How the Multilateral Development Banks are adapting to the needs of MICs: The views of the clients

14 November 2003
DIVERGENT ASIAN VIEWS ON A MULTILATERAL FRAMEWORK FOR FDI
Douglas H. Brooks and Hal Hill
The surge in flows of foreign direct investment (FDI) in the last two decades has had important
effects on global value chains of production, on developing countries, and on attitudes towards
such investment. Attitudes towards FDI and experiences with it in developing countries affect
host economy policies, which in turn affect subsequent experiences. Both FDI policies and
experiences, as well as their perceived feedback, influence attitudes toward negotiating a
multilateral framework for investment (MFI). This paper reviews recent trends and effects of
FDI in developing Asia, domestic policy changes in six Asian host economies, and how these
policies and experiences influence their attitudes towards a MFI.
I. Recent Trends and Effects
From only $53.7 billion in 1980, global FDI outflows reached $1.2 trillion in 2000. Since then,
however, the weak global economy has considerably reduced outflows, which dropped by 41%
in 2001 and an estimated further
9% in 2002. The upsurge in FDI
substantially changed the
international economic landscape.
From 1980 to 2000, the growth
rate of world FDI outflows
surpassed that of world exports
(Figure 1). This swift expansion in
FDI was more pronounced during
1985-1990, when many host
countries began to relax
regulations to attract FDI, and 1995-2000, when companies undertook scores of mergers and
acquisitions in the wake of the Asian financial crisis and privatization programs in Latin
America.
Figure 1: Growth of World Exports and FDI Outflows(average annual growth rate)
-505
101520253035
1980-1985 1985-1990 1990-1995 1995-2000Exports FDI Outflows
Sources: Exports: IMF (2003), FDI outflows: UNCTAD (2003b).
1

Relative to world output and
total trade, FDI flows have risen
tremendously since the early
1990s (Figure 2). World FDI
flows increased five times from
1993 to 2000 before falling
beginning in 2001, while world
trade and output grew at a more
modest pace, not even doubling
in value between 1990 and
2002.
Figure 2: Index of World Exports, FDI Outflows, and Output, 1990-2002 (1990=100)
050
100150200250300350400450500
1990 1992 1994 1996 1998 2000 2002FDI Outflows Exports GDP
Sources: Trade and GDP: IMF (2003), FDI flows: UNCTAD (2003b).
The geographic pattern of FDI outflows changed slightly during the last decade. Europe and
North America continued to be the largest sources of FDI flows in the world, supplying at least
75 percent since 1991. In contrast, the share of Asia and the Pacific in total FDI outflows fell
significantly beginning in 1998 due to the declining role of Japan as an FDI supplier.
While Europe and North America continued to be major recipients of FDI, China emerged as
another favored destination. Economies in Asia and the Pacific received increasingly larger
shares of world FDI inflows beginning in the 1990s, but the 1997 financial crisis temporarily
reversed this trend. FDI flows soon recovered, particularly in the wake of mergers and
acquisitions after the crisis.
In terms of individual country destinations, there have been shifts in the preferences of foreign
investors over the last decade. Malaysia, Singapore, and Thailand, which used to be included in
the 20 largest FDI recipients during 1991-1993, were replaced by Brazil, Finland, and Ireland
during 1998-2000. In addition, Japan and the Republic of Korea became preferred locations for
FDI in the post-Asian crisis era (JBICI 2002).
2

Among the preferred Asian destinations for FDI, there has not been as much change. Indonesia
and the Philippines, two of the top 10 FDI destinations in the early 1990s, dropped from the list
primarily due to uncertainties in their domestic economies and were replaced by India and Viet
Nam in the late 1990s. Meanwhile, Hong Kong, China overtook Malaysia as a preferred FDI
destination. While the total value of FDI inflows to the top 10 Asian destinations substantially
increased during the last decade, the Asia-Pacific’s share in the world total dropped significantly.
Average FDI inflows per capita showed remarkable increases in some Asian economies. In Hong
Kong, China, for instance, per capita inflows increased 7.5 times to $4,970 between the early-
and late-1990s and the inflow was greater than gross fixed capital formation by the end of the
decade. In other Asian economies, FDI amount to over 40 percent of gross fixed capital
formation (Table 1).
Table 1. FDI Top 10 in Developing Asia
Rank Host Economy 1991-1993 Rank Host Economy 1998-2000Average Annual Total Inflows, $ billion
1 China, People's Rep. Of 14.3 1 China, People's Rep. of 41.6 2 Malaysia 5.0 2 Hong Kong, China 33.8 3 Hong Kong, China 3.9 3 Korea, Rep. of 8.0 4 Singapore 3.9 4 Singapore 7.9 5 Thailand 2.0 5 Thailand 3.8 6 Indonesia 1.8 6 Malaysia 3.5 7 Taipei,China 1.0 7 Taipei,China 2.7 8 Philippines 0.9 8 India 2.4 9 Korea, Rep. of 0.8 9 Viet Nam 1.5 10 Kazakhstan 0.7 10 Kazakhstan 1.3 Total Asia-Pacific 36.0 Total Asia-Pacific 108.5 (Percent of World Total) 19.3 (Percent of World Total) 9.9
Average Inflows per Capita, $ 1 Singapore 1,234 1 Hong Kong, China 4,970 2 Hong Kong, China 666 2 Singapore 2,012 3 Malaysia 265 3 Brunei Darussalam 1,833 4 Vanuatu 164 4 Korea, Rep. of 172 5 Fiji Islands 102 5 Malaysia 159 6 Solomon Islands 51 6 Taipei,China 121 7 Taipei,China 50 7 Vanuatu 106 8 Kazakhstan 41 8 Kazakhstan 82 9 Thailand 35 9 Azerbaijan 72 10 Maldives 29 10 Thailand 62
3

Table 1. FDI Top 10 in Developing Asia (cont’d.)
FDI as % of Gross Fixed Capital Formation 1 Vanuatu 53.1 1 Hong Kong, China 75.7 2 Fiji Islands 38.7 2 Armenia 47.7 3 Viet Nam 32.0 3 Cambodia 45.3 4 Solomon Islands 26.5 4 Kazakhstan 42.7 5 Singapore 23.1 5 Singapore 39.3 6 Malaysia 22.8 6 Azerbaijan 38.9 7 Cambodia 17.9 7 Papua New Guinea 36.5 8 Kyrgyz Republic 15.2 8 Georgia 36.5 9 Hong Kong, China 13.2 9 Vanuatu 28.2 10 Papua New Guinea 12.1 10 Kyrgyz Republic 24.4
Source: UNCTAD (2003b).
Distinguishing characteristics of FDI are its stability and ease of service relative to commercial
debt or portfolio investment, as well as its inclusion of nonfinancial assets to production and
sales processes. Aside from increasing output and income, potential benefits to host countries
from encouraging FDI inflows include the following:
(i) Foreign firms bring superior technology. The extent of benefits to host countries depends
on whether the technology spills over to domestic and other foreign invested firms.
(ii) Foreign investment increases competition in the host economy. The entry of a new firm
in a nontradable sector increases industry output and reduces the domestic price, leading to a net
improvement in welfare.
(iii) Foreign investment typically results in increased domestic investment. In an analysis of
panel data for 58 developing countries, Bosworth and Collins (1999) found that about half of
each dollar of capital inflow translates into an increase in domestic investment. However, when
the capital inflows take the form of FDI, there is a near one-for-one relationship between the FDI
and domestic investment.
(iv) Foreign investment gives advantages in terms of export market access arising from
economies of scale in marketing of foreign firms or from their ability to gain market access
abroad. Besides their contributions through joint ventures, foreign firms can serve as catalysts
for other domestic exporters. In an empirical analysis, the probability a domestic plant will
export was found to be positively correlated with proximity to multinational firms (Aitken et al.
1997).
4

Foreign investment can aid in bridging a host country’s foreign exchange gap. Two gaps may
exist in the economy: insufficient saving to support capital accumulation to achieve a given
growth target, and insufficient foreign exchange to purchase imports. Often investment requires
imported inputs. If domestic savings are not sufficient, or face barriers in being converted to
foreign exchange to acquire imports, domestic saving may not guarantee growth. Capital inflows
help ensure that foreign exchange will be available to purchase imports for investment.
If both labor and capital are fully employed before and after the capital movement, the total and
average returns to capital increase, and total and average returns to labor decrease in the source
country. While that country gains as a whole, income is redistributed from labor to capital.
Meanwhile, in the recipient country, income is redistributed from capital to labor, as total and
average returns to capital decrease and total and average returns to labor increase. The result is
potentially a win-win situation for the two countries.
However, capital inflows do not necessarily increase welfare in the host country. For example,
when capital flows to an industry in which an existing firm has monopoly power in the world
market, an increase in output from the new competition lowers the price of the exportable, thus
reducing the terms of trade and potentially lowering welfare in the host country. Also, the
benefits from foreign investment are usually evaluated under the assumption that host countries
can absorb a large inflow of capital without large declines in its rate of return. But if capital
grows much faster than the productivity of labor, its productivity will fall, which might reduce its
rate of return.
Under full employment, a capital inflow that reduces the relative scarcity of capital and raises the
productivity of labor in the host country can raise real wages across the board and reduce income
disparity within the host country. However, the question of distribution also arises with respect to
the sharing of gains between foreign capital and host countries’ factors of production.
Traditionally, foreign investment was geared toward primary commodity exports. During the
colonial period in Indonesia, for instance, foreign investment in Java was concentrated in tea and
sugar export sectors and in Sumatra in rubber and oil exports. In some cases, this led to capacity
expansion, productivity growth, declining prices of exportable commodities, and deterioration in
the host country’s terms of trade, possibly leading to welfare losses. In addition, there were
generally little spillovers to the rest of the host economy from primary commodity production.
5

The resulting view was that the gains from capital inflows favor the source economy more than
the host economy.
Many new foreign investments in developing countries are in process manufacturing because of
lower labor costs, such as sports shoe factories across developing Asia. The host countries often
import unfinished components and export finished goods or refined components for further
processing elsewhere. While wages may rise across the board in host countries and reduce
income disparity, in practice wages are likely to rise only for a small fraction of the labor force
employed by the foreign investor. By creating a favored local group, this can lead to greater
income disparity within the host country. The result can be to improve the absolute and relative
condition of workers within this favored group, in the process aggravating income inequality.
Over time, however, and given a conducive policy environment, linkages and leakages emerge,
creating a country reputation that influences other potential investors. The Singapore story is a
case in point.
A capital inflow can lead to a rise in the prices of nontradable goods and services relative to
those of imported goods and services. If world demand for the country’s exports is perfectly
price-elastic, the price of nontradables will rise relative to the price of exports as well.
Consequently, the change will affect the returns to factors that are used intensively in either
tradable or nontradable sectors. Thus, a capital inflow-induced terms of trade effect may affect
real income for any given level of real output, which may or may not be affected.
When the price of nontradables rises relative to the prices of imports and exports, the “Dutch
disease” may result, in which resources are drawn from production of tradables to nontradables,
and exports fall as the macroeconomy adjusts to a new equilibrium with corresponding changes
in factor demand and prices. Distributional effects will result (Cooper 2002).
When there are “lumpy” adjustment costs for new investment and there are economies of scale in
the investment technology, trade openness can trigger discrete changes in the terms of trade and
thereby lead to a discrete jump in the level of investment. However, it can also lead to boom-bust
cycles of investment where multiple equilibria are supported by self-fulfilling expectations
(Razin et al. 2002).
6

As foreign investors search for the location that will provide the highest returns on their
investment, they are often drawn to countries with abundant natural resources but low-quality
institutions. Weak and inefficient institutions allow the extraction of natural resources at a faster
pace than that required for sustainable development. As a result, local communities are
sometimes harmed as the environment, their main source of livelihood, is damaged or destroyed.
Foreign investment-led growth also promotes western-style consumerism, which could have
serious potential consequences on the health and food security of the host population (French
1998).
Not all investments by multinational enterprises (MNEs) lead to technology transfer and positive
spillovers. In their desire to protect the technology of the parent company, MNEs may limit the
production of affiliates in host countries to low value-added activities, thereby reducing the
scope for technical change and technological learning. MNEs may also restrict vertical
integration by relying completely on foreign suppliers for their inputs. In some cases, MNEs, by
their sheer size, can even eliminate competition by crowding out domestic producers. As integral
parts of global value chains, MNEs have a built-in advantage (e.g., economies of scale and
scope) over their local competitors.
Increasing FDI across borders has increased the impact of FDI on national economies and the
international economy as a whole, with the widely held perception in Asia that the net effect is
positive. No absolute consensus on the positive effects of FDI has been reached by all
governments or the general public, reflecting differences in economic conditions, specific
histories of utilizing FDI, cultural variation, and ideological differences. In particular, the policy
framework plays an important role in determining the effects of FDI on a recipient country.
II. Domestic Policy Changes
This section assesses FDI inflows (and outflows), patterns, and policy regimes in the six
countries, in the context of general economic trends, ownership structures, and policy reforms.
One of our major arguments, as adumbrated above, is that trade reform alters the incentive of
7

production for the domestic market relative to exports, resulting in a fundamental shift in the
behaviour of MNEs and in the FDI cost-benefit calculus.
A. Six Diverse Economies
Tables 2 and 3 present a set of comparative statistics for the six economies. These include some
general economic indicators, as well as those relating to the trade regime and FDI. We also
include some indicators of countries’ attractiveness to FDI. Table 4 offers some summary
stylized facts of FDI regimes in the six.
The sample includes the world’s two most populous nations, together with a range of
intermediate-sized countries with populations in the range 20-100 million people. The largest
economy (China) is more than double that of the next largest (India) and about 35 times that of
the smallest (Vietnam). Korea is a rich OECD member. Malaysia is an upper middle-income
developing country. China and Thailand are in the lower middle-income group, while India and
Vietnam are low-income. The range of per capita GDP from the richest (Korea) to poorest
(Vietnam) is about 30:1, or 7:1 in PPP terms.
8

Table 2. Annual FDI Inflows, Portfolio and other capital inflows during the period 1990-2002 ($m)
1990 1991 1992 1993 1994 1995 1996 1997 1998 1999 2000 2001 2002China Total Capital Inflows 4,557 9,431 7,467 30,585 36,214 41,676 43,834 64,107 35,230 41,908 58,045 41,557 50,031FDI 3,487 4,366 11,156 27,515 33,787 35,849 40,180 44,237 43,751 38,753 38,399 44,241 49,308Portfolio 0 565 393 3,646 3,923 710 2,372 7,842 98 -699 7,317 1,249 1,752Other 1,070 4,500 -4,082 -576 -1,496 5,116 1,282 12,028 -8,619 3,854 12,329 -3,933 -1,029
India Total Capital Inflows n.a. 4,258 3,147 5,244 9,488 5,157 16,798 14,490 11,871 10,108 11,087 n.a. n.a. FDI n.a. 74 277 550 973 2,144 2,426 3,577 2,635 2,169 2,315 n.a. n.a.Portfolio n.a. 5 284 1,369 5,491 1,590 3,958 2,556 -601 2,317 1,619 n.a. n.a.Other n.a. 4,180 2,587 3,325 3,024 1,423 10,413 8,357 9,837 5,623 7,152 n.a. n.a.
Korea Total Capital Inflows 6,506 10,519 10,606 9,686 22,591 37,101 48,080 6,814 -8,748 17,829 20,002 2,912 11,014FDI 788 1,180 728 589 810 1,776 2,326 2,844 5,412 9,333 9,283 3,198 1,972Portfolio 662 2,906 5,875 11,088 8,713 14,619 21,514 13,308 775 7,908 12,697 11,856 4,940Other 5,056 6,434 4,003 -1,990 13,068 20,706 24,240 -9,338 -14,935 588 -1,978 -12,142 4,102
Malaysia Total capital inflows 1,989 4,664 7,244 11,738 784 6,628 5,343 6,801 2,719 n.a. n.a. -942 n.a.FDI 2,332 3,998 5,183 5,006 4,342 4,178 5,078 5,137 2,163 3,895 3,788 554 n.a.Portfolio -255 170 -1,122 -709 -1,649 -436 -268 -248 283 -892 -2,145 -666 n.a.Others -89 496 3,183 7,441 -1,909 2,885 533 1,912 272 n.a. n.a. -830 n.a.
Thailand Total capital inflows 9,402 11,575 9,517 13,998 13,691 25,534 17,797 -8,851 -10,591 -8,970 -8,094 -3,709 -6,500FDI 2,444 2,014 2,113 1,804 1,366 2,068 2,336 3,895 7,315 6,213 3,366 3,820 1,075Portfolio -38 -81 924 5,455 2,486 4,083 3,585 4,598 338 77 -546 -932 -1,347Others 6,996 9,642 6,479 6,739 9,839 19,383 11,876 -17,344 -18,243 -15,261 -10,914 -6,597 -6,228
Vietnam Total capital inflows n.a. n.a. n.a. n.a. n.a. n.a. 2,942 2,237 2,183 1,844 1,773 1,568 n.a.FDI n.a. n.a. n.a. n.a. n.a. n.a. 2,395 2,220 1,671 1,412 1,298 1,300 n.a.Others n.a. n.a. n.a. n.a. n.a. n.a. 547 17 512 432 475 268 n.a.
Source: IMF (2003b).
9

Table 3. Comparative Statistics
China India Korea Malaysia Thailand Vietnam
1. General Economic Indicators GDP 2002 ($b) 1,237 515 477 95 126 35 GDP per capita PPP 2001 ($) 4,020 2,840 15,090 8,750 6,400 2,070GDP per capita growth (1990-96) (%) 9.2 3.7 6.5 6.7 7.4 5.8 GDP per capita growth (1997-2001) (%) 6.9 3.5 3.5 0.5 -0.9 5.0 Annual average inflation (1990-2001) (%)a 6.5 8.6 5.3 3.3 4.4 3.0Total External Debt /GDP 2001 (%) 15 20 26 49 59 38 GDP per capita 2001/GDP per capita 1980c 5.3 2.1 3.5 2.1 2.6 2.1 2. Openness 2.1 Trade (Exports+Imports)/GDP 1990 (%) 31.9 17.2 59.4 147.0 75.8 81.3 (Exports+Imports)/GDP 2001(%) 49.2 29.1 83.5 214.3 126.5 111.5Export growth (1990-2001)(%) 17.4 12.9 13.5 11.3 9.8 22.0Average tariff rate 1999 18.7 30.2 7.9 8.1 5.9 20.0 Index of Economic Freedom(2003)b 3.6 3.5 2.7 3.0 2.6 3.7
Note: adata for Vietnam are for the period 1997-2001. bIndex of Economic Freedom ranges from 0 (mostly free) to 5 (highly restricted). cdata for Vietnam are for the years 1984 and 2001. Source : World Bank, World Development Indicators (CD ROM). Index of Economic Freedom 2003, available at http://www.heritage.org/research/features/index/.
10
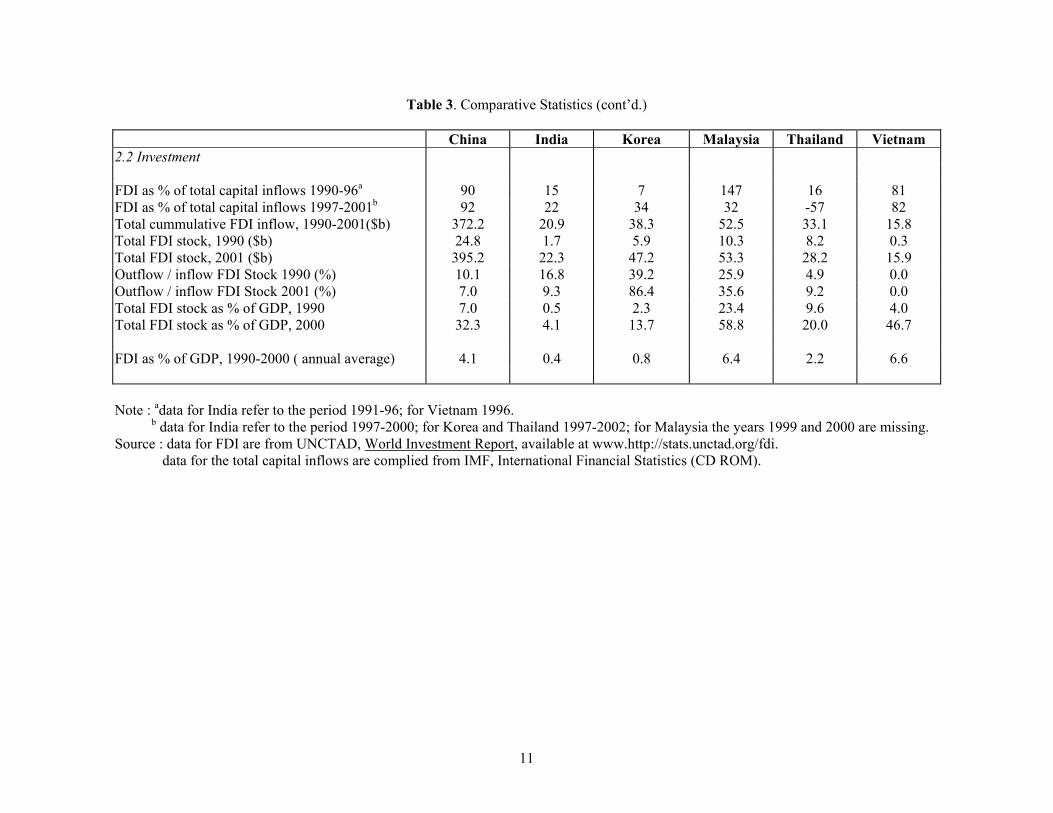
Table 3. Comparative Statistics (cont’d.)
China India Korea Malaysia Thailand Vietnam2.2 Investment
FDI as % of total capital inflows 1990-96a 90 15 7 147 16 81FDI as % of total capital inflows 1997-2001b 92 22 34 32 -57 82Total cummulative FDI inflow, 1990-2001($b) 372.2 20.9 38.3 52.5 33.1 15.8 Total FDI stock, 1990 ($b) 24.8 1.7 5.9 10.3 8.2 0.3 Total FDI stock, 2001 ($b) 395.2 22.3 47.2 53.3 28.2 15.9 Outflow / inflow FDI Stock 1990 (%) 10.1 16.8 39.2 25.9 4.9 0.0 Outflow / inflow FDI Stock 2001 (%) 7.0 9.3 86.4 35.6 9.2 0.0 Total FDI stock as % of GDP, 1990 7.0 0.5 2.3 23.4 9.6 4.0 Total FDI stock as % of GDP, 2000 32.3 4.1 13.7 58.8 20.0 46.7
FDI as % of GDP, 1990-2000 ( annual average) 4.1 0.4 0.8 6.4 2.2 6.6
Note : adata for India refer to the period 1991-96; for Vietnam 1996. b data for India refer to the period 1997-2000; for Korea and Thailand 1997-2002; for Malaysia the years 1999 and 2000 are missing. Source : data for FDI are from UNCTAD, World Investment Report, available at www.http://stats.unctad.org/fdi. data for the total capital inflows are complied from IMF, International Financial Statistics (CD ROM).
11

Table 3. Comparative Statistics (cont’d.)
China India Korea Malaysia Thailand Vietnam3. Human Capital Years of education 5.7 4.8 10.5 7.9 6.1 n.a. Tertiary enrolment as % of age group, 2000a 7.5 10.5 77.6 28.2 35.3 9.7R&D expenditure as % of GDPb 1.0 1.2 2.7 0.4 0.1 n.a.Number of internet users as % of total population, 2001 3 1 51 27 6 1 Public spending on education as % of GDP, 2000c 2.9 4.1 3.8 6.2 5.4 2.8
4. Physical Infrastructured 46 54 28 18 32 57
5. Institutional quality & risk Corruption (Corruption Perception Index)e 3.5 (59) 2.7(71) 4.5(40) 4.9(33) 3.2(64) 2.4(85) Country risk (composite risk rating) 73.5 63.8 79 75.3 72.8 71.8 Property rights (Index of Economic Freedom) f 4 3 2 3 2 5Bureaucratic quality (public Institutions Index 2001)g 4.10(50) 4.11(49) 4.25(44) 4.53 (39) 4.36(42) 3.58(63)
6. Fiscal/Finance Stock market capitalization 2002 h 13.0 23.0 43.0 129.0 36.6 n.a.Average Corporate Tax Rate 1999 (%) 33 35 28 28 30 25
a Tertiary enrolments (regardless of age) as percentage of 20-22 age group. Data for China and India refer to 1999. b data for India, Malaysia and Thailand refer to 1996, 1997 and 1998, respectively. c data for India and Vietnam refer to 1999 and 1997 respectively. d GCR, 1-59 ranking, 1 =best. e The index ranges from 10 ( highly clean) to 0 ( highly corrupt) for 102 countries. The world average is 4.6, with maximum 9.7 and minimum 1.2. Numbers in the parenthesis are the country ranking. f The property rights index is a composite from the Index of Economic Freedom developed by the Heritage Foundation. This index ranges from 0 (very good) to 5 (very poor). g The public institutions index is based on survey data and ranges from 2.48-6.59 across 75 countries. The higher the index the higher the quality. h The figure for India is 2001. Source : Human capital and stock market capitalization are from World Bank, World Development Indicators (CD ROM); Corruption Perception Index is from Transparency International available at http://www.transparency.org/; Country risk data are from, UNCTAD, World Investment Report; All other data are from Global Competitiveness Report (GCR) 2001.
12

Table 4. FDI Regimes – Some Stylized Facts China India KoreaOwnership Structures Dominant but declining SOEs,
rapidly rising private and foreign firms
Large SOE sector; reservations schemes for small firms
Predominantly private; chaebol important; high concentration; small SME presence
FDI History Closed to 1978; rapid increase from 1980s, especially in south
Very restrictive pre-1991, then gradual opening
Restrictive until 1990s; then gradual opening; major 1998 reforms
FDI Presence Modest but rising Modest, no clear trend Low, rising gradually
Trade Regime Closed to 1978; then progressive opening, especially for X; 2002 WTO accession
Very restrictive pre-1991, then gradual opening
From 1960s, open for X, otherwise restrictive; major 1990s reforms
International Connections HK important; large diaspora Large and active diaspora Large US diaspora; reverse brain drain in 1990s
FDI Regime in Practice Continuing though declining SOE preference; rapid decentralization; much corruption
Reforming, in context of dirigiste history; states are powerful; much corruption
Business climate becoming more predictable and open; powerful nationalist sentiment
Institutional Quality Uneven, though improving Well developed, though cumbersome
Generally high, though legal system still evolving
Human Capital Pockets of excellence; uneven, rapid catch-up
Pockets of excellence; continuing high illiteracy
Extremely strong education; R&D base, though not very international
13

Table 4. FDI Regimes – Some Stylized Facts (cont’d) Malaysia Thailand VietnamOwnership Structures Always large foreign presence;
active bumiputra promotion Predominantly private; Sino-Thai dominance
Dominant SOEs, actually rising post reform
FDI History Consistently open Consistently fairly open Closed to late 1980s; rapid rise from early 1990s
FDI Presence Very high Substantial, and rising Low, but rising quickly
Trade Regime Consistently open Consistently fairly open Closed to late 1980s; then major opening, especially for X
International Connections Singapore ties historically strong No special features Large diaspora, still regarded with suspicion
FDI Regime in Practice Predictable commercial environment
Reasonably predictable commercial environment
Continuing SOE preference; north-south differences; private firms insecure
Institutional Quality Generally high Generally quite high Weak; very limited investor protection
Human Capital Generally quite good; major affirmative action program; continuing non-bumiputra brain drain
Historic under-investment in post-primary education
High literacy, though limited international commercial know-how and entrepreneurship
14

All six have performed creditably for most of the past two decades. Their real per capita incomes
in 2001 were at least double those of 1980, and more than five times higher in the case of China.
Since 1990, China has consistently recorded spectacular economic growth, to the point where it
is now the principal East Asian growth locomotive, and a major global economy. If its current
growth rates are maintained, it will become the world’s largest economy (in PPP terms) before
2020. Korea, Malaysia, and Thailand all grew at more than 6% until the crisis of 1997-98;
Thailand was the world’s fastest growing economy in the decade from the mid 1980s. All three
experienced a sharp contraction in 1998, but recovery has been fairly rapid. Vietnam grew
strongly for most of the 1990s, with slower (but consistently positive) growth during the crisis.
India has never achieved the very high growth rates of the others. However, reforms from the
late1980s have lifted its performance significantly, and it was largely unaffected by the recent
Asian crisis.
All six have reasonably good macroeconomic management. Since 1990, all have averaged
single-digit inflation. None is a heavily indebted economy. Malaysia and Thailand have the
highest debt to GDP ratios. Both were running very large current account deficits pre-crisis,
albeit in the context of very high investment rates, low fiscal deficits and (owing to their outward
orientation) moderate debt-service ratios.
B. FDI Regimes
An Overview
In their FDI regimes, it is useful to divide the six countries into three groups. The first comprises
those with historically very restrictive regimes, including outright prohibition, which have
opened up during the past quarter century. This includes China, India and Vietnam. Second is
those which have always been reasonably open, and become progressively more so. Malaysia
and Thailand belong to this group. Finally, there is the special case of Korea, which was initially
highly selective in its opening up to FDI, and which has become progressively more open over
time. There is no instance in our sample of countries becoming less open towards FDI.
15
The comparative FDI data reported in Table 2 illustrate these general characterizations. In 1990,
Malaysia, the least populous of the six, had the largest stock of FDI after China. Thailand was
well ahead of the other three. The amount in Vietnam was negligible. By 2001, China had
emerged as the dominant recipient, with more than seven times the stock of the next two,
Malaysia and Korea. In 2002, it was the world’s largest FDI recipient, overtaking the US. India
and Vietnam still had the smallest stocks, though they had both increased quickly, especially
Vietnam. Relative to GDP, Malaysia was the largest recipient of FDI in both years, and India the
smallest. The greatest absolute increase in these ratios occurred in Vietnam, followed by
Malaysia.
In some cases, it is possible to date the opening up to FDI as part of a package of major general
reforms. In Korea, there was gradual liberalization from the late 1980s, with major reforms in
1997-98 in the wake of the economic crisis. In China the reform process commenced in 1978. It
was further consolidated in the late 1980s, and again in 2002 upon accession to the WTO. In
India, 1991 is regarded as the key reform year. In Vietnam it was the late 1980s Doi Moi
reforms, with further liberalizations around the turn of the century.
By contrast, Malaysia especially and Thailand have always been quite open to FDI, and over
time have become progressively more so. In neither case have there been major swings in the
policy pendulum. In the decade up to the 1997 crisis, Thailand was a huge capital importer, in
some years running a current account deficit of more than 8% of GDP. While FDI increased to
record levels, an increasing proportion of the flow was portfolio and other short-term capital. The
government’s objective to promote Bangkok as a regional capital market centre in competition
with Hong Kong and Singapore was a factor here, as virtually all restrictions on capital flows
were removed. Following the 1997-98 capital flight and consequent collapse of the baht, the
government maintained its open posture towards FDI, despite a growing nationalist backlash,
and FDI flows actually increased for a period.
In Malaysia, the principal ownership issue has arguably been the political imperative to
redistribute towards the indigenous (bumiputra) community (Gomez and Jomo, 1997), rather
16
than the foreign presence per se. Under the New Economic Policy, announced in 1970, the
bumiputra share of the corporate sector was to rise from 2% to 30%. Reaching about 20% in
1990, albeit through sometimes controversial share allocations, the scheme has been somewhat
de-emphasized, especially in the wake of the mid 1980s recession and the economic crisis of
1997-98. In fact, the very high foreign presence at the outset of the NEP facilitated this
transformation, as the major redistribution occurred not from non-bumiputra to bumiputra groups
but rather from foreign to domestic. The non-bumiputra share actually rose throughout the
period, while the foreign share fell continuously until recently (see below).
This is not the place to analyze in any detail the dynamics of these reforms and why they took
place. But it is worth pointing out that a range of internal and external factors were typically at
work. At an intellectual level, these factors include a recognition that outward-oriented
economies grow more quickly, and that it is possible to achieve ‘nationalist’ objectives in an
open economy context. Competitive liberalizations – keeping up with one’s neighbours – have
been a factor. Foreign pressures, including a desire to join international agencies (the
GATT/WTO and, for Korea, the OECD) have often coaxed countries along. Conversely, the
demise of an international benefactor (the former USSR) was a major trigger in Vietnam’s
reforms. Coalitions of key bureaucrats and political figures have often accelerated progress once
the environment for reform was judged to be favourable.
Obviously, ‘policy reform’ has very different connotations across the six. In traditionally open
Malaysia and Thailand, it has implied a gradual shift of the pendulum. In other cases, reform has
constituted a major change in policy emphasis, even a U-turn, in which FDI liberalization has
been important. China and Vietnam are both cases of a transition from a prohibitive to a quite
open FDI regime.
‘Dual policy’ regimes
There are only a handful of countries with completely open FDI regimes in the world. Thus,
while FDI regimes have become more open among the six, there remains considerable selectivity
across sectors and firms. Governments have typically been slower to open up the services sector
17

to FDI. All countries have ‘national projects’ where a range of non-economic considerations
intrude. Among our sample, for example, even the most open economy, Malaysia, has
consistently protected its uneconomic automotive industry, and restricted foreign equity
participation in it.
More generally, countries typically have a mix of both ‘rent-seeking’ and ‘efficiency-seeking’
FDI, reflecting partial reform of their trade regimes, and the political economy of dispensing
patronage. Consequently, all the country studies draw attention to what may be termed ‘dual
policy regimes’. For example:
FDI policy may differ between regions. Three of the six (China, India, Malaysia) feature quite
high levels of decentralized economic policy making. Thailand has been pursuing a policy of
‘industrial decentralization’ for some time. In all but Malaysia, economic authority is being
progressively devolved away from the centre in varying degree and speed.
There are large inter-industry differences in protection, and thus incentives, in all six.
SOEs typically receive preferential treatment, especially in China, India and Vietnam, and so
therefore do their MNE joint venture partners.
Most countries offer some sort of fiscal or financial incentives to foreign investors. These vary
by sales orientation, the technology introduced by the foreign investor, location of investment,
and other factors.
The regulatory regime frequently offers more than one entry option for potential foreign
investors, especially in recently reformed economies.
Not surprisingly, this phenomenon of ‘dual policy regimes’ is particularly pronounced in the
most recently reformed economies, China and Vietnam. Governments in the ‘late reformers’
typically reveal the greatest ambivalence towards foreign investors. There is an awareness that,
after a period of commercial isolation, special promotional measures may be required as
countries attempt to enter the international commercial mainstream. Sometimes this results in
more generous treatment for foreign firms at the expense of domestic firms. Such preferential
treatment lacks any analytical rationale, can generally be easily circumvented (eg, the China
‘roundtripping’ phenomenon discussed below), and runs the risk of a domestic backlash.
18

In such cases, there is at one extreme FDI flowing into joint ventures with SOEs, often in
protected, uneconomic sectors, producing negative value added at international prices. FDI also
typically flows into non-tradables such as real estate and hotels where, in thin markets for
international-quality assets, asset-price bubbles may occur. Meanwhile, another group of foreign
investors enters ‘comparative advantage’ sectors – SMEs, labour-intensive, export-oriented
activities. Often the latter locate in special zones which are free of the regulatory and
bureaucratic complexities found elsewhere in the economy. Such a pattern has been evident
clearly in the case of China. The country’s initial export orientation was confined to four
southern coastal zones. Most of the labour-intensive FDI originated from Hong Kong, and later
Taiwan. This FDI co-existed with FDI going into joint ventures with SOEs, much of it in
uneconomic and protected heavy industry. Firms from OECD countries were the dominant
investors in these activities. The domestic welfare implications of different types of FDI are
fundamentally important. There is no such thing as a single FDI ‘model’ in these economies. A
major feature of the reform process is, therefore, the diminished importance of the former type of
FDI, and its progressive replacement with the latter.
Even among the relatively successful late reformers, policy progress is invariably uneven and
unpredictable, as is the response of investors. Vietnam in the 1990s illustrates both these
propositions. Following Doi Moi, growth accelerated and there was an initial period of euphoria
among foreign investors. By the mid 1990s, however, foreign investors became more wary as the
reality of doing business in a transitional, partially reformed communist state sunk in (see
Freeman, 2003). The prolonged commercial isolation and prevailing ideology permeating much
of the bureaucracy and the Communist Party meant that policy makers frequently have very little
understanding of how to manage a foreign commercial presence. For example, they typically
have unrealistic expectations of FDI.1 Moreover, many of the general problems associated with
the business environment had not been addressed in the first round of reforms: red tape,
corruption, insecure property rights, an ill-defined legal environment, poor physical
infrastructure, limited financial development, and the huge, inefficient and privileged SOE
1 For example, official documents state that FDI should go to ‘mountainous and remote regions with difficult economic and social conditions’. MNEs are criticized for not developing greater local sourcing, and yet the policy regime inhibits the development of a vibrant SME sector.
19

sector. Finding private sector business partners was difficult, especially as much of the non-SOE
business sector was either neglected or harassed.
China is an excellent illustration of the political economy proposition that, in some
circumstances, partial reform is desirable if it can be a precursor to successful economy-wide
liberalization. Evidently, the latter was not politically feasible during the early years of reform.
As the coastal zones began to grow at a spectacular rate, they became the model for the rest of
the economy to emulate, and reform progressively extended to other regions and sectors.2
Reform: rhetoric versus reality
In any evaluation of policy regimes, it is crucial to distinguish between formal FDI and trade
regimes, and their operation in practice. Nominally ‘open’ regimes may in fact be highly
complex and corrupt. Widespread physical and technical smuggling, and unrecorded capital
flows, are present in all six, especially the less reformed ones. For example, smuggling renders
irrelevant much of Vietnam’s formal trade regime. The value of investment incentives is
significantly eroded by administrative complexities and corruption.
Moreover, reform at the centre does not necessarily ensure that liberalization will proceed
smoothly. This is illustrated in the case of India, where power is diffused and the vested interests
and philosophical predisposition towards planning and intervention built up during decades of
dirigisme cannot be quickly overturned. The reforms have been ‘positive sum game’, since
growth has accelerated. But there have been losers too, among the bureaucrats who dispensed
power and patronage, the SOEs sheltered from competition, and the unions in feather-bedded
(especially state-owned) industries. Moreover, under India’s federal structure, the states wield
considerable power.3
2 See Lardy (1996) for a detailed analysis of China’s trade and FDI liberalization. 3 To quote Joshi (2003): ‘In practice, however, the system [ie, the FDI regime] is more restrictive than it sounds, because there still remain numerous hurdles to jump, erected by State governments if not the Centre.’ Athreye and Kapur (2001, p. 422) note that the irony that ‘… even in sectors where foreign investment is readily allowed, firms must secure ‘automatic approval’! On the Indian reforms, see also Joshi and Little (1997) and Krueger (ed, 2002).
20

In Korea, too, there seems to have been considerable ambivalence about recent reforms in
sections of the bureaucracy which are reluctant to relinquish control. Considerable sectoral
restrictions on FDI remain, while business surveys (eg, that conducted by AMCHAM Korea)
report that foreign investors find the business environment quite difficult. To overcome these
difficulties, reformers have proposed the establishment of ‘free economic zones’, where
liberalization can proceed more quickly than elsewhere. It is unlikely that Korea could achieve
its current objective of becoming an ‘economic hub’ for Northeast Asia unless these reforms can
be introduced.
One general lesson from the reform experience is that authoritarian states like China and
Vietnam can reform very quickly, once key leadership figures are convinced of the case for
change. Democratic states such as India invariably move more slowly. Conversely, it may be that
the reforms are likely to be more durable in democratic states: greater persuasion is required to
get the reforms through, potential losers are more likely to be compensated, and therefore
opposition ameliorated.
Korea undertook its major liberalizations after it had become democratic, but in any case it
appears that external factors were a major trigger for reform. Two in particular stand out. One
was its desire to join international organizations (successively the GATT/WTO and the OECD),
membership of which required reform. The second was the 1997-98 economic crisis when, in
spite of intense nationalist sentiment, the government felt it had no choice but to open up.
Frequently, the investment boards charged with regulating FDI have little general authority.
‘One-stop-shops’ may simply refer to their operations and not the regulatory complexities of
many other, more powerful agencies. Moreover, the rationale for the existence of these boards
continues to be obscure. Over a decade ago, there was concern in the literature over how Asian
investment boards married their (potentially conflicting) promotion and regulatory functions.4
Such a concern appears to be even more valid today, in the wake of the transition to outward
orientation, and the region’s economic crisis (Buckley, 2003).
4 See Wells and Wint (1991). In their sample of countries, only Singapore appeared to have an effective separation of responsibilities.
21

Especially in larger states, sub-national policy regimes matter increasingly. In well-established
federal structures like those of India and Malaysia, states do compete for investment, and the
rules of the game are quite well established. But decentralization is proceeding rapidly in most of
East Asia’s nominally unitary states (Hill, 2002). Regional authorities are now offering a range
of incentives, some only quasi-legal. The general presumption is that this intra-national
competition for FDI (and investment in general) is desirable, since it will be a spur to improve
the quality of governance at the local level. However, there are dangers, especially moral hazard
concerns of local governments offering excessively generous incentives secure in the knowledge
of central government bail-outs. Moreover, as international barriers to commerce are declining,
paradoxically sub-national barriers are sometimes rising.
C. Ownership Structures and the Foreign Presence
Rising FDI flows in the six economies have generally been associated with an increased foreign
presence, as measured by MNE shares of output, employment and exports. However, it needs to
be emphasized that rising FDI inflows do not necessarily result in increasing foreign ownership.5
This is so for a number of reasons. First, especially in high-growth economies, increased FDI
flows have been accompanied by rising domestic investment rates, and thus the share of foreign-
owned firms has not necessarily risen. Second, much FDI takes the form of reinvested earnings
rather than capital inflow. This is especially the case in countries with long established foreign
investors, such as Malaysia. In recent years, retained earnings have accounted for as much as half
of all new FDI in that country.
It also needs to be noted that, even in the rare instances where ownership statistics are
comprehensive, the foreign presence is always recorded imperfectly.6 There are substantial non-
5 See Ramstetter (1999) for a detailed empirical study of this issue. 6 Any analysis of foreign investment has to be heavily qualified by data constraints. The country chapters provide extensive discussion of data issues. Commonly found weaknesses include the following: First, FDI flows are poorly recorded. Investment agencies typically report approved investments, which often differ significantly from actual flows: realization rates fluctuate and may lag several years; some agencies include domestic borrowings and even equity in their ‘foreign’ totals.
22

equity forms of foreign commercial involvement, such as licensing and franchising. In some
cases, foreign firms have no choice but to enter through non-equity forms, principally licensing
arrangements. It is generally – though not necessarily – the case that these commercial
arrangements are less important in countries with more open FDI regimes. Thus, for example,
the foreign presence is probably more accurately captured in the ownership statistics in Malaysia
than in Korea or India. In addition, international labour flows are increasing, thus adding an
additional element to the foreign presence.
Moreover, ownership is often an empirically slippery concept, and the distinction between
foreign and domestic is likely to become blurred in the future. The existence of large diasporas
abroad will hasten this trend. These are present in all six countries, particularly China, India and
Vietnam. But, perhaps inevitably, their commercial activities are not consistently recorded.
Official attitudes to this community also vary, from embrace to suspicion.
To place these rising FDI flows in context, and bearing in mind the serious data deficiencies, it is
useful to briefly examine patterns of ownership in the six countries.
Accurate economy-wide ownership data are not available for China. The best documented sector
is manufacturing, where the major ownership feature has been the rapidly diminishing
importance of the once dominant SOE sector. Its share of industrial output declined from 49% in
1994 to just 18% in 2001. Over this period, shares of the non-SOE domestic sector and foreign
firms rose by approximately similar amounts: 38% to 53% for the former, and 13% to 28% for
foreign firms. Among the latter, firms from Hong Kong, Macao and Taiwan account for 40-45%
of the total. There has been some, but limited, privatization of SOEs. The major change has been
Second, realized FDI estimates produced by central banks from balance of payments data are generally very approximate. Moreover, they do not include FDI in the form of reinvested earnings. Third, disaggregated FDI flow data, by sector and source, are mostly incomplete. Often, the administrative responsibility of investment agencies does not extend to key sectors of the economy. Attempts to match home and host country FDI estimates typically reveal large discrepancies. Fourth, accurate stock estimates of the foreign presence are rarely available. As noted, the flows data are inadequate. In addition, census estimates of foreign ownership are irregular and mostly patchy. Fifth, data on other dimensions of the foreign presence, which may also include foreign equity, are even weaker. In some countries, there is substantial foreign ownership via the stock market, which (except during periods of crisis) may be ‘FDI-like’ in its behaviour. There is a large diaspora community in all six countries, but no consistent treatment of their investment activities. Associated flows of human capital and technology, which often also entail some implicit or explicit FDI, are poorly recorded.
23
the unshackling of the non-state sector, which has been the source of the country’s economic
dynamism since the late 1980s.
In India, too, economy-wide ownership data are patchy, but all estimates point to minor
ownership changes over time and a modest foreign presence. As would be expected, foreign
shares declined prior to liberalization, from around 30% of industrial output in the early 1970s to
about 25% in 1990, according to unpublished Reserve Bank of India (RBI) data cited by Athreye
and Kapur (2001). These figures overstate the foreign presence since they refer only to medium
and large public companies surveyed by the RBI. As the authors (ibid, p. 409) note, the decline is
explained by ‘… the restrictions placed on foreign firms by the overall regulatory framework.
Greater selectivity in industrial licensing restrained the growth of many multinationals [which]
were unable to compete against well-organized domestic industrial lobbies.’ Post-liberalization,
this trend appears to be slowly reversing. For listed companies on the Indian stock exchange – a
data series which cannot be directly compared with the source above – the share of foreign firms
in manufacturing output has risen gradually towards the end of the century: 9.5% in 1990, 9.3%
in 1995, and 12.8% in 2000. It could be that the foreign presence has risen more sharply in other
sectors, especially the newly opened service industries. The foreign presence is India’s
manufactured exports is as noted minuscule, especially compared to East Asian norms.
The foreign presence has always been modest in Korea, given its historically restrictive
ownership regime. Within manufacturing, at the onset of the economic crisis, foreign firms
produced about 10% of manufacturing output and employed 5.5% of the industrial workforce.
Liberalization and M&A activity raised these shares to 13.3% and 8% respectively by 1999.
Over the period 1997-99, foreign firms accounted for about 15% of the country’s manufactured
exports.
The Malaysian data confirm the historically large foreign presence in the economy. Foreign
firms owned approximately one-third of the nation’s share capital in 1999, down from over one-
half in 1970. Within manufacturing, foreign firms generated about 44% of value added and 38%
of employment in 2000. They also accounted for 73% of manufactured exports and 65% of total
exports in 1995.
24

Ownership statistics for Thailand are the weakest of the six countries. There are no economy-
wide estimates, while even for manufacturing the first reasonably comprehensive data were
prepared only in 1996. They report that firms with a foreign presence (ie, a foreign share greater
than zero) produced about 50% of the country’s industrial output and employed 41% of its
workforce. Estimates for 1999 suggest little change in the immediate aftermath of the crisis.
Ownership structures in Vietnam are unusual. As FDI flowed in from the late 1980s, the share of
the SOE sector actually increased. The explanation is that the SOEs retained their privileged
access to secure land titles and the domestic banking sector for much of the reform period, and
thus foreign investors were forced into joint ventures with them. Meanwhile, the policy regime
suppressed the emergence of a domestic SME sector. This trend began to reverse, but very
slowly, as the monopoly privileges of SOEs have been eroded. One important milestones in this
respect was the granting of 100% foreign ownership in certain circumstances (principally for
firms in export zones), and the formal recognition that foreign firms are no longer part of the
‘state capitalist sector. Another was the passing of the Law on Enterprises in 2000, which
provided a more secure environment for the domestic private sector. Over the period 1995-2001,
there were no major changes in economy-wide output shares by ownership, apart from a
doubling of foreign firms (6% to 13%). The state sector remained virtually constant (39-40%),
while collectives (10% to 8%) and the private/household sector (39% to 36%) declined slightly.
The small mixed sector remained unchanged (4%). In these respects, Vietnam is yet to
experience the far-reaching ownership changes evident in China. The foreign share of Vietnam’s
manufactured exports has been rising sharply, from 17-19% in 1993-95 to 57% in 2000. This
share is likely to rise still further as the country entrenches itself as an attractive destination for
labour-intensive manufactured exports.
D. FDI Flows and Patterns
There are at least five features of the FDI flows and patterns summarized above and explained in
more detail in the country papers which are worthy of comment.
25

The first concerns inflows to China and China-India comparisons. Although China is now the
world’s largest FDI recipient, the size of the inflows is a subject of debate. The principal
uncertainty relates to ‘round-tripping’, that is, Chinese investments being channelled through
Hong Kong and returning as ‘foreign’ investment to secure the greater privileges and security
which foreign investors typically receive. As the Chinese reforms progress, however, and the gap
between the commercial environment in Hong Kong and adjoining southern regions narrows,
this round-tripping FDI appears to be a diminishing proportion of total inflows.
These magnitudes have also triggered a recent debate about the comparative attractiveness of
China and India to foreign investors. On the face of it, China appears to dwarf India, owing to its
earlier reforms, faster economic growth and recorded FDI inflows some 20 times greater in
recent years. However, a recent literature, principally emanating from India, has argued that the
reported differences are greatly exaggerated.7 At least 20% of China’s FDI is still thought to be
round-tripping, while Indian statistics until recently have significantly understated its FDI
receipts, partly owing to the way it measures outflows. In addition, China’s economy is about
double that of India’s. Making these adjustments, the reported 20:1 differential in flows becomes
perhaps 3:1 in terms of FDI/GDP ratios. Since China’s investment rate (relative to GDP) is at
least one-third higher than India’s, the FDI/GDI (investment) ratio is about 2:1. Thus, in the
China-India comparison, and more generally, China emerges as less of an outlier. Its magnitudes
are extremely large as much owing to its size as its openness to FDI.
A second feature of FDI flows is their changing sectoral composition. Prior to the 1980s, most
FDI in developing countries was in extractive industries and import substituting (IS)
manufacturing. The first major compositional shift was within manufacturing, from IS to export-
oriented manufacturing. This transition commenced in the late 1960s, but really accelerated from
the 1980s. A more recent shift has been towards services. By 2000, about half the total stock of
FDI in developing countries was in services, more than double the figure in 1990 (UNCTAD,
2002). Three factors principally account for this trend: the rising share of services in practically
7 For a summary of the debate, see the China and India chapters. A recent summary appears in the Economist, June 21, 2003.
26

all countries, the increasingly tradable nature of many service outputs, and liberalized entry into
many service industries previously closed to foreign businesses. However, there remain
substantial barriers to FDI in services.
These global changes are evident in all six economies, and have been driven in particular by the
opening up of service industries to FDI. The changes are particularly pronounced in the more
recent reforming economies. In China, FDI began entering the banking and foreign and domestic
trade sectors in the 1990s. With its WTO accession, insurance, telecommunications and other
sectors are being progressively opened. Liberalization in India has resulted in a sharp decline in
the earlier dominance of manufacturing, from 85% to 48% of the total. Most of the increase has
gone into services. There is also a more even distribution of FDI across sub-sectors. In Korea,
most service industries were closed to MNEs prior to the 1990s. Here too reform has led to a
major reallocation of FDI flows.
Third, there are the changing modalities of capital flows. For a period in the 1990s, portfolio
investment flows in Southeast Asia exceeded FDI (see Table 3). During and after the 1997-98
crisis, this trend was dramatically reversed. Moreover, the nature of FDI is also changing. The
old pattern of greenfields FDI, and durable, long-term joint ventures is increasingly being
replaced by M&As and volatile, opportunistic and short-term relationships. The extent of M&A
FDI is poorly documented, but appears to be increasing in most countries. These activities
certainly increased in the late 1990s in the crisis-affected countries, as exchange rates and stock
markets collapsed, inducing so-called ‘fire-sale FDI’, that is, foreigners purchasing distressed
and much cheapened assets. In India, too, there was a sharp rise. During the restrictive era,
virtually all FDI was ‘greenfield’ by government dictate; now about 40% is M&A. However, as
will be shown below, there continues to be much official ambivalence about the domestic
welfare effects of this form of MNE entry.
The modalities of foreign capital entry have varied significantly among the six economies (Table
3). FDI has been the major source of capital flowing into China, dwarfing portfolio investment
owing to the semi-closed capital account, including restrictions on foreigners trading shares on
the domestic stock market. Total capital flows to India have risen significantly since the 1991
27

reforms, with a sharp increase from 1996. FDI still remains a relatively unimportant part of these
flows, though it is rising over time as MNEs adjust to the country’s more open policies. Capital
flows to Korea also increased sharply in the first half of the 1990s, until the crisis precipitated
major capital flight during the 1997-98 economic crisis. The major declines occurred in portfolio
and other capital flows; as noted, FDI inflows increased strongly 1997-99.
In contrast to the other countries, and reflecting its consistently open regime, Malaysia has
traditionally received most of its capital in the form of FDI. FDI declined during the onset of the
crisis, though it was still large. In the wake of the September 1998 imposition of capital controls,
portfolio flows turned negative, but FDI strengthened. Thailand experienced the greatest
volatility in capital flows, reflecting the large swing in its capital account balance during the
crisis, equivalent to about 15% of GDP. Capital flows have been negative 1997-2002, but FDI
has remained positive, increasing strongly in the immediate aftermath of the crisis.
Comprehensive capital flow data to Vietnam are poorly recorded. It has the least internationally
integrated capital market of the six. Most of the capital inflows have taken the form of FDI.
Inflows declined in the wake of the crisis, but remained positive.
Fourth, the major sources of FDI vary across countries, although there are some common
patterns. The US, Japan and Europe are typically the major investors. In addition, in some cases
much smaller, but very open, proximate and historically connected economies are major players
in much larger economies. Thus, Hong Kong is the largest investor in China, given its
traditionally important (though declining) role in connecting that country to the global economy.
The round-tripping phenomenon alluded to above is also a factor. Singapore remains a
significant actor in Malaysia, reflecting their historically close commercial and political ties. A
major foreign investor in India is Mauritius where, in addition to historical connections, special
taxation privileges have played a key role.
The 1970s FDI debates about whether particular source countries matter, and whether some are
more desirable than others, no longer resonates.8 This is so for several reasons: the demonstrated
8 This debate included the assertions that Japanese and third world’ FDI were superior to that from America and developed countries respectively. Kiyoshi Kojima (eg, 1996)) was commonly associated with the former argument, while Wells (1983) was a major early study of the latter.
28

evidence that well managed FDI contributes to growth; international competition for FDI is more
intense; there is a greater diversity of sources as compared to earlier periods of American and
European domination; and even quite low-income countries are also investing abroad. Much of
the ‘FDI differences’ literature simply reflected the particular stages of development of the home
countries. These alleged ‘unique’ MNE characteristics generally faded as the source countries
were transformed.
Finally, there is the issue of FDI behaviour during crises, including the magnitude and
composition of FDI flows. Three of the six economies in the sample (Korea, Malaysia, Thailand)
were severely affected by the 1997-98 Asian economic crisis, and in another (Vietnam) growth
slowed markedly. It is therefore useful to examine briefly the behaviour of FDI, and related
policy responses, during this episode. Sudden capital flight is a central feature of modern
economic crises. Crisis economies typically switch quickly from current account deficits to
surpluses. On the current account, expenditure switching and absorption effects reduce imports
and promote exports. In addition, slower economic growth and increased economic and political
uncertainty result in the rest of the world being unwilling to finance a current account deficit.
Moreover, the behaviour of different forms of capital diverge. Portfolio and other forms of
highly mobile capital are more likely to exit a country. By contrast, FDI flows are typically much
less volatile. In fact, post-crisis FDI may well increase, along the lines postulated in Krugman’s
‘fire-sale FDI’ thesis (Lipsey, 2001). Asset prices are now cheaper, owing to depreciated
exchange rates, demand contractions and financial collapse. Policy regimes are typically
liberalized as part of the government’s recovery package. Athukorala (2003) demonstrates that
this is precisely what happened in most of the five East Asian crisis-affected countries during
1997-98. In aggregate, there was massive capital flight, principally portfolio investment and
short-term debt. Yet FDI actually rose modestly.9
FDI may also play an important role during the recovery of crisis-affected economies. The
analytical connection between the two starts with the collapse in aggregate demand during a
9 Indonesia has of course been the principal outlier among the crisis-affected economies, owing to its regime change and prolonged period of political uncertainty.
29

crisis: consumer confidence and therefore expenditure wanes; the capacity for governments to
run fiscal deficits is often constrained; domestic investment falls owing to financial fragility and
weak domestic demand, and uncertainty. Exports are therefore the critical component in the
immediate recovery period. Crucial to the latter are MNEs. Given their global market networks
and know-how, deeper pockets, and stronger connections to global capital markets, they have the
capacity to translate large increases in potential competitiveness (arising from the depreciated
currency) into export growth, in turn facilitating economic recovery.
The 1997-98 crisis also served as a reminder that restrictions on short-term capital flows may be
compatible with an open FDI regime, at least in the short-medium term. This is the major
conclusion of the controversial Malaysian policy experiment introduced in September 1998.10
Nevertheless, it is important to note Malaysia’s special circumstances: its very open economy, its
good quality bureaucracy, and the fact that it has never had a balance of payments crisis.
Moreover, the controls were introduced in the context of a sudden and dramatic political crisis –
the sacking and gaoling of the Deputy Prime Minister – indicating the government’s resolve to
implement the controls.
E. FDI Outflows
Capital outflows are central to the process of globalization. Although occasionally the subject of
mercantilist objections, to the effect that national savings are being employed for the benefit of
others, theory and empirical evidence point clearly in the opposite direction. Outward FDI
benefits the home economy, since domestic factors of production are able to maximize their
returns. It is also presumed to constitute a spur to better economic policy, to the extent that the
option of ‘exit’ for investors exerts a policy discipline on governments. Outflows present a
mixed and imperfectly recorded picture, but it is clear that patterns vary across the six
economies. In all but Vietnam these investments abroad are sizeable. In all cases, there has been
a general relaxation of controls on outflows, although in some cases quite onerous restrictions
remain in place. However, with the occasional exception of Korea, all six are net FDI recipients.
10 See Athukorala (2001) for a detailed examination.
30

The Korean case, at a relatively low per capita income becoming a large investor abroad with
outflows often exceeding inflows, is very unusual. This appears to reflect a number of factors.
One was its traditionally restrictive approach to inflows. The second was the country’s rapid loss
of comparative advantage in labour-intensive activities during the 1980s and the consequent
relocation on a massive scale of much of this industry to high-growth, receptive economies
nearby. A third was the aggressive internationalization of the major chaebol from the late 1980s,
with support from the government. A considerable proportion of the FDI was high-end
investment in sectors where protection in the targeted markets necessitated investment rather
than export from the home base (eg, the automotive and consumer electronics industries).
‘Reverse engineering’ type FDI, to obtain access to host country technology, has sometimes been
a factor. In India, also, this motive is increasingly important.
China is also emerging as a major investor abroad. This phenomenon may appear surprising in
view of its rapid growth, with the presumption that returns on capital would be higher at home
than abroad. Three factors appear to be relevant in this story (Garnaut and Song, eds, 2003). One
relates to macroeconomic policy. China is running large current account surpluses and
accumulating massive international reserves, currently estimated to exceed $350 billion. Most of
these reserves are held abroad, albeit largely in the form of government securities rather than
FDI. The second factor is the round-tripping phenomenon referred to above. This is not of course
genuine FDI, and should be discounted from the outflows figure. The third are investments
abroad by state-related entities in sectors deemed to be of commercial and strategic importance,
such as natural resource projects.
For some countries, it is useful to distinguish between what may be termed ‘state-sponsored’ and
‘market driven’ investments. This is evident in Malaysia, for example. The government has
sponsored several major investment projects abroad, including directly through its state-related
entities. Some of these have been high profile, quasi-political investments in the ‘South’, with
mixed commercial results. Alongside these have been straightforward efficiency-motivated
investments, principally in neighbouring countries and reflecting firms’ competitive advantages.
31

Three additional features of these outflows are worthy of mention. First, as noted elsewhere,
many of the outward investment projects draw on the countries’ overseas communities, to be
expected given that this diaspora lowers the transactions costs of going abroad. Second, in
countries with complex regulatory systems, outward FDI may be a means of exploiting firm-
specific advantages in a less restrictive environment. This has been hypothesized in some of the
Indian literature, though presumably it is now a less important motive. Third, it appears to be the
case that increasing outward FDI has contributed to the liberalization of policies towards FDI
inflows. The argument is that investing abroad does introduce an appreciation of the case for a
more predictable and open regime. This has evidently been the case in Korea, particularly in the
context of its accession to the OECD.
F. Trade Regimes
Openness to the international economy varies significantly among the six. All have become more
open to trade since 1990, as indicated by both trade reforms and rising export/GDP ratios. This
ratio has increased by more than 50% in three of the countries (China, India and Thailand) and
substantially in the others (Table 1).11 Malaysia and Thailand were among a very small group of
developing economies classified by Sachs and Warner (1995) as ‘always open’. Both exhibit
very high trade orientation, quite low average tariffs, modest inter-industry tariff dispersion, and
limited incidence of NTBs. Qualitative indicators support this conclusion. Korea now has fairly
low average tariff rates. Notwithstanding recent reforms, China, India and Vietnam still have
quite high tariffs, and a higher incidence of NTBs. Smuggling remains rampant in the more
protected economies.
Among the six, Korea’s trade and investment regime has arguably been the most unusual. From
the early 1960s, it achieved very rapid export-led growth, but in the context of (until recently)
very restrictive policies towards imports (except those required by export-oriented firms) and
11 Of course, the usual caveats have to be attached to the data in Table 1. Trade/GDP ratios need to allow for country size. Average tariffs need to take account of tariff dispersion and the presence of NTBs. To varying degrees, all six countries maintain dual trade regimes as between export sectors and the domestic economy. Nonetheless, the picture presented here is a reasonably plausible characterization of the country differences.
32

FDI. Its adventurous industrial policy resulted in tremendous achievements but also high costs.12
In addition to tariff reform and the reduced incidence of NTBs, Korea’s 1990s reforms also
included a reduction in the number of subsidy programs and customs simplification. As with its
FDI regime, a desire to join both the GATT/WTO and the OECD, and the imperative to reform
in the wake of the 1997-98 crisis, drove much of the liberalization.
Vietnam’s re-engagement with the international economy is of very recent origins. For much of
the period following the commencement of its 1986 Doi Moi reforms, it was effectively shut out
of the world’s largest market: the US Embargo was lifted in 1993, while the two countries signed
a Bilateral Trade Agreement only in 2001. As is the case with late reformers, its official trade
regime remains opaque and poorly documented. It is only quite recently that a formal tariff
schedule was released. It still retains very high levels of protection (several hundred percent) for
its automotive, sugar and garments industries. Much protection is firm-specific in nature, tailored
to the needs of its inefficient SOE sector. Vietnam aspires to WTO membership by 2005, which
constitutes a powerful incentive to continue and broaden the reform process. ASEAN
membership and the gradual introduction of AFTA commitments have constituted a useful
‘training exercise’ for its WTO application.
A central feature of trade reform in all six economies is that it was unilateral in nature. While
four of the countries are members of preferential trading arrangements – ASEAN in the case of
the three Southeast Asian economies and SAARC (South Asian Association for Regional
Cooperation) for India – in practice these arrangements have meant practically no deviation from
non-discriminatory reform.13 Unfortunately, this may be changing. With the current US-led
penchant for FTAs, all six have been forced to follow suit, and explore FTA options. Korea and
Thailand in particular have been active. If these FTAs ever become significant, MNEs will
certainly respond by including preferential access to selected exports markets as a factor in their
decision-making processes.
12 For contending perspectives on the impact of these interventions, see for example Amsden (1989, 2001) and Smith (2000). 13 That is, the ASEAN AFTA liberalizations have almost always been multilateralized, while the SARC concessions have been trivial.
33

(2.7) The Commercial Environment
The large variations in the foreign presence among the six economies are explained
fundamentally by the attractiveness of the host economies to FDI. This in turn reflects the rate of
economic growth in each, and the ease of entry for foreign investors. In addition to
macroeconomic management and openness, a number of factors co-determine both economic
growth and FDI attractiveness. Several proxies for these factors are presented in Table 1.
Informed analytically by the ‘three Is’ referred to above, these variables include proxies for
human capital, the quality of physical infrastructure, institutional quality and country risk, and
financial conditions. The argument here is that, as economies open up, governments have to
make the transition from protectionist/regulatory regimes to a new emphasis on promotion and
efficiency. Thus, there needs to be more effective industrial extension, R&D and other support
schemes; better physical infrastructure; legal reform; improved education; and administrative
reform and simplifications. Broader still are issues of country risk and policy predictability.
Hence, countries’ performance according to a range of ‘competitiveness’ variables listed in
Table 2 is central to economic progress.
It also needs to be emphasized that domestic investors are invariably the key players in any
economy and that domestic investor sentiment weighs heavily in MNEs’ international location
decisions. Therefore what matters is the host economy’s commercial environment in general, and
not especially as it relates to foreign investors. Indeed, FDI regimes which are significantly ‘pro-
foreign’ in their incentives or other provisions are unlikely to be fiscally or politically durable,
and are therefore heavily discounted by MNEs. It is important that any study of competitiveness
and the business environment recognize this fact.14
14 Of course, there will always need to be some special provisions in any investment law tailored specifically for foreign investors, eg, concerning guarantees against expropriation and provision for profit remittance.
34

The proxies and data in Table 2 are of course highly selective, and subject to numerous
qualifications.15 But they are illustrative, and generally accord with a priori notions. Moreover,
they effectively draw attention to the diversity of the six countries.
China’s human capital base is comparatively strong, with near universal literacy, and segments
of technical excellence. It is also increasingly able to tap into a very large international diaspora.
It has R&D strengths, some military related, or present owing to the past emphasis on heavy
industry. It is rapidly opening up to foreign trade and investment, at a pace faster than either
India or Russia. Its commercial institutions have been historically weak, and the country
continues to score poorly in international comparisons of corruption and protection of property
rights. But institutional quality is improving quickly, especially in regions most connected to the
international economy. Physical infrastructure is being upgraded rapidly, although it quality is
spatially very uneven.
India’s human capital and R&D base has pockets of international excellence, most notably in IT
and in some defence-related heavy industry. Until recently, and in contrast to much of East Asia,
its educational priorities resulted in centres of international quality alongside quite high levels of
illiteracy. It also differed from East Asia until recently in that its inward-looking strategy meant
that it was unable to exploit its human capital strengths in the global economy. Thus, in contrast
to China, its major intrusion into the international IT industry has been via services rather than
manufacturing. Its commercial environment is broadly predictable, and the legal system
cumbersome but independent. Economic policy making is the most dispersed among the six
countries. A large diaspora facilitates its connections to the international economy. The 1991
reforms and their aftermath have begun to transform the commercial environment, but the
unfinished agenda is large and complex, and the forward momentum appears to have slowed
significantly in recent years.16
15 Numerous data sources could have been selected. One recent and very useful series, with heavy emphasis on technological capacity and learning, is presented in UNIDO (2002). Its major drawback for this chapter is that it does not include Vietnam. Part 3 (‘Competitiveness in Developing Asia’) of ADB (2003) provides a comprehensive review of various competitiveness estimates. 16 For a detailed review of these issues, see the contributors to Krueger (ed, 2000). On the reform list, major areas include fiscal imbalances, public sector enterprises, trade policy (especially in consumer goods industries), labour market rigidities, SMEs and reservation schemes, the regulatory and licensing system, and centre-state relations. Many of these of course intersect.
35

Korea’s development strategy has been underpinned by exceptional strength in some areas. It
reached OECD levels of educational achievement and R&D expenditure at comparatively low
levels of per capita income.17 Its internet access and usage is one of the highest in the world. Its
infrastructure and institutional quality are good though not outstanding. External factors –
aspiring to membership of international organizations and the recent economic crisis – have been
important in Korea’s policy reforms. As with its trade and FDI regimes, the internationalization
of its human capital strengths has proceeded more slowly (Dahlman and Andersson, 2000). For
example, its universities remain relatively unconnected to the international mainstream.
Malaysia emerges as a country with comparatively high institutional quality, excellent physical
infrastructure, and large public investments in education, much of it designed to redress past
ethnic imbalances. It has had the most consistent commercial policy environment of the six.
Nevertheless, there are concerns that the independence of its legal system may have been
weakened over the past two decades, and there has been a persistent loss of high-level non-
bumiputra human capital. Its very open international labour market has delayed the process of
upgrading its technological capabilities, and it faces in particular competitiveness challenges
from below (especially China) and from above (the Asian NIEs).
Thailand scores well on most indicators, with the principal exception of human capital. Until
recently, while achieving almost universal primary enrolments, its education retention ratios
were very low. In consequence, during the 1990s, as real wages began to rise quickly in the wake
of rapid economic growth, it experienced difficulty managing the transition out of labour-
intensive activities. It has become progressively more open in its trade and FDI policies
(although nationalist sentiment became more pronounced in the wake of the 1997-98 crisis).
Historically, its legal and commercial institutions were not strong, though its informal
commercial rules of the game were widely understood and observed. Physical infrastructure is
generally good, apart from Bangkok congestion.
17 For example, R&D expenditure rose from 0.3% of GDP in 1971 to 2.8% in the mid 1990s.
36

Having successfully completed the first round of macroeconomic and commercial policy
reforms, the principal challenges in Vietnam relate to establishing the infrastructure which
underpins a market-based economy: property rights, the legal system, financial intermediation,
and physical infrastructure all remain poorly developed. Illiteracy levels are low, but so too is the
stock of internationally experienced entrepreneurs. Many small and household enterprises
operate in an insecure commercial environment. SOE reform lags. There are pronounced
regional differences (especially, still, between the north and the south) in the quality of the
physical and commercial infrastructure.
Considering the wide variety of resource endowments, policy regimes, and experiences with FDI
among the six economies, it is not surprising they have developed different views toward
international investment agreements.
III. INTERNATIONAL INVESTMENT AGREEMENTS
In the context of international trade and investment negotiations, most favored nation (MFN)
treatment obliges the host country to offer equally advantageous investment conditions to
potential investors from all treaty signatories. National treatment (nondiscrimination) requires
the same treatment of both foreign and domestic investors.
Over 1,900 bilateral investment treaties (BITs) and 2,100 double taxation treaties were in effect
by the end of 2000 (UNCTAD 2001). These BITs vary across countries but generally contain
binding commitments on expropriation, transfer of funds, and compensation due to armed
conflict or political instability. These commitments are provided on a national treatment or MFN
basis. Disagreements between foreign investors and the host government are usually referred to
private arbitration centers of the International Chamber of Commerce or the International Centre
for Settlement of Investment Disputes (ICSID).18
18 While private sector arbitration mechanisms have generally worked satisfactorily so far, it raises the potential for political disagreements in that a sovereign judicial system can be overruled by an arbitration panel that is unelected and usually operates with little transparency.
37

BITs are intended to protect foreign investors against unpredictable host country actions that
would negatively affect the profitability of their investments. In this sense they guard against
problems of dynamic inconsistency. However, their implementation may not always be effective
in lower income countries. Furthermore, their benefits for the host countries are not clear.
Empirical evidence has not found a strong link between the existence of a BIT and an increase in
FDI flows. Furthermore, BITs complement, rather than substitute for institutional quality,
including strength of property rights (Hallward-Dreimeier 2003). Tax treaties may even reduce
FDI if the FDI includes an element of tax evasion. At the same time BITs may reduce policy
options for the host country government and leave it open to being sued for substantial amounts.
Decisions handed down behind closed doors by the arbitration panels, which have no public
accountability, cannot be amended by the domestic legal system.
Despite the asymmetry of BITs benefits for foreign investors and host economies, these
agreements have proliferated. China has signed bilateral agreements with 98 countries on
protection of investment, and with 70 countries on taxes. By January 2002, India had signed 45
bilateral investment promotion and protection agreements. As some developing economies
mature and their outward FDI flows increase, as in the case of Korea, they become more
interested in protecting the rights of their investors. In the broadest international context, this has
led to calls for a multilateral framework on investment (MFI).
A. The Agreement on Trade-Related Investment Measures (TRIMs Agreement)
In the multilateral context, the General Agreement on Tariffs and Trade (GATT)/WTO has
stipulated rules related to trade-related investment measures (TRIMs). TRIMs are a subset of the
incentives and regulations designed to influence FDI. Broadly speaking, they consist of
incentives and regulations deemed to have a direct impact on international trade. The most
common TRIMs are local content requirements and export performance requirements. Trade
balancing measures are also considered TRIMs. In this case, governments impose restrictions on
the import of inputs by a corporation, or limit the import of inputs in relation to the level of
exports of the firm. Some foreign exchange balancing requirements impose a similar scheme
whereby a corporation’s permitted imports are tied to the value of its exports so that there is net
38

foreign exchange earning. Another measure used is denying foreign corporations access to the
host country markets.
After a failed attempt to formulate a multilateral agreement on investment among mostly
developed countries in the OECD, the TRIMs Agreement was formulated in the Uruguay Round
of the GATT (1986-94), the forerunner of the WTO. A combination of factors led to the
inclusion of foreign investment in the work program of the Uruguay Round negotiations. As
mentioned above, there was a changing perception of the role of FDI in development. Foreign
investment had become increasingly important and the flows far more sizeable. Perceptions had
also moved from initial anxiety to a more welcoming stance. The United States-Canada dispute
over Canada’s application of performance measures on foreign firms around this time also
facilitated debate on the linkages between GATT rules and foreign investment policy (Bora
2001).
The TRIMs Agreement recognizes that certain investment measures distort trade and that these
distortions are not consistent with GATT principles. Export subsidies, import entitlements,
minimum export requirements, and local content requirements directly affect volumes and prices
of imports and exports, and in some cases the composition of trade. Local content requirements
mean that imports are treated less favorably than domestic inputs, violating the national
treatment principle of the GATT. A trade-balancing requirement that limits the quantity of
imported products that can be used if an MNC does not meet its export target also violates
national treatment obligations. Incentives geared to attracting FDI, such as tax incentives, may
influence trade flows by persuading firms to favor FDI over exports as a method of foreign
market penetration.
Despite this, only a brief TRIMs Agreement was put into effect on 1 January 1995 after a lengthy
debate. The TRIMs Agreement included the following terms:
(i) It would only cover regulations and requirements imposed on foreign investors that
directly impinged on international trade flows.
(ii) Its coverage “applies to investment measures related to trade in goods only.” This meant
that it excludes investment incentives and many performance requirements. Furthermore,
39

services are covered by the WTO General Agreement on Trade in Services (GATS), and export
subsidies are covered in the Subsidies Agreement. As such, technology transfer requirements,
licensing requirements, and joint venture requirements are not included in the TRIMs
Agreement. Export performance requirements are not actually part of the annexed list of the
TRIMs Agreement. There has been ongoing debate about whether or not the list should be
extended to prohibit these policies.
(iii) The central provision prohibits trade-distorting investment measures subject to GATT
Article III (national treatment) or Article XI (elimination of quantitative restrictions). Measures
specifically identified as inconsistent with Articles III and XI include provisions for local
content, trade balancing, import substitution, foreign exchange, and export limitation
requirements.
(iv) The Agreement sets deadlines for removing trade-related investment measures. Member
states were given 90 days from 1 January 1995 to notify the Council for Trade in Goods of all
measures that did not conform with the Agreement. They were then given a “transition period” to
eliminate their notified TRIMs. A member’s level of development determined the length of time
it was given to eliminate TRIMs. Developed members were allowed two years; developing
countries were given five years and least-developed countries were given seven years.
(v) There was provision for developing and least-developed countries to apply for an
extension of the transition period. Ten WTO members have so far submitted transitional period
extension requests. The requests range from less than a year for Chile to seven years for
Pakistan.
(vi) An allowance was made for developing country members to deviate temporarily from the
provisions of the obligations as, for example, under the Balance-of-Payments Provisions of
GATT 1994. The waiver of an obligation will be granted providing that three fourths of the
Members agree.
(vii) Arrangements were made for the Agreement to be overseen by the WTO Council for
Trade in Goods, with the WTO dispute settlement mechanism to apply to the TRIMs Agreement.
A review of the operation of the Agreement took place in 2000, five years after its entry into
force.
40

The Agreement did not provide an explicit definition of TRIMs. Nor did it define “investment.”
Instead, it provides an Illustrative List in the Annex with examples of laws, policies, or
regulations that are considered as TRIMs and are deemed to violate GATT Articles III and XI.
All developing countries were to have implemented the TRIMs Agreement and eliminated their
relevant regulations by 1 January 2000. Twenty-six developing country members with widely
varying economic characteristics gave notice that at that time they still had a variety of policies
in existence, however. Most of the policies related to the auto industry or the agro-food industry.
The policies overwhelmingly adopted by these countries were local content schemes. The second
most frequently notified type of TRIM was foreign exchange balancing requirements (Bora
2001).
In Malaysia, TRIMs compliance remains incomplete, as the country continues local-content
policy on motor vehicles for both new and existing firms (although this is to be phased out Dec.
31, 2003). Local content requirements are also being phased out in Viet Nam as part of its
moves towards WTO accession. Meanwhile, compliance with the TRIMs agreement was
instrumental in overcoming resistance to investment policy reform in Thailand, as trade-related
investment measures were gradually abolished.
A number of countries requested extensions of the transition period. Argentina, Malaysia,
Thailand, and Philippines cited financial crises that added to their structural adjustment problems
as a major factor behind their extension requests. Colombia and Pakistan cited specific
development reasons for their extension requests. Colombia detailed difficulties in transforming
its economic model, especially in terms of developing substitutes for illegal crops. They argued
this would require domestic absorption, or local content policy, to ensure that farmers are able to
sell their produce. Pakistan argued that opening its economy to import competition rapidly would
not allow it to exploit domestic resources optimally, to promote the transfer of technology, or to
41

promote employment and domestic linkages. Another reason cited for an extension request was
inconsistency between preferential trade agreements and multilateral obligations (Bora 2001).19
The current TRIMs Agreement resulted from a compromise. During the Uruguay Round
discussion, developed countries, including the European Union (EU), Japan, and US initially
proposed to establish a comprehensive agreement on investment. Their proposed framework
covered a wide range of areas such as technology transfer requirements, restrictions on the
transfer of profits overseas, controls on foreign exchange flows, government reviews of foreign
investment performance, and nationalization. This plan faced strong resistance from the
governments of developing countries. Brazil and India maintained that investment was outside
the GATT’s competence, while other developing countries tended to take a defensive position
with regard to TRIMs (Ariff 1989). In particular, many developing countries resisted the extent
to which market access for foreign firms would be included. The result was that negotiations
focused on policies that applied to the operations of foreign firms. Even then, negotiation still
proved to be difficult.
Since the enactment of the Agreement, the main focus has been on the trade effect of local
content and export performance requirements. Since 1995, TRIMs obligations of new members
on accession to the WTO depend on the terms of their accession. So far, all acceding countries
have agreed to implement the TRIMs Agreement upon accession regardless of whether they are
developing countries or not.
The remarkable brevity of the TRIMs Agreement in relation to the complicated issues it covers is
extraordinary. The brevity of the TRIMs Agreement is a manifestation of the divisions that
emerged between developed and developing countries. This lack of consensus also explains the
vague nature of elements of the agreement. The current TRIMs Agreement does not contain a
basic definition of investment. This requires clarification, as the definition of investment has
profound implications for the scope and coverage of the Agreement. The definition of investment
in the draft OECD Multilateral Agreement on Investment, for example, went far beyond the
19 Argentina’s request stated specifically that negotiations within the context of the MERCOSUR Common Automotive Policy were important. Mexico did not specifically mention NAFTA in their request, but it has been
42

traditional notion of FDI to include portfolio investment, debt capital, intellectual property rights,
and various forms of tangible or intangible assets (Ganesan 1998). Korea has suggested using an
enterprise-based definition of investment for investment liberalization, and an asset-based
definition for investment protection. This approach could help developing countries avoid
negative effects of volatile short-term portfolio investment.
Bora (2001) summarizes a few other areas where confusion might arise. The TRIMs Agreement
covers measures related to foreign investment according to their impact on trade. However, since
nothing in the TRIMs Agreement suggests that the nationality of the ownership of enterprises is
an element in deciding whether that measure is covered by the Agreement, the TRIMs
Agreement is not confined to policies targeting foreign firms. It is in fact ownership-neutral.
However, some argue that the TRIMs Agreement is basically designed to govern and provide a
level playing field for foreign investment and that therefore measures relating to internal taxes or
subsides cannot be construed to be trade-related investment measures.
There is also no well-defined phase-in period in place to bring laws into conformity for members
that notify under the TRIMs Agreement. Members are under no obligation to respond in detail.
This has caused some implementation difficulties. None of the notifying countries have either
developed an implementation plan or identified alternative policies that could be used to achieve
this objective.
TRIMs are typically used in conjunction with a number of other policies. One aspect, which was
not taken into account during the Uruguay Round negotiations, was how the removal of certain
TRIMs without addressing companion policies would affect trade. For example, local content
schemes are usually combined with a subsidy. The TRIMs Agreement disciplines trade policy,
but not incentives. Views are still divided on how to deal with both incentives and regulations.
Ambiguity in the wording of the TRIMs Agreement has made the interpretation of obligations
difficult. Some developing countries’ lack of capacity to fully understand the scope and
implications of these obligations has exacerbated this problem. These problems have also created
noted that there is an inconsistency in the phase out period for TRIMs between NAFTA and the WTO.
43

a tension between the generally accepted notion of efficiency and the broader definition of
development. Some work to clarify these issues has been done recently by the WTO Council for
Trade in Goods, but solving these problems will require much time and effort (Bora 2001).
The current TRIMs Agreement relies on the state-to-state mechanisms of the WTO for dispute
settlement and arbitration under which, for example, a dispute settlement panel is established and
makes its judgment. Some argue that it is necessary to establish investor-to-state mechanisms to
ensure investors receive a hearing (Moran 2002). Others believe inclusion of an investor-to-state
dispute settlement mechanism would add an excessive burden on developing countries’ legal
machinery and imposes a threat to their national sovereignty (Tangkitvanich et al. 2003).
Korea’s preliminary position is that the dispute settlement of the MFI should not cover investor-
to-state disputes.
Believing the existing TRIMs Agreement to be inadequate, developed country parties such as
EU, Japan, and US largely view it as a mechanism for removing performance requirements on
foreign investment (Greenfield 2001). Still, the Agreement represents a step forward in ensuring
that countries are all subject to the same rules respecting the use of certain investment-related
performance requirements. Although most FDI has occurred between developed countries, the
Agreement has allowed investment issues to be discussed in the context of multilateral
negotiations. These discussions have been continued through the WTO Working Group on Trade
and Investment where members have further assessed the linkages between trade, FDI, and
development. It has also allowed disputes between member states to be settled in the WTO
context, and has enforced GATT provisions.
B. The Ongoing Divide Regarding Negotiating a Multilateral Framework on Investment
Investment was again put on the agenda for the WTO Doha round of negotiations. Investment,
competition policy, transparency in government procurement, and trade facilitation have been
labeled the “Singapore issues”, following the WTO work program in the 1996 Singapore
Ministerial Declaration. The Doha Declaration continues to attach the usual operational
qualifications of “trade-related aspects only” for investment and competition policy. However,
44

as evidenced at the Fifth WTO Ministerial Conference in Cancun, Mexico, in 2003, members are
still far from in agreement on investment issues.
In the WTO discussions, negotiations take place in what is known as a “single undertaking” in
which concessions in one sector can be traded off against concessions in other sectors. In
Cancun, resistance by more developed economies to make further concessions on agriculture
prompted some developing countries to refuse to negotiate on the Singapore issues, and vice
versa. In the end, the discussions broke down on the issue of investment, although other factors
were more likely the underlying reason.
Considerable divisions continue to exist between developed and developing countries on
investment-related issues in the WTO framework. Since the TRIMs Agreement came into effect
in 1995, operational details have caused contention between developed and developing countries.
Some developing members argue that they lack the capacity to identify measures that are
inconsistent with the TRIMs Agreement and hence are unable to meet notification deadlines set
out for the transition periods. In some cases, members that did notify do not appear prepared to
meet the deadlines. Many members implemented strategies that seemingly addressed the
implications of compliance for the affected industries, but did not actually implement alternative
policies.20
Furthermore, governments of some developing countries, including Malaysia, have argued that
the process for negotiating extensions to the duration of transition periods should be undertaken
through a multilateral framework. In contrast, EU, Japan, and US argued that requests for
deadline extensions should only be considered on a “case-by-case” basis and should be
negotiated bilaterally (Greenfield 2001). The bilateral nature of this process has caused concern
among developing country governments that developed countries could use the threat of
rejecting requests for an extension as bargaining leverage against developing countries. Since the
1999 Seattle talks, the WTO Council for Trade in Goods has held several meetings to resolve the
dispute over extension procedures. This was partly resolved in July 2000 when it was decided
20 Implementation is difficult in some cases. For example, Romania had a legally binding contract between the government and a firm that included a policy not in compliance with the TRIMs Agreement, but the removal of this would have had legal consequences for the national government.
45

that the Council chair would oversee multilateral negotiations. However, requests will still be
dealt with on a case-by-case basis and are open to bilateral pressure.
The extremely brief preamble of the TRIMs Agreement states that it takes into account the trade,
development, and financial needs of developing countries. Some applications for extensions
cited the financial crises that hit East Asia and Latin America. However, some developed
countries argue that structural adjustment should not be considered a defense, as this is part of
any obligation to liberalize.
More fundamentally, several developing counties are of the view that TRIMs and other
investment measures are domestic investment issues that should therefore not involve
GATT/WTO officials. This point was emphasized during the Fifth WTO Ministerial meeting in
September 2003. India and others also assert that the mandate of the GATT and WTO is
confined to trade and does not extend to investment. Some fear they would be deprived of a
major means of exercising control over foreign firms operating locally if their right to impose
TRIMs or other investment measures were removed. Some developing countries, including India
and Malaysia, consider that policies such as domestic content requirements are essential policy
tools for industrialization. At the WTO Doha Ministerial Conference, a number of countries
stated that joint venture requirements encourage indigenization. They believe developing
countries should be allowed to use TRIMs and other investment measures flexibly in pursuit of
developmental objectives because each country’s unique needs and circumstances require
sufficient freedom and flexibility to pursue one’s own policies. They are of the view that,
although the TRIMs Agreement established uniform obligations for all members, it does not take
account of structural inequalities and disparities in levels of development; technological
capabilities; or social, regional, and environmental conditions, and does not incorporate a
meaningful development dimension. A legally binding treaty on foreign investment would
reduce the degree of flexibility available (Ganesan 1998).
Panagariya (2001) points out a number of major factors behind objections to a multilateral
agreement on investment by developing countries. These include asymmetries in the obligations
46

they must undertake in these areas and in the distribution of benefits, limited capacity to
negotiate, and limited resources for implementation.
A major reason for their reluctance is that liberalization of investment is more constrained by
political factors than is trade.21 Many developing countries find political sensitivities demand
discretion in how investment liberalization proceeds. Investment is a sensitive issue in terms of
national sovereignty, and this adds another dimension to policies aimed at controlling the extent
and character of foreign production within a nation’s own borders (McCulloch 1991). This arises
from the fact that direct investment means long-term ownership and control over assets,
resources, and enterprises.
A second reason is that many developing countries wish to ensure a degree of certainty that the
benefits of a future agreement outweigh the risks of trade sanctions before they are willing to
commit to negotiations. Based on their experience with the Uruguay Round Agreement, some
developing countries fear that they will fail to implement the negotiated agreements in a timely
fashion and then be left exposed to the risk of trade sanctions. Third, many developing countries
lack the capacity to negotiate effectively on a wide-ranging agenda. The problem is not merely
one of financial resources, but also involves human resources. Furthermore, since developed
countries already meet the standards likely to be negotiated with respect to the Singapore issues,
liberalization in these areas places a proportionately greater burden on developing countries. The
use of TRIMs and other investment regulations tends to be relatively high in developing
countries. From the national standpoint, it is not clear that the implementation of these
agreements on a priority basis represents the best use of the limited resources and political
goodwill available to the governments.
This raft of concerns explains the ongoing reluctance of many developing countries to negotiate
a multilateral framework on investment. Some countries have been concerned about the
dislocations and difficult adjustments that will be forced on uncompetitive firms and workers.
21 Panagariya (2001) pointed out that trade is generally easier to liberalize than investment, which is easier to liberalize than labor flows. Within trade, goods trade is easier to liberalize than services trade. Within investment, FDI is easier to liberalize than portfolio investment. And within labor, opening up to immigration of skilled labor is easier than to unskilled labor.
47

The tone has suggested that some developing country authorities might even wish to reopen the
TRIMs Agreement (Moran 2002).
In a joint submission with Brazil to the WTO’s Committee on TRIMs in October 2002, India
argued that the TRIMs Agreement should be amended to incorporate provisions that provide
developing countries flexibility to implement development policies. In particular, they proposed
that developing countries should be allowed to use investment measures or performance
requirements to promote domestic manufacturing capabilities in high value-added sectors, to
stimulate transfer and indigenous development of technology, to promote domestic competition,
and to correct restrictive business practices (Kumar 2003). Despite its increasing trend of
investment abroad, Malaysia also views multilateral rules on investment as impinging on
development policy options and has called for clarification of the issues before negotiations
commence (Tham 2003).
To date, it is still unclear whether the WTO will negotiate investment related issues further, and
what form and scope the negotiations will take if they do proceed. Furthermore, it is not clear
whether any new talks would center around extension of the TRIMs agreement or a new
comprehensive multilateral investment agreement. This reflects the continuing difference of
opinions between developing and developed countries. The next subsection explores some issues
that might arise in future negotiations.
Is a Multilateral Framework on Investment Necessary?
Mundell (1957) argued that free trade is a substitute for factor movements, so that in the
presence of free trade there would be little or no FDI. By this logic, there would be no need for
investment measures in the absence of FDI, if the latter were due to free factor movements. Ariff
(1989) also argued that investment measures only arise because of pre-existing distortions. Such
distortions make domestic market orientation an attractive proposition to foreign investors.
Investment measures would become largely a non-issue if liberalization succeeded in
dismantling tariff and non-tariff barriers to trade. For example, local content requirements tend to
raise production costs and render final products uncompetitive. A local content program can only
48

be sustained behind protectionist walls. Similarly, elimination of protection will diminish the
need for export incentives. Without tariffs, quotas, and other import barriers, there would be less
rent to extract and thus less scope for performance requirements. Thus, trade liberalization can
also induce more liberal investment regimes. The more successful is trade liberalization, the less
it will need to worry about investment agreements. This raises two questions: should
liberalization focus on trade, and is an agreement on investment needed?
The reality is that trade and FDI coexist. Impediments to trade are a factor in the growth of FDI,
but other market imperfections also have important influences on the decisions of firms to invest
abroad. Real market conditions seldom approximate the free trade model. Oligopoly rather than
perfect competition is a characteristic of many market structures in which foreign firms operate,
and these firms have considerable discretion over the choice of market in which they operate
(Balasubramanyam, 1991). Even for trade barriers, it would be unrealistic to assume that all
trade barriers will disappear soon. In these circumstances, restrictions on foreign investment, as
well as incentives to promote it, may exist for a long time.
Nevertheless, an agreement on investment might strengthen the investment climate of host
countries and also contribute to trade liberalization. Foreign investment and trade are not
necessarily substitutes for each other. Often they have a complementary relationship. Effects of
restrictions on trade or investment are empirically indistinguishable from one another. As with
the multilateral trade rules introduced through the Uruguay Round, a multilateral framework of
rules may or may not be necessary for investment in order to cope with the dynamics of an
ongoing integration of the world economy. In recent years, TRIMs have been reduced or
dismantled as the TRIMs Agreement is implemented. However, such measures have also been
reduced as countries carry out economic reform and liberalization.
Is an Investment Agreement a North-South Divide?
Industrialized countries are still overwhelmingly the main source of FDI. However, capital
moves not only between developed and developing countries, but also between developed
countries. By the mid-1980s, the US had emerged as the world’s largest host country in terms of
49

the total value of inward FDI. Thus, developed countries represent both major sources of, and
hosts for, FDI. The increased extent of intra-industry FDI among the industrialized nations blurs
the distinction, at least among industrial nations, between host and source countries. The
investment issue thus is of interest to developed countries as both suppliers and recipients of
FDI. Developing countries are mainly recipients of FDI. But a number of developing countries,
most prominently Hong Kong, China; Republic of Korea; Taipei,China; and Singapore have
undertaken investment abroad. Thus for some developing countries, the stake or interest in the
TRIMs Agreement and other investment issues may be more similar to that of their developed
counterparts.
There are different views between and within developed and developing nations. For example,
given their generally open capital markets, relatively higher income levels, and preoccupation
with agricultural liberalization, countries in Latin America were not particularly opposed to
negotiation of the TRIMs Agreement. In its submission to the Working Group on the
Relationship between Trade and Investment at the WTO, the Government of the Republic of
Korea supported the EU position on banning technology transfer requirements for foreign
investment (Greenfield 2001). Much of the opposition derives from countries in Africa and Asia
(Panagariya 2001).
Conventional wisdom holds that developing countries engage in trade-distorting investment
measures while developed countries do not. However, trade and investment figures clearly show
that developed countries also use investment measures. Most developed countries make available
location-based incentive packages for both domestic and international investors. Ireland reports
that its special incentive packages have attracted more than 1,200 foreign firms to its economy,
and these contribute 70 percent of the country’s industrial output and three quarters of its
manufactured exports (O’Donovan 2000). German grants to both domestic and foreign firms to
settle in the economically depressed former East Germany have exceeded the already generous
treatment EU member states used to attract investment to regions lagging behind. The OECD
found that almost 90 percent of all domestic support programs in the EU were available to
foreign investors (OECD 1996, Moran 2002). Any multilateral effort to create a level playing
field for national and international companies among home and host countries around the world
50

would be seriously deficient if it ignored the proliferation and escalation of location-based
incentives by developed countries.
Overall, it appears that with or without a multilateral framework for investment, many countries
have carried out liberalization of investment regimes. This has two possible implications: (a) a
multilateral framework is redundant; or (b) it is more necessary as policies converge, and a more
comprehensive international agreement on investment becomes increasingly possible and
necessary for facilitating the liberalization process and to govern investment measures. Which
outcome emerges will depend on the bargaining positions adopted by different countries and the
attitudes they hold towards the process. Even a small group of developing Asian economies are
seen to hold widely diverging views on negotiating a multilateral framework for investment,
from strongly in favor (Korea) to strongly opposed (India), from viewing it as a helpful spur to
domestic liberalization (Thailand) to a constraint on development policy options (Malaysia), and
from acceptance if implementation is gradual (China) to concern over capability to address the
difficulties and challenges of achieving compliance (Viet Nam).
References
ADB (Asian Development Bank), 2003. Asian Development Outlook 2003, Manila.
Aitken, B., G. H. Hanson, and A. E. Harrison, 1997. “Spillovers, Foreign Investment and Export
Behaviour.” Journal of International Economics 43:103-32.
Amsden, A., 1989. Asia's Next Giant: South Korea and Late Industrialization, Oxford University
Press, New York.
Amsden, A., 2001. The Rise of the Rest: Challenges to the West from the Late-Industrializing
Economies, Oxford University Press, New York.
Ariff, M., 1989, TRIMs: A North-South Divide or a Non-issue? World Economy, 12(3): 347-60.
Athreye, S. and S. Kapur, 2001. Private Foreign Investment in India: Pain or Panacea?’, World
Economy, 24 (3), pp. 399-424.
Athukorala, P.-C., 2001. Crisis and Recovery in Malaysia: The Role of Capital Controls, Edward
Elgar, Cheltenham.
51

———, 2003. ‘FDI in Crisis and Recovery: Lessons from the 1997-1998 Asian Crisis’,
Australian Economic History Review, 43 (2), pp. 197-213.
Balasubramanyam, V. N., 1991. “Putting TRIMs to Good Use.” World Development 19(9):
1215-24.
Bora, B., 2001. Trade Related Investment Measures and the WTO: 1995-2001. United Nations
Conference on Trade and Development, United Nations, Geneva.
Bosworth, B. P., and S. M. Collins, 1999. “Capital Flows to Developing Economies:
Implications for Saving and Investment.” Brookings Papers on Economic Activity 1:143-
69.
Buckley, P., 2003. ‘The Challenges of the New Economy for Multinational Firms: Lessons from
Southeast Asia’, in Bartels, F. and N. Freeman (eds), The Future of Foreign Investment in
Southeast Asia, Routledge-Curzon Press, London. pp. 15-31.
Cooper, R. N., 2002. “Growth and Inequality: The Role of Foreign Trade and Investment.” In
Annual World Bank Conference on Development Economics 2001/2002. World Bank,
Washington, D.C.
Dahlman, C.J. and T. Andersson, 2000. Korea and the Knowledge-Based Economy: Making the
Transition, World Bank/OECD, Washington DC and Paris.
Freeman, N., 2003. ‘The Prospects for Foreign Direct Investment in the Transitional Economies
of Southeast Asia’, in Bartels, F. and N. Freeman (eds), The Future of Foreign
Investment in Southeast Asia, Routledge-Curzon Press, London, pp. 170-187.
French, H., 1998. “Capital Flows and Environment.” Foreign Policy in Focus 3(22, August): 1-
4.
Ganesan, A. V., 1998. Strategic Options Available to Developing Countries with Regard to a
Multilateral Agreement on Investment. UNCTAD Discussion Paper No. 134, United
Nations Conference on Trade and Development, Geneva.
Garnaut, R. and L. Song (eds.), 2003. China: New Engine of World Growth, Asia Pacific Press,
Canberra.
Gomez, E.T. and Jomo K.S., 1997. Malaysia’s Political Economy: Politics, Patronage and
Profits, Cambridge University Press, Cambridge.
Greenfield, G., 2001. “The WTO Agreement on Trade-Related Investment Measures (TRIMs).”
CCPA Briefing Paper Series: Trade and Investment 2(1):1-8.
52

Dahlman, C.J. and T. Andersson, 2000. Korea and the Knowledge-Based Economy: Making the
Transition, World Bank/OECD, Washington DC and Paris.
Hallward-Dreimeier, M. 2003. “Do Bilateral Investment Treaties Affect Foreign Direct
Investment? Only a Bit...and They Could Bite.” Working paper No. 3121. Washington,
DC: World Bank.
Hill, H., 2002. ‘Spatial Disparities in Developing East Asia: A Survey’, Asian-Pacific Economic
Literature, 16 (1), pp. 10-35.
International Monetary Fund, 2003a. World Economic Outlook Database. September.
———, 2003b. International Financial Statistics (CD Rom).
Japan Bank for International Cooperation Institute (JBICI), 2002. Foreign Direct Investment and
Development: Where Do We Stand? JBICI Research Paper No. 15, Tokyo.
Joshi, V., 2003. ‘India and the Impossible Trinity’, World Economy, forthcoming.
Joshi, V. and I. Little, 1997. India’s Economic Reforms 1991-2001, Oxford University Press,
Oxford.
Kojima. K., 1996. Trade, Investment and Pacific Economic Integration, Bushindo, Tokyo.
Kumar, N., 2003. “Foreign Direct Investment, Development and WTO: The Case of India.”
Paper prepared for ADB RETA 5994: A Study of Regional Integration and Trade—
Emerging Policy Issues for Selected Developing Member Countries, Manila.
Krueger, A.O. (ed.), 2002. Economic Policy Reforms and the Indian Economy, Oxford
University Press, New Delhi.
Lardy, N.R., 1996. The Role of Foreign Trade and Investment in China’s Economic
Transformation, Oxford University Press, New York.
Lipsey, R., 2001. ‘Foreign Direct Investment in Three Financial Crises’, NBER Working Paper
No. 8084, Cambridge MA.
McCulloch, R., 1991. Investment Policies in the GATT. NBER Working Paper Series No. 3672,
National Bureau of Economic Research, Massachusetts.
Moran, T. H., 2002. Strategy and Tactics for the Doha Round: Capturing the Benefits of Foreign
Direct Investment. Asian Development Bank, Manila.
Mundell, R., 1957. “International Trade and Factor Mobility.” American Economic Review
(47):321-35.
53

O’Donovan, D., 2000. “Economy-Wide Effects of Direct Foreign Investment: The Case of
Ireland.” Paper presented to the InterAmerican Development Bank, 18 September.
Organisation for Economic Co-operation and Development, 1996. Trade and Competition:
Frictions After the Uruguay Round. Paris.
Panagariya, A., 2001. “Developing Countries at Doha: A Political Economy Analysis.”
Available: http://www.bsos.umd.edu/econ/panagariya/apecon/Policy%20Papers/Doha-E-
2.pdf.
Ramstetter, E., 1999. ‘Comparisons of Foreign Multinationals and Local Firms in Asian
Manufacturing over Time’, Asian Economic Journal, 13 (2), pp. 163-203.
Razin, A., E. Sadka, and T. Coury, 2002. Trade Openness and Investment Instability. NBER
Working Paper No. 8827, National Bureau of Economic Research, Massachusetts.
Sachs. J. and A. Warner, 1995. ‘Economic Reform and the Process of Global Integration’,
Brookings Papers on Economic Activity, 1 (1).
Smith, H., 2000. Industry Policy in Taiwan and Korea in the 1980s: Winning with the Market,
Edward Elgar, Cheltenham.
Tangkitvanich, S., D. Nikomborirak, and B. Krairiksh, 2003. “Thailand’s Country Report on
FDI.” Paper prepared for ADB RETA 5994: A Study of Regional Integration and
Trade—Emerging Policy Issues for Selected Developing Member Countries, Manila.
Tham, S.Y., 2003. “Foreign Direct Investment in Malaysia,” presented at the ADB Finalization
Conference for Country studies on Foreign Direct Investment, Manila.
United Nations Conference on Trade and Development (UNCTAD), 2001. World Investment
Report 2001: Promoting Linkages. United Nations, Geneva.
———, 2002. World Investment Report: Transnational Corporations and Export
Competitiveness. United Nations, Geneva.
———, 2003a. World Investment Report 2003—FDI Policies for Development: National and
International Perspectives. United Nations, Geneva.
———, 2003b. Foreign Direct Investment Database. Downloaded on 15 September.
UNIDO, 2002. Industrial Development Report 2002/2003: Competing Through Innovation and
Learning, Vienna.
Wells, L.T., 1983. Third World Multinationals, MIT Press, Cambridge, Mass.
54

55
Wells, L.T. Jr and A.G. Wint, 1991. ‘The Public-Private Choice: The Case of Marketing a
Country to Investors’, World Development, 19 (7), pp. 749-761.