
Diurnal Variations of CO 2 Emissions during CalNex -LA: Magnitude and Sources

Instructions for use
Title Diurnal Variations in Lower-Tropospheric Wind over Japan Part I: Observational Results using the Wind ProfilerNetwork and Data Acquisition System (WINDAS)
Author(s) Sakazaki, Takatoshi; Fujiwara, Masatomo
Citation Journal of the Meteorological Society of Japan, 88(3), 325-347https://doi.org/10.2151/jmsj.2010-305
Issue Date 2010-07-21
Doc URL http://hdl.handle.net/2115/44056
Type article
File Information JMSJ88-3_325-347.pdf
Hokkaido University Collection of Scholarly and Academic Papers : HUSCAP

Journal of the Meteorological Society of Japan, Vol. 88, No. 3, pp. 325--347, 2010. 325
DOI:10.2151/jmsj.2010-305
Diurnal Variations in Lower-Tropospheric Wind over Japan Part I:
Observational Results using the Wind Profiler Network and
Data Acquisition System (WINDAS)
Takatoshi SAKAZAKI and Masatomo FUJIWARA
Graduate School of Environmental Science, Hokkaido University, Sapporo, Japan
(Manuscript received 24 November 2009, in final form 19 February 2010)
Abstract
This study investigates diurnal variations in lower-tropospheric wind over Japan during 2002–2008 using datafrom 31 stations of the Wind profiler Network and Data Acquisition System (WINDAS) and the Automated Me-teorological Data Acquisition System (AMeDAS). The diurnal and semidiurnal components are extracted andanalyzed to identify the dominant processes for each height range and for each season. Near the surface, the di-urnal component is controlled by local wind systems (e.g., land–sea breezes) throughout the year. At 1–3 km, thediurnal component is primarily controlled by the return currents of local wind systems, with additional influenceby other disturbances; the superposition of these two wind systems generates amplitude maxima in spring(@0.5 m s�1) and autumn (@0.6 m s�1). At 3–5 km, the diurnal wind in DJF–MAM is controlled by medium-scale eastward traveling waves, which generate the amplitude maximum (@0.8 m s�1) in winter–spring. In JJA–SON, the diurnal component is controlled by a large-scale wind system with an amplitude of@ 0.3 m s�1, prob-ably related to the diurnal tide. At stations located on small islands located south of the Japanese mainland, thediurnal wind within the lower troposphere has di¤erent characteristics from those described above throughoutthe year. Throughout Japan, the semidiurnal wind component is controlled by the semidiurnal migrating tideabove @ 1 km, and is influenced by local wind systems below @1 km. The amplitude of the semidiurnal tidebelow 5 km is largest in DJF (@0.4 m s�1) and smallest in JJA (@0.2 m s�1).
1. Introduction
Diurnal wind variations are important not onlyfor predicting severe weather (e.g., diurnal varia-tions in precipitation) and pollution transport, butfor observing the daily-mean field. The latter meansthat it is essential to estimate the diurnal and sub-diurnal components when observing a climatologi-cal variable with once-per-day observations (e.g.,Seidel et al. 2005). In the atmosphere, diurnal windvariations are caused by several phenomena at dif-ferent spatial scales; therefore, it is important toidentify those processes responsible for diurnal vari-
ations at each longitude/latitude/height range andin each season.
Diurnal variations in surface wind result mainlyfrom local-scale wind systems such as land–seaand mountain–valley breezes. Being relativelyeasy to measure, surface wind patterns have beenreported in many previous studies conductedthroughout the world (e.g., see Miller et al. 2003for a review of studies on land–sea breezes). Saka-zaki and Fujiwara (2008) recently investigated thesurface wind upon Japanese plains and found thatdiurnal variations upon plains of 50–100 km inscale are explained mainly by the lagged combi-nation of land–sea and mountain–valley breezes.Di¤erent types of ‘‘local-scale’’ wind systems aresometimes coupled to generate ‘‘regional-scale’’(@100 km) wind systems (e.g., Kurita et al. 1990).In the present study, we refer to these local- and
Corresponding author: Takatoshi Sakazaki, GraduateSchool of Environmental Science, Hokkaido Univer-sity, Sapporo, Hokkaido 060-0810, Japan.E-mail: [email protected] 2010, Meteorological Society of Japan

regional-scale wind systems simply as ‘‘local windsystems’’. Local wind systems are not confined tothe near-surface, but extend to the upper air; returncurrents exist above the surface winds, thereby clos-ing the local circulation system. The vertical scaleof local circulation, including the return currents,is generally reported to be @3 km (Fujibe andAsai 1979; Tijm et al. 1999; Oliphant et al. 2001).
In the middle to upper atmosphere, variations indiurnal wind result mainly from atmospheric solartides, which are defined as global-scale waves withperiods that are harmonics of a solar day (see thereview by Chapman and Lindzen 1970). Althoughthe definition of ‘‘global-scale’’ is ambiguous, previ-ous studies generally define the tide as diurnal andsemidiurnal disturbances with zonal wavenumbersless than 6–10 (e.g., Tokioka and Yagai 1987; Lie-berman and Leovy 1995; Hagan et al. 1995). Ofall the tidal components, the ‘‘migrating’’ compo-nent is defined as a Sun-synchronous, westward-propagating wave (i.e., the westward-propagatingdiurnal (semidiurnal) component at a zonal wave-number of 1 (2)). All other components are termed‘‘nonmigrating’’ components. The main excitationsources of tides are the absorption of solar radia-tion by tropospheric water vapor and stratosphericozone (e.g., Chapman and Lindzen 1970), as wellas diurnally varying latent heat release in thetropics (Hamilton 1981; Williams and Avery1996a; Forbes et al. 1997; Hagan and Forbes 2002,2003). Planetary-boundary-layer sensible heating(Tsuda and Kato 1989) and solar heating of cloudparticles (Sasi et al. 2001) are also possible excita-tion sources. Diurnal and semidiurnal tides havecontrasting physical characteristics (e.g., verticalwavelength, latitudinal structure, and vertical prop-agation). According to tidal theory (Chapman andLindzen 1970), the diurnal tide is dominant in thetropics and is small in midlatitudes, as verticallypropagating modes are largely confined to thetropics, whereas the semidiurnal tide can propagatein all latitude regions, with a somewhat larger am-plitude than that of the diurnal tide in midlatitudes.
In the upper troposphere, medium-scaleeastward-traveling waves prevail, with a horizontalscale of 2000–3000 km and a zonal phase speed of20–30 ms�1 (Sato et al. 1993, 2000), resulting in aperiod of approximately 1 day. These waves aremaintained as neutral edge waves near the upperboundary in the Eady solutions (e.g., Eady 1949;Tomikawa et al. 2006, and references therein);however, the relevant excitation mechanism is
poorly understood. It should be noted that in mostprevious studies, the frequency of medium-scalewaves has been reported as approximately (notexactly) 1 day. However, Kodama et al. (2008) re-cently suggested that the period may be exactly 1day, at least over East Asia, and that the excitationmechanism may be related to diurnal wind systemsover the Tibetan Plateau. This proposal indicatesthat the medium-scale waves may be considered adisturbance that significantly contributes to diurnalvariability in the upper troposphere. It should benoted that Yamamori et al. (1997) found that waveswith a similar periodicity also exist in the lowertroposphere, with a phase speed of @17 m s�1,less than that of upper-tropospheric medium-scalewaves.
As outlined above, diurnal wind variations inthe troposphere are possibly influenced by local-,medium-, and global-scale wind systems, yet manyprevious studies have focused only on local windsystems (particularly on land–sea breezes). Fewstudies have provided a broader viewpoint of ‘‘diur-nal wind variations in the troposphere,’’ includinglocal wind systems. These few studies were basedmainly on tropical observations, either intensive ra-diosonde campaigns (Tsuda et al. 1994; Alexanderand Tsuda 2008) or atmospheric radars (Williamset al. 1992; Chen et al. 1996; Williams and Avery1996b; Sasi et al. 1998, 2001; Riggin et al. 2002),and investigated the diurnal and semidiurnal windcomponents by focusing on atmospheric tides andlocal wind systems.
A smaller number of observational studies haveconsidered diurnal wind variations in the midlati-tude troposphere. In terms of the diurnal windcomponent, Wallace and Hartranft (1969) andWallace and Tadd (1974) examined global-scale di-urnal winds in the troposphere and lower strato-sphere, using global radiosonde data. Both studiesfound that the diurnal wind component is a¤ectedby topography as well as by the diurnal tide; thisresult was later confirmed from global analysisdata (Hsu and Hoskins 1989). With regard to therelationship between local wind systems and atmo-spheric tides, Yoshida and Hirota (1979) suggestedthat the diurnal wind component is influenced bylocal wind systems below 500 hPa and by the diur-nal tide above 500 hPa, based on an analysis ofradiosonde data in Japan. Fujibe and Asai (1979),using pilot-balloon and radiosonde data, showedthat land–sea breezes control the diurnal wind upto @3 km upon the Kanto Plain, the largest plain
326 Journal of the Meteorological Society of Japan Vol. 88, No. 3

in Japan (horizontal scale of @100 km). It shouldbe noted that the number of stations considered inthe latter two studies was less than 10 and that theperiod of data analysis was less than 1–2 years;these factors may be an insu‰cient basis uponwhich to draw statistically robust conclusions. Inaddition, in most previous studies on diurnal windvariations in the troposphere, conclusions regardingthe diurnal tide were based solely on qualitative dis-cussions; that is, wind systems with a horizontalscale greater than that of local wind systems wereregarded as tides, without a quantitative estimationof their horizontal scales. Finally, the seasonality ofthe diurnal wind component has yet to be examinedin detail.
The semidiurnal wind component in the midlati-tude troposphere is caused mainly by the semidiur-nal migrating tide (Wallace and Tadd 1974). Thisrelationship was confirmed by Whiteman and Bian(1995, 1996), based on data from the wind pro-filer network in the USA. Sakazaki and Fujiwara(2008) confirmed a robust semidiurnal componentin surface wind that is caused by the non-sinusoidallocal pressure gradient force associated with localwind systems. Note that the height range up towhich local wind systems control the semidiurnalwind component remains poorly understood. Like-wise, seasonal variations in the semidiurnal compo-nent have yet to be examined in detail.
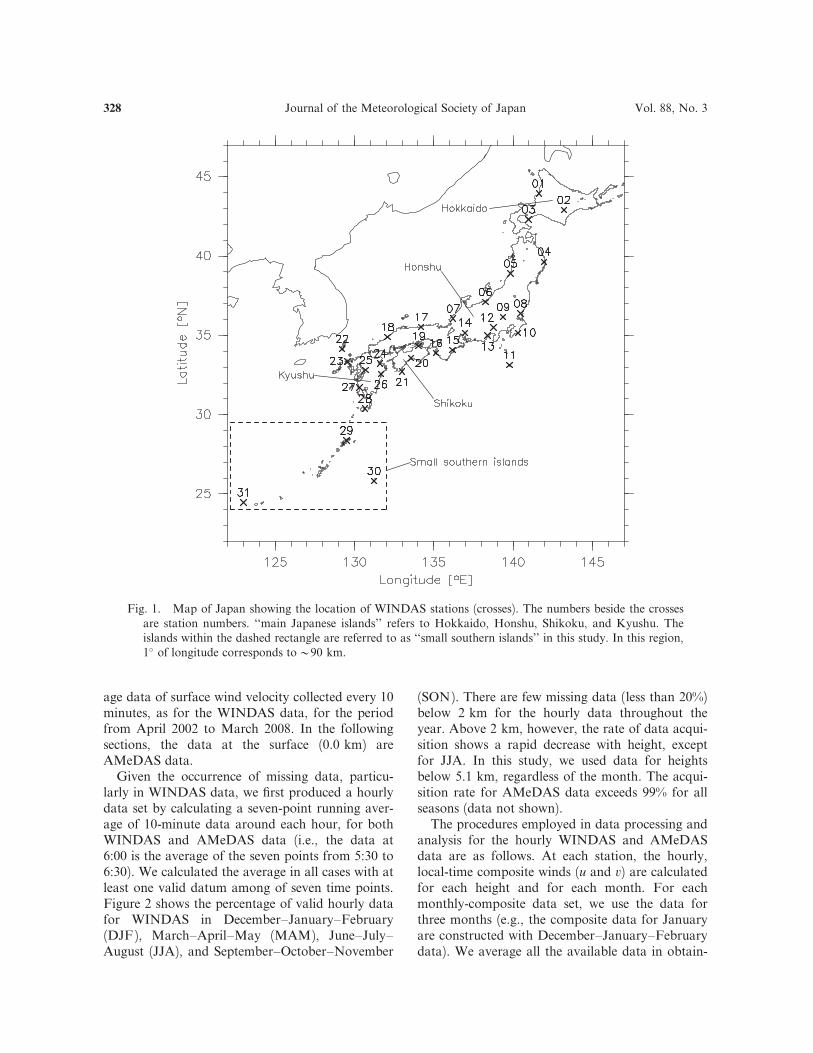
The goal of the present study is to investigate thedetailed characteristics of diurnal wind variationsover Japan, and to identify the responsible dynami-cal processes for each height range and for eachseason. A dense operational wind profiler network,the Wind profiler Network and Data AcquisitionSystem (WINDAS), was established in Japan in2002 to observe and predict severe rainstorms. Thenetwork, which consists of 31 stations with an aver-age horizontal spacing of 130 km (Fig. 1), monitors10-minute-average winds in the lower tropospherefrom 0.4 km up to @5 km with a vertical resolu-tion of @0.3 km. Ishihara et al. (2006) reportedthat the average top height of wind measurementsthroughout the year is 5.3 km, although this valueis higher in summer (6–7 km) than in winter(3–4 km). Detailed information regarding the char-acteristics and performance of WINDAS can befound in Ishihara et al. (2006), and the instrumenta-tion of the wind profiler used in WINDAS is de-scribed by Hashiguchi et al. (2004). By March of2008, 5- or 6-year continuous data sets had beencompiled for most of the stations, enabling a statis-
tical analysis of diurnal variations in upper-airwinds.
The remainder of the manuscript is organizedas follows. Section 2 describes data sets and analy-sis methods, Section 3 considers the climatologicalwinds, and Section 4 provides two examples ofdiurnal wind variations. Sections 5 and 6 describethe detailed characteristics of the diurnal and semi-diurnal wind components, respectively, and discussthe controlling processes for each component. Fi-nally, the main findings of the study are summa-rized in Section 7. In Part II of this study (Sakazakiand Fujiwara 2010), the dynamical processes thatcontrol the observed diurnal wind component, asdescribed in the present paper (Part I), are fur-ther examined based on Japanese MeteorologicalAgency (JMA) meso-scale analysis data (MANAL)and four global reanalysis data sets.
2. Data and analysis methods
WINDAS, operated by the JMA, consists of 311.3 GHz wind profilers (see Fig. 1 for station loca-tions). Most of the stations are located in coastalareas of the four main Japanese islands (Hokkaido,Honshu, Shikoku, and Kyushu; hereafter, theseareas are collectively referred to as the ‘‘main Japa-nese islands’’), with three stations located on smallislands located south of the Japanese mainlandwithin the Pacific (hereafter referred to as ‘‘smallsouthern islands’’). On the main Japanese islands,the surface wind is expected to be influenced mainlyby land–sea breezes. In the present study, measure-ments are made in terms of the height from theground at each station, with a vertical resolutionof @0.3 km. Note that because the altitude of theground level at most WINDAS stations is less than50 m above sea level, we did not take into accountdi¤erences among the stations in terms of measure-ment altitude; thus, the height from ground level issimply referred as ‘‘height.’’ Every 10 minutes, 10-minute averages of three wind components (u: east-ward wind, v: northward wind, w: vertical wind)over each wind profiler station are calculated fromDoppler velocities. Measurements have been takensince April 2002 for 25 stations and since Marchor June 2003 for the other 6 stations. We analyzethe data set for the 5- or 6-year periods until March2008.
At the WINDAS stations, surface winds aremonitored using the Automated MeteorologicalData Acquisition System (AMeDAS), which isalso operated by JMA. We analyze 10-minute aver-
June 2010 T. SAKAZAKI and M. FUJIWARA 327
age data of surface wind velocity collected every 10minutes, as for the WINDAS data, for the periodfrom April 2002 to March 2008. In the followingsections, the data at the surface (0.0 km) areAMeDAS data.
Given the occurrence of missing data, particu-larly in WINDAS data, we first produced a hourlydata set by calculating a seven-point running aver-age of 10-minute data around each hour, for bothWINDAS and AMeDAS data (i.e., the data at6:00 is the average of the seven points from 5:30 to6:30). We calculated the average in all cases with atleast one valid datum among of seven time points.Figure 2 shows the percentage of valid hourly datafor WINDAS in December–January–February(DJF), March–April–May (MAM), June–July–August (JJA), and September–October–November
(SON). There are few missing data (less than 20%)below 2 km for the hourly data throughout theyear. Above 2 km, however, the rate of data acqui-sition shows a rapid decrease with height, exceptfor JJA. In this study, we used data for heightsbelow 5.1 km, regardless of the month. The acqui-sition rate for AMeDAS data exceeds 99% for allseasons (data not shown).
The procedures employed in data processing andanalysis for the hourly WINDAS and AMeDASdata are as follows. At each station, the hourly,local-time composite winds (u and v) are calculatedfor each height and for each month. For eachmonthly-composite data set, we use the data forthree months (e.g., the composite data for Januaryare constructed with December–January–Februarydata). We average all the available data in obtain-
Fig. 1. Map of Japan showing the location of WINDAS stations (crosses). The numbers beside the crossesare station numbers. ‘‘main Japanese islands’’ refers to Hokkaido, Honshu, Shikoku, and Kyushu. Theislands within the dashed rectangle are referred to as ‘‘small southern islands’’ in this study. In this region,1� of longitude corresponds to@90 km.
328 Journal of the Meteorological Society of Japan Vol. 88, No. 3

ing the composite. The results do not change in thecase that we omit days when typhoons cross Japan(@60 cases during the 6 years of interest). Usingthis data set, the hourly anomaly wind is extractedfrom the 24-hour mean. Next, using a Fouriertransform, the diurnal and semidiurnal components(i.e., their amplitudes and phases) are calculated.The phase is represented by the local time wheneach component (u and v) attains its maximum.Wind measurements were conducted in JapaneseStandard Time (JST), which is defined at (35�N,135�E). The WINDAS/AMeDAS network rangesbetween@125�E and@145�E (Fig. 1), which corre-sponds to a maximum time di¤erence of @1 hr.The phases are corrected to the actual ‘‘local’’solar time (LT) at each station depending on thelongitude.
We also calculate the standard errors (SE) in theamplitudes and phases of the diurnal and semidiur-nal components. Note that SE is di¤erent from thestandard deviation (SD): SE represents the error
in the composite estimation, whereas SD representsthe degree to which individual data on each daydeviate from the composite value. The procedureemployed in calculating SE is as follows. Weassume that the deviation of each original hourlydatum (i.e., hourly data before performing the com-posite analysis) from the monthly composite valueis caused by random errors. Based on this assump-tion, the unbiased variance (s2) about the com-posite value at each local time is calculated; sub-sequently, s is obtained for the amplitudes andphases of the diurnal and semidiurnal components,following error propagation theory. Finally, weobtain SE, defined as s=
ffiffiffiffiffiffiffiffiffiffiffi
n� 1p
, where n is thetotal number of hourly data for each station, eachheight, and each month. Because the diurnal (semi-diurnal) phase takes values between 0000 LT and2400 (1200) LT, phase data with SE greater than12 (6) hr are not plotted in Figs. 6c–d, 11, or14c–d.
In addition to WINDAS and AMeDAS data,four-times-daily Japanese reanalysis data (JRA25and JMA Climate Data Assimilation System(JCDAS); hereafter referred to as JRA25) (Onogiet al. 2007) are used to assess climatological windsover Japan (Section 3), for the 6-year analysis pe-riod from April 2002 to March 2008.
Finally, output data from the Global Scale WaveModel (GSWM02) (Hagan et al. 1995, 1999; Ha-gan and Forbes 2002, 2003) are compared withour results as a reference for atmospheric tides.GSWM02 is a two-dimensional, linearized, steady-state numerical tidal and planetary wave modelthat covers the height region from the ground tothe thermosphere. This model only calculates thediurnal and semidiurnal tides at zonal wavenum-bers from �6 to 6, based on the assumption thateach zonal wavenumber component behaves inde-pendently from the others. Regarding the excitationsources for the tides, radiative heating of ozone andwater vapor are considered for the migrating com-ponent, while latent heat release in the tropics isconsidered for both the migrating and nonmigrat-ing components; topography and sensible heatflux in the boundary layer are not taken into ac-count. The horizontal spacing of the output data is5� � 5�, with a vertical resolution of 4 km. Here,we only consider data at a height of 4 km.
3. Climatological winds
Before examining diurnal variations, we investi-gate climatological winds in the lower troposphere
Fig. 2. Proportion of hourly data used forthe composite analysis with respect to alldata, including missing data. The averagefor all stations is shown. The solid curve isfor December–January–February (DJF),dashed curve for March–April–May(MAM), dotted curve for June–July–August (JJA), and dot-dashed curve forSeptember–October–November (SON).
June 2010 T. SAKAZAKI and M. FUJIWARA 329

over Japan. Figure 3 shows month–height distribu-tions of the observed daily-mean zonal and meri-dional winds averaged for all WINDAS stations.We found only minor inter-station di¤erences(data not shown). Zonal wind is eastward through-out the year, with its speed increasing with heightand attaining a maximum in winter. The meri-dional wind behavior is di¤erent above and below3 km: above 3 km, the wind is northward through-out the year and reaches a maximum in winter,whereas below 3 km the wind is southward inwinter and northward in summer.
The above features are also evident in global re-analysis data. Figure 4 shows climatological JRA25horizontal winds at 925 and 500 hPa in DJF andJJA. The subtropical jet prevails at 500 hPa over
Japan, and is stronger in DJF than in JJA (Figs.4b and 4d). In DJF at 925 hPa (Fig. 4a), the windis blowing from the Siberian high-pressure systemon the Eurasian Continent, which develops due toradiative cooling. The location of this high explainsthe wintertime southward winds near the surfaceover Japan (Fig. 3b). In DJF at 500 hPa (Fig. 4b),Japan is located downstream of a climatologicaltrough within the subtropical jet, probably dueto the topographic e¤ects of the Tibetan Plateau(Held 1983). At this time, a large gyre occurs inthe western Pacific to the south of Japan, represent-ing a dynamical response to diabatic heating in thetropics, known as the Matsuno–Gill pattern (Mat-suno 1966; Gill 1980). Thus, the northward windsat 3–5 km in winter (see Fig. 3b) are caused by acombination of the meandering subtropical jet andthe gyre due to the Matsuno–Gill pattern. In JJAat both 925 hPa (Fig. 4c) and 500 hPa (Fig. 4d),Japan is located in the western part of the Ogasa-wara (Bonin) high pressure system over the north-western Pacific Ocean; the wind is northward atboth 925 and 500 hPa over Japan (Fig. 3b).
4. Examples of variations in diurnal and
semidiurnal wind
In this section, we provide examples of diurnalwind variations recorded at small southern islandsand on the main Japanese islands in summer. Fig-ure 5a shows the time–height distributions ofhourly anomaly meridional wind at Minamidaito-jima (station 30 in Fig. 1) and at Kumagaya (sta-tion 9 in Fig. 1) in JJA. Minamidaitojima is a smallisland of just@6 km across, whereas Kumagaya islocated upon the Kanto Plain, the largest plain inJapan, and is strongly influenced by local wind sys-tems (regional-scale land–sea breezes) (e.g., Kuritaet al. 1990). Figure 5b and 5c shows the diurnaland semidiurnal components of v, respectively, asextracted from the anomaly winds in Fig. 5a. Fig-ure 5d shows diurnal variations reconstructed fromthe diurnal and semidiurnal components only. Atboth stations, these two components perform wellin reproducing the detailed features of the originalvariations in Fig. 5a.
At Minamidaitojima, the distribution with allcomponents basically shows a vertically standingstructure throughout the region. The diurnal andsemidiurnal wind components also show a standingstructure, and the diurnal amplitude (@0.4 m s�1)is larger than the semidiurnal amplitude(@0.2 m s�1).
Fig. 3. Month–height distributions of daily-mean (a) zonal wind and (b) meridionalwind averaged for all stations. The contourinterval is 2.5 m s�1 for (a) and 0.5 m s�1
for (b). For (b), solid and dashed linesshow northward and southward winds, re-spectively.
330 Journal of the Meteorological Society of Japan Vol. 88, No. 3

At Kumagaya, the characteristics are markedlydi¤erent from those at Minamidaitojima. We ob-serve a clear phase reversal at around 1.5 km. Thelower oscillation is centered at 0.5 km and the up-per oscillation is vertically elongate, with the ampli-tude of the former being slightly larger than that ofthe latter. The harmonic components show that thediurnal amplitude (0.6–1.2 m s�1) is larger than thesemidiurnal amplitude (0.1–0.3 m s�1) throughoutthe region. The phase reversal evident at around1.5 km in Fig. 5a is clearly represented in the diur-nal component. Note that above this level, thephase of the diurnal component is generally consis-tent between Kumagaya and Minamidaitojima.The semidiurnal component also shows a verticallystanding structure above 2 km. The vertical struc-ture and the phase at Kumagaya are basically simi-
lar to those at Minamidaitojima throughout theheight region, although a phase distortion [email protected] km, which is lower than the phase reversalin the diurnal component. These findings suggestthat for both the diurnal and semidiurnal windcomponents, Minamidaitojima and Kumagaya arefundamentally influenced by a common, large-horizontal-scale wind system, at least above 2 km,and that at Kumagaya below 2 km, local windsystems are dominant over the large-scale windsystem.
5. Results and discussion on the diurnal wind
component
Here, we analyze the diurnal wind component atall stations. In Section 5.1, we examine the overallfeatures of vertical profiles and seasonal variations;
Fig. 4. Climatological horizontal winds derived from JRA25 data for the period from April 2002 to March2008. (a) and (b) are for 925 and 500 hPa, respectively, in December–January–February (DJF). (c) and (d)are for 925 and 500 hPa, respectively, in June–July–August (JJA). Reference vectors are shown on theright-hand side.
June 2010 T. SAKAZAKI and M. FUJIWARA 331

spatial inhomogeneities are considered in Section5.2. In Section 5.3, we further examine the returncurrents and the eastward-traveling phenomena,which are introduced in Section 5.2.
5.1 Overall features of vertical profiles
Figure 6 shows vertical profiles of the diurnalamplitude at 31 WINDAS stations for each season;the average values for all stations are also shown.The average amplitudes are 0.3–0.5 m s�1 through-out the year, except for a maximum of 0.7–0.8 m s�1 near the surface, where SD is also large(@0.5 m s�1). Secondary peaks appear at 1–3 kmin JJA and SON: u has a secondary peak at@2 km (1.5 km) in JJA (SON), while v has asecondary peak at @2 km (3 km) in JJA (SON).These peaks occur because large secondary peaksare observed at some stations at 1–3 km (thin lines;see also Fig. 5b, in which a secondary peak is seenat 2–4 km at Kumagaya). It should be noted thatdi¤erences among the stations decrease with height,particularly in JJA and SON. For example, the SD
of v in JJA–SON is >0.2–0.3 m s�1 below@3 km,but is <0.2 m s�1 above@3 km. We suggest that alarge-scale wind system influences the diurnal windcomponent above@3 km during JJA–SON. Thesefeatures are unclear in DJF and MAM.
Figure 7 shows the month–height distributions ofdiurnal amplitude averaged for all stations. A t-testis used to assess statistically significant deviationsfrom the yearly average amplitude. Here we assumethat the di¤erence in the value at each station fromthe station average is caused by random errors.Three marked seasonal characteristics are foundin di¤erent height regions. First, near the surface,below @1 km, the amplitude is largest (@1 m s�1)from spring to autumn for both u and v. We pro-pose that this broad peak results from local windsystems that develop mainly in summer due toweak background winds. Second, in the heightregion of 1–3 km, the amplitude attains maximain autumn (@0.6 m s�1) and spring (@0.5 m s�1).The amplitudes of these maxima are larger for v
than for u. Large secondary peaks in amplitude
Fig. 5. Time–height distributions of variations in diurnal meridional wind in June–July–August at (top)Minamidaitojima and (bottom) Kumagaya (stations 30 and 9 in Fig. 1, respectively). (a) Hourly anomalyvariations including all components, (b) diurnal component, (c) semidiurnal component, and (d) variationsreconstructed from the diurnal and semidiurnal components only. The contour interval is 0.2 m s�1 for (a),(b), and (d), and 0.1 m s�1 for (c). Surface data are from AMeDAS.
332 Journal of the Meteorological Society of Japan Vol. 88, No. 3

Fig. 6. Vertical profiles of the amplitude and phase of the diurnal component in December–January–February (DJF), March–April–May (MAM), June–July–August (JJA), and September–October–November (SON). (a) Diurnal amplitude of zonal wind, (b) diurnal amplitude of meridional wind, (c) diur-nal phase of zonal wind, and (d) diurnal phase of meridional wind. Thin lines are profiles at individualstations. Solid circles and horizontal bars are the average and SD, respectively, for all stations. For (c)and (d), data are not plotted in the case that the standard error exceeds 12 hr.
June 2010 T. SAKAZAKI and M. FUJIWARA 333

occur at some stations at heights of 1–3 km (seeFig. 6a and 6b). Finally, above 3 km, the amplitudereaches a maximum in February, with clearer sig-nals in v (@0.8 m s�1) than in u. The amplitude inv is as large as that near the surface.
Figure 6 also shows vertical profiles of diurnalphases for each season. Here, the station-averagephase is defined as the phase of the diurnal compo-nent extracted from the hourly anomaly compo-nents averaged for all stations. Because the phasesassociated with local wind systems are expected tobe canceled out when taking the station average,the average phase is expected to be due to larger-scale phenomena, at least as large as the scale ofthe Japanese Archipelago (>1000–1500 km). Theaverage phase of u has a positive slope below@2 km and is nearly constant with height above@2 km throughout the year. The average phase ofv is nearly constant with height in DJF and MAM,and the phase near the surface is preceded by thatin upper air regions. The average phase of v in JJA
and SON has a small positive slope with height. Atypical example is seen at Minamidaitojima in JJA(Fig. 5a). Note that the di¤erences among stationsdecrease with height, particularly in JJA, as alsoseen in amplitude (Figs. 6a, b). In fact, the SD of vin JJA is @6 hr below 3 km, but <3 hr above3 km. In other seasons, the SD of v in upper air re-gions (3–5 hr) is also smaller than that at the sur-face (>6 hr), although SD in upper air regions islarger than that in JJA. These findings are consis-tent with the data shown in Figs. 6a, b, which indi-cate that a larger-scale wind system influences the di-urnal component above@3 km, particularly in JJA.
Figure 8 shows the month–height distributions ofthe diurnal phase averaged for all stations. A clearseasonal variation in phases is found for the entireregion. In DJF, the average phase of u is @2100LT at 1 km, becoming later with increasing heightto @1500 LT at 4 km (see also Fig. 6). In JJA, incontrast, the phase is @0300 LT at 1 km and@0900 LT at 4 km. The phase changes drasticallyat around April–May and around November–December. A marked seasonal variation is alsoseen for v: in DJF the phase is@1500 LT at 1 kmand@1200 LT at 4 km, whereas in JJA the phase
Fig. 7. Month–height distributions of thediurnal amplitude averaged for all stations,showing (a) the zonal component and (b)the meridional component. The contour in-terval is 0.05 m s�1. Regions surroundedby dashed curves represent statistically sig-nificant regions (95% level, t-test).
Fig. 8. As for Fig. 7, but for the diurnalphase averaged for all stations. The con-tour interval is 2 hr.
334 Journal of the Meteorological Society of Japan Vol. 88, No. 3

at 1 km is@0000 LT, becoming later with height to@0400 LT at 4 km. Again, the phases change dras-tically during the same months in which a change isseen in u. Given that the phase of local wind sys-tems is not expected to change considerably duringthe year (see Fig. 10, for 0.0 km), these findingssuggest that the dominant large-scale phenomenadi¤er between DJF–MAM and JJA–SON.
5.2 Spatial inhomogeneity
Here, we examine spatial inhomogeneity in thediurnal wind component. An appropriate way toillustrate the horizontal distribution of the charac-teristics of diurnal wind variations is to use hodo-graphs and harmonic dial vectors. The hodographrepresents diurnal variations in the wind vector ata given point. Details of the method employed inanalyzing hodographs can be found in Sakazakiand Fujiwara (2008). The harmonic dial vector rep-resents the amplitude and phase of any harmoniccomponent based on its length and direction, re-spectively. Figures 9 and 10 show hodographs ofthe diurnal wind component and the harmonic dialvectors of the diurnal component of v, respectively,at 0.0, 1.9, and 5.1 km in DJF, MAM, JJA, andAugust–September–October (ASO). These threeheight levels correspond to the levels where distinctseasonal variations are found in diurnal amplitudes(see the previous section and Fig. 7). For harmonicdial vectors, we show the results for v becausemost WINDAS stations are located near the coast,which is approximately oriented east–west (Fig. 1);consequently, the e¤ects of local wind systems(land–sea breezes) are seen more clearly in v thanin u. In the following sub-sections, we examine indetail the spatial characteristics of the diurnal windcomponent for the main Japanese islands (Sections5.2.a–c) and for stations located on small southernislands (stations 29–31; herein referred to as I-stations) (Section 5.2.d).
a. At the surface (0.0 km height) for the main
Japanese islands
At the surface (0.0 km) for the main Japaneseislands, most of the hodographs are elongate in adirection crossing the local coast (Figs. 9, 10).In addition, the winds are basically o¤shore duringthe nighttime (@0300 JST) and onshore during thedaytime, indicating that the winds are controlledmainly by land–sea breezes. Some of the hodo-graphs show an anticlockwise rotation, indicat-ing that the surface winds are also influenced bymountain–valley (mountain–plain) breezes (Saka-
zaki and Fujiwara 2008). The amplitudes arelargest in JJA and smallest in DJF, whereas thephases show no marked change during the year.
b. At 1.9 km height for the main Japanese islands
Here, we examine the diurnal component at1.9 km height for the main Japanese islands. InJJA, the direction of the wind vector at 0000 LTis basically onshore (Fig. 9), and the diurnal com-ponent of v attains a maximum at @1800 LT(@0400 LT) along the north (south) coast (Fig.10). These findings indicate that the winds arebasically onshore (o¤shore) during the nighttime(daytime) and that the phases are approximatelyopposite those at 0.0 km. Therefore, it is suggestedthat the return currents of the local wind systemprevail at this height in JJA. In addition, the spatialdi¤erences among hodographs (e.g., direction ofthe major axis) are smaller at 1.9 km than at0.0 km. For example, the large di¤erence in themajor axes of hodographs among stations 08, 09,12, and 13 at 0.0 km is not seen at 1.9 km. It isinferred that the return currents have a largerhorizontal scale than do the surface winds; that is,they are not as sensitive to complex (or ‘‘local’’)coastlines as are the surface winds.
In ASO, similar features are observed to thosein JJA; however, a salient feature in ASO is thatthe winds along the south coast (e.g., stations 8–10and 12–16) have larger amplitudes (@1 m s�1)than those in JJA, contributing to the autumn max-imum in amplitude at 1–3 km (Fig. 7). In fact, thediurnal amplitude of v averaged for the stationsalong the south coast (stations 2, 3, 9, 10, 12–16,20, and 21; herein referred to as S-stations) in [email protected] m s�1, which [email protected] m s�1 larger than theaverage for all stations in ASO (Fig. 7). It can beinferred that the return currents are basicallyproportional to the strength of the surface windsystem. Considering that the surface winds in ASOare almost the same as those in JJA (Fig. 9), it issuggested that other disturbances are superposedon the return currents, resulting in larger ampli-tudes along the south coast in ASO.
In MAM, the return currents are discernible as aphase contrast between the north and south coastsof the main Japanese islands (Fig. 10). Further-more, the winds along the north coast (e.g., stations5–7 and 17–18) have larger amplitudes (@1 m s�1)than those in JJA, particularly for v. In contrast,the amplitudes of return currents along the southcoast in MAM are much smaller than those in JJA
June 2010 T. SAKAZAKI and M. FUJIWARA 335

Fig. 9. Hodographs reconstructed from the diurnal component for (top) December–January–February(DJF), (upper middle) March–April–May (MAM), (lower middle) June–July–August (JJA), and (bot-tom) August–September–October (ASO), and for heights of (left) 0.0 km, (center) 1.9 km, and (right)5.1 km. The hodograph at station 31 is shown in the small square within each panel. Solid and dashedellipses represent clockwise and anticlockwise rotations, respectively. The symbol X in each hodograph de-notes the head point of the wind vector at 0000 LT. Reference hodographs are shown at the bottom of thefigure.
336 Journal of the Meteorological Society of Japan Vol. 88, No. 3

Fig. 10. As for Fig. 9, but for harmonic dial vectors of the diurnal component of v. Reference harmonic dialvectors are shown at the bottom of the figure.
June 2010 T. SAKAZAKI and M. FUJIWARA 337

and ASO (Fig. 10). The large amplitudes along thenorth coast contribute to the spring maximum inamplitude at 1–3 km in MAM (Fig. 7). The diurnalamplitude of v averaged for stations along thenorth coast (stations 5–7 and 17–19; herein referredto as N-stations) in MAM is @1.0 m s�1, twiceas large as the average for all stations in MAM(Fig. 7). In addition, the amplitudes at 0.0 km aresmaller in MAM than in JJA. It is inferred that inMAM also, other disturbances are superposed onthe return currents, resulting in large amplitudesalong the north coast.
Finally, in DJF, the wind pattern is similar tothat in MAM, although with a smaller amplitude,especially along the south coast. The phase alongthe north coast in DJF is increasingly delayed to-ward the east (Fig. 10). For example, the phases atstations 22, 07, and 06 are@0800 LT,@1200 LT,and@1700 LT, respectively. A similar phase delayis seen in MAM along the north coast (Fig. 10):the phases at stations 18 and 05 are@1300 LT and@1600 LT, respectively. This type of phase delayalong the north coast is only seen in DJF–MAM.These findings suggest that in DJF and MAM,eastward-moving phenomena prevail over Japan at1.9 km height. These eastward-moving signals arefurther investigated in Section 5.3.b.
c. At 5.1 km height for the main Japanese islands
Finally, we examine the diurnal component at5.1 km height for the main Japanese islands. InDJF, the winds have larger amplitudes than thosein JJA and the hodographs are elongate in anorth–south orientation (Fig. 9). This finding indi-cates that the amplitudes of v are larger than thoseof u in DJF, as shown in Fig. 7. The phase of v isbasically @1200 LT (Fig. 10). It should be notedthat a clear eastward phase delay is observed overHonshu (@35�N). For example, the phases atstations 18, 07, and 08 are@0900 LT,@1200 LT,and @1800 LT, respectively. At these stations, theamplitudes reach @1.0 m s�1, resulting in largeamplitudes in winter at 3–5 km height (Fig. 7).For the diurnal component of u, an eastward delayat 5.1 km is observed only around 40�N (stations1–5). In other areas of the main Japanese islands,the phases of u are di¤erent between stations lo-cated along the north coast (1200–1800 LT) andthose along the south coast (1900–0000 LT) (datanot shown), in contrast to the features in JJA.
In JJA, the diurnal winds at 5.1 km height areblowing coherently at almost all stations; the di¤er-
ences among stations are small compared withthose at 0.0 or 1.9 km, as noted in Sec. 5.1 and asshown in Fig. 6. These features are also seen in theharmonic dial vectors in u (data not shown). Thephase of v over the main Japanese islands is 0000–0600 LT (Fig. 10), and that of u is 0600–1200 LT(data not shown, but see Fig. 6). These values aresomewhat di¤erent from those in DJF. The ampli-tudes are @0.3–0.4 m s�1, smaller than those inDJF. In addition, unlike in DJF, the eastwardphase delay is not observed. These findings suggestthat a large-scale wind system, with a horizontalscale of at least @3000 km, controls the diurnalwind component at 5.1 km height in JJA and thatthis wind system is di¤erent to the system that pre-vails in DJF. This wind system is hereafter referredas the diurnal tide, as it is identified as such in PartII of this study.
The wind patterns in MAM and SON are similarto those in DJF and JJA, respectively. This resultcorresponds to the findings presented in Sec. 5.1(see Fig. 8), whereby the wind pattern showsdrastic changes in May–June and in November–December.
d. Stations located on small southern islands
Finally, we examine the diurnal wind componentat the I-stations. At the surface, the amplitudes [email protected] m s�1 throughout the year, much smallerthan the values recorded throughout the main Jap-anese islands. This finding suggests that local windsystems do not develop at these island stations. Thephases of v are 0300–0600 LT, with little seasonalvariation. At 1.9 km, the amplitudes are a littlelarger (0.1–0.2 m s�1) than at the surface through-out the year. The phases of v are 0900–1200 LTin DJF and 0300–0600 LT in JJA (Fig. 10). At5.1 km, the amplitudes are @0.2–0.4 m s�1 andthe phases are 1500–1800 LT in DJF and 0600–0900 LT in JJA, showing a seasonal variation.
In addition, in DJF at both 1.9 and 5.1 kmheight, the phases are only consistent with thoseover the southern part of Kyushu (stations 27 and28), where the eastward phase delay is not ob-served. In JJA, the phases at 1.9 km are close tothose at stations along the south coast of the mainJapanese islands, and the phases at 5.1 km are sim-ilar to those for almost all stations over the mainJapanese islands.
At both 1.9 and 5.1 km, the features in MAM(SON) are similar to those in DJF (JJA) (see Fig.11). An analysis of u at island stations yields similar
338 Journal of the Meteorological Society of Japan Vol. 88, No. 3

results, except that the phase of u is basically pre-ceded by that of v, reflecting the clockwise rotationevident in the hodographs (Fig. 9).
We further examine the vertical phase structuresat I-stations, as the wind system over these stationsis identified as the diurnal tide over the entire lowertroposphere throughout the year in Part II of thisstudy. Figure 11 shows vertical profiles of diurnalphases of v for I-stations, as defined above. Notethat the center of the abscissa in Fig. 11 is 1200LT in DJF and MAM, and 0000 LT in JJA andSON. In DJF–MAM, the phase varies abruptly
with height and the vertical wavelengths are esti-mated as 5–10 km. In contrast, in JJA–SON, thephase has a small positive slope, indicating down-ward energy propagation. The vertical wavelengthsare estimated to be @20 km (the phase is @0300LT at 0.0 km and @0900 LT at 5.0 km), beinglarger than those in DJF–MAM. According totidal theory (Chapman and Lindzen 1970), the the-oretical vertical wavelength of the principal Houghmode (first symmetric propagating mode) of themigrating diurnal tide is 25–30 km. The higher-order Hough modes of the migrating component
Fig. 11. Vertical profiles of the diurnal phase of v in (a) December–January–February (DJF), (b) March–April–May (MAM), (c) June–July–August (JJA), and (d) September–October–November (SON). Solidlines are for N-stations (stations 5, 6, 7, and 17–19), thin dashed lines are for S-stations (stations 2, 3, 9,10, 12–16, 20, and 21), and thick dotted lines are for I-stations (stations 29–31). The center of the abscissais 1200 LT for (a) and (b), and 0000 LT for (c) and (d). Data are not plotted in the case that the phasestandard error exceeds 12 hr.
June 2010 T. SAKAZAKI and M. FUJIWARA 339

and nonmigrating components have small verticalwavelengths. In particular, the wavelengths of non-migrating components due to planetary boundarylayer sensible heating are reported to be 3–5 km(Tsuda and Kato 1989; Sasi et al. 1998). Thus, ourobservation results suggest that the diurnal compo-nent in JJA–SON is influenced mainly by theprincipal Hough mode of the migrating compo-nent, probably excited by radiative heating of watervapor and/or latent heat release; that in DJF–MAM is a¤ected mainly by higher-order Houghmodes of the migrating component and/or non-migrating components. The excitation mechanismis further discussed in Part II of this study.
In summary, the characteristics of the diurnalwind component are di¤erent between the mainJapanese islands and small southern islands. Forthe main Japanese islands, di¤erent phenomenaprevail at the surface, at 1.9 km, and at 5.1 km. Atthe surface, the hodographs show winds that areprimarily controlled by local wind systems (mainlyland–sea breezes) throughout the year. At 1.9 km,the phase of the winds is reversed from that at thesurface, indicating the dominance of the returncurrents of local wind systems. The amplitude of vis large along the north (south) coast in spring(autumn). Considering that local wind systems arestrongest in summer, it is suggested that the windsare influenced not only by the return currents butby other disturbances; in other words, disturbanceswith a clear seasonal variation are superposed onthe return currents, resulting in amplitude maximain spring and autumn at 1.9 km. At 5.1 km, thewind system di¤ers between DJF–MAM and JJA–SON. In DJF–MAM, an eastward phase delayis observed, indicating that eastward-moving dis-turbances control the diurnal wind component. InJJA–SON, the phase di¤erence is small among thestations, indicating that the winds are influenced bythe diurnal tide with a horizontal scale larger thanthe size of Japan. The di¤erences in the dominantwind systems during JJA–SON and DJF–MAMgenerate the abrupt changes evident in April–Mayand November–December in the phase profile inFig. 8.
Finally, over the entire lower troposphere, thediurnal component at I-stations located equator-ward of 30�N is controlled by a di¤erent windsystem to that over the main Japanese islands. Atcertain height levels and in some seasons, thephases are coherent with those over the main Japa-
nese islands. The vertical wavelengths are small(5–10 km) in DJF–MAM and large (@20 km) inJJA–SON.
As a reference with which to compare our find-ings regarding the diurnal tide at 5.1 km, we ana-lyze the diurnal tide at 4 km in the tidal modelGSWM02. In GSWM02, the amplitude rangesfrom @0.1 m s�1 (45�N) to @0.5 m s�1 (25�N)for both u and v. For the region (20–50�N, 120–150�E), the phase of u (v) is 1800 (1200) LT, withno dependence on longitude or latitude throughoutthe year. Although the amplitude in GSWM02 isgenerally consistent with our results at 5.1 km, thephase is not, particularly over the main Japaneseislands (Fig. 10).
5.3 Return currents and eastward-moving
phenomena
a. Return currents
Here, we investigate the height range in whichthe local wind systems, including the return cur-rents, influence the diurnal wind component. Figure11 also shows vertical profiles of diurnal phases of vfor N- and S-stations, as defined above. As men-tioned above, we focus on the phase of v to clearlydetect the signals of local wind systems.
At the surface, the winds are northward at 0000–0600 LT (1200–1800 LT) at N-stations (S-stations)throughout the year; that is, the winds are onshorein the afternoon and o¤shore early in the morningdue to land–sea breezes at both N- and S-stations,as already shown in Section 5.2.a. This surfacewind system extends up to 0.5–1 km, although theupper height increases [email protected] km for S-stations inDJF–MAM because in these seasons, an eastward-moving disturbance at 1–3 km is in phase with thesurface wind system along the south coast.
Above @1 km, the phases are reversed fromthose at the surface throughout the year. The windsare basically o¤shore in the afternoon and onshoreduring the early morning. Thus, for both N- and S-stations, the wind system at this height is inter-preted as the return current of the local surfacewind system.
Above 3–4 km, the phases at N- and S-stationsapproach each other, reaching 0900–1500 LT inDJF–MAM and 0000–0600 LT in JJA–SON.These phases correspond to the average phase forall stations at 4–5 km (Figs. 6d, 8, 10). Therefore,it is suggested that the return currents are confinedto below 3–4 km and that other wind systems, witha horizontal scale greater than that of local wind
340 Journal of the Meteorological Society of Japan Vol. 88, No. 3

systems (i.e., eastward-moving disturbances inDJF–MAM and diurnal tide in JJA–SON),prevail above 3–4 km. Therefore, the secondaryamplitude peaks at 1–3 km (Fig. 6) are due in partto the return currents. The amplitude maximum inautumn (Fig. 7) is confined to the region of the re-turn currents. The top height of the return currentsis basically consistent with that reported in previousstudies (e.g., Fujibe and Asai 1979; Oliphant et al.2001).
In accordance with seasonal variations in thephase of large-scale wind systems above 3–4 km,the vertical structure of phases changes with theseason. For example, in JJA, the phases above 1–2 km for S-stations have a vertically standing struc-ture, because the return currents and large-scalewind system have the same phase (a typical exam-ple is seen at Kumagaya; Fig. 5b). In contrast, inDJF, the phases above 1–2 km for S-stations varywith height because of the contrasting phases ofthe return currents and the large-scale wind sys-tems.
b. Eastward-moving phenomena
Here, we further examine the disturbance with aneastward phase delay observed in DJF–MAM at1.9 and 5.1 km height (Fig. 10). Figure 12 showsscatterplots of station longitude versus the diur-nal phase of v, at 1.9 and 5.1 km in January–February–March, when the phase delay is pro-nounced. Data are plotted for stations at latitudes
of 34�N to 40�N. At both 1.9 and 5.1 km, weobserve a disturbance that continuously propagateseastward from @130�E to @140�E. The corre-sponding eastward phase speed is @20 m s�1 at1.9 km and 20–30 m s�1 at 5.1 km. This phasepropagation is largely observed in DJF–MAM forv, at both 1.9 and 5.1 km height. Note that thisphase propagation is not clearly seen for u over themain Japanese islands throughout the year.
Figure 13 shows a time series of longitude–heightdistributions of the diurnal component of v, from1200 JST to 2100 JST at 3-hour intervals inJanuary–February–March. We use the data atstations 04–06, 07, 17, 18, and 22, which are lo-cated at approximately 35�N. v has a maximum(@0.8 m s�1) at around 135�E at 1200 JST and 4–5 km. The maximum moves eastward and reaches138�E at 1500 JST, when a line of zero velocityappears at 131�E and moves eastward to 137�Eat 2100 JST. The corresponding phase speed is25 m s�1, consistent with the estimated phase veloc-ity for 5.1 km in Fig. 12. Note that this eastward-moving phenomenon shows a barotropic structure,with its amplitude increasing with height. Thesecharacteristics (i.e., zonal phase speed and verticalstructure) are consistent with those of the medium-scale eastward-traveling waves reported by Satoet al. (1993). Therefore, it is suggested that thesemedium-scale waves contribute to the diurnal windcomponent above 3–4 km over Japan in DJF–MAM and that the maximum amplitude in Febru-
Fig. 12. Scatter plot of station longitude and diurnal phase of v for latitudes of 34�N–40�N in January–February–March. The numbers in circles represent station numbers. Vertical bars represent 95% confidencelevels (t-test). Sloping lines indicate the reference eastward zonal phase speed.
June 2010 T. SAKAZAKI and M. FUJIWARA 341

ary above 3–4 km (Fig. 7) is caused by this phe-nomena. The eastward signals at 1.9 km in Fig. 13are not clearly seen in Fig. 10, but are discussed asan independent mode, Diurnal Eastward-movingEddies (DEEs), in Part II of this study.
6. Results and discussion on the semidiurnal wind
component
Figure 14 shows vertical profiles of semidiur-nal amplitudes for each season. The amplitude is
[email protected] m s�1 for both u and v, and is near-constant with height throughout the year. Theamplitudes are slightly smaller than those of thediurnal wind component (Figs. 5, 6). The SD is<0.2 m s�1 in DJF and <0.1 m s�1 in JJA, againsmaller than that for the diurnal component. Figure15 shows the month–height distributions of thesemidiurnal amplitude averaged for all stations.Unlike the diurnal component (Fig. 7), the ampli-tude is small near the surface. There exists amarked seasonal variation above 2–3 km for bothu and v, with maxima of 0.4–0.5 m s�1 in winterand minima of 0.2–0.3 m s�1 in summer.
Figure 14 also shows vertical profiles of semi-diurnal phases for each season. The di¤erencesamong the stations are minor above @1 km. TheSD is >3 hr at the surface and <1 hr above 1 km,except for some levels in some months for u. Theaverage phase of u (v) has a constant value of@0400 LT (0100 LT) regardless of height, indicat-ing that the meridional component precedes thezonal component by a quadrature, and that thesemidiurnal wind vector rotates clockwise in ahorizontal plane. Furthermore, there is little sea-sonal variation in phase, in contrast to the diurnalwind component (Figs. 6, 8).
Chapman and Lindzen (1970) predicted thephase of the migrating semidiurnal tide based onobservation data of diurnal pressure tide (see alsoWhiteman and Bian 1996). The authors showedthat the semidiurnal phase of u is 0344 LT in bothhemispheres, while that of v is 0044 LT (0644 LT) inthe Northern (Southern) Hemisphere. The phasesobtained in the present study, 0400 LT (0100LT) for u (v), are similar to those predicted; theGSWM02 results are also consistent with the pres-ent findings. Furthermore, according to tidal theory(Chapman and Lindzen, 1970), the vertical wave-length of the semidiurnal tide is relatively long(@200 km) and the vertical phase tilt is relativelysmall. Again, the present results are consistentwith this theoretical prediction (Fig. 14c, d). There-fore, we conclude that the semidiurnal componentabove@1 km over Japan is caused by the semidiur-nal migrating tide throughout the year. The semi-diurnal amplitudes reported in this study (0.2–0.5 m s�1) are consistent with those in the lowertroposphere over the USA (0.2–0.5 m s�1) (Fig. 8in Whiteman and Bian 1996), but larger than thosein the tropics (@0.2 m s�1) (Williams et al. 1992).The occurrence of larger amplitudes in midlatituderegions is consistent with the theoretical prediction
Fig. 13. Longitude–height distributions ofthe diurnal component of v from 1200JST to 2100 JST at 3-hour intervals inJanuary–February–March from selectedstations located at approximately @35�N.The longitudes of the selected stations aredenoted by the vectors below the bottompanel, which are accompanied by the rele-vant station numbers. The contour intervalis 0.2 m s�1. The regions with >0.6 m s�1
(<�0.6 m s�1) are colored gray (hatched).
342 Journal of the Meteorological Society of Japan Vol. 88, No. 3

that the semidiurnal migrating tidal winds havemaximum amplitudes in subtropical to midlatituderegions (20–30�) (Figs. 3.4 and 3.5 in Chapman andLindzen 1970).
Based on the above results, the seasonal varia-
tion in semidiurnal amplitudes shown in Fig. 15is regarded as that of the semidiurnal tide. Amarked seasonal variation in amplitude is seen inGSWM02, although qualitatively rather than quan-titatively; the amplitudes in GSWM02 at 4 km
Fig. 14. As for Fig. 6, but for the semidiurnal wind component. For (c) and (d), data are not plotted in thecase that SE exceeds 6 hr.
June 2010 T. SAKAZAKI and M. FUJIWARA 343

show a maximum of @0.16 m s�1 in winter and aminimum of @0.13 m s�1 in summer. The winter(summer) maxima are approximately 33% (50%)smaller than the present results. Iwai and Miyashita(2005) found that the amplitude of semidiurnalsurface pressure over Japan attains a maximum(0.6–0.9 hPa) in winter and a minimum in summer(0.4–0.6 hPa). These seasonal variations are proba-bly related to that in ozone distribution, which isconsidered the main source of the semidiurnal tide(Chapman and Lindzen 1970).
Below @1 km, large di¤erences are observedamong stations, particularly in terms of phase.These di¤erences reflect the semidiurnal wind com-ponent of local wind systems, as discussed by Saka-zaki and Fujiwara (2008). In fact, the amplitude [email protected] m s�1 (Fig. 15) is consistent with the findingof Sakazaki and Fujiwara (2008) that the semidiur-nal amplitude associated with the local wind systemis approximately one-third smaller than that of thediurnal component (in the present study, the diur-nal amplitudes below 1 km, which are largely dueto the local wind system, are 0.6–0.8 m s�1 (Fig.7)). Thus, it is concluded that for the semidiurnalwind component, the influence of local wind sys-tems extends up to@1 km.
7. Concluding remarks
We studied diurnal variations in lower-tropospheric wind between the surface and@5 kmover Japan, using WINDAS and AMeDAS datafrom 31 WINDAS stations. The diurnal and semi-diurnal harmonic components were extracted fromthe local time composite of the horizontal winddata, and were analyzed for each height range andfor each season.
For the diurnal wind component, the amplitudeaveraged for all stations attains a maximum of(@0.8 m s�1) in JJA near the surface. At 1–3 km,the average amplitude is largest in autumn(@0.6 m s�1), followed by spring (@0.5 m s�1);the average amplitude is relatively small in sum-mer and winter. At 3–5 km, the average ampli-tude is largest in February, with the amplitudeof v (@0.8 m s�1) being larger than that of u
(@0.4 m s�1). In addition, for the entire heightregion, the average phase shows a clear seasonalvariation. The average phase of u (v) below 5 kmis 1500–2100 LT (1200–1500 LT) in DJF and0300–0900 LT (0000–0400 LT) in JJA, with abruptchanges in spring and autumn.
Analysis of hodographs and harmonic dial vec-tors revealed that for the diurnal wind component,the dominant wind system is di¤erent between themain Japanese islands and small southern islands.For the main Japanese islands, the surface windsare controlled by local wind systems, as discussedpreviously by Sakazaki and Fujiwara (2008). Thestrength of the surface wind system is greatest insummer. At 1–3 km, the autumn maximum tendsto appear at stations along the south coast of themain Japanese islands, while the spring maximumis found at stations along the north coast. The re-turn currents of the surface wind systems (localwind systems) prevail throughout most of the yearin this height region; however, other larger-scaledisturbances also a¤ect the diurnal winds, particu-larly in spring and autumn. The larger-scale distur-bances strengthen the return currents along thenorth (south) coast of the main Japanese islands inspring (autumn) because of a favorable phase rela-tion. This superposition results in the spring andautumn amplitude maxima. Furthermore, in winterand spring, these disturbances show an eastwardphase propagation of @20 m s�1 over the mainJapanese islands. Finally, at 3–5 km in DJF–MAM, we suggest that the diurnal wind compo-nent of v at 3–5 km is caused mainly by medium-
Fig. 15. As for Fig. 7, but for the semidiur-nal wind component.
344 Journal of the Meteorological Society of Japan Vol. 88, No. 3
scale eastward-traveling waves with a phase speedof @25 m s�1 and maximum amplitude located inthe upper troposphere (Sato et al. 1993). Thesewaves result in large amplitudes at 3–5 km inFebruary. At 3–5 km in JJA–SON, the diurnalwind is caused by a large-scale wind system with ahorizontal scale larger than the scale of Japan(@3000 km); the amplitudes are 0.3–0.4 m s�1.This large-scale wind system is caused by atmo-spheric tides, although the tidal phase in the tidalmodel GSWM02 at 4 km is not consistent withour results.
At stations located on small southern islandsequatorward of @30�N, the wind system is di¤er-ent from that at stations on the main Japaneseislands throughout the year, with amplitudes of0.2–0.4 m s�1 over the lower troposphere in allseasons. The vertical wavelengths are small (5–10 km) in DJF–MAM and large (@20 km) inJJA–SON.
For the semidiurnal component, the di¤erencein amplitudes and phases among the WINDASstations is relatively small above @1 km and largebelow@1 km. Above@1 km, the phase of v (0100LT) precedes that of u (0400 LT) by a quadrature,and the phase is approximately constant withheight; these observations are consistent with classi-cal tidal theory regarding the semidiurnal migratingtide, as proposed by Chapman and Lindzen (1970).Therefore, we conclude that the semidiurnal mi-grating tide is dominant above @1 km. The semi-diurnal amplitude attains a maximum in winter(0.4–0.5 m s�1) and a minimum (0.2–0.3 m s�1) insummer. Below@1 km, the semidiurnal wind com-ponent is attributed to local wind systems, as dis-cussed by Sakazaki and Fujiwara (2008).
Thus, diurnal variations in lower-tropospherewind are influenced by at least three phenomenaother than the local wind systems, including theirreturn currents. The first is an eastward-moving dis-turbance with a zonal phase velocity of@20 m s�1
at 1–3 km in DJF–MAM, which is superposed onthe return currents. The second is an eastward-moving disturbance with a phase velocity of@25 m�1s at 3–5 km in winter–spring. The third isa large-scale wind system (>3000 km) at 3–5 kmin summer–autumn. In Part II of this study, basedon meso-scale analysis data and global reanalysisdata, these three phenomena are identified as diur-nal eastward-traveling eddies (DEEs), medium-scale eastward-traveling waves, and the diurnaltide, respectively. In addition, the diurnal wind
system at small southern islands is identified as thediurnal tide, over the entire lower troposphere.
When using horizontal wind data sampled diur-nally in the lower troposphere, it is important toconsider the bias due to diurnal variations withamplitudes of up [email protected] m s�1 (the sum of diurnaland semidiurnal amplitudes), although the bias de-pends on location, season, and height range.
Acknowledgments
WINDAS and AMeDAS data were providedby the Japan Meteorological Agency (JMA), andGSWM02 data were provided by Dr. Maura Haganthrough the Web site http://www.hao.ucar.edu/public/research/tiso/gswm/gswm.html. This workwas supported by the JSC-S Scholarship Founda-tion, and by the Japanese Ministry of Education,Culture, Sports, Science and Technology (MEXT)through Grants-in-Aid for Scientific Research(2200295800). We wish to express our gratitude toDr. Koji Yamazaki for useful advice regarding theinterpretation of daily-mean winds. We thank Dr.Fumio Hasebe for useful advice regarding statisti-cal significance tests in composite analysis. We arealso grateful to Dr. Isamu Hirota and two anony-mous reviewers for their helpful comments andsuggestions. All figures were drawn using theGFD-DENNOU Library.
References
Alexander, S. P., and T. Tsuda, 2008: Observations ofthe diurnal tide during seven intensive radiosondecampaigns in Australia and Indonesia. J. Geophys.Res., 113, D04109, doi:10.1029/2007JD008717.
Chapman, S., and R. S. Lindzen, 1970: Atmospheric
Tides., D. Reidel Publ. Co., 200 pp.Chen, T.-C. (M.), M.-C. Yen, and R. Arritt, 1998: Detec-
tion of semidiurnal wind oscillations with a radarprofiler. Bull. Amer. Meteor. Soc., 79, 1921–1924.
Eady, E. T., 1949: Long waves and cyclonic waves.Tellus, 1, 33–52.
Forbes, J. M., M. E. Hagan, X. Zhang, and K. Hamil-ton, 1997: Upper atmosphere tidal oscillations dueto latent heat release in the tropical troposphere.Ann. Geophys., 15, 1165–1175.
Fujibe, F., and T. Asai, 1979: A study of local winds inKanto district. Part I: Structures of wind systemswith diurnal variation. Tenki, 26, 595–604 (inJapanese).
Gill, A. E., 1980: Some simple solutions for heat-inducedtropical circulation. Quart. J. Roy. Meteor. Soc.,106, 447–462.
Hagan, M. E., J. M. Forbes, and F. Vial, 1995: On mod-
June 2010 T. SAKAZAKI and M. FUJIWARA 345

eling migrating solar tides. Geophys. Res. Lett., 22,893–896.
Hagan, M. E., M. D. Burrage, J. M. Forbes, J. Hackney,W. J. Randel, and X. Zhang, 1999: GSWM-98:Results for migrating solar tides. J. Geophys. Res.,104(A4), 6,813–6,827.
Hagan, M. E., and J. M. Forbes, 2002: Migrating andnonmigrating diurnal tides in the middle andupper atmosphere excited by tropospheric latentheat release. J. Geophys. Res., 107(D24), 4754,doi:10.1029/2001JD001236.
Hagan, M. E., and J. M. Forbes, 2003: Migrating andnonmigrating semidiurnal tides in the upper atmo-sphere excited by tropospheric latent heat release.J. Geophys. Res., 108(A2), 1062, doi:10.1029/2002JA009466.
Hamilton, K., 1981: Latent heat release as a possibleforcing mechanism for atmospheric tides. Mon.
Wea. Rev., 109, 3–17.Hashiguchi, H., S. Fukao, Y. Moritani, T. Wakayama,
and S. Watanabe, 2004: A lower troposphere radar:1.3-GHz active phased-array type wind profilerwith RASS. J. Meteor. Soc. Japan, 82, 915–931.
Held, I. M., 1983: Stationary and quasi-stationary eddiesin the extratropical tropopause: theory. Large-
Scale Dynamical Processes in the Atmosphere., ed.B. J. Hoskins and R. Pearce, Academic Press,127–168.
Hsu, H.-H., and B. J. Hoskins, 1989: Tidal fluctuationsas seen in ECMWF data. Quart. J. Roy. Meteor.
Soc., 115, 247–264.Ishihara, M., Y. Kato, T. Abo, K. Kobayashi, and Y.
Izumikawa, 2006: Characteristics and performanceof the operational wind profiler network of theJapan Meteorological Agency. J. Meteor. Soc. Ja-
pan., 84, 1085–1096.Iwai, K., and E. Miyashita, 2005: Diurnal, semi-diurnal
and ter-diurnal pressure variations at the stationsof central mountain area of Japan. Tenki, 52,831–836 (in Japanese).
Kodama, Y.-M., K. Egawa, and M. Takahashi, 2008:Medium-scale tropopausal waves visualized byupper-level clouds to the east of Tibetan Plateau.J. Meteor. Soc. Japan, 86, 279–295.
Kurita, H., H. Ueda, and S. Mitsumoto, 1990: Combina-tion of local wind systems under light gradientwind conditions and its contribution to the long-range transport of air pollutants. J. Appl. Meteor.
29, 331–348.Lieberman, R. S., and C. B. Leovy, 1995: A numerical
model of nonmigrating diurnal tides between thesurface and 65 km. J. Atmos. Sci., 52, 389–409.
Matsuno, T., 1966: Quasi-geostrophic motions in theequatorial area. J. Meteor. Soc. Japan, 44, 25–43.
Miller, S. T. K., B. D. Keim, R. W. Talbot, and H. Mao,2003: Sea breeze: Structure, forecasting, and
impacts. Rev. Geophys., 41(3), 1011, doi:10.1029/2003RG000124.
Oliphant, A. J., A. P. Sturman, and N. J. Tapper, 2001:The evolution and structure of a tropical islandsea/land-breeze system, northern Australia. Me-
teor. Atmos. Phys., 78, 45–59.Onogi, K., J. Tsutsui, H. Koide, M. Sakamoto, S. Ko-
bayashi, H. Hatsushika, T. Matsumoto, N. Yama-zaki, H. Kamahori, K. Takahashi, S. Kadokura,K. Wada, K. Kato, R. Oyama, T. Ose, N. Man-noji, and R. Taira, 2007: The JRA-25 reanalysis.J. Meteor. Soc. Japan, 85, 369–432.
Riggin, D. M., E. Kudeki, Z. Feng, M. F. Sarango, andR. S. Lieberman, 2002: Jicamarca radar observa-tions of the diurnal and semidiurnal tide in the tro-posphere and lower stratosphere. J. Geophys. Res.,107(D8), doi:10.1029/2001JD001216.
Sakazaki, T., and M. Fujiwara, 2008: Diurnal variationsin summertime surface wind upon Japanese plains:Hodograph rotation and its dynamics. J. Meteor.
Soc. Japan, 86, 787–803.Sakazaki, T., and M. Fujiwara, 2010: Diurnal variations
in lower-tropospheric wind over Japan. Part II:Analysis of Japan Meteorological Agency meso-scale analysis data and four global reanalysis datasets. J. Meteor. Soc. Japan, 88, 349–372.
Sasi, M. N., G. Ramkumar, and V. Deepa, 1998: Non-migrating diurnal tides in the troposphere andlower stratosphere over Gadanki (13.5�N, 79.2�E).J. Geophys. Res., 103(D16), 19,485–19,494.
Sasi, M. N., G. Ramkumar, and V. Deepa, 2001: Tidalwind oscillations in the tropical lower atmosphereas observed by Indian MST radar. Ann. Geophys.,19, 991–999.
Sato, K., H. Eito, and I. Hirota, 1993: Medium-scaletravelling waves in the extra-tropical upper tropo-sphere. J. Meteor. Soc. Japan, 71, 427–436.
Sato, K., K. Yamada, and I. Hirota, 2000: Global char-acteristics of medium-scale tropopausal waves ob-served in ECMWF operational data. Mon. Wea.
Rev., 128, 3808–3823.Seidel, D. J., M. Free, and J. Wang, 2005: Diurnal
cycle of upper-air temperature estimated fromradiosondes. J. Geophys. Res., 110, D09102,doi:10.1029/2004JD005526.
Tijm, A. B. C., A. A. N. Holtslag, and A. J. van Delden,1999: Observations and modeling of the sea breezewith the return current. Mon. Wea. Rev., 127, 625–640.
Tokioka, T., and I. Yagai, 1987: Atmospheric tides ap-pearing in a global atmospheric general circulationmodel. J. Meteor. Soc. Japan, 65, 423–437.
Tomikawa, Y., K. Sato, and T. G. Shepherd, 2006: Adiagnostic study of waves on the tropopause. J.
Atmos. Sci., 63, 3315–3332.Tsuda, T., and S. Kato, 1989: Diurnal non-migrating
346 Journal of the Meteorological Society of Japan Vol. 88, No. 3

tides excited by a di¤erential heating due to land-sea distribution. J. Meteor. Soc. Japan, 67, 43–55.
Tsuda, T., Y. Murayama, H. Wiryosumarto, S. W. B.Harijono, and S. Kato, 1994: Radiosonde observa-tions of equatorial atmosphere dynamics overIndonesia 1. Equatorial waves and diurnal tides.J. Geophys. Res., 99(D5), 10,491–10,505.
Wallace, J. M., and F. R. Hartranft, 1969: Diurnal windvariations, surface to 30 kilometers. Mon. Wea.
Rev., 97, 446–455.Wallace, J. M., and R. F. Tadd, 1974: Some further
results concerning the vertical structure of atmo-spheric tidal motions within the lowest 30 kilo-meters. Mon. Wea. Rev., 102, 795–803.
Whiteman, C. D., and X. Bian, 1995: Radar wind pro-filer observations of solar semidiurnal atmospherictides. Geophys. Res. Lett., 22, 901–904.
Whiteman, C. D., and X. Bian, 1996: Solar semidiurnaltides in the troposphere: Detection by radar pro-filers. Bull. Amer. Meteor. Soc., 77, 529–542.
Williams, C. R., and S. K. Avery, 1996a: Diurnal nonmi-grating tidal oscillations forced by deep convectiveclouds. J. Geophys. Res., 101(D2), 4079–4091.
Williams, C. R., and S. K. Avery, 1996b: Diurnal windsobserved in the tropical troposphere using 50 MHzwind profilers. J. Geophys. Res., 101(D10), 15,051–15,060.
Williams, C. R., S. K. Avery, J. R. NcAfee, and K. S.Gage, 1992: Comparison of observed diurnal andsemidiurnal tropospheric winds at Christmas islandwith tidal theory. Geophys. Res. Lett., 19, 1471–1474.
Yamamori, M., K. Sato, and I. Hirota, 1997: A study onseasonal variation of upper tropospheric medium-scale waves over East Asia based on regionalclimate model data. J. Meteor. Soc. Japan, 75,13–22.
Yoshida, A., and I. Hirota, 1979: Diurnal wind varia-tion in the troposphere and lower stratosphereover Japan. J. Meteor. Soc. Japan, 57, 29–38.
June 2010 T. SAKAZAKI and M. FUJIWARA 347