Diurnal variation in ozone derived from MACC …...ozone variations in the lower stratosphere. For...
42
ACPD 14, 32667–32708, 2014 Diurnal variation in ozone derived from MACC reanalysis and WACCM A. Schanz et al. Title Page Abstract Introduction Conclusions References Tables Figures J I J I Back Close Full Screen / Esc Printer-friendly Version Interactive Discussion Discussion Paper | Discussion Paper | Discussion Paper | Discussion Paper | Atmos. Chem. Phys. Discuss., 14, 32667–32708, 2014 www.atmos-chem-phys-discuss.net/14/32667/2014/ doi:10.5194/acpd-14-32667-2014 © Author(s) 2014. CC Attribution 3.0 License. This discussion paper is/has been under review for the journal Atmospheric Chemistry and Physics (ACP). Please refer to the corresponding final paper in ACP if available. The diurnal variation in stratospheric ozone from the MACC reanalysis, the ERA-Interim reanalysis, WACCM and Earth observation data: characteristics and intercomparison A. Schanz 1 , K. Hocke 1 , N. Kämpfer 1 , S. Chabrillat 2 , A. Inness 3 , M. Palm 4 , J. Notholt 4 , I. Boyd 5 , A. Parrish 6 , and Y. Kasai 7 1 Institute of Applied Physics and Oeschger Centre for Climate Change Research, University of Bern, Bern, Switzerland 2 Belgium Institute of Space Aeronomy, Brussels, Belgium 3 ECMWF, Reading, UK 4 Institute of Environmental Physics, Universität Bremen, Bremen, Germany 5 Contractor to BC Scientific, Consulting LLC, USA 6 Department of Astronomy, University of Massachusetts, Amherst, MA, USA 7 Department of Environmental Chemistry and Engineering, Tokyo Institute of Technology, Tokyo, Japan 32667
Transcript of Diurnal variation in ozone derived from MACC …...ozone variations in the lower stratosphere. For...
ACPD14, 32667–32708, 2014
Diurnal variation inozone derived from
MACC reanalysis andWACCM
A. Schanz et al.
Title Page
Abstract Introduction
Conclusions References
Tables Figures
J I
J I
Back Close
Full Screen / Esc
Printer-friendly Version
Interactive Discussion
Discussion
Paper
|D
iscussionP
aper|
Discussion
Paper
|D
iscussionP
aper|
Atmos. Chem. Phys. Discuss., 14, 32667–32708, 2014www.atmos-chem-phys-discuss.net/14/32667/2014/doi:10.5194/acpd-14-32667-2014© Author(s) 2014. CC Attribution 3.0 License.
This discussion paper is/has been under review for the journal Atmospheric Chemistryand Physics (ACP). Please refer to the corresponding final paper in ACP if available.
The diurnal variation in stratosphericozone from the MACC reanalysis, theERA-Interim reanalysis, WACCM andEarth observation data: characteristicsand intercomparisonA. Schanz1, K. Hocke1, N. Kämpfer1, S. Chabrillat2, A. Inness3, M. Palm4,J. Notholt4, I. Boyd5, A. Parrish6, and Y. Kasai7
1Institute of Applied Physics and Oeschger Centre for Climate Change Research, University ofBern, Bern, Switzerland2Belgium Institute of Space Aeronomy, Brussels, Belgium3ECMWF, Reading, UK4Institute of Environmental Physics, Universität Bremen, Bremen, Germany5Contractor to BC Scientific, Consulting LLC, USA6Department of Astronomy, University of Massachusetts, Amherst, MA, USA7Department of Environmental Chemistry and Engineering, Tokyo Institute of Technology,Tokyo, Japan
32667
ACPD14, 32667–32708, 2014
Diurnal variation inozone derived from
MACC reanalysis andWACCM
A. Schanz et al.
Title Page
Abstract Introduction
Conclusions References
Tables Figures
J I
J I
Back Close
Full Screen / Esc
Printer-friendly Version
Interactive Discussion
Discussion
Paper
|D
iscussionP
aper|
Discussion
Paper
|D
iscussionP
aper|
Received: 6 October 2014 – Accepted: 9 December 2014 – Published: 22 December 2014
Correspondence to: A. Schanz ([email protected])
Published by Copernicus Publications on behalf of the European Geosciences Union.
32668
ACPD14, 32667–32708, 2014
Diurnal variation inozone derived from
MACC reanalysis andWACCM
A. Schanz et al.
Title Page
Abstract Introduction
Conclusions References
Tables Figures
J I
J I
Back Close
Full Screen / Esc
Printer-friendly Version
Interactive Discussion
Discussion
Paper
|D
iscussionP
aper|
Discussion
Paper
|D
iscussionP
aper|
Abstract
In this study we compare the diurnal variation in stratospheric ozone derived from free-running simulations of the Whole Atmosphere Community Climate Model (WACCM)and from reanalysis data of the atmospheric service MACC (Monitoring AtmosphericComposition and Climate) which both use a similar stratospheric chemistry module.5
We find good agreement between WACCM and the MACC reanalysis for the diurnalozone variation in the high-latitude summer stratosphere based on photochemistry.In addition, we consult the ozone data product of the ERA-Interim reanalysis. TheERA-Interim reanalysis ozone system with its long-term ozone parametrization can notcapture these diurnal variations in the upper stratosphere that are due to photochem-10
istry. The good dynamics representations, however, reflects well dynamically inducedozone variations in the lower stratosphere. For the high-latitude winter stratosphere wedescribe a novel feature of diurnal variation in ozone where changes of up to 46.6 %(3.3 ppmv) occur in monthly mean data. For this effect good agreement between theERA-Interim reanalysis and the MACC reanalysis suggest quite similar diurnal advec-15
tion processes of ozone. The free-running WACCM model seriously underestimates therole of diurnal advection processes at the polar vortex at the two tested resolutions. Theintercomparison of the MACC reanalysis and the ERA-Interim reanalysis demonstrateshow global reanalyses can benefit from a chemical representation held by a chemicaltransport model. The MACC reanalysis provides an unprecedented description of the20
dynamics and photochemistry of the diurnal variation of stratospheric ozone which isof high interest for ozone trend analysis and research on atmospheric tides. We con-firm the diurnal variation in ozone at 5 hPa by observations of the SuperconductingSubmillimeter-Wave Limb-Emission Sounder (SMILES) experiment and selected sitesof the Network for Detection of Atmospheric Composition Change (NDACC). The latter25
give valuable insight even to diurnal variation of ozone in the polar winter stratosphere.
32669
ACPD14, 32667–32708, 2014
Diurnal variation inozone derived from
MACC reanalysis andWACCM
A. Schanz et al.
Title Page
Abstract Introduction
Conclusions References
Tables Figures
J I
J I
Back Close
Full Screen / Esc
Printer-friendly Version
Interactive Discussion
Discussion
Paper
|D
iscussionP
aper|
Discussion
Paper
|D
iscussionP
aper|
1 Introduction
Biases in satellite-based ozone trend analysis due to measurements at different lo-cal time and drifting satellite orbits renewed the interest in diurnal variations of strato-spheric ozone (Bhartia et al., 2013). Model projections indicate a recovery of the ozonelayer of about 1 % per decade (Jonsson et al., 2009; Garny et al., 2013; Chehade et al.,5
2013; Kyrölä et al., 2014; Gebhardt et al., 2014) while the diurnal variation in strato-spheric ozone typically has an amplitude of 2–4 % which may induce a serious bias intrend estimates from satellite ozone measurements.
The diurnal variation in stratospheric ozone was researched by new studies based onchemistry–climate model simulations, ground-based microwave radiometry and satel-10
lite observations (e.g. Sakazaki et al., 2013; Studer et al., 2013a; Parrish et al., 2014).Schanz et al. (2014) investigated the global, seasonal and regional behaviour of diurnalvariation in stratospheric ozone by means of the free-running chemistry–climate modelWACCM. The study explained the basic underlying physical processes as temperature-dependent photochemical reactions within the Chapman cycle and the catalytic NO15
cycle which are the main contributors to the diurnal variation in stratospheric ozone.The strong connection to photochemistry in the stratosphere leads to a seasonality indiurnal ozone variation especially at high latitudes. The maximum ozone variation dur-ing a day is up to 0.8 ppmv (15 %) at the polar circle in summer in WACCM simulation(Schanz et al., 2014). This surprisingly strong amplitude is confirmed by ground-based20
microwave radiometer at Ny-Ålesund, Svalbard (Palm et al., 2013) and indicates thata correction of diurnal sampling effects in stratospheric ozone data sets is more neededthan previously expected.
Sakazaki et al. (2013) compared the diurnal variation in stratospheric ozone fromnudged chemistry–climate model simulations (SD-WACCM where SD stands for spec-25
ified dynamics) to observations from the Superconducting Submillimeter-Wave Limb-Emission Sounder (SMILES, Kikuchi et al., 2013). The SMILES observations showed
32670
ACPD14, 32667–32708, 2014
Diurnal variation inozone derived from
MACC reanalysis andWACCM
A. Schanz et al.
Title Page
Abstract Introduction
Conclusions References
Tables Figures
J I
J I
Back Close
Full Screen / Esc
Printer-friendly Version
Interactive Discussion
Discussion
Paper
|D
iscussionP
aper|
Discussion
Paper
|D
iscussionP
aper|
a good agreement in the tropics to SD-WACCM data (Sakazaki et al., 2013) wheredynamics are nudged in the lower atmosphere.
Parrish et al. (2014) derived the diurnal variation in stratospheric ozone using18 years of microwave radiometer measurements at Mauna Loa (Hawaii). They com-pared the observed results to simulations of the Goddard Earth Observing System5
Chemistry Climate Model (GEOSCCM, Duncan et al., 2007; Strahan et al., 2007;Oman et al., 2011) with two different implementations of atmospheric chemical pro-cesses. The observed and the simulated diurnal variation in stratospheric ozoneagreed mostly within 1 % (2σ) of the estimated statistical errors. Studer et al. (2014)derived a climatology of the diurnal ozone variation using a 17 years series of strato-10
spheric ozone profiles measured by a microwave radiometer at Bern, Switzerland. Theyfound indications for an interannual variability of the diurnal ozone variation.
The good agreement of model data and observations may indicate that a model-assisted correction of diurnal sampling effects in satellite ozone measurements couldbe feasible. Alternatively to a model-assisted correction of satellite data, the assimila-15
tion of satellite ozone measurements into an advanced chemistry–climate model withtwo-way interactions between dynamics and atmospheric composition may be consid-ered. The assimilating model system can incorporate the diurnal ozone variation ina correct manner. The Earth observation programme Copernicus of the EU developssuch a chemistry–climate model system called Monitoring Atmospheric Composition20
and Climate (MACC). MACC assimilates satellite data of atmospheric composition, in-cluding ozone, into a global atmosphere model to provide a reanalysis of atmosphericcomposition for the years 2003–2012. Such a model system might help to correct diur-nally sampled ozone data from biased satellite measurements and finally improve thequality of ozone trend estimates.25
The present study follows on Schanz et al. (2014) and scrutinizes the WACCM re-sults with the help of reanalysis data. The diurnal ozone variation from the MACCreanalysis, the ERA-Interim reanalysis and the WACCM model is intercompared andresults are confirmed at 5 hPa by selected ground-based observations of the the Net-
32671

ACPD14, 32667–32708, 2014
Diurnal variation inozone derived from
MACC reanalysis andWACCM
A. Schanz et al.
Title Page
Abstract Introduction
Conclusions References
Tables Figures
J I
J I
Back Close
Full Screen / Esc
Printer-friendly Version
Interactive Discussion
Discussion
Paper
|D
iscussionP
aper|
Discussion
Paper
|D
iscussionP
aper|
work for Detection of Atmospheric Composition Change (NDACC) and satellite-basedobservations of the Superconducting Submillimeter-Wave Limb-Emission Sounder(SMILES). Further, the study presents a remarkably strong diurnal variation based onadvection at the polar regions in winter which is even stronger than the known effectsbased on photochemistry. This novel feature is discussed in a separated section by5
means of the potential vorticity distribution and an Arctic NDACC site.The article is organized as follows: in Sect. 2 the different data sets from model
systems and instruments are described. Section 3 intercompares the diurnal ozonevariation derived from the MACC reanalysis, the ERA-Interim reanalysis, WACCM andNDACC instruments. Section 4 gives a brief summary of the results and concluding10
remarks.
2 Model systems and observations
2.1 MACC reanalysis system
The EU project Monitoring Atmospheric Composition and Climate (MACC) fostersa chemical weather forecast system which will be fed by the observations of the up-15
coming Sentinel satellites of the Copernicus Earth Observation programme. The globalmodel and data assimilation system of MACC (Inness et al., 2013) is based on the Eu-ropean Centre for Medium-Range Weather Forecast’s (ECMWF) integrated forecastsystem (IFS, Flemming et al., 2009; Stein et al., 2012). The representation of the at-mospheric chemical system is held by a chemical transport model (CTM) which is cou-20
pled to the IFS via the OASIS4 coupler (Redler et al., 2010). That means the MACCreanalysis considers two-way interaction of dynamics and composition.
The coupled CTM is called Model of OZone And Related chemical Tracers (MOZARTv3.5, Kinnison et al., 2007; Stein et al., 2012) and calculates chemical production andloss rates of the atmospheric gases. The implementation of Stein et al. (2012) used by25
the MACC reanalysis from 2009 onwards comprises 115 species, 71 photolysis reac-
32672
ACPD14, 32667–32708, 2014
Diurnal variation inozone derived from
MACC reanalysis andWACCM
A. Schanz et al.
Title Page
Abstract Introduction
Conclusions References
Tables Figures
J I
J I
Back Close
Full Screen / Esc
Printer-friendly Version
Interactive Discussion
Discussion
Paper
|D
iscussionP
aper|
Discussion
Paper
|D
iscussionP
aper|
tions, 223 gas phase reactions and 21 heterogeneous reactions. The MOZART modelsimulates tropospheric and stratospheric chemistry on a 1.125◦ by 1.125◦ horizontalgrid. The vertical model domain is divided into 60 layers on hybrid–pressure (σ −p)coordinates (Phillips, 1957) with a model top at 0.1 hPa.
Satellite retrievals of reactive gases, aerosols and greenhouse gases are assimilated5
into the MACC reanalysis system by a four-dimensional variational (4-D-VAR) data as-similation system (Talagrand and Courtier, 1987; Courtier et al., 1994; Courtier, 1997).Stratospheric ozone data are assimilated from different satellite-based instruments e.g.Global Ozone Monitoring Experiment (GOME), Michelson Interferometer for PassiveAtmospheric Sounding (MIPAS), Microwave Limb Sounder (MLS), Ozone Monitoring10
Instrument (OMI), Solar Backscatter UltraViolet Instrument (SBUV/2), Scanning Imag-ing Absorption Spectrometer for Atmospheric CHartographY (SCIAMACHY). For fur-ther information on the assimilation of ozone data we refer to Inness et al. (2013). Asidethe meteorological variables the MACC system calculates forecasts of reactive gasesincluding ozone (O3), carbon monoxide (CO), nitrogen oxides (NOx) and formaldehyde15
(HCHO), aerosols and greenhouse gases.Data records, monitored present state, forecasts and reanalysis of atmospheric com-
position are provided by the MACC project (atmosphere.copernicus.eu). The MACCreanalysis ozone product contains 6 hourly analysis data (forecast data is availableevery 3 h) at 00:00, 06:00, 12:00 and 18:00 UT and is available from 2003 to 2012.20
Inness et al. (2013) found that stratospheric ozone from the MACC reanalysis agreesto within ±10 % in most seasons and regions which is considerably better compared tothe free-running CTM MOZART.
2.2 ERA-Interim reanalysis
The ERA-Interim reanalysis is a global atmospheric reanalysis produced by the25
ECMWF. The ERA-Interim project aimed at establishing an improved reanalysis byapproaching the existing problems of ERA-40’s hydrological cycle, stratospheric circu-lation and temporal consistence of atmospheric fields (Dee et al., 2011).
32673

ACPD14, 32667–32708, 2014
Diurnal variation inozone derived from
MACC reanalysis andWACCM
A. Schanz et al.
Title Page
Abstract Introduction
Conclusions References
Tables Figures
J I
J I
Back Close
Full Screen / Esc
Printer-friendly Version
Interactive Discussion
Discussion
Paper
|D
iscussionP
aper|
Discussion
Paper
|D
iscussionP
aper|
The prognostic ozone system of the ERA-Interim reanalysis is a simplified, built-inchemistry routine. Ozone follows a scheme of linear relaxation to a local photochemicalequilibrium which is calculated by a two-dimensional photochemical model. The coeffi-cients of the ozone parametrisation are given as a function of latitude, model level, andmonth, hence there is no diurnal variation or longitudinal variation (Geer et al., 2007).5
That means the ERA-Interim reanalysis does not represent a fully two-way interactivecoupling of dynamics and composition and it can not model the diurnal ozone cycle inthe upper stratosphere that is due to photochemistry. The prognostic ozone system wasupgraded following Cariolle and Teyssèdre (2007) who improved the representation ofpolar ozone destruction by taking into account local stratospheric temperature and the10
total chlorine content. The upgraded ozone system reproduced well the inter-annualvariability related to temperature in polar vortices. For more details on the ozone sys-tem of the ERA-Interim reanalysis we refer to Cariolle and Déqué (1986) and Cariolleand Teyssèdre (2007).
The ERA-Interim reanalysis uses a 4-D-VAR data assimilation system (Rabier et al.,15
2000; Dee et al., 2011). The atmospheric model performs simulations on hybrid-pressure (σ −p) coordinates (Phillips, 1957) with a model top at 0.1 hPa. Reanalysisdata of ERA-Interim are available in 6 hourly data at 00:00, 06:00, 12:00 and 18:00 UTfrom 1979 onwards. Ozone data from the ERA-Interim reanalysis are often used in at-mospheric research (e.g. Goncharenko et al., 2012; Hocke et al., 2013; Studer et al.,20
2013a). The quality of ERA-Interim ozone data was assessed by Dragani (2011) whofound that ERA-Interim reanalysis is in better agreement than the ERA-40 equivalentcompared to a total column ozone reference. In the stratosphere the ERA-Interim re-analysis shows mean residuals of about ±10 % compared to satellite observations(Dragani, 2011).25
2.3 WACCM
The Whole Atmosphere Community Climate Model (WACCM) is a fully coupledchemistry–climate model which simulates the entirety of the Earth’s atmosphere. The
32674
ACPD14, 32667–32708, 2014
Diurnal variation inozone derived from
MACC reanalysis andWACCM
A. Schanz et al.
Title Page
Abstract Introduction
Conclusions References
Tables Figures
J I
J I
Back Close
Full Screen / Esc
Printer-friendly Version
Interactive Discussion
Discussion
Paper
|D
iscussionP
aper|
Discussion
Paper
|D
iscussionP
aper|
WACCM model was developed by the National Center of Atmospheric Research(NCAR) (Garcia et al., 2007; Marsh et al., 2007; Tilmes et al., 2007) and is embed-ded into the software framework of the Community Earth System Model (CESM) whichcomprises a land, ice, ocean and an atmosphere model. The atmosphere is simulatedfrom the Earth’s surface up to the lower thermosphere at 5.1×10⁻⁶ hPa (∼ 150 km).5
In the present article, WACCM version 4 was utilized with the preconfigured, free-running F 2000 scenario which reflects a perpetual year with atmospheric conditionscorresponding to the year 2000. Free-running means that the model is not influencedby effects of data assimilation or nudging.
The chemical representation of the atmosphere is based on the stratospheric chem-10
istry of the CTM MOZART (v3, Kinnison et al., 2007) which comprises the main pro-duction and loss processes of 59 atmospheric species. In addition, the WACCM modelsimulates chemical heating, gravity wave drag, molecular diffusion and ionization. Theozone distribution calculated by the model feeds back to the model dynamics.
The simulations are carried out on a horizontal resolution of 1.9◦ latitude by15
2.5◦ longitude and a vertical fragmentation of 66 layers on hybrid-pressure (σ−p) coor-dinates (Phillips, 1957) which are terrain-following below the 100 hPa level and isobarabove. The resolution of the vertical coordinates ranges from 1.1 to 2.0 km in the middleatmosphere. The time steps of the atmosphere and land model were reduced to 15 minin order to achieve good results for the diurnal variability of stratospheric composition.20
The global output data set of WACCM has a time resolution of 1 h and is derived froma one year simulation starting at 1 January 00:00 UT.
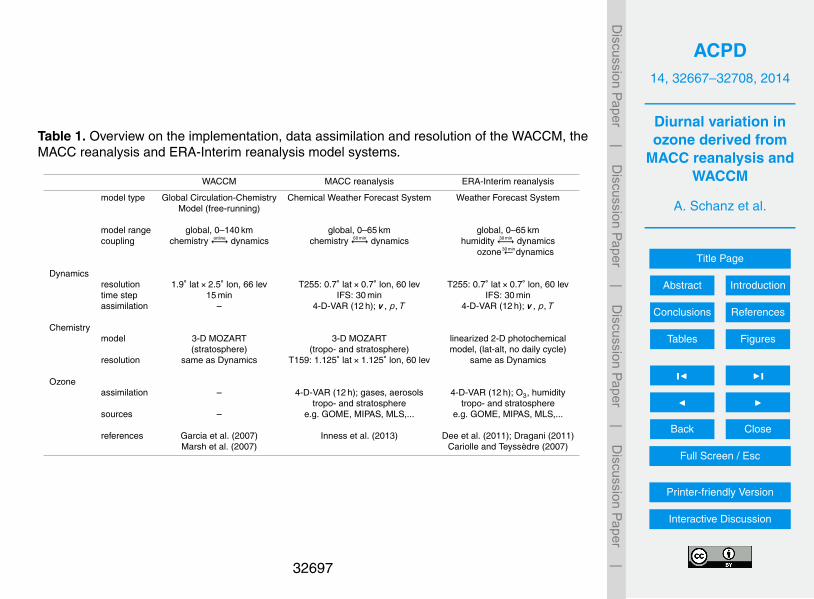
An overview on the model systems of the MACC reanalysis, the ERA-Interim reanal-ysis and WACCM is given in Table 1.
2.4 SMILES climatology25
The SMILES (Kikuchi et al., 2013) was jointly operated by the Japan Aerospace Ex-ploration Agency (JAXA) and National Institute of Communication Technology (NICT)at the Japanese Experiment Module on the International Space Station (ISS). The
32675

ACPD14, 32667–32708, 2014
Diurnal variation inozone derived from
MACC reanalysis andWACCM
A. Schanz et al.
Title Page
Abstract Introduction
Conclusions References
Tables Figures
J I
J I
Back Close
Full Screen / Esc
Printer-friendly Version
Interactive Discussion
Discussion
Paper
|D
iscussionP
aper|
Discussion
Paper
|D
iscussionP
aper|
SMILES experiment was launched to space on 9 September 2009 and had been ob-serving the atmosphere from 12 October 2009 until 21 April 2010 when an instrumentcomponent failed.
During seven months in operation SMILES has been observing profiles of atmo-spheric minor constituents such as O3 (and isotopes), HCl, ClO, HO2, BrO, HNO3. The5
SMILES observations cover a latitudinal range mostly within 38◦ S to 65◦N (exceptionsoccur when the ISS was turned) with a vertical resolution of 3.5–4.1 km.
The relatively low inclination of the ISS supports the study of diurnal variations ofozone, minor constituents, ozone isotopes, rate constants and atmospheric tides (e.g.Sakazaki et al., 2012, 2013; Sato et al., 2014; Kuribayashi et al., 2014) by means of10
the SMILES observations. Kreyling et al. (2013) derived a climatology of stratosphericand mesospheric trace gases and temperature from SMILES observations. The ozoneclimatology of Kreyling et al. (2013) is distributed via the NICT SMILES website (http://smiles.nict.go.jp/index-e.html). Due to irregular spatial and temporal distribution of theSMILES data, the ozone climatology was obtained by binning the ozone measurements15
of SMILES within latitude bands (20–40◦ S, 20◦ S–20◦N, 20–50◦N and 50–65◦N) andover bimonthly periods.
2.5 GROMOS measurements
The GROund-based Millimeter-wave Ozone Spectrometer (GROMOS) is situated atthe Bern NDACC site, Switzerland (46◦57′N, 7◦26′ E) and has been operating since20
1994 (Dumitru et el., 2006). In the present study ozone profiles are used with a timeresolution of 30 min which have been measured with the Fast Fourier transform (FFT)spectrometer of GROMOS. Ozone profiles are retrieved at fixed pressure levels fromabout 0.2 to 50 hPa with a vertical resolution of approximately 10 km. A climatologyof diurnal variation in mesospheric and stratospheric ozone was derived for the pe-25
riod from 1994 to 2011 by Studer et al. (2014). For further details on the GROMOSclimatology we refer to the latter study.
32676

ACPD14, 32667–32708, 2014
Diurnal variation inozone derived from
MACC reanalysis andWACCM
A. Schanz et al.
Title Page
Abstract Introduction
Conclusions References
Tables Figures
J I
J I
Back Close
Full Screen / Esc
Printer-friendly Version
Interactive Discussion
Discussion
Paper
|D
iscussionP
aper|
Discussion
Paper
|D
iscussionP
aper|
Ozone profiles from GROMOS are regularly used for satellite validations or for stud-ies on middle-atmospheric dynamics, diurnal ozone variation and sudden stratosphericwarmings (Hocke et al., 2007, 2013; Flury et al., 2009; Studer et al., 2014).
2.6 MLO ozone measurements
The Mauna Loa Observatory (MLO, 19.5◦N, 204.5◦ E) is a tropical NDACC site sens-5
ing ozone profiles. The MLO microwave radiometer has been operating since 1995 atan elevation of 3400 m where the quality of sensed profiles benefits from a low zenithtropospheric opacity (Parrish et al., 2014). Ozone profiles are retrieved from 20–65 kmwith a vertical resolution from 6–14 km. Technical details of the MLO microwave ra-diometer are described by Parrish et al. (1992).10
The diurnal variation of ozone was studied by Parrish et al. (2014) from reprocessedmeasurements with hourly time resolution of the profiling MLO radiometer. They com-pared the results to measurements of space-based microwave limb sounders (e.g.SMILES) and the solar backscattered instruments of SBUV/2 and found very smalldifferences of less than 1.5 % amongst the profiles.15
2.7 OZORAM measurements
The OZOne Radiometer for Atmospheric Measurements (OZORAM) is deployed to Ny-Ålesund, Svalbard in the high Arctic (78.9◦N, 11.9◦ E). The instrument is operated bythe Alfred Wegener Institute (AWI) and the University of Bremen, Germany in the frameof NDACC. Since 2008 OZORAM has been observing ozone profiles of the middle20
atmosphere from 30–70 km with an altitude resolution of 10–20 km and time intervalsof 1 h.
Palm et al. (2010) compared stratospheric ozone observations from OZORAM tosatellite-based instruments such as EOS-MLS and TIMED and found good agreementwithin 10 %. For further information on the technical details, the ozone retrieval and the25
quality of ozone measurements we refer to Palm et al. (2010).
32677

ACPD14, 32667–32708, 2014
Diurnal variation inozone derived from
MACC reanalysis andWACCM
A. Schanz et al.
Title Page
Abstract Introduction
Conclusions References
Tables Figures
J I
J I
Back Close
Full Screen / Esc
Printer-friendly Version
Interactive Discussion
Discussion
Paper
|D
iscussionP
aper|
Discussion
Paper
|D
iscussionP
aper|
Ground-based microwave radiometers such as GROMOS, OZORAM and the MLOmicrowave radiometer measure ozone profiles from approximately 25–70 km at day-and nighttime with the same quality so that the determination of the small diurnal cycleof stratospheric ozone is possible. For further details on the retrieval technique of themicrowave instruments we refer to Rodgers (2000).5
3 Results and discussion
3.1 Intercomparison with respect to ground- and satellite-based measurements
Diurnal ozone variation of model systems and selected NDACC sites are intercom-pared at the 5 hPa level where satellite ozone trend analysis is most biased by samplingeffects. Further, strongest diurnal variation in ozone appears mostly from 3–5 hPa, little10
above the ozone maximum (VMR) and hence at the peak of the stratospheric ozonelayer (Bhartia et al., 2013; Parrish et al., 2014; Sakazaki et al., 2013).
By sorting and binning of all ozone values of a month according to the local time, weget monthly mean ozone as function of local time (O3,m(LT)) showing the mean diurnalvariation in stratospheric ozone. The relative, diurnal ozone variation is calculated with15
respect to monthly mean ozone at midnight
∆O3(LT) =O3,m(LT)−O3,m(00:00)
O3,m(00:00). (1)
Figure 1 displays mean March (2012) diurnal variations in stratospheric ozone overNDACC sites at northern midlatitudes (upper panel) and tropics (bottom panel) accord-ing to Eq. (1). The figure compares data from two microwave radiometers (dashed and20
solid gray lines), the WACCM model (blue line), the MACC reanalysis (red markers) andthe ERA-Interim reanalysis (black markers). In Fig. 1, diurnal ozone variation at 5 hPafeatures three different characteristics during a day: almost constant ozone over night-time (WACCM, MLO radiometer), a morning minimum and an afternoon maximum.
32678

ACPD14, 32667–32708, 2014
Diurnal variation inozone derived from
MACC reanalysis andWACCM
A. Schanz et al.
Title Page
Abstract Introduction
Conclusions References
Tables Figures
J I
J I
Back Close
Full Screen / Esc
Printer-friendly Version
Interactive Discussion
Discussion
Paper
|D
iscussionP
aper|
Discussion
Paper
|D
iscussionP
aper|
Table 2 compares the morning minima and afternoon maxima of the different data setsfrom model systems and microwave radiometers. Figure 1 and Table 2 clearly showthat the ERA-Interim reanalysis only renders a small diurnal variation in ozone of ap-proximately 0.8 %. This result reveals that the simplified, linear ozone representation ofthe ERA-Interim reanalysis does not adequately reflect diurnal variation in ozone.5
There is agreement between the microwave radiometers, WACCM and the MACCreanalysis in spring (Fig. 1a and b) though the temporal resolution of the MACC re-analysis is rather coarse. At 19:00 LT the ozone VMR values from the MACC reanalysisare beyond the data of the WACCM model and the ground-based microwave radiome-ters over Mauna Loa and Bern. The low temporal resolution of the MACC reanalysis10
might cause minor defects in strength of the diurnal variation in ozone. Further defectsmight be related to the chemical data of the CTM of the MACC reanalysis which iscoupled every hour only. The MACC project also provides 3 hourly forecast data whichwe considered to be not adapted for intercomparison to the ERA-Interim reanalysis orthe WACCM model. Nevertheless, the 6 hourly reanalysis data of the MACC project is15
already valuable for the study of the diurnal ozone variation on a global scale.Further, Fig. 1 includes the SMILES climatology (orange line) for midlatitudes (zonal
mean from 20 to 50◦N) and tropics (zonal mean from 20◦ S to 20◦N) which is availablefor the bimonthly period of March–April only. Over Bern, Switzerland, the SMILES cli-matology agrees with the morning minimum and the afternoon maximum of WACCM20
and the MACC reanalysis (see Table 2), whereas over Mauna Loa, Hawaii only theWACCM model and the MLO microwave radiometer are mutually consistent.
Over Mauna Loa, Hawaii there is only qualitative agreement of the SMILES clima-tology and all data from model systems and the MLO microwave radiometer. Kreylinget al. (2013) compiled the SMILES climatology by sampling bimonthly zonal mean pro-25
files from non-sun-synchronous orbits, thus from all local times. The apparent discrep-ancy of SMILES over the Mauna Loa NDACC site (Fig. 1b) may be related to the ir-regular data sampling due to the ISS orbit which accounts of up to 20 % (relative error)in the SMILES climatology product (Kreyling et al., 2013). Such discrepancies and the
32679
ACPD14, 32667–32708, 2014
Diurnal variation inozone derived from
MACC reanalysis andWACCM
A. Schanz et al.
Title Page
Abstract Introduction
Conclusions References
Tables Figures
J I
J I
Back Close
Full Screen / Esc
Printer-friendly Version
Interactive Discussion
Discussion
Paper
|D
iscussionP
aper|
Discussion
Paper
|D
iscussionP
aper|
phase bias in the diurnal ozone variation from ground-based measurements, WACCM,the MACC reanalysis and the SMILES climatology (see Fig. 1) remind that our presentunderstanding of ozone photochemistry in the stratosphere is still incomplete (Crutzenand Schmailzl, 1983).
3.2 Intercomparison of the model systems5
The strength of the diurnal variation in ozone is represented by the peak-to-valley dif-ference DO3
which is defined by Eq. (2) for each grid point where O3,max refers to themaximum, O3,min to the minimum ozone VMR during a day (00:00 to 24:00 UT).
DO3= O3,max −O3,min (2)
DO3is the interval width of the ozone values of a day and depends on the amplitudes10
of the diurnal and subdiurnal variations without any information about timing. Further,we often discuss monthly means of relative diurnal variation DO3,m/O3,m where DO3,mand O3,m are the monthly means at a gridpoint.
Figure 2 shows zonal-mean DO3,m/O3,m for March, June, September and Decemberof 2012 as derived from the MACC reanalysis. The strengths of the diurnal ozone15
variation in Fig. 2 is presented for the pressure range from 1 to 50 hPa and all latitudes.Figure 2a and c displays diurnal ozone variation of more than 6.0 % (0.6 ppmv) abovethe 3 hPa pressure level in the tropics and below the 20 hPa pressure level in Marchand September. The diurnal variation of ozone in the upper stratosphere is based onphotochemistry (cf. Fig. 1) and hence is a function of latitude. The diurnal variation20
from the MACC reanalysis in the lower, tropical stratosphere is mostly based on Oxtransport related to vertical tidal winds and the strong vertical ozone gradient in thelower stratosphere as described by Sakazaki et al. (2013).
A further feature in March and September (Fig. 2a and c) are enhancements ofDO3,m/O3,m in the Arctic and Antarctic upper stratosphere of more than 15 % (1.0 ppmv)25
which are clearly separated from the tropical enhancement. These features are dueto dynamics at the Arctic and Antarctic and relate to advection effects. Aside these
32680
ACPD14, 32667–32708, 2014
Diurnal variation inozone derived from
MACC reanalysis andWACCM
A. Schanz et al.
Title Page
Abstract Introduction
Conclusions References
Tables Figures
J I
J I
Back Close
Full Screen / Esc
Printer-friendly Version
Interactive Discussion
Discussion
Paper
|D
iscussionP
aper|
Discussion
Paper
|D
iscussionP
aper|
maxima the MACC reanalysis shows also minima of diurnal ozone variation in Marchand September (Fig. 2a and c) of approximately 1.5 % (0.3 ppmv) at 10 hPa near theequator.
In the MACC reanalysis data, the diurnal variation of stratospheric ozone is en-hanced in June and December (Fig. 2b, d) at the Arctic and Antarctic polar circles5
(marked as magenta dashed lines). For instance, in Fig. 2b and d, the MACC reanaly-sis shows high values of diurnal ozone variation in the respective summer hemisphereof up to 16.9 % (1.3 ppmv) between the 2 and 5 hPa pressure levels at the polar cir-cle. This feature is based on the long sunshine duration at the polar circle in summerwhere ozone is accumulated during daytime to very high values. The MACC reanalysis10
accurately renders this feature of the stratospheric daily ozone cycle and assures itsstrength of reflecting photochemical induced diurnal ozone variation.
However, the global maximum in diurnal ozone variation in June (Fig. 2b) from theMACC reanalysis appears around 2 hPa in the Antarctic polar region and is approxi-mately 46.6 % (3.3 ppmv) which is a surprisingly high value. The Arctic and Antarctic15
stratosphere in winter is a dynamically dominated region and most of the diurnal ozonevariation relates to advection at different time scales. The MACC reanalysis capturesthe diurnal ozone variation from different origins as photochemistry and dynamics andgives an unprecedented global picture.
In a similar manner, Figs. 3 and 4 show zonal-mean DO3,m/O3,m for March, June,20
September and December as derived from simulations of the WACCM model and fromthe ERA-Interim reanalysis. With regard to the intercomparison to the MACC reanal-ysis and the ERA-Interim reanalysis the hourly WACCM output was down-sampled toa 6 hourly temporal resolution.
In the WACCM simulation, diurnal variation of stratospheric ozone is maximal in25
June and December at the polar circle of the summer hemisphere in between the 1and 5 hPa pressure levels. This strong photochemical features of up to approximately18.6 % (0.9 ppmv) can be clearly seen in Fig. 3b and d and are consistent to the resultsof the MACC reanalysis.
32681

ACPD14, 32667–32708, 2014
Diurnal variation inozone derived from
MACC reanalysis andWACCM
A. Schanz et al.
Title Page
Abstract Introduction
Conclusions References
Tables Figures
J I
J I
Back Close
Full Screen / Esc
Printer-friendly Version
Interactive Discussion
Discussion
Paper
|D
iscussionP
aper|
Discussion
Paper
|D
iscussionP
aper|
From the 2 to 5 hPa pressure level where photochemistry is important, the simulateddiurnal variation in ozone of WACCM is weaker than at the polar circles in summer.For instance, in March and September as shown in Fig. 3a and c the strength of thedaily ozone cycle is approximately 5 %. Exceptions are maxima of diurnal ozone vari-ation at 2 hPa and 80◦ latitude in the respective autumn hemisphere in Fig. 3a and c.5
These exceptions are artifacts of the strong diurnal variation due to photochemistry insummer.
Compared to the MACC reanalysis, the WACCM model underestimates all dynami-cally induced effects such as the diurnal ozone variation at the Arctic and Antarctic andin the lower, tropical stratosphere. The WACCM model shows strong effects of diurnal10
ozone variation only above 10 hPa which mostly are based on photochemistry. Thisstrongly indicates that the free-running WACCM model underestimates tidal winds inthe lower stratosphere which could be also due to the low horizontal resolution. Further,advection processes at diurnal and shorter time scales in the polar regions in winterare not adequately reflected in the WACCM simulation. On the other hand, WACCM15
and the MACC reanalysis are mutually consistent with diurnal ozone variation basedon photochemistry.
The ERA-Interim reanalysis does not consider locally time-dependent ozone photo-chemistry and hence can not render the strong diurnal ozone variation due to photo-chemistry at the polar circle in summer (Fig. 4b, d). The ERA-Interim reanalysis shows20
this feature at 2 hPa polewards of the polar circles with only 8.4 % (0.3 ppmv). At thispoint, the limit of the simplified, linear ozone system of the ERA-Interim reanalysis be-comes evident. Unsurprisingly, the ERA-Interim ozone system can not keep up withthe fully coupled CTMs of the MACC reanalysis and the WACCM model.
In the Arctic and Antarctic winter stratosphere the ERA-Interim reanalysis and the25
MACC reanalysis benefit from their strong dynamics assimilation systems. Such sys-tems give a good representation of the diurnal ozone variation due to advection pro-cesses. For instance, the ERA-Interim reanalysis shows a maximum in diurnal ozonevariation in June (Fig. 4b) at around 1 hPa of approximately 30.5 % (1.0 ppmv). This
32682

ACPD14, 32667–32708, 2014
Diurnal variation inozone derived from
MACC reanalysis andWACCM
A. Schanz et al.
Title Page
Abstract Introduction
Conclusions References
Tables Figures
J I
J I
Back Close
Full Screen / Esc
Printer-friendly Version
Interactive Discussion
Discussion
Paper
|D
iscussionP
aper|
Discussion
Paper
|D
iscussionP
aper|
feature can also be seen to a similar extent in the MACC reanalysis (Fig. 2b). TheERA-Interim reanalysis nicely reflects the diurnal variation of ozone based on advec-tion in the polar region in winter but also in the lower, tropical stratosphere.
Figure 5 gives a comprehensive overview of the diurnal ozone variations in theMACC reanalysis, the ERA-Interim reanalysis and WACCM at 5 hPa. It is evident that5
neither WACCM nor the ERA-Interim reanalysis can match all of the important charac-teristics which figure in the MACC reanalysis. WACCM fails in the polar winter strato-sphere where the ERA-Interim reanalysis agrees well with the MACC reanalysis. TheERA-Interim reanalysis fails in the polar summer stratosphere where WACCM agreeswell with MACC. Especially, WACCM and the MACC reanalysis show the strong diurnal10
ozone variation at the polar circle of approximately 0.8 ppmv (15 %) in summer and inaddition agree well on the seasonal timing of this feature. Contours in Fig. 5 depict thesunshine duration (dashed lines) and the solar zenith angle (solid lines) which governthe seasonal pattern of the photochemically induced diurnal variation.
The three model systems show different features of the diurnal variation in ozone15
based on their specific model composition. Eventually, it has been the weaknesses inphotochemistry or short term advection of WACCM and the ERA-Interim reanalysiswhich revealed the different origins of the diurnal ozone variation in the stratosphere.The MACC reanalysis combines the strengths of both and therefore gives an unprece-dented global picture on diurnal ozone variation in the stratosphere.20
3.3 The influence of horizontal resolution on WACCM simulations
The analysis of diurnal variation of ozone in the dynamically dominated polar regionin winter by WACCM questions the influence of horizontal resolution on the simulationresults. In Sect. 3.2 results from WACCM were presented at medium horizontal reso-lution of 1.9◦ latitude by 2.5◦ longitude. Here, the term “medium” is with respect to the25
higher horizontal resolution of the MACC reanalysis (T255 truncation with about 0.7◦
horizontal resolution; Inness et al., 2013). Diurnal variation of the stratospheric compo-sition in the polar winter region depends on the quality of the dynamical representation
32683

ACPD14, 32667–32708, 2014
Diurnal variation inozone derived from
MACC reanalysis andWACCM
A. Schanz et al.
Title Page
Abstract Introduction
Conclusions References
Tables Figures
J I
J I
Back Close
Full Screen / Esc
Printer-friendly Version
Interactive Discussion
Discussion
Paper
|D
iscussionP
aper|
Discussion
Paper
|D
iscussionP
aper|
in the model. This in turn highly depends on the implemented interaction processes ofthe atmospheric layers as tidal waves, planetary waves, gravity waves and atmosphericinstabilities such as sudden stratospheric warmings.
In order to test a different horizontal resolution of WACCM, a simulation was per-formed at the lower 4◦ latitude by 5◦ longitude resolution. Figure 6 exemplifies the rela-5
tive difference in ozone VMR from 18:00 to 06:00 UT relative to ozone VMR at 06:00 UTat 5 hPa for the low and the medium horizontal resolution. The figure presents a repre-sentative day of the Southern Hemisphere in winter. From Fig. 6 it can be deduced thatsimulated diurnal variation depends on the horizontal resolution in the following way:higher horizontal resolution results in enhanced diurnal variation in ozone at the polar10
region in winter.This result is in line with Richter et al. (2008) who showed that the gravity wave
parameterization at different horizontal resolutions of WACCM results in different vari-ability in the stratosphere. That means, whenever dynamics at diurnal and shortertimescales in the stratosphere are simulated with WACCM, it is important to consider15
the actual potential of the model. For instance, at the polar circle the medium resolutionis approximately 113 by 86 km which can solve many but not for all the gravity waves inthe atmosphere. For internally-generated gravity waves without a gravity wave param-eterization, simulations need to be performed at high horizontal and vertical resolution(e.g. T213 grid with about 60 km horizontal resolution and 300 m vertical resolution,20
Sato et al., 2009).From the results of Sect. 3.2 and different results of the two horizontal resolu-
tions (Fig. 6) it is inferred that neither the low nor the medium horizontal resolutionof WACCM can represent the features of diurnal variation in the polar winter region.WACCM with its internal gravity wave parametrization is tuned to model adequate25
mean flows and jets in the middle atmosphere and the simulation of diurnal variation inthe polar region in winter overstresses the prospects of the model.
32684
ACPD14, 32667–32708, 2014
Diurnal variation inozone derived from
MACC reanalysis andWACCM
A. Schanz et al.
Title Page
Abstract Introduction
Conclusions References
Tables Figures
J I
J I
Back Close
Full Screen / Esc
Printer-friendly Version
Interactive Discussion
Discussion
Paper
|D
iscussionP
aper|
Discussion
Paper
|D
iscussionP
aper|
3.4 Diurnal variation in the polar regions
The surprisingly strong diurnal variation in the polar regions is accessible by one of theNDACC’s instruments. The OZORAM microwave radiometer located at Ny-Ålesund,Svalbard (78.9◦N, 11.9◦ E) observes diurnally sampled ozone profiles at such highlatitudes in summer and winter.5
Figure 7 presents the mean diurnal ozone variation observed by the OZORAM mi-crowave radiometer in June 2011 at 5 hPa along with the corresponding data of theMACC reanalysis and the ERA-Interim reanalysis. The figure shows the relative diur-nal variation according to Eq. (1). The diurnal ozone variation in Fig. 7 is based onphotochemistry and is up to approximately 8 % for the WACCM model and the OZO-10
RAM radiometer which are almost perfectly consistent. The MACC reanalysis showseven stronger diurnal variation in ozone of up to 10 %.
Figure 8 shows diurnal ozone variation from OZORAM measurements during twoperiods: 21–26 June 2011 and 1–6 December 2012. The figure presents the ozonetime series of OZORAM per mean ozone of the two periods, respectively. The MACC15
reanalysis and OZORAM measurements agree well (mostly within the error range ofOZORAM) during the summer period in June 2011 (Fig. 8a). Again, the diurnal ozonevariation is based on photochemistry and shows similar characteristics as in Fig. 7.Figures 7 and 8a confirm the strong diurnal ozone variations around the polar circlein summer which form in the MACC reanalysis and in the independent observations of20
the OZORAM microwave radiometer. However, the MACC reanalysis and OZORAM mi-crowave radiometer show poor agreement in ozone VMR (the MACC reanalysis showsup to 60 % more ozone VMR during the presented period).
The bottom panel of Fig. 8 displays OZORAM measurement in December 2012. TheOZORAM measurement and the MACC reanalysis show qualitative agreement mostly25
within the error range of the radiometer data. The diurnal ozone variation is superposedby variability at longer and sub-diurnal time scales. Thus, the dynamically dominatedpolar region in winter shows no clear diurnal signature in ozone variability at 5 hPa.
32685
ACPD14, 32667–32708, 2014
Diurnal variation inozone derived from
MACC reanalysis andWACCM
A. Schanz et al.
Title Page
Abstract Introduction
Conclusions References
Tables Figures
J I
J I
Back Close
Full Screen / Esc
Printer-friendly Version
Interactive Discussion
Discussion
Paper
|D
iscussionP
aper|
Discussion
Paper
|D
iscussionP
aper|
A view on the diurnal ozone variation in the Arctic and Antarctic is presented inFig. 9 from WACCM, the MACC reanalysis and ERA-Interim reanalysis. The relativedifference in ozone VMR from 18:00 to 06:00 UT relative to ozone VMR at 06:00 UT isshown at 5 hPa for 21 June 2012. WACCM is shown for the corresponding day of thesimulation. The WACCM model and the MACC reanalysis agree well in the Northern5
Hemisphere (summer) where photochemistry is dominating the diurnal ozone variation(Fig. 9a and b). In the Southern Hemisphere (winter) WACCM seems to fail in simu-lating vortex dynamics and related advection compared to the MACC reanalysis (cf.Fig. 9d, e). On the other hand, the ERA-Interim reanalysis agrees well with the MACCreanalysis in the polar region in winter (Southern Hemisphere, Fig. 9b, c) but does10
not reflect the diurnal ozone variation based on photochemistry in the polar region insummer (Northern Hemisphere, Fig. 9e, f).
Dynamics of the polar vortices and related advection cause strong, aperiodic ozonevariation in the polar region in winter. A useful quantity for studying synoptic variabil-ity of polar vortices is potential vorticity or shorter PV. Potential vorticity is often used15
to analyze vortex dynamics (e.g. Kew et al., 2009). The observed structure, the un-derstanding of vortex dynamics and the benefits of potential vorticity are reviewed byWaugh and Polvani (2010).
When potential vorticity is conserved, an air parcel moves along its potential vorticityisopleth. Further, it is assumed that the change of the ozone VMR in the air parcel20
is negligible over the period of a day in the polar winter stratosphere. Thus a diurnalchange in the potential vorticity isopleth would indicate a diurnal change in the trajec-tory which is associated to a diurnal change in ozone at a fixed geographic location(Danielson, 1961; McIntyre and Palmer, 1983; Coffey et al., 1999; McWilliams et al.,2003). Such colocated variations in potential vorticity and ozone indicate diurnal varia-25
tion in ozone based on vortex dynamics.The difference in potential vorticity in Fig. 10 is determined as the difference from
18:00 to 06:00 UT from the ERA-Interim reanalysis. The Antarctic polar vortex in Fig. 10shows stronger changes in potential vorticity than the midlatitudes and tropics. These
32686

ACPD14, 32667–32708, 2014
Diurnal variation inozone derived from
MACC reanalysis andWACCM
A. Schanz et al.
Title Page
Abstract Introduction
Conclusions References
Tables Figures
J I
J I
Back Close
Full Screen / Esc
Printer-friendly Version
Interactive Discussion
Discussion
Paper
|D
iscussionP
aper|
Discussion
Paper
|D
iscussionP
aper|
strong changes in potential vorticity correlate to ozone variability at the same timescale in Fig. 9e and f. This connection confirms that transport processes related to thedynamics of the stratospheric polar vortex evoke the strong diurnal ozone variation inthe polar winter.
The polar vortices in the stratosphere show day-to-day variability which manifest in5
elongation of the vortices and displacement from the poles (Waugh and Polvani, 2010).Tides and periodic gravity wave flux perturb the stratospheric vortex. The perturbedvortex forms vortex Rossby waves with typical spiral band structures of zonal wavenum-ber 2. Partly, these structures are visible in Fig. 10. To confirm the interconnection ofgravity waves to diurnal ozone variation in the polar region in winter further research10
based on highly resolved data is needed (e.g. ECMWF-T799, Yamashita et al., 2010).
4 Conclusions
The intercomparison of diurnal variation in ozone from reanalysis and chemistry–climate modelling shows a wide range of agreements but also differing features. Forinstance, the strong diurnal variation in ozone at the polar circle in summer as derived15
from the MACC reanalysis suites the global pattern of seasonality in diurnal ozone vari-ation of the WACCM model. Diurnal variation in stratospheric ozone is mostly basedon ozone accumulation due to the Chapman cycle over day time which is not entirelybalanced by catalytic ozone depletion. The ERA-Interim reanalysis with its linearized,two-dimensional photochemical ozone model does not reflect such diurnal variation of20
stratospheric ozone based on photochemistry.Differences also appear in the winter stratosphere where the free-running WACCM
model shows less diurnal variation than the MACC reanalysis and the ERA-Interimreanalysis. These variations depend to some extent on horizontal resolution of thefree-running WACCM model where higher resolutions show more variability. However,25
WACCM at either low and the medium resolution tends to underestimate the diurnalvariation of ozone in winter at high latitudes which are most likely based on vortex dy-
32687
ACPD14, 32667–32708, 2014
Diurnal variation inozone derived from
MACC reanalysis andWACCM
A. Schanz et al.
Title Page
Abstract Introduction
Conclusions References
Tables Figures
J I
J I
Back Close
Full Screen / Esc
Printer-friendly Version
Interactive Discussion
Discussion
Paper
|D
iscussionP
aper|
Discussion
Paper
|D
iscussionP
aper|
namics and related advection. Such variation occurs in the MACC reanalysis data andis up to 47 % in the upper stratosphere. The ECMWF ERA-Interim reanalysis confirmsthe large amplitudes of diurnal and subdiurnal variation in ozone at the stratosphericpolar vortex. From analysis of the potential vorticity structure we relate these effects todiurnal and subdiurnal vortex Rossby waves. Here, the present conception and under-5
standing of diurnal ozone variation in the stratosphere is widened by the novelty of thissurprisingly strong diurnal variation in the polar winter stratosphere.
In addition, the comparison to ECMWF’s ERA-Interim and WACCM substantiates thebenefits of a coupled CTM as in the MACC reanalysis system for the representationof the diurnal variation in stratospheric ozone. Our intercomparison study indicates the10
potential of the MACC reanalysis for an accurate description of the advection and thephotochemical effects on the diurnal variation of stratospheric ozone while the ERAInterim reanalysis and free-running WACCM either fail for the photochemical effects orthe diurnal advection effects.
The results show how gathering and preparation of data by the affiliated ground15
stations of the NDACC network yields additional value for atmospheric research andvalidation of the MACC reanalysis model system. Ground-based microwave radiom-etry is an important observation method for diurnal variation of stratospheric ozone.Partly, it was possible to validate the different model systems by NDACC observations.Therefore, further measurements of diurnal ozone variation in the polar regions as per-20
formed by Palm et al. (2013) are desirable to confirm and study the behaviour of diurnalvariation in ozone at different seasons in Arctic and Antarctic. For instance, the recentstart-up of the campaign instrument GROMOS-C (Fernandez et al., 2014) makes po-lar stratospheric ozone and its diurnal variation more accessible to ground-based mi-crowave radiometry and could extend the global sampling of local ozone profiles. In25
addition, microwave instruments might benefit from reanalysis data with higher tempo-ral resolution in order to validate and improve retrievals which focus on subdiurnal timescales.
32688
ACPD14, 32667–32708, 2014
Diurnal variation inozone derived from
MACC reanalysis andWACCM
A. Schanz et al.
Title Page
Abstract Introduction
Conclusions References
Tables Figures
J I
J I
Back Close
Full Screen / Esc
Printer-friendly Version
Interactive Discussion
Discussion
Paper
|D
iscussionP
aper|
Discussion
Paper
|D
iscussionP
aper|
Interesting results emerged from simulations at different horizontal resolutions of theWACCM model. In dynamically dominated regions as the polar night region, ozonevariation at diurnal and shorter time scales depends on an accurate representationof dynamics at short time scales. This in turn is based on the implementation of at-mospheric processes which interact between the atmospheric layers such as gravity5
waves, 2-days waves and sudden stratospheric warmings. We suspect that also otherchemistry–climate models may have similar weaknesses and advised application tosuch short time scales is recommended.
Despite a suboptimal temporal resolution, the MACC reanalysis system impressivelyshowed dynamical and photochemical features of diurnal variation in ozone at all lati-10
tudes and seasons. On this account, such a model system of chemical data integrationand assimilated dynamics shows great promise for preprocessing diurnally sampledozone data from space-borne instruments and correct potential biases in ozone trends.The diurnally sampled observations might be assimilated and reanalyzed with a cou-pled chemical transport model under consideration of a higher temporal resolution.15
Acknowledgements. The research leading to these results has received funding from the Eu-ropean Community’s Seventh Framework Programme ([FP7/2007–2013]) under grant agree-ment no. 284421 (see Article II.30. of the Grant Agreement). We acknowledge the MACC-IIconsortium, ECMWF for access to the ERA-Interim reanalysis data, the International SpaceScience Institute at Bern, Switzerland (ISSI Team #246, Characterizing Diurnal Variations of20
Ozone for Improving Ozone Trend Estimates, http://www.issibern.ch/teams/ozonetrend/) andthe MeteoSwiss project MIMAH in the frame of GAW. Further, we thank L. Moreira Méndez forconsultations on GROMOS data. The OZORAM measurements at the AWIPEV research basehave been supported by the AWI Bremerhaven and the ’Deutsche Forschungsgemeinschaft’(DFG) in the projects NO 404/5-1, NO 404/5-2, NO 404/5-3.25
32689

ACPD14, 32667–32708, 2014
Diurnal variation inozone derived from
MACC reanalysis andWACCM
A. Schanz et al.
Title Page
Abstract Introduction
Conclusions References
Tables Figures
J I
J I
Back Close
Full Screen / Esc
Printer-friendly Version
Interactive Discussion
Discussion
Paper
|D
iscussionP
aper|
Discussion
Paper
|D
iscussionP
aper|
References
Bhartia, P. K., McPeters, R. D., Flynn, L. E., Taylor, S., Kramarova, N. A., Frith, S., Fisher, B.,and DeLand, M.: Solar Backscatter UV (SBUV) total ozone and profile algorithm, Atmos.Meas. Tech., 6, 2533–2548, doi:10.5194/amt-6-2533-2013, 2013. 32670, 32678
Cariolle, D. and Déqué, M.: Southern Hemisphere medium-scale waves and total ozone dis-5
turbances in a spectral General Circulation model, J. Geophys. Res., 91, 10825–10846,doi:10.1029/JD091iD10p10825, 1986. 32674
Cariolle, D. and Teyssèdre, H.: A revised linear ozone photochemistry parameterization for usein transport and general circulation models: multi-annual simulations, Atmos. Chem. Phys.,7, 2183–2196, doi:10.5194/acp-7-2183-2007, 2007. 32674, 3269710
Chehade, W., Weber, M., and Burrows, J. P.: Total ozone trends and variability during 1979–2012 from merged data sets of various satellites, Atmos. Chem. Phys., 14, 7059–7074,doi:10.5194/acp-14-7059-2014, 2014. 32670
Coffey, M. T., Mankin, W. G., and Hannigan, J. W.: A reconstructed view of polar stratosphericchemistry, J. Geophys. Res., 104, 8296–8316, doi:10.1029/1998JD100045, 1999. 3268615
Courtier, P.: Dual formulation of four-dimensional variational assimilation, Q. J. Roy. Meteor.Soc., 123, 2449–2461, 1997. 32673
Courtier, P., Thépaut, J.-N., and Hollingsworth, A.: A strategy for operational implementationof 4-D-Var, using an incremental approach, Q. J. Roy. Meteor. Soc., 120, 1367–1388, 1994.3267320
Crutzen, P. J. and Schmailzl, U.: Chemical budgets of the stratosphere, Planet. Space Sci., 31,1009–1032, doi:10.1016/0032-0633(83)90092-2, 1983. 32680
Danielsen, E. F.: Trajectories: isobaroc, isentropic, and actual, J. Meteorol., 18, 479–486, 1961.32686
Dee, D. P., Uppala, S. M, Simmons, A. J., Berrisford, P., Poli, P., Kobayashi, S., Andrae, U.,25
Balmaseda, M. A., Balsamo, G., Bauer, P., Bechtold, P., Beljaars, A. C. M., van de Berg, L.,Bidlot, J., Bormann, N., Delsol, C., Dragani, R., Fuentes, M., Geer, A. J., Haimberger, L.,Healy, S. B., Hersbach, H., Hólm, E. V., Isaksen, L., Kållberg, P., Köhler, M., Matricardi, M.,McNally, A. P., Monge-Sanz, B. M., Morcrette, J.-J., Park, B.-K., Peubey, C., de Rosnay, P.,Tavolato, C., Thépaut, J.-N., and Vitartm, F.: The ERA-Interim reanalysis: confiduration and30
performance of the data assimilation system, Q. J. Royal Meteor. Soc., 137, 553–597,doi:10.1002/qj.828, 2011. 32673, 32674, 32697
32690
ACPD14, 32667–32708, 2014
Diurnal variation inozone derived from
MACC reanalysis andWACCM
A. Schanz et al.
Title Page
Abstract Introduction
Conclusions References
Tables Figures
J I
J I
Back Close
Full Screen / Esc
Printer-friendly Version
Interactive Discussion
Discussion
Paper
|D
iscussionP
aper|
Discussion
Paper
|D
iscussionP
aper|
Dragani, R.: On the quality of the ERA-Interim ozone reanalyses: comparisons with satellitedata, Q. J. Roy. Meteor. Soc., 127, 1312–1326, doi:10.1002/qj.821, 2011. 32674, 32697
Dumitru, M. C., Hocke, K., Kämpfer, N., and Calisesi, Y: Comparison and validation studiesrelated to ground-based microwave observations of ozone in the stratosphere and meso-sphere, J. Atmos. Sol.-Terr. Phy., 68, 745–756, doi:10.1016/j.jastp.2005.11.001, 2006. 326765
Duncan, B. N., Strahan, S. E., Yoshida, Y., Steenrod, S. D., and Livesey, N.: Model study ofthe cross-tropopause transport of biomass burning pollution, Atmos. Chem. Phys., 7, 3713–3736, doi:10.5194/acp-7-3713-2007, 2007. 32671
Fernandez, S., Murk, A., and Kämpfer, N.: Design and characterization of a peltier-coldcalibration target for a 110-GHz radiometer, IEEE T. Geosci Remote, 53, 344–351,10
doi:10.1109/TGRS.2014.2322336, 2014. 32688Flemming, J., Inness, A., Flentje, H., Huijnen, V., Moinat, P., Schultz, M. G., and Stein, O.:
Coupling global chemistry transport models to ECMWF’s integrated forecast system, Geosci.Model Dev., 2, 253–265, doi:10.5194/gmd-2-253-2009, 2009. 32672
Flury, T., Hocke, K., Haefele, A., Kämpfer, N., and Lehmann, R.: Ozone depletion, water vapor15
increase, and PSC generation at midlatitudes by the 2008 major stratospheric warming, J.Geophys. Res., 114, D18302, doi:10.1029/2009JD011940, 2009. 32677
Garcia, R. R., Marsh, D. R., Kinnison, D. E., Boville, B. A., and Sassi, F.: Simulation ofsecular trends in the middle atmosphere, 1950–2003, J. Geophys. Res., 112, D09301,doi:10.1029/2006JD007485, 2007. 32675, 3269720
Garny, H., Bodeker, G. E., Smale, D., Dameris, M., and Grewe, V.: Drivers of hemisphericdifferences in return dates of mid-latitude stratospheric ozone to historical levels, Atmos.Chem. Phys., 13, 7279–7300, doi:10.5194/acp-13-7279-2013, 2013. 32670
Gebhardt, C., Rozanov, A., Hommel, R., Weber, M., Bovensmann, H., Burrows, J. P., De-genstein, D., Froidevaux, L., and Thompson, A. M.: Stratospheric ozone trends and vari-25
ability as seen by SCIAMACHY from 2002 to 2012, Atmos. Chem. Phys., 14, 831–846,doi:10.5194/acp-14-831-2014, 2014. 32670
Geer, A. J., Lahoz, W. A., Jackson, D. R., Cariolle, D., and McCormack, J. P.: Evaluation of lin-ear ozone photochemistry parametrizations in a stratosphere-troposphere data assimilationsystem, Atmos. Chem. Phys., 7, 939–959, doi:10.5194/acp-7-939-2007, 2007. 3267430
Goncharenko, L. P., Coster, A. J., Plumb, R. A., and Domeisen, D. I. V.: The potential role ofstratospheric ozone in the stratosphere-ionosphere coupling during stratospheric warmings,Geophys. Res. Lett., 39, L08101, doi:10.1029/2012GL051261, 2012. 32674
32691
ACPD14, 32667–32708, 2014
Diurnal variation inozone derived from
MACC reanalysis andWACCM
A. Schanz et al.
Title Page
Abstract Introduction
Conclusions References
Tables Figures
J I
J I
Back Close
Full Screen / Esc
Printer-friendly Version
Interactive Discussion
Discussion
Paper
|D
iscussionP
aper|
Discussion
Paper
|D
iscussionP
aper|
Haefele, A., Hocke, K., Kämpfer, N., Keckhut, P., Marchand, M., Bekki, S., Morel, B.,Egorova, T., and Rozanov, E.: Diurnal changes in middle atmospheric H20 and O3: ob-servations in the alpine region and climate models, J. Geophys. Res., 113, D17303,doi:10.1029/2008JD009892, 2008.
Hocke, K., Kämpfer, N., Ruffieux, D., Froidevaux, L., Parrish, A., Boyd, I., von Clarmann, T.,5
Steck, T., Timofeyev, Y. M., Polyakov, A. V., and Kyrölä, E.: Comparison and synergy of strato-spheric ozone measurements by satellite limb sounders and the ground-based microwaveradiometer SOMORA, Atmos. Chem. Phys., 7, 4117–4131, doi:10.5194/acp-7-4117-2007,2007. 32677
Hocke, K., Studer, S., Martius, O., Scheiben, D., and Kämpfer, N.: A 20-day period10
standing oscillation in the northern winter stratosphere, Ann. Geophys., 31, 755–764,doi:10.5194/angeo-31-755-2013, 2013. 32674, 32677
Inness, A., Baier, F., Benedetti, A., Bouarar, I., Chabrillat, S., Clark, H., Clerbaux, C., Coheur, P.,Engelen, R. J., Errera, Q., Flemming, J., George, M., Granier, C., Hadji-Lazaro, J., Huij-nen, V., Hurtmans, D., Jones, L., Kaiser, J. W., Kapsomenakis, J., Lefever, K., Leitão, J.,15
Razinger, M., Richter, A., Schultz, M. G., Simmons, A. J., Suttie, M., Stein, O., Thépaut, J.-N.,Thouret, V., Vrekoussis, M., Zerefos, C., and the MACC team: The MACC reanalysis: an 8 yrdata set of atmospheric composition, Atmos. Chem. Phys., 13, 4073–4109, doi:10.5194/acp-13-4073-2013, 2013. 32672, 32673, 32683, 32697
Jonsson, A. I., Fomichev, V. I., and Shepherd, T. G.: The effect of nonlinearity in CO2 heat-20
ing rates on the attribution of stratospheric ozone and temperature changes, Atmos. Chem.Phys., 9, 8447–8452, doi:10.5194/acp-9-8447-2009, 2009. 32670
Kew, S. F., Sprenger, M., and Davies, H. C.: Potential vorticity anomalies of the low-ermost stratosphere: a 10-yr winter climatology, Mon. Weather Rev., 138, 1234–1249,doi:10.1175/2009MWR3193.1, 2009. 3268625
Kikuchi, K., Nishibori, T., Ochiai, S., Ozeki, H., Irimajiri, Y., Kasai, Y., Koike, M., Manabe, T.,Mizukoshi, K., Murayama, Y., Nagahama, T., Sano, T., Sato, R., Seta, M., Takahashi, C.,Takayanagi, M., Masuko, H., Inatani, J., Suzuki, M., and Shiotani, M.: Overview and earlyresults of the Superconducting Submillimeter-Wave Limb-Emission Sounder (SMILES), J.Geophys. Res., 115, D23, doi:10.1029/2010JD014379, 2013. 32670, 3267530
Kinnison, D. E., Brasseur, G. P., Walters, S., Garcia, R. R., Marsh, D. R., Sassi, F., Harvey, V. L.,Randall, C. E., Emmons, L., Lamarque, J. F., Hess, P., Orlando, J. J., Tie, X. X., Randel, W.,Pan, L. L., Gettelman, A., Granier, C., Diehl, T., Niemeier, U., and Simmons, A. J.: Sensi-
32692
ACPD14, 32667–32708, 2014
Diurnal variation inozone derived from
MACC reanalysis andWACCM
A. Schanz et al.
Title Page
Abstract Introduction
Conclusions References
Tables Figures
J I
J I
Back Close
Full Screen / Esc
Printer-friendly Version
Interactive Discussion
Discussion
Paper
|D
iscussionP
aper|
Discussion
Paper
|D
iscussionP
aper|
tivity of chemical tracers to meteorological parameters in the MOZART-3 chemical transportmodel, J. Geophys. Res., 112, D20302, doi:10.1029/2006JD007879, 2007. 32672, 32675
Kreyling, D., Sagawa, H., Wohltmann, I., Lehmann, R., and Kasai, Y.: SMILES zonal anddiurnal variation climatology of stratospheric and mesospheric trace gasses: O3, HCl,HNO3, ClO, BrO, HOCl, HO2, and temperature, J. Geophys. Res., 118, 11888–11903,5
doi:10.1002/2012JD019420, 2013. 32676, 32679Kuribayashi, K., Sagawa, H., Lehmann, R., Sato, T. O., and Kasai, Y.: Direct estimation of the
rate constant of the reaction ClO+HO2→ HOCl+O2 from SMILES atmospheric observa-tions, Atmos. Chem. Phys., 14, 255–266, doi:10.5194/acp-14-255-2014, 2014. 32676
Kyrölä, E., Laine, M., Sofieva, V., Tamminen, J., Päivärinta, S.-M., Tukiainen, S., Zawodny, J.,10
and Thomason, L.: Combined SAGE II–GOMOS ozone profile data set for 1984–2011 andtrend analysis of the vertical distribution of ozone, Atmos. Chem. Phys., 13, 10645–10658,doi:10.5194/acp-13-10645-2013, 2013. 32670
Marsh, D. R., Garcia, R. R., Kinnison, D. E., Boville, B. A., Walters, S., Matthes, K., andSolomon, S. C.: Modeling the whole atmosphere response to solar cycle changes in radia-15
tive and geomagnetic forcing, J. Geophys. Res., 112, D23306, doi:10.1029/2006JD008306,2007. 32675, 32697
McIntyre, M. E. and Palmer, T., N.: Breaking planetary waves in the stratosphere, Nature, 305,593–600, doi:10.1038/305593a0, 1983. 32686
McWilliams, J. C., Graves, L. P., and Montgomery, M. T.: A formal theory for20
vortex Rossby waves and vortex evolution, Geophys. Astro. Fluid, 97, 275–309,doi:10.1080/0309192031000108698, 2003. 32686
Oman, L. D., Ziemke, J. R., Douglass, A. R., Waugh, D. W., Lang, C., Rodriguez, J. M., andNielson, J. E.: The response of tropical tropospheric ozone to ENSO, Geophys. Res. Lett.,38, L13706, doi:10.1029/2011GL047865, 2011. 3267125
Palm, M., Hoffmann, C. G., Golchert, S. H. W., and Notholt, J.: The ground-based MW radiome-ter OZORAM on Spitsbergen – description and status of stratospheric and mesospheric O3-measurements, Atmos. Meas. Tech., 3, 1533–1545, doi:10.5194/amt-3-1533-2010, 2010.32677
Palm, M., Golchert, S. H. W., Sinnhuber, M., Hochschild, G., and Notholt, J.: Influence of solar30
radiation on the diurnal and seasonal variability of O3 and H2O in the stratosphere andlower mesosphere, based on continuous observations in the tropics and the high arctic, in:Climate and Weather of the Sun-Earth System (CAWSES), Springer Atmospheric Sciences
32693

ACPD14, 32667–32708, 2014
Diurnal variation inozone derived from
MACC reanalysis andWACCM
A. Schanz et al.
Title Page
Abstract Introduction
Conclusions References
Tables Figures
J I
J I
Back Close
Full Screen / Esc
Printer-friendly Version
Interactive Discussion
Discussion
Paper
|D
iscussionP
aper|
Discussion
Paper
|D
iscussionP
aper|
Publisher: Springer Netherlands, 125–147, doi:10.1007/978-94-007-4348-9_8, 2013. 32670,32688
Parrish, A., Connor, B. J., Tsou, J. J., McDermid, I. S., and Chu, W. P.: Ground-based microwave monitoring of stratospheric ozone, J. Geophys. Res., 97, 2541–2546,doi:10.1029/91JD02914, 1992. 326775
Parrish, A., Boyd, I. S., Nedoluha, G. E., Bhartia, P. K., Frith, S. M., Kramarova, N. A., Con-nor, B. J., Bodeker, G. E., Froidevaux, L., Shiotani, M., and Sakazaki, T.: Diurnal varia-tions of stratospheric ozone measured by ground-based microwave remote sensing at theMauna Loa NDACC site: measurement validation and GEOSCCM model comparison, At-mos. Chem. Phys., 14, 7255–7272, doi:10.5194/acp-14-7255-2014, 2014. 32670, 32671,10
32677, 32678Phillips, N. A.: A coordinate system having some special advantages for numerical forecast-
ing, J. Meteorol., 14, 184–185, 1957. 32673, 32674, 32675Rabier, F., Järvinen, H., Klinker, E., Mahfouf, J.-F., and Simmons, A.: The ECMWF operational
implementation of four-dimensional variational assimilation. I: Experimental results with sim-15
plified physics, Q. J. Roy. Meter. Soc., 126, 1143–1170, doi:10.1002/qj.49712656415, 2000.32674
Redler, R., Valcke, S., and Ritzdorf, H.: OASIS4 – a coupling software for next generation earthsystem modelling, Geosci. Model Dev., 3, 87–104, doi:10.5194/gmd-3-87-2010, 2010. 32672
Richter, J. H., Sassi, F., Garcia, R. R., Matthes, K., and Fischer, C. A.: Dynamics of the middle20
atmosphere as simulated by the Whole Atmosphere Community Climate Model, version 3(WACCM3), J. Geophys. Res., 113, D08101, doi:10.1029/2007JD009269, 2008. 32684
Rodgers, C. D.: Inverse Methods for Atmospheric Sounding, World Scientific Publishing Co.Pte. Ltd., Singapore, 2000. 32678
Sakazaki, T., Fujiwara, M., Zhang, X., Hagan, M. E., and Forbes, J. M.: Diurnal tides from the25
troposphere to the lower mesosphere as deduced from TIMED/SABER satellite data and sixglobal reanalysis data sets, J. Geophys. Res., 117, D13108, doi:10.1029/2011JD017117,2012. 32676
Sakazaki, T., Fujiwara, M., Mitsuda, C., Imai, K., Manago, N., Naito, Y., Nakamura, T.,Akiyoshi, H., Kinnison, D., Sano, T., Suzuki, M., and Shiotani, M.: Diurnal ozone variations30
in the stratosphere revealed in observations from the Superconducting Submillimeter-WaveLimb-Emission Sounder (SMILES) on board the International Space Station (ISS), J. Geo-phys. Res., 118, 1–16, doi:10.1002/jgrd.50220, 2013. 32670, 32671, 32676, 32678, 32680
32694

ACPD14, 32667–32708, 2014
Diurnal variation inozone derived from
MACC reanalysis andWACCM
A. Schanz et al.
Title Page
Abstract Introduction
Conclusions References
Tables Figures
J I
J I
Back Close
Full Screen / Esc
Printer-friendly Version
Interactive Discussion
Discussion
Paper
|D
iscussionP
aper|
Discussion
Paper
|D
iscussionP
aper|
Sato, K., Watanabe, S., Kawatani, Y., Tomikawa, Y., Miyazaki, K., and Takahashi, M.:On the origin of mesospheric gravity waves, Geophys. Res. Lett., 36, L19801,doi:10.1029/2009GL039908, 2009. 32684
Sato, T. O., Sagawa, H., Yoshida, N., and Kasai, Y.: Vertical profile of δ18OOO from the middlestratosphere to lower mesosphere from SMILES spectra, Atmos. Meas. Tech., 7, 941–958,5
doi:10.5194/amt-7-941-2014, 2014. 32676Schanz, A., Hocke, K., and Kämpfer, N.: Daily ozone cycle in the stratosphere: global, regional
and seasonal behaviour modelled with the Whole Atmosphere Community Climate Model,Atmos. Chem. Phys., 14, 7645–7663, doi:10.5194/acp-14-7645-2014, 2014. 32670, 32671
Stein, O., Flemming, J., Inness, A., Kaiser, J. W., Schultz, M. G.: Global reactive gases fore-10
cast and reanalysis in the MACC project, J. Integr. Envi. Sci., 9, Supplement 1, 57–70,doi:10.1080/1943815X.2012.696545, 2012. 32672
Strahan, S. E., Duncan, B. N., and Hoor, P.: Observationally derived transport diagnostics forthe lowermost stratosphere and their application to the GMI chemistry and transport model,Atmos. Chem. Phys., 7, 2435–2445, doi:10.5194/acp-7-2435-2007, 2007. 3267115
Studer, S., Hocke, K., Pastel, M., Godin-Beekmann, S., and Kämpfer, N.: Intercomparison ofstratospheric ozone profiles for the assessment of the upgraded GROMOS radiometer atBern, Atmos. Meas. Tech. Discuss., 6, 6097–6146, doi:10.5194/amtd-6-6097-2013, 2013.32670, 32674
Studer, S., Hocke, K., Schanz, A., Schmidt, H., and Kämpfer, N.: A climatology of the diurnal20
variations in stratospheric and mesospheric ozone over Bern, Switzerland, Atmos. Chem.Phys., 14, 5905–5919, doi:10.5194/acp-14-5905-2014, 2014. 32671, 32676, 32677
Talagrand, O. and Courtier, P.: Variational assimilation of meteorological observa-tions with the adjoint vorticity equation, Q. J. Roy. Meteor. Soc., 113, 1311–1328,doi:10.1002/qj.49711347812, 1987. 3267325
Tilmes, S., Kinnison, D. E., Garcia, R. R., Müller, R., Sassi, F., Marsh, D. R., andBoville, B. A.: Evaluation of heterogeneous processes in the polar lower stratospherein the Whole Atmosphere Community Climate Model, J. Geophys. Res., 112, D24301,doi:10.1029/2006JD008334, 2007. 32675
Waugh, D. W. and Polvani, L. M.: Stratospheric polar vortices, Geoph. Monog. Series, 190,30
43–57, doi:10.1029/2009GM000887, 2010. 32686, 32687
32695
ACPD14, 32667–32708, 2014
Diurnal variation inozone derived from
MACC reanalysis andWACCM
A. Schanz et al.
Title Page
Abstract Introduction
Conclusions References
Tables Figures
J I
J I
Back Close
Full Screen / Esc
Printer-friendly Version
Interactive Discussion
Discussion
Paper
|D
iscussionP
aper|
Discussion
Paper
|D
iscussionP
aper|
Yamashita, C., Liu, H.-L., and Chu, X.: Gravity wave variation during the 2009 stratosphericsudden warming as revealed by ECMWF-T799 and observations, Geophys. Res. Lett., 37,L22806, doi:10.1029/2010GL045437, 2010. 32687
32696
ACPD14, 32667–32708, 2014
Diurnal variation inozone derived from
MACC reanalysis andWACCM
A. Schanz et al.
Title Page
Abstract Introduction
Conclusions References
Tables Figures
J I
J I
Back Close
Full Screen / Esc
Printer-friendly Version
Interactive Discussion
Discussion
Paper
|D
iscussionP
aper|
Discussion
Paper
|D
iscussionP
aper|
Table 1. Overview on the implementation, data assimilation and resolution of the WACCM, theMACC reanalysis and ERA-Interim reanalysis model systems.
WACCM MACC reanalysis ERA-Interim reanalysis
model type Global Circulation-Chemistry Chemical Weather Forecast System Weather Forecast SystemModel (free-running)
model range global, 0–140 km global, 0–65 km global, 0–65 kmcoupling chemistry online←→ dynamics chemistry 60 min←→ dynamics humidity 30 min←→ dynamics
ozone30 min← dynamics
Dynamicsresolution 1.9◦ lat×2.5◦ lon, 66 lev T255: 0.7◦ lat×0.7◦ lon, 60 lev T255: 0.7◦ lat×0.7◦ lon, 60 levtime step 15 min IFS: 30 min IFS: 30 minassimilation – 4-D-VAR (12 h); v , p, T 4-D-VAR (12 h); v , p, T
Chemistrymodel 3-D MOZART 3-D MOZART linearized 2-D photochemical
(stratosphere) (tropo- and stratosphere) model, (lat-alt, no daily cycle)resolution same as Dynamics T159: 1.125◦ lat×1.125◦ lon, 60 lev same as Dynamics
Ozoneassimilation – 4-D-VAR (12 h); gases, aerosols 4-D-VAR (12 h); O3, humidity
tropo- and stratosphere tropo- and stratospheresources – e.g. GOME, MIPAS, MLS,... e.g. GOME, MIPAS, MLS,...
references Garcia et al. (2007) Inness et al. (2013) Dee et al. (2011); Dragani (2011)Marsh et al. (2007) Cariolle and Teyssèdre (2007)
32697

ACPD14, 32667–32708, 2014
Diurnal variation inozone derived from
MACC reanalysis andWACCM
A. Schanz et al.
Title Page
Abstract Introduction
Conclusions References
Tables Figures
J I
J I
Back Close
Full Screen / Esc
Printer-friendly Version
Interactive Discussion
Discussion
Paper
|D
iscussionP
aper|
Discussion
Paper
|D
iscussionP
aper|
Table 2. Forming of the morning minimum and the afternoon maximum for a mean day of Marchfrom model systems and the Mauna Loa and Bern microwave radiometers (MWRs) (morningminimum/afternoon maximum in percent).
Data set Bern, Switzerland Mauna Loa, Hawaii
MACC −0.8/3.2 % –/5.2 %ERA-Interim –/0.8 % –/–WACCM −0.8/1.9 % −0.7/2.5 %MWRs –/2.4 % −0.7/2.6 %SMILES –/3.8 % −1.7/6.9 %
32698
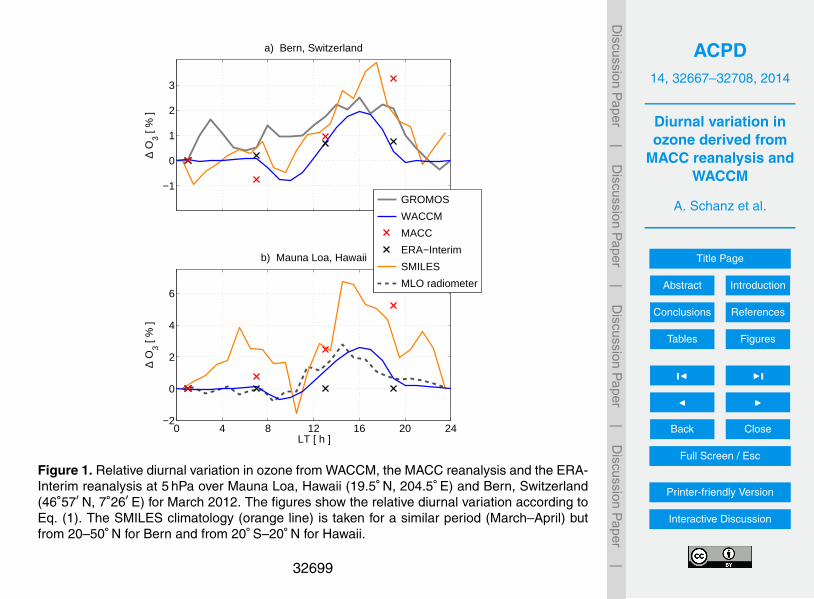
ACPD14, 32667–32708, 2014
Diurnal variation inozone derived from
MACC reanalysis andWACCM
A. Schanz et al.
Title Page
Abstract Introduction
Conclusions References
Tables Figures
J I
J I
Back Close
Full Screen / Esc
Printer-friendly Version
Interactive Discussion
Discussion
Paper
|D
iscussionP
aper|
Discussion
Paper
|D
iscussionP
aper|
−1
0
1
2
3
∆ O
3 [ %
]
a) Bern, Switzerland
0 4 8 12 16 20 24−2
0
2
4
6
∆ O
3 [ %
]
LT [ h ]
b) Mauna Loa, Hawaii
GROMOS
WACCM
MACC
ERA−Interim
SMILES
MLO radiometer
Figure 1. Relative diurnal variation in ozone from WACCM, the MACC reanalysis and the ERA-Interim reanalysis at 5 hPa over Mauna Loa, Hawaii (19.5◦ N, 204.5◦ E) and Bern, Switzerland(46◦57′ N, 7◦26′ E) for March 2012. The figures show the relative diurnal variation according toEq. (1). The SMILES climatology (orange line) is taken for a similar period (March–April) butfrom 20–50◦ N for Bern and from 20◦ S–20◦ N for Hawaii.
32699

ACPD14, 32667–32708, 2014
Diurnal variation inozone derived from
MACC reanalysis andWACCM
A. Schanz et al.
Title Page
Abstract Introduction
Conclusions References
Tables Figures
J I
J I
Back Close
Full Screen / Esc
Printer-friendly Version
Interactive Discussion
Discussion
Paper
|D
iscussionP
aper|
Discussion
Paper
|D
iscussionP
aper|
p [ h
Pa
]
a) March 2012
−90 −60 −30 0 30 60 90
1
2
3
5
10
20
30
50
DO
3,m
/ O
3,m
[ %
]
0
5
10
15
20
p [ h
Pa
]
b) June 2012
−90 −60 −30 0 30 60 90
1
2
3
5
10
20
30
50
DO
3,m
/ O
3,m
[ %
]
0
5
10
15
20
p [ h
Pa
]
c) September 2012
−90 −60 −30 0 30 60 90
1
2
3
5
10
20
30
50
DO
3,m
/ O
3,m
[ %
]
0
5
10
15
20
latitude [ deg ]
p [ h
Pa
]
d) December 2012
−90 −60 −30 0 30 60 90
1
2
3
5
10
20
30
50
DO
3,m
/ O
3,m
[ %
]
0
5
10
15
20
Figure 2. Zonal-mean DO3,m/O3,m derived from the MACC reanalysis. The figure showsmonthly means in the middle and upper stratosphere for March, June, September and De-cember of 2012 (according to Eq. 2, ff). The dashed, magenta lines refer to the polar circles.
32700

ACPD14, 32667–32708, 2014
Diurnal variation inozone derived from
MACC reanalysis andWACCM
A. Schanz et al.
Title Page
Abstract Introduction
Conclusions References
Tables Figures
J I
J I
Back Close
Full Screen / Esc
Printer-friendly Version
Interactive Discussion
Discussion
Paper
|D
iscussionP
aper|
Discussion
Paper
|D
iscussionP
aper|
p [ h
Pa
]
a) March
−90 −60 −30 0 30 60 90
1
2
3
5
10
20
30
50
DO
3,m
/ O
3,m
[ %
]
0
5
10
15
20
p [ h
Pa
]
b) June
−90 −60 −30 0 30 60 90
1
2
3
5
10
20
30
50
DO
3,m
/ O
3,m
[ %
]
0
5
10
15
20
p [ h
Pa
]
c) September
−90 −60 −30 0 30 60 90
1
2
3
5
10
20
30
50
DO
3,m
/ O
3,m
[ %
]
0
5
10
15
20
latitude [ deg ]
p [ h
Pa
]
d) December
−90 −60 −30 0 30 60 90
1
2
3
5
10
20
30
50
DO
3,m
/ O
3,m
[ %
]
0
5
10
15
20
Figure 3. Same as Fig. 2 but derived from the WACCM model.
32701

ACPD14, 32667–32708, 2014
Diurnal variation inozone derived from
MACC reanalysis andWACCM
A. Schanz et al.
Title Page
Abstract Introduction
Conclusions References
Tables Figures
J I
J I
Back Close
Full Screen / Esc
Printer-friendly Version
Interactive Discussion
Discussion
Paper
|D
iscussionP
aper|
Discussion
Paper
|D
iscussionP
aper|
p [ h
Pa
]
a) March 2012
−90 −60 −30 0 30 60 90
1
2
3
5
10
20
30
50
DO
3,m
/ O
3,m
[ %
]
0
5
10
15
20
p [ h
Pa
]
b) June 2012
−90 −60 −30 0 30 60 90
1
2
3
5
10
20
30
50
DO
3,m
/ O
3,m
[ %
]
0
5
10
15
20
p [ h
Pa
]
c) September 2012
−90 −60 −30 0 30 60 90
1
2
3
5
10
20
30
50
DO
3,m
/ O
3,m
[ %
]
0
5
10
15
20
latitude [ deg ]
p [ h
Pa
]
d) December 2012
−90 −60 −30 0 30 60 90
1
2
3
5
10
20
30
50
DO
3,m
/ O
3,m
[ %
]
0
5
10
15
20
Figure 4. Same as Fig. 2 but derived from the ERA-Interim reanalysis of the year 2012.
32702
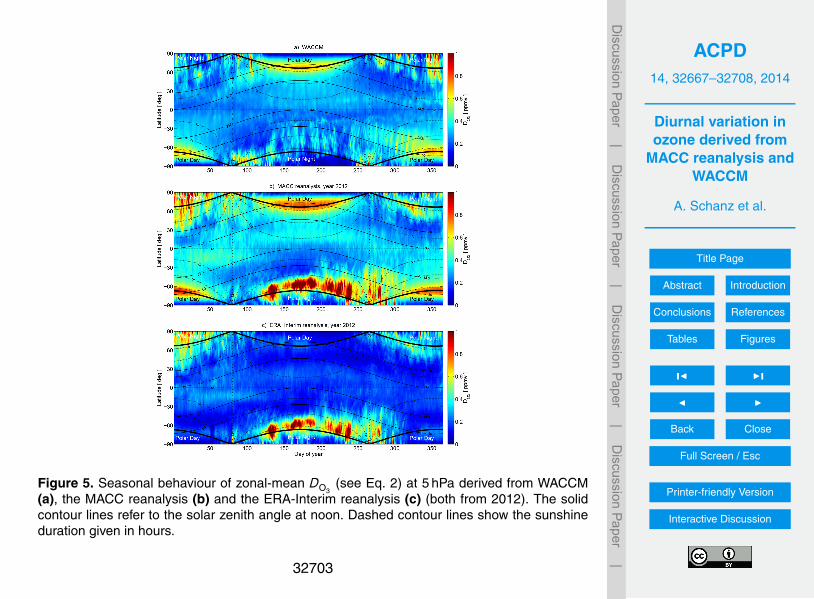
ACPD14, 32667–32708, 2014
Diurnal variation inozone derived from
MACC reanalysis andWACCM
A. Schanz et al.
Title Page
Abstract Introduction
Conclusions References
Tables Figures
J I
J I
Back Close
Full Screen / Esc
Printer-friendly Version
Interactive Discussion
Discussion
Paper
|D
iscussionP
aper|
Discussion
Paper
|D
iscussionP
aper|
Figure 5. Seasonal behaviour of zonal-mean DO3(see Eq. 2) at 5 hPa derived from WACCM
(a), the MACC reanalysis (b) and the ERA-Interim reanalysis (c) (both from 2012). The solidcontour lines refer to the solar zenith angle at noon. Dashed contour lines show the sunshineduration given in hours.
32703
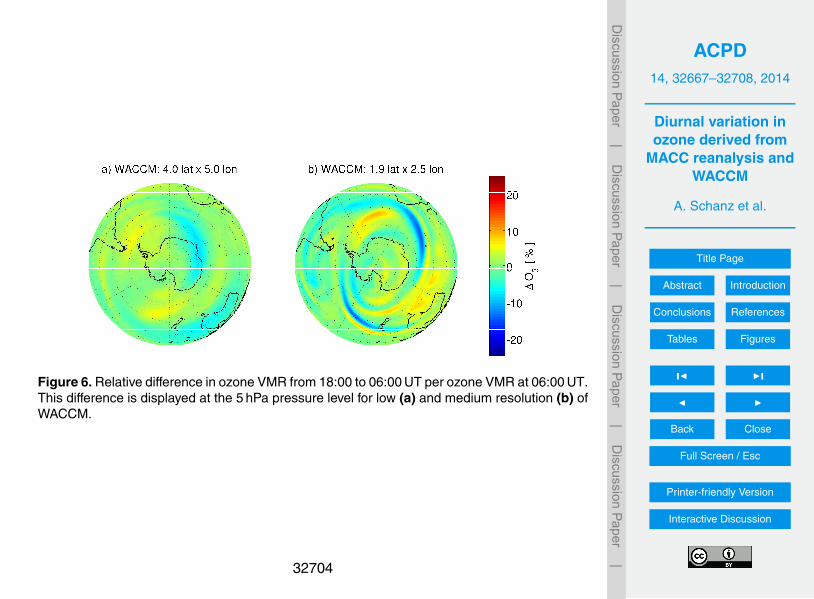
ACPD14, 32667–32708, 2014
Diurnal variation inozone derived from
MACC reanalysis andWACCM
A. Schanz et al.
Title Page
Abstract Introduction
Conclusions References
Tables Figures
J I
J I
Back Close
Full Screen / Esc
Printer-friendly Version
Interactive Discussion
Discussion
Paper
|D
iscussionP
aper|
Discussion
Paper
|D
iscussionP
aper|
Figure 6. Relative difference in ozone VMR from 18:00 to 06:00 UT per ozone VMR at 06:00 UT.This difference is displayed at the 5 hPa pressure level for low (a) and medium resolution (b) ofWACCM.
32704

ACPD14, 32667–32708, 2014
Diurnal variation inozone derived from
MACC reanalysis andWACCM
A. Schanz et al.
Title Page
Abstract Introduction
Conclusions References
Tables Figures
J I
J I
Back Close
Full Screen / Esc
Printer-friendly Version
Interactive Discussion
Discussion
Paper
|D
iscussionP
aper|
Discussion
Paper
|D
iscussionP
aper|
0 4 8 12 16 20 24
−4
0
4
8
∆ O
3 [ %
]
LT [ h ]
Ny−Alesund, Svalbard
WACCM MACC ERA−Interim OZORAM
Figure 7. Relative diurnal variation in ozone from WACCM (blue line), the MACC reanalysis(red markers), the ERA-Interim reanalysis (black markers) and from the OZORAM radiometer(gray line) at 5 hPa over Ny-Ålesund, Svalbard (78.9◦ N, 11.9◦ E). The figure shows the relativediurnal variation according to Eq. (1). The SMILES climatology does not cover the high latitudeof Ny-Ålesund.
32705

ACPD14, 32667–32708, 2014
Diurnal variation inozone derived from
MACC reanalysis andWACCM
A. Schanz et al.
Title Page
Abstract Introduction
Conclusions References
Tables Figures
J I
J I
Back Close
Full Screen / Esc
Printer-friendly Version
Interactive Discussion
Discussion
Paper
|D
iscussionP
aper|
Discussion
Paper
|D
iscussionP
aper|
06/21 06/22 06/23 06/24 06/25 06/26
−10
0
10
O3 /
O3,
m [
% ]
a) Summer period in June 2011
12/01 12/02 12/03 12/04 12/05 12/06−20
−10
0
10
20
date (mm/dd)
O3 /
O3,
m [
% ]
b) Winter period in December 2012
MACC
OZORAM
error range
Figure 8. Relative diurnal variation in ozone from the MACC reanalysis and the OZORAMradiometer at 5 hPa over Ny-Ålesund, Svalbard (78.9◦ N, 11.9◦ E) for a summer (a) and a winter(b) period (21–26 June 2011 and 1–6 December 2012). The figure shows the ozone time seriesof OZORAM per mean ozone O3,m of the two periods, respectively. The summer period is takenfrom 2011 due to technical problems of the instrument in summer 2012. The uncertainty rangestands for the combined random and systematic SD.
32706

ACPD14, 32667–32708, 2014
Diurnal variation inozone derived from
MACC reanalysis andWACCM
A. Schanz et al.
Title Page
Abstract Introduction
Conclusions References
Tables Figures
J I
J I
Back Close
Full Screen / Esc
Printer-friendly Version
Interactive Discussion
Discussion
Paper
|D
iscussionP
aper|
Discussion
Paper
|D
iscussionP
aper|
Figure 9. Relative difference of ozone VMR from 18:00 to 06:00 UT per ozone VMR at06:00 UT. The figure shows the polar regions from the MACC reanalysis and the ERA-Interimreanalysis at 21 June 2012 and from WACCM at 5 hPa.
32707

ACPD14, 32667–32708, 2014
Diurnal variation inozone derived from
MACC reanalysis andWACCM
A. Schanz et al.
Title Page
Abstract Introduction
Conclusions References
Tables Figures
J I
J I
Back Close
Full Screen / Esc
Printer-friendly Version
Interactive Discussion
Discussion
Paper
|D
iscussionP
aper|
Discussion
Paper
|D
iscussionP
aper|
Figure 10. Difference of potential vorticity from 18:00 to 06:00 UT derived from the ERA-Interimreanalysis for 21 June 2012 in the Southern Hemisphere at 5 hPa.
32708