District Factbook District Domestic Product (2013-14) (Rs. in Lakh) 21,36,686 At Current Price /...
33
-
Upload
hoangthien -
Category
Documents
-
view
218 -
download
5
Transcript of District Factbook District Domestic Product (2013-14) (Rs. in Lakh) 21,36,686 At Current Price /...


KarnatakaDistrict Factbook™
Udupi District
(Key Socio-economic Data of Udupi District, Karnataka)January, 2017

Editor & DirectorDr. R.K. Thukral
Research EditorDr. Shafeeq Rahman
Compiled, Researched and Published byDatanet India Pvt. Ltd.D-100, 1st Floor,Okhla Industrial Area, Phase-I,New Delhi-110020.Ph.: 91-11-43580781, 26810964-65-66Email : [email protected] : http://www.datanetindia-ebooks.com
Report No.: DFB/KA-569-0616
ISBN : 978-93-86277-74-9
First Edition : June, 2016Updated Edition : January, 2017
Price : Rs. 7500/- US$ 200
© 2017 Datanet India Pvt. Ltd.All right reserved. No part of this book may be reproduced, stored in a retrievalsystem or transmitted in any form or by any means, mechanical, photocopying,recording or otherwise without the prior written permission of the publisher.
Printed in India

Udupi District at a Glance
District came into Existence 24th August, 1997
District Headquarter Udupi
Distance from State Capital 399 Kms.
Geographical Area (In Square km.) 3,582 (Ranks 27th in State and 336th in India)Wastelands Area (In Square km.)(2008-2009)
181.45
Total Number of Households 2,46,313
Population 11,77,361 (Persons), 5,62,131 (Males), 6,15,230 (Females) (Ranks 23rd in Stateand 402nd in India)
Population Growth Rate (2001-2011)
5.85 (Persons), 7.64 (Males), 4.27 (Females)
Number of SubDistricts/Towns/Villages
Sub-districts (03), Towns (20) and Villages (233)
Forest Cover (2015) 56.16% of Total Geographical AreaPercentage of Urban/RuralPopulation
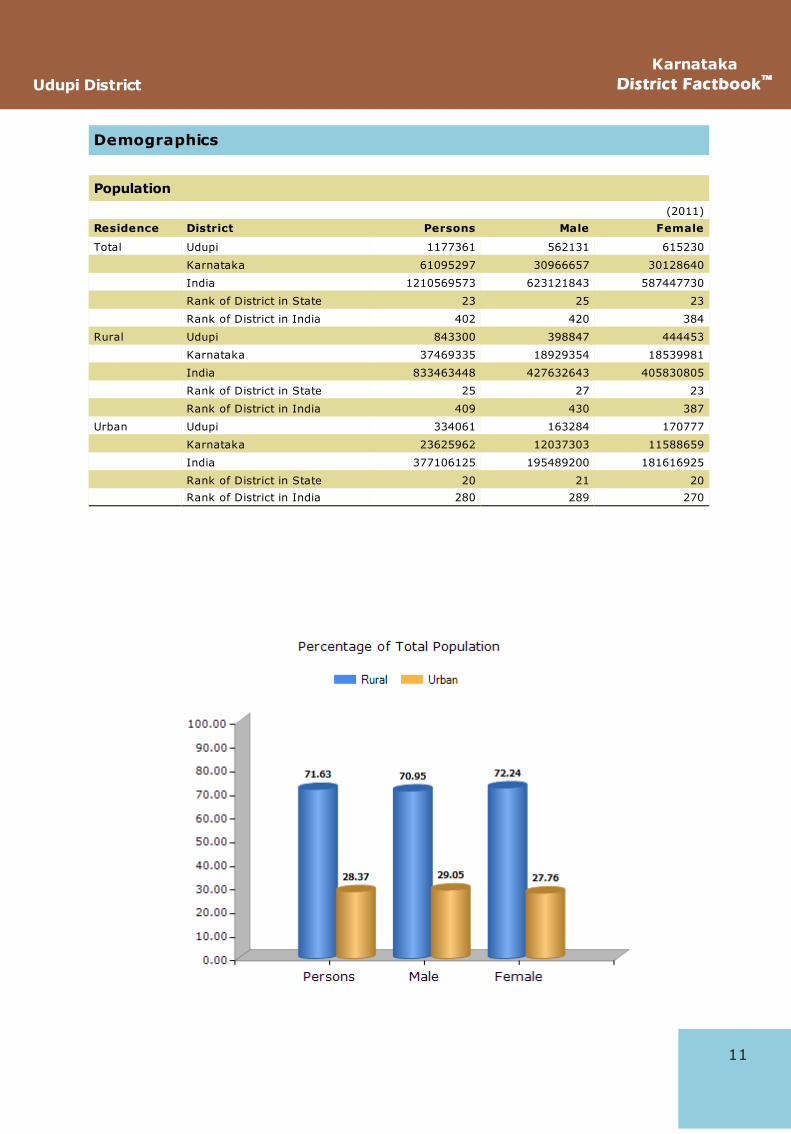
28.37 (Urban), 71.63 (Rural)
Administrative Language Kannada
Principal Languages (2001) Kannada (42.36%), Tulu (31.64%), Konkani (12.71%), Urdu (4.30%), Marathi(3.11%), Malayalam (2.85%) and Others (0.85%)
Population Density 329 (Persons per Sq. km.)
Sex Ratio 1094 (Females per 1000 Males)
Child Ratio (Age Group 0-6 Year) 958 (Females per 1000 Males)
Number of Live Births (2014) 19,558 (Persons), 10,482 (Males), 9,076 (Females)
Number of Deaths (2014) 10,761 (Persons), 6,898 (Males), 3,863 (Females)
Literacy Rate (In %age) 86.24 (Persons), 91.41 (Males), 81.58 (Females)
Literates 9,26,429 (Persons), 4,65,704 (Males), 4,60,725 (Females)
Illiterates 2,50,932 (Persons), 96,427 (Males), 1,54,505 (Females)
Major Religions Hindu (85.72%), Muslim (8.22%), Christian (5.59%), Jain (0.39%), Sikh (0.02%)and Buddhist (0.01%)
Schedule Caste Population 75,429 (Persons), 36,988 (Males), 38,441 (Females), Percentage of SC in TotalPopulation (0.72)
Major Schedule Caste Population Adi Dravida (52.63%); Moger (8.87%); Mundala (6.79%); Bhovi, Od, Odde,Vaddar, Waddar, Voddar, Woddar (4.31%); Bathada (3.13%)
Schedule Tribe Population 52,897 (Persons), 26,228 (Males), 26,669 (Females), Percentage of ST in TotalPopulation (1.24)
Major Schedule Tribe Population
Marati (in South Kanara district)e (63.96%); Koraga (16.95%); Naikda, Nayaka,Cholivala Nayaka, Kapadia Nayaka, Mota Nayaka, Nana Nayaka, Naik, Nayak,Beda, Bedar and Valmiki (9.18%); Malaikudi (3.14%); Bhil, Bhil Garasia, DholiBhil, Dungri Bhil, Dungri Garasia, Mewasi Bhil, Rawal Bhil, Tadvi Bhil, Bhagalia,Bhilala, Pawra, Vasava, Vasave (0.67%)
Number of Total Workers 5,13,241 (Persons), 3,35,399 (Males), 1,77,842 (Females)Labour Force Participation Rate(2011-2012)
53.11% (Rural), 41.92% (Urban)
Major Source of Income AgriculturalGross District Domestic Product(2013-14) (Rs. in Lakh)
21,36,686 At Current Price / 18,48,426 At Constant (2011-2012) Prices
Net District Domestic Product(2013-14) (Rs. in Lakh)
19,54,411 At Current Price / 16,81,201 At Constant (2011-2012) Prices
Per Capita Income (NDDP, At FactorCost) (2013-14) (In Rs.)
1,61,424 At Current Price / 1,38,858 At Constant (2011-12) Prices
Number of Tourists (2015) 61,92,672 (Domestic Tourist) / 1,283 (Foreign Tourist)
Major Tourist Places
Karkala, Maravanthe, Udupi, Attur, Padutirupathi Sree Venkataramana Temple,Attur St. Lawrence Church, Water Sports, Bijadi, Kundapur, Kaup Beach, Manipal,Pajaka, Shri Anjaneya Temple, Shri Brahmalingeshwara Temple, ShriChennakeshava Temple, Shri Durga Parameshwari Temple, Shri Guru NarasimhaTemple, Shri Mahathobhara Shree Mahalingeshwara Temple, Shri SitaramchandraTemple, Shri Vishnumurthy Temple, Shri Yele Mahalingeshwara Temple, SriLakshmi Ventkatarama Temple, Shri Kantheshwara Temple and PadmavatiTemple.
Note: A ll figures for 2011 Census, Otherwise year is mentioned.

No. Particulars Page No.
1 Administrative Setup 1-10
Location Map | District w ith Sub-Districts | Reference Map of District |About District | Administrative Unit | Villages | Towns | Wards |Panchayats
2 Demographics 11-34
Population l Sex Ratio | Density | Child Population | Child Sex Ratio |Decadal Growth | Age Group Population | Age Group Population ofCurrently Married | Economically Active Population | Ageing Population |Dependency Ratio | Single Year Age Population | Scheduled CastePopulation | Scheduled Tribe Population | Religious Population | CD BlockPopulation
3 Economy 35-47
GDP/NDP | Per Capita Income | Households by Income Groups |Disposable Income | Banking | Lead Banks | Investment and Debt | FairPrice Shops & Godown | Ration Cards Issued | Kerosene Dealers
4 Market Size 48-59
Monthly Per Capita Expenditure | Estimated Annual Expenditure /Average Per Capita Consumer Expenditure on Services and DurableGoods
5 Life Style 60-64
Households having Radio/Transistor, Television | Households havingComputer/Laptop/Internet | Households having Telephone/MobilePhone | Households having Bicycle, Scooter/Motor Cycle/Moped &Car/Jeep/Van | Circulation of Dailies | Cinema Theatres
6 Infrastructure 65-80
Occupied Houses used as Shops/Offices | Amenities | Sanitation | Roadlength | Vehicle Registered | Electricity | Telecommunication | Post Office& PIN Code | Tourism | LPG Distributors
7 Industries 81-114
Factories, Capital Invested and Persons Employed (2 & 3 digit levelIndustries) | Factories by Type of Organisation/Ownership |Consumption of Fuels | Manufacturing Industries Share of GDP |Outstanding Credit of SCBs according to Industrial Occupation |Factories and Workers Engaged | Micro, Small and Medium Enterprises |Cocoon & Silk | Liquor Shops | Ongoing Projects
8 Labour and Workforce 115-122
Total Workers | Main Workers | Marginal Workers | Non-Workers |Average Wages/Earning per Day Received by Usual Principal ActivityStatus | Employment Indicators
9 Agriculture 123-143
Land Utilistation | Production of Major Food Crops | Production ofCommercial Crops | Production of Fruit & Vegetable Crops | Productionof Spices | Sowing Seeds Distribution | Consumption of Fertilisers |Sericulture | Milk, Egg and Meat Production | Fisheries | VeterinaryInstitutions | Livestock Population | Poultry Population | Irrigation | LandHoldings | Regulated Markets | Farmer

10 Education 144-151
Literacy Rate | Population by Educational Level | Census Houses Usedas School/College etc. | Enrollment | Enrollment by Medium of Instruction| Gross/Net Enrollment Ratio | Teachers | Gini Coefficient Education |Population by Mother Tongue
11 Health 152-171
Health Institutions, Medical Staff and Beds | Live Births Registered | StillBirths Registered | Deaths Registered | Infant Deaths Registered |Immunisation | Family Planning Measures | National Health Programmes| Disabled Population by Type of Disability | Houses used forHospital/Dispensary | Households by Married Couples per Householdand Dwelling Rooms | Maternal and Child Health Indicators (HMIS) |District Level Household Health Indicators | Family Welfare Programmes |National Family Health Survey (NFHS)
12 Environment and Pollution 172-176
Geographical Area | Wastelands | Forest Cover | Rainfall | Latitude,Longitude and Altitude | Water Quality
13 Housing 177-188
Households | Houseless Households | Houseless Population | Standardof Living Index | Housing Condition | House and Their Uses | SlumPopulation
14 Crime & Law 189-194
Incidence of IPC Crime | Road Accidents | Police Stations | Prisons | FireStations | Police Officer/Officials | Judicial Officers
15 Social and Welfare Schemes 195-202
Mahatma Gandhi National Rural Employment Guarantee Scheme(MGNREGS) | Indira Awaas Yojana (IAY) | District Rural DevelopmentAgencies (DRDA) | National Rural Drinking Water Programme (NRDWP) |Nirmal Bharat Abhiyan (NBA) | Swachh Bharat Mission (SBM)-Gramin |Self-Help Groups (SHGs) | Aadhaar Card (UIDAI) Enrollments
16 Electoral 203-205
Vote Distribution of Major Parties (Parliamentary Election-2014 andAssembly Election 2013) | Name and Address of MPs/MLAs | Electors
17 Annexure - I to V 206-231
18 Useful Contacts 232
19 Abbreviations & Sources 233
20 Concepts and Definitions 234-237
21 Disclaimer & Terms of Use 238

KarnatakaDistrict FactbookDistrict Factbook™™ Udupi District

1
Udupi DistrictKarnataka
District FactbookDistrict Factbook™™
Administrative Setup
Location Map

KarnatakaDistrict FactbookDistrict Factbook™™ Udupi District
Administrative Setup
2

3
Udupi DistrictKarnataka
District FactbookDistrict Factbook™™
Administrative Setup

KarnatakaDistrict FactbookDistrict Factbook™™ Udupi District
4

5
Udupi DistrictKarnataka
District FactbookDistrict Factbook™™
About Udupi District
Historically, the name Udipi is the combination of two Sanskrit words Udu which means‘stars’ and Pa meaning ‘lord’. It is said that the name of Udupi was derived from its Tuluname Odipu. According to a story, the moon reduced its light due to curse by the kingDaksha. The moon restored its light with the blessing of Lord Shiva. The moon and hiswives created a Linga and prayed at Chandra Mouleeshwara temple at Udupi. Accordingto this story, therefore, Udupi means the land of the "lord of the stars," the moon.
Geographically, the district has total 3,582 sq. km . and occupies the ranks 27 th inState and 336 th in India. It lies at 13°33' N latitude, 74° 75' E longitude and 39maltitude. In the year 2015, the district covered 56.16% forest area of total geographicalarea. It is bounded by Uttara Kannada district in North, Dakshina Kannada district inSouth, Shivamogga district on North East, Chikkamagaluru district on East , Arabian Seaon West. It has tropical climate. The actual rainfall in the district was 3835.4 mm in theyear of 2015-16.
Administrative wise, the district is divided into 3 sub-districts, 20 towns and 233 villages.Kannada is its official language. The district of Udupi came into existence on the 24th
August, 1997 in the state of Karnataka with an allotted district code of 569. Its districtHeadquarter is at Udupi which is located at a distance of 399 km . from the StateCapital. There are 2 parliamentary and 5 assembly constituencies in the district.
Demographically, according to 2011 census, the district has a total number of 2,46,313households with a total of 11,77,361 of which 5,62,131 are males, and 6,15,230 arefemales and causing it to rank 23rd in the State and 402 nd in India. The populationgrowth rate during the period 2001 to 2011 was 5.85% of which 7.64% were males, and4.27% were females. The density of population of the district is 329 persons per sq km.The sex ratio is pegged at 1094 (females per 1000 males) while the child ratio stands at958 (females per 1000 males). The schedule caste population of the district is recordedas 75,429 of which 36,988 are males and 38,441 are females. The percentage ofSchedule Caste is 0.72%. The schedule tribe population is 52,897 of which 26,228 aremales of which 26,669 are females. The percentage of Schedule Tribe is 1.24%. Thepercentage of major religions practiced by the people of this region is Hindu at 85.72%and Muslim at 8.22%. According to 2001 census, the percentage of the principallanguages spoken in the region was Kannada at 42.36%, Tulu at 31.64% and Konkani at12.71%.
Economically, agriculture is the back bone of the district. It produces rice, coconut,Cashew and areca nut. The district also has a Karnataka Milk Federation (a dairy plant).It has both inland and deep sea fishing. Main centers for fishing are Malpe , Gangolli andArabian Sea. There are small-scale industries mainly such as some red clay tile(Mangalore tile), cashew nut, and coconut oil industries. Public sector banks namelyVijaya Bank, Canara Bank, Corporation Bank and Syndicate Bank are available here. Thedistrict also has home for some computer software companies like RobosoftTechnologies, Source Hub India Pvt Ltd and Data Tree IT Services, United SpectrumSolutions-Mobile Application, Manipal Digital systems. The district has a thermal powerplant in Nandikoor to generate electricity. The GDDP or Gross District Domestic Productduring the period 2013-14 was Rs. 2 1,36,686 Lakh at current price and Rs. 18 ,48,426Lakh at Constant (2011-12) Prices. The NDDP, or Net District Domestic Product duringthe period 2013-14 was Rs . 19 ,54,411 Lakh at Current Price and Rs. 16 ,81,201 Lakh atConstant (2011-12) Prices.

KarnatakaDistrict FactbookDistrict Factbook™™ Udupi District
Education wise, according to 2011 census, the literacy rate is 86.24% persons, of which91.41% are males and 81.58% are females. The total literate population of the district is9,26,429 persons, of which 4,65,704 are males and 4,60,725 are females. All schools inthe districts conduct 10th and 12th standard exams under Karnataka State EducationBoard. Schools, colleges and institutes of higher learning are run by internationalrenowned educational institutions namely The Manipal Academy of Higher Education(MAHE) and The Nitte University. The name of some famous educational institutes isBhandarkars' Arts & Science College, Crossland College, KMC International Center,Moodlakatte Institute of Technology, N.M.A.M. Institute of Technology, Shri MadhwaVadiraja Institute of Technology & Management, Vaikunta Baliga College of Law, JayceesEnglish Medium School, Little Rock Indian School and Nirmala High School, Brahmavar etc.
Padmanabha Balakrishna Acharya was born on 8th October , 1931. He is an Indianpolitician. He served as Governor of Nagaland on 14 th July 2014. He also became theHonorable Governor of Assam in 2014.
The district has numerous famous historical and religious places to visit. These placesare Karkala, Maravanthe, Udupi, Attur, Padutirupathi Sree Venkataramana Temple, AtturSt. Lawrence Church, Water Sports, Bijadi, Kundapur, Kaup Beach, Manipal, Pajaka, ShriAnjaneya Temple, Shri Brahma Lingeshwara Temple, Shri Chennakeshava Temple, ShriDurga Parameshwari Temple, Shri Guru Narasimha Temple, Shri Mahathobhara ShreeMahalingeshwara Temple, Shri Sitaramchandra Temple, Shri Vishnumurthy Temple, ShriYele Mahalingeshwara Temple, Sri Lakshmi Ventkatarama Temple, Shri KantheshwaraTemple and Padmavati Temple. During the year 2015, there were 1,283 foreign touristsand 61,92,672 domestic tourists who visited above places.
Ashwini Chidananda Shetty Akkunji (born 7 October 1987) is an Indian athlete. She wonGold Medals at the 2010 Commonwealth Games and the 2010 Asian Games in 4x400 mrelay team event and an individual gold medal in the 400 meters hurdles in 2010 AsianGames. She received the Rajyotsava Prashasti in 2010 by the Government of Karnataka.Mamatha Poojary is known as Kabaddi Queen born in 1986. She is the Captain of theIndian women’s Kabaddi team. She is awarded with the Rajyotsava Prashasti by theGovernment of Karnataka.
6

7
Udupi DistrictKarnataka
District FactbookDistrict Factbook™™
Administrative Setup Administrative UnitAdministrative Division:- Mysore
Sub-districts:
1. Karkal
2. Kundapura
3. Udupi
Towns:
1. 52 Heroor (CT) 11. Moodabettu (CT)
2. Alevoor (CT) 12. Nadsal (CT)
3. Bada (CT) 13. Saligram (TP)
4. Badagabettu (No.80) (CT) 14. Sanoor (CT)
5. Karkal (TMC) 15. Tenkanidyoor (CT)
6. Korangrapady (CT) 16. Tonse East (CT)
7. Koteshwar (CT) 17. Udupi (CMC)
8. Kundapura (TMC) 18. Udyavara (CT)
9. Mallar (CT) 19. Varamballi (CT)
10. Manipura (CT) 20. Yenagudde (CT)
Sub-districts, Towns, CD Blocks and Villages(2011)
District Sub-districts Towns CD Blocks Villages
Udupi 3 20 3 233
Karnataka 176 347 176 29340
India 5924 7933 6596 640930
Rank of District in State 30 3 30 30
Rank of District in India 532 97 576 538
11
Udupi DistrictKarnataka
District FactbookDistrict Factbook™™
Demographics
Population(2011)
Residence District Persons Male Female
Total Udupi 1177361 562131 615230
Karnataka 61095297 30966657 30128640
India 1210569573 623121843 587447730
Rank of District in State 23 25 23
Rank of District in India 402 420 384
Rural Udupi 843300 398847 444453
Karnataka 37469335 18929354 18539981
India 833463448 427632643 405830805
Rank of District in State 25 27 23
Rank of District in India 409 430 387
Urban Udupi 334061 163284 170777
Karnataka 23625962 12037303 11588659
India 377106125 195489200 181616925
Rank of District in State 20 21 20
Rank of District in India 280 289 270

39
Udupi DistrictKarnataka
District FactbookDistrict Factbook™™
Economy
Offices, Deposits, Credit and C-D Ratio of Scheduled Commercial Banks (SCBs)Rs. in Million (September, 2016)
District Udupi Karnataka IndiaRank ofDistrictin State
Rank ofDistrictin India
Number of Offices 361 9745 135263 5 96
Deposits 187061 7323481 100965397 5 86
Credit 88936 4966262 75178857 7 109
Credit-Deposit Ratio (C-D Ratio) 47.54 67.81 74.46 29 330
By Bank GroupRs. in Million (September, 2016)
Bank Group Udupi Karnataka IndiaRank ofDistrictin State
Rank ofDistrictin India
State Bank of India and Its AssociatesNumber of Offices 33 1909 24493 19 216
Deposits 22499 1568251 22988903 11 201
Credit 7661 1025139 15874037 22 258
Credit-Deposit Ratio (C-D Ratio) 34.05 65.37 69.05 29 365
Nationalised BanksNumber of Offices 246 4357 66577 4 55
Deposits 134446 3042803 47342652 3 60
Credit 67334 2219034 34201792 5 67
Credit-Deposit Ratio (C-D Ratio) 50.08 72.93 72.24 29 287
Regional Rural BanksNumber of Offices 23 1724 20858 28 331
Deposits 2113 312344 3215425 29 402
Credit 1909 271700 2187606 28 332
Credit-Deposit Ratio (C-D Ratio) 90.34 86.99 68.03 16 167
Private Sector BanksNumber of Offices 59 1737 23020 5 105
Deposits 28002 1925624 22460896 4 88
Credit 12033 1112864 19231413 8 143
Credit-Deposit Ratio (C-D Ratio) 42.97 57.79 85.62 26 422
Foreign BanksNumber of Offices - 18 315 0 0
Deposits - 474459 4957521 0 0
Credit - 337525 3684010 0 0
Credit-Deposit Ratio (C-D Ratio) - 71.14 74.31 0 0
All Scheduled Commercial BanksNumber of Offices 361 9745 135263 5 96
Deposits 187061 7323481 100965397 5 86
Credit 88936 4966262 75178857 7 109
Credit-Deposit Ratio (C-D Ratio) 47.54 67.81 74.46 29 330

KarnatakaDistrict FactbookDistrict Factbook™™ Udupi District
Market Size
Broad Category-wise Monthly Per Capita Expenditure - Total In Rs. (2011-2012)
Broad Categories of Goods and Services Udupi Karnataka IndiaRank ofDistrictin state
Rank ofDistrictin India
Cereals 157.73 164.06 159.53 13 288
Cereal Substitute 0.00 0.03 0.99 0 0
Pulses & Products 44.97 56.89 45.48 22 258
Milk & Milk Products 112.56 100.29 136.22 6 273
Sugar & Salt 20.36 26.69 27.34 29 395
Edible Oil 29.72 52.07 52.62 29 568
Egg, Fish & Meat 112.29 57.02 51.71 2 87
Vegetables 54.89 56.10 67.46 9 437
Fruits (Fresh) 73.96 40.70 25.70 3 17
Fruits (Dry) 5.67 12.37 7.95 25 210
Spices 33.90 35.62 31.13 18 179
Beverages etc. 32.24 34.14 27.25 11 185
Served Processed Food 145.81 85.22 51.40 4 17
Packaged Processed Food 25.90 19.40 23.17 4 192
Pan 4.20 6.41 4.43 19 235
Tobacco 11.52 17.09 15.35 20 339
Intoxicants 8.95 20.41 11.31 23 293
Fuel and Light 128.66 131.20 136.63 10 287
C lothing 111.25 85.40 87.26 7 138
Bedding etc. 17.80 6.39 6.54 3 70
Footwear 33.10 22.46 20.33 4 130
Education 104.26 54.90 67.24 2 109
Medical (Institutional) 220.09 64.09 26.00 3 6
Medical (Non-institutional) 122.14 66.31 74.33 2 50
Entertainment 43.90 35.19 22.67 4 52
Minor Durable Type Goods 26.31 8.38 5.50 2 9
Toilet Articles 52.54 46.45 38.16 4 84
Other Household Consumables 52.80 43.56 34.10 5 63
Consumer Services excl. Conveyance 113.36 117.07 85.63 5 90
Conveyance 149.74 136.47 95.22 6 88
Rent 33.85 133.18 52.20 14 164
Consumer Taxes & Cesses 10.26 19.63 8.91 19 124
Durable Goods 251.16 203.60 99.27 6 52
Monthly Per Capita Expenditure (MPCE) 2345.89 1958.79 1599.04 5 67
48

KarnatakaDistrict FactbookDistrict Factbook™™ Udupi District
Market Size
Broad Category-wise Monthly Per Capita Expenditure - Urban In Rs. (2011-2012)
Broad Categories of Goods and Services Udupi Karnataka IndiaRank ofDistrictin state
Rank ofDistrictin India
Cereals 175.23 187.12 175.52 15 276
Cereal Substitute 0.00 0.05 1.27 0 0
Pulses & Products 45.85 63.97 54.48 23 325
Milk & Milk Products 129.96 136.29 186.47 12 312
Sugar & Salt 21.49 26.89 30.44 27 440
Edible Oil 28.25 57.40 63.62 29 586
Egg, Fish & Meat 111.28 69.80 66.94 5 116
Vegetables 56.99 63.82 81.40 13 455
Fruits (Fresh) 69.22 55.80 42.02 6 40
Fruits (Dry) 5.95 16.69 13.85 26 311
Spices 36.41 38.55 36.99 14 178
Beverages etc. 46.88 48.21 42.85 8 135
Served Processed Food 225.92 131.91 89.68 2 15
Packaged Processed Food 41.18 29.79 37.37 3 147
Pan 2.57 4.20 4.66 21 328
Tobacco 14.25 16.47 15.54 17 246
Intoxicants 18.40 23.64 13.36 8 142
Fuel and Light 165.08 167.79 182.54 5 210
C lothing 169.75 127.03 118.73 10 108
Bedding etc. 17.32 8.46 8.72 3 111
Footwear 24.92 30.87 29.09 15 304
Education 95.85 113.23 135.73 6 251
Medical (Institutional) 91.60 116.46 33.13 5 46
Medical (Non-institutional) 131.31 92.54 98.85 2 70
Entertainment 49.02 59.99 43.77 5 116
Minor Durable Type Goods 41.68 14.46 8.42 1 1
Toilet Articles 64.27 67.87 56.88 6 93
Other Household Consumables 82.59 59.90 48.90 3 8
Consumer Services excl. Conveyance 151.97 205.58 155.78 5 104
Conveyance 112.51 225.89 180.98 16 280
Rent 153.47 348.17 166.93 14 107
Consumer Taxes & Cesses 13.15 37.19 22.22 21 220
Durable Goods 59.37 296.09 152.10 16 335
Monthly Per Capita Expenditure (MPCE) 2453.74 2942.11 2399.24 7 128
50

KarnatakaDistrict FactbookDistrict Factbook™™ Udupi District
Life Style
Households having Radio/Transistor, Television(2011)
Residence DistrictTotal Number
ofHouseholds
Radio /Transistor (%) Television (%)
Total Udupi 246313 78521 (31.88) 173033 (70.25)
Karnataka 13179911 2944833 (22.34) 7911490 (60.03)
India 246692667 49016595 (19.87) 116493624 (47.22)
Rank of District inState
24 2 17
Rank of District inIndia
443 52 484
Rural Udupi 174548 56729 (32.5) 112409 (64.4)
Karnataka 7864196 1383160 (17.59) 3640301 (46.29)
India 167826730 29057003 (17.31) 56005607 (33.37)
Rank of District inState
25 7 27
Rank of District inIndia
515 145 596
Urban Udupi 71765 21792 (30.37) 60624 (84.48)
Karnataka 5315715 1561673 (29.38) 4271189 (80.35)
India 78865937 19959592 (25.31) 60488017 (76.7)
Rank of District inState
9 17 7
Rank of District inIndia
81 419 120
60

67
Udupi DistrictKarnataka
District FactbookDistrict Factbook™™
Infrastructure
Households by Main Source of Drinking Water - Total(2011)
Particulars Udupi Karnataka IndiaRank ofDistrictin State
Rank ofDistrictin India
Total Number of Households 246313 13179911 246692667 24 443
Tap water from Treated Source(%)
28751 (11.67) 5432724 (41.22) 78873488(31.97)
15 352
Tap water from UntreatedSource (%)
16986 (6.90) 3274240 (24.84) 28533688(11.57)
16 488
Total Tap (%) 45737 (18.57) 8706964 (66.06) 107407176(43.54)
6 216
Covered Well (%) 14810 (6.01) 131305 (1.00) 3895409 (1.58) 23 531
Un-covered Well (%) 166257 (67.50) 1051685 (7.98) 23289867(9.44)
26 515
Total Well (%) 181067 (73.51) 1182990 (8.98) 27185276(11.02)
24 475
Handpump (%) 2899 (1.18) 729630 (5.54) 82599531(33.48)
19 312
Tubewell/Borehole (%) 9990 (4.06) 2101712 (15.95) 20916074(8.48)
1 1
Spring (%) 462 (0.19) 42476 (0.32) 1314556 (0.53) 11 229
River/Canal (%) 1072 (0.44) 107435 (0.82) 1550549 (0.63) 30 629
Tank/Pond/Lake (%) 2023 (0.82) 124772 (0.95) 2075181 (0.84) 23 435
Other Sources (%) 3063 (1.24) 183932 (1.40) 3644324 (1.48) 16 352

KarnatakaDistrict FactbookDistrict Factbook™™ Udupi District
Infrastructure
Electricity ConsumersIn Nos. (As on 31.03.2016)
District Domestic Industrial Commercial I.P Sets Others Total
Udupi 304798 5550 39868 64159 7918 422293
Karnataka 16344865 403905 1829326 2405611 756270 21739977
Rank of District in State 23 28 16 19 25 22
Electricity ConsumptionIn Million Units (2015-2016)
District Domestic Industrial Commercial I.P Sets StreetLights Others Total
Income fromElectricity
Consumption(Rs. in Lakh)
Udupi 312.90 163.90 107.80 87.00 8.50 86.90 767.00 46449.30
Karnataka 11270.90 9741.90 6177.40 19074.20 882.60 3834.10 50981.10 2846934.30
Rank ofDistrict inState
6 16 7 29 26 11 24 20
ElectrificationIn Nos. (31.03.2016)
District
Beneficiariesunder
Bhagyajyoti/Kutirajyoti
Electrified Non-electrified
Villages Hamlets I.P. Sets Villages Hamlets I.P.Sets
Udupi 112454 1370 786 88464 - - 390
Karnataka 2807885 28734 34603 2405611 32 266 27546
Rank of Districtin State
10 6 10 11 0 0 19
Telecommunication
In Nos. (As on 31.03.2016)
District PostOffices*
TelephoneExchanges Telephones Mobile
PhonesInternet
ConnectionsUdupi 334 97 47580 - -
Karnataka 9661 2793 1294726 6979446 470742
Rank of District in State 13 12 7 0 0
78
Note : Figures are included Dakshina Kannada and UdapiDistrict. * : Chief Post Master General, Karnatka circle.

KarnatakaDistrict FactbookDistrict Factbook™™ Udupi District
Industries
Manufacturing Industries Share of GDP Rs. in Lakh (2013-14)
DistrictAt Current Prices At Constant Prices (2011-2012)
Manufacturing Registered Un-registered Manufacturing Registered Un-
registeredUdupi 466398 - - 431840 - -Karnataka 11724013 - - 10855310 - -India 171473000 - - 157972100 - -Rank of Districtin State
5 0 0 5 0 0
Outstanding Credit of Scheduled Commercial Banks (SCBs) according to IndustrialOccupation
Rs. in Thousand (March, 2015)
Particulars Classification ofOccupation Udupi Karnataka India
Rank ofDistrictin State
Rank ofDistrictin India
Number ofAccounts
Mining and Quarrying 73 1789 50619 6 152
Manufacturing andProcessing
6076 173824 2622730 7 110
Electricity, Gas andWater
909 31071 116724 10 26
Construction 3991 47276 382498 2 14
Total 11049 253960 3172571 6 68
AmountOutstanding
Mining and Quarrying 149746 17973229 589787190 6 143
Manufacturing andProcessing
12437954 803394561 16945680284 6 113
Electricity, Gas andWater
8154460 290178837 4193839187 2 32
Construction 4558372 443802000 6631190550 3 62
Total 25300532 1555348627 28360497211 4 78
108

KarnatakaDistrict FactbookDistrict Factbook™™ Udupi District
Agriculture
(Area in Hectare; Production in Tonne & Yield in Tonne/Hect.)
Crops Year District Area Production Yield
Rice 2012-2013 Udupi 51608 127721 2.47
Karnataka 1279247 3551169 2.78
Rank of District in State 11 10 15
Maize 2012-2013 Udupi 15 50 3.33
Karnataka 1324394 3223992 2.43
Rank of District in State 29 29 5
Total Cereals 2012-2013 Udupi 51623 127771 2.48
Karnataka 5029737 9253041 1.84
Rank of District in State 27 26 6
Total Foodgrains 2012-2013 Udupi 55932 130004 2.32
Karnataka 7294511 10561801 1.45
Rank of District in State 28 27 5
Black Gram/Urad 2011-2012 Udupi 4800 2630 0.55
Karnataka 83650 31140 0.37
Rank of District in State 4 4 2
Green Gram (Moong) 2011-2012 Udupi 70 30 0.43
Karnataka 292250 72330 0.25
Rank of District in State 24 24 4
Total Pulses 2012-2013 Udupi 4309 2233 0.52
Karnataka 2264774 1308760 0.58
Rank of District in State 25 26 11
124
Production of Major Food Crops

145
Udupi DistrictKarnataka
District FactbookDistrict Factbook™™
Education
Population by Educational Level (Graduate and Above)(2011)
Educational Level Udupi Karnataka IndiaRank ofDistrictin State
Rank ofDistrictin India
Graduate and Above 78079 4043647 68288971 12 263
Graduate Degree other than Technical Degree 52740 2292017 41563939 11 239
Post Graduate Degree other than TechnicalDegree
9591 574772 14585424 13 378
Technical Degree or Diploma Equal to Degreeor Post Graduate Degree :
- Engineering and Technology 8268 737749 7312459 13 196
- Medicine 2923 119572 1529942 9 142
- Agriculture and Dairying 76 10152 163461 29 383
- Veterinary 42 3359 44866 24 254
- Teaching 4401 305085 3065605 27 234
- Others 38 941 23275 6 145
Census Houses Used as School/College etc.(2011)
Residence District Total Number ofCensus Houses
School/College etc.
Total Udupi 385389 2987
Karnataka 17999066 139176
India 330835767 2106530
Rank of District in State 23 24
Rank of District in India 347 320
Rural Udupi 269817 2212
Karnataka 10620687 106282
India 220695914 1702048
Rank of District in State 23 25
Rank of District in India 363 359
Urban Udupi 115572 775
Karnataka 7378379 32894
India 110139853 404482
Rank of District in State 17 14
Rank of District in India 238 156

KarnatakaDistrict FactbookDistrict Factbook™™ Udupi District
Health
Deaths Registered(2014)
Residence District Person Male Female
Total Udupi 10761 6898 3863
Karnataka 411533 251491 160042
India 6138182 3614951 2517308
Rank of District in State 15 16 17
Rank of District in India 197 174 231
Rural Udupi 7044 4618 2426
Karnataka 221153 133167 87986
India 3442280 1991953 1446398
Rank of District in State 14 11 17
Rank of District in India 188 157 227
Urban Udupi 3717 2280 1437
Karnataka 190380 118324 72056
India 2695902 1622998 1070910
Rank of District in State 18 19 16
Rank of District in India 193 192 187
Infant Deaths Registered(2014)
Residence District Person Male Female
Total Udupi 245 160 85
Karnataka 17286 10706 6580
India 189008 108585 80190
Rank of District in State 23 22 23
Rank of District in India 206 177 249
Rural Udupi 13 9 4
Karnataka 2195 1151 1044
India 59356 32286 26928
Rank of District in State 28 28 30
Rank of District in India 396 367 418
Urban Udupi 232 151 81
Karnataka 15091 9555 5536
India 129652 76299 53262
Rank of District in State 22 20 23
Rank of District in India 140 128 168
154

159
Udupi DistrictKarnataka
District FactbookDistrict Factbook™™
Health
Disabled Population by Type of Disability-Urban (2011)
Type of Disability Sex Udupi Karnataka IndiaRank ofDistrictin State
Rank ofDistrictin India
Total Number of Disabled Persons Persons 4349 531511 8178636 25 366
Male 2331 287916 4578034 26 383
Female 2018 243595 3600602 25 350
In Seeing Persons 467 124765 1529873 27 411
Male 236 64643 817580 27 421
Female 231 60122 712293 27 401
In Hearing Persons 559 115397 1679186 26 416
Male 265 60344 894158 28 444
Female 294 55053 785028 25 397
In Speech Persons 386 30108 694752 23 295
Male 198 16168 387989 24 318
Female 188 13940 306763 21 270
In Movement Persons 838 76132 1401085 28 384
Male 519 47050 866972 28 390
Female 319 29082 534113 28 384
Mental Retardation Persons 503 34858 480064 19 239
Male 272 18691 279300 19 251
Female 231 16167 200764 19 215
Mental Illness Persons 302 7688 227000 6 187
Male 179 4130 132300 5 191
Female 123 3558 94700 7 186
Any Other Persons 747 111538 1634482 25 374
Male 366 59446 900244 27 398
Female 381 52092 734238 24 349
Multiple Disability Persons 547 31025 532194 19 257
Male 296 17444 299491 19 271
Female 251 13581 232703 18 244

KarnatakaDistrict FactbookDistrict Factbook™™ Udupi District
Environment and Pollution
Rainguage StationsIn Nos. (2015)
District Working Not Working Total
Udupi 91 2 93
Karnataka 1157 141 1298
Rank of District in State 1 26 3
174

KarnatakaDistrict FactbookDistrict Factbook™™ Udupi District
Housing
Houseless Population(2011)
District Total Rural Urban
Persons Male Female Persons Male Female Persons Male Female
Udupi 953 623 330 554 328 226 399 295 104
Karnataka 76735 42874 33861 41262 22281 18981 35473 20593 14880
India 1773040 1046871 726169 834692 444450 390242 938348 602421 335927
Rank of District inState
27 26 29 29 27 29 24 17 30
Rank of District inIndia
403 364 430 392 370 405 323 279 404
Standard of Living Index(2007-2008)
DistrictLow (%) High (%)
Total Rural Total Rural
Udupi 4.6 5.3 30.8 26.1
Karnataka 13.5 17.2 17.4 7.2
Rank of District in State 25 25 3 2
Rank of District in India 431 442 142 81
178

KarnatakaDistrict FactbookDistrict Factbook™™ Udupi District
Crime & Law
Road Accidents In Nos. (2015-2016)
District Number ofCases Persons Killed Persons Injured
Udupi 1279 208 1551
Karnataka 43714 10496 56196
Rank of District in State 15 26 19
Police Stations In Nos. (31.03.2016)
District Police Stations
Udupi 23
Karnataka 983
Rank of District in State 22
Jails In Nos. (2015-2016)
District Jails
Udupi 2
Karnataka 102
Rank of District in State 20
190

KarnatakaDistrict FactbookDistrict Factbook™™ Udupi District
Social and Welfare Scheme
Physical Performance under MGNREGS
In Nos. (2015-2016)
Particulars Udupi Karnataka India
Rankof
Districtin
State
Rankof
Districtin
IndiaCumulative Number of Households IssuedJobcards I. SCs 4666 924121 27671891 30 513
II. STs 4046 461664 17486053 24 375
III. Others 42038 4163038 84658938 29 460
Total (I+II+III) 50750 5548823 129816882 29 513Cumulative Number of Households DemandedEmployment
8406 1662986 53433225 28 570
Labour Budget (LB) : Households ProjectedCumulative Number of Households providedEmployment
7443 1237226 47976868 28 568
Number of Households Working under NREGA 2963 371476 18817017 28 522
Labour Budget (LB) : Projected Persondays 1565 2322374 232722042 29 595
Cumulative Persondays Generate
I. SCs 25710 9685861 515579753 28 513
II. STs 13721 5385310 411853565 27 431
III. Others 204669 44878807 1388457285 28 498
Total (I+II+III) 244100 59949978 2315890603 28 572
Women 167530 28250752 1274032776 28 537
Cumulative Number of Households Completed 100days
74 133351 4623745 28 555
Number of Households which are Beneficiary ofLand Reform/IAY
426 24833 2502269 17 231
Number of Disabled Beneficiary Individuals 22 5288 451738 28 515
196

201
Udupi DistrictKarnataka
District FactbookDistrict Factbook™™
Social and Welfare Scheme
Nirmal Bharat Abhiyan (NBA)
Financial Performance under NBARs. in Lakh (2013-2014)
Particulars Udupi Karnataka IndiaRank of
District inState
Rank ofDistrictin India
Center Opening Balance 38.75 16336.55 234179.54 27 481
Center Allocated Fund 0.00 0.00 0.00 0 0
Release 207.35 6594.69 184262.02 11 233
Total Available Fund 246.10 22881.78 417328.79 25 449
Expenditure 385.28 15840.98 209545.62 19 180
%age of Exp. 100.00 69.23 50.21 5 62
Interest Earned 0.00 25.74 3170.62 0 0
Balance -139.18 7116.00 210285.85 25 578
State Opening Balance 33.83 3830.97 75844.22 25 336
Release 92.20 2856.11 68067.05 10 214
Total Available Fund 126.03 6687.08 143911.28 20 342
Expenditure 125.55 3535.56 57493.27 13 159
%age of Exp. 99.62 52.87 39.95 3 24
Interest Earned 0.00 11.45 1302.36 0 0
Balance 0.48 3162.98 87720.43 27 547
Physical Performance under NBAIn Nos. (2013-2014)
Particulars Udupi Karnataka IndiaRank of
District inState
Rank ofDistrict in
India
Individual Household LatrinesBelow Poverty Line (IHHL BPL)Total 9288 364045 2553571 21 76SC 1409 72166 528332 21 122ST 1049 38767 386810 13 100Individual Household Latrines(IHHL APL)Total 1381 141652 2422723 19 331SC 130 16368 371056 18 229ST 112 13469 237105 15 139Small & Marginal Farmers 609 67189 910908 15 215Landless Labourers with Homestead 151 16498 308780 18 193PH 27 1137 28846 13 143Women Headed Households 525 12570 114030 7 56Total Individual HouseholdLatrines (APL+BPL) 10669 505697 4976294 22 163
School Toilets 14 1483 37696 20 182Sanitary Complex 4 88 1530 10 76Anganwadi Toilets 16 1416 22318 20 140

i
KarnatakaUdupi District District Factbook™
Get Complete BookAt Datanet India eBooks Store
www.datanetindia-ebooks.comor go directly at
http://www.datanetindia-ebooks.com/District_Factbook/Karnataka/Udupi