Distribution Systems Planning and Analysis Framework for ...
20
Distribution Systems Planning and Analysis Framework for Indian Feeders David Palchak 2 nd International Conference on Large-Scale Grid Integration of Renewable Energy in India September 6 th , 2019
Transcript of Distribution Systems Planning and Analysis Framework for ...

Distribution Systems Planning and Analysis Framework for Indian Feeders
David Palchak
2nd International Conference on Large-Scale Grid Integration of Renewable Energy in IndiaSeptember 6th, 2019

NREL | 2
Contents
• Generating OpenDSS model
• Data cleaning
• Load allocation
Distribution Network Modeling
EV Demand Modelling
Battery Energy Storage Systems
Simulation Architecture
Future Work and Conclusions
1
2
3
4
5
• Daily demand profile estimates
• Initial Results
• Battery Sizing
• Peak shaving control application
• Results
Distribution Network Modeling
• Generating OpenDSS model
• Data cleaning
• Load allocation

NREL | 4
Challenges and Need for developing feeder models
• Need:
– Distribution feeders consist of both the primary and the secondary networks.
– Distribution feeder models form the basis on which any distributed energy resource (DER) impact study may be performed.
– Even though modelling the secondary networks is challenging, it is essential especially for Indian feeders as each secondary hosts hundreds of customers.
– Many local parameters such as voltages can not be sufficiently captured if only the primary networks are modelled.
• Challenges:
– Multiple data sources with different levels of completeness must be used, such as data from GIS, SCADA, AMI and equipment specification sheets.
– Assumptions such as line transposition and balanced phase loading cannot be assumed, and all the phases of each feeder component must be modeled accurately.

NREL | 5
Generating OpenDSS model
Steps for creating detailed feeder models in OpenDSS, an open-source power system simulation tool for distribution systems, developed by Electric Power Research Institute (EPRI), USA:
• Explode each line layer in the GIS file
• Export the geometry of the exploded layer to nodes and attribute files
• Edge creation• Feeder head location• Adding nodes and merging of
neighboring nodes• Remove loops in feeder layout• Adding new secondary nodes for
customer load allocation
GIS-based dataset translation to OpenDSS model
New nodes created to connect secondary customers

NREL | 6
Data Cleaning
• Serially complete time series distribution transformer (DT) loading data is required for time-series simulations of the distribution feeder.
• The DT data sets obtained from field measurements were afflicted with several types of inconsistencies such as missing data and data corruption.
• The mean loading condition observed during each half-hourly time point was used to get typical daily profile for each month.
• This process was repeated for each month in the year, producing donor profile to fill missing time points.
Typical daily profile for each month
Serially complete time series; corrupt data has been identified, removed, and replaced

NREL | 7
Load Allocation
• A novel load allocation algorithm based on evolutionary algorithm (EA) was developed to match voltage drops from the feeder head to the DT secondaries.
• This algorithm gave correct per phase load kW and power factors which were subsequently distributed among all secondary customer based on their annual kWh consumption.
DT metering information and target voltages
Results of load allocation algorithm
EV Demand Modelling
• Daily demand profile estimates
• Initial Results

NREL | 9
Daily demand profile estimates
• With detailed OpenDSS feeder models available, the electric vehicle impact studies could be started.
• EV load was modeled as spot demand profiles for various randomized locations representing different scenarios.
• A residential EV charger was modeled as an additional load on top of the base load profile but a public charging station was added as a new load.
• The first figure shows number of EVs arriving at the station at different times and their initial SOCs.
Bottom-up model development for public charging station demand calculation- number of EVs and their initial SOC levels
Number of EVs waiting in the queue

NREL | 10
Initial Results
• In this scenario, there are about 2000 EVs being considered.
• A hot summer day profile was selected for this initial simulation.
• The first figure suggests that in this scenario the EV load adds more than a MW on top of the existing base load of 1.5 MW.
• Voltage impacts are seen in the second figure which plots minimum voltages for every 30 minutes.
• The second figure shows that there is a clear voltage drop in the evening due to the high EV load.
Base load and total load (after EV integration) profiles for a summer day
Comparison of minimum voltages between baseline and EV integration scenario

Battery Energy Storage Systems
• Battery Sizing
• Peak shaving control application
• Results

NREL | 12
Battery Sizing
• The bivariate distribution of the DT overloading point-pairs is superimposed over the scatter plot as shown in the figure.
• It is assumed that commercially available batteries are generally available with a 4:1 ratio between energy and power.
• There are three points of interest, these are:
– the peak power overloading instance point-pair shown in red,
– the projected peak power point-pair to the 4:1 ratio line shown in purple, and,
– the 70th percentile point-pair.
• 70th percentile point represents the point on the 4:1 ratio line most near the point simultaneously at the 70th percentile of power and energy for all observed overloading instances.
Battery sizing map
NREL | 13
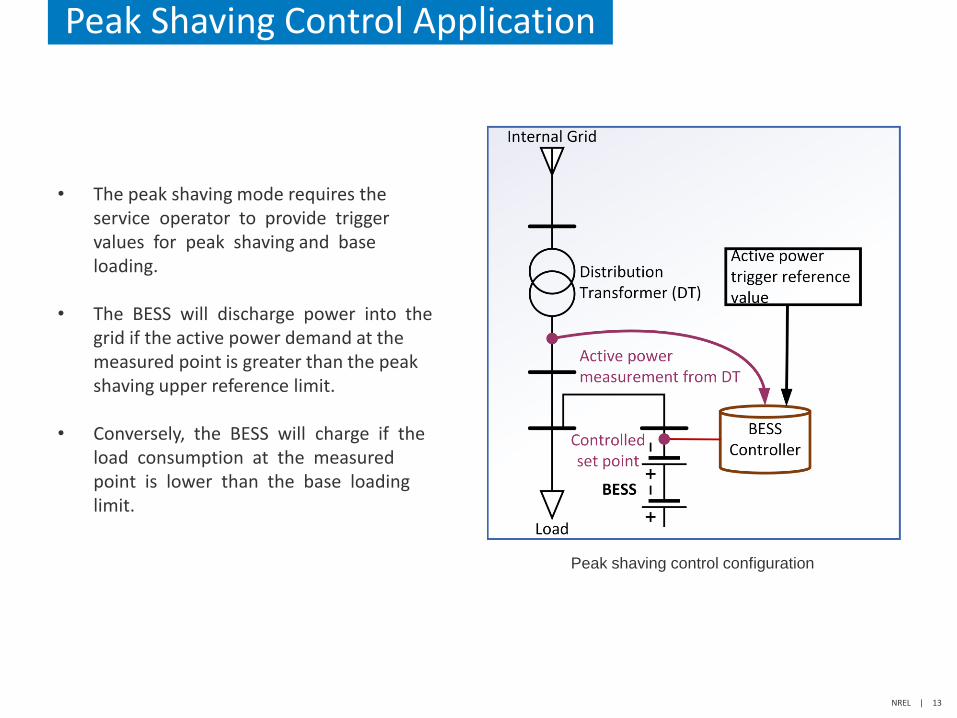
Peak Shaving Control Application
• The peak shaving mode requires the service operator to provide trigger values for peak shaving and base loading.
• The BESS will discharge power into the grid if the active power demand at the measured point is greater than the peak shaving upper reference limit.
• Conversely, the BESS will charge if the load consumption at the measured point is lower than the base loading limit.
Peak shaving control configuration

NREL | 14
Results
• The implementation of peak shaving algorithm in 30-minute time step for one day is presented.
• The figure shows the active power at a particular distribution transformer, SOCs of the attached local BESS and the batteries active power output with and without (base case) the peak shaving grid support.
Energy storage integration results at a distribution transformer for one of the modelled feeders

Simulation Architecture

NREL | 16
Simulation Architecture
• In order to assess the grid readiness of the modeled network to host EVs, many time series simulations had to be completed.
• Simulating them serially on a local machine would be time intensive and inflexible.
• Thus, a simulation architecture was created which could run all of these simulations in parallel by leveraging the high-performance computing facilities available at NREL.
Simulation architecture used to run hundreds of time-series simulations in parallel

NREL | 17
Validating accuracy of developed models
• The simulation architecture was used to run the 10-year baseline simulations on the developed OpenDSS feeder models.
• The first year-long baseline loading profile was compared with the expected loading of each DT.
• Expected loading is obtained by multiplying the load allocated using EA with the time series profile multiplier.
• The original DT meter data and OpenDSS outputs were also compared.
• The OpenDSS output looks very similar to the raw input data.
Expected vs actual DT loading
DT Meter data vs OpenDSS outputs

Future Work and conclusions

NREL | 19
Future Work and Conclusions
Future Work:
• For each of the multi-year time series simulations a suit of grid readiness metrics will be evaluated.
• These metrics will provide information about the required network upgrades to mitigate violations.
• The EV demand profiles will also be included to simulate the network impacts of varying levels of EV penetration.
• The BESS use cases such as peak shaving will then be implemented along with the EV scenarios to determine the effectiveness of BESS in facilitating EV integration
Conclusions:
• This paper presented a platform developed to conduct detailed distribution planning and analysis studies.
• This platform can be used to model a detailed distribution network model including both the primary and secondary networks.
• The developed modes have accurate load allocations and statistically correct loading profiles.
• The modular nature of this platform allows it to be easily extended to any DER use case in addition to the BESS and EV use cases already implemented.

www.nrel.gov
Thank You!
This work was supported by Alliance for Sustainable Energy, LLC, the manager and operator of the National Renewable Energy Laboratory for the U.S. Department of Energy (DOE) under Contract No. DE-AC36-08GO28308. Funding was provided by the U.S. Agency for International Development. A portion of the research was performed using computational resources sponsored by the Department of Energy's Office of Energy Efficiency and Renewable Energy and located at the National Renewable Energy Laboratory. The views expressed in the article do not necessarily represent the views of the DOE or the U.S. Government. The U.S. Government retains and the publisher, by accepting the article for publication, acknowledges that the U.S. Government retains a nonexclusive, paid-up, irrevocable, worldwide license to publish or reproduce the published form of this work, or allow others to do so, for U.S. Government purposes.