Distribution of Heavy Metals in the Coastal Marine ...
11
E-mail: [email protected] Western Indian Ocean J. Mar. Sci. Vol. 6, No. 1, pp. 73–83, 2007 © 2007 WIOMSA Distribution of Heavy Metals in the Coastal Marine Surficial Sediments in the Msasani Bay-Dar es Salaam Harbour Area Alfred N. N. Muzuka Institute of Marine Sciences, University of Dar es Salaam, P.O. Box 668, Zanzibar, Tanzania Key words: Heavy metals, Msasani bay, Dar es Salaam, Tanzania Abstract—In Tanzania, a large amount of domestic and industrial wastes are daily released to the aquatic environment without prior treatment. The demographic pressure resulting from the about 2.5 million people in the Dar es Salaam region (according to the 2002 National Census) is the major driver of amounts of waste released. Heavy metals such as arsenic (As), cadmium (Cd), cobalt (Co), chromium (Cr), copper (Cu), iron (Fe), manganese (Mn), nickel (Ni), lead (Pb) and zinc (Zn), some of which are toxic, are among the wastes being released. The present study documents the levels of the above-mentioned metals in sediments recovered from the Msasani Bay-Dar es Salaam harbour area. Heavy metal concentrations in the collected coastal marine surfical sediments were determined using atomic absorption spectrophotometery. The concentration of most of the heavy metals in sediments is higher in the Dar es Salaam harbour than outside the habour area. These metals are derived from the industrial areas through rivers and storm water outflows. The concentration of Cd, Ni, and Pb increase northward from the Dar es Salaam harbour to the Msasani-Kunduchi area. Also the concentration of these three metals increases with increasing distance offshore to the boundary of the study area. Concentrations of Cd, Ni, and Pb in sediments above background level indicate that these sediments are polluted. Although the current concentration of most heavy metals in sediments is low, suggesting low levels of pollution in the study area, the increasing trend in dumping untreated wastes, driven by the demographic pressure, might change the future scenario. This calls for attempts to treat waste before it enters the marine environment, to reduce contamination, accompanied by regular monitoring work. land near residential areas or dumped at roadsides and in streams. A large proportion (76%) of the inhabitants of the Dar es Salaam city use pit latrines, while 13% are served by a central sewerage system and 11% use septic tanks (Mgana and Mahongo, 1997; Dar es Salaam City Council, 2004). Furthermore, sewage from the central sewerage system is discharged untreated to the Indian Ocean from the screen- house. Sludge from septic tanks is periodically removed using cesspit emptier or vacuum trucks, which in turn empty their contents either into the stabilization ponds or into a screen-house where the INTRODUCTION According to the 2002 National Census, the city of Dar es Salaam has a population of about 2.5 million. With this level of population there is a significant amount of waste generated daily. For example, municipal solid wastes generated in the city of Dar es Salaam amounts to 1,770 tonnes/day (Mgana and Mahongo, 1997). Only 8.1% of the waste generated is disposed in the official open dumpsite, a practice that is common in many developing countries (Soto-Jiménez et al., 2001; Sarkar et al., 2004). Uncollected refuse is mainly stockpiled on vacant
Transcript of Distribution of Heavy Metals in the Coastal Marine ...
DistributionofHeavymetalsinmsasanibay 73
E-mail: [email protected]
Western Indian Ocean J. Mar. Sci. Vol. 6, No. 1, pp. 73–83, 2007© 2007 WIOMSA
Distribution of Heavy Metals in the Coastal Marine Surficial Sediments in the Msasani Bay-Dar es Salaam Harbour Area
Alfred N. N. MuzukaInstitute of Marine Sciences, University of Dar es Salaam, P.O. Box 668, Zanzibar, Tanzania
Key words: Heavy metals, Msasani bay, Dar es Salaam, Tanzania
Abstract—In Tanzania, a large amount of domestic and industrial wastes are daily released to the aquatic environment without prior treatment. The demographic pressure resulting from the about 2.5 million people in the Dar es Salaam region (according to the 2002 National Census) is the major driver of amounts of waste released. Heavy metals such as arsenic (As), cadmium (Cd), cobalt (Co), chromium (Cr), copper (Cu), iron (Fe), manganese (Mn), nickel (Ni), lead (Pb) and zinc (Zn), some of which are toxic, are among the wastes being released. The present study documents the levels of the above-mentioned metals in sediments recovered from the Msasani Bay-Dar es Salaam harbour area. Heavy metal concentrations in the collected coastal marine surfical sediments were determined using atomic absorption spectrophotometery. The concentration of most of the heavy metals in sediments is higher in the Dar es Salaam harbour than outside the habour area. These metals are derived from the industrial areas through rivers and storm water outflows. The concentration of Cd, Ni, and Pb increase northward from the Dar es Salaam harbour to the Msasani-Kunduchi area. Also the concentration of these three metals increases with increasing distance offshore to the boundary of the study area. Concentrations of Cd, Ni, and Pb in sediments above background level indicate that these sediments are polluted. Although the current concentration of most heavy metals in sediments is low, suggesting low levels of pollution in the study area, the increasing trend in dumping untreated wastes, driven by the demographic pressure, might change the future scenario. This calls for attempts to treat waste before it enters the marine environment, to reduce contamination, accompanied by regular monitoring work.
land near residential areas or dumped at roadsides and in streams. A large proportion (76%) of the inhabitants of the Dar es Salaam city use pit latrines, while 13% are served by a central sewerage system and 11% use septic tanks (Mgana and Mahongo, 1997; Dar es Salaam City Council, 2004). Furthermore, sewage from the central sewerage system is discharged untreated to the Indian Ocean from the screen-house. Sludge from septic tanks is periodically removed using cesspit emptier or vacuum trucks, which in turn empty their contents either into the stabilization ponds or into a screen-house where the
INTRODUCTION
According to the 2002 National Census, the city of Dar es Salaam has a population of about 2.5 million. With this level of population there is a significant amount of waste generated daily. For example, municipal solid wastes generated in the city of Dar es Salaam amounts to 1,770 tonnes/day (Mgana and Mahongo, 1997). Only 8.1% of the waste generated is disposed in the official open dumpsite, a practice that is common in many developing countries (Soto-Jiménez et al., 2001; Sarkar et al., 2004). Uncollected refuse is mainly stockpiled on vacant
74 a.n.n.muzuka
untreated contents are discharged into the Indian Ocean. Overflow of soak-away pits and septic tanks, particularly during the rainy season, impacts directly on public health. Water-borne diseases such as cholera, schistomiasis, and filariasis are some of those associated with untreated sewage discharges. About 1,588 tonnes per year of hazardous sludge are generated by several industrial companies such as Aluco, Pipeco, Steelco, Galco, Ubungo Spinning Mills, Karibu Textiles, Cottex Spinning and Shelys Limited (Mgana and Mahongo, 1997; Dar es Salaam City Council, 2004). Most of this sludge is dumped on site and finds its way to the ocean via streams. Moreover, Muhimbili Hospital disposes 896 tonnes of infectious solid waste annually while other hospitals dispose 1,512 tonnes of hazardous waste on site annually. These waste generated and dumped in the aquatic environment contain heavy metals such as As, Cd, Co, Cr, Cu, Pb and Zn. Heavy metal pollution is known to be the cause of various diseases globally, such as the Minamata disease (organic mercury poisoning), Itai-itai disease (cadmium poisoning), arsenous acid poisoning, and air-pollution-related asthma (Matsuo, 2003). Contaminated sediments may also limit the recreational uses of affected waters. Since sediments are potential sinks and sources of heavy metals to the water column, elevated levels of heavy metal concentration above background levels have adverse effects on resident benthic and aquatic organisms. Therefore, this calls for studies to evaluate and monitor sediment metal concentrations in the aquatic environment. Concentration of heavy metals in habours and coastal marine surficial sediments has been widely reported in many parts of the globe (e.g. Prego et al., 1999; Binning and Baird, 2001; Gangaiya et al., 2001; Man et al., 2004; Sarkar et al., 2004; Caplat et al., 2005; McCready et al., 2006). Generally, the trend of pollution in coastal areas has been increasing over time. In Tanzania, heavy metals in sediments have been determined in the Dar es Salaam harbour (Machiwa 1992, 2000) and along River Msimbazi (A’khabuhaya and Lodenius 1988). Heavy metals concentration have also been measured from sediments, mangrove parts and crabs from Mtoni, Msimbazi and Mbweni (Mremi and Machiwa 2003; Mgaya et al., 2004). The works
of Machiwa (1992, 2000) and Mremi and Machiwa (2003) observed higher concentration of metals in the Dar es Salaam harbour sediments as well as higher concentration of Pb, Zn and Cu in crabs collected from Mtoni and Msimbazi. However, these studies did not cover a large area and none of them extended beyond the Dar es Salaam harbour. Thus, the major objective of the present study was to document the levels of heavy metals pollution in the coastal sediments between Msasani Bay and the Dar es Salaam harbour to assess their threshold levels.
Study Area and Sampling Sites Location
The study area is a coastal marine environment located between Fungu Yasin (Kunduchi Area in the Msasani Bay) and the Dar es Salaam Harbour. It is located between latitudes 6.82° and 6.89°S and longitudes 39.24° and 39.30°E (Figure 1). The climate is typically tropical, with hot weather throughout the year (ranging from 26°–35°C) and two rainy seasons: short rains in November–December and long rains in March–May. The industrial development that has taken place in Dar es Salaam is mainly light industries, manufacturing a variety of goods for both domestic as well as export markets. These industries include: textiles, breweries, distilleries, beverages, bags, cigarettes, cement, paints, pharmaceuticals, plastic, metal products, steel, grain milling, chemicals, timber and wood products, confectionery, food products, petroleum products, edible oil, dairy products, domestic utensils, tea blenders, batteries, radiators, body building, printing and publishing, paper products, garments, electricity generation and glass. These industries are located in industrial areas distributed throughout the city of Dar es Salaam. Some of the industrial areas include Nyerere Road, Mbezi, Tabata, Ubungo and Mikocheni. Other activities include urban and per urban agriculture. Almost 650 ha of the urban area of Dar es Salaam are currently used for vegetable production on open spaces, which is equivalent to 4% of the whole surveyed area, offering employment for over 4,000 farmers (Dongus, 2001). 12% of these 650 ha are privately owned land, 48% are institutionally and 40% publicly owned (Dongus, 2001).

DistributionofHeavymetalsinmsasanibay 75
Fig. 1. A map of study area showing locations of sampling sites and location of the study area with respect to Africa andTanzania (insert)
METHODOLOGY
Sediments were collected using a grab sampler and stored frozen in plastic bags before processing for geochemical analysis. Processing for geochemical analysis involved drying sediment at 60oC and grinding the sub-samples to fine powder using agate mortar. Solid phase As, Cd, Co, Cr, Cu, Fe, Mn, Ni, Pb and Zn levels were determined by means of flame atomic absorption spectrophotometer model GBC 906 AA with HG 3000 hydride generator at the Southern and Eastern African Mineral Centre
(SEAMIC). Digestion of sediment samples followed standard procedure as outline in analytical methods for Atomic absorption Spectrometry manual (Perkin Elmer Corporation, 1994). Sediment samples (ca. 0.5g) were digested with aqua regia at 80oC on a hot plate for 4 hours.
RESULTS
The Dar es Salaam harbour has slightly elevated concentration levels of Cr, averaging 21.6 ±6.8 ppm, compared to areas outside the harbour (Table

76 a.n.n.muzuka
Table 1. Comparison of previous works conducted in the area with the present study. Data are quoted in ppm except As which is quoted in ppb
Machiwa 1992 Machiwa 2000b Mremi and Machiwa 2003 This studyMetal Dar Port Dar Port Msimbazi Mtoni Dar Port Outside Dar port
As 5.26 0.47 0.20Cd 2.0 0.12 3.6 6.8Co 6.6 5.0 5.0 4.7 Cr 26.5 42.4 37.5 36.8 21.6 9.7Cu 15.5 28.9 3.2 1.2 13.5 2.4Fe 9000 7254.6 1975.0Mn 159.0 132.6 40.7Ni 13.6 14.7 22.3 21.4 15.5 16.8Pb 35.1 36.1 31.6 17.9 35.4 29.7Zn 57.1 109.1 31.7 27.1 58.4 7.2
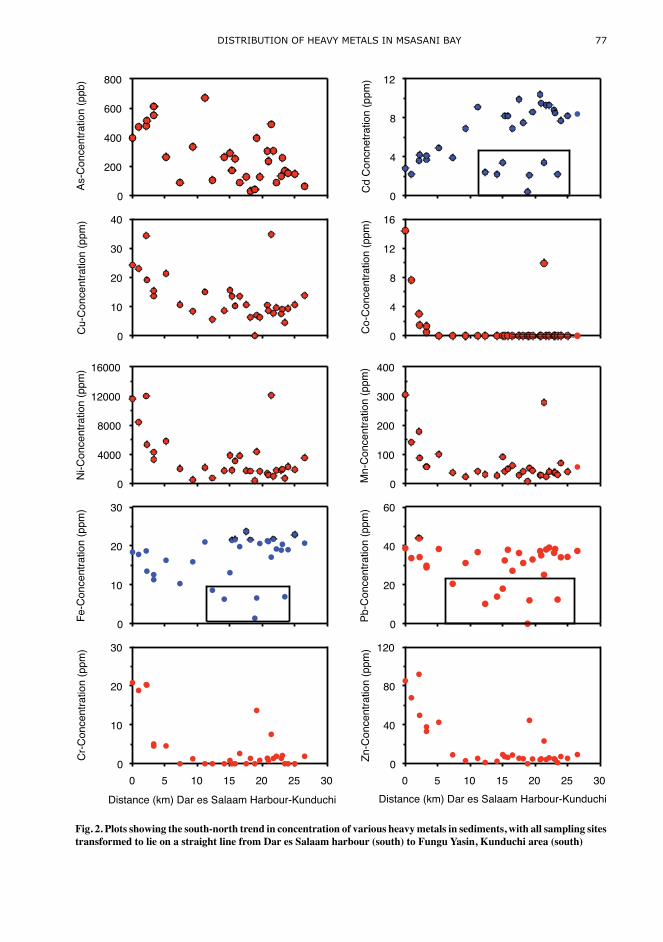
1). The Cr concentration in other areas average 9.7±3.0 ppm. Generally, there is a northward (Dar es Salaam Harbour-Kunduchi) decreasing trend in Cr concentration (Fig. 2). Also, Cr is positively correlated with iron (r = 0.927; p95 = 0.349, n = 32), manganese (r = 0.848; p95 = 0.349) and Zinc (r = 0.741; p95 = 0.349) (Fig. 3). Generally, the Cr concentration is below the Florida “no effect” level of 33 ppm in sediments (Table 2). Furthermore, Cr does not show any clear land-offshore trend. Pb concentration in the Dar es Salaam harbour is generally above 30 ppm and averages 35.4 ±5.3 ppm. The Pb concentration values in the Kunduchi-Msasani area are close to that of the Dar es Salaam harbour (Table 1) with lack of northward trend (Fig. 2). The Pb concentration increases with increasing distance offshore, and it has a strong positive correlation with Ni concentration (r = 0.872; p95 = 0.349) (Fig. 3). The Pb concentration in sediments is above the Florida “no effect” level of 21 ppm but is below the Florida “probable effect” level (Table 2). Fe concentration is highest in the Dar es Salaam harbour averaging 7,254.6 ±3,489.2 ppm. The concentration of Fe in other areas is generally low, averaging 1,975 ±1,070.7 ppm. Also higher concentrations of Fe are found near river entrances or tidal channels of Msimbazi, Tegeta and Manyema creek. Fe-concentration is positively correlated with manganese (r = 0.943; p95 = 0.349), copper (r = 0.807; p95 = 0.349) and zinc (r = 0.850; p95 = 0.349).
Highest Cu concentration is observable in the Dar es Salaam harbour where the values average 13.5 ±8.2 ppm, while in other areas concentrations are generally less than 5.0 ppm (Table 1). Apart from being positively correlated with iron, copper is positively correlated with zinc (r = 0.938; p95
= 0.349) and manganese (r = 0.700; p95 = 0.349). Generally, the Cu concentration is below the Florida “no effect” level of 28 ppm. The concentration of lead in the Dar es Salaam harbour is above the Florida “no effect” level of 21 ppm and is also higher than levels of the Canadian Environmental Protection Authority (EPA, 1976) Concentration of Co is generally below detection limit except in the Dar es Salaam harbour and at the Kunduchi fish landing site harbour. The Co-concentration in the Dar es Salaam harbour averages 4.7 ±5.4 ppm (Table 1). Highest concentration of Mn (>70 ppm) occurs in the Dar es Salaam harbour and at the Kunduchi fish landing site. The Mn-concentration averages 132.6 ±87.7 ppm in the Dar es Salaam harbour, whereas it averages 40.7 ±17.3 ppm outside the harbour area. The concentration of Mn shows a general northward decrease (Fig. 2). Highest concentration of Zn is observable in the Dar es Salaam harbour and at the Kunduchi fish landing site. Zn concentration averages 58.4 ±23.5 ppm in the Dar es Salaam harbour and 7.2 ±8.5 ppm outside the harbour area (Table 1). The Dar es Salaam harbour has slightly elevated values of As that averages 469.4 ±113 ppb relative to other areas which average 202.6 ±141
DistributionofHeavymetalsinmsasanibay 77
As-C
once
ntra
tion
(ppb
)
0
200
400
600
800
Cd
Con
cnet
ratio
n (p
pm)
0
4
8
12C
r-Con
cent
ratio
n (p
pm)
0
10
20
30
40
Fe-C
once
ntra
tion
(ppm
)
0
4000
8000
12000
16000M
n-C
once
ntra
tion
(ppm
)
0
100
200
300
400
Ni-C
once
ntra
tion
(ppm
)
0
10
20
30
Distance (km) Dar es Salaam Harbour-Kunduchi
0 5 10 15 20 25 30
Cu-
Con
cent
ratio
n (p
pm)
0
10
20
30
Distance (km) Dar es Salaam Harbour-Kunduchi0 5 10 15 20 25 30
Zn-C
once
ntra
tion
(ppm
)
0
40
80
120
Co-
Con
cent
ratio
n (p
pm)
0
4
8
12
16
Pb-C
once
ntra
tion
(ppm
)
0
20
40
60
Fig. 2. Plots showing the south-north trend in concentration of various heavy metals in sediments, with all sampling sites transformed to lie on a straight line from Dar es Salaam harbour (south) to Fungu Yasin, Kunduchi area (south)
78 a.n.n.muzuka
ppb. Furthermore, the Cd concentration increases northward from the Dar es Salaam harbour to Kunduchi if 8 data points (enclosed in a box in Fig. 2) are excluded. The concentration of Cd, which averages 6.8±3.0 ppm, increases generally with increasing distance offshore. The concentration of Cd in the Dar es Salaam harbour is below average (lower than other areas outside the harbour). Furthermore, the Cd-concentration increases northward from the Dar es Salaam harbour to Kunduchi (Fig. 2). The Cd concentration is above the Canadian EPA (1976) standard of 2 ppm for sediments. Concentration of Ni is slightly elevated in the Msasani-Kunduchi area relative to the Dar es Salaam harbour area except at a site located in the Kunduchi fish landing site. Ni concentration in the Dar es Salaam harbour and Kunduchi-Msasani areas averages 15.5 ±3.0 and 16.8 ±6.5 ppm, respectively. Furthermore, there is a general increase northward from the Dar es Salaam harbour to Kunduchi as was with the case of Cd (Fig. 2). Ni concentration is positively correlated with Cd concentration (r = 0.838; p95 = 0.349).
DISCUSSION
The concentration of Cd and Ni increases northward from the Dar es Salaam harbour to the Msasani-Kunduchi area (Fig. 2), and also it increases offshore. Machiwa (1992) noted also high values of cadmium offshore for a core recovered east of Makatumbe Island located at the Dar es Salaam harbour entrance (Fig. 1). Because of the high toxicity of cadmium, which leads to an itai-itai disease that causes damage to kidney and bones, with bones becoming brittle, weak and breaking easily with accompanying pain and weakness (Matsuo 2003), elevated levels observed in this study could be an issue of concern. The trend of cadmium concentration in the study area could be explained by the transport mechanisms. Cadmium is generally derived from land through rivers and burning of fossil fuel and once it enters the aquatic environment it is readily incorporated into the food chain (Staniszewski et al., 2000). It is transported to deeper waters through re-suspended matter spreading just above the seabed. Organic matter content plays a role in transport of cadmium as most
of the cadmium is incorporated in organic matter (Pohl et al., 2003). The organic carbon and nitrogen in the study area averages 0.76% and 0.08% respectively, with a lack of clear northward trend from the Dar es Salaam harbour (Muzuka, 2001a,b). However, the stable isotopes of organic carbon for sediments collected from the Msasani area shows a northward increase owing to current pattern that flows northward (Muzuka, 2001b). Therefore, a northward increase in the concentration of Cd can be attributed to a northward transport of suspended matter just above the seabed. There is a general indication that nearshore and coastal currents in the vicinity of Dar es Salaam flows northwards (Dubi and Nyandwi 1999; Muzuka and Shaghude 2000; Nyandwi, 2001). Furthermore, wave height increases northward in the vicinity of Dar es Salaam (Nyandwi, 2001), with wave heights at Kunduchi being about 0.9 m during the southeast monsoon. Waves with this height magnitude are capable of stirring bottom sediments and creating a suspended layer close to the seafloor. Low concentration of cadmium in nearshore areas is a result of dilution by high sedimentation rates that are taking place in these areas. Mean values of Cd, and Ni in the study area are either equal or above threshold levels of various established sediment quality criteria (Table 2). Cadmium is scarce in igneous rocks and its presence in the marine environment is usually related to anthropogenic input from the atmosphere and rivers, and gives an indicator of coastal environments’ pollution level (Prego et al., 1999). Because Cd is very toxic at low concentration (Staniszewski et al., 2000) sediments in the study area can be considered as polluted, calling for an urgent need to identify the main sources of cadmium in the area. As pointed out previously, Pb concentration is generally constant throughout the study area with slightly elevated concentration in the Harbour area (Fig. 2). Also Pb-concentration is above the Florida “no effect” level (MacDonald, 1993), “no effect” level criteria of Persaud et al. (1989, 1992), and threshold effect level of Environment Canada (1994). This shows an anthropogenic impact to the environment that needs attention. Iron, which has been assumed to be a conservative element (Cosma et al., 1982; Blomqvist et al., 1992; Herut et al., 1993), is positively correlated with

DistributionofHeavymetalsinmsasanibay 79
Table 2. Comparison of the results of this study with various established levels of pollution (Note: 1Environment Canada (1994); 2Long et al. (1995); 3Persaud et al. (1989); 4CRC Press (1992); 5MacDonald (1993))
ppm As Cd Co Cu Cr Fe Mn Ni Pb Zn
Threshold effect levels1 7.24 0.68 18.7 52.3 15.9 30.2 124.0Effect range low2 8.20 1.20 34.0 81.0 20.9 46.7 150.0No effect Level3 4.00 0.60 15.0 22.0 400.0 15.0 23.0 65.0Average Conc. in Earth’s Crust4 1.80 0.20 55.0 100.0 950.0 75.0 12.5 70.0Florida no effect level5 8.00 1.00 28.0 33.0 21.0 68.0Dar Harbour 0.47 3.6 4.7 13.5 21.6 7254.6 132.6 15.5 35.4 58.4Out side Harbour 0.20 6.8 2.4 9.7 1975.0 40.7 16.8 29.7 7.2
Cd-Concentration (ppm)
0 2 4 6 8 10 12
Ni-C
on
ce
ntr
atio
n (
pp
m)
0
10
20
30
Cu-Concentration (ppm)0 5 10 15 20 25
Zn
-Co
nce
ntr
atio
n (
pp
m)
0
20
40
60
80
100
120
Cr-Concentration (ppm)0 10 20 30 40
Zn
-Co
nce
ntr
atio
n (
pp
m)
0
20
40
60
80
100
120
Mn-Concentration (ppm)0 100 200 300 400
Zn
-Co
nce
ntr
atio
n (
pp
m)
0
20
40
60
80
100
120
Fe-Concentration
0 4000 8000 12000 16000
Zn
-Co
nce
ntr
atio
n
0
20
40
60
80
100
120
Pb-Concentration (ppm)
0 10 20 30 40 50
Ni-C
on
ce
ntr
atio
n (
pp
m)
0
10
20
30
Cu-Concentration (ppm)
0 5 10 15 20 25
Mn
-Co
nce
ntr
atio
n (
pp
m)
0
100
200
300
400
Cr-Concentration (ppm)
0 10 20 30 40
Mn
-Co
nce
ntr
atio
n (
pp
m)
0
100
200
300
400
Fe-Concentration (ppm)
0 4000 8000 12000 16000
Mn
-Co
nce
ntr
atio
n (
pp
m)
0
100
200
300
400
Fe-Concentration
0 4000 8000 12000 16000
Cu
-Co
nce
ntr
atio
n (
pp
m)
0
10
20
30
40
Fe-Concentration (ppm)0 4000 8000 12000 16000
Cr-
Co
nce
ntr
atio
n (
pp
m)
0
10
20
30
40y = 2.22x + 5.09; r2 = 0.859y = 1.67x - 1.56; r = 0.651
y = 0.02x + 0.16; r2 = 0.888y = 7.4x - 26.3; r2 = 0.719y = 7.1x + 38.6; r2 = 0.490
y = 0.48x +2.22; r2 = 0.760y = 6.53x - 3.81; r2 = 0.724y = 0.27x + 0.48; r2 = 0.531
y = 1.62x + 6.87; r2 = 0.702 y = 3.49x + 4.14; r2 = 0.879 y = 2.37x - 11.56; r2 = 0.550
Fig. 3. Scatter plots for selected heavy metals having significant correlation

80 a.n.n.muzuka
Table 3. Correlation coefficients (r) among the determined concentrations of selected heavy metals
As (ppb) Cd (ppm) Co (ppm) Cu (ppm) Cr (ppm) Fe (ppm) Mn (ppm) Ni(ppm) Pb (ppm) Zn (ppm)
As (ppb) 1.000 Cd (ppm) -0.249 1.000 Co (ppm) 0.392 -0.373 1.000 Cu (ppm) 0.549 -0.447 0.674 1.000 Cr (ppm) 0.581 -0.231 0.681 0.674 1.000 Fe (ppm) 0.516 -0.404 0.822 0.807 0.927 1.000 Mn (ppm) 0.424 -0.367 0.924 0.700 0.848 0.943 1.000 Ni (ppm) -0.052 0.838 0.059 -0.064 0.223 0.077 0.102 1.000 Pb (ppm) 0.207 0.688 0.148 0.209 0.399 0.258 0.218 0.872 1.000 Zn (ppm) 0.573 -0.464 0.662 0.938 0.741 0.851 0.729 -0.048 0.263 1.000
As/F
e R
atio
0.0000
0.0002
0.0004
0.0006
0.0008
Cd/
Fe R
atio
0.000
0.005
0.010
0.015
0.020
Co/
Fe R
atio
0.0000
0.0002
0.0004
0.0006
0.0008
0.0010
0.0012
0.0014
Cu/
Fe R
atio
0.00000.00050.00100.00150.00200.00250.00300.00350.0040
Cr/F
e R
atio
0.0000.0020.0040.0060.0080.0100.0120.0140.0160.018
Mn/
Fe R
atio
0.0100.0150.0200.0250.0300.0350.0400.0450.050
Distance (km) Dar es Salaam Harbour-Kunduchi
0 5 10 15 20 25 30
Pb/F
e R
atio
0.00
0.02
0.04
0.06
0.08
Distance (km) Dar-es Salaam Harbour-Kunduchi
0 5 10 15 20 25 30
Zn/F
e an
d N
i/Fe
Rat
ios
0.000
0.005
0.010
0.015
0.020
0.025
0.030
0.035Ni/FeZn/Fe
Fig. 4. Northward variation in metal/iron ratio from Dar es Salaam harbour to Kunduchi

DistributionofHeavymetalsinmsasanibay 81
Mn, Zn, Cu, and Cr at 95% confidence level (Fig, 3; Table 3). This may indicate a common origin and association of these metals (Cox and Preda, 2005). Furthermore, a northward increase in the ratio of metal to iron for Pb, Cd, Mn, and Ni suggest reduced rate of input of iron relative to these metals northward. The ratio of metal to iron for Cu, Zn and Co shows a decrease with increasing distance from the Dar es Salaam harbour (Fig. 4). Arsenic is mainly released to the environment through coal burning and discharge of domestic wastes (Cox and Preda, 2005). Since the level of coal burning in the city of Dar es Salaam is low, elevated level of arsenic in the Dar es Salaam harbour could be related to the discharge of domestic wastes. Arsenic, which is a biophilic element in the ocean, is scavenged from seawater by the organic matter fraction in a manner somewhat similar to the behaviour of Zn (Minami and Kato (1997). Arsenic is re-mobilized in reducing conditions and is subsequently re-adsorbed on oxides and hydroxides of iron in the aerobic layer. The Dar es Salaam harbour is currently a sink of organic matter with elevated values of organic carbon relative to areas outside the harbour (Muzuka, 2001b). Comparison of the present results with the previous works shows that Cd, Cu and Zn values in this study are similar to those reported by Machiwa (1992), but deviate slightly from those of Machiwa (2000) and Mremi and Machiwa (2003). Ni concentration is close to all previous works (Machiwa, 1992, 2000; Mremi and Machiwa, 2003). Also the concentration of Co reported in this study is comparable to the one reported by both Machiwa 2000 and Mremi and Machiwa 2003. The Dar es Salaam harbour has elevated concentration values of As, Co, Cr, Cu, Mn and Zn when compared to areas outside the harbour (Fig. 2). This is because a large number of industries, which are potential sources of these metals, are located in the city of Dar es Salaam with the majority of the industrial establishments (64%) being located in the Temeke Municipality (Dar es Salaam City Council, 2004). Most of the industries located in the Temeke Municipality discharge wastes such as heavy metals, pesticides, organic contaminants and paint wastes into streams and storm water canals that terminate in the harbour area. For example, the Karibu Textile Mill in Temeke discharges its
effluent (hot waste products) directly to the Mzinga stream. Because of this, concentration of Pb, Zn and Ni is higher in Kizinga stream (Mgaya et al., 2004) than in the Dar es Salaam harbour. Apart from industries, shipping activities may contribute to the observed metal concentration particularly Pb from paints. Although the concentration of these metals is high in the Dar es Salaam harbour, their levels are below the threshold level values of various established sediment quality criteria (Table 1) suggesting that the anthropogenic impact from industrial development pressure is still low.
CONCLUSION
The cadmium concentration, which is above threshold level, could be dangerous to human health. It is transported to offshore areas through suspended organic matter as a fluff layer near the seabed and through atmospheric deposition. Pb and Ni, possibly resulting from car emissions, are slightly above threshold levels and action needs to be taken to abate future increase of these metals. Generally, the Tanzanian coastal sediments in the vicinity of the city of Dar es Salaam are relatively clean except for the Cd, Pb and Ni. The Dar es Salaam port is currently a sink of most of the heavy metals although the concentrations of some metals are below threshold levels. More detailed studies are recommended to identify the major sources of Cd, Pb and Ni in the coastal water.
Acknowledgement—The author is grateful for the anonymous reviewers for their constructive comments that led to improvement in the quality of this paper. I gratefully acknowledge for the field assistance accorded to me by Mohammed Nur, Mohammed Suleiman and Evans Edward. I am also grateful for the, laboratory assistance accorded to me by Dotto Salum and Southern and Eastern African Mineral Centre (SEAMIC). This work was made possible by SIDA SAREC core support programme.
REFERENCE
A’khabuhaya J. & Lodenius M. (1988) Metal pollution of River Msimbazi, Tanzania. Environment International 14: 511-514.

82 a.n.n.muzuka
Binning, K. & Baird, D. (2001) Survey of heavy metals in the sediments of the Swartkops river estuary, Port Elizabeth South Africa. Water South Africa 27, 461-466.
Blomqvist, S. Larsson, U. & Borg, H., (1992) Heavy metal decrease in the sediments of a Baltic Bay following tertiary sewage treatment. Marine Pollution Bulletin 24: 258-266.
Caplat, C., Texier, H., Barillier, D. & Lelievre, C. (2005) Heavy metals mobility in harbour contaminated sediments: The case of Port-en-Bessin. Marine Pollution Bulletin 50, 504-511.
Cosma, B., Frache, R., Baffi, F. & Dadone, A. (1982) Trace metals in sediments from the Ligurian coast, Italy. Marine Pollution Bulletin 13: 127-132.
Cox, M. E. & Preda, M. A. (2005) Trace metal distribution within marine and estuarine sediments of western Moreton Bay, Queensland, Australia: Relation to land use and setting. Geographical Research 43: 173-193.
CRC Press. (1992) CRC Handbook of Chemistry and Physics. 73rd ed. Boca Raton, FL.
Dar es Salaam City Council, 2004. City Profile for Dar es Salaam, United Republic of Tanzania (un published report).
Dongus, S. (2001) Urban Vegetable Production in Dar es Salaam (Tanzania) – GIS-supported Analysis of Spatial Changes from 1992 to 1999. In: 1 Applied Physiogeography of the Tropics and Subtropics (APT)-Reports 12, July 2001. S. 100-144. Freiburg.
Dubi A. M. & Nyandwi N. (1999) Preliminary studies for the mitigation and control of coastal erosion at Kunduchi Beach, Dar es Salaam. Research Report No. IMS/1999/01 of May 1999. Institute of Marine Sciences, University of Dar es Salaam.
Environment Canada (1994) Interim Sediment Quality Assessment Values. Manuscript Report No. ECD. Ottawa, Canada: Ecosystem Conservation Directorate, Environment Canada.
EPA 1976, Heavy metals in the sediments of Port Phillip Bay and input streams, Environment Protection Authority, Victoria, Report no. 16/76.
Gangaiya, P., Tabudravu, J., South, R. & Sotheeswaran, S. (2001) Heavy metal contamination of the Lami coastal environment, Fiji. South Pacific Journal of Natural Science 19, 24-39.
Herut, B., Hornung, H., Krom, M. D., Kress, N. & Cohen, Y. (1993) Trace metals in shallow sediments from the Mediterranean coastal region of Islael. Marine Pollution Bulletin 26: 675-682.
Long, E..R., MacDonald, D. D., Smith, S.L. & Calder F.D. (1995) Incidence of adverse biological effects within ranges of chemical concentration in marine and estuarine sediments. Environmental Management 19: 81-87.
MacDonald, D. D. (1993) Development of an approach to the assessment of sediment quality in Florida coastal waters. Florida Department of Environmental Regulation, USA.
Machiwa, J. F. (1992) Heavy metal content in coastal sediments off Dar es Salaam, Tanzania. Environment International 18: 409-415.
Machiwa, J. F. (2000) Heavy metals and organic pollutants in sediments of Dar es Salaam Harbour prior to dredging in 1999. Tanzania Journal of Science 26: 29-46.
Man, K-W., Zheng, J., Leung, A. P. K., Lam, P. K. S., Lam, M. H-W. & Yen, Y-F. (2004) Distribution and behavior of trace metals in the sediment and porewater of a tropical coastal wetland. Science of the Total Environment 327, 295-314.
Matsuo, T., (2003) Japanese experiences of environmental management. Water Science and Technology 47, 7-14.
McCready, S., Birch, G. F. & Long, E. R. (2006) Metallic and organic contaminants in sediments of Sydney Harbour, Australia and vicinity – A chemical dataset for evaluating sediment quality guidelines. Environment International 32, 455-465.
Mgana S. & Mahongo S. (1997) Eastern African Action Plan: Strategic Action Plan for Land-Based Sources and Activities Affecting the Marine, Coastal and Associated Fresh Water Environment in the Eastern African Region. A Report prepared by Food and Agriculture Organisation of the United Nations project for the Protection and Management of the Marine and Coastal Areas of the Eastern African Region (EAF/5)
Mgaya, Y. D., Machiwa, J. F., Lugomela, C., Lyimo, T., Joseph, C., Muzuka, A.N.N, Shaghude, Y.W., Mvungi, A., Mapunda, B. & Mwanuzi, F. L. (2004) Environmental studies of Mtoni mangrove ecosystem, Dar es Salaam. Unpublished Report.
Minami H., & Kato, Y. (1997) Remobilization of arsenic in sub-oxic sediments from the seafloor of the continental margin. Journal of Oceanography 53, 553-562.
Mremi, S. D. & Machiwa, J. F. (2003) Heavy metal contamination of mangrove sediments and the associated biota in Dar es Salaam, Tanzania. Tanzania Journal of Science 29: 61-76.
Muzuka, A. N. N. (2001a) Sources and diagenetic alteration of organic matter in coastal waters at the vicinity of Dar es Salaam, Tanzania. Tanzania Journal of Science 27: 39-55.
Muzuka, A. N. N. (2001b) Sources of organic matter in the Msasani Bay and Dar es Salaam Harbour. In: Richmond, M. D. and Francis, J. Marine Science Development in Tanzania and Eastern Africa.

DistributionofHeavymetalsinmsasanibay 83
Proceedings of the 20th Anniversary Conference on Advances in Marine Science in Tanzania, p. 61-76.
Muzuka, A.N.N. & Shaghude, Y.W. (2000) Grain size distribution along the Msasani beach north of the Dar es Salaam harbour. Journal of African Earth Sciences 30, 417–426.
Nyandwi, N.(2001) Reassessment of the nature of beach erosion north of Dar es Salaam, Tanzania. In:Richmond, MD, Francis J, Marine Science Development in Tanzania and Eastern Africa. Proceedings of the 20th Anniversary Conference on Advances in Marine Science in Tanzania, p. 107-120.
Perkin-Elmer Corporation (1994) Analytical methods for Atomic Absorption Spectrometry.
Persaud, D., Jaagumagi, R. & Hayton, A. (1989). Development of Provincial Sediment Quality Guidelines. Toronto: Ontario Ministry of the Environment, Water Resources Branch, Aquatic Biology Section.
Persaud, D., Jaagumagi, R. & Hayton, A. (1992) Guidelines for the Protection and Management of Aquatic Sediment Quality in Ontario. Toronto: Ontario Ministry of the Environment.
Pohl, C., Löffler, A. Hennings, U. (2003) A sediment trap flux for trace metals under seasonal aspects
in the stratifed Baltic Sea (Gotland Basin; 57o19.20’N; 20o03.00’E). Marine Chemistry 84, 143-160.
Prego, R., Segarra, M. J. B., Helios-Rybicka, E. & Barciela, M. C. (1999) Cadmium, manganese, nickel and lead contents in surface sediments of the lower Ulla River and its estuary (northwest Spain). Boletin Instituto Espańol de Oceanografia 15, 495-500.
Sarkar SK, Bilinski SF, Bhattacharya A, Saha M, Bilinski H. (2004) Levels of elements in the surficial estuarine sediments of the Hugli River, northeast India and their environmental implications. Environ Int; 30: 1089– 98.
Soto-Jiménez, M., Páez-Osuna, F., and Morales-Hernández, F. 2001. Selected trace metals in oysters (crassostrea iridescens) and sediments from the discharge zone of the submarine sewage outfall in Mazatlán Bay (southeast Gulf of California): chemical fractions and bioaccumulation factors. Environmental Pollution 114, 357-370.
Staniszewski A., Pazdro K., Bełdowski J., Leipe T., Emeis K.-C. and Pempkowiak J. 2000. Temporal and spatial changes of cadmium in the near-bottom suspended matter of the Pomeranian Bay – Arkona Deep system. Oceanologia 42, 483–491.


![Ecological Risk Assessment of Heavy Metals in Coastal ...the highest concentrations of toxic heavy metals in marine environment are found in sediments [1,6,7]. Coastal sediments are](https://static.fdocuments.in/doc/165x107/60777613a46f6a043806f637/ecological-risk-assessment-of-heavy-metals-in-coastal-the-highest-concentrations.jpg)