Distribution of Gold, Tellurium - U.S. Geological … of Gold, Tellurium Silver, and Mercury in Part...
16
Distribution of Gold, Tellurium
Transcript of Distribution of Gold, Tellurium - U.S. Geological … of Gold, Tellurium Silver, and Mercury in Part...
Distribution of Gold, Tellurium


Distribution of Gold, Tellurium Silver, and Mercury in Part of the Cripple Creek District, Colorado
By Garland B. Gott, J. Howard McCarthy, Jr.
Gordon H. VanSickle, and John B. McHugh
GEOLOGICAL SURVEY CIRCULAR 543
Washington J 967

United States Department of the Interior STEWART L. UDALL, Secretary
Geological Survey Wiltiam T. Pecora, Director
First printing 1967
Second printing 1967
Third printing 1969
Free on application to the U.S. Geological Survey, Washington, D.C. 20242
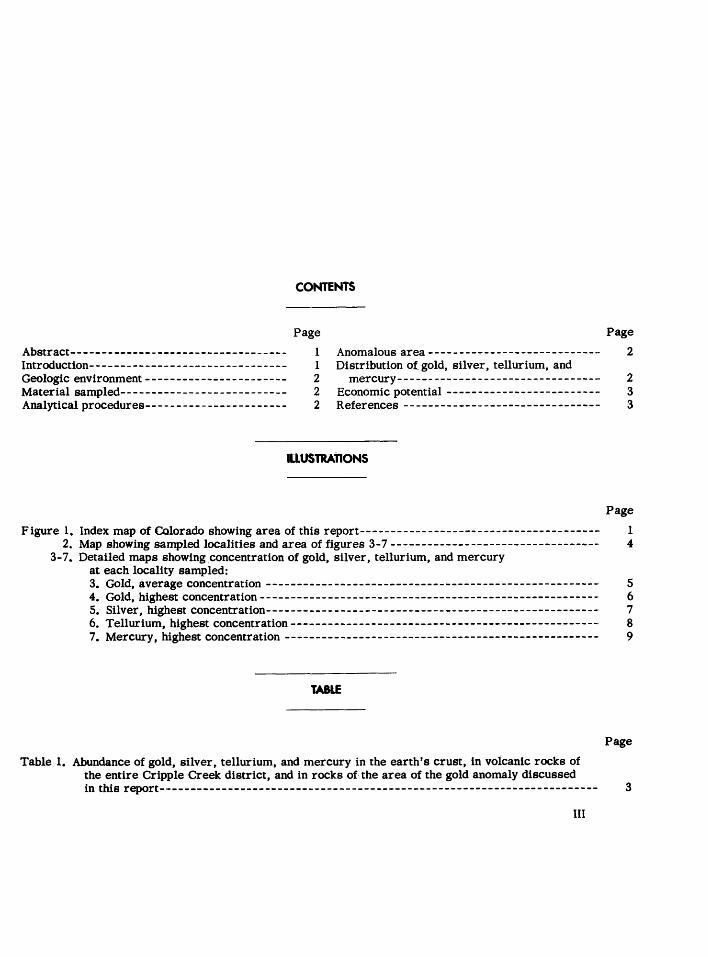
Abstract----------------------------------Introduction--------------------------------Geologic environment----------------------Material sampled--------------------------Analytical procedures-----------------------
CONTENtS
Page
1 1 2 2 2
Anomalous area --------------- ------------ ~ Distribution of gold, silver, tellurium, and
mercury---------------------------------Economic potential -------------------------References --------------------------------
IUUSTRATIONS
Page
2
2 3 3
Page
Figure 1. Index map of Colorado showing area of this report--------------------------------------~ 1 2. Map showing sampled localities and area of figures 3-7 ----------------------------------· 4
3-7. Detailed maps showing .concentration of gold, silver, tellurium, and mercury at each locality sampled: 3. Gold, average concentration ------------------------------------------------------ 5 4. Gold, highest concentration------------------------------------------------------- 6 5. Silver, highest concentration------------------------------------------------------ 7 6. Tellurium, highest concentration-------------------------------------------------- 8 7. Mercury, highest concentration --------------------------------------------------- 9
Table 1. Abundance of gold, silver, tellurium, and mercury in the earth's crust, in volcanic rocks of the entire Cripple Creek district, and in rocks of the area of the gold anomaly discussed
Page
in this report----------------------------------------------------------------------- 3
III


Distribution of Gold, Tellurium, Silver, and Mercury in part of thq
Cripple Creek district, Colorado
By Garland B. Gott, J. Howard McCarthy, Jr., Gordon H. VanSickle, and John B. McHugh
ABSTRACT
Geochemical exploration studies were undertaken in the Cripple Creek district to test the possibility that large low-grade gold deposits might be found. Surface rock samples taken throughout the district indicate that the volcanic rocks between the productive veins contain an average of about 0.6 ppm (part per million) gold, ln an area about 3,800 feet long and 500 feet '!ide near the Cresson mine in the south-central part of the district, scattered surface samples show that the rocks contain an average of 2.5 ppm gold, equivalent to $2.50 per ton. Inasmuch as veins that contain more than 2.5 ppm may also exist ln the area, systematic sampling by trenching and drilling is warranted.
The famous Cripple Creek mining district, 20 miles southwest of Colorado Springs, Colo. (fig. 1), has produced about 21 million ounces of gold since its discovery in 1891. Value of this gold exceeds the total output from all other mining districts in the Front Range combined (Lovering and Goddard, 1950, p. 7). In the past decade, however, the last major mill and the last of the active mines were closed, threatening an end to the productive life of the district. As the mining potential of blocks of ground-as contrasted to that of veins alone-has not been extensively investigated, the Geological Survey recently begangeochemical testing over the district as a whole, and the U.S. Bureau of Mines has made an engineering and economic study of the potential for large-scale surface mining operations in the district. This report pertains to the strongest and most extensive gold anomaly found during the geochemical investigation. A geochemical report on the entire district, giving all the analytical data, will be published later.
the gold in unoxidized ore occurs as tellurideL The recent development of sensitive analytical methods and techniques for the determination of tellurium (Lakin and Thompson, 1963}, mercury(VaughnandMcCarthy, 1964}, silver (Nakagawa and Lakin, 1965}, anci gold (Lakin and Nakagawa, 1965) makes it possibletostudy the geochemical distribution and abundance of these elements. The gold deposits have been descrit~ by Cross and Penrose (1895}, Lindgren and Ransome (1906), Loughlin (1927), Loughlin and Koschmann (1935), Kosch mann (1949}, and Lovering and Goddard (1950).
Acknowledgments.-lt is a pleasure to acknowledge the warm cooperation of Max Bowen, Presidenr.. and Charles Carlton, Manager of Mines, of the Golden Cycle Corp. The authors appreciate the assistance d•lring the field investigations by Prof. Gunther Frie~rich, Professor of Geochemistry, U n i v e r sit y of Aa~hen, West Germany.
108" ----2r--:_...!.o.!:------- - I C)
z <[
z 0 a:: lL
·~ _;-, TELL~R! ~ ~LOitADO ....... .
COUNTY ~.!3f:~:ICL1t rka
I I
\
The investigations included a study of the distri- 3a·l----+-------+--------l....::::::.."'=""-f::=::===~ bution in surface rocks of gold, silver, tellurium, and mercury-elements commonly associated in gold deposits. The high mobility of mercury and tellurium apparently permits them to form a primary leakage halo above deposits of less mobile metals such as gold, and their geochemical distribution may therefore furnish clues to the distribution of gold and silver. At Cripple Creek, tellurium in particular was considered to be a potentially useful indicator because most of
1
--~~--- ______ __.
50 0 50 100 MILES
Figure 1.-Index map of Colorado showing areaofthis report,

GEOLOGIC ENVIRONMENT
The gold deposits of the Cripple Creek district are largely confined to a roughly elliptical volcanic subsidence basin abo4t 4 miles long and 2 miles wide that is surrounded by Precambrian granite, gneiss, and schist (fig. 2). The basin is filled with fractured and brecciated fragmental rocks, chiefly latite-phonolite and phonolite, of Tertiary (Miocene) age. Rocks ofthe basin are mainly volcanic near the surface but include increasing amounts of nonvolcanic material at depth. The v,olcanic rocks_ are intruded by dikes and irregular masses of phonolite, latite-phonolite, trachyte, syenite, trachydolerite, vogesite, and monchiquite. Brecciation and fracturing were caused mostly by subsidence of the consolidated fragmental rocks in the basin and recurrent explosive eruptions. The major fracture system trends generally north, and it is in these fractures that gold telluride ores were localized.
Investigations by Loughlin and-Koschmann (1935) indicate that the mineralizing solutions entered the volcanic co~plex through sevez:al channel ways and migrated upward and laterally through the main fissure zones. As these solutions ascended they spread outward into shallower subsidiary fracture zones. Most of the ore deposits are in the relatively shallow subsidiary fracture zones, but some of those within the main fissure zones continue to the deepest workings, 3,000 feet or more below the surface.
MA11RJAL SAMPLED
Samples of bedrock are difficult to obtain in the district because outcrops are scarce and much ground is covered by mine dumps. Most samples were collected, therefore, from shallow pits that had been dug to bedrock by the early prospectors; sample locations are shown infigure2. Manyofthesepitshave been partially refilled by surficial debris during the years since they were dug, and at these the bedrock material on the dumps was sampled. The lack of bedrock exposures made it impossible to sample systematically, and consequently the set of samples may not be representative of all the bedrock. The analytical data presented here probably are lower than would be obtained if bedrock could have been sampled directly; the pits sampled were shallow presumably because they lacked any mineralized structures, such as small veins or joint surfaces, to lure the prospector onward.
ANALYTICAL PROCEDUI!S
Gold was determined by a wet chemical method using atomic absorption spectrophotometry. The results obtained by this method are very close to those given by fire assay, as shown in the following table in which analyses of 10 samples by both methods are compared.
Analyses (prm)
SBIIIple Atomic: absorption CC- (by Gordon H. VanSic:kle)
5oo---- 2.2 503---- .1 506A-- 3,3 508--- 14.3 512---- 6,2 514B--- 7.5 514D-- 4,6 Sl6-- S,7 519A--- 7,4 5208----- 3.4
Fire auay (by'(), H, Parker, J, D. Mensik, and Claude
Huffman, Jr.)
2.0 ,07
2.5 14,1 5,4 7.1 4,3 s.o 6,1 2,8
Tellurium was determined by a se~sitivewetchemical method developed by Lakin and Thompson (1963). Silver was determined by a wet cl'~mical catalytic method using atomic absorption; and mercury was determined instrumentally by an atomic absorption technique (Vaughn and McCarthy, 1964 ).
ANOMALOUS AREA
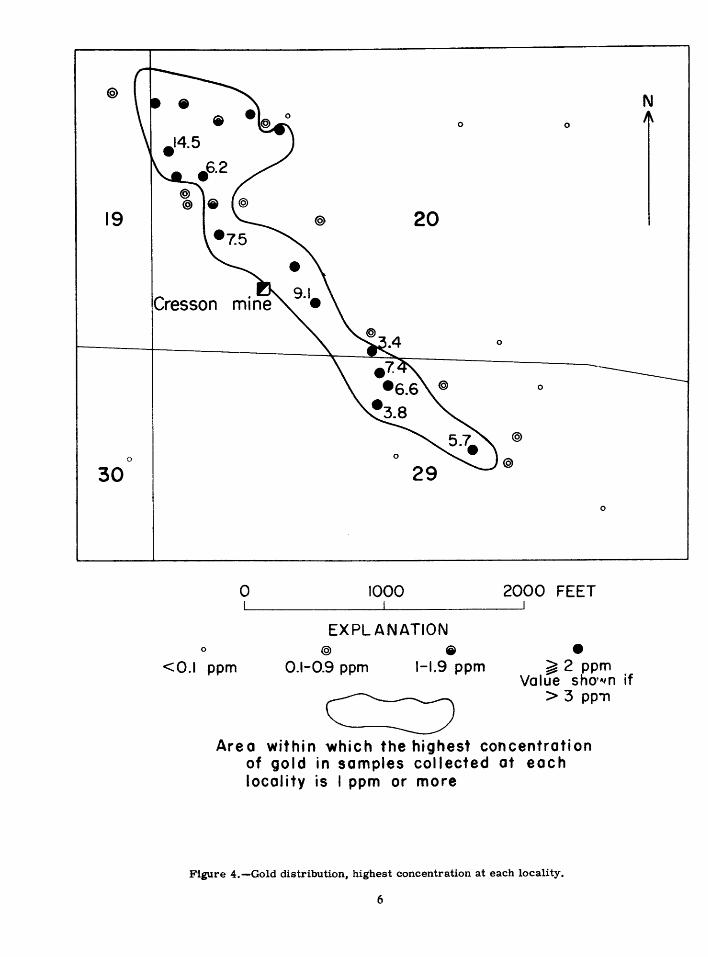
An extensive gold anomaly isshow.,bythegeochemical sampling in the vicinity of the Cresson mine in the SE!ai: sec. 19, SW!ai: sec. 20, and NE¥ sec. 29. The area extends about 2,000 feet northw~stwardand2,000 feet southeastward from the Cresson mine. W it hi n this area 2 to 5 samples were collected at each locality sampled. The average concentration of gold in samples at each locality is shown on figure 3, and the highest concentration of gold, silver, tellurium, and mercury in samples at each locality is show"'\ on figures 4, 5, 6, and 7, respectively. The area witr'nwhichall samples contain at least l ppm (part pe':" million) gold is about 3,800 feet long and 500 feet wicte. Average value (arithmetic) of 49 samples from witt~.n this area is 2.5 ppm gold (approx $2.50 per ton); irdividual samples range from 1 to 14.5 ppm.
DfSTRIIUTION Of GOLD~ SILVER, TELLURIUM, AND MERCUIY
Distribution patterns of gold, silv<?.r, and tellurium (figs. 3-6) are nearly identical in th~ anomalous area; the distribution of mercury (fig. 7) is similar but more restricted. The distribution pattern<;~ of gold, silver, and tellurium probably reflect the distribution of gold and silver tellurides. Table 1 shows the average concentration and the enrichment above ~rustal abundance of the four metals. Although mercury-in the form of cinnabar-occurs locally in the distri~t. it is not greatly enriched above crustal abundance h the area of this report. Tellurium and gold are gre:11tly enriched and silver is moderately so. The mercury in the goldbearing veins probably was emplaced during the waning and cooling stages of mineralizatio'1, Such an interpretation is strongly supported by the occurrence of late-stage cinnabar in the Cresson mine, where it locally coats the gold tellurides.
2

Table 1.-Abundance of gold. silver, tellurium. and mercury in the earth's crust, in volcanic rocks of the entire Cripple Creek district, and in rocks of the area of the gold anomaly discussed in this report
Gold
Earth's crust---pp- .!/o,oo2s Cripple Creek district:
Average concentration (282 saaples) in volcanic rocks
!~:~~:~~~~-~--do- ,6 Average concentration
(49 samples) within the gold anomaly--do- 2,5
Enrichment within the gold anomaly in ex-cess of that in the earth 'a crust (factor)----------- 1,000
.!/From DeGrazia and Haskin (1964), 1/From Goldschmidt (1958),
Silver Telluriua Mercury
l/o.o2 Yo.oo2 llo.o6
.92 2,7 .19
3,1 10,7 • 75
155 5,350 12.5
~From Green (1959), i/ Analysts: Gold, Gordon II, VanSickle; sUver, H, H, l>akagawa and
J, B, McHugh; tellurium, J, B. :tcHugh; mercury, Henriette llcCarthy and ll, W, JS!lea•
ECONOMIC POTENTIAL
The Cripple Creek district has produced gold valued at nearly one-half billion dollars at the time of sale, and worth nearly three-quarters of a billion dollars at the present price. It seems unlikely that all the gold within the district has been extracted, but exploration and mining of veins similar to those that have been mined in the past probably would be prohibitively expensive. Because of this and because more gold has been mined from s h a 11 ow deposits than from deep ones, the best possibility for the discovery and development of additional gold reserves within the district appears to be large low-grade deposits that can be mined by low-cost methods from the surface.
The anomalous area described in this report conceivably could constitute just such a deposit, particularly since the concentrations reported herein are thought to approach minable grade. The com p u t e d amount of rock within the anomalous area is about 15 million tons per 100 feet of depth; and if the aver age grade is 2.5 ppm gold as the samples at the surface suggest, a mass of rock of this size would contain about $37.5 million worth of gold. Inasmuch as the deepest mining within the district has reached 3,000 feet, the body of rock of this grade could reasonably be expected to extend to depths of at least s ever a 1 hundred feet.
Whether or not the results of preliminary sampling reported here are representative of the gold content of a large body of rock, they identify an area sufficiently anomalous in gold to warrant systematic sampling, including such trenching or drilling as might be necessary to allow the sampling. Trenching would be
required to obtain either grid or channel samples ·of the bedrock in much of the area, and angle dr~u holes would be required to reach the bedrock beneath large dumps. The U.S. Bureau of Mines is currently planning such sampling in its program of research on s·ampling of low -grade deposits.
Cross, Whitman, and Penrose, R. A. F., Jr., 1895, Geology and mining industries of the Cripple Creek district, Colorado: U.S. Geol. Survey 16th Ann. Rept., pt. 2, p. 1-209.
DeGrazia, A. R., and Haskin, Larry, 1964, On the gold contents of rocks: Geochim. et Cosmochim. Acta, v. 28, no. 5, p. 559-564 •
Goldschmidt, V. M., 1958, Geochemistry [ed. by Alex Muir]: London, Oxford Univ. Press, 730 p.
Green, Jack,. 1959, Geochemical table of the dements for 1959: Geol. Soc. America Bull., v. 70, p. 1127-1184.
Koschmann, A. H., 1949, Structural control ofthegold deposits of the Cripple Creek district, T e 11 e r County, Colorado: U.S. Geol. Survey Bull. 955-B, p. 19-58.
Lakin, H. W., and Nakagawa, H. M., 1965, A spectrophotometric method for the determination of traces of gold in geologic materials,.!.!!.. Ge:0logical Survey research 1965: U.S. Geol. SurvP.y Prof. Paper 525-C, p. Cl68-Cl71.
Lakin, H. W., and Thompson, C. E., 1963, Telluriuma new sensitive test: Science, v. 141, no. 3575, p. 42-43.
Lindgren, Waldemar, and Ransome, F. L., 19C'S, Geology and gold deposits of the Cripple Creek district, Colorado: U.S. Geol. Survey Prof. Paper 54, 516p.
Loughlin, G. F., 1927, Ore at deep levels in the Cripple Creek district, Colorado: Am. Lnst. Minin~Metall. Engineers Tech. Pub. 13, 32 p.
Loughlin, G. F., and Koschmann, A. H., 1935, Geology and ore deposits of the Cripple Creek dis t r i c t, Colorado: Colorado Sci. Soc. Proc., v. 13, no. 6, p. 217-435.
Lovering, T. S., and Goddard, E. N., 1950, Geology and ore deposits of the Front Range, Colorado: U.S. Geol. Survey Prof. Paper 223, 319 p.
Nakagawa, H. M., and Lakin, H. W., 1965, A field method for the determination of silver in soils and rocks, in Geological Survey research 19<--5: U.S. Geol. Survey. Prof. Paper 525-C, p. C172-CL75.
Vaughn, W. W., and McCarthy, J. H., Jr., 1964, An instrumental technique for the determination of submicrogram concentrations of mercury in soils, rocks, and gas, in Geological Survey research 1964:
3
U.S. Geol. Survey Prof. Paper 501-D, p. 0123-0127.

4 6 2 5
10
38° Tv
..e' 14 13 18 .
I~ ~~
:·
23 24 . • 19 •• 20 .... ., 21 22 .. ~· .: ..
Tv . •I . . ..
26 25 29 2.7
Tv
p£g
31 32 . 33 34 . . . . . .... . . ..
R.70W. R.69W.
1 0 1 2 MILES
Figure 2.-Map showing sampled localities (dots) and area of figures 3-7 (heavy rectangle). T•• Tertiary brecciated volcanic rocks; p(:g, Precambrian granite and some gneiss and schist.
4
T. 18 s.

@
19
@
30
0 0
20
Cresson
0
0
0
0 @
0
0 1000 2000 FEET
EXPLANATION 0 • <0.1 ppm
@
0.1-0.9 ppm • 1-1.9 ppm ~ 2 ppm Value shown if
> 3 ppm
Area within which the average concentration of gold in samples collected at each locality is I ppm or more
Figure 3.-Gold distribution, average concentration at each locality.
5
N
19
0
30
0 0
20
Cresson
0
0
@)
0 @)
29
0
0 1000 2000 FEET
EXPLANATION 0 •
<0.1 ppm @
0.1-0.9 ppm ~
1-1.9 ppm ~ 2 ppm Value sho~"'n if
c:::J > 3 pp11
Area within which the highest concentration of gold in samples collected at each locality is I ppm or more
Figure 4.-Gold distribution, highest concentration at each locality.
6
N

0
0 0
~ ~
19 20
0
30
Cresson
0
0
0
@
0 1000 2000 FEET
EXPLANATION 0 • <0.5 ppm
@
0.5-0.9 ppm • 1-9.9 ppm ~10 ppm
c:::J Area within which the high:est concentration
of silver in samples collected at each I oca1ity is I ppm or more
Figure 5.-silver distribution. highest concentration at each locality.
7

19
@
30
0
20
0
• 0
@ 29
@
0 1000 2000 FEET
EXPLANATION 0 • <0.1 ppm
@)
0.1-0.9 ppm • 1-9.9 ppm ~ 10 pr71
c:::J Value sho~"n if
>tOO Pr'Tl
Area within which the highest concentration of tellurium in samples collected at each locality is 10 ppm or more
Figure G.-Tellurium distribution. highest concentration at each locality.
8
N

®
19
0
30
0 ® @) ® 0
0@ 0 @
@
0
@ 20
Cresson
0
0 0
0
@ @
0
29
0
0 1000 2000 FEET
EXPLANATION 0
<0.1 ppm @
0.1-0.9 ppm • 1-9.9 ppm • 10-100 ppm
C:::J Area within which the highest concentration
of mercury in samples collected at each locality is I ppm or more
Figure 7.-Mercury distribution. highest concentration at each locality.
r-~
9 'k U. S. GOVERNMENT PRINTING OFFICE : 1968 0 - 329 ·504