Distribution Netting of Cutthroat and Lake Trout
10
7 Distribution Netting of Cutthroat and Lake Trout To effectively implement an adaptive management strategy for Yellowstone Lake, we needed to enhance efforts to monitor the status of the lake trout and cutthroat trout populations. In August 2009 and 2010 we used methods developed in the late-1990s by Ruzyki (2004) for this purpose. In 2009, nets were set at two depths and in 12 locations. In 2010, we set nets at three depth strata at 24 randomly chosen sites. Through collaboration with the US Geological Survey, Montana Cooperative Fishery Research Unit, we intend to develop a statistically robust design for this long-term monitoring program. The information obtained by this monitoring will be key in determining if benchmarks for lake trout mortality and cutthroat trout recovery are being met, and whether adjustments to conservation actions should be made. Fall Netting Assessment of Cutthroat Trout In 2009 and 2010, staff continued to monitor the YCT population in Yellowstone Lake with an annual gill net assessment. In 2009, 524 cutthroat trout (9.5 trout/ net; fig. 3) were sampled in eleven sampling locations. This was the highest catch since 1998 and continued a trend of increasing cutthroat trout catches since 2001. The number of cutthroat trout sampled dropped drastically in 2010 to just 289 cutthroat trout (5.3 trout/ net), the lowest catch since 1977 (fig. 3). Mean fish lengths in 2009 and 2010 were 310 mm and 334 mm respectively. While mean fish length has not changed drastically over the past decade, there has been a shift in the length frequency of sampled cutthroat trout (fig. 4). Over the past several years there has been a decline in the proportion of the population in the 330–450 mm size range. Historically, fish in this size class were the most abundant fish sampled and made up the majority of the spawning population. Lake trout predation on smaller size-classes of fish is likely preventing YCT from surviving to adulthood and continues to affect spawning and juvenile survival. Increased efforts to suppress the lake trout population are intended to allow more cutthroat trout to survive to spawning age. Lake Trout Suppression Program Overview Nonnative lake trout, discovered in Yellowstone Lake in 1994, pose a serious threat to its native YCT population. Since their discovery, the NPS has been working to 0 5 10 15 20 25 0 10 20 30 40 50 60 70 80 1975 1980 1985 1990 1995 2000 2005 2010 Clear Creek Fall Netting Assessment Spawners Moving Upstream at Clear Creek (x10 4 ) Average Catch per Net in Yellowstone Lake Figure 3. Total number of upstream-migrating cutthroat trout counted at the Clear Creek spawning migration trap and mean number of cutthroat trout collected per net during the fall netting assessment on Yellowstone Lake (1976–2010). Yellowstone Cutthroat Trout # of Yellowstone Cutthroat Trout Total Length Category (mm) 1980 1990 2000 2010 12 10 8 6 4 2 0 100 150 200 250 300 350 400 450 500 550 600 Figure 4. Percent frequency of Yellowstone cutthroat trout in 10-mm size class increments sampled during the annual fall netting assessment of Yellowstone Lake. NPS Chelsey Pasbrig displays lake trout caught in NPS nets.
Transcript of Distribution Netting of Cutthroat and Lake Trout
7
Distribution Netting of Cutthroat and Lake Trout
To effectively implement an adaptive management strategy for Yellowstone Lake, we needed to enhance efforts to monitor the status of the lake trout and cutthroat trout populations. In August 2009 and 2010 we used methods developed in the late-1990s by Ruzyki (2004) for this purpose. In 2009, nets were set at two depths and in 12 locations. In 2010, we set nets at three depth strata at 24 randomly chosen sites. Through collaboration with the US Geological Survey, Montana Cooperative Fishery Research Unit, we intend to develop a statistically robust design for this long-term monitoring program. The information obtained by this monitoring will be key in determining if benchmarks for lake trout mortality and cutthroat trout recovery are being met, and whether adjustments to conservation actions should be made.
Fall Netting Assessment of Cutthroat Trout
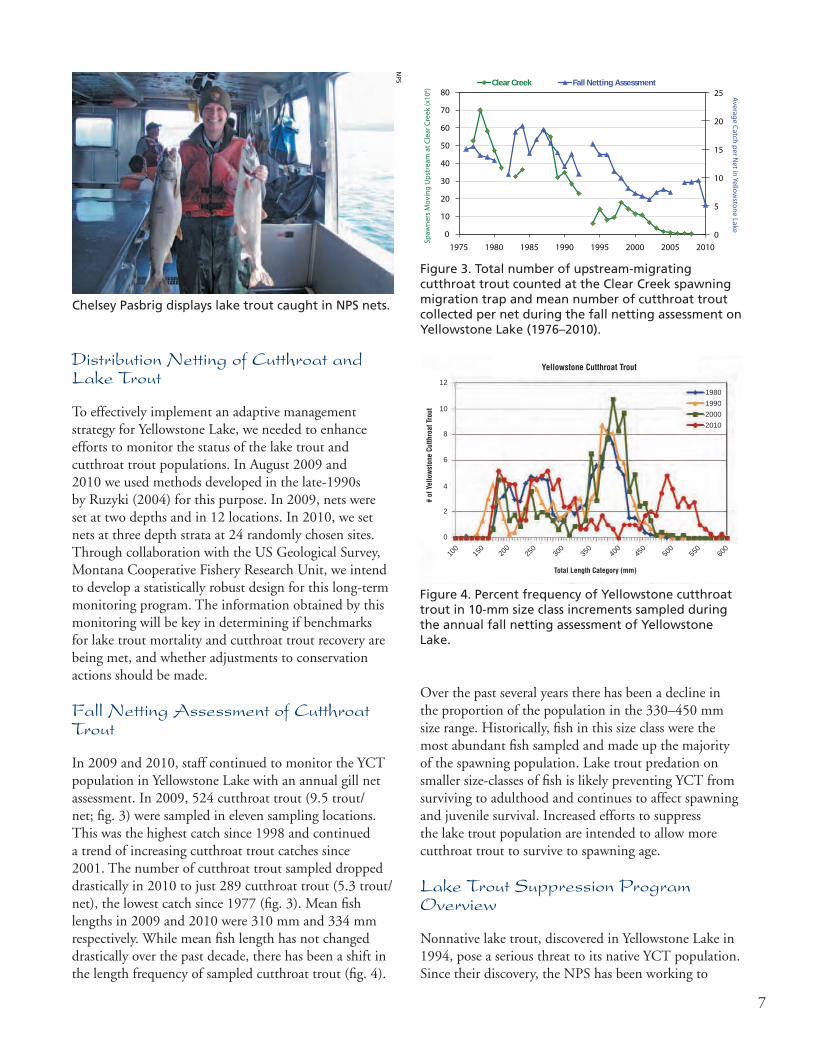
In 2009 and 2010, staff continued to monitor the YCT population in Yellowstone Lake with an annual gill net assessment. In 2009, 524 cutthroat trout (9.5 trout/net; fig. 3) were sampled in eleven sampling locations. This was the highest catch since 1998 and continued a trend of increasing cutthroat trout catches since 2001. The number of cutthroat trout sampled dropped drastically in 2010 to just 289 cutthroat trout (5.3 trout/net), the lowest catch since 1977 (fig. 3). Mean fish lengths in 2009 and 2010 were 310 mm and 334 mm respectively. While mean fish length has not changed drastically over the past decade, there has been a shift in the length frequency of sampled cutthroat trout (fig. 4).
Over the past several years there has been a decline in the proportion of the population in the 330–450 mm size range. Historically, fish in this size class were the most abundant fish sampled and made up the majority of the spawning population. Lake trout predation on smaller size-classes of fish is likely preventing YCT from surviving to adulthood and continues to affect spawning and juvenile survival. Increased efforts to suppress the lake trout population are intended to allow more cutthroat trout to survive to spawning age.
Lake Trout Suppression Program Overview
Nonnative lake trout, discovered in Yellowstone Lake in 1994, pose a serious threat to its native YCT population. Since their discovery, the NPS has been working to
0
5
10
15
20
25
0
10
20
30
40
50
60
70
80
1975 1980 1985 1990 1995 2000 2005 2010
Clear Creek Fall Netting Assessment
Spaw
ners
Mov
ing
Ups
trea
m a
t Cle
ar C
reek
(x10
4 )
Average Catch per Net in Yellow
stone Lake
Figure 3. total number of upstream-migrating cutthroat trout counted at the Clear Creek spawning migration trap and mean number of cutthroat trout collected per net during the fall netting assessment on Yellowstone lake (1976–2010).
Yellowstone Cutthroat Trout
# of
Yel
low
ston
e Cu
tthro
at T
rout
Total Length Category (mm)
1980
1990
2000
2010
12
10
8
6
4
2
0
100
150
200
250
300
350
400
450
500
550
600
Figure 4. Percent frequency of Yellowstone cutthroat trout in 10-mm size class increments sampled during the annual fall netting assessment of Yellowstone lake.
NPs
Chelsey Pasbrig displays lake trout caught in NPs nets.
8
understand lake trout distribution and population dynamics, and to develop effective strategies to suppress the population. The result has been a substantial and growing body of scientific literature, program input from premier scientific experts, and a suppression program that includes operation of two NPS gillnetting boats and the addition of private-sector contract netters in 2009.
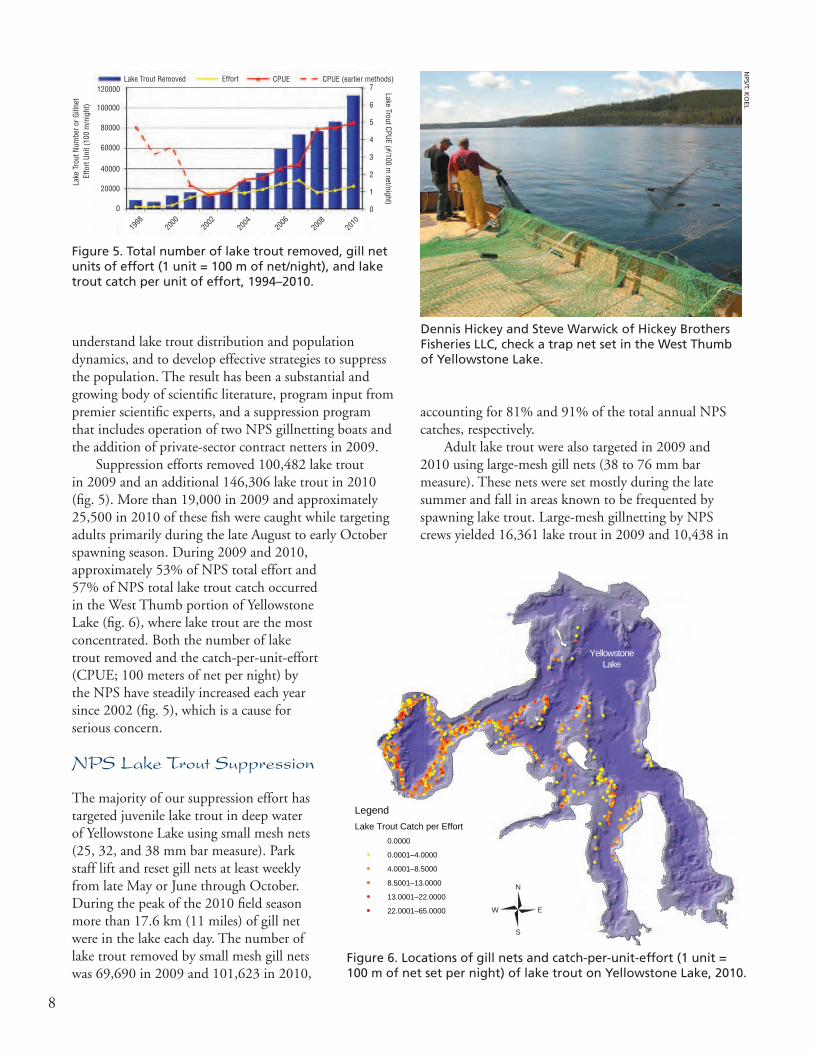
Suppression efforts removed 100,482 lake trout in 2009 and an additional 146,306 lake trout in 2010 (fig. 5). More than 19,000 in 2009 and approximately 25,500 in 2010 of these fish were caught while targeting adults primarily during the late August to early October spawning season. During 2009 and 2010, approximately 53% of NPS total effort and 57% of NPS total lake trout catch occurred in the West Thumb portion of Yellowstone Lake (fig. 6), where lake trout are the most concentrated. Both the number of lake trout removed and the catch-per-unit-effort (CPUE; 100 meters of net per night) by the NPS have steadily increased each year since 2002 (fig. 5), which is a cause for serious concern.
NPS Lake Trout Suppression
The majority of our suppression effort has targeted juvenile lake trout in deep water of Yellowstone Lake using small mesh nets (25, 32, and 38 mm bar measure). Park staff lift and reset gill nets at least weekly from late May or June through October. During the peak of the 2010 field season more than 17.6 km (11 miles) of gill net were in the lake each day. The number of lake trout removed by small mesh gill nets was 69,690 in 2009 and 101,623 in 2010,
Lake Trout Removed Effort CPUE CPUE (earlier methods)120000
80000
60000
40000
20000
0
100000
7
6
5
4
3
2
1
0
1998
2000
2002
2004
2006
2008
2010
Lake
Tro
ut N
umbe
r or G
illne
t Ef
fort
Unit
(100
m/n
ight
)
Lake Trout CPUE (#/100 m net/night)
Figure 5. total number of lake trout removed, gill net units of effort (1 unit = 100 m of net/night), and lake trout catch per unit of effort, 1994–2010.
Legend
Lake Trout Catch per Effort
0.0000
0.0001–4.0000
4.0001–8.5000
8.5001–13.0000
13.0001–22.0000
22.0001–65.0000
YellowstoneLake
2N
S
EW
Figure 6. locations of gill nets and catch-per-unit-effort (1 unit = 100 m of net set per night) of lake trout on Yellowstone lake, 2010.
accounting for 81% and 91% of the total annual NPS catches, respectively.
Adult lake trout were also targeted in 2009 and 2010 using large-mesh gill nets (38 to 76 mm bar measure). These nets were set mostly during the late summer and fall in areas known to be frequented by spawning lake trout. Large-mesh gillnetting by NPS crews yielded 16,361 lake trout in 2009 and 10,438 in
dennis Hickey and steve Warwick of Hickey Brothers Fisheries llC, check a trap net set in the West thumb of Yellowstone lake.
NPs/t. K
oel
9
9,885, of which 42% were released alive back to the lake. Cutthroat trout bycatch is minimized by carefully monitoring and adjusting netting strategies, such as setting nets at depths with fewer cutthroat trout and limiting the use of mesh sizes with higher cutthroat trout bycatch. For example, based on previous experience, the 25-mm mesh nets tend to have increased cutthroat trout bycatch in the fall so we have reduced use of this mesh size at that time of year. Another netting strategy to avoid cutthroat trout bycatch is to cease setting in an area once lake trout catches decrease, particularly near lake trout spawning areas. The use of trap nets also resulted in YCT bycatch; however, almost all (96%) of the YCT caught in trap nets were released alive.
2010. The lake trout captured via large-mesh netting are large, mostly sexually mature fish. Eliminating these fish, which not only can prey on YCT, but also have high reproductive potential because of their size, is important to suppressing the population within the lake.
Contracted Lake Trout Suppression
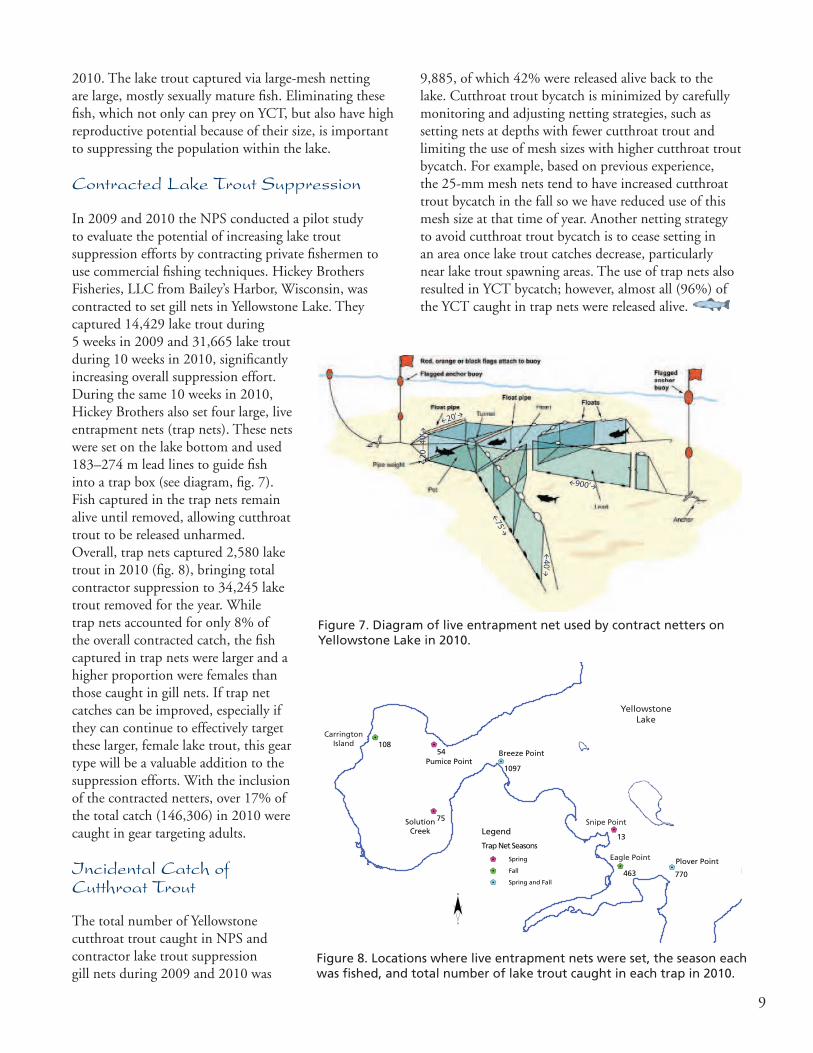
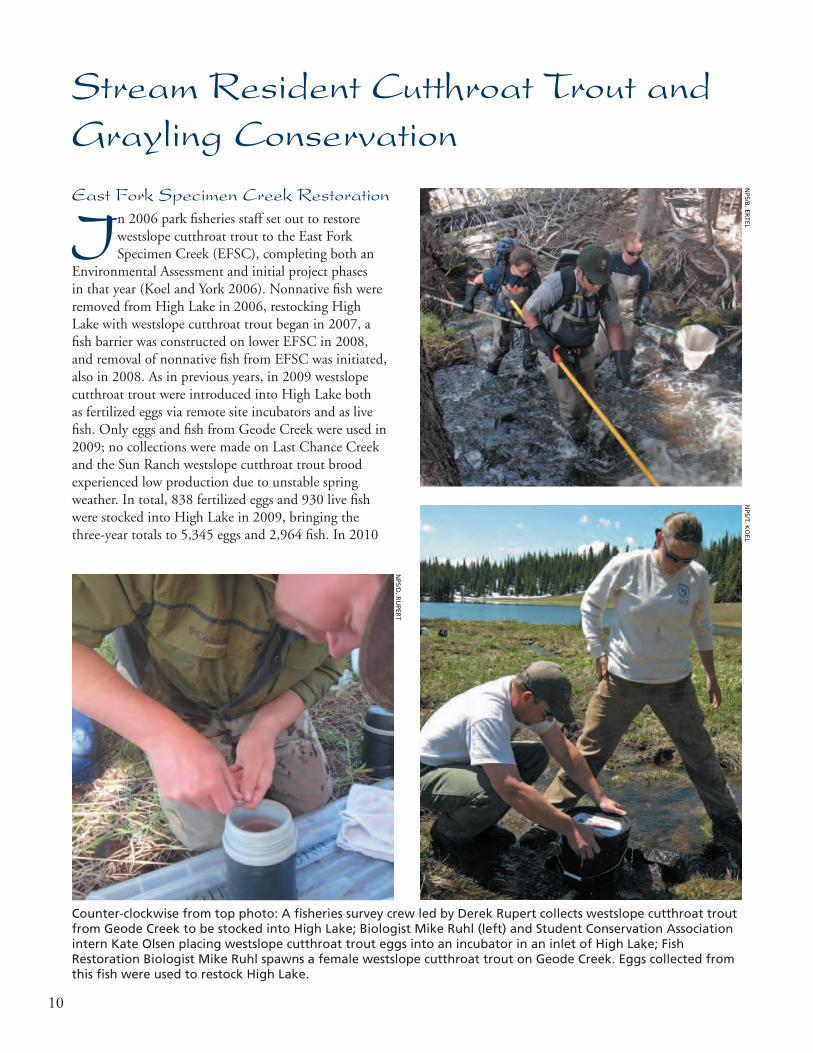
In 2009 and 2010 the NPS conducted a pilot study to evaluate the potential of increasing lake trout suppression efforts by contracting private fishermen to use commercial fishing techniques. Hickey Brothers Fisheries, LLC from Bailey’s Harbor, Wisconsin, was contracted to set gill nets in Yellowstone Lake. They captured 14,429 lake trout during 5 weeks in 2009 and 31,665 lake trout during 10 weeks in 2010, significantly increasing overall suppression effort. During the same 10 weeks in 2010, Hickey Brothers also set four large, live entrapment nets (trap nets). These nets were set on the lake bottom and used 183–274 m lead lines to guide fish into a trap box (see diagram, fig. 7). Fish captured in the trap nets remain alive until removed, allowing cutthroat trout to be released unharmed. Overall, trap nets captured 2,580 lake trout in 2010 (fig. 8), bringing total contractor suppression to 34,245 lake trout removed for the year. While trap nets accounted for only 8% of the overall contracted catch, the fish captured in trap nets were larger and a higher proportion were females than those caught in gill nets. If trap net catches can be improved, especially if they can continue to effectively target these larger, female lake trout, this gear type will be a valuable addition to the suppression efforts. With the inclusion of the contracted netters, over 17% of the total catch (146,306) in 2010 were caught in gear targeting adults.
Incidental Catch of Cutthroat Trout
The total number of Yellowstone cutthroat trout caught in NPS and contractor lake trout suppression gill nets during 2009 and 2010 was
75’
40’
900’
20’
20−4
0’
Figure 7. diagram of live entrapment net used by contract netters on Yellowstone lake in 2010.
$1
$1
$1
$1
$1
$1
$1
Pumice Point
SolutionCreek
Breeze Point
Plover Point
13
75
54108
463 770
1097
Legend
Trap Net Seasons
$1 Spring
$1 Fall
$1 Spring and Fall
¨
YellowstoneLake
CarringtonIsland
Snipe Point
Eagle Point
Figure 8. locations where live entrapment nets were set, the season each was fished, and total number of lake trout caught in each trap in 2010.
10
East Fork Specimen Creek Restoration
In 2006 park fisheries staff set out to restore westslope cutthroat trout to the East Fork Specimen Creek (EFSC), completing both an
Environmental Assessment and initial project phases in that year (Koel and York 2006). Nonnative fish were removed from High Lake in 2006, restocking High Lake with westslope cutthroat trout began in 2007, a fish barrier was constructed on lower EFSC in 2008, and removal of nonnative fish from EFSC was initiated, also in 2008. As in previous years, in 2009 westslope cutthroat trout were introduced into High Lake both as fertilized eggs via remote site incubators and as live fish. Only eggs and fish from Geode Creek were used in 2009; no collections were made on Last Chance Creek and the Sun Ranch westslope cutthroat trout brood experienced low production due to unstable spring weather. In total, 838 fertilized eggs and 930 live fish were stocked into High Lake in 2009, bringing the three-year totals to 5,345 eggs and 2,964 fish. In 2010
Stream Resident Cutthroat Trout and Grayling Conservation
Counter-clockwise from top photo: a fisheries survey crew led by derek Rupert collects westslope cutthroat trout from Geode Creek to be stocked into High lake; Biologist Mike Ruhl (left) and student Conservation association intern Kate olsen placing westslope cutthroat trout eggs into an incubator in an inlet of High lake; Fish Restoration Biologist Mike Ruhl spawns a female westslope cutthroat trout on Geode Creek. eggs collected from this fish were used to restock High lake.
NPs/t. K
oel
NPs/B
. eRtel
NPs/d
. Ru
PeRt
11
no eggs or fish were stocked in High Lake, however, fry were observed in the inlets of High Lake, confirming that natural reproduction of westslope cutthroat trout is occurring in the lake and making further stocking unlikely to be necessary.
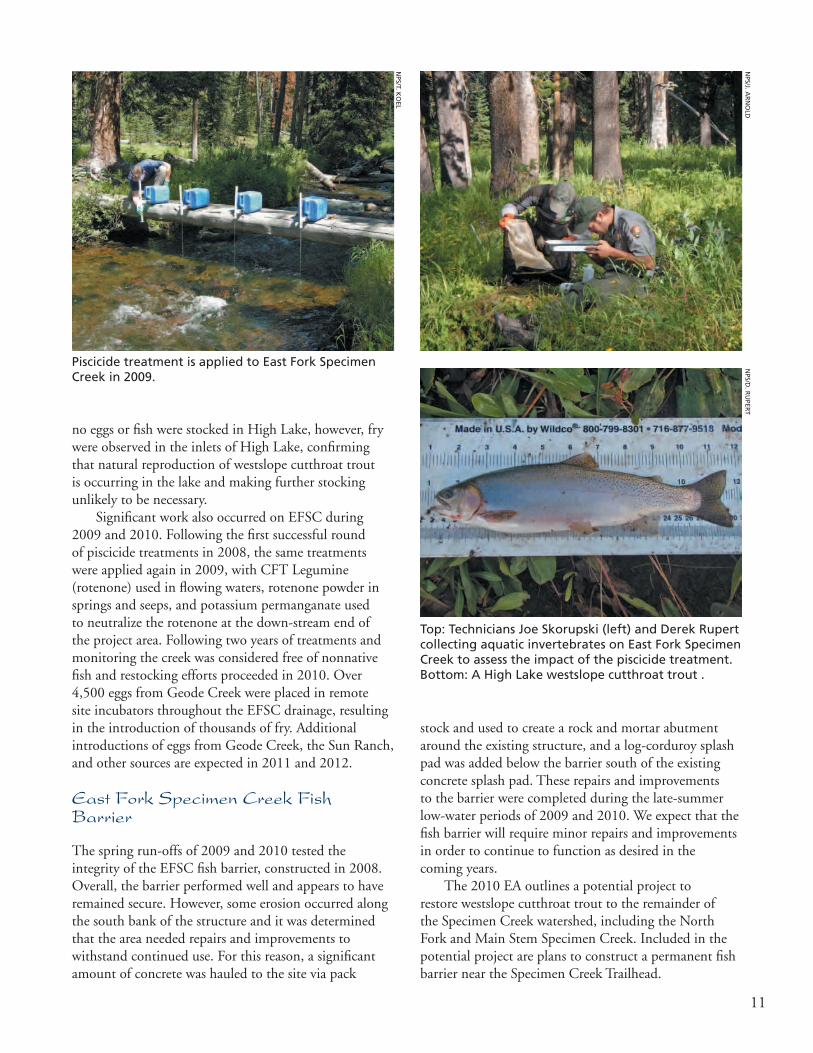
Significant work also occurred on EFSC during 2009 and 2010. Following the first successful round of piscicide treatments in 2008, the same treatments were applied again in 2009, with CFT Legumine (rotenone) used in flowing waters, rotenone powder in springs and seeps, and potassium permanganate used to neutralize the rotenone at the down-stream end of the project area. Following two years of treatments and monitoring the creek was considered free of nonnative fish and restocking efforts proceeded in 2010. Over 4,500 eggs from Geode Creek were placed in remote site incubators throughout the EFSC drainage, resulting in the introduction of thousands of fry. Additional introductions of eggs from Geode Creek, the Sun Ranch, and other sources are expected in 2011 and 2012.
East Fork Specimen Creek Fish Barrier
The spring run-offs of 2009 and 2010 tested the integrity of the EFSC fish barrier, constructed in 2008. Overall, the barrier performed well and appears to have remained secure. However, some erosion occurred along the south bank of the structure and it was determined that the area needed repairs and improvements to withstand continued use. For this reason, a significant amount of concrete was hauled to the site via pack
stock and used to create a rock and mortar abutment around the existing structure, and a log-corduroy splash pad was added below the barrier south of the existing concrete splash pad. These repairs and improvements to the barrier were completed during the late-summer low-water periods of 2009 and 2010. We expect that the fish barrier will require minor repairs and improvements in order to continue to function as desired in the coming years.
The 2010 EA outlines a potential project to restore westslope cutthroat trout to the remainder of the Specimen Creek watershed, including the North Fork and Main Stem Specimen Creek. Included in the potential project are plans to construct a permanent fish barrier near the Specimen Creek Trailhead.
Piscicide treatment is applied to east Fork specimen Creek in 2009.
top: technicians Joe skorupski (left) and derek Rupert collecting aquatic invertebrates on east Fork specimen Creek to assess the impact of the piscicide treatment. Bottom: a High lake westslope cutthroat trout .
NPs/t. K
oel
NPs/J. a
RN
old
NPs/d
. Ru
PeRt
12
Potential for Restoring a Native Fish Community to Grayling Creek
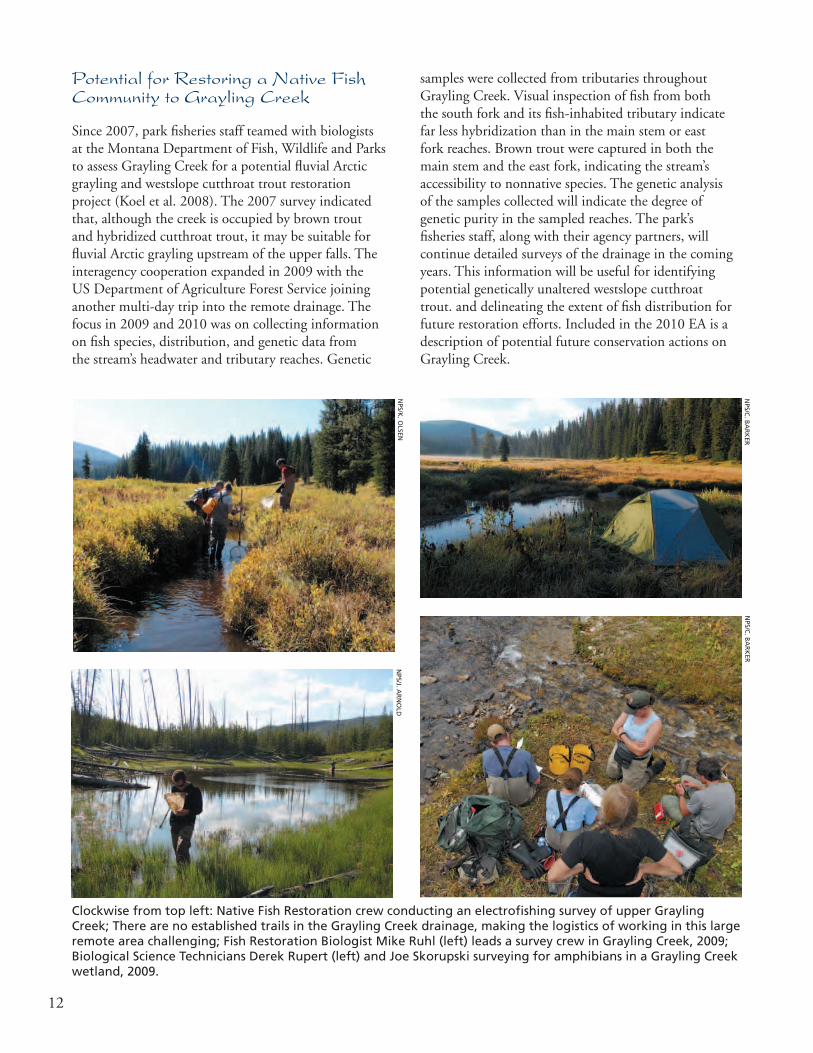
Since 2007, park fisheries staff teamed with biologists at the Montana Department of Fish, Wildlife and Parks to assess Grayling Creek for a potential fluvial Arctic grayling and westslope cutthroat trout restoration project (Koel et al. 2008). The 2007 survey indicated that, although the creek is occupied by brown trout and hybridized cutthroat trout, it may be suitable for fluvial Arctic grayling upstream of the upper falls. The interagency cooperation expanded in 2009 with the US Department of Agriculture Forest Service joining another multi-day trip into the remote drainage. The focus in 2009 and 2010 was on collecting information on fish species, distribution, and genetic data from the stream’s headwater and tributary reaches. Genetic
samples were collected from tributaries throughout Grayling Creek. Visual inspection of fish from both the south fork and its fish-inhabited tributary indicate far less hybridization than in the main stem or east fork reaches. Brown trout were captured in both the main stem and the east fork, indicating the stream’s accessibility to nonnative species. The genetic analysis of the samples collected will indicate the degree of genetic purity in the sampled reaches. The park’s fisheries staff, along with their agency partners, will continue detailed surveys of the drainage in the coming years. This information will be useful for identifying potential genetically unaltered westslope cutthroat trout. and delineating the extent of fish distribution for future restoration efforts. Included in the 2010 EA is a description of potential future conservation actions on Grayling Creek.
NPs/C
. Ba
RK
eR
NPs/J. a
RN
old
NPs/K
. olseN
NPs/C
. Ba
RK
eR
Clockwise from top left: Native Fish Restoration crew conducting an electrofishing survey of upper Grayling Creek; there are no established trails in the Grayling Creek drainage, making the logistics of working in this large remote area challenging; Fish Restoration Biologist Mike Ruhl (left) leads a survey crew in Grayling Creek, 2009; Biological science technicians derek Rupert (left) and Joe skorupski surveying for amphibians in a Grayling Creek wetland, 2009.
13
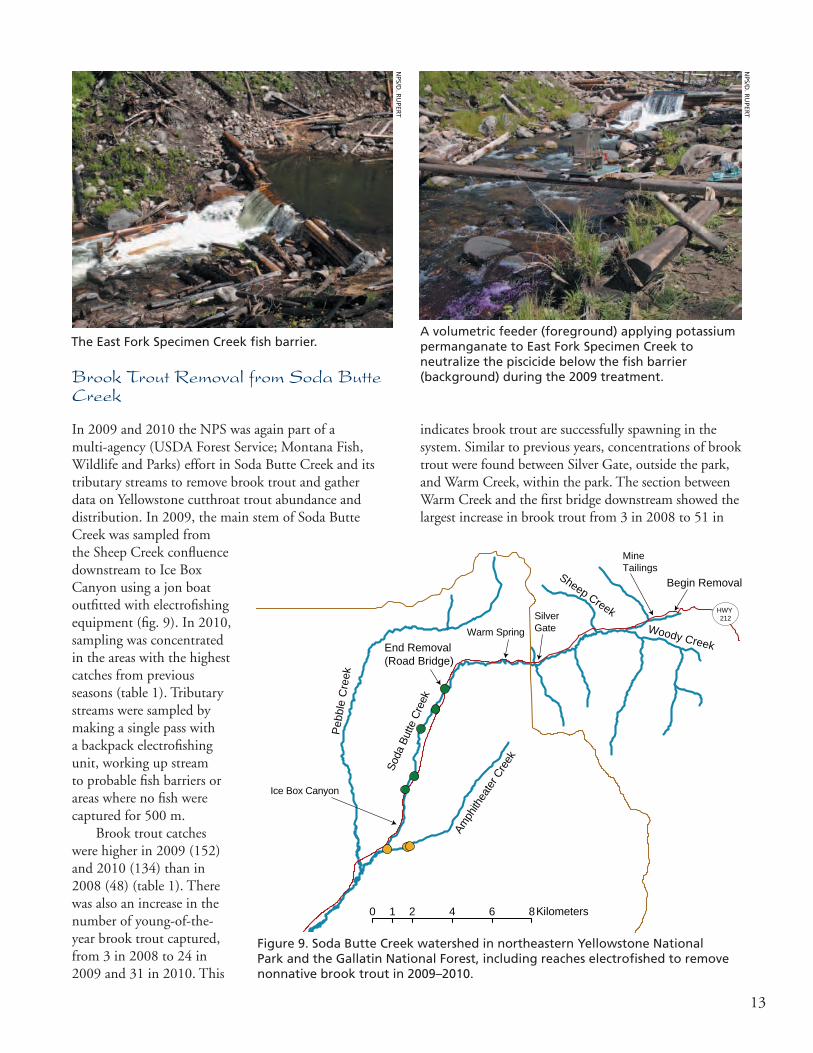
Brook Trout Removal from Soda Butte Creek
In 2009 and 2010 the NPS was again part of a multi-agency (USDA Forest Service; Montana Fish, Wildlife and Parks) effort in Soda Butte Creek and its tributary streams to remove brook trout and gather data on Yellowstone cutthroat trout abundance and distribution. In 2009, the main stem of Soda Butte Creek was sampled from the Sheep Creek confluence downstream to Ice Box Canyon using a jon boat outfitted with electrofishing equipment (fig. 9). In 2010, sampling was concentrated in the areas with the highest catches from previous seasons (table 1). Tributary streams were sampled by making a single pass with a backpack electrofishing unit, working up stream to probable fish barriers or areas where no fish were captured for 500 m.
Brook trout catches were higher in 2009 (152) and 2010 (134) than in 2008 (48) (table 1). There was also an increase in the number of young-of-the-year brook trout captured, from 3 in 2008 to 24 in 2009 and 31 in 2010. This
Soda
But
te C
reek
End Removal(Road Bridge)
Warm Spring Woody Creek
Amph
ithea
ter C
reek
Begin Removal
Ice Box Canyon
Mine Tailings
Silver Gate
Pebb
le C
reek
Lamar River
Soda Butte Sites
Amphitheater Cr Sites
YNP Boundary ®
0 2 4 6 81 Kilometers
Road
River/Creek
HWY 212
Sheep Creek
Figure 9. soda Butte Creek watershed in northeastern Yellowstone National Park and the Gallatin National Forest, including reaches electrofished to remove nonnative brook trout in 2009–2010.
indicates brook trout are successfully spawning in the system. Similar to previous years, concentrations of brook trout were found between Silver Gate, outside the park, and Warm Creek, within the park. The section between Warm Creek and the first bridge downstream showed the largest increase in brook trout from 3 in 2008 to 51 in
the east Fork specimen Creek fish barrier.a volumetric feeder (foreground) applying potassium permanganate to east Fork specimen Creek to neutralize the piscicide below the fish barrier (background) during the 2009 treatment.
NPs/d
. Ru
PeRt
NPs/d
. Ru
PeRt
14
low numbers in the past, pose a serious threat to the cutthroat trout population through competition and hybridization. During 2009, tissue samples for genetic analysis were collected from a random sample of 30 fish just upstream of Ice Box Canyon and from an additional 20 fish that appeared to be cutthroat trout/rainbow trout hybrids.
The increase in brook trout was the first recorded since 2005. Although our catch numbers remain low, the greater numbers of both juvenile and adult brook trout downstream of Warm Creek indicate that the population is expanding downstream and possibly spawning in new downstream locations. Our current plan is to continue with mechanical removal of brook trout in the system.
2009 and 68 in 2010. Sampling for the first time in two sections, the road bridge to Ice Box Canyon produced 1 brook trout in 2009 and 7 in 2010. Electrofishing of tributary streams outside the park produced 8 brook trout in 2009 (5 in Amphitheater Creek outside the park and 3 from a small spring flowing through the town of Silver Gate) and none in 2010. No brook trout were collected in tributary streams within the park.
A comparison of sections sampled in both 2009 and 2010 showed a decline in YCT numbers with 2,188 and 565 fish sampled, respectively. This may have resulted from an early season flash flood that altered much of the habitat in the system. One rainbow trout was removed in 2009 and three cutthroat/rainbow trout hybrids in 2010. Rainbow trout, which have been captured in
Nonnative brook trout are removed from upper soda Butte Creek each year to curtail population growth and expansion.
a small “push boat” is used to carry the generator and electrofishing unit for brook trout removal on soda Butte Creek.
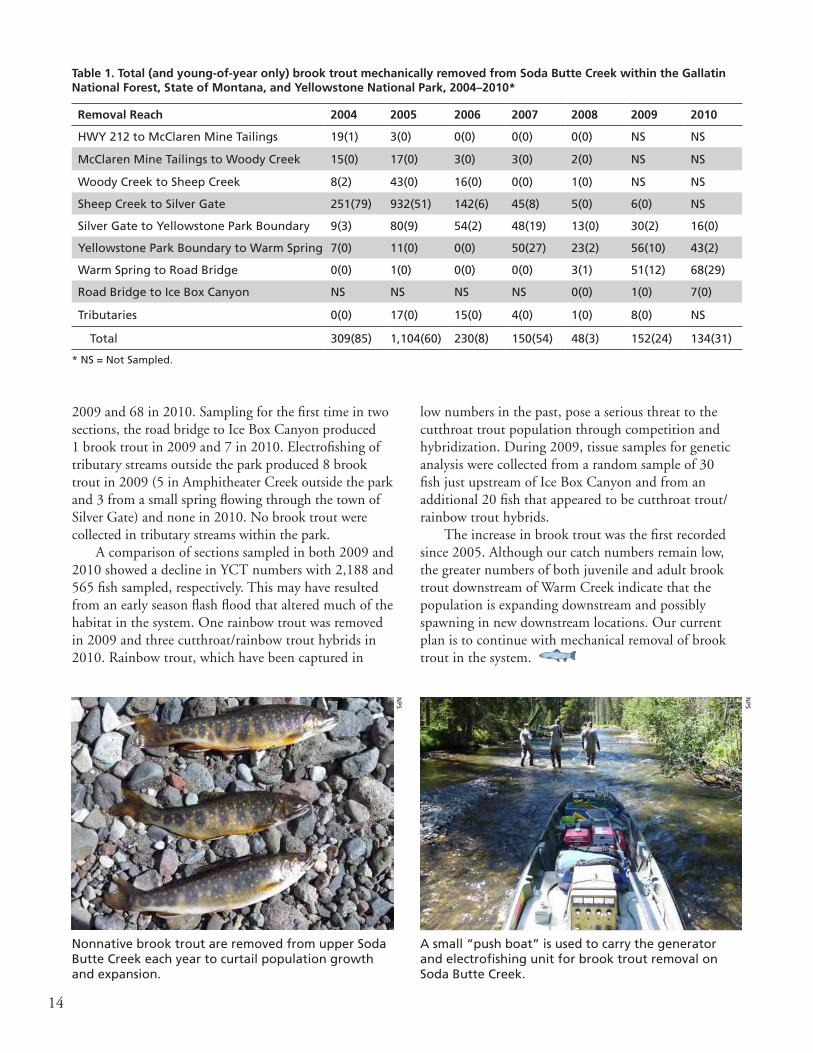
Table 1. Total (and young-of-year only) brook trout mechanically removed from Soda Butte Creek within the Gallatin National Forest, State of Montana, and Yellowstone National Park, 2004–2010*
Removal Reach 2004 2005 2006 2007 2008 2009 2010
HWY 212 to McClaren Mine tailings 19(1) 3(0) 0(0) 0(0) 0(0) Ns Ns
McClaren Mine tailings to Woody Creek 15(0) 17(0) 3(0) 3(0) 2(0) Ns Ns
Woody Creek to sheep Creek 8(2) 43(0) 16(0) 0(0) 1(0) Ns Ns
sheep Creek to silver Gate 251(79) 932(51) 142(6) 45(8) 5(0) 6(0) Ns
silver Gate to Yellowstone Park Boundary 9(3) 80(9) 54(2) 48(19) 13(0) 30(2) 16(0)
Yellowstone Park Boundary to Warm spring 7(0) 11(0) 0(0) 50(27) 23(2) 56(10) 43(2)
Warm spring to Road Bridge 0(0) 1(0) 0(0) 0(0) 3(1) 51(12) 68(29)
Road Bridge to ice Box Canyon Ns Ns Ns Ns 0(0) 1(0) 7(0)
tributaries 0(0) 17(0) 15(0) 4(0) 1(0) 8(0) Ns
total 309(85) 1,104(60) 230(8) 150(54) 48(3) 152(24) 134(31)
* Ns = Not sampled.
NPs
NPs
15
Aquatic EcologyLong-term Water Quality Monitoring
Monitoring water quality continues to be a high priority for Yellowstone, with standardized data available for 17 sites
dating to May 2002. The monitoring is conducted in cooperation with the Vital Signs Monitoring Program of the Greater Yellowstone Inventory & Monitoring Network, which includes Yellowstone National Park, Grand Teton National Park, John D. Rockefeller Jr. Memorial Parkway, and Bighorn Canyon National Recreation Area. In Yellowstone, 12 sites are on major rivers and 7 are on Yellowstone Lake, including two sites added to the program in 2003 (fig. 1). Because stream discharge strongly influences limnological processes, most of the stream sites are located near US Geological Survey discharge gauging stations so the flow-weighted measurements can be calculated for chemical parameters.
Data was collected monthly during 2009 and 2010 at each monitoring site on core water quality parameters, including water temperature, dissolved oxygen, pH, specific conductance, and turbidity. Water was also collected from each site, filtered, dried, and weighed for total suspended solids (TSS), volatile suspended solid (VSS), and fixed suspended solid (FSS) analysis. In addition, nine of the stream sites were sampled for various chemical parameters, including anions (sulfate, chloride, bicarbonate, and carbonate), cations (calcium, magnesium, sodium, and potassium), and nutrients (total phosphorus, orthophosphate, nitrate, nitrite, and ammonia). Dissolved and total metals (arsenic, copper, iron, and selenium) in water and sediments are measured twice annually during high and low flow periods on
upper Soda Butte Creek at the park boundary near Silver Gate, Montana.
During 2009–2010, most water quality sites sampled in Yellowstone met or surpassed national/state water quality standards for all parameters on all collection days. Some sites, such as the Gibbon River and Yellowstone River near Canyon, had lower than expected pH values, which is most likely attributable to inputs from nearby geothermal features.
The upper Soda Butte Creek regulatory site exceeded Environmental Protection Agency (EPA)/state standards for total iron and aquatic life criteria during 27 visits (15 in 2009, 12 in 2010) and exceeded drinking water standards during 5 visits (2 in 2009, 3 in 2010).
Regulatory Monitoring of Impaired Waters
Three stream segments on the park boundary are listed as 303(d) impaired by the state of Montana and are monitored as regulatory streams: (1) upper Soda Butte Creek near Cooke City; (2) Yellowstone River upstream of Corwin Springs to the Montana state line; and (3) Reese Creek on the park’s north boundary.
In-stream metals contamination in Soda Butte Creek is a result of historical mining in the vicinity of Cooke City, approximately 8 km from the park boundary. Mine tailings
Table 2. The waters of Yellowstone
area of Yellowstone National Park1 3,468.4 mi2 (8,983 km2)
Water surface area2,3 approximately 5% of park area
Number of named lakes1 150
surface area of named lakes1 24.7 mi2 (63.9 km2)
Number of lakes with fish2 ~45
Yellowstone lake surface area1 131.8–135.9 mi2 (341–352 km2)
Number of named streams3 278
total stream length3 3,496,329 meters (2,172.52 miles)
Number of streams with fish2 ~2001Yellowstone spatial analysis Center data 2010. 2Varley and schullery 1998. 3GRYN Water Quality Report 2009
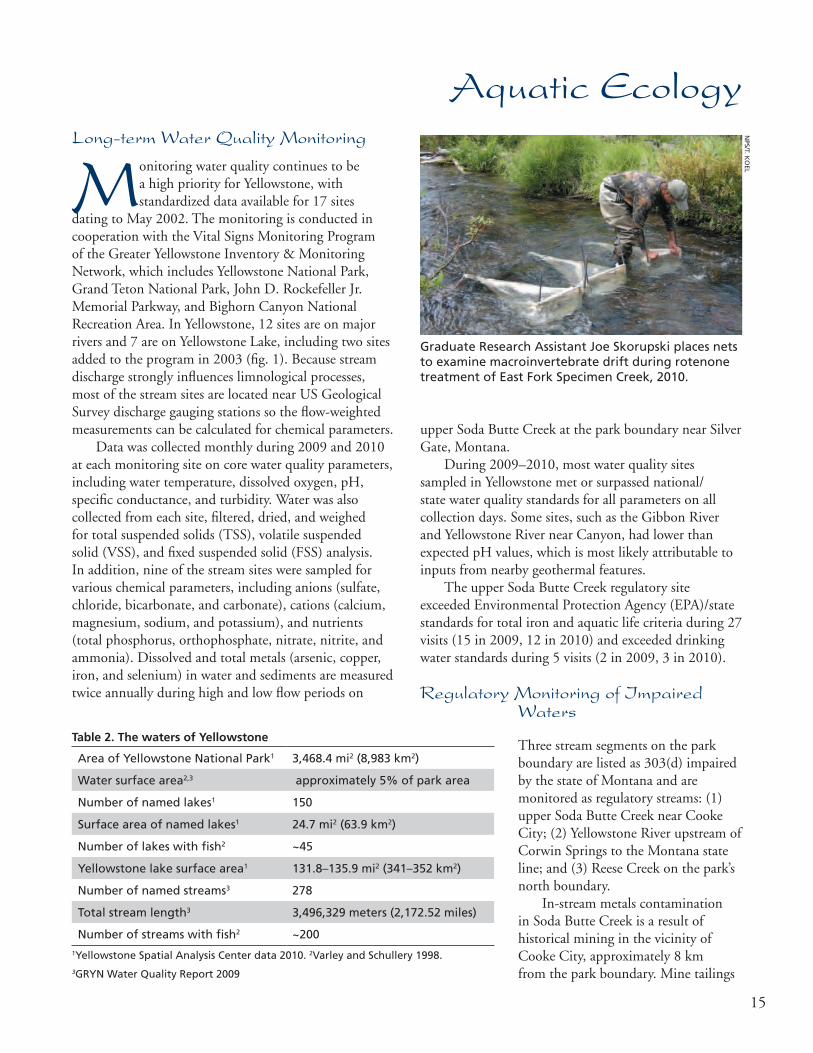
Graduate Research assistant Joe skorupski places nets to examine macroinvertebrate drift during rotenone treatment of east Fork specimen Creek, 2010.
NPs/t. K
oel
16
persist within the Soda Butte Creek floodplain and contribute to the listing of a portion of this stream as impaired and only partially supporting of aquatic life and coldwater fisheries. At the upper Soda Butte Creek site, water and sediment samples were analyzed for metals (i.e., arsenic, copper, iron, and selenium) from May to October in 2009 and 2010.
The Yellowstone River upstream of Corwin Springs was listed on Montana’s 303(d) list in 2006 for sedimentation and arsenic levels that exceed drinking water standards. In addition to routine water quality monitoring, data on total dissolved arsenic, copper, iron, and selenium were collected from this site from July to October 2009.
The lower portion of Reese Creek is on Montana’s 303(d) list because irrigation practices from adjacent land owners often leave too little water in the stream to sustain a healthy resident fish population during the critical months of July and August. Discharge measurements on Reese Creek were collected during 17 site visits from May 28 to September 17, 2009, by the park’s resource management staff to calculate instream flows.
Yellowstone Lake Limnology
Understanding the limnology of Yellowstone Lake, the park’s most prominent body of water, is an important part of comprehending the ecology of lake trout and carrying out the lake trout suppression program. Water temperature, dissolved oxygen, specific conductance, and turbidity measurements were sampled monthly from May/June through October for both years at seven sites in the Yellowstone Lake basin (fig. 1). Weather permitting, temperature profile data were also collected
from the West Thumb and South Arm. Water samples were collected at each location for analysis of total suspended solids (TSS), volatile suspended solids (VSS) and fixed suspended solids (FSS).
Macroinvertebrates Surveys
Aquatic invertebrates are an important element in aquatic food webs and include a wide assortment of feeding groups: primary consumers (filter feeders, gatherers, scrapers, and shredders) and predators that feed on other invertebrates, and small vertebrates (larval amphibians, and young fish). In turn, the various life stages of those invertebrates provide an important food source for fish, birds, and mammals. Because aquatic invertebrates are sensitive to environmental changes, they are used to supplement long-term water quality data, evaluate the impact of road construction activities on aquatic resources, and assess the impacts that our fish restoration activities have on non-target organisms.
In 2009 and 2010, 25 and 18 invertebrate sites were surveyed respectively within Yellowstone National Park. For both years, five sites were sampled as part of our long-term water quality monitoring program and six sites were associated with road construction projects. The remaining sites were located within current or proposed native fish restoration watersheds. During August 2009, CFT legumine formulation (rotenone) was used to remove nonnative fish from the East Fork Specimen Creek drainage. Pre- and post-treatment aquatic invertebrate surveys were conducted to assess the piscicide’s impact on the stream invertebrate community. All invertebrate samples were sent to an independent contractor for analysis.
Red-rimmed Melania Found in the Boiling River
The red-rimmed melania (Melanoides tuberculata) is a snail that is native to the subtropical waters of Asia, Africa and Australia. It was introduced into North America in the 1930s through the aquarium trade and populated local watersheds when discarded by aquarium owners. In December 2009, it was found at the confluence of the Boiling River and Gardiner River near Mammoth Hot Springs. In 2010, other hot spring areas used by park visitors were surveyed to inventory and locate the distribution of the red-rimmed melania snails and aquatic native species (fig. 10). This survey also incorporated the collection of basic water quality information and native gastropod population inventories to evaluate the potential impacts of red-rimmed melania
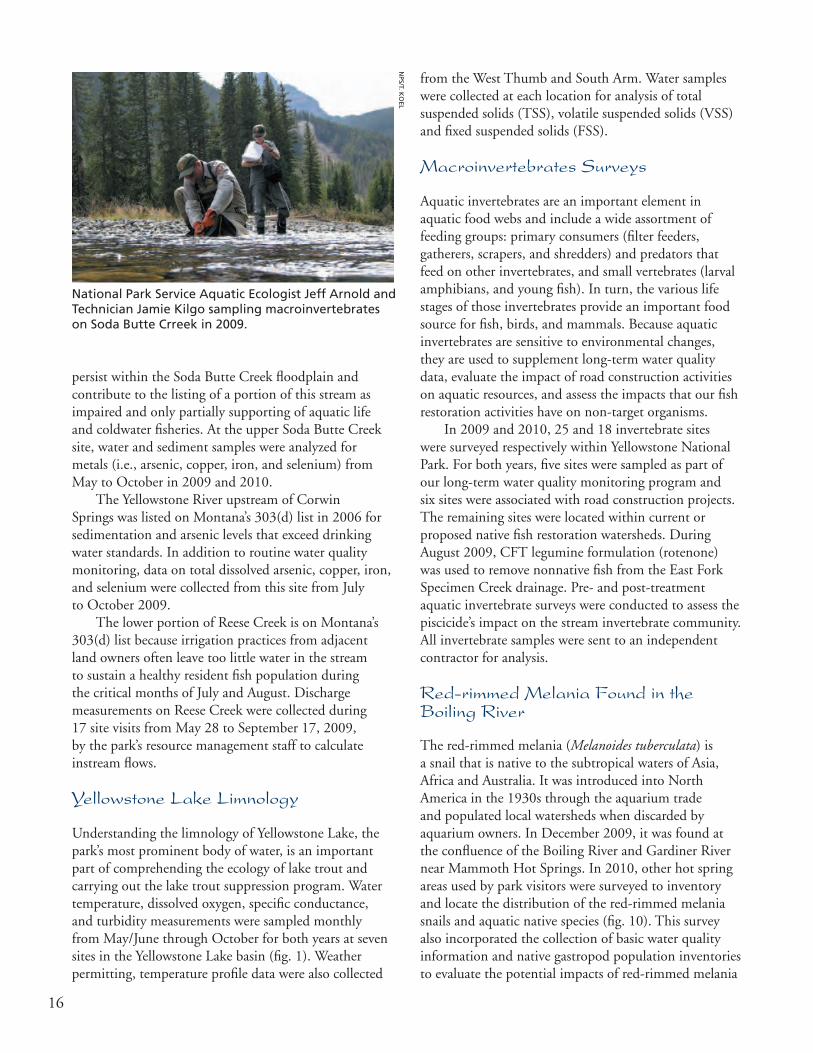
National Park service aquatic ecologist Jeff arnold and technician Jamie Kilgo sampling macroinvertebrates on soda Butte Crreek in 2009.
NPs/t. K
oel