
DISTRIBUTION COMMITTEE REPORT TRIENNIUM...
148
This publication is produced under the auspices of the International Gas Union (IGU) which holds the copywrite. The publication must not be reproduced in whole or in part without the written permission of the IGU. However, irrespective of the above, established journals or periodicals shall be permitted to reproduce this publication, or part of it, abbreviated or edited form, provided that credit is given to IGU. This document contains strictly technical information to be distributed during the 27 th World Gas Conference in Washington DC, USA, and has no commercial intent. 1 DISTRIBUTION COMMITTEE REPORT TRIENNIUM 2015-2018:
Transcript of DISTRIBUTION COMMITTEE REPORT TRIENNIUM...

This publication is produced under the auspices of the International Gas Union (IGU) which holds the copywrite. The publication must not be reproduced in whole or in part without the written permission of the IGU. However, irrespective of the above, established journals or periodicals shall be permitted to reproduce this publication, or part of it, abbreviated or edited form, provided that credit is given to IGU. This document contains strictly technical information to be distributed during the 27th World Gas Conference in Washington DC, USA, and has no commercial intent.
1
DISTRIBUTION COMMITTEE
REPORT TRIENNIUM 2015-2018:

This publication is produced under the auspices of the International Gas Union (IGU) which holds the copywrite. The publication must not be reproduced in whole or in part without the written permission of the IGU. However, irrespective of the above, established journals or periodicals shall be permitted to reproduce this publication, or part of it, abbreviated or edited form, provided that credit is given to IGU. This document contains strictly technical information to be distributed during the 27th World Gas Conference in Washington DC, USA, and has no commercial intent.
2
CONTENTS
1. Executive Summary .................................................................................................................... 4
2. Gratitude and member List ........................................................................................................ 4
3. Meetings .................................................................................................................................... 8
4. Study Group Reports .................................................................................................................. 9
5. Glossary ...................................................................................................................................... 9
6. IGU DC Study Group 1 Report. Role of DSO in market creation and facilitation .................... 12
6.1. Introduction .......................................................................................................................... 12
6.2. Competitiveness of Pipeline Quality Gas .............................................................................. 15
6.3. Stakeholder Interactions ....................................................................................................... 18
6.4. Expanding Existing and New Market Identification (Market Facilitation) ............................ 26
6.5. Infrastructure Development (Construction Practices) ......................................................... 39
6.6. Technology Challenges ......................................................................................................... 45
6.7. Threats and Opportunities .................................................................................................... 53
6.8. Conclusions ........................................................................................................................... 59
6.9. Sources/References .............................................................................................................. 61
7. IGU DC Study Group 2 Report. Operational Excellence of Gas Distribution Activities ............ 63
7.1. Operational excellence? What else? ................................................................................... 63
7.2. Safety management from an OE objective ........................................................................... 66
7.3. Customer perspective in relation to OE................................................................................ 77
7.4. Field Workforce: the “blue collars” perspective .................................................................. 83
7.5. Operational Excellence supported by Management Systems and Standards for DSOs ....... 97
7.6. Conclusions and recommendations .................................................................................... 101
8. IGU DC Study Group 3 Report. System integration of Gas and other Energies (including green gases) ............................................................................................................................................. 103
8.1. Introduction ........................................................................................................................ 103
8.2. SCOPE OF THE STUDY GROUP REPORT BACKGROUND AND PURPOSE („storyline“) ......... 103

This publication is produced under the auspices of the International Gas Union (IGU) which holds the copywrite. The publication must not be reproduced in whole or in part without the written permission of the IGU. However, irrespective of the above, established journals or periodicals shall be permitted to reproduce this publication, or part of it, abbreviated or edited form, provided that credit is given to IGU. This document contains strictly technical information to be distributed during the 27th World Gas Conference in Washington DC, USA, and has no commercial intent.
3
8.3. Worldwide situation of integration of green gases ............................................................ 107
8.4. Methods Current Research, Development and Demonstration of Green gases (Case Studies from around the World) ................................................................................................................ 131
8.5. Results Potential Scenarios and Perspectives for green gases development .................... 142
8.6. Conclusions ......................................................................................................................... 143
8.7. References .......................................................................................................................... 144
9. Conclusions and Recommendations ...................................................................................... 146

This publication is produced under the auspices of the International Gas Union (IGU) which holds the copywrite. The publication must not be reproduced in whole or in part without the written permission of the IGU. However, irrespective of the above, established journals or periodicals shall be permitted to reproduce this publication, or part of it, abbreviated or edited form, provided that credit is given to IGU. This document contains strictly technical information to be distributed during the 27th World Gas Conference in Washington DC, USA, and has no commercial intent.
4
1. Executive Summary
The IGU Distribution Committee (DC) has dedicated its work during the triennium 2015-2018 to highlight how gas distribution activities can contribute to improve:
- the access of new consumers to natural gas supply; - the image of natural gas through distribution activities quality management; - the integration of renewable Energies (RES) to achieve decarbonization targets.
These three topics were allocated to three different Study Groups.
Placed at the end of the gas supply chain, and close to local economic actors and gas consumers, gas distribution activity has an essential role not only in the deployment of natural gas networks, but also in gas market creation and facilitation. The access to gas supply for new customers must sometimes overcome challenges such as the distance to the pipeline or the cost of network deployment. The report of Study Group 1 includes both new distribution technologies that give support to provide access to natural gas supply in these cases and other distribution activities oriented to the retention of existing and connection of new consumers to the natural gas networks.
The Distribution System Operator (DSO) carries out activities that can have an important impact on urban life. So, it is the DSO that provides the ultimate customer with the firmest image of the gas industry. Therefore, quality management of the distribution activity is essential for improving the public persona of gas. The report of Study Group 2 revises the best practices in quality management from different points of view: Safety, Customer and other Stakeholders’ perspective and certification.
Natural Gas Distribution Networks are an optimum way in which the integration of renewable gases can supply customers with greener energy. Following the work of the last triennium, IGU DC Study Group 3 summarizes the key directions from a point of view of operating the distribution system, supported by practical examples. The objective is to provide insight on conditions and rules of the gas market that can facilitate in terms of support or, conversely, reluctance to change.

This publication is produced under the auspices of the International Gas Union (IGU) which holds the copywrite. The publication must not be reproduced in whole or in part without the written permission of the IGU. However, irrespective of the above, established journals or periodicals shall be permitted to reproduce this publication, or part of it, abbreviated or edited form, provided that credit is given to IGU. This document contains strictly technical information to be distributed during the 27th World Gas Conference in Washington DC, USA, and has no commercial intent.
5
2. Gratitude and member List
IGU DC expresses its gratitude to all those experts and companies that have participated in the DC work during the triennium. The work of our Committee would not have been possible without their contributions and expertise. Also, the IGU DC would like to thank the companies and sponsors hosting the different meetings.
Between 2015 and 2016, the following experts were active members:
Country Member Company/Organization
Algeria Abdelkader Benyacoub IAP/RHU/SH
Amine Bouazza GP1Z/LQS/AVAL/SH
Abdelkader Guenoune IAP/RHU/SH
Mohamed Hakkoum Sonelgaz SDA
Ahmed Zine Hassanine Credeg/Sonelgaz
Nacera Mezouani SDA/Sonelgaz
Australia Peter Harcus Jemena
Matthew Haynes APA Group
Austria Christian Schicketmüller Netz Oberösterreich GmbH
Belgium Jos Dehaeseleer Marcogaz
Kyriakos Gialoglou Eurogas
Vince van de Ven Eandis
Brazil Antonio Almela Gas Natural Fenosa
Jose Carlos Broisler Oliver
(Vice Chair)
Comgás
Alex Sandro Gasparetto Petrobras
Walter Fernando Piazza Gas Brasilliano Distribuidora S/A
Colombia Alfredo Chamat Surtigas

This publication is produced under the auspices of the International Gas Union (IGU) which holds the copywrite. The publication must not be reproduced in whole or in part without the written permission of the IGU. However, irrespective of the above, established journals or periodicals shall be permitted to reproduce this publication, or part of it, abbreviated or edited form, provided that credit is given to IGU. This document contains strictly technical information to be distributed during the 27th World Gas Conference in Washington DC, USA, and has no commercial intent.
6
Country Member Company/Organization
Croatia Marko Horvacki Živalov Prvo plinarsko društvo - Distribucija plina d.o.o.
Marijana Perić Gradska Plinara Zagreb d.o.o.
Zoran Pul HEP-Plin d.o.o.
Vedran Vranešić INA d.d., Zagreb
Czech Republic Libor Çagala (Study Group 3 Leader)
Innogy
Petr Štefl Czech Gas Association
Denmark Erik Haulund Christensen DONG Energy
Birgitte Herskind HMN Naturgas
Egypt Tarek el Hawary Taqa Gas
Finland Thomas Schmidt Neste Jacobs Oy
France Christian Buffet GRDF
Yves Tournié Expertconnect
Pascal Vercamer Engie
Liliane Wietzerbin GRDF
Germany Bodo Andreas Kipker NBB Netzgesellschaft Berlin-Brandenburg
Dietmar Spohn Stadtwerke Bochum Holding GmbH
Andre Wankelmuth Itron
Iran Behzad Babazadeh National Iranian Gas Co
Hamed Hashemi Malayeri National Iranian Gas Co
Ebrahim Khalili NIGC
Ireland Rory Somers Gas Networks Ireland
Italy Luciano Baratto Anigas
Franco Jamoletti Regas Srl
Gianmarco Peretti Regas Srl
Livio Valagussa Regas Srl
Japan Toshiaki Adachi Toho Gas Co., Ltd
This publication is produced under the auspices of the International Gas Union (IGU) which holds the copywrite. The publication must not be reproduced in whole or in part without the written permission of the IGU. However, irrespective of the above, established journals or periodicals shall be permitted to reproduce this publication, or part of it, abbreviated or edited form, provided that credit is given to IGU. This document contains strictly technical information to be distributed during the 27th World Gas Conference in Washington DC, USA, and has no commercial intent.
7
Country Member Company/Organization
Yotaro Ito Toho Gas Co., Ltd
Takao Kume Tokyo Gas Co., Ltd.
Yoshinori Ozawa Osaka gas
Ken Tashiro Tokyo Gas Co., Ltd.
Yoshiaki Yoshii Osaka Gas
Korea Youngsam Oh Korea Gas Corp.
Mexico Jesús López de Andrés Gas Natural Fenosa SDG
Pakistan Muhammad Danish Petroleum Institute of Pakistan
Saeed Larik Sui Northern Gas Pipelines Ltd (SSGC)
Owais Shakeel Khan Khyber Pakhtunkhwa Oiland Gas Co (KPOGCL)
Mohammad Waseem Sui Northern Gas Pipelines Ltd (SSGC)
Mahmood Zia Sui Northern Gas Pipelines Ltd (SSGC)
Poland Maciej Chaczykowski Warsaw University of Technology
Portugal Gabriel Sousa Galp Energia
Russia Vladimir Klimenko Gazprom Promgaz JSC
Alexey Kosarev NIIgazekonomika LLC
Marina Krasilnikova Gazprom Promgaz JSC
Natalia Kruglova Gazprom Vniigaz LLC
Juan Parreno Gazprom Marketing & Trading Limited
Igor Tverskoy Gazprom Promgaz JSC
Serbia Milan Gabran Gas Feromont
Dragan Vučur JP Srbijagas
Slovakia Peter Demec SPP-Distribucia, a.s.
Slovenia Franc Cimerman Plinovodi d.o.o.
Spain José María Almacellas (Chair) Gas Natural Fenosa
Naiara Ortiz de Mendíbil Sedigas

This publication is produced under the auspices of the International Gas Union (IGU) which holds the copywrite. The publication must not be reproduced in whole or in part without the written permission of the IGU. However, irrespective of the above, established journals or periodicals shall be permitted to reproduce this publication, or part of it, abbreviated or edited form, provided that credit is given to IGU. This document contains strictly technical information to be distributed during the 27th World Gas Conference in Washington DC, USA, and has no commercial intent.
8
Country Member Company/Organization
Sergio Santaengracia Nortegas
Carlos Villalonga (Secretary) Sedigas
Thailand Satapanik Rodrugsa PTT Public Company Limited
Gridtin Tongutaisri PTT Public Company Limited
The Netherlands Ben Lambregts (Study Group 2 Leader)
Liander Asset Management
Kees Pulles Kiwa Gas Technology
Michielvan Dam Enexis
Turkey Kuddusi Atalay IGDAS
Ömer Doğan
Batuhan Akyol
Gazbir
Gazbir
Murad Şeralioğlu IGDAS
USA Nicholas Biederman (Study Group 1 Leader)
Gas Operations Innovation Alliance
Wally Buran Enovation
Matt Guarini Enovation
Christina Sames AGA
Cliff Simon Energy Experts International
Mike Watanabe Energy Experts International
Paul Wehnert Heath Consultants Incorporated
3. Meetings
IGU DC held 6 meetings in the triennium 2015-2018:
- 6th to 9th October 2015 in Barcelona, Spain; - 8th to 12th March 2016 in Istanbul, Turkey; - 11th to 14th October 2016 in The Hague, Netherlands; - 21st to 23 March 2017 in Paris, France; - 10th to 13th October 2017 in Chicago, USA; - 13th to 15th March 2018 in Lisbon, Portugal.

This publication is produced under the auspices of the International Gas Union (IGU) which holds the copywrite. The publication must not be reproduced in whole or in part without the written permission of the IGU. However, irrespective of the above, established journals or periodicals shall be permitted to reproduce this publication, or part of it, abbreviated or edited form, provided that credit is given to IGU. This document contains strictly technical information to be distributed during the 27th World Gas Conference in Washington DC, USA, and has no commercial intent.
9
4. Study Group Reports
The IGU DC set up three Study Groups in 2015 to deal with the three topics of the triennium:
• Study Group 1: Role of the DSO. Market Creation and Facilitation, chaired by Mr Nicholas Biederman, USA;
• Study Group 2: Operational Excellence of Distribution Activities, chaired by Mr Ben Lambregts, The Netherlands;
• Study Group 3: System integration of Gas and other Energies (including green gases), chaired by Mr Libor Çagala, Czech Republic.
The following chapters of this report include the individual reports of the three Study Groups.
During the triennium, the IGU DC also carried out benchmarking on different topics of interest of their members to exchange knowledge and experience. The topics selected were:
• Use of methane detectors;
• Conditions of use of PER 100RC in distribution networks; • Update of gas distribution figures in different countries.
5. Glossary
AC Alternating [electric] current
A/C Air-conditioning
AGA American Gas Association
ALARP As Low As Reasonably Practical
ANG Absorbed natural gas
BRP Business Process Re-engineering
Capex Capital expenditure
CEN Comité Européen de Normalisation
CHP Combined heat and power
cm Centimeter
CNG Compressed natural gas
CO2 Carbon dioxide
CRM Customer relationship management
CSR Customer service representative
DART Days away, restrictions and transfers
DC Direct (electric) current
DIMP Distribution integrity management program
DNO Distribution network operator
DSO Distribution system operator

This publication is produced under the auspices of the International Gas Union (IGU) which holds the copywrite. The publication must not be reproduced in whole or in part without the written permission of the IGU. However, irrespective of the above, established journals or periodicals shall be permitted to reproduce this publication, or part of it, abbreviated or edited form, provided that credit is given to IGU. This document contains strictly technical information to be distributed during the 27th World Gas Conference in Washington DC, USA, and has no commercial intent.
10
DVGW Deutsche Verein de Gas- und Wasserfaches
EU European Union
FRU Floating regasification unit (LNG)
FSU Floating storage unit (LNG)
GIS Geographic Information System
GPS Global positioning system (US)
GrDF Gaz Naturel GRDF: le réseau de distribution de gaz naturel
GTL Gas-to-liquids
GWh Gigawatt hours of electricity
HCA High consequence areas
HDD Horizontal directional drilling
HP Horse power
IGEM Institution of Gas Engineers and Managers
IGU International Gas Union
ILI Inline [pipeline] inspection
ILO International Labour Office
ISO International Organization for Standardization
kg Kilogram
km Kilometer
KPI Key Performance Indicator
kWh Kilowatt hours of electricity
lb Pound
LDC Local distribution company
LNG Liquified natural gas
LPG Liquid petroleum gas (propane and butane)
LPWA Low-Powered Wide-Area
m Meter
m3 Cubic meter
MCA Medium consequence areas
MGO Maritime gas oil
mm Millimeter
NOx Nitrous oxides
NTA8120 Netherlands Technical Agreement
OE Operational Excellence
Opex Operating expenses
OSHA Occupational Safety and Health Administration
PAS55 Publicly Available Specification 55
PAS 55-1:2008 Specification for the optimized management of physical assets
PDCA Plan, Do, Check, Act
PE Polyethylene plastic
PHMSA Pipeline and Hazardous Materials Safety Administration
PM Particulate matter
PPE Personal protective equipment
PSMS Pipeline safety management system
PV Photovoltaic
RES Renewable energy sources
RGII Registered Gas Installers of Ireland
RFID Radio frequency identification device
RP Recommended practice
RPA Risk and performance assurance
SaaS Software as a service
SCADA Supervisory control and data acquisition
This publication is produced under the auspices of the International Gas Union (IGU) which holds the copywrite. The publication must not be reproduced in whole or in part without the written permission of the IGU. However, irrespective of the above, established journals or periodicals shall be permitted to reproduce this publication, or part of it, abbreviated or edited form, provided that credit is given to IGU. This document contains strictly technical information to be distributed during the 27th World Gas Conference in Washington DC, USA, and has no commercial intent.
11
SME Subject matter experts
SMS Safety management system
SOx Sulfur oxides
SSLNG Small-scale liquified natural gas
TIMP Transmission integrity management program
TPD Third party damages
VR/AR Virtual reality/Augmented reality

This publication is produced under the auspices of the International Gas Union (IGU) which holds the copywrite. The publication must not be reproduced in whole or in part without the written permission of the IGU. However, irrespective of the above, established journals or periodicals shall be permitted to reproduce this publication, or part of it, abbreviated or edited form, provided that credit is given to IGU. This document contains strictly technical information to be distributed during the 27th World Gas Conference in Washington DC, USA, and has no commercial intent.
12
6. IGU DC Study Group 1 Report. Role of DSO in market creation and facilitation
6.1. Introduction
The scope of this report addresses a DSO’s activities on the promotion and the development, and facilitation of the natural gas market. The overview of the analytical process for this report is shown in Figure 6.1.
Figure 6.1: Overview of report process
Of importance in the 2015-18 Triennium the IGU Distribution Study Group 1 was tasked with exploring the opportunities for improving opportunities for natural gas through—
• ACCESS – development of supply, removal of barriers towards infrastructure development;
• MARKETS -- increasing opportunities to grow demand, integration of gas with other forms of energy, removal of market barriers
Important definitions in this report are—
• Remote/isolated/low-density areas: Market opportunities not connected to the pipeline that are economically not supported by load, or are technically infeasible for environmental and/or security reasons;
• DSO: Distribution System Operator that delivers pipeline gas to ultimate customers/end users.
The gas supply for new customers can under the right circumstances overcome challenges in situations where the distance to the pipeline (isolated areas) or demanding environmental requirements for network installations make the gas supply from the economic viewpoint impracticable. Some possible alternatives are:

This publication is produced under the auspices of the International Gas Union (IGU) which holds the copywrite. The publication must not be reproduced in whole or in part without the written permission of the IGU. However, irrespective of the above, established journals or periodicals shall be permitted to reproduce this publication, or part of it, abbreviated or edited form, provided that credit is given to IGU. This document contains strictly technical information to be distributed during the 27th World Gas Conference in Washington DC, USA, and has no commercial intent.
13
• Transporting natural gas to final consumers or isolated distribution networks in the form of large LNG facilities and small-scale ANG, CNG or LNG using road, rail and sea means of transportation; or local biogas plants;
• New installation technologies: Methods for developing and expanding networks that are safer, more respectful of the urban environment, and reduce, as much as possible, the installation costs;
• Physical installation of the pipe (mains and services) with trenchless construction, keyhole, aboveground, narrow and shallow trenches that will include changes to--
• Materials/pressure;
• Reduce investment cost /operating expenses;
• Attachment policies included in tariffs.
• Promotion of new markets for gas.
The IGU analysis of future natural gas in its document Global Natural Gas Insights 2017 Edition expects demand to double in the next 50 years. This forecast being driven by an increasing worldwide population and economic development. As discussed in this report new technologies for expanding and maintaining the infrastructure and new end use applications; as well as activities on the part of DSOs to relate to customers and the overall public generally will aid in this market growth.
Potential for growth of natural gas in the primary energy mix is also predicted in several energy company forecasts. For example, the BP Energy Outlook shows natural gas as a share of primary energy increasing from during the period 2017-2035, as shown in Figure 6.2.

This publication is produced under the auspices of the International Gas Union (IGU) which holds the copywrite. The publication must not be reproduced in whole or in part without the written permission of the IGU. However, irrespective of the above, established journals or periodicals shall be permitted to reproduce this publication, or part of it, abbreviated or edited form, provided that credit is given to IGU. This document contains strictly technical information to be distributed during the 27th World Gas Conference in Washington DC, USA, and has no commercial intent.
14
Figure 6.2: Primary energy growth, 1965-2035
According to Energy Outlook 2017, the gradual transition in the fuel mix is set to continue with renewable (together with nuclear and hydroelectric power) expected to account for half of the growth in energy supplies over the next 20 years. Oil, gas and coal are expected to remain the sources of energy powering the world economy. Gas is expected to be the fastest growing fuel (1.6%) with its share in primary energy increasing as it overtakes coal to be the second-largest fuel source by 2035. Oil is expected to continue to grow (0.7%); although its pace of growth is expected to slow gradually. The growth of coal is projected to decline sharply (0.2%) compared with 2.7% over the past 20 years. Renewable energy is the fastest growing source of energy (7.1%) with its share in primary energy increasing to 10% by 2035.
Until now the LNG market has been centralized in Asia, including Korea and Japan. The Asian market is expected to continue to grow and be the center of gravity of the world’s LNG demand, importing over 70% of the fuel until 2030. However, beginning around 2025, China, India and ASEAN (Southeast Asia) together are expected to import more LNG than Japan, Korea and Taiwan combined.
The key to expanding the LNG (i.e., natural gas) market with be financing the construction of the infrastructure, principally LNG terminals and pipeline networks. Because of environmental pollution, as well as an expectation of a stable price compared to oil, many courtiers want to use natural gas. The biggest barrier to use natural gas in some countries will be the lack of investment funds to construct them. On this point there are indications that the major energy companies may contribute to this development. There is also the potential for the development banks to provide funding.
In most cases included in the chapters of this report Case Studies (i.e., examples) of the ideas and activities expressed that are actively being undertaken by DSOs and supporting companies.

This publication is produced under the auspices of the International Gas Union (IGU) which holds the copywrite. The publication must not be reproduced in whole or in part without the written permission of the IGU. However, irrespective of the above, established journals or periodicals shall be permitted to reproduce this publication, or part of it, abbreviated or edited form, provided that credit is given to IGU. This document contains strictly technical information to be distributed during the 27th World Gas Conference in Washington DC, USA, and has no commercial intent.
15
6.2. Competitiveness of Pipeline Quality Gas
Natural Gas – clean and economic fossil fuel
Renewables are starting to play an important role in energy policy within the EU, which consequently led to their financial support within member states. However, renewables should not be recognized as the goal of energy policy, but as means for climate and environmental improvement. Furthermore, it is very important to evaluate their contribution not only for CO2 emission reduction, but the impact of renewables on the amount of other types of emissions should be considered, as well.
These other emissions include mainly particulate matter related with wood/biomass utilization, as the air polluted by them has a direct negative impact on human health. If this is not the case, investments in renewables will not bring about the desired effect. By contrast, if natural gas is replaced by biomass, environment and human health could deteriorate.
Figure 6.3: CO2 emissions by different fuel
Environmental quality improvement measures are being evaluated mainly regarding the CO2
reductions (which does not endanger human health directly) and based on the RES share on the energy production.
In complex evaluations, it should be stressed that air pollutants (i.e., human health endangering emissions) like SOx, NOx, PM10 and PM2,5 should be reduced; hence evaluated.
PM emissions from burning biomass are more than 8-times greater than from burning natural gas. CO2 emissions are almost double compared to that of combustion of natural gas. This lowers air quality as shown in Figure 6.4.

This publication is produced under the auspices of the International Gas Union (IGU) which holds the copywrite. The publication must not be reproduced in whole or in part without the written permission of the IGU. However, irrespective of the above, established journals or periodicals shall be permitted to reproduce this publication, or part of it, abbreviated or edited form, provided that credit is given to IGU. This document contains strictly technical information to be distributed during the 27th World Gas Conference in Washington DC, USA, and has no commercial intent.
16
Figure 6.4: Worsening Air Quality If Natural Gas Is Replaced by Wood or Biomass
From an economic point of view, the most recent analyses evaluate the contribution of RES to reducing emissions in relation to the price that had been paid for this environmental benefit. With no subsidies, natural gas wins “the economic solution of household heating and hot water preparation contest,” as total expenses over 15 years (including capex, opex and all actual subsidies) are the lowest. The only “price competitor” is wood. However, considering the need for wood storage, environmental impact and overall discomfort, wood cannot be really seen as comparable competitor to the natural gas. This is illustrated for Slovakia in Table 6.1.

This publication is produced under the auspices of the International Gas Union (IGU) which holds the copywrite. The publication must not be reproduced in whole or in part without the written permission of the IGU. However, irrespective of the above, established journals or periodicals shall be permitted to reproduce this publication, or part of it, abbreviated or edited form, provided that credit is given to IGU. This document contains strictly technical information to be distributed during the 27th World Gas Conference in Washington DC, USA, and has no commercial intent.
17
Table 6.1. Natural Gas in Slovakia – Economic Fuel Even if the Use of RES is Heavily Subsidized
Overall natural gas contributes positively for global environmental impact and for local air quality. With natural gas there is a very important decrease in NOx, PM and SOx:
• Residential Sector: Positive impact of natural gas boiler compared with use of biomass (-97% NOx, -99% PM, -98% NOx). Additional benefits resulting of continuous supply and easy access where natural gas distribution already operates;
• Transport Sector: Positive impact of natural gas on transport sector (-60% NOx, -93% PM, -97% SO2 when compared to diesel engines; -25% CO2 when compared to petrol engines). The large capital investment requirement for development of supply infrastructure in several countries that shows a low development of stations;
• Industrial Sector: natural gas represents the top solution for industrial utilizations that needs high heat demand, with the best results in control of combustion, control of product quality, emissions results (relevant decrease of CO2 emissions compared with fuel) and energy competitiveness and hence contributing for economic competitiveness of industries and countries.
Natural gas is not only one of the top solutions for the energy challenge, but also one of the top solutions for climate and emissions challenge.

This publication is produced under the auspices of the International Gas Union (IGU) which holds the copywrite. The publication must not be reproduced in whole or in part without the written permission of the IGU. However, irrespective of the above, established journals or periodicals shall be permitted to reproduce this publication, or part of it, abbreviated or edited form, provided that credit is given to IGU. This document contains strictly technical information to be distributed during the 27th World Gas Conference in Washington DC, USA, and has no commercial intent.
18
6.3. Stakeholder Interactions
This chapter discusses how DSOs (including suppliers and marketers, as applicable) and existing and potential customers maintain contact using well-formed websites, email, texts and social media. Included in this discussion are the benefits of understanding and communicating with the “digital customer.”
The evolution of unbundled operations in several countries and the existence of different roles for suppliers and distributors contribute to expanding natural gas sales but raises an important challenge about the real and effective role of the DSO.
Natural gas distribution operators must not only keep focus on the development and maintenance of infrastructures, but they also need to work hard on the promotion of natural gas in the energy mix solutions.
This is getting more relevant every day, since natural gas suppliers are also supplying other energy solutions (e.g., electricity) in several countries. DSO’s must focus on the promotion, development and competitiveness of natural gas.
DSOs have an essential role not only as an active developer and maintainer of natural gas networks, but also as a market creator and facilitator by:
• Providing customer services, such as new connections, metering, customer data management and providing information, emergency calls response, monitoring safety of customer installations, etc;
• Considering carbon tax initiatives;
• Using green technology as a part of the operating system (where feasible);
• Demonstrating the positive role of natural gas in the energy mix;
• Promoting integrated safety and energy-saving apps/controls.
A matrix of promotional responsibilities is shown in Table 6.2. This matrix identifies how different natural gas-related personnel categories could interact with outside organizations/individuals for allowing each to better understand the role of natural gas now and in the future and promote the market for natural gas.
Maintaining existing customers and promoting an environment that encourages new customers is a key factor in expanding the market for natural gas.
From the DSO point-of-view there are several things that can be done to provide good customer service. These ideas include:
Use of smart phone apps offers many opportunities for stakeholder interactions

This publication is produced under the auspices of the International Gas Union (IGU) which holds the copywrite. The publication must not be reproduced in whole or in part without the written permission of the IGU. However, irrespective of the above, established journals or periodicals shall be permitted to reproduce this publication, or part of it, abbreviated or edited form, provided that credit is given to IGU. This document contains strictly technical information to be distributed during the 27th World Gas Conference in Washington DC, USA, and has no commercial intent.
19
• High-touch approach aimed at building a personal connection between the company and the customer;
• Make judicious use of the customer’s time – i.e., minimize company-customer contact;
• Make the company available to the customer in all possible ways;
• Use apps/bots to communicate with the customer and the customer with the company – i.e., customer-self help;
• Adopt methods customers use and understand from other industries – i.e., mobile devices and social media – establish “digital trust”;
• Provide consistency, quick answers and seamless interactions across all methods of interaction while delivering both self-service and personalized service;
• Establish loyalty programs;
• Develop a 360° view of the customer through analytics;
• Respond to customers asking for access to green energy by enabling the distribution of green gases (e.g., biomethane) through the grid in relevant areas (mainly Europe).
To achieve these aims, the DSO has many potential opportunities to engage its customers. These opportunities include:
• A simple and easy-to-use website;
• Potential high bill notifications;
• Online bill pay;
• Proactive notifications of service interruption;
• Explanations of rate changes;
• Personalized products and services tailored to a customer’s needs;
• Insights on managing consumption;
• Outage preparation information;
• Outage realtime information monitoring;
Focusing on the need of interaction to promote natural gas as a solution for the future, the main stakeholders that can help with that goal should be identified. Interaction of the various stakeholders is shown in Table 6.2. These stakeholders include:
• National and local authorities;
• Regulators;
• Industrial associations;
• Consumer associations;
• Gas appliances manufacturers;
• Digital technologies;
• Labor unions;
• Environmental associations;

This publication is produced under the auspices of the International Gas Union (IGU) which holds the copywrite. The publication must not be reproduced in whole or in part without the written permission of the IGU. However, irrespective of the above, established journals or periodicals shall be permitted to reproduce this publication, or part of it, abbreviated or edited form, provided that credit is given to IGU. This document contains strictly technical information to be distributed during the 27th World Gas Conference in Washington DC, USA, and has no commercial intent.
20
Table 6.2. Personnel promotional responsabilities (DSO-Customer Interactions)
ACTIVITY / PERSONNEL CATEGORIES D
SO
Tech
nic
al
DSO
Man
agem
en
t
Co
ntr
acto
rs
DSO
Cu
sto
me
r Se
rvic
e
Re
tail
Sa
les
(of
app
lian
ces)
Ap
plia
nce
Man
ufa
ctu
rers
Ind
ust
ry
Ve
nd
ors
/
Man
ufa
ctu
rers
Re
gula
tory
Au
tho
rity
NG
Os
Outreach* x x x x x x x
Mass Media Advertising
x x x x x
Community Volunteering
x x x x
In-store Promotions x
National / Regional / International Organizations
x x x x x x x x
Research Cost Cutting/New Technologies
x x x x x x
Membership in Technical Committees
x x x x x x
Local Political Activity
x x x x x x
Provide Customer Education / Instruction
x x x x x
Interactive Social Media / Messaging
x x x x x x
High School/ College Internships
x x x x x
Focus Groups x x x
Interaction (Innovative) with Customers
x x x x x
Use of Apps for Interactive Communication
x x x
Improved website design
x x x x x
Tariff, Safety, Investment, Quality of Service
x x
* For example: school, labor union, small business organization and senior citizen group presentations on natural gas in the energy mix, GHG issues, sources of gas, etc.

This publication is produced under the auspices of the International Gas Union (IGU) which holds the copywrite. The publication must not be reproduced in whole or in part without the written permission of the IGU. However, irrespective of the above, established journals or periodicals shall be permitted to reproduce this publication, or part of it, abbreviated or edited form, provided that credit is given to IGU. This document contains strictly technical information to be distributed during the 27th World Gas Conference in Washington DC, USA, and has no commercial intent.
21
• Developing a sense of community of users, to promote the development and increase of customers;
• Gas installations contractors;
• Pipeline and gas installations materials manufacturers;
• Research organizations.
This is done in today’s environment predominantly through social networks (i.e., digitally). Some key elements in building and maintaining digital trust between the DSO and customers are:
• Security. Issues include malware and/or virus protection, data integrity, hacking protection, data permissions and user identity, data encryption standards, resiliency, and data connections such as VPN and SSL;
• Accountability. Trusted providers need the ability to protect data integrity. They also need the legal and compliance resources to deal with global and regional data standards;
• Privacy and data control. Trust requires effective company data policies, third-party data sharing and machine-to-machine (M2M) data sharing. Providers must also meet regional cultural expectations and provide government access to data as appropriate;
• Benefit/Value. Digital trust is also dependent upon the provider delivering value to the customer, through services, brand, reputation and customer service.
It is also important that the DSO develop and maintain a culture of customer service. Ten important aspects of creating such a culture are:
• Engage LDC senior leadership - Example: Developed multiple communication efforts to make employees even more aware that the utility was committed to improving service levels;
• Engage customers - Example: Focus groups, public meetings, outreach efforts and social media efforts are being used to engage customers. Interest in sustainability and energy efficiency lead the utility to provide consumers with monthly customized home energy reports;
• Hire the right people - Examples: Have top executive job candidates complete a questionnaire to help establish commonalities between the candidate’s core values and the utility’s corporate culture. In employee interview process use “speed date” with potential managers and coworkers to ensure hiring of the correct applicants;
• Cultural alignment - Example: Employ a cultural assessment survey to show if customer service and satisfaction were core values that employees recognize within the organization;
• Educate and train - Examples: Develop an employee orientation program that describes the organization’s core values and links the values with the Strategic Plan and goals for the next five years;

This publication is produced under the auspices of the International Gas Union (IGU) which holds the copywrite. The publication must not be reproduced in whole or in part without the written permission of the IGU. However, irrespective of the above, established journals or periodicals shall be permitted to reproduce this publication, or part of it, abbreviated or edited form, provided that credit is given to IGU. This document contains strictly technical information to be distributed during the 27th World Gas Conference in Washington DC, USA, and has no commercial intent.
22
• Retain the best - Example: Establish career development plans for all employees to ensure growth opportunities, increase retention levels and promote more effective succession planning;
• Empower company employees - Example: Establish policies for customer service representatives (CSR) to use when discussing payment arrangements with customers. Within these guidelines, the CSRs have the authority to negotiate terms with each customer that is appropriate for their individual situation;
• Communicate service success - Example: Recognize employees that go above-and-beyond their normal duties;
• Reward and recognize excellent customer service - Example: Announce in a company newsletter, on the webpage, give a plaque, or send a handwritten note from senior management; and/or give a gift certificate to encourage behavior supporting a great service culture;
• Create and track metrics - Example: Include in employee appraisal systems how they meet company customer service goals.
Some of the creative programs for establishing and maintaining the DSO-customer relationship have been through payment activities. These have included-:
• Fixed-rate plans for 12, 24 or 36 months. Some utilities in unregulated markets have prepaid plans that don’t require a credit check or deposit;
• Refer-a-friend programs;
• Offering a free Nest-type thermostat with a fixed-rate plan;
• Free gas on the weekends;
• Themed rewards programs, such as family rewards, travel rewards or shopper’s rewards where customers receive gift certificates for paying their bills on time;
• Get more, save more plans with a competitive energy charge for the first tranch of gas and a lower charge for additional usage;
• Renewable energy plans where the gas comes from sources, such as biogas;
• Cash-back offers or plans where customers can exchange reward points for goods and services;
• Connected home mobile applications so customers can manage their accounts on the go, or control their heating, home security and door locks.
The Japanese DSOs have some cooperative frameworks for R&D. For example, the three leading city gas companies work together on R&D projects. If the technical development has a high degree of difficulty, R&D is funded as a national project through the government. Collaborative R&D between companies is also done with the cooperation of JGA (Japan Gas Association).

This publication is produced under the auspices of the International Gas Union (IGU) which holds the copywrite. The publication must not be reproduced in whole or in part without the written permission of the IGU. However, irrespective of the above, established journals or periodicals shall be permitted to reproduce this publication, or part of it, abbreviated or edited form, provided that credit is given to IGU. This document contains strictly technical information to be distributed during the 27th World Gas Conference in Washington DC, USA, and has no commercial intent.
23
In the US DSOs have formed cooperative funding consortiums in which the DSOs pool their R&D funds to undertake research programs for both operations and end use applications. In these programs manufacturers are usually involved in either the initial development or during the commercialization step.
The European DSOs conduct cooperative research programs through the European Gas Research Group (GERG). For larger scale projects funds are also available through the European Commission’s Directorate-General Energy for Research & Innovation Joint Research Centre (JRC) and CEN.
The following framework (Figure 6.5) shows the main concepts to develop natural gas promotion within the society, with a particular focus on customer experience, partnerships and stakeholder participation.
Figure 6.5: Framework for promotion improvement
This publication is produced under the auspices of the International Gas Union (IGU) which holds the copywrite. The publication must not be reproduced in whole or in part without the written permission of the IGU. However, irrespective of the above, established journals or periodicals shall be permitted to reproduce this publication, or part of it, abbreviated or edited form, provided that credit is given to IGU. This document contains strictly technical information to be distributed during the 27th World Gas Conference in Washington DC, USA, and has no commercial intent.
24
CASE STUDY 6.1: SPP experience with analytics to stop customer churn
Slovenský plynárenský priemysel, a.s. (SPP) using customer segmentation, achieved by analytical modelling, can reach the right customers with the right product offers. New, targeted multichannel campaign strategies helped it cross-sell electricity to its gas customers and offer new customers special incentives for switching to either its gas or electric services. Churn-reduction campaigns are now 50% more efficient thanks to early warning indicators and alerts.
CASE STUDY 6.2: Cooperation Between the DNO and Gas Boilers’ Vendors – (Retention Policy)
Slovenský plynárenský priemysel, a.s., the major Slovak gas DNO, joined in a cooperative effort with gas boiler manufacturers and vendors in order to retain customers connected to the gas grid.
Using basic grid data, such as the age of mains and connections, the DNO generated a list of villages and parts of towns, which were built approximately 20 years ago. The logic behind this is the average lifetime or renewal cycle for domestic gas heating systems, especially boilers, is 20 years.
Because there is a trend towards a cleaner and greener low-carbon future, customers in heating areas might be more willing to switch to another, greener way for heating and hot water. This is even more likely taking into consideration the generous subsidies from the Government for the installation of greener alternatives.
Therefore, the DNO decided that the promotion of natural gas should be primarily directed to locations where customers are considering renovating heating systems. Existing and potential customers are more open to providers marketing competitive solutions where this is taking place.
The gas boiler vendors directly marketed their appliances to customers including special offers, such as--
• Discount price for the boiler, fittings and installation;
• Installment financing with zero interest;
• Prolonged warranty period;
• Discounts for the filter and anticorrosion and cleansing applications;
• Free-of-charge heating system water analysis;
• Free consultancy.
Based on the project outcomes SPP concluded that customers preferred the Installment sale with no interest payments for the boiler.
CASE STUDY 6.3: Cooperation Between the DSO and Mortgage Loan Provider – (New Houses)
Slovenský plynárenský priemysel, a.s. formed an agreement with one of the Slovak major mortgage loan providers – VUB Bank. The terms of the agreement were a reduction of the mortgage interest

This publication is produced under the auspices of the International Gas Union (IGU) which holds the copywrite. The publication must not be reproduced in whole or in part without the written permission of the IGU. However, irrespective of the above, established journals or periodicals shall be permitted to reproduce this publication, or part of it, abbreviated or edited form, provided that credit is given to IGU. This document contains strictly technical information to be distributed during the 27th World Gas Conference in Washington DC, USA, and has no commercial intent.
25
rate for the new house, if the future owner of the house chose natural gas as the primary heating option.
The big advantage from the DSO’s point-of- view is the opportunity to target this marketing tool to locations where more unconventional (but not necessary greener) solutions have tendencies to succeed. In this case the DSO must sacrifice some part of the future income (in favor of the bank) to attract new customers.
CASE STUDY 6.4: Use of Business Intelligence and Data Mining Techniques for Personalized Offers for Its Customers
Slovenský plynárenský priemysel, a.s., the major Slovak Gas shipper and one of the biggest gas and electricity trader and seller, introduced the innovative way of direct marketing of cross-selling electricity to existing gas customers.
In the form of short (up to 1 min) video clips, emailed to existing customers, an actor salutes the customer with his or her name, gives personalized information about the recent consumption and payments, followed with the cross-selling offer for a combined electricity and gas contract.
SPP is one of the leaders in the Slovak and Czech energy market in BI and datamining, where only 15% of all companies and only 4% of utilities use BI in their marketing activities. SPP uses predictive analyses, analysis of non-structured data (text mining) and the trend to personalization of its marketing approaches.
The objective of the campaign was, besides the sale of products, enhancing customer loyalty and strengthening the company’s image especially in the innovation attribute.
CASE STUDY 6.5: Kansas City P&L improves energy efficiency program enrollment
Kansas City Power & Light (KCP&L) provides energy-related products and services in the Kansas City area of the US. To better engage its customers, KCP&L launched a preference center where customers can opt to receive various emails and register for paperless billing. Today, KCP&L communicates with more than 25% of its customer base through email, engaging its community to help promote its programs and services and has increased enrolment in its energy efficiency programs.
CASE STUDY 6.6: US National Grid in NY’s Reforming the Energy Vision (REV) project
To find out what customers expect they ask. In Worcester (MA) they have a storefront on Main Street called the Sustainability Hub that is a community space. It allows them to “share information on a granular level.” National Grid has quit trying to avoid customer interaction and get involved. Being a bit in the “early adopters” camp on the customer interface front is valuable to every utility, according to the company.

This publication is produced under the auspices of the International Gas Union (IGU) which holds the copywrite. The publication must not be reproduced in whole or in part without the written permission of the IGU. However, irrespective of the above, established journals or periodicals shall be permitted to reproduce this publication, or part of it, abbreviated or edited form, provided that credit is given to IGU. This document contains strictly technical information to be distributed during the 27th World Gas Conference in Washington DC, USA, and has no commercial intent.
26
CASE STUDY 6.7: Washington Gas Light uses self-service analytics
WGL delivers natural gas in the Washington D.C. metro area. In 2015 the company began developing a self-service analytic operating model - calling it SANoP - that would enable all its employees to easily access the company's data to help them do their jobs more effectively and efficiently.
For example, Washington Gas service technicians could use SANoP to schedule their appointments to maximize the number they can fit into a day. In addition to the appointments' locations, SANoP would consider such variables as the types of services the technicians are scheduled to perform at each appointment and how long performing those services typically takes.
Data analytics is commonly used to make appointment schedules for field workers at many types of businesses. But it typically isn't used by the workers themselves on the spur of the moment.
SANoP would be able to use artificial intelligence to pull data from wherever the data resides in Washington Gas' information-technology systems to perform the tasks requested of it.
SANoP also would allow users to ask questions or make requests in their everyday vocabulary due to its use of an IT concept called an ontology, which is a descriptive model of the world that the software will deal with. To make that possible, Sapp's team includes 10 business-model subject-matter experts as well as five software engineers.
WGL plans to initially deploy SANoP to its field-service technicians and billing personnel, Sapp said. If all goes well, he said, the company would make SANoP available to other employees and eventually to customers, who could use it to better understand and manage their gas consumption.
6.4. Expanding Existing and New Market Identification (Market Facilitation)
Placed at the end of the gas supply chain, and close to local economic actors and gas consumers, as mentioned above, DSOs have an essential role as an active deployer of natural gas networks, but also as a market creator and facilitator. Investing in new connections to the gas grid and promoting current and new efficient uses of natural gas benefits all stakeholders from the corresponding natural gas market expansion. This is achieved by considering:
• Attachment policies;
• Climate effects/load factor;
• Incentives for using gas;
• Retail promotion (manufactures/retail outlets);
• Changing perception of natural gas vis-à-vis alternative fuels;
• Combination appliances, e.g., gas-solar;
• Small-scale generation of electricity and industrial uses;
• In-house piping system for simpler appliance installation;
• CNG/LNG/ANG vehicle storage for end-user backup;
• Green gas availability with the grid: Biomethane and hydrogen produced through gas2power, etc.

This publication is produced under the auspices of the International Gas Union (IGU) which holds the copywrite. The publication must not be reproduced in whole or in part without the written permission of the IGU. However, irrespective of the above, established journals or periodicals shall be permitted to reproduce this publication, or part of it, abbreviated or edited form, provided that credit is given to IGU. This document contains strictly technical information to be distributed during the 27th World Gas Conference in Washington DC, USA, and has no commercial intent.
27
Novel ways of promoting the traditional natural gas market for residential/commercial, large commercial, industrial and power generation are key to market expansion. This market is served from existing and new infrastructure of mains and services continues. There are DSOs that are actively trying out new techniques for expanding and maintaining their assets.
But in addition to traditional markets for natural gas served from underground mains and services many independent companies have formed utilizing liquefied natural gas (LNG) and compressed natural gas (CNG). These forms of natural gas are being used for mobile applications in place of LPG, gasoline, diesel and bunker C. Markets opened to natural gas from this include remote residential/commercial and industrial customers, automobiles (NGVs), long-distance trucking, mining equipment, bunkering for shipping applications, offshore oil and gas drilling rigs.
The market for small-scale LNG facilities covers the LNG virtual pipeline (delivering LNG to remote areas not covered by the pipeline grid). In the US, this has meant in some cases using shale reserves to supply fuel for high-horsepower applications, such as drilling, mining and other civil projects, the transportation demands of trucking, marine and rail plus power generation.
In addition to mobile applications, LNG and CNG are used for supplying remote residential/commercial and large “stranded” industrial customers. These remote markets exist where natural gas pipelines are not economically viable, but the price point, environmental and/or fuel quality for the industrial process make natural gas the fuel of choice. For example, the EU introduced a maritime fuel emissions cap for some areas, including the Baltic Sea.
Thus, small-scale LNG supply logistics has drawn attention because LNG can be carried to the market without pipeline networks. In the future, small-scale LNG including FSRU could help expand natural gas use in energy sector.
Due to several factors, the small-scale LNG supply model has regained attractiveness over the last couple of years. This method of supplying natural gas to remote sites in the US dates from the late 1960s. New environmental emissions policies and arbitrage in oil and gas prices have led many regions to begin building up small-scale infrastructures. In addition, the wider availability of LNG due to new projects and modifications of existing import terminals to enable redistribution of LNG also has contributed to this development. SSLNG is up to now mainly taking place in the US, Europe and China.
With a total amount of approximately 100 small-scale LNG production plants globally, the total SSLNG installed production capacity is upwards of 20 mtpa of LNG, approximately 5% of the global conventional LNG production (LNG, 2014 Edition). The majority of SSLNG production is in China, where approximately 100 - 150 plants account for 15 mtpa installed capacity. Total planned capacity is expected to reach 21mtpa by 2020.
For transport overseas, there are currently 24 LNG carriers in operation with less than 30.000 m3 cargo capacity, and the order book is filled with 14 new small-scale LNG carriers. The number of (very) small-scale regasification and import terminals is in the thousands, mainly located in Japan, Turkey,

This publication is produced under the auspices of the International Gas Union (IGU) which holds the copywrite. The publication must not be reproduced in whole or in part without the written permission of the IGU. However, irrespective of the above, established journals or periodicals shall be permitted to reproduce this publication, or part of it, abbreviated or edited form, provided that credit is given to IGU. This document contains strictly technical information to be distributed during the 27th World Gas Conference in Washington DC, USA, and has no commercial intent.
28
Spain and Northern Europe. Whereas the sector of small scale LNG wholesale and retail has been so far populated by small players, the recent growth is determined by the entrance of some of the big LNG players (e.g., Shell, Gazprom, Petrochina).
In the case of stranded gas supplies, several solutions are available for gas resource monetization. Stranded gas can either be triggered by a gas flaring reduction objective or from a remote gas resource without any infrastructure available around to handle gas.
Special purpose projects for small-size gas resources that are stranded, because they are uneconomical using conventional gas pipeline or LNG projects. A small-scale liquefaction project is the most feasible monetization route for stranded gas resources. Typically, LNG competes with other means of gas monetization, i.e.:
▪ Pipeline; ▪ CNG; ▪ Gas re-injection; ▪ Gas to power; ▪ Gas to methanol; ▪ GTL; ▪ Other.
The decision on the best transport and monetization method for gas mainly depends on the distance between supply and customer, market size, gas price and volume. The LNG can be sold with a premium when competing with gasoline, diesel, marine gas oil (MGO) and even compressed natural gas (CNG).
Biomethane production from purification of biogas and injection to the grid is also a way to expand the gas market for end users while promoting the fact that gas is a fuel-of-choice in the context of energy transition; particularly in Europe.
Developing technologies also offer opportunities for growing the natural gas market. These include fuel cells, small A/C, CHP, micro-turbines, and as a substitute for diesel in stationary applications.
6.4.1 New Customer Attachment Policies
The cost of attaching new customers is generally mandated in the tariffs of DSOs. These policies are negotiated with the regulatory agencies that monitor DSO activities. As such the DSO must balance the cost of these new attachments and the revenue generated against the increase in the tariff for existing customers. The difficulty is providing easy access for new markets while maintaining a tariff rate that encourages existing customers to maintain service.
The attachment policies incorporated in tariffs of the majority of DSOs worldwide for new residential/commercial end users take the form of three policies:
▪ Footage allowance; ▪ Revenue test;

This publication is produced under the auspices of the International Gas Union (IGU) which holds the copywrite. The publication must not be reproduced in whole or in part without the written permission of the IGU. However, irrespective of the above, established journals or periodicals shall be permitted to reproduce this publication, or part of it, abbreviated or edited form, provided that credit is given to IGU. This document contains strictly technical information to be distributed during the 27th World Gas Conference in Washington DC, USA, and has no commercial intent.
29
▪ Economic test. The Footage Allowance sets a limit on the amount of footage that can be installed free-of-charge for a new customer for both main extensions and services. This policy sets either a specific length for main extensions and services (i.e., straight footage) or a variable length allowance based on the estimated load to be generated by the new customer (i.e., demand-based footage). Variations on this policy include a fixed investment allowance based on the average cost per foot and the average length for new customers, or an allowance based on the average customer’s embedded cost for mains and services.
The Revenue Test is a calculation that yields the amount of investment allowed for a single attachment by multiplying the potential annual revenues (net or gross) expected from the customer by a selected economic factor.
The Economic Test is a variation on the Revenue Test that requires that either a rate-of-return (ROR) or a supportable investment be calculated, based on the rate-of-return allowed and the revenues to be generated from the new customer.
In the US over 50% of DSOs use the straight footage allowance for main extensions and almost two-thirds use straight footage for service extensions.
Some US companies require a deposit from the customer (or developer) in advance an amount of money equal to the company’s estimated cost of the required extension. Where an extension of main is required for service to lots under development within a subdivision, the developer may be required to deposit with the company an amount of money equal to the estimated cost of the required extension. In such cases, the developer grants to the company the right to install, operate and maintain the gas main and related facilities.
Refunds of the money deposited over a period of no more than 10 years are made in the amount equal to the original estimates for each customer that connects and takes service during this period from the original extension.
Some companies for individual residential or small commercial customers allow the additional amount of the extension above that mandated to be financed over some period (not to exceed 10 years) and collected as part of the monthly utility bill to the customer.
In many cases, the length and cost of the service extensions to not-for-profit schools, colleges, universities, hospitals and churches, and governmental agencies are substantially more generous.
In Algeria, a policy to promote natural gas has been in place since 1990. According to this policy, a DSO has an obligation to build transmission and distribution networks for new gas customers regardless of the length. The policy applies to new localities and to extensions in regions already served. The government finances these projects at 100%, while customers pay only a symbolic cost.
In Japan DSOs have an obligation to extend pipes, regardless of the extension length. The philosophy behind this is that the extension cost for main, branch, service pipes basically should be paid by gas

This publication is produced under the auspices of the International Gas Union (IGU) which holds the copywrite. The publication must not be reproduced in whole or in part without the written permission of the IGU. However, irrespective of the above, established journals or periodicals shall be permitted to reproduce this publication, or part of it, abbreviated or edited form, provided that credit is given to IGU. This document contains strictly technical information to be distributed during the 27th World Gas Conference in Washington DC, USA, and has no commercial intent.
30
utilities. According to Japanese DSOs the companies try to keep to the principle that gas utilities should treat all customers fairly. Therefore, if the extension cost exceeds the average construction cost per each existing household, the excess should be paid by a new customer.
In France, the investment for the extension is based on an economic criterion: i.e., if the economic criteria are not met the customer must cover the difference. This ensures efficient development of the network and avoiding increase of tariff due to an uneconomic decision.
In Italy, there is co-financing of networks delivering natural gas to depressed areas. The government co-financed these projects and there are many successful cases, especially in southern Italy.
Also, it is important to highlight the fact that access conditions and development/creation of new market regions will be evaluated based on the impact on the tariffs and the consequences these developments have on natural gas competitiveness.
Regulation and approval conditions should eliminate the risk of growing infrastructures under remunerated asset base conditions, below a certain level of consumption, which will end up increasing the tariffs.
6.4.2 Potential for LNG Remote Supply in World Market
Small-Scale LNG
There are already good prospects for portable, small LNG units in Canada, Russia, China, Australia and Indonesia.
Particularly in Indonesia, the most popular system is an LNG unit coupled with generators to supply power to neighboring villages with an agreed tariff with PLN (Indonesian power distribution authority) based on tenders. As there are very many islands in Indonesia, power transportation is a big challenge.
Figure 6.6: Small-Scale LNG Unit
The challenge for Russia and Canada is that the portable units require temperature compensation

This publication is produced under the auspices of the International Gas Union (IGU) which holds the copywrite. The publication must not be reproduced in whole or in part without the written permission of the IGU. However, irrespective of the above, established journals or periodicals shall be permitted to reproduce this publication, or part of it, abbreviated or edited form, provided that credit is given to IGU. This document contains strictly technical information to be distributed during the 27th World Gas Conference in Washington DC, USA, and has no commercial intent.
31
(due to inherent encapsulation of compressor unit) for constant operation.
Small-scale LNG is developing in China and can be implemented within relatively small space constraints. A lot of transportation in China is driven by natural gas.
Mid-Scale LNG
The mid-scale LNG systems use multiple, smaller, identical modular LNG trains that allow clients to scale their project, and costs, with market conditions. As examples, if feed gas supply resources are not fully developed, clients can start small and proceed with additional LNG trains as feed gas supply comes on line. If sufficient consumers are not available, or ready to commit, clients can serve the consumers that are ready and expand plant capacity as LNG demand grows. If multiple billions in financing are not available, clients can start with a smaller facility and expand as they sell LNG and secure more funding.
Each single liquefaction module is typically engineered to deliver between 900,000 to 2,700,000 gallons of LNG per day. Additionally, modular solutions are quicker to market and, thus, generate revenue faster for stakeholders.
Deployment of standard and modular plant designs significantly reduces overall time to production and provides lower cost and earlier recognition of revenues.
Standard Plant Concept
The standard plant concept consists of maximizing equipment with an essentially fixed mechanical design for a portfolio of capacities. At the specified nominal capacities, key pieces of equipment are designed once with those designs replicated on an ongoing basis. The concept is applied to the pretreatment, liquefaction, refrigeration, storage and truck loading sections of the plant.
The principal driver for project success is bringing gas to market quickly with LNG production proven to begin within 15 to 18 months of contract execution. Plants typically use a nitrogen cycle liquefaction process and are also simple to operate.
CASE STUDY 6.8: Small- and Mid-Scale LNG: The Spanish Case
Enagás is an example of how LNG terminals have switched from a traditional model to a multimodal LNG terminal. With more than four decades of experience in the “small scale” use of LNG, the adaptation to more demanding market needs required Enagás to face a number of technical challenges with innovative solutions regarding the management model, maximizing efficiency of existing assets, and adding efficiency to the classical value chain by integrating new logistic services.
Furthermore, in 2016 the European Commission chose the CORE LNG as hive initiative, among the projects submitted for the tender called by the Connect Europe Facility (CEF) for the development of the TransEuropean Transport Networks and will receive financial support of €16.5Mn from the European commission. The total investment in the project will amount to €33Mn.

This publication is produced under the auspices of the International Gas Union (IGU) which holds the copywrite. The publication must not be reproduced in whole or in part without the written permission of the IGU. However, irrespective of the above, established journals or periodicals shall be permitted to reproduce this publication, or part of it, abbreviated or edited form, provided that credit is given to IGU. This document contains strictly technical information to be distributed during the 27th World Gas Conference in Washington DC, USA, and has no commercial intent.
32
The project, coordinated by Enagás, involves 42 partner entities in Spain and Portugal: 8 state owned institutions, 13 port authorities and 21 industrial companies, such as LNG operators, shipbuilders, regasification companies and other partners. Its execution is planned to last until 2020 and will put forward a National Action Framework for the use of LNG as maritime fuel in Spain.
The aim of the project is to develop a safe and efficient, integrated logistics and supply chain for LNG in the transport industry, particularly for the maritime transport around the Iberian Peninsula and the implementation of the Clean Transport Directive.
With 8 regasification plants, the Iberian Peninsula is geostrategically positioned and possesses a sound LNG logistics know-how, which is key to the consolidation of the region’s leadership in this field.
CASE STUDY 6.9: CNG Virtual Pipeline Example
Australia-Luxfer Gas Cylinders, Germany, was awarded (2014) a contract to supply bulk gas transportation modules to Sub 161, a Queensland-based company that will use 'road-trains' to truck CNG from Port Hedland to a power station that serves the large Solomon iron ore mine in the Pilbara region of Western Australia.
The Solomon mine and power station are operated by Fortescue Metals Group, which is converting the 125-megawatt station to run on natural gas. Fortescue will replace an estimated 300,000 liters of diesel used each day with 11 terajoules of natural gas.
The G-Pak system is designed for storage and transportation of gases at pressures up to 5000 psig (345 bar). At the heart of the system are Luxfer G-Stor™ Pro Type 3 (aluminum-lined) carbon composite cylinders fitted with high-flow valves and protected by a reliable glass-bulb-based pressure/thermal safety system.
CASE STUDY 6.10: LNG Supply to Remote High-Horsepower Applications
Prometheus Energy Group Inc. pioneered the US market for fully automated mobile LNG storage and regasification equipment for matching high‐HP customer requirements. They are a developer and marketer of LNG plant capacity through both owned/equity production and numerous market‐based supply relationships.
When the company started it established five LNG import facilities that supplied roughly 10% of total US natural gas consumption. It also built five micro-LNG Plants that supplied the Western US markets. The company also developed a niche LNG vehicle fuel market that consumed 180,000 gallons per day (681 374.121 liters/day) primarily in California, Arizona and Texas.
The availability of LNG led Prometheus to supply product for industrial LPG displacement, preventing interruptions during pipeline maintenance, pipeline pressure control and traditional peakshaving operations. The company has also developed a market for LNG as a fuel on drilling platforms replacing diesel fuel for boilers, gas dryers and stationary power units.
This publication is produced under the auspices of the International Gas Union (IGU) which holds the copywrite. The publication must not be reproduced in whole or in part without the written permission of the IGU. However, irrespective of the above, established journals or periodicals shall be permitted to reproduce this publication, or part of it, abbreviated or edited form, provided that credit is given to IGU. This document contains strictly technical information to be distributed during the 27th World Gas Conference in Washington DC, USA, and has no commercial intent.
33
Prometheus attributes its success to being flexible:
• Ability to adjust to market needs;
• Ability to manage through volatility;
• Know‐how for matching design to application;
• Ability to balance a national LNG supply portfolio.
CASE STUDY 6.11: GRDF marketing
The GRDF program to promote the development of gas usage in France focuses on:
• Strong client policy: Multi-channel customer receptiveness; CRM quality, efficient Call Centers to speak directly with customers; offering customers new uses or services; employees as being the first promoters of the customer relationship;
• Strong marketing policy: Providing natural gas price comparisons to other energies; addressing Client and Prospects Portfolio (industry/tertiary/building contractors); developing a positive image of natural gas and promoting key advantages of natural gas; developing new gas uses, such as mobility (CNE / bio-CNG) or end-use (heat-pumps, micro-turbines, residential A/C, etc.); and communicating with the preliminary decision makers (engineering and design offices, architects, building contractors);
• Strong long-term commitment toward the injection of green gases into the grid (biomethane, hydrogen and methane produced through gas2power, etc.); GRDF advocates for the achievement of 30% of green gases within the grid by 2030.
• Strong gas-balance management: Ensuring metering and quality of metering (1-customer/1-meter calibration; ensuring/measuring quality of gas (calorific value and pressure); ensuring quality of client database, addressing recovery, mechanics of payment, arrears, non-technical losses;
• Easily connecting customers to gas networks.
CASE STUDY 6.12: Portuguese virtual pipeline to Maderia Island
GasLink is the Portuguese virtual pipeline project to Madeira Island. LNG is shipped from the Sines LNG Terminal on the Portugal mainland, and transported through the Port of Lisbon to Madeira Island covering more than 950 km (590 miles) by sea. The regasified LNG fuels the island power station. LNG is loaded into ISO units at the LNG import terminal in Sines, transported over-the-road to the port. The containers are then transferred to a vessel for the trip to Madeira Island. It is offloaded into an LNG tank farm and regasified on demand.
Given the complexity of such operation, using a dedicated LNG satellite plant and a fleet of 55 LNG ISO containers, customization has been implemented by specific standard operating procedures developed by Grupo Sousa/Gáslink, addressing all key areas of intervention: organizational, administrative, safety, security, maintenance and operations. Extensive on-the-job training,

This publication is produced under the auspices of the International Gas Union (IGU) which holds the copywrite. The publication must not be reproduced in whole or in part without the written permission of the IGU. However, irrespective of the above, established journals or periodicals shall be permitted to reproduce this publication, or part of it, abbreviated or edited form, provided that credit is given to IGU. This document contains strictly technical information to be distributed during the 27th World Gas Conference in Washington DC, USA, and has no commercial intent.
34
industry’s best standards and practices, and continuous improvement methodologies are in place with a track record of over 4.300 operations without incidents or accidents.

This publication is produced under the auspices of the International Gas Union (IGU) which holds the copywrite. The publication must not be reproduced in whole or in part without the written permission of the IGU. However, irrespective of the above, established journals or periodicals shall be permitted to reproduce this publication, or part of it, abbreviated or edited form, provided that credit is given to IGU. This document contains strictly technical information to be distributed during the 27th World Gas Conference in Washington DC, USA, and has no commercial intent.
35
CASE STUDY 6.13: Virtual pipelines to final customers and small networks through LNG
In Europe there is a significant increase in the number of individual industrial users that are switching from LPG or oil products to natural gas. That is the case with users located far away from pipelines that are upgrading their storage/usage plants to begin receiving LNG through road tanker deliveries. In comparison with LPG, LNG reduces by a factor of 2 the total number of road trips to supply the same quantity of energy to each plant. In some cases, it is the LPG companies suggesting their customers make the conversion.
This trend does not only touch end users, but also local distribution networks. Remote villages, where single users receive individual supplies of LPG or the DSO is currently feeding the local network with LPG, have the chance to be easily converted to natural gas distribution. That has multiple advantages – while on the one hand it reduces vehicle traffic that brings the fuel to the end users, it gives further benefits in terms of lower emissions and ease/convenience of use for the local community-
With reference to the LNG-fed local networks in Italy, the Ministry of Economic Development issued a document that enables the creation of distribution systems regardless of the new rules for gas concessions. This decision would encourage operators to bring gas to around 1000 local communities throughout the country. Those villages are currently either supplied with LNG or do not have distribution systems at all. Reduction of emissions and savings for users from this transition will be significant and users benefiting from it are expected to get to know the “new” fuel and spread positive opinions about it.
The very first village interested in this new way of delivering gas is Molveno. The LDC Dolomiti LNG has other projects developing networks in such style, as well as many other utility companies.
CASE STUDY 6.14: Indonesia’s potential for small scale LNG
Indonesia is pressing ahead with the creation of a network of small-scale LNG import projects, with a second floating regasification vessel to be delivered in Q2 2018.
Indonesia is expanding its small-scale LNG import infrastructure with a second project, but the complexity of the network it is building could result in slow progress.

This publication is produced under the auspices of the International Gas Union (IGU) which holds the copywrite. The publication must not be reproduced in whole or in part without the written permission of the IGU. However, irrespective of the above, established journals or periodicals shall be permitted to reproduce this publication, or part of it, abbreviated or edited form, provided that credit is given to IGU. This document contains strictly technical information to be distributed during the 27th World Gas Conference in Washington DC, USA, and has no commercial intent.
36
BP plc’s Tangguh LNG in Indonesia third train could supply LNG domestically once it starts up (Figure 6.7).
Figure 6.7: BP’s Tangguh LNG in Indonesia
Jaya Samudra Karunia (JSK) Shipping changed its order with South Korean Gas Entec from an FSU to an FSRU in January (2017). The FSU was supposed to support the FRU in place in Benoa (Bali), but the added regasification facilities replaced the FRU, which then is free to be deployed elsewhere in Indonesia.
CASE STUDY 6.15: India’s small-scale LNG plan for inland waterways
India is pressing ahead with its plans to invest in inland storage and distribution of LNG, with an initial focus on the stretch of the Ganges between Varanasi and Kolkata National called Waterway One.
According to India’s Economic Times, the Inland Waterways Authority of India (IWAI) is planning to supply LNG bunkers from Sahibganj and Gazipur, to promote take-up of LNG fuel for craft that sail the Ganges.
IWAI has met industry leaders to present its plan, seeking to encourage a shift away from diesel. Participants included GAIL India, Petronet, Bharat Petroleum, Hindustan Petroleum, Indian Oil, Oil & Natural Gas Corp (ONGC), Venerable LNG, and Indonesian state-owned power firm Perusahaan Listrik Negara (PLN).
Venerable LNG plans to set up multiple LNG hubs along the Ganges, part of its Sahaj Ganga project to create an LNG distribution network for industry and for transport.
IWAI has hired Duisberg, Germany-based DST to design LNG-powered river barges. It plans to agree to a standard design for inland waterway barges and to procure 13 vessels.

This publication is produced under the auspices of the International Gas Union (IGU) which holds the copywrite. The publication must not be reproduced in whole or in part without the written permission of the IGU. However, irrespective of the above, established journals or periodicals shall be permitted to reproduce this publication, or part of it, abbreviated or edited form, provided that credit is given to IGU. This document contains strictly technical information to be distributed during the 27th World Gas Conference in Washington DC, USA, and has no commercial intent.
37
CASE STUDY 6.16: Russia’s small-scale LNG development program
Gazprom and the Austrian company OMV have teamed up on a small-scale LNG project. The parties intend to cooperate in a joint integrated project for a small-scale LNG production terminal in the area of the Russian Black Sea coast.
In addition to the small-scale LNG cooperation agreement, the two companies signed a memorandum of understanding outlining the principles of potential cooperation between Gazprom and OMV in coordinating activities for the development of the gas transmission infrastructure required for providing natural gas supplies to Central and Southeastern Europe.
Gazprom has also approved a development program for 2017-2019 that includes construction of natural gas filling stations and the production and use of small-scale LNG.
The program entails construction of new marketing infrastructure, fixed cryogenic filling facilities and mobile LNG filling stations.
In addition to small-scale LNG, Gazprom intends to focus on boosting use of natural gas in transport. In 2017, natural gas-fueled vehicles accounts for 26% of the company’s fleet. However, Gazprom is planning to increase the share to 70% by the end of 2020.
In 1Q 2016 Gazprom signed a Framework Agreement with Fluxys on small-scale LNG cooperation in the European market. The Agreement reflects the intention of the parties to collaborate on joint projects for the construction and operation of LNG receiving terminals, LNG filling stations and LNG bunkering infrastructure in Europe.
CASE STUDY 6.17: Serbian experience with CNG for remote supply
In analyzing CNG delivery in period 2013-2017 there was small, but constant increasing consumption. The 2013-16 period saw a 23% in consumption, and the 2013-17 period is expected to be higher.
In this period CNG was delivered predominantly to industrial customers in areas where pipeline delivery is not possible.
Small volumes were delivered as the vehicle fuel. Unfortunately, even this energy activity requires licensing from AERS (national energy regulator). Exact data is not available (in AERS annual report for 2016. page 83 is said: “… exact data is not existing”.
In the last few years the intention has been to expand CNG as vehicle fuel at new locations. The Serbian oil and gas producing company Naftna Industrija Srbije a.d. (mainly owned by Gazprom) is starting to use natural gas in small, combined process plants for production of electricity and heat in areas where gas pipelines are not present. NIS has 14 locations with total production of electricity of 14 MWh/day.
Delivery of CNG is from two main wholesale suppliers NIS and JP Srbijagas to suppliers that deliver CNG to the final costumer, in last five years the trend is as follows:

This publication is produced under the auspices of the International Gas Union (IGU) which holds the copywrite. The publication must not be reproduced in whole or in part without the written permission of the IGU. However, irrespective of the above, established journals or periodicals shall be permitted to reproduce this publication, or part of it, abbreviated or edited form, provided that credit is given to IGU. This document contains strictly technical information to be distributed during the 27th World Gas Conference in Washington DC, USA, and has no commercial intent.
38
2013. m3/year 2014. m3/year 2015. m3/year 2016. m3/year 2017. m3/year *
29,748,000 31,787,000 31,205,000 36,674,000 35,187,000
*period January/September 2017.
Comparing this delivery to the whole natural gas market in Serbia, this volume is approximately 1.5 to 2% of total annual consumption.
In year 2013. Only three companies were dealing with CNG delivery, while this number has increased in 2017 with three new ones. This information is based on available data, but the total number could be higher if those delivering gas only as vehicle fuel are taken into account.
CASE STUDY 6.18: Small scale LNG based power generation in the Philippines
AG&P (Atlantic, Gulf and Pacific Company) announced the introduction of its small-scale LNG solutions to bridge the capacity demands for power in Southeast Asia. The Philippines provides a unique challenge for the distribution of energy to 100 million people living across 7,000 islands.
Figure 6.8: Small scale LNG based power generation in the Philippines
Traditional power delivery models are often too bulky to be viable to meet relatively smaller-scale energy requirements. Small-scale LNG solutions, including floating storage, regasification and power, provide power plants tailored to the archipelago, from even 5MW all the way up to traditionally-

This publication is produced under the auspices of the International Gas Union (IGU) which holds the copywrite. The publication must not be reproduced in whole or in part without the written permission of the IGU. However, irrespective of the above, established journals or periodicals shall be permitted to reproduce this publication, or part of it, abbreviated or edited form, provided that credit is given to IGU. This document contains strictly technical information to be distributed during the 27th World Gas Conference in Washington DC, USA, and has no commercial intent.
39
sized plants. More importantly, small-scale LNG provides a clean solution without the soot and contaminants of old coal. With the recent decrease in the cost of LNG, such technology is now not only viable, but also strongly commercial.
Philippines is regarded as having the potential to be a trailblazer in delivering innovative small-scale LNG solutions that will make power more accessible and affordable. AG&P is poised to transform the way energy is being delivered in the Philippines and Southeast Asia with the introduction of the virtual LNG pipeline, comprising a network of smaller-scale economical delivery systems such as vessels, regasification terminals and smaller power plants with faster delivery times.
6.5. Infrastructure Development (Construction Practices)
Once new customers are attracted to natural gas it becomes the responsibility of the DSO to attach and maintain these customers. There are two primary areas in which new customers are located. These are 1) developed and 2) undeveloped areas.
Developed areas have established streets, sidewalks and structures. Structures can be single-family house, multifamily dwellings, large and/or small commercial and in some instances industrial end users. These areas will more than likely already have mains in the streets. Customer attachments will involve the installation of service pipe from the main to the customer meter.
Undeveloped areas may have streets and sidewalks, but most often will not. If in the case of new housing developments final landscaping will also not have been done when mains and service stubs are installed. Rural areas fall within this category. There will almost always be a requirement for an extension of the pipeline grid to provide service to the area. In the case of undeveloped areas new large commercial, industrial or power generation facilities may also be present without residential development.
Depending on DSO practice, either company crews or contractors are used for installation of mains and services for new (or replacement) activities.
Undeveloped area new construction practices
For undeveloped areas without established infrastructure the most common method of installing mains and services is open trenching (i.e., direct burial) of the pipe. In the US direct burial of mains account for 90% of the pipe installed. Other methods include common trench installations (25%), pneumatic boring and plowing-in.
Trenches are commonly dug using backhoe excavators of various types or trenching machines.
Plastic or steel pipes are used depending on pressure requirements. If plastic, the pipe is usually in coils of up to 450 meters (1500 ft). In some cases, plastic pipe will be installed in 10-meter (40 ft) sections. Steel pipe is installed in 10 meter (40 ft) welded sections.
Services, which are usually of smaller diameter pipe than mains in new construction, are either installed in open trenches or plowed-in.

This publication is produced under the auspices of the International Gas Union (IGU) which holds the copywrite. The publication must not be reproduced in whole or in part without the written permission of the IGU. However, irrespective of the above, established journals or periodicals shall be permitted to reproduce this publication, or part of it, abbreviated or edited form, provided that credit is given to IGU. This document contains strictly technical information to be distributed during the 27th World Gas Conference in Washington DC, USA, and has no commercial intent.
40
Developed area construction practices
Developed areas where there are established paved streets, sidewalks (in some cases) and final landscaping open trenching plays a smaller role. Direct burial in developed areas in the US account for 30% and up of new construction. Horizontal directional drilling (HDD) is becoming more popular, but still only accounts for 10%+ of new main installations.
Services are more often installed with either HDD or pneumatic boring tools; or are plowed-in, pulled-in or installed with pipe-splitting methods.
Breaking street pavement and/or boring under sidewalks and driveways may also be required. This will depend on the location of utility easement: street or parkway between the curb and sidewalk.
General considerations in new construction
There are other considerations in new construction for either developed or undeveloped areas. These considerations include the type of backfill used (native spoil, clean fill and/or sand padding), compactions of the backfill, pavement and landscape restoration, and job site cleanup.
Reducing the cost of customer attachments
Several new technologies and techniques are being introduced to reduce the cost of connecting new customers. These strategies generally rely on increasing the efficiency of the installation activity. This is fundamental since little is being done to reduce the cost of the materials being used.
Innovation in installation practices include keyhole operations, HDD, pipe splitting, narrow trenches and reduced diameter of the pipe itself by increasing the operating pressure.
Uses of Green Technologies in Gas Operations
Little effort has been made by most DSOs in adapting some of its operating infrastructure to the use of green technologies. This would involve the use of wind, solar photovoltaic and thermal; and other technologies, such as vortex heating/cooling and pressure reduction turbines for power generation.
Table 6.3 shows some potential applications for adapting renewable technologies in gas operations.

This publication is produced under the auspices of the International Gas Union (IGU) which holds the copywrite. The publication must not be reproduced in whole or in part without the written permission of the IGU. However, irrespective of the above, established journals or periodicals shall be permitted to reproduce this publication, or part of it, abbreviated or edited form, provided that credit is given to IGU. This document contains strictly technical information to be distributed during the 27th World Gas Conference in Washington DC, USA, and has no commercial intent.
41
Table 6.3: Natural Gas Operations Potential Renewable Energy Source Applications
Natural Gas Operations Potential Renewable Energy Source Applications
Solar PV Wind turbine Battery Vortex Tech Flow Turbine
Pressure
Reduction
Turbine
Micro-turbine
expander Hybrid Waste energy
Instrumentation √ √ √ √ √ √
Reheat √ √
Communications √ √ √ √ √ √
Lighting √ √ √ √ √ √
Instrumentation √ √ √ √ √ √
Lighting √ √ √ √ √ √
Communications √ √ √ √ √ √
Instrumentation √ √ √ √ √ √
Lighting √ √ √ √ √ √
Communications √ √ √ √ √ √
Power Generation √ √ √
Air compressor √ √
Safety/work lights √ √ √
Excavators √ √
√ √ √ √
√ √
√
Remote Sensors
APPLICATION / SOURCE
Mobile Safety Signage
Regulator stations:
Meter stations:
Compressor stations:
Crew trucks:

This publication is produced under the auspices of the International Gas Union (IGU) which holds the copywrite. The publication must not be reproduced in whole or in part without the written permission of the IGU. However, irrespective of the above, established journals or periodicals shall be permitted to reproduce this publication, or part of it, abbreviated or edited form, provided that credit is given to IGU. This document contains strictly technical information to be distributed during the 27th World Gas Conference in Washington DC, USA, and has no commercial intent.
42
As examples of the industry’s efforts to develop new, more efficient and less expensive technology for installing new infrastructure there are a couple of case studies:
CASE STUDY 6.19: Innovation in trenching techniques at Gas Natural Fenosa
Gas Natural Fenosa field tested their innovative trenching technique in 2012. The concept is to reduce the trench depth and width.
Conventional trenches are 2.5 ft (80cm) deep and 16 inches (40cm) wide. The new trench would be 1.5 ft (50cm) deep and 4-6 inches (10-15cm) wide. Both concepts would accommodate a PE (DN63) pipe. By changing the width and depth of their trenches Gas Natural Fenosa estimates it can reduce its cost by 60%.
Trench dimension vary at the size of the pipe installed increase from DN63 to DN200. Widths go from 6 to 12 inches (15cm to 30cm) and depths from 24-26 inches (60-65cm) to 30-32 inches (75-80cm) (Figure 6.9)
Figure 6.9: Gas Natural Fenosa trenching technique
The equipment used includes a backhoe with trenching disk, and a suction truck for removal of spoil. After the pipe is installed the trench backfilled with a flowable fill (i.e., low resistance mortar). The specifications of the flowable fill is it is self-compacting, self-leveling and easily excavated (compressive strength of RC28 = 2-3 MPa).
The field test determined the advantages were the trench could be constructed at an increased rate, quality of the trench was excellent in any soil type, and cleaning of the site was minimal. Drawbacks included the equipment could not operate in narrow streets without closing the road to traffic, the vacuum truck needs emptying approximately every 30 minutes requiring work to be stopped, where the soil contains stones and is low density the trench collapses, and the cost of the suction equipment requires a high production rate.

This publication is produced under the auspices of the International Gas Union (IGU) which holds the copywrite. The publication must not be reproduced in whole or in part without the written permission of the IGU. However, irrespective of the above, established journals or periodicals shall be permitted to reproduce this publication, or part of it, abbreviated or edited form, provided that credit is given to IGU. This document contains strictly technical information to be distributed during the 27th World Gas Conference in Washington DC, USA, and has no commercial intent.
43
Following the field test Gas Natural Fenosa changed the trench dimensions to a depth of (80cm) and a width of 10 inches (25cm). The company also elected to use a skid steer with a trenching wheel instead of the larger equipment. Furthermore, instead of using 100% flowable fill for backfilling they elected to reuse the selected spoil to pad the pipe and the remainder of the spoil to fill 8 inches (20cm) of the trench. The top 6-8 inches (15-20cm) of the trench and paving used a pigmented expansive concrete.
CASE STUDY 6.20: Use of keyhole technology
Keyhole technology has been used for decades. The concept is to open a smaller size excavation of less than 1m square or round from which work is done from ground level with long-handled tools. Improvements in tools extending their versatility in recent years have greatly improved the attractiveness of keyhole repairs and installation of mains and services. The is particularly true when activity takes place in pavement. Another innovation for opening keyholes has been improvements in coring technology. Utilicor Technologies Inc. have truck and trailer mounted coring units. These machines cut up to 24-inch (610mm) diameter cores through all kinds of pavement up to 22 inches (559mm) thick with an integral central pilot bit the bit simultaneously cuts a pilot hole to simplify extraction and reinstatement of the core. A core hoist with a 500-lb (230 kg) capacity is optional for removing the core e. If larger diameter excavations are needed overlapping cores are used.
Once the core is removed the most common method of excavating is to use vacuum excavation machines. They are most often wetvac system, but dryvac systems are also used (Figure 6.10).
Figure 6.10: Coring operation for pavement removal - Courtesy Utilcore Corp. The US Federal Highway Administration (FHWA) Turner-Fairbanks Highway Research Center commissioned a study in August 2014 into the best practices for making and restoring utility cuts in pavement for release in early 2016. Keyhole coring and reinstatement was a featured technology to be “Recommended as a Best Practice.”
In April 2016: the FHWA Report identified keyhole coring as a Best Practice that can minimize impact of utility cuts on both highway infrastructure and the traveling public. The FHWA recommendation was coring and reinstatement process should be employed by roadway agencies and utility companies.

This publication is produced under the auspices of the International Gas Union (IGU) which holds the copywrite. The publication must not be reproduced in whole or in part without the written permission of the IGU. However, irrespective of the above, established journals or periodicals shall be permitted to reproduce this publication, or part of it, abbreviated or edited form, provided that credit is given to IGU. This document contains strictly technical information to be distributed during the 27th World Gas Conference in Washington DC, USA, and has no commercial intent.
44
Implementation consisted of circulating the report, a Tech Brief and the recommendations
to:
• 50 State DOTs;
• 384 Metropolitan Planning Organizations, and
• 20,000 County and Municipal Roads departments
The FHWA sponsors webinars and regional demonstrations to encourage awareness and implementation under the Technology & Innovation Deployment Program.
CASE STUDY 6.21: Innovation trenchless construction of services
Tracto-Technik GmbH & Co. KG and TT Technologies Grundig have developed a keyhole boring machine for short bores suitable for installing service lines. The new machine is called the Grundopit Keyhole.
The machine is designed to be inserted into a keyhole of approximately 24-in (60 cm) diameter to a depth of 2 to 5 ft (0.6 to 1.5 m). The boring operation is done with a series of drill rods each approximately 10 inches (230 mm) long. The rods are a maximum of approximately 2.5 inches (63 mm) in diameter. These are “loaded” by the field tech one at a time and connect at the bottom of the machine through a patented system. The total length of the bore can be up to 65 feet (20 m). The machine is reversed after the back reamer with the pulling head is attached to pull the service line back to the main. The pulling head in brought back into the machine where the PE pipe is cut off with a special tool operated from the surface. All the boring operation is done above ground.
Drilling speed is approximately 50 ft/h (15 m/h) and the bore is steerable. A sonde can be added to the borehead before the machine is lowered into the ground to allow it to be located. According to TT Group the set-up time is less than 30 min.
CASE STUDY 22: Use of green technologies in gas operations
The Czech distribution company, RWE GasNet has introduced several “green” technologies at its Island Gas Regulator Station near Prague (Figure 6.11). The unique feature of this regulator station is that it is equipped with technologies for generating and storing electricity allowing the facility to operate off-grid, plus a technology for reheating the downstream gas supply that requires no input energy.

This publication is produced under the auspices of the International Gas Union (IGU) which holds the copywrite. The publication must not be reproduced in whole or in part without the written permission of the IGU. However, irrespective of the above, established journals or periodicals shall be permitted to reproduce this publication, or part of it, abbreviated or edited form, provided that credit is given to IGU. This document contains strictly technical information to be distributed during the 27th World Gas Conference in Washington DC, USA, and has no commercial intent.
45
Figure 6.11: Island Gas Regulator Station Illustration
The principal technologies for achieving grid independence used are:
• Vortex tube as a replacement of the traditional preheating method;
• Replacement of electric grid connection with an independent electricity generation and supply system using:
- Photovoltaic panels;
- Wind turbine;
- Electricity generator using the gas stream energy (GASEN).
• Battery set;
• Control electronics.
6.6. Technology Challenges
6.6.1 End-user focus
In expanding the market for natural gas there are two areas that promote customer utilization:
a) New and innovative end-use technologies; and b) New less expense materials, techniques or equipment for installing mains and
services.
For example, interactive “smart” end-use technologies with NEST®-type thermostats, e.g., small-scale A/C, in-house piping with plug-in capability, fuel cells, combination “CHP” appliance, etc. are all technologies that are being worked on, but need to find the appropriate price point to enter the market place.
Also the growth of new materials for the construction of internal gas networks is important to achieve three dimensions that will improve natural gas attractiveness: i.e., easy, quick, cheap and safe:

This publication is produced under the auspices of the International Gas Union (IGU) which holds the copywrite. The publication must not be reproduced in whole or in part without the written permission of the IGU. However, irrespective of the above, established journals or periodicals shall be permitted to reproduce this publication, or part of it, abbreviated or edited form, provided that credit is given to IGU. This document contains strictly technical information to be distributed during the 27th World Gas Conference in Washington DC, USA, and has no commercial intent.
46
• Easy to promote the universality of skills to work on natural gas installations that today are limited to master specific techniques such as welding;
• Quick helping to reduce labor costs associated with each new installation;
• Cheap improving competitiveness of natural gas solutions vs other energy solutions;
• Safe because it is the basis of our business and the trust that we need to establish with customers.
Multilayer indoor pipes and indoor flex pipes can represent such examples.
As for gas appliances, there is room to improve the mix of the following ingredients: smart, efficient and desirable. A smart, connected intelligence that allows palm of the hand control to command and monitor the operation of the equipment, thus promoting an efficient use of energy with superior levels of comfort and performance. Desirable for the design and proper promotion of its attributes, bringing the evolution of the equipment from an old-fashioned and merely utilitarian framework to a new and fully modern equipment in which the attributes bring together rationale and emotion.
When working with gas and although wanting the solutions to be easy, fast, cheap, intelligent, efficient and desirable, it cannot be forgotten that safety always has to be in the forefront.
Infrastructure safety, but also Consumer usage safety, namely by the availability and proper offer of intelligent security systems, such as methane, carbon monoxide and smoke detectors with integrated communication systems and controls.
Many of these technologies require not only customer acceptance, but the approval of regulatory agencies; local building codes in particular play an important role. It might take regulatory reform that allows DSOs to more readily innovate before these technologies can develop. An example of this is the introduction in Spain of multilayer indoor pipes. The potential here is to reduce the cost of installing indoor gas piping systems.
Recently in the Japanese market, dwellings have been piped to allow a gas outlet similar to an electric outlet. By putting a plug into the gas outlet gas is supplied to appliances. Taking the appliance plug from gas outlet automatically shuts off the gas without turning a knob. Appliances can then be moved from place-to-place or even room to room where a gas outlet is available. It is this type of system that can increase convenience for the customer.
The development of communications new technologies that use LPWA (Low Powered Wide Range) brings a world of possibilities regarding the place where smart meters can be installed, because of the higher ability to communicate, even if installed in places underground.
These devices also provide longer battery life, since they are usually sleeping, using low power only they wake up to communicate specific and defined events.
Another example is by 2020 all British Gas customers will be able to claim smart meters, which will be installed for free by a specially trained Smart Energy Expert. This is part of a government-led national upgrade scheme to improve energy efficiency in Great Britain.

This publication is produced under the auspices of the International Gas Union (IGU) which holds the copywrite. The publication must not be reproduced in whole or in part without the written permission of the IGU. However, irrespective of the above, established journals or periodicals shall be permitted to reproduce this publication, or part of it, abbreviated or edited form, provided that credit is given to IGU. This document contains strictly technical information to be distributed during the 27th World Gas Conference in Washington DC, USA, and has no commercial intent.
47
Their customers will have the capability to:
• Track energy use by day, week, month and year;
• Compare surrounding homes;
• Get tips on how to save energy and money;
• Determine how much is spent on energy, for things like cooking the Sunday roast.
CASE STUDY 23: Smart meter installation in Italy
Italy has been one of the very first countries worldwide to go through a process of gas meter upgrade, from mechanical types to an electronic, remotely-readable smart type. The transition was ordered through resolution 155/2008 (updated by 631/2013) from the AEEGSI (national regulator for energy and gas) and it’s involving all the metering units in the field (around 20 million units).
At the time of this review (October 2017), the deadlines to which the DSOs must comply with are as follows:
• By the end of 2017: 30% of all G/4 and G/6 class meters must be replaced with new smart-type;
• By the end of 2018: 50% of all G/4 and G/6 class meters must be replaced with new smart-type;
• By the end of 2018: 100% of all greater than G/6 class meters must be new smart-type;
• By the end of 2018 all the smart meter installed can be shut off from remote.
This project will roughly involve 10 million final customers.
In Italy the potential benefits of smart metering in gas are well understood. The next step could be to push for a time-of-day gas rate that changes in relation with the hours of consumption. Final users would likely find it very appealing to keep using gas to run appliances and the network operator would also allow a more homogeneous supply of the gas overtime, ensuring more competitive prices to the users.
6.6.2 DSO Operations Focus
Identifying new technologies and their application in DSO operations is a challenging aspect of distribution system management. Decisions on what and how to implement new technologies include, how to employ drones, 3D printing, augmented reality, 3D design and as-builts, NDT of plastic fusion welds, low/medium-press (ANL) gas storage, low-energy Bluetooth sensors (IoT), pipeline integrity management apps/tools, technology transfer apps/tools, new training methods (e.g., game based learning).

This publication is produced under the auspices of the International Gas Union (IGU) which holds the copywrite. The publication must not be reproduced in whole or in part without the written permission of the IGU. However, irrespective of the above, established journals or periodicals shall be permitted to reproduce this publication, or part of it, abbreviated or edited form, provided that credit is given to IGU. This document contains strictly technical information to be distributed during the 27th World Gas Conference in Washington DC, USA, and has no commercial intent.
48
Figure 6.12: Handsfree “tablet” Courtesy RealWear
Advances in pipe materials that will allow high pressure plastic pipe, including PE composites, polyamide 11 and 12, PEEK/PEAK, etc. could be developed for minimizing the construction footprint and allowing innovative less expensive techniques for installing mains and services.
Asset management and tracking have increasingly been relying on geolocation technology. Expansion of the satellite constellations including US GPS, Galileo (European), BeiDou (Chinese), GLONASS (Russian) and NAVIC (Indian) have greatly increased the realtime accuracy of the system. This combined with reduction in hardware costs have contributed to this trend. Thus, paper maps have evolved into the GIS (graphical information systems) relied on today by many DSOs.
This reliance on GIS has resulted in apps that manage, interpret and post the information on these digital maps.
Computer applications for managing DSO data that allow linking and monitoring operations with asset management have helped to reduce costs and improve the safety of the systems. For example, there are suites of apps for natural gas distribution systems that include—
• Leak management. Minimize leakage by assessing leakage levels from individual pipes and overall system; identifying correct adjustment of supply pressure in order to minimize leakage; and analyses to reduce set pressures so that the pressure in pipes with highest leakage is preferentially reduced;
• Data management. Provide integration between modules of an app and company GIS data; allowing the importation of data from a variety of external sources;
• System design. Assess pipe size options for the model with specified location, loading conditions, cost of materials and installation; in order to calculate and report the lowest possible pipe diameter capable of transporting sufficient quantities of gas to required delivery points safely and reliably;

This publication is produced under the auspices of the International Gas Union (IGU) which holds the copywrite. The publication must not be reproduced in whole or in part without the written permission of the IGU. However, irrespective of the above, established journals or periodicals shall be permitted to reproduce this publication, or part of it, abbreviated or edited form, provided that credit is given to IGU. This document contains strictly technical information to be distributed during the 27th World Gas Conference in Washington DC, USA, and has no commercial intent.
49
• Facilities management. Synchronize the DSO network models with GIS updates without rebuilding the model and losing hydraulic data, allows a review of changes spatially, and to selectively accept or reject individual or groups of changes to merge into the model;
• Regulator station. Ensure the distribution system is adequately protected against unexpected overpressure conditions; supports monitoring and reporting on system safety equipment to ensure compliance with internal guidelines and external regulations;
• Customer management. Provide a link between the app and the DSO customer information system, and establishes a relationship between weather, individual customer load and customer location;
• Time-varying. Allow for the handling of a large volume of information a time-varying model needs to produce a series of consecutive steady-state analyses simulating changes in the distribution network over time;
• Unsteady-state flow modeling. Perform off-line unsteady flow condition analysis in natural gas networks;
• Load forecasting;
• Gas quality tracking;
• Contractor crew management.
Figure 6.13: Screen capture of GIS map
Proprietary integrity and risk management software tracks pipeline operations, documents risk, regulatory compliance, and give an overview of the integrity of pipelines and distribution network components.

This publication is produced under the auspices of the International Gas Union (IGU) which holds the copywrite. The publication must not be reproduced in whole or in part without the written permission of the IGU. However, irrespective of the above, established journals or periodicals shall be permitted to reproduce this publication, or part of it, abbreviated or edited form, provided that credit is given to IGU. This document contains strictly technical information to be distributed during the 27th World Gas Conference in Washington DC, USA, and has no commercial intent.
50
The principal objective of risk management software is to reduce pipeline incidents related to corrosion and other operations issues. In some cases, a DSO maintains the system in house, and configures the app for its own conditions and risk tolerance level; other times the app with the DSO data is maintained by the consultancy. In either case, this enables the company to monitor realtime operations data.
Many apps are built on a GIS platform to provide a solution to leverage the geospatial and asset information. Integrity analyses include:
• Risk assessment;
• Threat identification;
• ILI data analysis;
• Corrosion management;
• Class location;
• High consequence area (HCA) identification;
• Medium consequence areas (MCAs).
Field work force management tools that eliminate much of the paper work from past practices has gained favor in the industry. For example, field techs are able to complete orders electronically while seeing their work on maps allowing them to optimize their routes. Dispatchers, schedulers and administrators can also visualize with the HTML5-based office app where field techs are located and manage field operations, including the individual techs, vehicles and orders.
Information can be stored either in the backoffice or in the cloud.
These types of apps also provide automatic vehicle location, meter reading and asset investment planning apps as part of their suite.
In the US, the regulatory requirement of asset integrity management (DIMP/TIMP) has resulted in the DSO gathering an abundance of data on all aspects of its operations. Apps for managing and interpreting Big Data and the expanding world of IIoT (Industrial Internet of Things).
Essentially these apps integrate high volumes of different types of data from numerous sources and use machine intelligence to spot patterns in it. This then allows DSOs to look for specific conditions and feed the apps with data from the company supervisory control and data acquisition system (SCADA), other systems, historical data, and data from outside sources. This allows operating companies to get actual or near realtime views of operations.
DSOs have increased the use of apps to keep track of when an operator "checks out" a tool, what the tool is being used for, and when the tool is returned. These types of apps have customizable solutions that completely automates check-in and check-out procedures. The system can keep track of tools at multiple locations allowing key equipment to be located and acquired with a simple search.

This publication is produced under the auspices of the International Gas Union (IGU) which holds the copywrite. The publication must not be reproduced in whole or in part without the written permission of the IGU. However, irrespective of the above, established journals or periodicals shall be permitted to reproduce this publication, or part of it, abbreviated or edited form, provided that credit is given to IGU. This document contains strictly technical information to be distributed during the 27th World Gas Conference in Washington DC, USA, and has no commercial intent.
51
These apps use RFIDs to provide the tracking data. The RFID system automatically captures information on each tagged asset and can associate the item to the person responsible as it moves in and out of storage. This gives asset managers realtime visibility into the location and status of equipment. The system also provides methods for reporting analyses of asset usage, such as automated audit trails and establishing the chain of custody for equipment and hand tools; to a tool-value level deemed appropriate.
Operating companies are also making use of the Software-as-a-Service (SaaS) apps. These SaaS apps are being used to initiate callouts and roster management for crews to respond to a gas leak or other emergency. The system automatically takes into account the availability and callout rules for every worker as it assembles a crew. These apps also help managers track a crew’s status during normal work hours to see who can take overtime in the event of an emergency. The “virtual board” allows supervisors to track crews by job classification, staging area, elapsed-time worked and status. Working shifts, rest time, emergency callouts and work exceptions appear as movable icons.
As an example of managing Big Data, the electric side of Pacific Gas & Electric Co. (US) built an app that enables it to see the distributed generation on its grid, including rooftop solar systems and combined heat and power systems. The company thus has the ability to tell when the systems are causing changes to the state of its grid that it needs to deal with.
Other apps designed for the electric industry can monitor multiple distribution-sensing applications, such as smart meters, transformers, fault circuit indicators and other grid assets, under one unified network. Such apps cover back country and remote locations where cellular is non-existent or unreliable, as well as dense tropical environments where natural obstructions pose interference challenges for most wireless technologies. By gathering data from all connected devices, a utility can use its back-end applications to monitor and analyze the data to improve, for example, network reliability, while reducing costs associated with installing additional infrastructure and performing routine maintenance on networks for different applications.
CASE STUDY 24: UK First Utility experience with analytics to stop customer churn
Beginning in 2016, First Utility in the UK, an online retailer of electricity, is using its data analytics platform, built on NoSQL from database provider DataStax. Their aim, as reported, is to win and maintain business by keeping customers satisfied with “an exceptional digital experience.” The value to the customer is providing a deeper insight into their consumption, to better manage their consumption.
To accomplish this the utility is digitizing the entire customer activity across the entire enterprise. First Utility is adding such capability as a mobile solution for customers that move and need to change details with the company. The utility will have from 50-60% of its customer data in the cloud. Plans are to use companies such as Salesforce and Amazon Web Services to manage this database.
First Utility realized early on to keep customers engaged that it had to use more advanced analytics than just half hourly consumption data. For this the company contracted with Opower to build a

This publication is produced under the auspices of the International Gas Union (IGU) which holds the copywrite. The publication must not be reproduced in whole or in part without the written permission of the IGU. However, irrespective of the above, established journals or periodicals shall be permitted to reproduce this publication, or part of it, abbreviated or edited form, provided that credit is given to IGU. This document contains strictly technical information to be distributed during the 27th World Gas Conference in Washington DC, USA, and has no commercial intent.
52
consumer energy analytics platform. This platform is still using smart meter data, but according to the company transforming the information into more interesting analyses.
Following the success of this initial activity, First Utility built its own analytics platform. Using DataStax to manage the cloud solution, it employed Cassandra technology for the Big Data analytics.
First Utility estimates customers can reduce energy consumption by 5% by employing the information now available to them.
Going forward the utility wants to create a more complex customer relationship on their digital platform. This, according to the company, will give customers multiple accounts and properties and relationships monitored around various product accounts.
CASE STUDY 25: Use of smartphone to record and send consumption information from customer to DSO
The Spanish DSO Gas Natural Fenosa began a project called YoLeoGas to improve the quality and efficiency of their meter reading activity. The project uses a photo of the meter taken by the customer and downloaded to the company website with the purpose of enhancing digitalization of the meter reading process.
Figure 6.14: A gas consumer takes a photo with the APP (reading + meter ID)
The consumer downloads the CUPS app and logs from the DSO website. Using the app on their smartphone the consumer takes a photo of the front face of the meter. The system “reads” the image with advanced OCR technology recognizing the reading and meter ID. This information is stored in the Commercial System and the photo filed in a data base. Any exceptions noted by the system is referred to the backoffice for manual verification.
In Algeria, DSO Algiers set up a "self-metering" project to improve the efficiency of its customer relations business, and to get closer to the customer by enabling them to communicate the meter index if absent during the meter reading cycle. The project uses a photo of the front of the meter taken by the customer that is downloaded at the company's website.
This publication is produced under the auspices of the International Gas Union (IGU) which holds the copywrite. The publication must not be reproduced in whole or in part without the written permission of the IGU. However, irrespective of the above, established journals or periodicals shall be permitted to reproduce this publication, or part of it, abbreviated or edited form, provided that credit is given to IGU. This document contains strictly technical information to be distributed during the 27th World Gas Conference in Washington DC, USA, and has no commercial intent.
53
On the company website the consumer updates items, such as "Surname, first name, address, customer reference". Once the items are entered and forwarded to the company through the website, this information is transferred to the commercial department, where the current consumption data is added to the customer’s record. Any exceptions noted by the system are referred to the backoffice for manual verification.
6.7. Threats and Opportunities
The journey to promote, develop and facilitate the entry of natural gas by distribution companies is not simple, it involves many complex simultaneous issues, which can represent both barriers and opportunities.
This section of the report does not aim at identifying all of them but presents cases that may help in the better understanding of the theme.
The list below (not necessarily in order of importance) gives an idea of the number and diversity of subjects that impact the development of natural gas distribution systems:
• The specific realities of the country or region;
• The level of industry maturity in the country or region;
• Legislation and regulation applicable in specific situations;
• The culture of natural gas use;
• Existing incentives and ease of entry of natural gas into markets;
• The availability of natural gas supplies;
• Competitive energy sources;
• The costs of the natural gas supply chain, especially those for the implementation, operation and maintenance of distribution;
• The current environmental issues;
• The available technological developments;
• The safety of distribution operations;
• Recruiting and maintaining talented DSO employees;
• Training competent DSO and contractor employees.
These issues affect the distribution industry in different ways and with variable intensity; and there is no single "recipe" for adopting applicable solutions.
The intelligent handling of the complexities of these issues is a challenge for the distribution industry, even in developed markets such as North America, Europe and Japan.
Although it is possible to identify macro trends of alternatives to addressing issues, the nature of the challenge changes on a case-by-case basis, therefore, each specific situation needs adequate evaluation.

This publication is produced under the auspices of the International Gas Union (IGU) which holds the copywrite. The publication must not be reproduced in whole or in part without the written permission of the IGU. However, irrespective of the above, established journals or periodicals shall be permitted to reproduce this publication, or part of it, abbreviated or edited form, provided that credit is given to IGU. This document contains strictly technical information to be distributed during the 27th World Gas Conference in Washington DC, USA, and has no commercial intent.
54
Opportunity may arise from a well-managed threat. The rational use of energy can be an example of this. At first, the rationalization of use causes a reduction of the average consumption per customer and consequently a decrease in the distributor’s sales.
However, when seeking for a global energy solution for the customer, this risk can become a natural gas strength. A fuel cell, for example, can reduce the total consumption of energy for the consumer and increase the volume of gas due to the displacement of the electrical energy supplied by the grid.
Add to this a good performance regarding emissions, it is clear that natural gas can have competitive advantages that are relevant when compared to other energy sources.
A challenging scenario can become a favorable one, additionally bringing greater consumer loyalty and an increase in the possibility of capturing end users that are not yet part of the customer base of a given DSO.
Regulation is the most important issue for DSOs. Natural gas distribution companies have always been subject to regulation by federal, state and local governments. Certainly, regulatory aspects can create positive or negative factors for the development of the gas distribution industry.
Consistently, regulation has the protection of costumers against possible abuses of DSOs as a fundamental principle. This is manifested by the search for reasonable prices, the increase of competition, the reduction of the monopolistic force of distribution, and the unbundling of activities, among others.
However, the effective application of regulation does not always guarantee the achievement of these objectives, depending on the way it is designed and how its agents conduct it.
Achieving a balance between the interests of clients and DSOs, including the proper remuneration of investments, is key to the success of the expansion of the universalization of gas distribution.
Once again, for the main objectives to be accomplished, it is essential that there is adequate management of regulatory issues.
An imbalance in this equation will most likely lead to the failure to meet the interests of consumers themselves and to weaken natural gas penetration possibilities.
There is a wide variety of issues addressed by regulation, as well as the impact of public policy relating to energy sources. The following are some of the themes that are essential for building an environment that favors the development of natural gas penetration; again, not necessarily in order of importance:
• Protect long-term investments;
• Improve the operating efficiency of the DSOs;
• Recognize operational costs;
• Promote the increase of energy efficiency;
• Define clear rules on infrastructure access;

This publication is produced under the auspices of the International Gas Union (IGU) which holds the copywrite. The publication must not be reproduced in whole or in part without the written permission of the IGU. However, irrespective of the above, established journals or periodicals shall be permitted to reproduce this publication, or part of it, abbreviated or edited form, provided that credit is given to IGU. This document contains strictly technical information to be distributed during the 27th World Gas Conference in Washington DC, USA, and has no commercial intent.
55
• Clarify how unbundling rules are applied;
• Establish a clear separation of the state functions and DSO functions;
• Protect the DSO´s activities from political meddling;
• Define how to serve vulnerable consumers;
• Managing cross-subsidies, when they exist;
• Promote diversification of gas suppliers;
• Strengthen the security of gas supply;
• Recognize and protect against cyber attacks;
• Maintain a safe and secure system downstream and upstream of the customer’s meter.
It is important to mention that no magic formula can adequately solve any situation. It is important to find intelligent ways to deal with these challenges.
Gas advocacy is another essential action to be performed by the DSOs, that many times do not feel empowered to play this role. This is probably because regulation is usually very intense and restrictive when establishing rigid performance limits for the DSOs.
It should also be recognized that the advocacy role has been neglected by many distribution companies.
It is key that all the entities in the gas chain play their role in gas advocacy, each in its own way and in its field, but it is essential that the DSOs understand that they also have an essential responsibility in this area.
One of the key elements of gas advocacy is to make the stakeholders in the gas and energy chain, including regulators, public authorities, opinion makers, the general public, existing customers, potential natural gas consumers, among others aware of the many benefits this energy source can bring.
The possibilities of gas advocacy are quite broad. The flexibility of natural gas, necessary for modern families’ life nowadays, is a good start.
It is an abundant and accessible fuel in most regions of the world, which allows a high efficiency in its direct use, reaching 92% of efficiency in some cases. The recent increase in the abundance of natural gas as a result of new technologies has driven down the cost of this commodity. This has added to the attractiveness of natural gas delivered by traditional pipelines, or LNG and CNG virtual pipelines.
The American Gas Association (AGA) provides some good examples of the global benefits obtained in the US, among them:
• Natural gas utility efficiency programs helped offset 9.4 million metric tons of carbon dioxide in 2015;

This publication is produced under the auspices of the International Gas Union (IGU) which holds the copywrite. The publication must not be reproduced in whole or in part without the written permission of the IGU. However, irrespective of the above, established journals or periodicals shall be permitted to reproduce this publication, or part of it, abbreviated or edited form, provided that credit is given to IGU. This document contains strictly technical information to be distributed during the 27th World Gas Conference in Washington DC, USA, and has no commercial intent.
56
• Utility funded gas efficiency programs helped customers reduce their typical annual gas usage by an average 18%, and save US$141 per residential customer in annual energy costs in 2015;
• US consumers who use natural gas for heating, cooking and clothes drying save an average of US$874 on energy bills each year compared to homeowners who use electricity.
A consistent performance of DSOs in this direction can bring important results for the development and penetration of natural gas. There are good examples of actions that gas distribution utilities have made in the world.
One of them also reported on the American Gas Association's website about a group of DSOs in the United States that serve about 50 communities and participated in the Georgetown University Energy Prize.
The transcript of these success stories is below, as reported by AGA:
“Cost-effective natural gas efficiency programs, which empower consumers to make smart energy choices, implement efficiency upgrades, and save energy and money throughout the year.
Natural gas and combination utilities have long-running energy efficiency programs. In 2013 they invested $1.14 Billion in 112 rate-payer funded natural gas efficiency programs, operating across 39 states.
These innovative, replicable, and scalable programs achieve significant energy and cost savings over the long term. In 2013 they helped customers save 151 trillion Btu of energy, which offset 7.9 million metric tons of CO2 emissions. Through these programs, participating residences saved an average $137 on their annual energy bills.
The range of utility-run programs includes:
• Energy education, online tools and energy usage dashboards
• Community engagement and consumer empowerment programs
• Low to no-cost weatherization services for low income customers
• Cash rebates for higher efficiency equipment and whole home/business upgrades
• Efficiency loans
• Partnerships with various stakeholders, including entities along the supply chain
• Training and certification, vetted contractor networks, and workforce development programs”

This publication is produced under the auspices of the International Gas Union (IGU) which holds the copywrite. The publication must not be reproduced in whole or in part without the written permission of the IGU. However, irrespective of the above, established journals or periodicals shall be permitted to reproduce this publication, or part of it, abbreviated or edited form, provided that credit is given to IGU. This document contains strictly technical information to be distributed during the 27th World Gas Conference in Washington DC, USA, and has no commercial intent.
57
Gas advocacy can also explore other areas, such as environmental issues. There are many discussions on the impacts of fossil fuels, but clearly, natural gas is an excellent alternative to reducing emissions; other than in some places perhaps where the development of biomethane injection to the grid is undertaken that potentially opens the road for an even better picture relative to CO2 emissions.
In this field, all agents of the gas industry must expend a great effort to clarify and demystify unfounded or misplaced concerns about natural gas emissions.
There are important issues that should be considered. One of them is the need of energy access for disadvantaged populations in poor and developing countries.
Millions of people should not be left without the basics in terms of energy, electricity or cooking, because of a debatable need to reduce the carbon footprint when it comes to natural gas. What costs the most in social terms?
Natural gas has an extraordinary possibility of attending those populations and their energy needs.
It should also be considered that the generation of pollutants from fossil fuels depends on several factors, including:
• Installations where feedstocks or fuels are consumed whether industrial, commercial or residential
• The scale of combustion, as well as the technologies involved with the processes of combustion
• The amount of sulfur present in the fuel
• Emission controls existing in the combustion processes
From the point of view of the greenhouse gas emissions, for example air pollution caused by local emissions, natural gas is much more efficient when compared to wood, coal and fuel oils.
In growing the market for natural gas, the replacement of diesel in public transport brings important benefits to cities. There are several examples where air quality improves significantly with the use of natural gas: New York, Beijing among others.

This publication is produced under the auspices of the International Gas Union (IGU) which holds the copywrite. The publication must not be reproduced in whole or in part without the written permission of the IGU. However, irrespective of the above, established journals or periodicals shall be permitted to reproduce this publication, or part of it, abbreviated or edited form, provided that credit is given to IGU. This document contains strictly technical information to be distributed during the 27th World Gas Conference in Washington DC, USA, and has no commercial intent.
58
Another case of great success is LNG bunker fuel to address international movement to reduce sulfur content in marine fuels. It can reduce NOx emissions by up to 90% and SOx and PM emissions by up to 100%. LNG is clearly a cleaner alternative propulsion fuel and many ports around the world are gearing up to have this alternative to supply ships.
Figure 6.14: CMA CGM proposed LNG-fuelled container ship
The development of technology is a key element to support the penetration of natural gas. Expanding end-use opportunities, offsetting efficiency, fuel switching, renewables, economic climate with for example small-scale air conditioning, hit pumps, micro-grids with fuel cells, micro turbines, transportation fuels and end user appliance development.
DSOs cannot "do it all by themselves". It is necessary to develop strategic partnerships with suppliers of products and services, equipment manufacturers and technology centers for energy and gas, stablishing a network among key stakeholders. New products and services are opportunities that must be continually explored.
Equally important is the effort to reduce costs and increase efficiency in the deployment of distribution infrastructure. This can help to make new projects possible, allowing taking the gas to locations where it is not yet present. In addition, it can also allow the reduction of environmental impacts and for the people of the communities where the networks are being built.
Innovation should occur not only in the technical issues of gas distribution, such as pipes, pressure reduction stations, or meters. It needs to be present in all activities developed by the DSOs, from marketing initiatives, knowledge of clients' habits and needs, market segmentation, use of the big data, and include governance issues.
Digitalization is a non-return process in the business world, particularly for those who manage tens of thousands to millions of customers.
Distribution has many opportunities; the industry must keep up to date in the service for its clients, in the ways of communicating with them, in addition to the continuous increase of the security of its operations.

This publication is produced under the auspices of the International Gas Union (IGU) which holds the copywrite. The publication must not be reproduced in whole or in part without the written permission of the IGU. However, irrespective of the above, established journals or periodicals shall be permitted to reproduce this publication, or part of it, abbreviated or edited form, provided that credit is given to IGU. This document contains strictly technical information to be distributed during the 27th World Gas Conference in Washington DC, USA, and has no commercial intent.
59
Finally, we should emphasize that DSOs are responsible to identify and exploit, as much as possible, a menu of alternatives aimed at the growth and penetration of natural gas.
As already mentioned throughout this report this is not a simple journey, but it is the responsibility of these companies to understand the vital role of the creation and development of the gas market and its support over time.
6.8. Conclusions
The current abundance and long-term optimistic outlook for natural gas supplies has made this energy source very accessible and economic. The economy of natural gas combined with its relatively benign environmental affects and flexibility as a fuel and feedstock has made it the fuel of choice in most of the world.
In many places around the world, however, public energy policy and the negative opinion promoted by environmental groups against all fossil fuels has stymied the expansion of pipeline systems. This has occurred even in places where, for the most part, natural gas is viewed positively. Incidents involving pipeline failures and residential home explosions have sometimes added to the negative press of natural gas.
An aging infrastructure combined with negligence of third-parties make it difficult to maintain an image of safety in an environment in which the industry is closely scrutinized. Upgrading the network, as well as expanding it takes place in both developed and undeveloped areas. Each offers its own challenges that are being met with new technologies and practices.
Innovative customer attachment policies and “outside the box” thinking on financing new customer connections are necessary to provide service to as wide a range of customers as possible.
Cooperative efforts around the world between DSOs, government agencies, manufacturers, service providers, university and independent research organizations are helping to meet these challenges. Still, in many countries the availability of capital is an impediment for expanding and maintaining the natural gas infrastructure.
Helping to counter negative perceptions are the interactions of the various stakeholders. Government oversight, particularly in the US, has formalized more than ever before maintenance and monitoring of the pipeline grid. This added incentive has provided the opportunity of service companies and manufacturers to promote and DSOs to implement new technologies and computer applications. These innovations have made the operation and construction of natural gas networks easier, safer and less expensive. Community friendly tech for construction and maintenance should be an objective of the industry.

This publication is produced under the auspices of the International Gas Union (IGU) which holds the copywrite. The publication must not be reproduced in whole or in part without the written permission of the IGU. However, irrespective of the above, established journals or periodicals shall be permitted to reproduce this publication, or part of it, abbreviated or edited form, provided that credit is given to IGU. This document contains strictly technical information to be distributed during the 27th World Gas Conference in Washington DC, USA, and has no commercial intent.
60
Community outreach has perhaps not been used to its fullest effectiveness. In addition to the physical maintenance and expansion of the gas system is the relationship between the DSO and its customers and the general public. Expanding what has traditionally been meant by customer service to include the opportunities offered by social media applications is another challenge for the industry; augmented reality is an example. The interactive nature of the company-customer relationship when handled effectively helps to offset negative publicity, and assures a DSO’s sincerity in providing a safe, reliable and economic energy source.
Retention and recruiting of employees for white collar and construction jobs is also a challenge in the industry. Interaction between the DSO, its employees and the general public using social media can help with this issue.
Applications that include smart meters, interactive sensors in the home and workplace, and the application of the developing IoT technology will be a part of this DSO-customer relationship. Indoor sensors for shutting off appliances and/or the meter if methane, carbon monoxide or smoke is detected is an example of available technology waiting to be deployed.
Cyber security is of increasing concern now for pipeline operations as more of the SCADA system controls are handled remotely. Maybe not currently as urgent an issue for distribution operations but will be a growing concern as smart sensors are integrated more and more into operations. Going forward with these threats in mind it should, however, be possible to certainly mitigate if not hopefully to eliminate this threat as smart sensors are deployed.
Expanding end-use opportunities beyond the traditional that would include offsetting efficiency fuel switching/renewables; small-scale A/C; heat pumps; small-scale CHP; and micro-grids with fuel cells, micro-turbines; and transportation fuels. One-touch plug-ins for residential use of gas appliances has been introduced in Japan. Technologies like this increase the flexibility of residential appliances making its use more desirable.
Beyond the traditional pipeline network remote supply of stranded industrial enterprises, power generation or residential/commercial markets with virtual pipelines based on LNG or CNG offer many opportunities for expanding the natural gas market. In most cases outside the normal DSO activities the beyond the mains opportunities include;
• Small-scale LNG;
• Vehicle fuels;
• Bunkering;
• Stranded industries.
Example of virtual reality for underground asset identification

This publication is produced under the auspices of the International Gas Union (IGU) which holds the copywrite. The publication must not be reproduced in whole or in part without the written permission of the IGU. However, irrespective of the above, established journals or periodicals shall be permitted to reproduce this publication, or part of it, abbreviated or edited form, provided that credit is given to IGU. This document contains strictly technical information to be distributed during the 27th World Gas Conference in Washington DC, USA, and has no commercial intent.
61
While there are many issues to be addressed the opportunity for an expanding the market for natural gas is great. By recognizing the issues and addressing them the industry will be able to make use of the abundant, clean and economic natural resource available.
6.9. Sources/References
http://www.igu.org/global-natural-gas-insights
https://www.bp.com/content/dam/bp/pdf/energy-economics/energy-outlook-2017/bp-energy-outlook-2017.pdf
Uncovering the US Natural Gas Commercial Sector, American Gas Association, January (2017).
Tim Porter, Accenture Strategy, “Gaining customers’ ‘digital trust’ is key for utilities seeking to unleash value,” intelligent utility, October 27, 2015.
Patty Cruz and Rebecca Shiflea, “Top 10 tips for utilities to create a customer service culture,” intelligent utility, December 11, 2015.
“10 Common Barriers to Understanding the Customer Journey and How to Overcome Them,” IBM Marketing Cloud, 2016.
Peter Key, “Washington Gas puts self-service analytics to work,” energybiz, October 29, 2015.
http://www.igu.org/sites/default/files/node-page-field_file/SmallScaleLNG.pdf
https://www.tno.nl/media/4516/tno-2014-r10447_final_small_scale_lng.pdf
https://www.mordorintelligence.com/industry-reports/small-scale-lng-market
http://www.poyry.com/news/articles/how-can-small-scale-lng-help-grow-european-gas-market-0
https://www.mckinseyenergyinsights.com/insights/the-role-of-gas-demand-creation-in-absorbing-upcoming-lng-supply-surplus/
Information from an article by Abel Enríquez, EU Regulatory Affairs, Manager and Angel Rojo, Manager at Commercial and Logistics Division at Enagás.
GIE data from 2015 display more than 1000 satellite storage LNG facilities
https://www.gasintensive.it/consorzio/comuni-metanizzati-mise-gnl-regolato-senza-aspettare-gara-0004460.html
http://www.dolomitignl.it/content/home
https://www.woodmac.com/news/opinion/lng-trucking-china/
https://www.woodmac.com/ms/gastech/indonesias-potential-for-small-scale-lng
http://interfaxenergy.com/gasdaily/article/24077/indonesia-looks-to-expand-small-scale-lng-network By Andrew Walker 21 February 2017

This publication is produced under the auspices of the International Gas Union (IGU) which holds the copywrite. The publication must not be reproduced in whole or in part without the written permission of the IGU. However, irrespective of the above, established journals or periodicals shall be permitted to reproduce this publication, or part of it, abbreviated or edited form, provided that credit is given to IGU. This document contains strictly technical information to be distributed during the 27th World Gas Conference in Washington DC, USA, and has no commercial intent.
62
http://www.lngworldshipping.com/news/view,india-develops-smallscale-lng-plan-for-inland-waterways_47572.htm Fri 05 May 2017 by Karen Thomas
http://www.lngworldnews.com/gazprom-omv-team-up-on-small-scale-lng-project
http://www.lngworldnews.com/gazprom-approves-small-scale-lng-development-program
http://www.fluxys.com/group/en/NewsAndPress/2016/160329_GazpromSmallScaleLNG
https://www.wartsila.com/docs/default-source/smartpowergeneration/content-center/conference-papers/small_scale_lng_power_generation_in_the_philippines.pdf
http://www.businesswire.com/news/home/20160520005195/en/AGP-Brings-Small-Scale-LNG-Solution-Philippines
Strategic Agreement between Total and CMA CGM on Liquefied Natural Gas Fuel Supply for CMA CGM New
Build Container Ships, http://www.bunkerportsnews.com/News.aspx?ElementID=598bba11-cb39-4d44-ad4f-e4fe8209d811, December 5 (2017)
http://certifiedplastic.aenor.es/uploads/7/0/7/8/7078209/2017._multilayer_gas._eng.pdf
https://www.youtube.com/watch?v=8fNK5F670_k and https://www.youtube.com/watch?v=TCU-pCoUBLs ]
https://www.britishgas.co.uk/smart-home/smart-meters.html
www.engerati.com/webinars/cloud-saas-customer-analytics-insights-new-services-and-and-satisfaction
(www.engerati.com/article/digital-platforms-fueling-next-generation-innovation-customer-engagement)
https://www.aga.org/sites/default/files/sites/default/files/media/efficiency_fact_sheet_-_2017_3.pdf
http://playbook.aga.org/mobile/index.html#p=12
https://www.aga.org/about/american-gas-foundation/georgetown-university-energy-prize-natural-gas
https://www.nrel.gov/docs/fy00osti/28377.pdf
Jordi Roselló, Innovation on Trenching Techniques, Trenching Techniques Evolution in Gas, Natural Fenosa, Barcelona, 7 October (2015)
The digital customer, Engage customers as individuals, IBM Sales and Distribution, Energy & Utilities, IBM Corporation, March (2016).
https://www.aga.org/sites/default/files/sites/default/files/media/efficiency_fact_sheet_-_2017_3.pdf

This publication is produced under the auspices of the International Gas Union (IGU) which holds the copywrite. The publication must not be reproduced in whole or in part without the written permission of the IGU. However, irrespective of the above, established journals or periodicals shall be permitted to reproduce this publication, or part of it, abbreviated or edited form, provided that credit is given to IGU. This document contains strictly technical information to be distributed during the 27th World Gas Conference in Washington DC, USA, and has no commercial intent.
63
7. IGU DC Study Group 2 Report. Operational Excellence of Gas Distribution Activities
7.1. Operational excellence? What else?
7.1.1 Introduction
Distribution companies in the gas industry commonly refer to operational excellence (OE) as a strategy and goal to fulfil customer and society expectations. The questions are: When and how can excellence in operation be achieved? What is the most important: The highest safety level for all customers and employees/ lowest costs/ most attractive sustainable and innovative portfolio of services/ all of these?
In 1993 an article in the Harvard Business Review by Micheal Tracy and Fred Wiersema on operational excellence was published. (https://hbr.org/1993/01/customer-intimacy-and-other-value-disciplines):
“Customer intimacy and other value disciplines, three paths to market leadership” explained and clarified how companies took leadership positions in their industry not by broadening their business focus but by narrowing it. These companies focused on superior customer value in line with one of the three value disciplines:
• Operational excellence;
• Customer intimacy and
• Product leadership
A description of these value disciplines can be summarized as:
1. Operational excellence means customer transactions are hassle-free;
2. Customer intimacy means that customers get exactly what they need;
3. Product leaders are open to new ideas wherever they can find them.
Being successful by focusing on one of the values must be matched by reaching a minimum level on the other two values. Being successful by mastering two of these values is reserved to only a few companies.
7.1.2 Operational excellence
Characteristics that are applicable for an operational excellence approach are the drive to be leading in price and convenience. Minimizing overhead costs and optimizing the business process are on top of the agenda. Standardization of processes, products and services (and therefore making choices) are factors to success (Figure 7.1).

This publication is produced under the auspices of the International Gas Union (IGU) which holds the copywrite. The publication must not be reproduced in whole or in part without the written permission of the IGU. However, irrespective of the above, established journals or periodicals shall be permitted to reproduce this publication, or part of it, abbreviated or edited form, provided that credit is given to IGU. This document contains strictly technical information to be distributed during the 27th World Gas Conference in Washington DC, USA, and has no commercial intent.
64
Figure 7.1: Drivers for Operational Excellence
Although it seems self-evident for a distribution company to focus on operational excellence instead of customer intimacy or product leadership this is sometimes not implemented consistently.
Some consultancies like the Opexgroep (www.opexgroep.nl) have the opinion that the meaning of OE has changed in time and that nowadays industry best performers are at operational excellence 3.0 (Figure 7.2)
Figure 7.2: Operational Excellence Timeframe
Beginning in phase 1.0 with mechanization and standardization (Taylor, Scientific Management 1911, T-Ford) the second phase 2.0 which follows is characterized by Total Quality Management, robotics,

This publication is produced under the auspices of the International Gas Union (IGU) which holds the copywrite. The publication must not be reproduced in whole or in part without the written permission of the IGU. However, irrespective of the above, established journals or periodicals shall be permitted to reproduce this publication, or part of it, abbreviated or edited form, provided that credit is given to IGU. This document contains strictly technical information to be distributed during the 27th World Gas Conference in Washington DC, USA, and has no commercial intent.
65
Six sigma, BPR and the introduction of the concept of operational excellence by Tracy and Wiersema. In 1993 we end up in the third phase 3.0 where reliability and transparency are differentiators for leading companies.
7.1.3 Drivers that make us focus on OE
The past
Historically, performance of the gas distribution companies has been focused on serviceability and safety. Shortly after liberalization, asset owners were coming under increasing pressure from the regulators to reduce costs. At that moment in time, the management of gas distribution companies had the challenging task to balance conflicting drivers to maximize profitability while maintaining desired levels of performance.
Operational Excellence is the most appropriate operating model to overcome this challenging task. It helps to balance conflicting business drivers in order to generate the highest level of sustainable returns while maintaining obligations for system performance, customer service, safety, regulatory and environmental stewardship.
It’s clear that in the past Operational Excellence was focused on standardization and efficiency, two concepts which fulfilled exactly the needs of gas distribution companies under pressure to reduce costs. Nowadays the environment of gas distribution companies is becoming a lot more complex. Does the operating model of operational excellence still hold, or should we place a new focus on the agenda?
Today’s reality
Natural Gas networks are a cornerstone for economical and societal development. These networks are becoming more and more connected, more digital (e.g. smart grids, IoT, etc.) and more multifunctional (e.g. hydrogen transport over gas networks), introducing technical complexity and new challenges with respect to integration and reliability.
At the same time, gas distribution is facing large investment needs for replacing old infrastructure and building new infrastructure to satisfy future needs. On the contrary, some distribution companies are taking the bold decision that there is no future for the residential use of natural gas. This results in stranded assets and the complexity of managing these stranded assets. The customer also starts to play a more central role in gas infrastructure (e.g. decentralized production of energy) requiring facilitation of increased customer participation and the emergence of new business models. Finally, regulatory scrutiny related to reliability, cost levels, cyber security and environmental compliance is becoming more intense.
These new drivers could suggest that Operational Excellence is not the most appropriate operating model anymore. Looking beyond the Operational Excellence idea of standardization and cost reduction teaches us that Operational Excellence 3.0 can be still the most appropriate operating

This publication is produced under the auspices of the International Gas Union (IGU) which holds the copywrite. The publication must not be reproduced in whole or in part without the written permission of the IGU. However, irrespective of the above, established journals or periodicals shall be permitted to reproduce this publication, or part of it, abbreviated or edited form, provided that credit is given to IGU. This document contains strictly technical information to be distributed during the 27th World Gas Conference in Washington DC, USA, and has no commercial intent.
66
model. Achieving extraordinary reliability, the first-time-right focusing on the real added value for the customer is exactly the role of gas distribution companies for overcoming these new challenges.
7.2. Safety management from an OE objective
Safety Management Systems (SMS) in gas distribution companies started many years ago with a focus on such technical aspects as testing and certification for materials and components, followed by human aspects like training and personnel certification. The programs expanded last years in some countries with focus on and certification of systems and organization based on different standards.
Safety shall be considered from the point of view of:
• Materials and equipment used in gas distribution installation; • Construction, Operation and Maintenance procedures • Continuous monitoring of gas faults for updating of safety requirements • Revision of the construction, maintenance and operations contracts; • Safety of own personnel; • Safety of Contractors’ personnel. • Safety of End Users and the Public
7.2.1 National Safety Regulation and SMS
SMSs are conditioned by the national legislation and safety regulation following the scheme:
Figure 7.3: SMS and National Regulation
Key insight
Good cooperation between DSOs, gas associations and safety regulators leads to best practice in Safety Management Systems

This publication is produced under the auspices of the International Gas Union (IGU) which holds the copywrite. The publication must not be reproduced in whole or in part without the written permission of the IGU. However, irrespective of the above, established journals or periodicals shall be permitted to reproduce this publication, or part of it, abbreviated or edited form, provided that credit is given to IGU. This document contains strictly technical information to be distributed during the 27th World Gas Conference in Washington DC, USA, and has no commercial intent.
67
In some countries, like Spain, Germany and Austria, national Safety Regulation is complemented with Technical Rules or Good Practice Guidance prepared by the gas sector association.
Examples of the cooperation of regulators and the gas distribution companies to prepare new safety rules or standards are:
The Netherlands: A national standard based on Pas55 was developed: NTA8120 Asset management - Requirements for a safety, quality and capacity management system for electricity and gas network operations. The Dutch Safety Regulator took part in the development and endorses the importance of this standard.
France: One unique public portal for all diggers to request for information to protect gas distribution mains from Third Party Damages (TPD) allow contractors to get information in 7 days before digging. The TPDs have been reduced by 50 % compared to 10 years ago.
USA: Recommended practice (RP) 1173 establishes a pipeline safety management systems (PSMS) framework for organizations that operate hazardous liquids and gas pipelines jurisdictional to the US Department of Transportation. Operators of other pipelines may find this document applicable useful in operating to their systems.
Figure 7.4: Plan, Do, Check, Act – The core of RP1173
This RP provides pipeline operators with safety management system requirements that, when applied, provide a framework to reveal and manage risk, promote a learning environment, and
Key Trend
A Single source of Utility mapping with self-service over the web will reduce time and increase ease of access to mapping for authorised third parties

This publication is produced under the auspices of the International Gas Union (IGU) which holds the copywrite. The publication must not be reproduced in whole or in part without the written permission of the IGU. However, irrespective of the above, established journals or periodicals shall be permitted to reproduce this publication, or part of it, abbreviated or edited form, provided that credit is given to IGU. This document contains strictly technical information to be distributed during the 27th World Gas Conference in Washington DC, USA, and has no commercial intent.
68
continuously improve pipeline safety and integrity. At the foundation of a PSMS is the operator’s existing pipeline safety system, including the operator’s pipeline safety processes and procedures.
This RP provides a comprehensive framework and defines the elements needed to identify and address safety for a pipeline’s life cycle. These safety management system requirements identify what is to be done, and leaves the details associated with implementation and maintenance of the requirements to the individual pipeline operators.
This RP presents the holistic approach of “Plan-Do-Check-Act” and is the American National Standard for pipeline safety management systems.
Germany: In Germany there are about 700 gas distribution companies. The independent technical association DVGW has been the competence network for all questions related to gas supply and is responsible for preparing new safety rules in Germany.
The special position of the DVGW rules in the German regulation is based on the legal requirements for safety of gas distribution established by § 49 of the German law on electricity and gas supply.
In the view of the German regulatory authorities the ensuring of technical safety is assumed if the DVGW rules are applied. The contractor of a German gas distribution company guarantees that his performances correspond to these generally accepted rules of technology like the DVGW rules.
DVGW working groups with participants of gas distribution companies have updated the safety rules continuously. This frequent updating of DVGW rules is the German way to define new safety requirements for organizations, processes and personnel.
7.2.2 Different SMS approach in different countries
USA: In the United States, gas distribution and transmission pipeline operators are regulated by the U.S. Department of Transportation, Pipeline & Hazardous Materials Safety Administration’s Office of Pipeline Safety. Distribution operators and intrastate transmission operators are also regulated, in all but two states, by a state government agency. The Pipeline and Hazardous Materials Safety Administration (PHMSA) requires operators to follow regulations for the design, construction, operation and maintenance of their natural gas pipelines. One key requirement is for operators to establish and implement integrity management requirements. For gas distribution pipelines, operators are required to develop, write, and implement a distribution integrity management program (DIMP) with the following elements:
• Knowledge of the System;
• Identify Threats to the System;
• Evaluate and Rank Risks;
• Identify and Implement Measures to Address Risks;

This publication is produced under the auspices of the International Gas Union (IGU) which holds the copywrite. The publication must not be reproduced in whole or in part without the written permission of the IGU. However, irrespective of the above, established journals or periodicals shall be permitted to reproduce this publication, or part of it, abbreviated or edited form, provided that credit is given to IGU. This document contains strictly technical information to be distributed during the 27th World Gas Conference in Washington DC, USA, and has no commercial intent.
69
• Measure Performance, Monitor Results, and Evaluate Effectiveness;
• Periodically Evaluate and Improve Program;
• Report Results.
Another key safety program that all gas distribution and transmission operators have in place is one to prevent damage to the pipeline from excavation. This includes outreach to the general public, contractors, excavators and government agencies that engage in excavation to make a phone call before digging occurs so that the pipeline operator can go to the excavation site in advance of the excavation and mark the location of the pipeline. In the United States, operators and other underground utilities mark the location of their underground infrastructure for free. Every state has a “One-Call” center that receives calls from those planning to excavate. The One-Call center alerts underground utility operators in the area of the excavation that an excavation is planned and the underground utility operators then mark the location of their infrastructure in order to avoid having the infrastructure hit during excavation. Spain: The Commitment to Health and Safety Project began in 2012 at Gas Natural Fenosa (hereinafter, GNF). The project brings together all the businesses of GNF, and it is applicable in all countries of the world where GNF is present.
The project itself ended in December 2015 and in 2016 a stable structure of consolidating GNF's Commitment to Health and Safety was organized. It is based on five principles:
The project was organized through a structure that paralleled GNF's organization, and it was based on four lines:
• Project Management Committee, which is composed of the business and corporate managing directors and is led by the Chief Executive Officer;
• Central Project Team composed of the sponsors and leaders of the work groups and led by the central project office;
• Work groups (called "Networks"), formed by representative members from the various businesses and countries;
• Finally, the businesses and contractor companies. The functions of each one of the project's links are the following:
• Definition: Project Management Committee and Central Project Team;
• Development: Central Project Team and Networks;

This publication is produced under the auspices of the International Gas Union (IGU) which holds the copywrite. The publication must not be reproduced in whole or in part without the written permission of the IGU. However, irrespective of the above, established journals or periodicals shall be permitted to reproduce this publication, or part of it, abbreviated or edited form, provided that credit is given to IGU. This document contains strictly technical information to be distributed during the 27th World Gas Conference in Washington DC, USA, and has no commercial intent.
70
• Implementation: Businesses and Contractor Companies with the support of the Networks.
A total of thirteen (13) Company Networks were trained, three (3) of which were cross-company Networks (training, information systems and communication), and the rest were specific Company Network (within the following areas: Leadership Network, Employee Network, Contractors Network, Installation and Industrial Processes Network) in charge of designing the tools (developed based on health and safety standards) that provide support for GNF's entire Health and Safety Commitment. After completing the design phase, the organization was transformed to consolidate and provide continuity to the Health and Safety Commitment. The levels on which the new organization is based are the following:
• GNF's Health and Safety Management Committee composed of the business and corporate managing directors and led by the Chief Executive Officer;
• Central Health and Safety Team, formed by sponsors from each one of the networks and by members of the Management Unit of the Health and Safety Commitment;
• Work groups or Networks: the three cross-company networks are maintained, and all other networks become five (5) networks;
• Finally, Businesses and Contractor Companies.
France: The safety Program is made up of different parts:
1. Safety and health program: to prevent accidents to our employees and decrease the rate of absenteeism. From a global point of view, we work on “Better quality of life at work”. The principal indicators are: frequency rate (2.3), rate of absenteeism, satisfaction survey (more than 85 % are proud of their company) 2. Industrial safety on the network. It is divided into a lot of different actions:
- Prevent damages to the grid (3000 this year divided by two in ten years); - Maintenance to avoid incident (rate of maintenance done); - Quality of the emergency gas services (rate of intervention in less than one hour); - Training of our employees and our subcontractors (a lot of training), etc.
All these programs are in a continuous improvement with a large feedback and adaptations to the evolutions (regulations, laws, demands of consumers or municipalities, etc.).
In Ireland, Gas Networks Ireland (GNI) have a safety system that permeates the entire organization and provides regular data to safety regulators on safety performance. The structure includes a Safety representative at the Executive level and the reporting of safety at Senior Management committee level.

This publication is produced under the auspices of the International Gas Union (IGU) which holds the copywrite. The publication must not be reproduced in whole or in part without the written permission of the IGU. However, irrespective of the above, established journals or periodicals shall be permitted to reproduce this publication, or part of it, abbreviated or edited form, provided that credit is given to IGU. This document contains strictly technical information to be distributed during the 27th World Gas Conference in Washington DC, USA, and has no commercial intent.
71
The Safety Management System is accredited to OHSAS 18001. It is based on OHSAS 18001 ILO OSH Guidelines, UK HSG65 and HSA Guidelines. It follows the Plan, Do, Check, Act model and contains 11 key headings:
1. Leadership and Responsibility;
2. Hazard Identification, Risk Assessment and Control;
3. Materials, Equipment and Assets;
4. Processes and Procedures; Personnel,
5. Competency and Behavior;
6. Contractors, Services and Suppliers;
7. Emergency Preparedness;
8. Communication, Consultation and Co-operation;
9. Documentation and Records;
10. Accident and Incident Reporting and Investigation;
11. Performance Monitoring, Review, Audit and Improvement.
A Safety Framework is agreed with the Safety Regulator which specifies all the risks associated with the network. Changes in the business practices that may affect the Safety Framework must be impact assessed and risk mitigated to ensure risks are maintained to As Low As Reasonably Practical (ALARP principle). The Safety Framework must be revised every three years as a minimum.
7.2.3 Internal organization of the SMS
Although all company personnel are involved in the SMS, it is usually (e.g. Austria, Spain, France) controlled by panels or committees of experts from all divisions and teams led by Technical Managers. These Committees are in charge of:
• Analyzing how to implement the health and safety standards prepared by the networks;
• Revising, when applicable, the technical business instructions to adapt them to the new
requirements of the health and safety standards;
• Following up on the objectives according to the scorecard;
• Proposing improvements/revisions of the health and safety standards.

This publication is produced under the auspices of the International Gas Union (IGU) which holds the copywrite. The publication must not be reproduced in whole or in part without the written permission of the IGU. However, irrespective of the above, established journals or periodicals shall be permitted to reproduce this publication, or part of it, abbreviated or edited form, provided that credit is given to IGU. This document contains strictly technical information to be distributed during the 27th World Gas Conference in Washington DC, USA, and has no commercial intent.
72
7.2.4 Key Performance Indicators
The 3 top safety KPIs reported by the Distribution Study Group 4.1 in the report of the IGU triennium 2009-2012 were:
• number of accidents and serious incidents;
• number of leakages (public reported and own activities);
• response time for emergencies.
These remain as the top KPIs at present. National Safety Regulations can have an impact on the KPIs used:
In the United States, gas distribution pipeline operators are required to submit annually performance measure reports to the federal government (U.S. Department of Transportation, Pipeline & Hazardous Materials Safety Administration’s Office of Pipeline Safety). This includes a requirement for gas distribution operators to submit key performance indicators from their Distribution Integrity Management Program (DIMP) and on their pipeline infrastructure. Key performance indicators include total number of leaks either eliminated or repaired by cause, the number of hazardous leaks eliminated or repaired by cause, the number of excavation damages, the number of excavation tickets (based on One-Call or Call-Before-You-Dig notifications), the total number of Excess Flow Valves (EFV's) installed on residential services, and the estimated number of EFV's existing in distribution systems at the end of the year. Operators are also required to report the miles of pipe and number of services by material and diameter, mileage by decade, and mechanical fitting failure information: type of mechanical fitting, leak location, year installed, year manufactured if known, fitting material, cause of failure.
At GNF, Spain, in addition to a monthly report on the above mentioned KPIs, it is prepared a Safety scorecard. The purpose of this report is to objectively follow up on the actions defined in the health and safety standards, which every person/unit must carry out in favor of implementing the GNF health and safety commitment within their own area of influence.
The actions that are measured concern the following:
• Preventive safety observations;
Key Insight
KPIs add value but require:
1. Constant review to ensure suitability
2. Appropriate data systems for gathering, analyzing
and reporting
3. Real-time data gathering in the field
This publication is produced under the auspices of the International Gas Union (IGU) which holds the copywrite. The publication must not be reproduced in whole or in part without the written permission of the IGU. However, irrespective of the above, established journals or periodicals shall be permitted to reproduce this publication, or part of it, abbreviated or edited form, provided that credit is given to IGU. This document contains strictly technical information to be distributed during the 27th World Gas Conference in Washington DC, USA, and has no commercial intent.
73
• Documented inspections;
• Zero tolerance;
• Personal action plans;
• Training.
Another aspect that is shown in this report includes the data pertaining to periodic health check-ups, both mandatory and voluntary ones.
In France, also are considered as KPIs are: the rate of absenteeism and the level of satisfaction of the employees.
In Ireland, several occupational safety KPIs are used together with gas safety KPIs to be reported to the regulator quarterly (accidents, Contractor Environmental Enforcement Actions/Complaints, hazard reports, Safety Management System Audits (Completed vs. Planned), DSO and contractor safety and environmental initiatives undertaken, Lost time incident frequency rate, etc.). KPIs are tracked and trended to indicate improving or deteriorating performance and to allow steps to be taken to make improvements.
At a European Level, Marcogaz (the Technical Association for the European Gas Industry) coordinates benchmarking of KPIs for safety and performance of all DSO member countries so that gas network operators are aware of their relative performance and so that the focus on risk reduction is prioritized.
7.2.5 Internal communication and communication to contractors and construction companies
Communication is crucial in the matter of safety and operational excellence. Nearly 70% of accidents worldwide are due to non-compliance with the rules (including human factors).
Internal communication
The dialogue should be faithful at eye level between superiors and colleagues and between peers. The superior should be responsible to keep the communication going. He has to create and to maintain the channels and the frequency. The internal communication should include the following aspects:
- Periodic Health and Safety Meetings to improve human behavior within the company in order to reduce the number of accidents;
- Regular trainings with own staff, information about novelties, modifications and improvements;
- Continuous risk assessment - vigilance and intervention: If a workmate is making a mistake that is likely to create a risk, immediate correction is compulsory. These intervention is often the last barrier to avoid an accident;
- Anytime possibility for refresher training and identify points to be reinforced for the group or for the employees;

This publication is produced under the auspices of the International Gas Union (IGU) which holds the copywrite. The publication must not be reproduced in whole or in part without the written permission of the IGU. However, irrespective of the above, established journals or periodicals shall be permitted to reproduce this publication, or part of it, abbreviated or edited form, provided that credit is given to IGU. This document contains strictly technical information to be distributed during the 27th World Gas Conference in Washington DC, USA, and has no commercial intent.
74
- Near miss and quick response channel: Information and raise awareness about human errors, which are at the origin of accidents. Figure out together what shall be done differently in order to achieve this goal;
- Open internet access to all process instructions, technical rules etc. for the own staff and contractors is a key factor of success;
- Interactive simulations (2D or 3D) are a way to improve the skills and behavior; - Compliance and respect: Every employee must know and respect the rules and requirements
that apply to specific work situations he is confronted to. He must also wear its individual safety equipment;
- Every meeting should end with written minutes of meeting which is the basis for improvement in the further work.
Communication to contractors and construction companies
External communication in this context means the communication with contractor companies and
their construction companies apart from the official communication established contractually.
Therefore, local management groups in order to implement the safe behavior programs should be
installed.
This communication should include following aspects:
- Periodic meetings with the management and operational units of the contractor companies and their construction companies with following topics:
o transfer main part of relevant issues from the internal communication to the contractor;
o information, commitment and transmission of the principles of health and safety standards;
o visits on sites to review the scorecard indicators. o programs and workshop with anytime possibility for refresher training.
- Prevention of damages to the grid: o A long-term monitoring tool with cause analysis in order to reduce damage; o Information folders in all community centers in order to provide external planners
with general rules concerning underground construction.
Corporate communication on safety
Transparency is always the principle of communication in the regulated gas markets.
The Natural Gas Industry – Local Distribution Company (LDC) as well as both upstream and midstream operators are very quick and decisive in providing immediate response to high profile incidents that

This publication is produced under the auspices of the International Gas Union (IGU) which holds the copywrite. The publication must not be reproduced in whole or in part without the written permission of the IGU. However, irrespective of the above, established journals or periodicals shall be permitted to reproduce this publication, or part of it, abbreviated or edited form, provided that credit is given to IGU. This document contains strictly technical information to be distributed during the 27th World Gas Conference in Washington DC, USA, and has no commercial intent.
75
occur within their operating areas. This can be accomplished on the Company website, social media, television and radio.
Natural Gas Companies want to eliminate potential rumors and state the facts as soon as they are known to prevent media, public and customer misconceptions. They are also very respectful and helpful of the regulatory agencies that are doing the investigation to determine the cause of the incident.
Natural Gas Companies are also very sensitive to the community and both customers and the public that have lost members as well as those that have been hospitalized due to the incident.
There is an overall commitment to safety and to learn from the incident in order to prevent something similar from happening in the future.
There is a strong commitment to the public in listing those items that the Utility is doing since the incident so that all parties are aware something is being done and this is taken very seriously.
In the regulated markets the gas distribution companies shall report statistics of reliability and safety to the regulator. There are different reporting systems of interruptions and accidents in the countries. But all reporting systems have the same target – the monitoring and improving of reliability and safety in gas distribution.
More and more national regulators / authorities have published the results of statistics in reliability and safety.
7.2.6 Examples of new safety requirements based on bad development of gas faults
A man, who makes a mistake and hide it, makes the next mistake (Confucius).
In the industrial world, a human mistake is classified as “bad”. This leads to the consequence that mistakes, near misses and incidents are often seen as personal failure and may be swept under the carpet.
In the most cases a mistake is not the responsibility of an individual. The environment, stress, work overload or little experience are often trigger.
The creation of a motivating environment to encourage reporting mistakes and incidents is a crucial requirement for self-learning and continuous improvement.
In Austria, companies are evolving into a motivating environment to detect failures and near misses.

This publication is produced under the auspices of the International Gas Union (IGU) which holds the copywrite. The publication must not be reproduced in whole or in part without the written permission of the IGU. However, irrespective of the above, established journals or periodicals shall be permitted to reproduce this publication, or part of it, abbreviated or edited form, provided that credit is given to IGU. This document contains strictly technical information to be distributed during the 27th World Gas Conference in Washington DC, USA, and has no commercial intent.
76
Figure 7.5: Evolution into a Motivating Environment Spain (GNF): Every accident or incident is analyzed (root cause analysis) by a group of experts of the business, including people involved in the accident (own personnel and contractors). The following items are considered and studied:
- Main immediate cause;
- Weaknesses in activities coordination;
- Weaknesses in job preparation;
- Weaknesses in operational procedures;
- Weaknesses in skills/training (own and contractor’s personnel);
- Weaknesses in System management.

This publication is produced under the auspices of the International Gas Union (IGU) which holds the copywrite. The publication must not be reproduced in whole or in part without the written permission of the IGU. However, irrespective of the above, established journals or periodicals shall be permitted to reproduce this publication, or part of it, abbreviated or edited form, provided that credit is given to IGU. This document contains strictly technical information to be distributed during the 27th World Gas Conference in Washington DC, USA, and has no commercial intent.
77
Figure 7.6: A chain of failures causes an accident
The final conclusions can lead to several types of actions, such as:
• Revision of technical standards or instructions; • Drafting of safety contacts, good practices or lessons learned; • Revision of the training plans; • Preparation of a comprehensive Action Plan designed to fulfil the organizational
improvements and the recommendations of the report; • Distribution of a lessons learned document throughout the whole Company and
Contractors.
7.3. Customer perspective in relation to OE
Harnessing customer feedback for outstanding customer experience
7.3.1. The Future is all about Customer Experience
Customers always have an experience – good, bad or indifferent. The challenge is to influence the customer in a way that differentiates this experience and delivers value. Customer Experience has now overtaken price and product as the key brand differentiator. Organizations are fast realizing that it pays to focus on delivering excellent customer experiences – companies that are excelling in customer experience are growing their revenues at 4-8% above their market average (Bain & co). This has resulted in almost
Your brand is formed
primarily, not by what
your company says about
itself, but what your
company does. Jeff Bezos,
Amazon
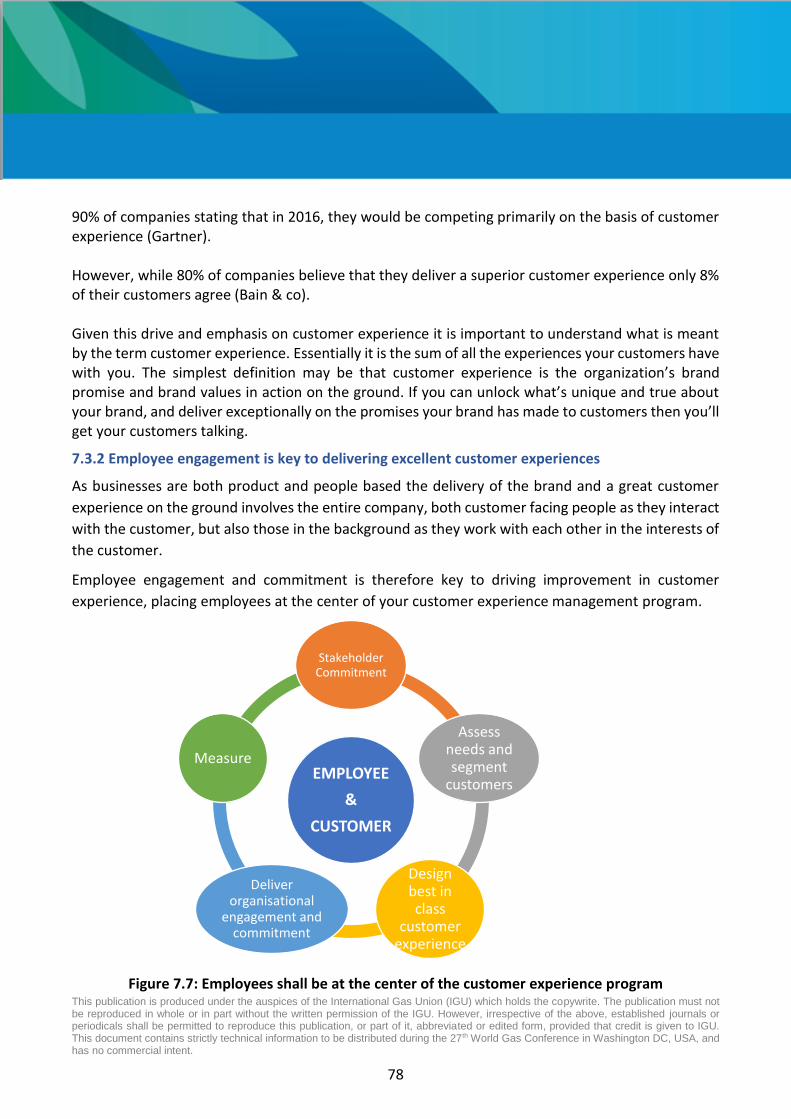
This publication is produced under the auspices of the International Gas Union (IGU) which holds the copywrite. The publication must not be reproduced in whole or in part without the written permission of the IGU. However, irrespective of the above, established journals or periodicals shall be permitted to reproduce this publication, or part of it, abbreviated or edited form, provided that credit is given to IGU. This document contains strictly technical information to be distributed during the 27th World Gas Conference in Washington DC, USA, and has no commercial intent.
78
90% of companies stating that in 2016, they would be competing primarily on the basis of customer experience (Gartner). However, while 80% of companies believe that they deliver a superior customer experience only 8% of their customers agree (Bain & co). Given this drive and emphasis on customer experience it is important to understand what is meant by the term customer experience. Essentially it is the sum of all the experiences your customers have with you. The simplest definition may be that customer experience is the organization’s brand promise and brand values in action on the ground. If you can unlock what’s unique and true about your brand, and deliver exceptionally on the promises your brand has made to customers then you’ll get your customers talking.
7.3.2 Employee engagement is key to delivering excellent customer experiences
As businesses are both product and people based the delivery of the brand and a great customer
experience on the ground involves the entire company, both customer facing people as they interact
with the customer, but also those in the background as they work with each other in the interests of
the customer.
Employee engagement and commitment is therefore key to driving improvement in customer
experience, placing employees at the center of your customer experience management program.
Figure 7.7: Employees shall be at the center of the customer experience program
EMPLOYEE
&
CUSTOMER
Stakeholder Commitment
Assess needs and segment
customers
Design best in class
customer experience
Deliver organisational
engagement and commitment
Measure

This publication is produced under the auspices of the International Gas Union (IGU) which holds the copywrite. The publication must not be reproduced in whole or in part without the written permission of the IGU. However, irrespective of the above, established journals or periodicals shall be permitted to reproduce this publication, or part of it, abbreviated or edited form, provided that credit is given to IGU. This document contains strictly technical information to be distributed during the 27th World Gas Conference in Washington DC, USA, and has no commercial intent.
79
7.3.3. So where does feedback/measurement fit in?
‘To value your customer you need to spend some time understanding the interactions they have with you, viewing your service through their eyes and designing in such a way that customers receive consistent experiences over time that they consider valuable.’
Oslo School of Architecture and Design
A successful measurement program is critical. This brings the customers’ voice into the organization and allows us to take action on what our customers are telling us. Most encompass a range of measures, each telling a different story but together painting the complete picture.
1. Was the customer able to do what they needed to do? - Customer Satisfaction Rating;
2. How easy or hard was it to do? - Customer Effort Score;
3. How did it make the customer feel? - Net Promoter Score;
4. What are the customers saying? – Customer verbatim.
7.3.4. Organizational approach
The challenge is to deliver a ‘joined-up and seamless’ service that puts customers first while operating an optimized business model employing key business partners which are an extension of the Customer Care team, for example:
• Contact Centre;
• Field staff;
• Customer experience monitoring provider.
all collaborating effectively with external stakeholders including Regulators, Local authorities, Installers and Suppliers.
Find the sweet spot for your organization by managing the tension between business efficiency and customer’s desire for distinctive experiences. Living your brand involves the entire organization - in a truly customer centric business model, the customer experience is driven by everyone
- as they interact with the customer;
- and as they work with each other in the interest of the customer.
Together these should both help to increase business efficiency and customer preference.
7.3.5 Gas Networks Ireland – a case study
Gas Networks Ireland (GNI) owns, operates, builds and maintains the natural gas network in Ireland. We connect and deliver gas to more than 673.000 domestic customers and 25.000 business customers regardless of their gas supplier. Our core purpose is to ensure the safe and reliable delivery of gas to our customers 24 hours a day, 365 days a year. By serving our customers and collaborating with our partners, we continually advance the utilization of the gas networks for the benefit of Ireland. Our mission is ‘Committed to putting our Customers First’. We strive to live our
This publication is produced under the auspices of the International Gas Union (IGU) which holds the copywrite. The publication must not be reproduced in whole or in part without the written permission of the IGU. However, irrespective of the above, established journals or periodicals shall be permitted to reproduce this publication, or part of it, abbreviated or edited form, provided that credit is given to IGU. This document contains strictly technical information to be distributed during the 27th World Gas Conference in Washington DC, USA, and has no commercial intent.
80
values ‘Customer Service’; ‘Safety’; ‘Performance’; ‘Integrity’ and ‘Collaboration’ in all behaviors and interactions with customers, staff, suppliers, stakeholders and the general public in the pursuit of excellent experience.
Putting our customers first
Traditionally the key focus in GNI has been Safety First - a predominately engineering driven organization. Our customer experience management program required a framework – ‘Insights into Action’ to measure our customers’ experiences, identify what the ideal experience is in their minds and in turn aid the organization to identify and implement improvements and process change that puts the customer first.
The five key principles we follow in doing this are:
1. Take a customer focus rather than job focus – stand in our customers’ shoes and see things from their perspective;
2. Focus on the whole journey rather than key moments of truth; 3. Engage a combination of metrics and methods – don’t rely on one metric; 4. Consider the service ecosystem – that multiple parties are involved in influencing the
customer’s experience; 5. Get it right first time.
Insights into Action
Through our ‘Insights into Action’ framework we gained a deep understanding of these customers’ experiences and drove out solutions to deliver process improvements and enhance customers’ experience. Across the organization we also use this program to set and monitor progress towards Customer Experience targets, ensuring the customer is at the center of everything we do. The ‘Insights into Action’ framework is summarized below, and how it was applied to enhancing the experience of our customers using this framework to improve our customers experience and influence change within the business:

This publication is produced under the auspices of the International Gas Union (IGU) which holds the copywrite. The publication must not be reproduced in whole or in part without the written permission of the IGU. However, irrespective of the above, established journals or periodicals shall be permitted to reproduce this publication, or part of it, abbreviated or edited form, provided that credit is given to IGU. This document contains strictly technical information to be distributed during the 27th World Gas Conference in Washington DC, USA, and has no commercial intent.
81
Figure 7.8: Insights into action framework
One example of this: Gas Networks Ireland provides a 24 h, 365 days a year emergency response service to anyone who phones the emergency helpline to report a suspected gas escape anywhere in the country. We commit to arrive on site within one hour nationwide and respond to about 20.000 calls annually. While we repair all external gas leaks and make any internal leaks safe, our customer experience measurement work was telling us that the initial reporting of a suspected leak and follow up required by customers still involved a great deal of personal effort for our customers.
Insights:
Based on both quantitative and qualitative feedback from W5s customer experience measurement program we identified that despite high satisfaction scores and a streamlined process internally, reporting a suspected gas leak continued to be a very stressful activity for customers involving a great deal of personal effort. Even greater reassurance was needed.
Communicate:
Real time monitoring and sharing the insights across the business and with external partners through our monthly reports, Intranet and stakeholder meetings highlighted customers’ difficulties and the issues for the business.
Solution:
As a utility with an outsourced business model a successful solution required collaboration. We engaged with the internal emergency team, the RGII (Registered Gas Installers of Ireland) and our

This publication is produced under the auspices of the International Gas Union (IGU) which holds the copywrite. The publication must not be reproduced in whole or in part without the written permission of the IGU. However, irrespective of the above, established journals or periodicals shall be permitted to reproduce this publication, or part of it, abbreviated or edited form, provided that credit is given to IGU. This document contains strictly technical information to be distributed during the 27th World Gas Conference in Washington DC, USA, and has no commercial intent.
82
business partners through monthly meetings, and our Quarterly Customer Experience Day, to identify and commit to ways we could address this issue together.
Actions:
• We revised the phoneline’s welcome message deterring nonemergency calls, removing any delay for emergency callers;
• We developed a training module using customer roleplay in our specially designed streetscape ‘Lamplighters Row’ for attending Fitters, empowering them to reassure customers better;
• Collaborating with RGII we developed a brochure explaining RGII’s role and responsibilities; • We introduced a follow up phone call to customers within 24hrs to ensure they understood
next steps.
The impacts of these actions have been seen across the company:
• There has been a 37% reduction in unwanted calls on the emergency phone line, following the introduction of the new message. 95% of calls are now answered in 20 seconds;
• Reassuring customers better means we have reduced the amount of effort it takes customers to report a suspected gas leak;
‘I was amazed how quickly the call was responded to. I felt at all times that I was dealing
with experienced people, from the lovely lady who took my call to the two gentlemen who
arrived at my door. What could have been a nightmare experience was handled quickly,
professionally and I was left feeling very safe in my home. Thank you.’ Nov 15
• We know from reaching out to Fitters and measuring their experience as employees that they feel more confident in advising/reassuring customers and are delighted to have more tools to help with this.;
• We have enhanced our relationship with the RGII through collaboration on training and the design of communications.
The Insights into Action Program has delivered for GNI. Since 2012:
• GNI’s customer effort has decreased from 2.13 to 1.61 (the lower an effort score is, the better);
• Net Promoter Score (likelihood to recommend) has risen from +41 to +62;
• Customers who say they are very satisfied has risen from 59% to 78%;
• We have reduced calls to our call center by 19%;
• We have reduced back office and field costs: o Reduced back office processing – approx. 25% less No-gas jobs in 2016; o Reduced call outs – approx. €250k savings in 2016; o Revisits reduced for missed appointments reducing customer complaints by 26%.

This publication is produced under the auspices of the International Gas Union (IGU) which holds the copywrite. The publication must not be reproduced in whole or in part without the written permission of the IGU. However, irrespective of the above, established journals or periodicals shall be permitted to reproduce this publication, or part of it, abbreviated or edited form, provided that credit is given to IGU. This document contains strictly technical information to be distributed during the 27th World Gas Conference in Washington DC, USA, and has no commercial intent.
83
• Winning multiple awards, GNI has been recognized internationally – across industries - as a leader in Customer Care.
In summary
"The most basic of all human needs is the need to understand and be understood. The best way to understand people is to listen to them."
Ralph Nichols
Harnessing customer feedback to consistently improve their experience through our insights into action progamme has worked for GNI. The journey that we as an organisation has taken points to the importance of the following in building a great framework or programme for others:
• Collect revelant, accurate and timely data to identify insights;
• Put the customer at the centre;
• Identify quick wins and process changes;
• Integrate Brand Values;
• Seek out and integrate best practice from other organisations;
• Incorporate the perspective of employees and other stakeholders as you are relying on them to deliver a great experience;
• Embed it across the organisation – every department should be thinking about the customer experience;
• Broad and deep – consider every interaction you have with the customer;
• Always ask why? – Question everything to ensure it works for the customer.
And the importance of executive support:
“Customer focused Service Delivery is a fundamental element of Gas Networks Irelands overall business strategy. GNI and business partners work tirelessly to truly put our customers at the heart of our business, always pushing the boundaries and the business to deliver on and exceed our customers’ expectations. The customer experience programme has delivered significant returns in terms of customer satisfaction, employee engagement and overall business performance.”
Liam O’Sullivan, MD Gas Networks Ireland
7.4. Field Workforce: the “blue collars” perspective
In this chapter we will look at operational excellence from the field workforce perspective. We address 5 topics:
• Technology and tools: a US Utility experience;
• Training, competence and skills;
• Engagement of the personal resulting in loyalty;
• Conflicting interest;

This publication is produced under the auspices of the International Gas Union (IGU) which holds the copywrite. The publication must not be reproduced in whole or in part without the written permission of the IGU. However, irrespective of the above, established journals or periodicals shall be permitted to reproduce this publication, or part of it, abbreviated or edited form, provided that credit is given to IGU. This document contains strictly technical information to be distributed during the 27th World Gas Conference in Washington DC, USA, and has no commercial intent.
84
• The human factor. 7.4.1. Technology
Technology enabled transformation: Driving construction quality and productivity - A US gas utility’s experience The company had a strong operational and financial track record serving one of the nation’s fastest growing and largest service territories. A key driver of their past success was their strong focus on safety, service and reliability. However, company leaders perceived that their historic success would be challenged by changes in their operating environment and workforce. Specifically, continued growth in gas infrastructure construction from new demand and accelerated pipe replacement programs, accelerating retirements of long tenured employees, new and emerging regulatory oversite requirements, and increasing crew turnover as the demand for construction workers increases nationally. These factors were placing new challenges on effectively managing pipeline installations and replacements. The Company wanted to improve construction quality, better leverage talented inspection resources, and improve crew performance. Historically, manual inspection forms were used to record critical but limited construction data. However, the process required considerable experience and judgement by inspectors and managers, leading to inconsistency in evaluations and reporting. The company wanted to implement a consistent, risk driven, performance focused and statistically valid inspection process. They also wanted to better support inspectors and managers time by leveraging mobile based, field data collection with automated record keeping. Finally, the company wanted better data and tools for managing an increasingly dynamic contractor workforce, while supporting managers with detailed performance tracking and closed loop work flow tools.
As the Senior Vice-President/Operations, said:” We were doing well, but we knew we could do better. We needed the ability not only drive operations excellence but prove the effectiveness of our construction programs. This led us to evaluate how we could refine our inspection structure and content to focus on critical areas in greater depth, and shift inspector focus from documenting findings to using findings to improve construction quality and performance. We knew it was possible, we just needed to right tools and support for the journey.”
Operations leadership started by establishing clear objectives for its “next generation” inspection program, specifically:
- What to inspect; - How to inspect; - How much to inspect; - How to focus on key quality and performance leverage points;

This publication is produced under the auspices of the International Gas Union (IGU) which holds the copywrite. The publication must not be reproduced in whole or in part without the written permission of the IGU. However, irrespective of the above, established journals or periodicals shall be permitted to reproduce this publication, or part of it, abbreviated or edited form, provided that credit is given to IGU. This document contains strictly technical information to be distributed during the 27th World Gas Conference in Washington DC, USA, and has no commercial intent.
85
- How to best manage a growing and diverse contractor based work force; - How to provide better tools and support for inspectors, managers and executives.
The company selected Risk and Performance Assurance (RPA) as their transformation technology platform and the consulting firm that developed RPA as their implementation partner. RPA was developed with eight industry leading gas utilities as part of a Gas Technology Institute sponsored initiative.
As the Program Lead stated: “We considered developing our own solution and looked at other commercially available tools. However, the commercial inspection solutions were developed for other industries and then adapted to the gas construction environment. Developing it ourselves would require a long time, significant resources and expertise that was in short supply. RPA offered a proven solution developed for the gas industry by gas industry. We also found the developer had both the gas industry knowledge and the transformation expertise to help us quickly build and implement a company tailored solution.”
Inspection content and criteria was configured to precisely fit the company’s design standards, regulatory environment, work flows, physical environment, internal legacy systems and operating practices. The RPA solution and technology were in the hands of inspectors within 6 weeks of beginning the project, where it was tested and refined over the following 4 weeks. The configured and enabled RPA solution was then implemented across all the company’s operations during the following 9 weeks, including all workflow support, performance reporting, training, and statistical models. Designing and implementing a risk-informed approach to construction and contractor management The first step in the transformation process was to determine what needed to be inspected, how it should be inspected, how frequently it should be inspected, and how inspection data should be collected and analyzed. The Operating Manual was the controlling driver, along with industry risk research, observed error rates, company risk experience and statistics based planning tools. The result was a significant expansion in the depth of inspection in critical areas. The number of tasks and decision criteria in the inspection process grew from less than 20 to over 200. Fortunately, the improved efficiency of data gathering, the targeted focus of the inspection process, and reduced dependence on inspector judgement, allowed inspectors to not only inspect considerably more tasks/questions on each inspection, but also increase the number of inspections performed. Critically, the inspection philosophy was also revised to an “observe and record all unsuccessful tasks” even if corrective action was immediately made. Warnings and judgement-based evaluations were eliminated, and inspection criteria was clearly defined and applied. This allowed the company to

This publication is produced under the auspices of the International Gas Union (IGU) which holds the copywrite. The publication must not be reproduced in whole or in part without the written permission of the IGU. However, irrespective of the above, established journals or periodicals shall be permitted to reproduce this publication, or part of it, abbreviated or edited form, provided that credit is given to IGU. This document contains strictly technical information to be distributed during the 27th World Gas Conference in Washington DC, USA, and has no commercial intent.
86
evaluate “first attempt” quality and performance by crews and individuals. It was an important cultural change and one embraced by both inspectors and managers. Statistical models were developed to determine and monitor inspection frequency based on risk factors, observed error rates, task population size and defined confidence levels. These models also ensure that individual, crew and contractor performance is objective, statistically valid and distinguishes trends and performance variations from “noise”. It also adjusts the frequency of inspection by task as observed error rates and crew performance changed. A fundamental design principle established for RPA was to develop a solution that could be deployed rapidly without requiring major internal IT work, yet a solution that could be integrated into the existing IT infrastructure easily at any time. After evaluation, the company decided to initially utilize a hosted RPA solution supported by a tablet-based structured inspection process. Data interfaces with existing operations and quality systems were developed to transfer key work order, crew and individual identification data, and return appropriate quality records in the format needed by the company’s legacy systems. Results to date: The impact of the new inspection program has been dramatic. Without any adjustments in manpower, inspectors have more than doubled the tasks inspected per inspection and the number of inspections per inspector has increased by over 50%. More important, crew and individual success rate have increased and inspectors have moved from a primary focus on evaluating work into coaching and improving crew quality and performance. Data on crew, individual and contractor performance is available real time with detailed tracking and follow-up of each inspection non-conformance. Further, statistically valid monitoring of contractor, crew and individual performance has led to significant improvements in quality, crew productivity and “first time” correct construction. The trend and performance analysis and timely access to prior inspection records enables inspectors to focus on key risk and performance challenges, and manager to focus on data driven contractor management. Lessons learned - Focus on quality improvement to drive construction performance and operations excellence; - Transform the inspection process and support it with technology, don’t just automate it; - Define the tasks and inspection criteria directly from the Operating Manual and provide the
Operating Manual on the tablet for quick reference, along with inspection protocols, inspection aids, and good practice examples;
- Emphasize “first pass” reporting quality by establishing a philosophy of “record what you observe and observe all you can”;
- Use statistical models to focus inspection activity and define the frequency of inspection; - Leverage the GIS location recording, photo capture, ability to record notes, sketches, and
diagrams within RPA; to enable effective inspection and support root cause analysis;

This publication is produced under the auspices of the International Gas Union (IGU) which holds the copywrite. The publication must not be reproduced in whole or in part without the written permission of the IGU. However, irrespective of the above, established journals or periodicals shall be permitted to reproduce this publication, or part of it, abbreviated or edited form, provided that credit is given to IGU. This document contains strictly technical information to be distributed during the 27th World Gas Conference in Washington DC, USA, and has no commercial intent.
87
- Develop detailed workflows to ensure employee, crew and contractor specific follow-up with remedial actions identified, tracked, monitored, and resolved;
- Track inspector performance to ensure consistency across each operation, organization and the company overall;
- Deploy quickly and iterate with user feedback. Study Case on advanced technology to enhance OE
In France, more than 3.000 operators are required on gas safety intervention. Due to the specificity of these interventions, it is difficult for managers to verify knowledge, respect of the rules and operational reflexes in emergency situations. So we decided to create a serious game named SRI, with a virtual reality technology, relying on an innovative technology and which will rapidly evolve to include new jobs (maintenance on biogas injection plant for example).
Figure 7.9: SRI
This simulator was produced by operational staff for operational staff.
Key Trend
Advanced technologies can enhance OE:
1. Interactive Simulators for training 2. Augmented Reality for operational response 3. Hand Held Technology, e.g. Field-GIS for capture of
as-built data

This publication is produced under the auspices of the International Gas Union (IGU) which holds the copywrite. The publication must not be reproduced in whole or in part without the written permission of the IGU. However, irrespective of the above, established journals or periodicals shall be permitted to reproduce this publication, or part of it, abbreviated or edited form, provided that credit is given to IGU. This document contains strictly technical information to be distributed during the 27th World Gas Conference in Washington DC, USA, and has no commercial intent.
88
In a few words, it’s a way to discover their shortcomings or at least the points on which they require further training or a refreshing of their knowledge.
With SRI it is able to assess the skills of operators every year, by a new way to train our employees.
The tool is based on four principles:
1. Registration;
2. Simulation; 3. Reporting; 4. Debriefing.
With more than 1700 tests, the feedback has clearly seen that 3 points are really mastered and 2 dimensions need to be reinforced. Immediately, we decided to reinforce the tutorial management on these two points of attention. With this tool we have a shorter improvement loop. It’s also a way to discover unadapted collective practices based on the old practices not necessarily identified as wrong.
For 2017, we plan to develop two new scenarios: underground gas leakage and damage to the gas network.
7.4.2. Training, competence and skills
Field workforce plays one of the important roles in distribution activities during the construction phase, and subsequently the operation phase to cope with the demands of operational excellence.
DSOs should invest in raising workforce loyalty, developing- training of their workforce, and furthermore assist the small subcontractors to raise their working force competency as they might not have the capabilities and financial means for this continuous development.
Human resource management creates the policies and practices involved in carrying out the “people” or human resource aspects of a management positions including recruiting, training, rewarding, and assessing.
Effective recruitment Process: Employing the right person for the business might be the most important part of our venture. An effective recruitment and selection process reduces turnover rates to reach a harmony between workforce and management to increase loyalty to the company. It is
Key Insight
• Management attention for training is growing
• Employees feel that the company is investing in
them and feel better prepared for the job
• Companies insource the training and build new
facilities

This publication is produced under the auspices of the International Gas Union (IGU) which holds the copywrite. The publication must not be reproduced in whole or in part without the written permission of the IGU. However, irrespective of the above, established journals or periodicals shall be permitted to reproduce this publication, or part of it, abbreviated or edited form, provided that credit is given to IGU. This document contains strictly technical information to be distributed during the 27th World Gas Conference in Washington DC, USA, and has no commercial intent.
89
obvious that keeping workforce as long as possible within the company will help the organization to cohere more and helps management to decide in putting the right man in the right Job.
Effective job descriptions: To keep our co-worker Top of the notch. This requires a clear and illustrative Job description, which outline the roles and responsibilities for a position and lists each of these key functions and provides a virtual checklist for the manager to ensure the new employee learns each key task.
Competency Monitoring and assessment: To monitor Individual Performance we need to know what to measure whether to rely on Education, experience or on-Job training. A complete way for approaching this monitoring is to link individual performance to business goals by creating a competency framework that integrates knowledge, skills, judgement and workforce attributes to perform a job effectively. The framework outlines specifically what people need to do to be effective in their roles and it clearly establishes how their roles relate to organizational objectives and success.
Job Training: Is an investment we make in our work force. When companies offer training and education to their employees, they indicate that they value their people and the contributions they make. They also send a message that the organization values progress -- both in organizational achievements as well in the careers of its people. Consequently, this creates attachment, loyalty and enthusiasm among staff.
A work force filled with people eager to learn and develop is a sure sign a company hired well. Employees who are engaged in their jobs and careers want to know more about their company and industry and to learn skills that will improve their performance. Employers who want to harness the full value of their employees and foster loyalty and retention will find training is a winning prospect for all involved.
A positive and impactful trend in the industry is the design and construction of state-of-the-art employee training facilities. This investment has allowed new and veteran employees to hone technical skills in environments specifically designed to simulate actual field conditions. However, the industry continues to face long-term workforce development challenges. This includes managing knowledge transfer, developing new employees as seasoned industry experts retire, and the contracting of qualified contractor resources. In addition, many companies continue to seek solutions that help to address field management’s need to balance administrative activities and their presence in the field, as well as details and logistics related to the training of their employees.

This publication is produced under the auspices of the International Gas Union (IGU) which holds the copywrite. The publication must not be reproduced in whole or in part without the written permission of the IGU. However, irrespective of the above, established journals or periodicals shall be permitted to reproduce this publication, or part of it, abbreviated or edited form, provided that credit is given to IGU. This document contains strictly technical information to be distributed during the 27th World Gas Conference in Washington DC, USA, and has no commercial intent.
90
Figure 7.10: Atmos Energy Charles K Vaughn Training Center (USA)
7.4.3. Engagement of the personal resulting in loyalty and motivation
While national safety regulations are created with the intent for a safer operation, their effectiveness is limited by the attempt to fulfil a collective need. National regulations offer a target for individual operator safety, but they do not align succinctly with each of a nations pipeline designs, workforces, and operations. For optimal effectiveness in improving and maintaining safety, engagement at an operating personnel level is required. Over national agencies, companies are better suited to motivate and engage personnel and many put forth a significant amount of effort on creating a strong culture of safety.
Organizations that focus on their internal safety culture will require a strong management commitment for safety. Management commitments for safety policies, safety committees, safety performance goals, and safety messaging are examples of programs and tasks that have been effective in creating a motivated and loyal workforce.
Safety Policies and engaged personnel: Defining and communicating company safety policies that empower personnel to make real time decisions for job safety is a necessity for personnel engagement. Company policies will outline requirements for identification of safety risks, stop job authority, and personal protective equipment (PPE). These policies have been identified as effective tools that focus personnel on safety.
1. Identifying safety risks is core competence of engaged personnel. Safety processes that require
personnel to evaluate risks at all tasks create personnel who are proficient in situational
awareness. Risks evaluations are completed prior to starting work tasks and require personnel
at the work site to discuss all recognizable safety risks. Activities to reduce or eliminate the risks
are discussed and implemented. Evaluations are documented and signed by all personnel
present;
2. Authority to stop a job when concerned for safety places safety responsibility on each member
of personnel. Recognizing that personnel who are willing to speak up and stop a job may fear

This publication is produced under the auspices of the International Gas Union (IGU) which holds the copywrite. The publication must not be reproduced in whole or in part without the written permission of the IGU. However, irrespective of the above, established journals or periodicals shall be permitted to reproduce this publication, or part of it, abbreviated or edited form, provided that credit is given to IGU. This document contains strictly technical information to be distributed during the 27th World Gas Conference in Washington DC, USA, and has no commercial intent.
91
colleague or management retaliation, many companies have implemented a policy of no
tolerance for retaliation. Job stoppage is permissible when any company procedure is not being
followed, a safety risk was not appropriately identified, incorrect use of PPE, or any other reason
for cause of a safety concern;
3. PPE is an effective tool to reduce and eliminate incidents. A well understood PPE policy that
has been implemented and enforced has saved many personnel from injury. Companies that
provide all needed PPE and offer PPE for personnel home projects, such as safety glasses while
trimming a home lawn, demonstrate considerable care for personnel which in turn triggers
loyalty.
Safety Committees: Utilizing personnel from multiple company functions to address safety issues has traditionally been managed by the creation of internal safety committees. Safety committee participation will include personnel from pipe operations, management, purchasing, etc. A committee’s purpose and expected deliverables must be clear and fully supported by management. Some deliverables that many safety committees are required to produce include PPE evaluation, review of near miss, perform root cause analysis for personnel injuries, etc.
Safety Performance Measurements: Metrics imposed by national agencies, such as the United States Occupational Safety and Health Administration (OSHA) can offer a positive direction toward a company’s safety measurements. A well-known OSHA metric, days away, restrictions, and transfers (DART), measures severe incidents that have kept personnel from being able to work. This final metric of severe incidents is a lagging metric and does not promote a company’s safety culture but reports on failures.
Companies have found that the creation of leading indicators are more effective in focusing the personnel thoughts on safety. Some common leading indicators that have been added to operational metrics include near misses, first aids, safety meeting attendance of personnel, and safety audit results.
Once a company has identified which metrics will be used to measure performance, communication of the metrics is needed. Many companies will give monthly updates to personnel. Through these updates personnel are able to understand what is important to management and will target many of their efforts to improving the results of the metrics.
Safety Training: Engaging employees for safety is first initiated in company training programs. Providing a setting where employees are educated on the hazards of their job and effective ways to remediate the hazards is critical to personnel engagement. Multiple training programs will integrate safety processes within a company procedure. Defining and explaining why a procedure or process is required as it relates to safety enables personnel to focus on the proficiency for safety. For example, personnel that understand the dangers of mechanical equipment within close proximity to an active gas line will most likely choose to hand dig over equipment digging when close to the active gas line.

This publication is produced under the auspices of the International Gas Union (IGU) which holds the copywrite. The publication must not be reproduced in whole or in part without the written permission of the IGU. However, irrespective of the above, established journals or periodicals shall be permitted to reproduce this publication, or part of it, abbreviated or edited form, provided that credit is given to IGU. This document contains strictly technical information to be distributed during the 27th World Gas Conference in Washington DC, USA, and has no commercial intent.
92
Safety Messaging: Messaging and communication with personnel is critical for any business and manager. Management is consistently being watched and reviewed by personnel. Hence, a leader who demonstrates a full commitment to safety will often visit personnel while working in the field. Management will wear proper PPE, conversations of any needs for safety will be engaged, and actions from those conversations will be taken. Effective messengers of safety are not limited to company managers or executives.
Many companies will have a process of safety meetings, where personnel will hear a tip or be reminded of something that was learned in safety training. Some companies will have daily safety meetings, others will be weekly, and others monthly. While frequency of safety meetings will change from company to company, many recognize the quality of a safety message is critical.
Effective messages are personal and get personnel thinking about how safety or lack of could affect their work and personal life. Some companies will ask personnel who have been hurt on the job to testify the event to co-workers in a safety meeting setting. These events create a comradery and loyalty among personnel that cannot be measured.
In Summary: Each company has their own unique mix of activities to increase personnel engagement and loyalty. The basic framework of most includes management commitment, safety policies, safety committees, performance measurements, safety training, and safety messaging.
7.4.4. Balancing interests
Safety rules from the blue-collar point of view: Both constraints in their activities and a protection resource for themselves and others. All is included in a sort of balance - Decrease the perception of the constraints: internal rules at the just level, practical and
operational rules fully or to be realistic best adapted to reality in the blue-collar field, personal protection equipment, adapted level of collective protection equipment, don’t have the right devices and tools, negative judgment on debriefing reports, etc;
- Increase the perception and the efficiency of protection: training and personal experience, safety reflex, personal protection equipment, quality devices, adapted level of collective protection equipment, personal conviction, having the right and checked devices and tools, adapted to the work to do, internal rules too complete to be operational (legal protection), open minded and comprehensive attitude in the debriefing report.
Another balance plates exists: - manager speaks of frequency rates, customers in satisfaction, year results, report on works,
activity deplaned, team disorganization; - operational blue-collar lives hurt, speaks professional proudness on personal status and peers’
appreciation, punishment. It is important to keep in mind that this balance will never stop moving. The external context actual reality in the field and also personal behavior shall continuously influence the balance.

This publication is produced under the auspices of the International Gas Union (IGU) which holds the copywrite. The publication must not be reproduced in whole or in part without the written permission of the IGU. However, irrespective of the above, established journals or periodicals shall be permitted to reproduce this publication, or part of it, abbreviated or edited form, provided that credit is given to IGU. This document contains strictly technical information to be distributed during the 27th World Gas Conference in Washington DC, USA, and has no commercial intent.
93
It is necessary, from the blue-collar point of view, to be able and allowed to decide the best way to do the work. Different solutions exist:
✓ A piece of “hack solution”; ✓ Personal analysis and adaptation (based on experience, training, skills); ✓ Technical support and advices. This point needs trust climate with colleagues and manager.
Another important point, especially in Gas DSO: an operator needs to manage both global gas risk and personal risk. 7.4.5. Human Factors
Study Case: A major event in the life of SONATRACH (Algeria)
The Safe Behavior Program is intended to improve human behavior within the company in order to reduce the number of accidents. This program was originally developed by the Norwegian Statoil oil and gas company and is currently developing in Algeria in the form of a partnership between Statoil, IAP and SONATRACH to be dispatched to the 120.000 workers of the SONATRACH group. The advent of the Safe Behavior Program is a major event in the life of SONATRACH. It is the first actual manifestation being implemented to strengthen the HSE policy of the Group and of the general instruction on workers’ and facilities safety. The Safe Behavior Program involves directly, through their daily behavior, the structures managers and their respective staff. The human factor and its behavior
“When you leave home in the morning for work, … it is for a living and not to lose one’s life. “ Practically, most of the accidents are due to human errors that occur on a workplace. This is why daily life cannot be made safer, unless constant caution is maintained on one’s own behavior to avoid errors.
Objectives: "a single loss is already too much":
• encourage everyone to make the right decisions, in due time, so that our daily be safe, out of risk and danger;
• inform and raise awareness about human errors which are at the origin of accidents; • figure out together on what we shall be doing differently in order to achieve this goal; • strengthen the barriers established by the program against accidents "which imply the
nucleus of Safe Behavior program” and deepen them during the follow up activities scheduled after each workshop."

This publication is produced under the auspices of the International Gas Union (IGU) which holds the copywrite. The publication must not be reproduced in whole or in part without the written permission of the IGU. However, irrespective of the above, established journals or periodicals shall be permitted to reproduce this publication, or part of it, abbreviated or edited form, provided that credit is given to IGU. This document contains strictly technical information to be distributed during the 27th World Gas Conference in Washington DC, USA, and has no commercial intent.
94
A program unique of its kind
Its only target is the security through human behavior. This is a long-term program extending over a long period. This program involves the contribution of everyone in the organization, without any exception, even the subsidiaries staff.
The program is divided in three phases • Activities prior to the workshop such as an introductory seminar for managers to inform them
about the program, who will be due to dispatch them to their respective staffs; • Preliminary meetings held on industrial sites with employees to introduce them to the concept
of "Barriers against accidents”; • The workshop itself. It is a two-day workshop held every week for a group of 300 participants.
Different themes are approached in the workshop:
• The situation point in Sonatrach / HSE challenges. The tragic consequences of serious accidents;
• Direct and indirect accident causes; • Why do accidents happen? • Barriers against accidents.
A variety of media is used to during the workshop like movies, testimonials, live presentations and participation in a competition.
The Barriers against Accidents
The concept of barriers lies, in the scope of the program, in the mental barriers, along with the behavior and the thinking out prior and during work. Barriers are the measures taken daily to prevent accidents. The Safe Behavior Program mainly focuses on the following five barriers:
1. First priority: Never hesitate, in case of clash between security and other important elements, to postpone your tasks until security is insured.
"Safety first, safety first, safety first" 2. Compliance: Each of you must know and respect the rules and requirements that apply to
specific work situations he/she is confronted to. "Respect, respect, respect"
3. Open Dialogue: Opt for an open faithful dialogue to raise, with no second thought, the security issues with your superiors and colleagues. However, personal problems have to be covered that can result in a hazardous work.
"Communicate, communicate, communicate"

This publication is produced under the auspices of the International Gas Union (IGU) which holds the copywrite. The publication must not be reproduced in whole or in part without the written permission of the IGU. However, irrespective of the above, established journals or periodicals shall be permitted to reproduce this publication, or part of it, abbreviated or edited form, provided that credit is given to IGU. This document contains strictly technical information to be distributed during the 27th World Gas Conference in Washington DC, USA, and has no commercial intent.
95
4. Risk Continuous Assessment: It requires only a minute of your time before you start a task. Ask yourself this question: is still there a risk to eliminate? Otherwise, go on assessing the risk during the conduct of the task work.
"vigilance, vigilance, vigilance” 5. No to indifference: If a workmate is making a mistake that is likely to create a risk, you
must intervene to correct it. Your initiative is often the last barrier for him/her to avoid an accident.
"Intervene, Intervene, Intervene”
What will happen after the workshop?
Compliance: A barrier to deepen - During the first twelve months after the workshop, the program will primarily focus, on compliance with the rules and procedures.
This barrier has been chosen following the report on site where people ignore rules, thus, preferring using shortcuts and settling their own working practices.
Nearly 70% of accidents worldwide are due to non-compliance with the rules.
Follow-up and Coaching; Keys to success - Local management groups will be installed in each structure, at the level of departments and services. The groups will serve as source and main guide for the program. Each group will consist of a unit director, an HSE Coordinator and a safety representative.
The Safe Behavior program project will make at the disposal of these local groups a scheduled program and the necessary equipment to its implementation and its follow-up.
Change behavior: Will creates effort, effort makes the change - The change of the strongly anchored habits is not easy. All experiments have proven that this takes time. Therefore, the Safe Behavior Program is a long-term commitment. A program devoted to follow-up activities, will be implemented in each site.
Study Case Worker Health and Safety Commitment Initiative
Gas Natural Fenosa started this initiative in 2012 driven by a true commitment to his stakeholders
and focused on four (4) guidelines: leadership, employees, business partners, assets and processes.
This task cannot be achieved without a deep cultural transformation that assures a long-lasting
endeavor. It is important to consider the different countries and the many idiosyncrasies involved in
Latin America.
Throughout these four challenging years, results have proved that it was worth the effort. In Latin America, accident levels (Frequency Index FI) for our employees have decreased dramatically and within our business partners’ personnel significantly.
Proudly, we can say that GNF had turned from a highly relied on supervision company to be transformed into an independent one (characterized by strong individual awareness). Nevertheless,

This publication is produced under the auspices of the International Gas Union (IGU) which holds the copywrite. The publication must not be reproduced in whole or in part without the written permission of the IGU. However, irrespective of the above, established journals or periodicals shall be permitted to reproduce this publication, or part of it, abbreviated or edited form, provided that credit is given to IGU. This document contains strictly technical information to be distributed during the 27th World Gas Conference in Washington DC, USA, and has no commercial intent.
96
there is still one more step to take, our goal is to become an interdependent company which transcends individual commitment and inspires team awareness (take care of yourself as much as you take care of your colleagues).
A key aspect has been our leaders’ involvement, pushing them to become true examples in safety responsibility for their teams by making field inspections, periodic safety briefings, and being in charge of transmitting our policies to business partners.
Our employees are encouraged to develop every year a Personal Action Plan (PAP) in order to take control of their everyday relation with Health and Safety issues. This plan consists of three (3) actions, followed by each leader, that have to be developed throughout the year.
7.4.6. Employee’s experience about Customer Relationship Management
The Gas Distribution System Operator aims to be a key player in the energy transition. In a changing sector, the Gas DSO shall consider all the factors that influence its environment and transform its professions in depth: the evolution of standards and expectations of more demanding customers in terms of services, the emergence of new technologies and the operational excellence in the realization of their technical activities.
These factors create the motivation behind the evolution of these activities, which the Gas DSO needs to embrace fully through the setup of a new organization, new tools, new challenges, etc. but also and above all the spreading of a true customer culture for the employees and their management.
It’s recommended that Gas DSOs design a "client procedure” for their technicians and managers
For example, to achieve its transformation, the French Distribution System Operator has especially written a "client procedure", co-built with technicians and customers on the basis of their respective expectations and worries.
• The guide book puts into words the ethical values of the company, linked to its Public Service’s mission and respect for people and the individual. Thanks to its co-construction process, it perfectly matches the needs of the teams by bringing them more confidence in their relations with customers. And, by integrating the expectations of the clients, ultimately everyone will benefit from the advantages created by the repository;
• The client procedure has been seen as an aid, helping with customer interactions without being experienced as a constraint (97% of technicians and managers are satisfied and very satisfied with the 12 behaviors that it defines). The client procedure deployment has been underway since March 2016. Technicians who use the repository enjoy using it. It brings a better quality of life at work.
The client procedure will be adapted before the end of the year to be deployed to telemarketers as well as to the company’s suppliers in contact with customers.
It is also recommended to Gas DSO:

This publication is produced under the auspices of the International Gas Union (IGU) which holds the copywrite. The publication must not be reproduced in whole or in part without the written permission of the IGU. However, irrespective of the above, established journals or periodicals shall be permitted to reproduce this publication, or part of it, abbreviated or edited form, provided that credit is given to IGU. This document contains strictly technical information to be distributed during the 27th World Gas Conference in Washington DC, USA, and has no commercial intent.
97
• To organize “safety day” in order to raise awareness customers to gas hazards. This can be done via “special TV show” or near the habitations. This strategy was very successful in raising awareness about the importance of safety in domestic gas utilization.
• To attach great importance to the feedback of experience about incidents and accidents and about good practices.
Figure 7.11: « I expect my gas installation to be repaired following a problem » client procedure
7.5. Operational Excellence supported by Management Systems and Standards for DSOs
Key Insight
• Certification is a starting point; not and end state.
• After certification companies pursue a higher maturity level
• Best performers encourage an internal drive to exceed compliance

This publication is produced under the auspices of the International Gas Union (IGU) which holds the copywrite. The publication must not be reproduced in whole or in part without the written permission of the IGU. However, irrespective of the above, established journals or periodicals shall be permitted to reproduce this publication, or part of it, abbreviated or edited form, provided that credit is given to IGU. This document contains strictly technical information to be distributed during the 27th World Gas Conference in Washington DC, USA, and has no commercial intent.
98
7.5.1 General
Distribution System Operators (DSO) typically rely on, and operate to, a range of technical standards in order to embed good practice within their businesses, particularly in the Design, Operation and Maintenance functions. In different jurisdictions, there are different organizations which support and publish standards relating to the gas distribution network, e.g. ASME, ISO, CEN, AGA, IGEM, DVGW, DNV, AS/NZS, etc.
Depending on the jurisdiction, there are different hierarchies for standards. For example, in Europe standards begin at a national level. For the European gas industry, a large amount of standards have been harmonized from national standards to create common standards (EN) published by a body responsible for standards across the EU, CEN. Higher again are standards that have been harmonized at an EU/International level, e.g. EN ISO.
It is essential to the quality of the outputs as well as the continuing professional development of personnel in DSOs to engage in standards development work relating to their business. This will provide them with invaluable knowledge on the technical changes to the industry and often gives them exposure to best practice approaches from other organizations and jurisdictions through collaborative membership of standards committees.
This work also provides an insight into standards relating to systems, for which there are recognized certifications available at a national and international level.
Distribution System Operators can benefit from different kinds of certification in several ways. The reason to seek for certification can be regulatory compliance or competitive advantage.
The generally accepted types of certification are:
1. Product certification, for instance for tools and components; 2. Process certification concerning an activity (like Lean 6 Sigma); 3. System certification like ISO 9001, OHSAS 18001, ISO 55000, DVGW G1000, concerning an
organization; 4. Professional certification which makes a person competent and qualified for a job, for example
EUR ING, C Eng, C IGEM, etc; 5. Competency Certification or Ticketing, achieving and maintaining a recognized industry
competency like ISO17024 “Conformity assessment - General requirements for bodies operating certification of persons”.
We gathered information among members of the IGU DC study groups and received information from 13 countries. Every respondent declared that they are directly involved in the development of standards and specifications in the gas distribution industry and 2/3 of the respondents regards this work part of the minimum role requirements within their organization. Taking in consideration the types of certification as mentioned above it is clear that process and system certification gets the

This publication is produced under the auspices of the International Gas Union (IGU) which holds the copywrite. The publication must not be reproduced in whole or in part without the written permission of the IGU. However, irrespective of the above, established journals or periodicals shall be permitted to reproduce this publication, or part of it, abbreviated or edited form, provided that credit is given to IGU. This document contains strictly technical information to be distributed during the 27th World Gas Conference in Washington DC, USA, and has no commercial intent.
99
most attention nowadays. Certification regarding tools, components, competence and professionally are likely more mature and already “business as usual” in the industry.
In literature the study group recognized 26 sorts and types of system and process standards and certifications. The respondents were asked if they used this kind of standard, if it was mandatory by law or regulation and if this lead to certification based on that standard. Every respondent is managing at least one kind of process or system certification. ISO 9001(Quality) and 14001 (Environmental) are widely used (85%) followed by OHSAS 18001 (Safety) and Lean Six Sigma (process and customer satisfaction). The result of the questionnaire is shown in the figure below. Some countries indicate more use of the 26 methodologies than others. The Netherlands (23 out of 26), Belgium (20) and Japan (18) score very high compared with other countries.
Some other remarkable observations are:
o It seems that PAS55 is no longer the appropriate standard for Asset Management. In the short time of its existence (introduced in 2014) the respondents make more use of ISO55000.
o In none of the responding countries it is mandatory to be certified for standards like ISO14001 or OHSAS18001 while these methodologies are widely used. In general, it looks that mandatory regulations it not the primarily driver for companies to work on structural improvement. It could be that regulatory bodies let companies free on how to prove that safety and quality are well arranged.
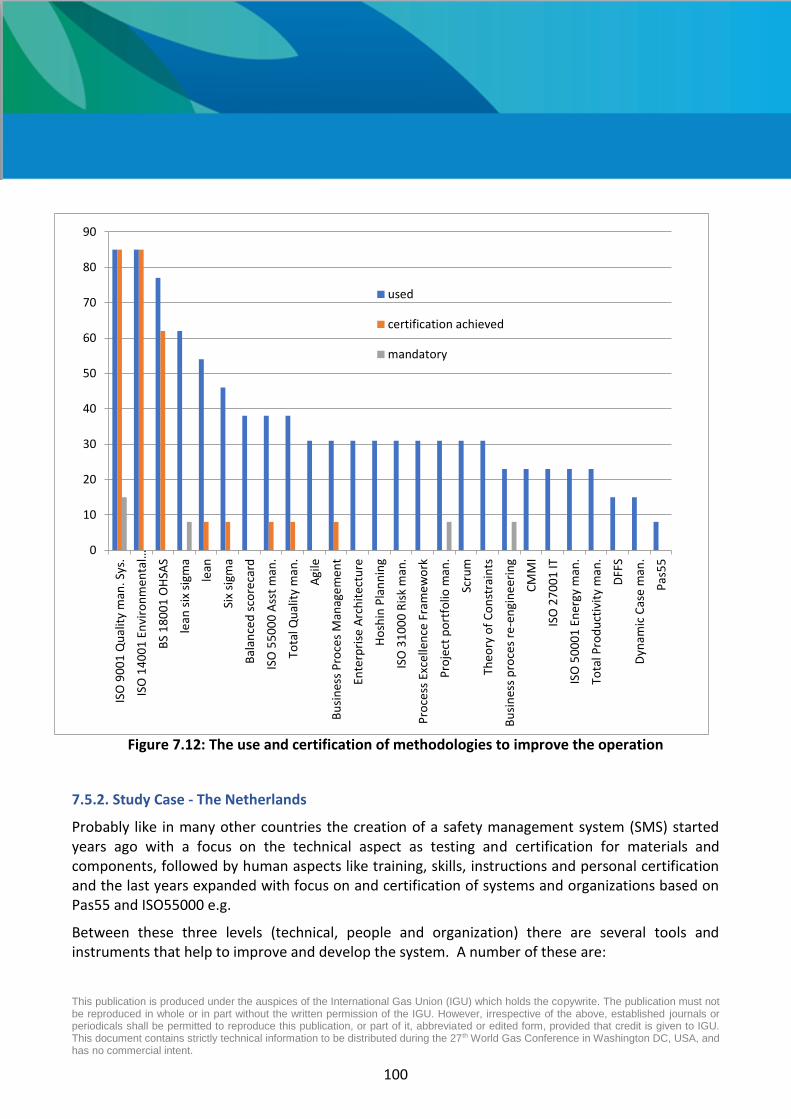
This publication is produced under the auspices of the International Gas Union (IGU) which holds the copywrite. The publication must not be reproduced in whole or in part without the written permission of the IGU. However, irrespective of the above, established journals or periodicals shall be permitted to reproduce this publication, or part of it, abbreviated or edited form, provided that credit is given to IGU. This document contains strictly technical information to be distributed during the 27th World Gas Conference in Washington DC, USA, and has no commercial intent.
100
Figure 7.12: The use and certification of methodologies to improve the operation
7.5.2. Study Case - The Netherlands
Probably like in many other countries the creation of a safety management system (SMS) started years ago with a focus on the technical aspect as testing and certification for materials and components, followed by human aspects like training, skills, instructions and personal certification and the last years expanded with focus on and certification of systems and organizations based on Pas55 and ISO55000 e.g.
Between these three levels (technical, people and organization) there are several tools and instruments that help to improve and develop the system. A number of these are:
0
10
20
30
40
50
60
70
80
90
ISO
90
01
Qu
alit
y m
an. S
ys.
ISO
14
00
1 E
nvi
ron
men
tal…
BS
18
00
1 O
HSA
S
lean
six
sig
ma
lean
Six
sigm
a
Bal
ance
d s
core
card
ISO
55
00
0 A
sst
man
.
Tota
l Qu
alit
y m
an.
Agi
le
Bu
sin
ess
Pro
ces
Man
age
me
nt
Ente
rpri
se A
rch
ite
ctu
re
Ho
shin
Pla
nn
ing
ISO
31
00
0 R
isk
man
.
Pro
cess
Exc
elle
nce
Fra
me
wo
rk
Pro
ject
po
rtfo
lio m
an.
Scru
m
The
ory
of
Co
nst
rain
ts
Bu
sin
ess
pro
ces
re-e
ngi
ne
erin
g
CM
MI
ISO
27
00
1 IT
ISO
50
00
1 E
ner
gy m
an.
Tota
l Pro
du
ctiv
ity
man
.
DFF
S
Dyn
amic
Cas
e m
an.
Pas
55
used
certification achieved
mandatory

This publication is produced under the auspices of the International Gas Union (IGU) which holds the copywrite. The publication must not be reproduced in whole or in part without the written permission of the IGU. However, irrespective of the above, established journals or periodicals shall be permitted to reproduce this publication, or part of it, abbreviated or edited form, provided that credit is given to IGU. This document contains strictly technical information to be distributed during the 27th World Gas Conference in Washington DC, USA, and has no commercial intent.
101
• A nationwide uniform agreement on how to register gas related failures and interruption. In this way benchmarking between the DSOs is made possible. It creates opportunities to learn from each other;
• The Dutch gas industry is at the stage of implementing Bow Tie methods to control hazards. A bow tie is a graphical illustration and strong tool to communicate how to reduce the probability and the consequences of and accident. It gives insight whether or not control measures are in place and effective.
Figure 7.13: Development of a safety management system in The Netherlands
7.6. Conclusions and recommendations
• Satisfied and engaged employees take ownership for customer satisfaction;
• Best performing operators embed a safety culture throughout all business decisions and activities/tasks;
• Good cooperation between DSOs, gas associations and safety regulators lead to best practice in Safety Management Systems;
• KPIs add value but require: Constant review to ensure suitability, Appropriate data systems for gathering, analyzing and reporting and Real-time data gathering in the field;

This publication is produced under the auspices of the International Gas Union (IGU) which holds the copywrite. The publication must not be reproduced in whole or in part without the written permission of the IGU. However, irrespective of the above, established journals or periodicals shall be permitted to reproduce this publication, or part of it, abbreviated or edited form, provided that credit is given to IGU. This document contains strictly technical information to be distributed during the 27th World Gas Conference in Washington DC, USA, and has no commercial intent.
102
• Consistent, timely and transparent communication is crucial in the matter of safety and operational excellence;
• Technology can help improving communication with customers speeding up processes and improving safety;
• Harnessing Customer feedback can lead to operational excellence;
• Customer service requires an optimized business model employing key business partners which are an extension of the Customer Care team of the DSO;
• A Single source of Utility mapping with self-service over the web will reduce time and increase ease of access to mapping for authorized third parties;
• Training facilities increasingly use computerized methods like virtual and artificial reality.
• Tools like tablets and other hand-held technology, digital manuals and visuals (YouTube videos) instead of text are more and more available;
• However, implementation was historically slow. There are still opportunities to accelerate implementation;
• The use of simulations, Virtual Reality (VR) and Augmented Reality (AR) will condense experience in a much shorter time;
• Engagement of employees starts with the CEO’s message: “Safety is important, followed by quality and quantity”;
• Besides top down bottom up communication must be supported;
• In a healthy safety culture anyone not only can but also is obligated to stop an unsafe job.
Operational Excellence: doing the job the first time right in the eyes of all stakeholders.

This publication is produced under the auspices of the International Gas Union (IGU) which holds the copywrite. The publication must not be reproduced in whole or in part without the written permission of the IGU. However, irrespective of the above, established journals or periodicals shall be permitted to reproduce this publication, or part of it, abbreviated or edited form, provided that credit is given to IGU. This document contains strictly technical information to be distributed during the 27th World Gas Conference in Washington DC, USA, and has no commercial intent.
103
8. IGU DC Study Group 3 Report. System integration of Gas and other Energies (including green gases)
8.1. Introduction
The work of the study group is the continuation of the theme of the use of alternative gases in the gas system of the future. Previous efforts in 2012-2015 triennium are the output and results of the study group “Diversification of Gas Quality and Non-conventional Sources in a Carbon-free Future”, which was carried out in last triennium aimed at the elaboration of the topic of future gas integration in the energy sector. The working group was looking for the potential use of alternative gases from the perspective of further usage of existing gas infrastructure. The key elements of the study include estimates of the development in the energy sector, especially after the adoption of the measures arising from the conclusions of the COP 21 in 2015, to support climate protection. Finding new ways to complement the greenhouse gas emission reduction scheme has shown some concrete differences in perceptions in the context of clean and green energy across continents. This report summarizes the key directions from a point of view of operating the distribution system, supported by practical examples. The objective is to provide insight on conditions and rules of the gas market that can facilitate in terms of support or, conversely, reluctance to change. The outputs of the study group's task were to prepare a suitable platform for the promotion of gas-based renewable energy sources in conjunction with supporting the future development of gas infrastructure. Another focus was to persuade energy groups and politicians about the benefits of molecular (gas based) and electronics (power grid) partnerships in terms of climate protection. The study was strictly focused on the operation of the distribution system together with supporting specific examples from individual countries.
8.2. SCOPE OF THE STUDY GROUP REPORT BACKGROUND AND PURPOSE („storyline“)
COP21 with the Paris Agreement followed by COP22 and COP 23 set strong ambitions on controlling the emission of greenhouse gases.
We believe, and we will illustrate in this report, that the existing and future gas network can contribute in an important way to realize these goals and creating a viable pathway towards to achieve them.
Also, even when GHG emissions are considered to be of less importance and urgency, natural gas, ‘green’ gas and the corresponding infrastructure have unique properties allowing them to play a major role in the energy system of modern societies.

This publication is produced under the auspices of the International Gas Union (IGU) which holds the copywrite. The publication must not be reproduced in whole or in part without the written permission of the IGU. However, irrespective of the above, established journals or periodicals shall be permitted to reproduce this publication, or part of it, abbreviated or edited form, provided that credit is given to IGU. This document contains strictly technical information to be distributed during the 27th World Gas Conference in Washington DC, USA, and has no commercial intent.
104
This trend towards an increasing use of gas and gas infrastructure is part of a long-term evolution and also an important link in the transition to a decarbonized energy system.
Gas and the gas infrastructure offer several benefits for any future energy system. The major benefits are summarized below and will be addressed in more detail in the report.
Table 8.1 Summary of the role of gas and gas infrastructure in a low carbon energy system
Benefits of using gas and gas infrastructure in a low carbon energy system
Relative low costs, long term storage of energy options available
Relief for the electrical transport/distribution system (flexibility)
The conventional gas remains available as backup
Enabling smooth transition at an adjustable pace
Use of existing infrastructure (no sunk costs)
Compatible with mobility demand (heavy transport, ships)
Other ad hoc opportunities (e.g. cogeneration)
Entering in a global environmental approach, including waste treatment, recycling, urban management, smart cities
These benefits can be taken as the drivers towards the system integration of gas with other parts of the energy system. As such, those drivers are not all of equal importance for the various regions of the world. It depends on societal priorities and pressures if those benefits are acted upon, how fast and to which extent.
Associated with the realization of these benefits are several challenges. The institutional, political and societal challenges are outside the scope of this report; they are discussed at the IGU strategic level.
Sustainability committee (PGCA) exchange results
Within the areas discussed with the Sustainability Task Force, the sections on distribution and general sustainability rules were jointly defined below (Table 8.2).

This publication is produced under the auspices of the International Gas Union (IGU) which holds the copywrite. The publication must not be reproduced in whole or in part without the written permission of the IGU. However, irrespective of the above, established journals or periodicals shall be permitted to reproduce this publication, or part of it, abbreviated or edited form, provided that credit is given to IGU. This document contains strictly technical information to be distributed during the 27th World Gas Conference in Washington DC, USA, and has no commercial intent.
105
Table 8.2 Distribution and Sustainability points of interest
Distribution perspective
Technical feasibility today and in short term technical adaptations possibility
Technical barriers – R&D orientations – gas quality topics
Changes in DSO network, organization and skills
Collecting information to monitor and control a future system from the
DSO customer´s interests
Investments and preparing the changes in the infrastructure
Technical coordination with other partners or industries
Sustainability perspective
Customer point of view
Position in energy landscape
Relationship with stakeholders (policy makers, regulators, society, etc.)
Long term 2050 vision according to UNO sustainable development goals
Analysis of society needs
Social acceptance and image of changes in energy
However, there are also technical challenges to be addressed. This report focuses on the technical challenges of the integration of gas and renewable in the future energy system, and how the challenges are tackled and solved in the various parts of the world.

This publication is produced under the auspices of the International Gas Union (IGU) which holds the copywrite. The publication must not be reproduced in whole or in part without the written permission of the IGU. However, irrespective of the above, established journals or periodicals shall be permitted to reproduce this publication, or part of it, abbreviated or edited form, provided that credit is given to IGU. This document contains strictly technical information to be distributed during the 27th World Gas Conference in Washington DC, USA, and has no commercial intent.
106
Table 8.3 Challenges for the gas network
Challenges of injection of ‘green’ gas into the gas network
Maintaining the existing high standard of safety
Maintaining the existing high standard of reliability and availability
Demonstrating the adequacy of the gas network for ‘green’ gases (life time and life cycle cost) and decentralized production
Creating affordable conversion technologies (P2G, methane reforming, biomethanization)
Creating affordable gas quality measurement devices
Improving existing conversion technologies (digesters, gasification, methanation)
Preparing the network and end user equipment for larger variations of gas quality (H2, gas mixtures)
Creating decentralized, local producer / consumer markets avoiding or postponing the construction of long distance transmission infrastructures
Providing adequate solutions for sensitive end consumers (mobility market)
In table 8.3, major technical challenges for use of ‘green’ gas are summarized in abstract terms. They can and must be translated into more specific tasks, to be handled and addressed in specific projects and by specific actors like DSO, TSO, government, regulators, gas associations.
Other, more general integration aspects are the overall coordination of the gas supply network with the networks for electrical power, heat and fuels for mobility. This concerns the planning (commissioning, decommissioning), interoperability (energy conversion) and market issues (billing and reconciliation). Arguably, these more general aspects need to be taken into account when incorporating ‘green’ gases into the energy system. As such, the task of integration of green gases is a good and sufficient example applicable to the other or generic aspects of the integration.
We may separate the specific technical challenges into short term, immediate and long-term issues. We include in the short time issues also the typical on-going technical innovation as required for any existing and competing industry. This provides us with a kind of road map. See e.g. “Policy recommendation” in the Eurogas/Marcogaz Report.

This publication is produced under the auspices of the International Gas Union (IGU) which holds the copywrite. The publication must not be reproduced in whole or in part without the written permission of the IGU. However, irrespective of the above, established journals or periodicals shall be permitted to reproduce this publication, or part of it, abbreviated or edited form, provided that credit is given to IGU. This document contains strictly technical information to be distributed during the 27th World Gas Conference in Washington DC, USA, and has no commercial intent.
107
Table 8.4 Some specific technical challenges when integrating green gases into the complete energy system
Short term challenges (typical) Long term challenges (typical)
Harmonization of gas quality Development of affordable, fast response P2G conversion techniques
Proof of resilience of materials and constructions
Development of affordable, safe and accepted local gas storage techniques
Suitable operating, billing and measuring techniques for bidirectional distribution and transport
Creation of ICT solutions (hardware and software) for establishing decentralized, integrated local producer/consumer markets
Prototyping and demonstration of modern gas appliances (burners, G2P) self-adjusting to a wide range of gas quality
Development of enabling, coordination techniques for decentralized, local energy storage facilities as part of existing grids
Cost reduction of infrastructure by cheaper construction techniques for green gases production and injection
Improvement of efficient and affordable decentralized technologies for producing electricity and /or heat from gas such as adsorption heat pump technologies, micro- CHP and fuel cells
Cost reduction of infrastructure by more accurate lifetime prediction
Full integration of the hydrogen chain into the gas system (production, storage, distribution, utilization, consumption)
Integration of green gases can be introduced progressively following different approaches according to local situation. It can be enhanced by several factors:
▪ Important sources of feedstock (waste, renewables, etc.) to produce green gases; ▪ The sufficient availability of gas networks for the connection between green gas plants and end
users; ▪ Availability of energy from renewable sources at competitive prices at the local level; ▪ Key users accepting specific gas qualities (CNG, industrial use, heat production, etc.).
8.3. Worldwide situation of integration of green gases
The study group has taken into account some examples illustrating the situation in various parts in world. For better understanding, the main attributes of each situation are sorted according to the topics as mentioned in the headings in the tables below
8.3.1 Public objectives

This publication is produced under the auspices of the International Gas Union (IGU) which holds the copywrite. The publication must not be reproduced in whole or in part without the written permission of the IGU. However, irrespective of the above, established journals or periodicals shall be permitted to reproduce this publication, or part of it, abbreviated or edited form, provided that credit is given to IGU. This document contains strictly technical information to be distributed during the 27th World Gas Conference in Washington DC, USA, and has no commercial intent.
108
Country/Group of countries
Key features
USA • Government oversight on biomethane injection into gas grids is a combination of federal and state policies.
• Individual state energy authorities have jurisdiction on DSOs operating within each US state leading to significant differences in biomethane policies, regulation and incentives.
• As a country, the United States does not have a single uniform policy with regard to biomethane as a viable energy renewable option, particularly in the face of inexpensive domestic shale gas.
• In 2014, the federal government modified the regulatory classification of biomethane for renewable transportation fuels. This new classification stipulates that CNG and LNG transportation fuels derived from biomethane benefit from cellulosic biofuel and advanced biofuel classification under the Renewable Fuel Standard (RFS ). The RFS has incentivized investments in CNG and LNG produced from biomethane. In 2018, the Renewable Natural Gas Coalition (industry association) reported that in the USA there are approximately 55 plants producing LNG or CNG from biomethane.
• California has an additional program supporting biomethane produced CNG and LNG for transportation. The Low Carbon Fuel Standard (LFCS) grants LCFS credits for CNG & LNG produced from biomethane from specific derived feedstocks.
Canada • The Canadian Gas Association (CGA) reports that in 2016 there were seven biomethane gas grid injection facilities operating in the provinces of Quebec, Ontario and British Columbia.
• CGA estimated the total quantity of biomethane being produced in Canada was equal to the annual natural gas demand of approximately 51,000 homes.
Japan • The number of sites injecting bio gas into the gas grid has not increased because the bio gas is mainly used for the power generation.
• Hydrogen production projects from renewable energy are operating in Japan. However, these projects are not related to the gas market.
Korea • Biogas generation and upgrading technology is being tested for commercial operation in Korea.
• Biogas from landfill gas is used for vehicles or power generation after the upgrading process.

This publication is produced under the auspices of the International Gas Union (IGU) which holds the copywrite. The publication must not be reproduced in whole or in part without the written permission of the IGU. However, irrespective of the above, established journals or periodicals shall be permitted to reproduce this publication, or part of it, abbreviated or edited form, provided that credit is given to IGU. This document contains strictly technical information to be distributed during the 27th World Gas Conference in Washington DC, USA, and has no commercial intent.
109
Country/Group of countries
Key features
• The number of biogas plants and upgrading facilities is gradually increasing.
Australia • Energy policy recognition has emerged in the last 18 months in Australia of the importance of a diverse energy system, if Australia is to achieve carbon neutrality. Policy makers have acknowledged that PV, wind and battery storage will not deliver reliable and affordable energy alone.
• Energy Networks Australia early in 2017 released its Gas Vision 2050 highlighting the role the gas distribution system can play in providing low or zero carbon gas and act as a buffer to support the electricity system, through the injection and blending of hydrogen and bio-methane.
• The Australian Renewable Energy Agency (ARENA) is funding studies into Power to Gas (P2G) and bioenergy sources and economics across Australia.
• State Governments of South Australia (SA), Victoria (Vic) and New South Wales (NSW) are supporting investigations into opportunities of hydrogen supply and export.
• While there are some existing regulatory and standards impediments to the introduction of hydrogen into the natural gas supply system there is a willingness to provide exemptions for the implementation of trials.
SA recently has released a Hydrogen Roadmap setting out its support and targets for establishing a domestic and export hydrogen industry. (https://service.sa.gov.au/cdn/ourenergyplan/assets/hydrogen-roadmap-8-sept-2017.pdf).
France • Biomethane injection in gas grids has been approved in 2011 with, in particular, the acceptance of health authorities.
• Biomethane plants with injection in gas grids are being promoted by the French Environment agency from 2014.
• Injection and uses of green gases such as H2 are being tested through demonstration programs with the support of public authorities.
Germany Current situation concerning Biogas and Biomethane:
• The by far largest share of the produced raw-biogas is used for generation of power (CHPs located near the digesters). This is done by 8.800 plants which consume 72 TWh/a of raw biogas and earn feed-in-tariffs for the electricity fixed by law.
• Only 8,4 TWh/a are injected into gas grids as biomethane by 190 plants.

This publication is produced under the auspices of the International Gas Union (IGU) which holds the copywrite. The publication must not be reproduced in whole or in part without the written permission of the IGU. However, irrespective of the above, established journals or periodicals shall be permitted to reproduce this publication, or part of it, abbreviated or edited form, provided that credit is given to IGU. This document contains strictly technical information to be distributed during the 27th World Gas Conference in Washington DC, USA, and has no commercial intent.
110
Country/Group of countries
Key features
• Regarding a biomethane plant, the digester and the plant for extraction of CO2 is owned and operated by the biomethane-producer (non-regulated business). The plant necessary for conditioning of biomethane (adaption of Wobbe-index and calorific value) to the local conditions of the natural gas belongs to the regulated business and is operated by the DSO. The cost caused by this are passed by the network operator to all gas customers.
• Biomethane has priority dispatch against natural gas concerning injection into public gas grids.
• There are no feed-in-tariffs fixed by law for injection of biomethane – the operator of a biomethane injection plant has to conclude a bilateral contract with a consumer of the biomethane. Normally the consumer is the operator of a CHP (located somewhere else), which earns feed-in tariffs for the production of “green electricity”. Because these tariffs are decreasing in recent years, the margins over the whole chain (production of biomethane, transport and conversion into green electricity) have diminished. This has led to a more or less overall termination of the expansion of the number biomethane injection plants (nearly no new plants were built in the last years).
• The usage of biomethane by customers in the heating market or in the mobility sector (CNG-cars) is negligible .
• In the past there were political targets (non-binding) for the development of biomethane-injection. These targets do not exist anymore.
• Due to several reasons there is a lack of public acceptance for the usage of biogas and biomethane.
Current situation concerning Hydrogen and SNG:
• Hydrogen / SNG: Currently there are 32 plants in operation. Most of them are run in pilot- or demonstration projects, less than 5 (estimated) are used for commercial purposes. The installed capacity for electrolysis is mostly under 1 MW, some bigger plants exist.
• The commercially run plants produce green gas, which is normally offered as a share of natural gas a customer purchases (“partially green gas products”). Since production costs cannot, by far, compete with natural gas, the customers have to be willing to pay a higher cost.
• The key problem concerning unrealizable economics is the obligation to pay so-called “end customers fees” when purchasing electricity for the electrolytic production of hydrogen. This obligation hinders the

This publication is produced under the auspices of the International Gas Union (IGU) which holds the copywrite. The publication must not be reproduced in whole or in part without the written permission of the IGU. However, irrespective of the above, established journals or periodicals shall be permitted to reproduce this publication, or part of it, abbreviated or edited form, provided that credit is given to IGU. This document contains strictly technical information to be distributed during the 27th World Gas Conference in Washington DC, USA, and has no commercial intent.
111
Country/Group of countries
Key features
competitiveness of hydrogen / SNG independent of the CAPEX of the production plants (electrolyze, methanation).
• There are no political targets for the development of hydrogen- / SNG-production and injection into natural gas grid. Furthermore, there is no market for provision of storage services for green electricity, which could support green gases in order to reach economics in the future. Future perspectives concerning these issues are unclear.
• There are two regional grids existing for many decades used for the transport of pure hydrogen between single industrial sites (producers and consumers of hydrogen). However, this hydrogen is produced by steam reforming and is therefore no “green hydrogen”.
Netherlands • There is agreement on sustainability strategic issues between government, industry and public organizations: Energie Akkoord 2017 (http://www.energieakkoordser.nl/): reduction of energy consumption of 1.5% yearly. 100 PJ reduction in 2020, 14% sustainable produced energy in 2020 and 16% in 2023.
• Many local governments have committed themselves to end the use of natural gas in the build environment in 2035. For costly conversions, the use of biomethane is intended.
• In 2017 approximately 79 GWh = 2.85 PJ of biomethane was injected in the public gas grid, originating from 25 locations. This biomethane was mainly bought by CNG fueling stations. The total amount of biogas produced has been appr. 12 PJ, of which the majority has been used for the cogeneration of electricity.
• The aim of the Dutch biomethane sector is to produce 90 PJ of biomethane in 2030, adding up to 10% of domestic consumption of gas.
Italy • The Italian Ministry of Industry, Ministry of Environment and Sea, Ministry of Agriculture Act 05, Dec, 2013 regulates the biomethane use for transportation, power/heat generation and to inject in the TSO/DSO. natural gas grids with the national incentive schemes for biomethane
• The National Regulation Authority (NRA) provide the responsibilities of grid operators, the quality and technical specification, the rules to access the grids, the TSOs and DSOs tariff the biomethane flow metering and meter reading.
• The NRA provide the biomethane injected allocation rules.

This publication is produced under the auspices of the International Gas Union (IGU) which holds the copywrite. The publication must not be reproduced in whole or in part without the written permission of the IGU. However, irrespective of the above, established journals or periodicals shall be permitted to reproduce this publication, or part of it, abbreviated or edited form, provided that credit is given to IGU. This document contains strictly technical information to be distributed during the 27th World Gas Conference in Washington DC, USA, and has no commercial intent.
112
Country/Group of countries
Key features
• The TSOs and DSOs provide the upgrading to the Network Codes (technical standard and cost to connect the biomethane plant to own grid).
Algeria • Renewable gas is still not well known and not completely brought under control. An old application was made before gas discovery, from then until now renewable gas plays a very limited role as an energy source.
• In the 50s, some scientists worked on biogas agricultural vehicle, and after that, studies have been made, especially on small scale units for biogas production by the research center on Renewable Energy “CDER”.
• Two kind of biogas production have been experimented at Agronomy National Institute of Algiers.
8.3.2 Main drivers
Country/Group of countries
Key features
USA • California is an example where the state government passed legislation providing monetary incentives to subsidize the costs of utility interconnections to biomethane facilities.
• California has established a biomethane protocol, Rule 30, which stipulates the procedures for pre-interconnection testing and biomethane quality specifications.
• In contrast, in the state of Wisconsin, the public energy authorities have not issued policies on biomethane injection into gas DSO pipelines. This limits diary and agricultural biogas producers from opportunities to upgrade biogas to biomethane for grid injection. In other states, such as New York, authorities have encouraged public/private partnerships to stimulate biomethane injection projects, often part of larger projects to avert methane emissions from solid and liquid waste.
• California introduced a Biogas Conditioning/Upgrading Services Tariff, known as “G-BCUS”. It is an optional tariff service for biogas producers that allows SoCalGas to plan, design, construct, own, operate and maintain biogas conditioning equipment on customer premises, where the biogas is upgraded to natural gas quality specifications for pipeline injection.

This publication is produced under the auspices of the International Gas Union (IGU) which holds the copywrite. The publication must not be reproduced in whole or in part without the written permission of the IGU. However, irrespective of the above, established journals or periodicals shall be permitted to reproduce this publication, or part of it, abbreviated or edited form, provided that credit is given to IGU. This document contains strictly technical information to be distributed during the 27th World Gas Conference in Washington DC, USA, and has no commercial intent.
113
Country/Group of countries
Key features
• New York State has active biomethane injection projects. National Grid (USA) prepared a study titled “Renewable Gas-Vision for a Sustainable Gas Network”. The study describes the potential of renewable gases to meet up to 25% of the natural gas demand (excluding power) in four states in the US North East.
• The Renewable Natural Gas Coalition (RNG Coalition) reports that additional gas utilities with active biomethane interconnection (injection) into their networks are: Southern Company, Puget Sound Energy, DTE Energy and Duke Energy.
• There is progress of biomethane injection policies and some success stories. However, given that there are still many barriers and the requisite support of state and federal governments, the Unites States as a whole represents a promising opportunity, but one that is still struggling to succeed.
Canada • Natural gas utilities are studying measures to support a target of 5 per cent biomethane injection into natural gas pipeline distribution system by 2025 and 10 per cent by 2030.
• Provincial governments have taken an active role in promoting biomethane injection.
• British Columbia: The Vancouver gas utility, FortisBC, offers commercial and domestic customers a voluntary biomethane program. Participants can choose to blend between 5 per cent to 100 per cent biomethane into their gas supply stream. A website calculator simulates the premium paid for biomethane. Currently, approximately 7,000 customers in British Columbia participate in this program.
Japan • Feed in Tariff (FIT) scheme in Japan.
• Bio-methane is mainly used for power generation and the volume of bio-gas injection depends on the FIT scheme.
• The electricity price from bio mass has a price advantage compared with that from PV and wind power.
• Hydrogen is supposed to be used for fuel cell vehicles (FCVs), pure hydrogen directly to fuel cell.
Korea • The law related to green gas is prepared by KGS.
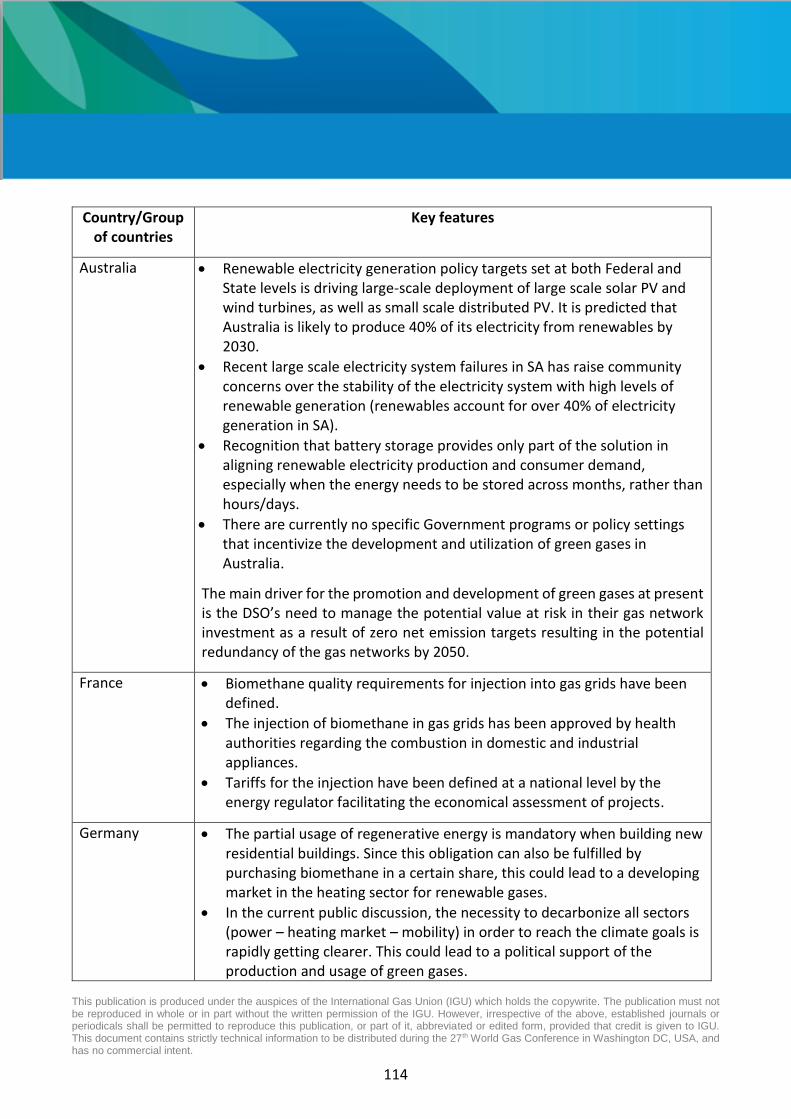
This publication is produced under the auspices of the International Gas Union (IGU) which holds the copywrite. The publication must not be reproduced in whole or in part without the written permission of the IGU. However, irrespective of the above, established journals or periodicals shall be permitted to reproduce this publication, or part of it, abbreviated or edited form, provided that credit is given to IGU. This document contains strictly technical information to be distributed during the 27th World Gas Conference in Washington DC, USA, and has no commercial intent.
114
Country/Group of countries
Key features
Australia • Renewable electricity generation policy targets set at both Federal and State levels is driving large-scale deployment of large scale solar PV and wind turbines, as well as small scale distributed PV. It is predicted that Australia is likely to produce 40% of its electricity from renewables by 2030.
• Recent large scale electricity system failures in SA has raise community concerns over the stability of the electricity system with high levels of renewable generation (renewables account for over 40% of electricity generation in SA).
• Recognition that battery storage provides only part of the solution in aligning renewable electricity production and consumer demand, especially when the energy needs to be stored across months, rather than hours/days.
• There are currently no specific Government programs or policy settings that incentivize the development and utilization of green gases in Australia.
The main driver for the promotion and development of green gases at present is the DSO’s need to manage the potential value at risk in their gas network investment as a result of zero net emission targets resulting in the potential redundancy of the gas networks by 2050.
France • Biomethane quality requirements for injection into gas grids have been defined.
• The injection of biomethane in gas grids has been approved by health authorities regarding the combustion in domestic and industrial appliances.
• Tariffs for the injection have been defined at a national level by the energy regulator facilitating the economical assessment of projects.
Germany • The partial usage of regenerative energy is mandatory when building new residential buildings. Since this obligation can also be fulfilled by purchasing biomethane in a certain share, this could lead to a developing market in the heating sector for renewable gases.
• In the current public discussion, the necessity to decarbonize all sectors (power – heating market – mobility) in order to reach the climate goals is rapidly getting clearer. This could lead to a political support of the production and usage of green gases.

This publication is produced under the auspices of the International Gas Union (IGU) which holds the copywrite. The publication must not be reproduced in whole or in part without the written permission of the IGU. However, irrespective of the above, established journals or periodicals shall be permitted to reproduce this publication, or part of it, abbreviated or edited form, provided that credit is given to IGU. This document contains strictly technical information to be distributed during the 27th World Gas Conference in Washington DC, USA, and has no commercial intent.
115
Country/Group of countries
Key features
• In Germany already 32% of the entire electricity demand is covered by power generation from regenerative sources. Since the strongly fluctuating sources from photovoltaic and wind energy become more and more dominant, in several years (not in short or midterm), storages for electricity with huge capacities will be necessary in order to provide also a seasonal balance between production and demand. Under current perspectives this storage requirements can only be realized on basis of power to gas (P2G) due to the extreme high and long-term storage capacity offered by this method. This necessity is probably the main driver for a long-term development of hydrogen and SNG, whereby hydrogen and SNG once being produced and injected into the gas infrastructure not necessarily have to be stored but also could immediately be used in the heating market or in the mobility sector (“sector coupling”). However, the probability of a developing market for storage provision that would lead to an economical usage of hydrogen and SNG seems to be quite low in the next decade.
• There are a lot of initiatives and associations (BDEW, DVGW, DENA, Energy agency of Northrhine Westphalia) supporting the development of green gases (biomethane, hydrogen, SNG) by addressing convenient messages towards policy makers. However, up to now there is no official and binding roadmap implemented by policy.
Netherlands • Production of the large Dutch gas field (Groningen) is being reduced, due to technical reasons (lower pressure due to depletion) and environmental reasons (earthquakes). The Netherlands is switching from an energy export country to a net importer.
• National legislation of gas quality allows controlled injection of conditioned biomethane (odorized, low H2S, CO2 content etc).
• Production of biomethane is partially and conditionally subsidized, depending on the difference between production cost and fossil fuel price (SDE+).
• Investment in innovative (bio methane conversion) technology is also subsidized (TKI and DEI).
• Energy consumption for heating of households and building is steadily decreasing (1%/year) due to insulation programs, strict building rules and introduction of heat pump and solar panels.

This publication is produced under the auspices of the International Gas Union (IGU) which holds the copywrite. The publication must not be reproduced in whole or in part without the written permission of the IGU. However, irrespective of the above, established journals or periodicals shall be permitted to reproduce this publication, or part of it, abbreviated or edited form, provided that credit is given to IGU. This document contains strictly technical information to be distributed during the 27th World Gas Conference in Washington DC, USA, and has no commercial intent.
116
Country/Group of countries
Key features
• Demand for biomethane is increasing both from industry and the transport sector.
• In a future carbon neutral energy system biomethane is seen as an important source for high thermal processes.
Algeria • Due to the environment ministry decisions and even if it is not included in Algerian renewable energy program, biogas can be regarded as a promising field.
• According to the actual state, the most interesting renewable gas fields remain from landfills and waste water treatment plants.

This publication is produced under the auspices of the International Gas Union (IGU) which holds the copywrite. The publication must not be reproduced in whole or in part without the written permission of the IGU. However, irrespective of the above, established journals or periodicals shall be permitted to reproduce this publication, or part of it, abbreviated or edited form, provided that credit is given to IGU. This document contains strictly technical information to be distributed during the 27th World Gas Conference in Washington DC, USA, and has no commercial intent.
117
8.3.3. Sources of green gases
Country/Group of countries
Key features
USA • The RNG Coalition publishes statistics on US biomethane production, feedstock sources and the end-uses of the produced biomethane. This organization reports that in 2018 there were approximately 70 active biomethane plants. Approximately 70% of the plants produce biomethane from landfills, 17% from anaerobic digestions and the remaining 13% from wastewater or miscellaneous sources. The majority of the biomethane is to produce CNG and LNG as renewable transportation fuels. There are some plants producing low carbon electricity and renewable heat.
• Each day, Fresh Kills in New York harvests nearly eight million cubic feet (226,000 cubic meters) of landfill gas using a network of wellheads. It is processed on site at the Landfill Gas Purification Plant. And then the city sells the resulting four million cubic feet (113,000 cubic meters) of refined, “pipeline-quality” gas to the local utility, National Grid, for distribution to residential and commercial customers throughout Staten Island.
• In California, as small-scale hydrogen injection project is underway, however, the hydrogen is not solely produced from renewable solar or wind energy. Instead, the objective is limited to evaluate hydrogen injection parameters for pipelines that may result from future renewable power-to-gas projects.
Canada • Biogas generated from wastewater treatment. It is upgraded to biomethane and injected into the Union Gas (Enbridge) distribution system.
• Regarding renewable hydrogen, Enbridge announced a 2MW wind power to hydrogen project in Ontario, which will be first power-to-gas project in Canada. Plans for hydrogen injection into the Enbridge pipeline grid form part of the project.
Japan • Pure hydrogen is transported and utilized as liquefied hydrogen or other chemicals to the hydrogen refueling stations or some hydrogen power generation facilities.
• Hydrogen produced from renewable energy abroad is imported to Japan as energy carrier.
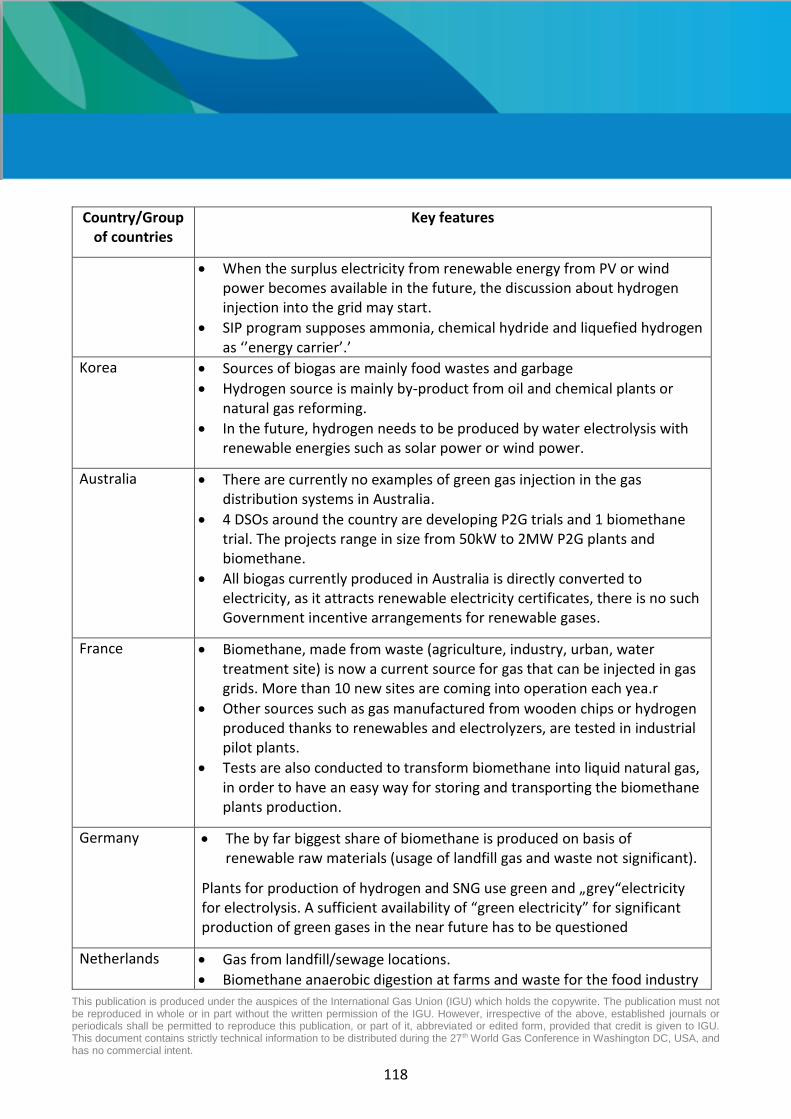
This publication is produced under the auspices of the International Gas Union (IGU) which holds the copywrite. The publication must not be reproduced in whole or in part without the written permission of the IGU. However, irrespective of the above, established journals or periodicals shall be permitted to reproduce this publication, or part of it, abbreviated or edited form, provided that credit is given to IGU. This document contains strictly technical information to be distributed during the 27th World Gas Conference in Washington DC, USA, and has no commercial intent.
118
Country/Group of countries
Key features
• When the surplus electricity from renewable energy from PV or wind power becomes available in the future, the discussion about hydrogen injection into the grid may start.
• SIP program supposes ammonia, chemical hydride and liquefied hydrogen as ‘’energy carrier’.’
Korea • Sources of biogas are mainly food wastes and garbage
• Hydrogen source is mainly by-product from oil and chemical plants or natural gas reforming.
• In the future, hydrogen needs to be produced by water electrolysis with renewable energies such as solar power or wind power.
Australia • There are currently no examples of green gas injection in the gas distribution systems in Australia.
• 4 DSOs around the country are developing P2G trials and 1 biomethane trial. The projects range in size from 50kW to 2MW P2G plants and biomethane.
• All biogas currently produced in Australia is directly converted to electricity, as it attracts renewable electricity certificates, there is no such Government incentive arrangements for renewable gases.
France • Biomethane, made from waste (agriculture, industry, urban, water treatment site) is now a current source for gas that can be injected in gas grids. More than 10 new sites are coming into operation each yea.r
• Other sources such as gas manufactured from wooden chips or hydrogen produced thanks to renewables and electrolyzers, are tested in industrial pilot plants.
• Tests are also conducted to transform biomethane into liquid natural gas, in order to have an easy way for storing and transporting the biomethane plants production.
Germany • The by far biggest share of biomethane is produced on basis of renewable raw materials (usage of landfill gas and waste not significant).
Plants for production of hydrogen and SNG use green and „grey“electricity for electrolysis. A sufficient availability of “green electricity” for significant production of green gases in the near future has to be questioned
Netherlands • Gas from landfill/sewage locations.
• Biomethane anaerobic digestion at farms and waste for the food industry

This publication is produced under the auspices of the International Gas Union (IGU) which holds the copywrite. The publication must not be reproduced in whole or in part without the written permission of the IGU. However, irrespective of the above, established journals or periodicals shall be permitted to reproduce this publication, or part of it, abbreviated or edited form, provided that credit is given to IGU. This document contains strictly technical information to be distributed during the 27th World Gas Conference in Washington DC, USA, and has no commercial intent.
119
Country/Group of countries
Key features
• Small amount of biomethane produced from waste water treatment.
• Some small demonstration plants hydrogen electrolysis.
Italy • Only the biomethane produced with agricultural, agro-industrial and domestic waste is allowed to be injected into NG grids.
• The DSO has to:
o Safeguard the safety and technical efficiency of own network management;
o Define the biomethane quality specifications, identify the maximum and minimum pressure value and the point of entry after verifying the compatibility of the network load profile;
o Ensure biomethane odorization; o Ensure that the injected biomethane is compatible with the technical
specifications. In case of incompatibility it can be refused connection to the network;
o Proceed to immediate interruption of biomethane flow if not compliant with quality standard.
• The biomethane producer has to ensure: o The compliance of the injected biomethane with the quality
specifications and the pressure or capacity restrictions; o The biomethane can be odorized and its features do not nullify or cover the effect of odorant substances admitted.
Algeria • Biogas is either produced naturally in landfills or obtained by digestion from waste water treatment plant.
• Dried biomass is already used, so the priority goes to the biogas from digestion more than from gasification. Due mainly to its competitiveness with food crops, biofuel from energy crops has not been taken into account.
• Biogas from cattle waste - The biogas used by the vehicle came from anaerobic digestion of cattle waste.
• Biogas from straw - To make an energetic food for cattle, products are breathed on straw in an enclosed space. This technique produces biogas.

This publication is produced under the auspices of the International Gas Union (IGU) which holds the copywrite. The publication must not be reproduced in whole or in part without the written permission of the IGU. However, irrespective of the above, established journals or periodicals shall be permitted to reproduce this publication, or part of it, abbreviated or edited form, provided that credit is given to IGU. This document contains strictly technical information to be distributed during the 27th World Gas Conference in Washington DC, USA, and has no commercial intent.
120
8.3.4 Gas infrastructure impact (TSO/DSO)
Country/Group of countries
Key features
USA • Direct injection of renewable gas into DSO gas grids has been limited to a small number of projects.
• Pipeline quality biomethane is often referred to as “renewable natural gas”, or RNG.
The RNG Coalition indicates that approximately 2/3 of the existing biomethane plants inject (interconnect) into pipelines (common carrier, gas utility or customer owned systems) while the rest is used to produce onsite CNG, LNG or renewable heat / electricity.
• Selected gas DSOs have introduced programs to facilitate biomethane injection. Notably, SoCalGas in California introduced a Biogas Conditioning/Upgrading Services Tariff, known as “G-BCUS”.
• Point Loma Waste Water Treatment Plant located in San Diego is a biomethane plant operating in California injecting gas into the pipeline system.
Canada • Ontario Energy Board will establish a regulatory framework to include biomethane, often referred to in Canada as “renewable natural gas” (RNG).
Japan • Hydrogen injection into the gas grid not discussed at all because there may be a negative influence on the gas appliance and the gas business act strictly limit the calorific value range (pure hydrogen utilization and hydrogen injection is discussed separately).
• Cross-ministerial Strategic Innovation Promotion Program program (SIP) is being promoted by cabinet office, government of Japan with the aim of developing the energy carrier which enable to produce, transport and storage hydrogen efficiently.
Korea • A demonstration of biogas injection was carried out. However, the commercialization of biogas isn’t realized because the regulation isn’t still prepared.
Australia • DSOs and TSOs have establish a research program under the Australian Pipelines Co-operative Research Centre (CRC) to review and resolve

This publication is produced under the auspices of the International Gas Union (IGU) which holds the copywrite. The publication must not be reproduced in whole or in part without the written permission of the IGU. However, irrespective of the above, established journals or periodicals shall be permitted to reproduce this publication, or part of it, abbreviated or edited form, provided that credit is given to IGU. This document contains strictly technical information to be distributed during the 27th World Gas Conference in Washington DC, USA, and has no commercial intent.
121
Country/Group of countries
Key features
technical and regulatory barriers to the introduction of hydrogen and other green gasses into the gas pipeline and network systems .
Below is a summary of the green gas trials being implemented by DSOs in Australia.
France • Tests are conducted to determine if changes in the requirements must be adapted to accept injection of green gases such as H2 or for particular uses such as CNG.
• Software used for the design and simulation of gas network operations have been adapted to take easily into account the local injection of biomethane.
• Technologies are being developed for monitoring the injection of green gases in existing gas networks and ensuring the odorization issue.
Germany • Biomethane quality requirements for injection into gas grids are defined.
• Admixture of hydrogen into natural gas grids: There is only one generally valid limit (2% in volume when hydrogen-enriched gas is used in CNG-cars). There are many ongoing studies about the future tolerance of gas appliances, which will primarily constrain the admixture, not the infrastructure itself. By now there is no clear perspective, when generally applicable limits can be defined and which tolerances will be possible. However, it is obvious that there is an extreme spread between several appliances concerning the tolerable portion of hydrogen in natural gas - “simple” appliances such as gas cookers or heating devices are quite tolerant (portions of up to 20 vol.-% hydrogen seem to be possible), whereas special appliances normally used for industrial purposes are partially negatively impacted already at minimal portions of hydrogen.
Netherlands • Injected gas quality has to comply with calorific value and quality of the standard gas, so only minor impact on distribution materials and equipment expected.
• Experiments are ongoing for pressure control at distribution level to facilitate the injection of renewables from the multiple (often rural) sources.
• The TSO and DSO’s are working together to pilot solutions for bi-directional flow between their grids. This is done to enlarge the physical market area, especially in summer. One example is the Green Gas Booster in Wijster.

This publication is produced under the auspices of the International Gas Union (IGU) which holds the copywrite. The publication must not be reproduced in whole or in part without the written permission of the IGU. However, irrespective of the above, established journals or periodicals shall be permitted to reproduce this publication, or part of it, abbreviated or edited form, provided that credit is given to IGU. This document contains strictly technical information to be distributed during the 27th World Gas Conference in Washington DC, USA, and has no commercial intent.
122
Country/Group of countries
Key features
• Small scale demonstration projects for distribution of raw bio gas ongoing (e.g. Biogasnetwerk Twente http://www.biogasnetwerktwente.nl/ 6 Mm3/year).
• Prospects of decommissioning gas distribution to households Curtailment of investment plans.
Italy • Injected gas quality has to comply with calorific value and quality of the standard gas, so only minor impact on distribution materials and equipment expected.
• The biomethane must be compatible with natural gas quality specifications.
Algeria • An ambitious renewable energy program 2011 – 2030 has been launched by the energy ministry. The Algerian company of electricity and gas “SONELGAZ” is responsible for the implementation of this program, which began in 2011. It focuses mainly on wind, solar PV and Concentrated Solar Power. Production and use of renewable gas is not a priority under this program.
8.3.5 Market deployment - Biomethane situation
1. FRANCE
Rapid evolution of injection of biomethane on gas networks
Injection of biomethane has increased very quickly since 2011, which was the date of edition of biomethane quality specifications required for the injection in existing gas networks.
Figure 8.1 shows the number of biomethane sites connected to gas grids by 2016 (mainly gas distribution grids, but some are connected with the gas transmission grids. The origin of waste used in these biomethane plants are diverse, which encourages the construction of biomethane plants in a large variety of locations, rural, semi urban or urban. 45 biomethane sites were connected to the grid by end 2017. GRDF promoted the objective of achieving 30% of green gas injected in the distribution network by 2030.
Figure 8.2 shows the origin of waste used in French biomethane plants whose production is injected in gas grids.

This publication is produced under the auspices of the International Gas Union (IGU) which holds the copywrite. The publication must not be reproduced in whole or in part without the written permission of the IGU. However, irrespective of the above, established journals or periodicals shall be permitted to reproduce this publication, or part of it, abbreviated or edited form, provided that credit is given to IGU. This document contains strictly technical information to be distributed during the 27th World Gas Conference in Washington DC, USA, and has no commercial intent.
123
Figure 8.1: Number of biomethane sites connected to gas grids (France) by end 2016
Figure 8.2: Origin of waste used in biomethane plants whose production is injected in gas grids (2016)
The injection was facilitated by the definition of regulated feed in tariffs that can give a strong basis to assess the economic feasibility of new biomethane plants by giving a good visibility to investors and other stakeholders (Figure 8.3).

This publication is produced under the auspices of the International Gas Union (IGU) which holds the copywrite. The publication must not be reproduced in whole or in part without the written permission of the IGU. However, irrespective of the above, established journals or periodicals shall be permitted to reproduce this publication, or part of it, abbreviated or edited form, provided that credit is given to IGU. This document contains strictly technical information to be distributed during the 27th World Gas Conference in Washington DC, USA, and has no commercial intent.
124
Figure 8.3: Biomethane feed-in-tariff according to type of waste (France)
Biomethane is now involved in a regular development process. Feedback from the first operations give the possibility of improving and optimizing the different equipment and procedures involved in the gasification process.
Biomethane production today is about 0,8TWh/y. The objective of GRDF is to reach a level of 90 TWh/y in 2030, ie, 30% of distributed gas (gas distributed by GRDF has been about 290 TWh in 2016, gas consumption in France has been about 420 TWh).
2. THE NETHERLANDS
Figures 8.4 and 8.5 show the present situation in the Netherlands and the potential volume of biogas per type of source. Both graphs are part of the Roadmap Green Gas 2014.

This publication is produced under the auspices of the International Gas Union (IGU) which holds the copywrite. The publication must not be reproduced in whole or in part without the written permission of the IGU. However, irrespective of the above, established journals or periodicals shall be permitted to reproduce this publication, or part of it, abbreviated or edited form, provided that credit is given to IGU. This document contains strictly technical information to be distributed during the 27th World Gas Conference in Washington DC, USA, and has no commercial intent.
125
Figure 8.4: Situation in the Netherlands

This publication is produced under the auspices of the International Gas Union (IGU) which holds the copywrite. The publication must not be reproduced in whole or in part without the written permission of the IGU. However, irrespective of the above, established journals or periodicals shall be permitted to reproduce this publication, or part of it, abbreviated or edited form, provided that credit is given to IGU. This document contains strictly technical information to be distributed during the 27th World Gas Conference in Washington DC, USA, and has no commercial intent.
126
Million m3(n) biomethane (presumably per year)
Number of locations (presumably number of installation sites)
Household-equivalents
Figure 8.5: Biogas potential from digestion (Netherlands)
Source:
http://www.vggp.nl/www.vggp.nl/Home.html
https://www.ecn.nl/publicaties/PdfFetch.aspx?nr=ECN-O--15-058
3. GERMANY
Produced raw-biogas is used for generation of power (CHPs located near the digesters). This is done by 8.800 plants which consume 72 TWh/y of raw biogas and earn feed-in-tariffs for the electricity which is fixed by law (Figure 8.6).

This publication is produced under the auspices of the International Gas Union (IGU) which holds the copywrite. The publication must not be reproduced in whole or in part without the written permission of the IGU. However, irrespective of the above, established journals or periodicals shall be permitted to reproduce this publication, or part of it, abbreviated or edited form, provided that credit is given to IGU. This document contains strictly technical information to be distributed during the 27th World Gas Conference in Washington DC, USA, and has no commercial intent.
127
Figure 8.6: Development of power generation from renewable energy since 1990 (German ministry of the environment 02/2017)
Regarding a biomethane plant, the digester and the plant for extraction of CO2 is owned and operated by the biomethane producer (non-regulated business)
Only 8,4 TWh/y are injected into gas grids as biomethane by 190 plants.
4. ITALY
Figure 8.7 shows the renewable gas potential for Italy in 2050 relate for the various kinds of renewable methane (Organic Municipal Waste [OMW], Agricultural [A] and renewable from gasification or biogenic [G]).
Renewable Energy Law
PV
Biomass
Hydropower
Wind power

This publication is produced under the auspices of the International Gas Union (IGU) which holds the copywrite. The publication must not be reproduced in whole or in part without the written permission of the IGU. However, irrespective of the above, established journals or periodicals shall be permitted to reproduce this publication, or part of it, abbreviated or edited form, provided that credit is given to IGU. This document contains strictly technical information to be distributed during the 27th World Gas Conference in Washington DC, USA, and has no commercial intent.
128
Figure 8.7: Biomethane potential in Italy by 2050
Source: CIB Feb 2017 Report: https://www.consorziobiogas.it/wp-content/uploads/2017/05/LA-BIOGAS-REFINERY-ENG-2017-FINAL.pdf.
The total renewables gas potential (OMW, agriculture, biomass gasification and not biogenic sources can be estimated to 300-350 TWh (these evaluations are under scrutiny and will be addressed ingrate detail in a peer-reviewed study that is currently in preparation).
5. ALGERIA
Biogas from waste water treatment plant Biogas is generated from sludge anaerobic digestion in 3 out of 76 waste water treatment plants under operation in the country. This biogas is used to heat the digester, the remaining is flared. In the waste water treatment plant of Baraki, located in the eastern suburb of Algiers only water is removed from the biogas, which is why often problems happen to the heater.
0
50
100
150
200
250
300
350
400
2015 2020 2025 2030 2040 2050
Biomethane estimation - Italy 2050 (TWh potential)
BIOMETHANE OMW BIOMETHANE A BIOMETANE G TOTAL TWh

This publication is produced under the auspices of the International Gas Union (IGU) which holds the copywrite. The publication must not be reproduced in whole or in part without the written permission of the IGU. However, irrespective of the above, established journals or periodicals shall be permitted to reproduce this publication, or part of it, abbreviated or edited form, provided that credit is given to IGU. This document contains strictly technical information to be distributed during the 27th World Gas Conference in Washington DC, USA, and has no commercial intent.
129
Figure 8.8: Waste water treatment plant Baraki with the digester
In 2010, 60% of waste water is treated in Algiers. The objective is to achieve 80% in the future (le Soir, May 2010). The government imposes water treatment, which is why biogas production from waste water treatment plants could be sufficiently attractive (executive decree #92-100; 1992).
8.3.7 Renewables scenario
View of EUROGAS
‘In 2050, 76% of gas could be renewable’ (Brussels Conference, October 2017) "Power-to-gas is a very energy-intensive process but if you have excess electricity, why not put it to good use?," [© 2017 Eurogas]. “Eurogas have asked E3MLab at the University of Athens to use the PRIMES model in order to do a
scenario study on renewable gas. And they came up with a scenario where, in 2050, there would be
about the same demand for gas as today, but 76% of that gas would be renewable. So that is the
potential they came up with…”
(https://www.euractiv.com/section/energy/interview/gas-lobby-chief-in-2050-76-of-gas-could-be-renewable/) The view of CEN/CENELEC about Hydrogen Workgroup Hydrogen has been created by the European organization for standardization (CEN/CENELEC) Sector Forum Energy Management (SFEM). The task of this workgroup is to identify
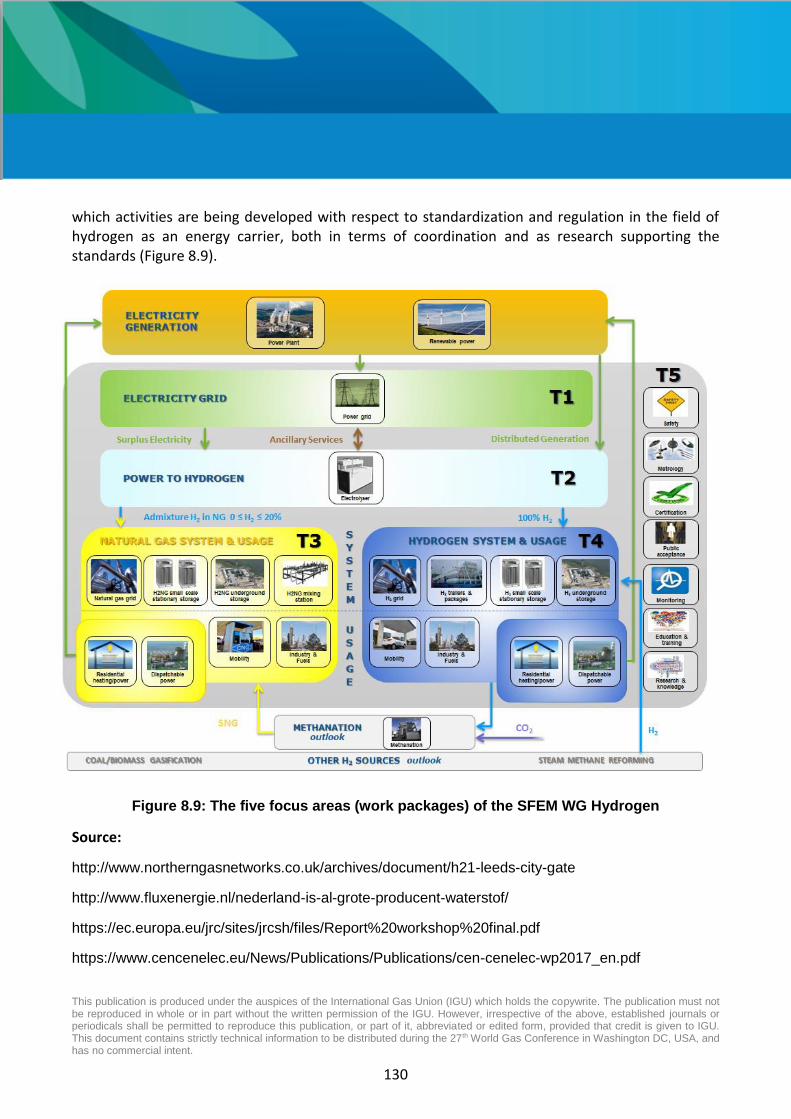
This publication is produced under the auspices of the International Gas Union (IGU) which holds the copywrite. The publication must not be reproduced in whole or in part without the written permission of the IGU. However, irrespective of the above, established journals or periodicals shall be permitted to reproduce this publication, or part of it, abbreviated or edited form, provided that credit is given to IGU. This document contains strictly technical information to be distributed during the 27th World Gas Conference in Washington DC, USA, and has no commercial intent.
130
which activities are being developed with respect to standardization and regulation in the field of hydrogen as an energy carrier, both in terms of coordination and as research supporting the standards (Figure 8.9).
Figure 8.9: The five focus areas (work packages) of the SFEM WG Hydrogen
Source:
http://www.northerngasnetworks.co.uk/archives/document/h21-leeds-city-gate
http://www.fluxenergie.nl/nederland-is-al-grote-producent-waterstof/
https://ec.europa.eu/jrc/sites/jrcsh/files/Report%20workshop%20final.pdf
https://www.cencenelec.eu/News/Publications/Publications/cen-cenelec-wp2017_en.pdf

This publication is produced under the auspices of the International Gas Union (IGU) which holds the copywrite. The publication must not be reproduced in whole or in part without the written permission of the IGU. However, irrespective of the above, established journals or periodicals shall be permitted to reproduce this publication, or part of it, abbreviated or edited form, provided that credit is given to IGU. This document contains strictly technical information to be distributed during the 27th World Gas Conference in Washington DC, USA, and has no commercial intent.
131
8.4. Methods Current Research, Development and Demonstration of Green gases (Case Studies from around the World)
1. JAPAN
a) Hydrogen town planned during Tokyo Olympics
Figure 8.10: Hydrogen town planned during Tokyo Olympics
○,c Yomiuri Shimbun
The number of residential:5,600
Fuel Cell device: Fuel cell utilizing pure hydrogen
Manufacturer: Panasonic, Toshiba ,Aisin
Hydrogen will be produced from city gas at hydrogen refueling stations and supplied to Fuel Cell Vehicles (FCVs) and FC buses. Furthermore, a hydrogen supply pipeline network is planned to be installed for hydrogen supply to fuel cell device for residential and business use. There is a plan to transport CO2 free hydrogen produced in Fukushima area to the Olympic team village. In Fukushima area, a lot of renewable energy producing equipment has now been introduced with support from the Japanese Government.

This publication is produced under the auspices of the International Gas Union (IGU) which holds the copywrite. The publication must not be reproduced in whole or in part without the written permission of the IGU. However, irrespective of the above, established journals or periodicals shall be permitted to reproduce this publication, or part of it, abbreviated or edited form, provided that credit is given to IGU. This document contains strictly technical information to be distributed during the 27th World Gas Conference in Washington DC, USA, and has no commercial intent.
132
b) Cross-ministerial Strategic Innovation Promotion Program - SIP Program
Figure 8.11: SIP Program (Japan)
This program is being promoted by cabinet offices and the government of Japan with the aim of developing the energy carrier to produce, transport and storage hydrogen efficiently. This program supposes ammonia, chemical hydride and liquefied hydrogen as ‘’energy carriers’’.
Hydrogen produced from renewable energy abroad is imported to Japan as energy carrier and such energy carrier is used for power production at power plants and fuel cells. This program contains the technology development for production, transport and utilization of hydrogen from renewable energy, however, it doesn’t contain the hydrogen supply pipeline.
2. USA CANADA
Newtown Creek Waste Water Treatment Plant Demonstration Project in Brooklyn, New York. It will purify biogas into renewable natural gas, which will heat nearly 5,200 homes and reduce greenhouse gas emissions by more than 90,000 metric tons each year the equivalent of removing nearly 19,000 cars from the road.
SoCalGas announced that in 2017 a 2 million cubic feet/day (56,000 cubic meters/day) biomethane injection facility will be commissioned at one of the world’s largest anaerobic digestion facilities, located in Perris, California.

This publication is produced under the auspices of the International Gas Union (IGU) which holds the copywrite. The publication must not be reproduced in whole or in part without the written permission of the IGU. However, irrespective of the above, established journals or periodicals shall be permitted to reproduce this publication, or part of it, abbreviated or edited form, provided that credit is given to IGU. This document contains strictly technical information to be distributed during the 27th World Gas Conference in Washington DC, USA, and has no commercial intent.
133
In the field of hydrogen injection into gas pipelines, in January 2017, SoCalGas launched a small scale experimental pilot at the University of California at Irvine. However, the hydrogen is not solely produced from renewable solar or wind energy. Instead, the objective is limited to evaluate hydrogen injection parameters for pipelines that may result from future renewable power-to-gas projects.
3. THE NETHERLANDS
A demonstration project is launched in 2017 by Gasunie daughters EnergyStock and Gasunie New Energy at the Natural Gasbuffer Zuidwending. This project will provide experience with the conversion of renewable electricity to hydrogen. On the ramparts and the parking spaces around the plant, approximately 13,000 solar panels are installed with a combined power of 2.4 MW. Of these 1.4 MW is intended for the conservation of the own power supply of the installation. 1 MW will be used to gain experience with the conversion of green current into green hydrogen. For this, three sea containers will be placed on the installation. One container contains an electrolyzer that splits water into hydrogen and oxygen. The second contains the required electronics and the third is a small compressor which then fills one of the storage cylinders with hydrogen. With these so-called tube trailers, hydrogen can be transported to customers in, for example, mobility and industry.
At the location of the project in the north of the Netherlands there is a high voltage junction in for the electricity supply. In the long term, sustainable electricity can be supplied, for example, from wind farms above the Wadden sea Islands, temporary surplus of wind energy via the Cobra cable from Denmark and excess wind energy from German wind and solar parks. There is also gas infrastructure in the area along which hydrogen - mixed with natural gas or not - can be discharged. Also, the location has licenses for gas storage in salt caverns in under Southwending. Part of the pilot phase is to investigate whether hydrogen can be stored cost-efficiently in these caverns. (https://www.agbzw.nl/projecten/waterstofproject)

This publication is produced under the auspices of the International Gas Union (IGU) which holds the copywrite. The publication must not be reproduced in whole or in part without the written permission of the IGU. However, irrespective of the above, established journals or periodicals shall be permitted to reproduce this publication, or part of it, abbreviated or edited form, provided that credit is given to IGU. This document contains strictly technical information to be distributed during the 27th World Gas Conference in Washington DC, USA, and has no commercial intent.
134
Figure 8.12: Hystock Pilot Project (Netherlands)
4. FRANCE
GRHYD project, the first « Power to Gas » demonstration in France
GRHYD Project was selected by ADEME, French environmental agency, in mid. 2011, in the framework of “Investment for the Future” Demonstration and technology platform in renewable and low carbon energy: hydrogen and fuel cells. This project is the first Power-to-Gas project in France and a significant step for the development of hydrogen as an energy and Power-to-Gas technologies.
The objective of GRHYD project, located in Dunkirk in the northern France, is to produce H2 from renewable electricity, to supply it as natural gas-H2 mixture to customers by means of the

This publication is produced under the auspices of the International Gas Union (IGU) which holds the copywrite. The publication must not be reproduced in whole or in part without the written permission of the IGU. However, irrespective of the above, established journals or periodicals shall be permitted to reproduce this publication, or part of it, abbreviated or edited form, provided that credit is given to IGU. This document contains strictly technical information to be distributed during the 27th World Gas Conference in Washington DC, USA, and has no commercial intent.
135
distribution gas grid, and to consume it locally (as stationary utilizations: heating, cooking, hot water, CHP, and fuel for buses), in order to assess the relevance of the « Power to gas » chain.
Figure 8.13: Principle of the GRHYD project (France
The GRHYD project will test H2 injection (between 0 – 20% vol. H2) in the NG distribution grid, for the energy supply of 200 new homes (heating, cooking, hot water). It opens up several options, including H2 injection into the natural gas grid and utilization of the
H2/NG blend as a vehicle fuel (Hythane, ‘H2 enriched NG’):
• Higher engine efficiency (+7% vs CNG);
• Lower emissions of local pollutants (-10% vs CNG);
• Lower consumption of primary energy (fossil energy replaced by renewable H2 energy).
An early scenario for distributing the novel gas blend has been prepared. It gives a preliminary picture of the technical requirements (study of impacts on grid equipment and gas appliances) and of the necessary steps for the field implementation (social acceptance, risk assessment, regulatory and legal aspects, permitting). In 2017, the French administration made a favorable recommendation for permitting of this part of the project. Injection of hydrogen into the natural gas grid in this district has begun in mid.2017.

This publication is produced under the auspices of the International Gas Union (IGU) which holds the copywrite. The publication must not be reproduced in whole or in part without the written permission of the IGU. However, irrespective of the above, established journals or periodicals shall be permitted to reproduce this publication, or part of it, abbreviated or edited form, provided that credit is given to IGU. This document contains strictly technical information to be distributed during the 27th World Gas Conference in Washington DC, USA, and has no commercial intent.
136
5. AUSTRALIA
DSO/State Australian Gas Networks (AGN) - SA
Type of Green
Gas/Size
P2G – 50kW
Scope and purpose of
trial
Trial new higher efficiency electrolyzer technology and injection
into the gas grid.
Project/Trial Status ARENA grant approved, project deployment commenced
DSO/State Jemena Gas Networks (JGN) - NSW
Type of Green
Gas/Size
P2G – 500kW
Scope and purpose of
trial
Trial the injection of up to 4% hydrogen into the natural gas grid
and assess different value propositions of onsite hydrogen storage,
vehicular refueling and electricity generation to optimize the
viability of P2G.
Project/Trial Status Front end engineering design and ARENA funding approval due Q3
2017.
DSO/State Evo Energy – ACT (Canberra)
Type of Green
Gas/Size
P2G (2MW) and Bio-methane
Scope and purpose of
trial
Demonstrate viability of direct hydrogen injection into the gas grid
and production of bio-methane with potential for methanation of
bio-gas.
Project/Trial Status Preliminary design and funding assessment.

This publication is produced under the auspices of the International Gas Union (IGU) which holds the copywrite. The publication must not be reproduced in whole or in part without the written permission of the IGU. However, irrespective of the above, established journals or periodicals shall be permitted to reproduce this publication, or part of it, abbreviated or edited form, provided that credit is given to IGU. This document contains strictly technical information to be distributed during the 27th World Gas Conference in Washington DC, USA, and has no commercial intent.
137
DSO/State ATCO – Western Australia (WA)
Type of Green
Gas/Size
P2G
Scope and purpose of
trial
Demonstration of P2G.
Project/Trial Status Feasibility assessment and sizing. No firm timelines as yet.
CASE STUDY: Jemena Gas Networks (NSW) - Australia
POWER TO GAS PROJECT – H2GO
To work towards an even brighter future, part of Jemena’s vision is to provide sustainable energy solutions to our customers. To be the leader in providing energy solutions we will support the commitments of Australian energy players as we move towards a low carbon future.
The Federal Government has signed up to the Paris Climate Agreement seeking to limit temperature increases caused by humans to 1.5ºC. Australia has committed to reducing carbon emissions by between 26% to 28% by 2030. The NSW Government has set a more ambitious target to balance all carbon emissions by 2050 with an equivalent amount of carbon storage or buying enough carbon credits to make up the difference. The carbon can be stored by pumping carbon dioxide into salt caverns, disused oil and gas wells, or by planting trees.
Increasing electricity sourced from solar and wind is central to achieving these goals. To achieve our climate change commitments, it is expected that more than 90% of electricity will be sourced from solar and wind energy by 2050, with no role for gas or the gas network by 2050.
Jemena has worked with Energy Networks Australia to publish Gas Vision 2050. The document presents the use of transformative technologies to ensure that the benefits of gas can continue to be enjoyed in a decarbonized economy beyond 2050. Power to Gas (P2G) is one of these transformational technologies. A P2G demonstration facility will add value to customers, enable industry R&D (reach and development) and credibility to this vision. Jemena is investigating the feasibility of a pilot-scale P2G demonstration facility within the NSW Jemena Gas Network (JGN).
P2G uses electricity sourced from solar and wind energy to split water into hydrogen and oxygen. Like natural gas, hydrogen is an energy carrier that can be stored and transported safely across the JGN in NSW. The intermittent nature of wind and solar power creates a need for energy storage. P2G represents a solution to the problem of excess energy reserves, as Australia significantly increases energy generation from renewable sources.
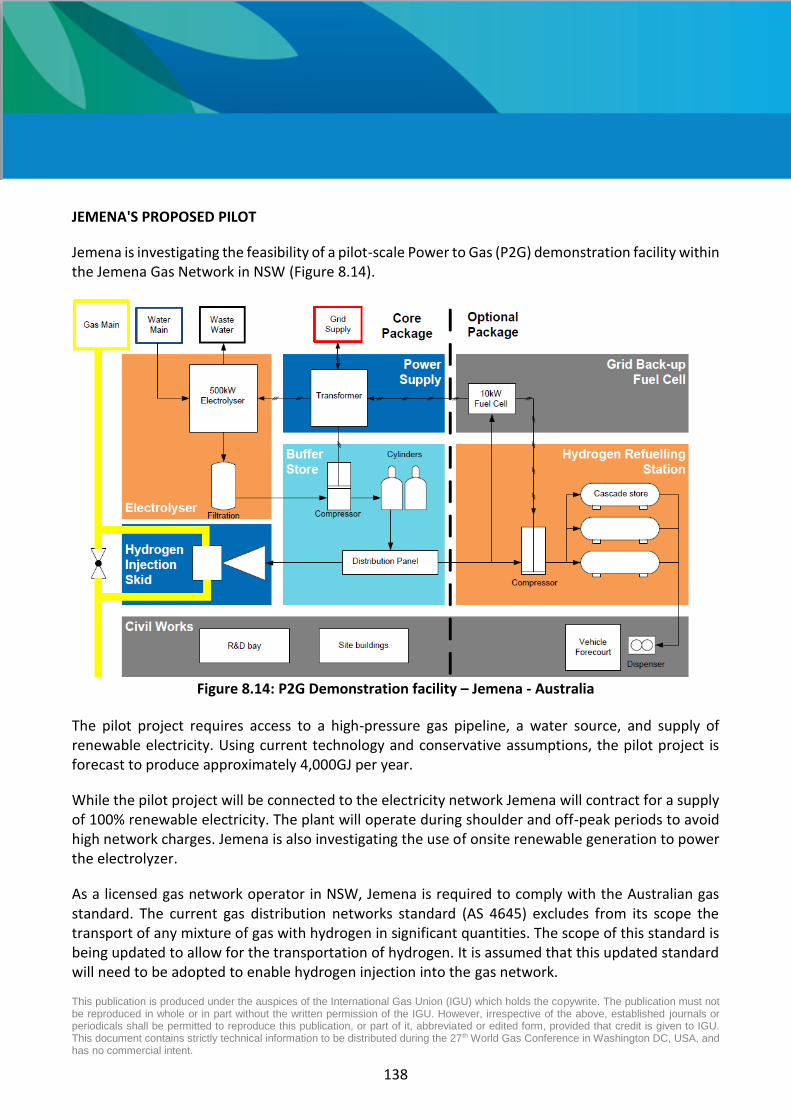
This publication is produced under the auspices of the International Gas Union (IGU) which holds the copywrite. The publication must not be reproduced in whole or in part without the written permission of the IGU. However, irrespective of the above, established journals or periodicals shall be permitted to reproduce this publication, or part of it, abbreviated or edited form, provided that credit is given to IGU. This document contains strictly technical information to be distributed during the 27th World Gas Conference in Washington DC, USA, and has no commercial intent.
138
JEMENA'S PROPOSED PILOT
Jemena is investigating the feasibility of a pilot-scale Power to Gas (P2G) demonstration facility within the Jemena Gas Network in NSW (Figure 8.14).
Figure 8.14: P2G Demonstration facility – Jemena - Australia
The pilot project requires access to a high-pressure gas pipeline, a water source, and supply of renewable electricity. Using current technology and conservative assumptions, the pilot project is forecast to produce approximately 4,000GJ per year.
While the pilot project will be connected to the electricity network Jemena will contract for a supply of 100% renewable electricity. The plant will operate during shoulder and off-peak periods to avoid high network charges. Jemena is also investigating the use of onsite renewable generation to power the electrolyzer.
As a licensed gas network operator in NSW, Jemena is required to comply with the Australian gas standard. The current gas distribution networks standard (AS 4645) excludes from its scope the transport of any mixture of gas with hydrogen in significant quantities. The scope of this standard is being updated to allow for the transportation of hydrogen. It is assumed that this updated standard will need to be adopted to enable hydrogen injection into the gas network.

This publication is produced under the auspices of the International Gas Union (IGU) which holds the copywrite. The publication must not be reproduced in whole or in part without the written permission of the IGU. However, irrespective of the above, established journals or periodicals shall be permitted to reproduce this publication, or part of it, abbreviated or edited form, provided that credit is given to IGU. This document contains strictly technical information to be distributed during the 27th World Gas Conference in Washington DC, USA, and has no commercial intent.
139
HYDROGEN REFUELLING STATION OPTION
In addition to the core P2G infrastructure, Jemena has identified hydrogen vehicle re-fueling plants as a complementary technology for inclusion in the scope of this project.
Hydrogen's key advantage over plug-in electric vehicles is that a car can take on a full tank of hydrogen in a few minutes – roughly the same amount of time it takes to top up a tank of petrol – while electric cars usually require several hours to take a charge. The range on a full tank of hydrogen is currently greater than 600km and the range of the next generation of vehicles will significantly exceed this.
The challenge today is that hydrogen technology is expensive and infrastructure is extremely limited – particularly compared with the power grid. Both of those factors are expected to change in coming years.
FUEL CELL OPTION
Jemena also seeks to trial a hydrogen refueling station, along with a fleet of up to 40 Fuel Cell Electric Vehicles to test and demonstrate a viable alternative to petrol and diesel fueled vehicles and associated refueling infrastructure.
Jemena has also identified fuel cells as a complimentary technology for inclusion in the scope of the project. The fuel call can convert stored hydrogen into electricity at times of peak demand (when prices are higher), and provide a backup source of electricity supply, to counter the impact of intermittent renewable (wind and solar) electricity generation.
Jemena also seeks to trial a fuel cell and demonstrate the capability of the pilot plant to provide valuable services to the electricity distribution system.
6. EUROPEAN CONSORTIUM PROJECTS
6.1. STORE&GO project to integrate Power-to-Gas technology into the future European energy system.
The project is being funded by the European Union's "Horizon 2020” research and Innovation program.
European consortium project is built of 27 partners from three European countries (Germany, Italy, Switzerland) having expertise in the energy sector, process engineering, economics, law and social science.
The project STORE&GO - Shaping the energy supply for the future. By 2050, the EU aims to cut its emissions even further – by 80 - 95 percent compared to 1990. These targets can only be reached by turning the vast majority of energy sources from fossil/nuclear into renewable ones. The project

This publication is produced under the auspices of the International Gas Union (IGU) which holds the copywrite. The publication must not be reproduced in whole or in part without the written permission of the IGU. However, irrespective of the above, established journals or periodicals shall be permitted to reproduce this publication, or part of it, abbreviated or edited form, provided that credit is given to IGU. This document contains strictly technical information to be distributed during the 27th World Gas Conference in Washington DC, USA, and has no commercial intent.
140
focuses on the integration of P2G into the daily operation of European energy grids to investigate the maturity level of the technology (Figure 8.15).
Figure 8.15: Store&Go Project Methanation processes will be developed and improved by the technologies:
• catalytic methanation reactors; • biological methanation; • modular milli-structured catalytic methanation reactors.
These technologies will be demonstrated at a considerable scale between 200 kW and 1 MW in three different demonstration environments in Germany, Switzerland, Italy. The resulting product synthetic natural gas (SNG) will be injected into the existing grid and delivered to customers.

This publication is produced under the auspices of the International Gas Union (IGU) which holds the copywrite. The publication must not be reproduced in whole or in part without the written permission of the IGU. However, irrespective of the above, established journals or periodicals shall be permitted to reproduce this publication, or part of it, abbreviated or edited form, provided that credit is given to IGU. This document contains strictly technical information to be distributed during the 27th World Gas Conference in Washington DC, USA, and has no commercial intent.
141
Figure 8.16: Italian demonstration site at Troia, (I)
Figure 8.17: Electrolysis systems at Falkenhagen (DE) Figure 8.18: The hybrid plant Regio Energie
Solothurn, (CH) 6.2 INGRID Project
8 partner organizations and companies from 4 European countries (Belgium, France, Italy, Spain)
The project aims to demonstrate the effective usage of safe, high-density, solid-state hydrogen storage systems for power supply and demand balancing within active power distribution grids with high penetration of intermittent Distributed Generation (Renewable Energy Sources in particular).

This publication is produced under the auspices of the International Gas Union (IGU) which holds the copywrite. The publication must not be reproduced in whole or in part without the written permission of the IGU. However, irrespective of the above, established journals or periodicals shall be permitted to reproduce this publication, or part of it, abbreviated or edited form, provided that credit is given to IGU. This document contains strictly technical information to be distributed during the 27th World Gas Conference in Washington DC, USA, and has no commercial intent.
142
Figure 8.19: Ingrid Project
8.5. Results Potential Scenarios and Perspectives for green gases development
Watching the development towards a sustainable energy system in the various regions around the globe, it appears that the production and consumption of green gas is increasing and will be an unavoidable component of the overall energy system. There is still a prospect for significant improvement in production methods, both from technological aspects (e.g. production methods of hydrogen) as from an economic perspective (e.g. improvements due to the economies of scale, and specialization of production and construction of equipment). The use of green gas as energy carrier also matches rather perfectly with the need for affodable and efficient (seasonal) storage. Such storage becomes essential with an increase fraction of energy supply from sustainable sources that are mostly of an intermittent and seasonal character (sun, wind).
It is to be expected that the use of green gas will grow during a transition period until a mature sustainable energy system is operational. Until then, the search for and the evaluation of the technical/economical optimal solutions will take place. We are now in this phase and this phase will continue in the next decade. There is a wide variety of technologies to explore. The optimal choice and the optimal pathway toward the end result will be different for each region in the world.
From the perspective of the technical consequences for the current gas system, we conclude that this transition is more of an evolution rather than a revolution. By and large, the currently operational network, with their materials and controls used, will function nominally with any reasonable variety of green gas (see e.g. the Leeds H21 project). No completely new infrastructure has to be built and the existing network infrastructure does not need to be abandoned of dismantled, realizing a huge saving in transition costs (order of magnitude thousands of euro of dollars per consumer). Of course, the opportunity of using and adapting the network needs guidance and research. Demonstration and

This publication is produced under the auspices of the International Gas Union (IGU) which holds the copywrite. The publication must not be reproduced in whole or in part without the written permission of the IGU. However, irrespective of the above, established journals or periodicals shall be permitted to reproduce this publication, or part of it, abbreviated or edited form, provided that credit is given to IGU. This document contains strictly technical information to be distributed during the 27th World Gas Conference in Washington DC, USA, and has no commercial intent.
143
development projects must be performed to convince and prove the concept to politicians, the public and investors.
When extending the use of gas network into the era of sustainable energy systems, the network must be prepared for dealing with the new type of customer: the ‘prosumer’. The customer not only consumes energy but may be a producer of energy. This customer requires flexible contracts, flexible services and flexible appliances. The network operator (DSO) needs to change their customer support procedures. This is perhaps the most revolutionary part of the challenge. The DSO, especially a regional distribution network operator, also needs to be able to employ more flexibility the direction of gas flow and he needs to monitor and control the flows in his network in more detail than currently practiced. However, this is a more evolutionary change, since the technology can be learned from the gas transmission networks, where this issue is routinely addressed, and it is also part of the on-going process toward operational excellence. A potential bottleneck is the availability of suitable flexible end user appliances. It is conceivable that a larger variety of gas qualities needs to be distributed than in the current single source network. However, appliances manufacturers will need an incentive for developing and producing those flexible appliances. It is in the interest of the network operators help and stimulate that development where possible.
The extent and impact of the introduction of green gas will vary substantially from one region to another. Local climate and the local availability of sustainable energy sources are important aspects that are external to the gas network. Also, demographic and environmental, as well as local and national politics, do have an impact. There will be not a ‘one size fits all’ solution to the challenge of incorporating green gas into the energy system.
From a policy point of view, the analysis is that the incorporation of green gasses into the energy system is unavoidable, necessary and technically feasible. There are technical challenges to be managed, but the institutional aspects are perhaps even more challenging. In any case, this opportunity, and indeed the transition to a sustainable energy system, will only succeed with an integrated energy policy. Such a policy requires collaboration of network owners (gas, electricity, heat) and small and large-scale prosumers, including energy storage facilities). It is important that network operators play an active role in this transition process to a sustainable energy system. They must work together with the other stakeholders in the process, in particular their customers, appliance manufactures, energy producers and competing energy distributors.
8.6. Conclusions Studying subjects closely associated with the operation of the distribution system and its potential for future integration of renewable "green" gas is absolutely necessary to take into account the following areas:
- Creation of ICT solutions (hardware and software) for establishing decentralized, integrated local producer/consumer markets (“Make grid smarter”);
- Full integration of the hydrogen supply chain into the gas system value chain of production, storage, distribution, utilization and consumption (“Support Hydrogen Integration”);

This publication is produced under the auspices of the International Gas Union (IGU) which holds the copywrite. The publication must not be reproduced in whole or in part without the written permission of the IGU. However, irrespective of the above, established journals or periodicals shall be permitted to reproduce this publication, or part of it, abbreviated or edited form, provided that credit is given to IGU. This document contains strictly technical information to be distributed during the 27th World Gas Conference in Washington DC, USA, and has no commercial intent.
144
- Intensify actions by DSO´s to foster partnerships with innovators outside the utility sector to contribute to innovative solutions (“Expand Innovation Ecosystem”).
Therefore, the recommendations of the study group towards for the next triennium is to study in more detail the following topics:
These are the areas of the next triennium perspective:
• Make grid smarter;
• Support Hydrogen Integration
• Expand Innovation Ecosystem
8.7. References Eurogas – Marcogaz – GERG Task Force on Smart Gas Grid/Gas Bridges: the natural gas network as key partner of the energy transition
The Canadian Gas Association (CGA) reports
Canadian Gas Association (CGA) 2016 http://www.cga.ca/wp-content/uploads/2016/05/RNG-publication-FINAL-April-2016-EN.pdf
French Environment agency
Energie Akkoord 2017
Italian Ministry of Industry, Ministry of Environment and Sea, Ministry of Agriculture
German Ministry of the environment
German associations (BDEW, DVGW, DENA, Energy agency of Northrhine Westphalia)
DENA-Strategieplattform Power to Gas (http://www.powertogas.info/english/ )
DVGW - Arbeitsblatt G262
DIN 51624: Determination of requirements concerning quality and composition of natural gas
National Regulation Authorities (NRA)
Japanese Cross-ministerial Strategic Innovation Promotion Program program (SIP)
Ontario Energy Board 2016 https://www.oeb.ca/industry/policy-initiatives-and-consultations/framework-assessment-distributor-gas-supply-plans
Biogasnetwerk Twente http://www.biogasnetwerktwente.nl/
Étude sur l'utilisation de la biomasse pour la production d'électricité et de chaleur en Algérie.RAPPORT TECHNIQUE Stage de deuxième année. Ecole des Mines d’Albi (France) - CREDEG de Samy ADAFER Office National de l’Assainissement “ONA” ; Situation des stations d’épuration en Algérie

This publication is produced under the auspices of the International Gas Union (IGU) which holds the copywrite. The publication must not be reproduced in whole or in part without the written permission of the IGU. However, irrespective of the above, established journals or periodicals shall be permitted to reproduce this publication, or part of it, abbreviated or edited form, provided that credit is given to IGU. This document contains strictly technical information to be distributed during the 27th World Gas Conference in Washington DC, USA, and has no commercial intent.
145
Executive decree # 92-100 of 3 March 1992 concerning the transformation of the legal incorporation of companies dealing with production, supply and management of water and determining the terms of their organization and functioning.
Web sites
http://www.marcogaz.org
https://service.sa.gov.au/cdn/ourenergyplan/assets/hydrogen-roadmap-8-sept-2017.pdf
http://www.storeandgo.info/demonstration-sites/
http://www.ingridproject.eu/
http://www.europeanpowertogas.com/
http://www.energieakkoordser.nl/
http://www.vggp.nl/www.vggp.nl/Home.html
(https://www.agbzw.nl/projecten/waterstofproject)
https://www.storeandgo.info/
https://www.ecn.nl/publicaties/PdfFetch.aspx?nr=ECN-O--15-058
https://www.euractiv.com/section/energy/interview/gas-lobby-chief-in-2050-76-of-gas-could-be-
renewable/
http://www.mem-algeria.org/actu/comn/pubt/explo-news_special-b.pdf; Mr TAKHERIST Exploration Manager Division – SONATRACH
http://www.northerngasnetworks.co.uk/archives/document/h21-leeds-city-gate
http://www.fluxenergie.nl/nederland-is-al-grote-producent-waterstof/
https://ec.europa.eu/jrc/sites/jrcsh/files/Report%20workshop%20final.pdf
https://www.cencenelec.eu/News/Publications/Publications/cen-cenelec-wp2017_en.pdf

This publication is produced under the auspices of the International Gas Union (IGU) which holds the copywrite. The publication must not be reproduced in whole or in part without the written permission of the IGU. However, irrespective of the above, established journals or periodicals shall be permitted to reproduce this publication, or part of it, abbreviated or edited form, provided that credit is given to IGU. This document contains strictly technical information to be distributed during the 27th World Gas Conference in Washington DC, USA, and has no commercial intent.
146
9. Conclusions and Recommendations
Placed at the end of the gas supply chain, and close to local economic actors and gas consumers, the distribution activity is in the best position to bring the benefits of natural gas to the society. Cooperative efforts around the world between DSOs and social and industrial stakeholders will help to meet this challenge.
New technologies able to make easier, safer and more cost effective network deployment and operation, as well as innovative customer attachment policies will be needed to achieve the necessary feasibility for providing natural gas service to as wide a range of customers as possible.
New technologies operated by DSOs using virtual pipelines based on LNG or CNG will offer new opportunities to supply new consumers in isolated areas.
Also, due to its close position regarding citizens and ultimate consumers, the distribution activity has a great influence on the perceived image of natural gas. The implementation and improvement of Quality Management Systems (QMS) focusing on Safety, Customer Service and Engagement of DSO’s employees is, therefore, necessary to achieve any objective based on customer satisfaction.
Good cooperation between DSOs, gas associations and gas regulatory agencies will lead to implementing best practices in Safety Management Systems (SMS) by the best performing operators embedding a safety culture throughout all business decisions and tasks.
Engagement of employees in QMS and SMS and recruiting of employees for white-collar, construction and operation jobs is also a challenge in the industry. The use of hand-held technology, social media, simulations, computerized methods, virtual reality and augmented realty support more efficient training of personnel.
Customer service requires an optimized business model employing business partners, which are an extension of the Customer Care team of the DSO. Again, new technologies and opportunities offered by social media applications can help improve communications with customers, to speed up processes and to achieve the best safety records. Smart meters, interactive sensors and IoT will be part of the future DSO-Customer relationship.
Consistent, timely and transparent communication from the DSO to all relevant stakeholders, including bottom up communication, is crucial in the matter of safety and operational excellence.
Gas Distribution activity in some parts of the world can be part of the way to a greener energy system as distribution networks can become a relevant tool for the integration of renewables into the future energy mix. Necessarily smarter grids will need new ICT solutions for establishing decentralized and integrated local producer-consumer markets.
DSOs in those areas of the world where public policy and negative opinion promoted by environmental groups against fossil fuels will need to intensify actions to foster partnerships with innovators outside the utility sector and to support the full integration of a future hydrogen supply chain into the gas system.

This publication is produced under the auspices of the International Gas Union (IGU) which holds the copywrite. The publication must not be reproduced in whole or in part without the written permission of the IGU. However, irrespective of the above, established journals or periodicals shall be permitted to reproduce this publication, or part of it, abbreviated or edited form, provided that credit is given to IGU. This document contains strictly technical information to be distributed during the 27th World Gas Conference in Washington DC, USA, and has no commercial intent.
147
While there are many issues to be addressed the opportunity for expanding the market for natural gas is great. By recognizing the issues and addressing them the industry will be able to make use of this abundant, clean and economic natural resource.

This publication is produced under the auspices of the International Gas Union (IGU) which holds the copywrite. The publication must not be reproduced in whole or in part without the written permission of the IGU. However, irrespective of the above, established journals or periodicals shall be permitted to reproduce this publication, or part of it, abbreviated or edited form, provided that credit is given to IGU. This document contains strictly technical information to be distributed during the 27th World Gas Conference in Washington DC, USA, and has no commercial intent.
148