Distribution and risk assessment of trace metals in...
34
Accepted Manuscript Title: Distribution and risk assessment of trace metals in Leptodius exarata, surface water and sediments from Douglas Creek, Qua Iboe estuary Author: Nsikak U. Benson Winifred U. Anake Joseph P. Essien Paul Enyong Abass A. Olajire PII: S1658-3655(16)30057-7 DOI: http://dx.doi.org/doi:10.1016/j.jtusci.2016.08.004 Reference: JTUSCI 324 To appear in: Received date: 30-1-2016 Revised date: 23-7-2016 Accepted date: 8-8-2016 Please cite this article as: N.U. Benson, W.U. Anake, J.P. Essien, P. Enyong, A.A. Olajire, Distribution and risk assessment of trace metals in Leptodius exarata, surface water and sediments from Douglas Creek, Qua Iboe estuary, Journal of Taibah University for Science (2016), http://dx.doi.org/10.1016/j.jtusci.2016.08.004 This is a PDF file of an unedited manuscript that has been accepted for publication. As a service to our customers we are providing this early version of the manuscript. The manuscript will undergo copyediting, typesetting, and review of the resulting proof before it is published in its final form. Please note that during the production process errors may be discovered which could affect the content, and all legal disclaimers that apply to the journal pertain.
Transcript of Distribution and risk assessment of trace metals in...
Accepted Manuscript
Title: Distribution and risk assessment of trace metals inLeptodius exarata, surface water and sediments from DouglasCreek, Qua Iboe estuary
Author: Nsikak U. Benson Winifred U. Anake Joseph P.Essien Paul Enyong Abass A. Olajire
PII: S1658-3655(16)30057-7DOI: http://dx.doi.org/doi:10.1016/j.jtusci.2016.08.004Reference: JTUSCI 324
To appear in:
Received date: 30-1-2016Revised date: 23-7-2016Accepted date: 8-8-2016
Please cite this article as: N.U. Benson, W.U. Anake, J.P. Essien, P. Enyong, A.A. Olajire,Distribution and risk assessment of trace metals in Leptodius exarata, surface waterand sediments from Douglas Creek, Qua Iboe estuary, Journal of Taibah University forScience (2016), http://dx.doi.org/10.1016/j.jtusci.2016.08.004
This is a PDF file of an unedited manuscript that has been accepted for publication.As a service to our customers we are providing this early version of the manuscript.The manuscript will undergo copyediting, typesetting, and review of the resulting proofbefore it is published in its final form. Please note that during the production processerrors may be discovered which could affect the content, and all legal disclaimers thatapply to the journal pertain.

Page 1 of 33
Accep
ted
Man
uscr
ipt
1
Distribution and risk assessment of trace metals in Leptodius exarata, surface water and
sediments from Douglas Creek, Qua Iboe estuary
aNsikak U. Benson,
aWinifred U. Anake,
bJoseph P. Essien,
cPaul Enyong and
d*Abass A. Olajire,
aEnvironmental Chemistry Unit, Department of Chemistry, Covenant University, Ota, Nigeria.
bDepartment of Microbiology, University of Uyo, Uyo, Nigeria.
cDepartment of Chemistry, University of Uyo, Uyo, Nigeria.
dIndustrial and Environmental Chemistry Unit, Department of Pure and Applied Chemistry, Ladoke Akintola
University of Technology, Ogbomoso, Nigeria.
*Corresponding Author:- [email protected]
Abstract
Five trace metals in Leptodius exarata, epipellic sediments and surface water from an
intertidal ecosystem in Niger Delta (Nigeria) were investigated to evaluate their spatial
distribution, degree of contamination, ecological and health risks. Results show Cd
(cadmium), Cr (chromium), Ni (nickel), Pb (lead) and Zn (zinc) concentrations in sediment
ranged between 0.550 – 1.142, 9.57 – 15.95, 9.15 – 13.96, 2.00 – 8.90 and 91.5 – 121.6
mg/kg dw, respectively; while L. exarata tissue metal content vary from 0.162 – 0.931, 3.81
– 8.62, 4.45 – 17.15, 1.90 – 7.35, and 125.55 – 269.75 mg/kg, dw, respectively. The
bioconcentration factor ranking for trace metals followed the sequence Zn>Ni>Pb >Cr>Cd.
High biota to sediment accumulation factor (BSAF) in L. exarata reveals a sentinel metal
bioindicator. Sediments from most sites were uncontaminated to moderately contaminated
(geoaccumulation, Igeo > 0) with Cd and Zn associated with anthropogenic intrusions. Low
mean-ERM (effect range-median) and mean-PEL (probable effect level) quotients of
sediments are observed, indicating low–medium degree of contamination with 30% and 21%
probability of being toxic. The multi-metal potential ecological risk index (RI) for the
intertidal ecosystem indicates low–moderate risk. Health risks associated with crabs (L.
exarata) consumption are significant in children than adults.
Keywords: Trace metals; surface water; bioindicator; sediment contamination; pollution
indices; health risk assessment
*Manuscript

Page 2 of 33
Accep
ted
Man
uscr
ipt
2
1. Introduction
The ecological integrity of most intertidal coastal aquatic ecosystems in the world has
been widely threatened and degraded by unprecedented levels of trace metals and metalloids
pollution arising mainly from human activities. Varying quantities of trace metals and
organic pollutants have been discharged directly into coastal systems as by products of many
commercial and industrial processes, land and municipal sewage runoff, agricultural and
domestic wastewater, effluents, and atmospheric deposition [1-3]. Previous investigations on
intertidal estuarine and associated aquatic ecosystems in this part of the world have revealed
that different human-mediated activities arising from crude oil spillage [4-6] can adversely
alter the ecological integrity of these fragile aquatic ecosystems, leading to bioaccumulation
of pollutants by biota [5-9], and heavy metals enrichment in sediment [10, 11]. However, the
transport, mobilization and pollution of trace metals in aquatic ecosystems especially
intertidal coastal water bodies have become an important problem due to their toxic effects,
accumulation and bioconcentration through the food chain [12, 13].
Metal toxicity mainly depends on the metal speciation and bioavailability, as well as
the means of uptake, accumulation and excretion rates of the organisms [12,14-16]. Body
levels of some crustacean (crab) are capable of regulating essential trace metals such as Zn,
Cu, Mn, Fe and Cr at concentrations below threshold level. These metals play a vital role in
many physiological processes, but have a toxic effect when present at high concentrations in
the surrounding medium. On the contrary, body levels of nonessential metals such as Cd and
Pb are not regulated by crustacean and are toxic even at trace concentrations [17]. This could
result in adverse effects such as disruption of reproductive potential, and endocrine disruption
for higher trophic level organisms [18-21].
The bioavailability/remobilisation of trace metals onto aquatic substrates such as
sediment, surface water, aquatic organisms and microorganisms is dependent on their

Page 3 of 33
Accep
ted
Man
uscr
ipt
3
physicochemical forms [15]. Several studies have indicated that phytoplankton and other
aquatic organisms can remove, bioaccumulate and transfer bioconcentrated trace metals from
lower to higher trophic levels in food webs [22-23]. These biological systems could be used
in environmental studies as bioindicators or biomonitors [24-26]. To date, there are scarce
data pertaining to bioaccumulation and integrated risk assessment of trace metals in aquatic
substrates of this important estuary. Despite the increasing environmental and health
concerns posed crude oil pollution to aquatic ecosystems in Niger Delta, the state or degree
of contamination by heavy metals and associated human health risk through dietary exposure
have not been duly assessed to date. Most previous studies on the occurrence of trace metals
were mainly focused on quantifying hydrocarbons and heavy metals levels in water,
zoobenthos, and sediment [4, 5, 6, 7]. Studies have indicated enhanced levels of trace metals
in soil, surface water, sediments and biota from aquatic ecosystems in the area [5, 6, 7, 10,
67]. Many tropical ecosystems in the Niger Delta serve as primary recipients of petroleum
exploration-exploitation wastes, domestic and industrial wastes generated by multinational
oil companies that are found in the region. Little information is available outlining the
utilization of multivariable pollution and risk assessment tools to evaluate the pollution status
and potential ecological and human health risks of heavy metals in this region. Hence, the
present study has been initiated with the following objectives: (1) to determine the levels of
trace metals accumulation and distribution in surface water, intertidal sediment and crab (L.
exarata) from Douglas Creek, (2) to assess its potential ecological environmental and health
risks, thus contributing to the knowledge and management of this region in future. (3) to
evaluate the sediment quality and environmental risks of investigated trace metals by
comparison with sediment quality guidelines (SQGs); and (4) to identify the possible sources
of trace metal pollution and assess their ecotoxicological significance. Our results would
provide a baseline against which future anthropogenic effects can be evaluated.

Page 4 of 33
Accep
ted
Man
uscr
ipt
4
2. Materials and methods
2.1 Study area
Douglas Creek is a major tributary of Qua Iboe Estuary (Fig. 1). The estuary is
characterized by shallow intertidal mudflats that are surrounded by mangroves and is
perennially subjected to sediment deposition from Qua Iboe River and marine sand from the
Atlantic Ocean. It is located close to several coastline settlements within an oil producing
area in Southeastern Nigeria. The Qua Iboe Estuary and Douglas Creek lie within latitude 4o
30’ to 4o
45’N and longitude 7o
30’ to 8o 00’E. It serves as the receiving water body for
residential, agricultural and petrochemical wastes generated from multinational oil companies
located in the oil producing communities. Fine sandy beaches fringed with mangrove
swamps and tidal mud flats on which Nypa palm vegetation dominates are distinctive
features of the marginal shore of the Estuary. The area is characterized by a humid tropical
climate with an annual rainfall of about 4021 mm, average humidity of 80% and means
minimum and maximum temperatures of 22oC and 30
oC respectively. Tidal currents are
strong especially during the wet seasons along estuary upper reaches and creek, and this
plays an important role in biota distribution, trace metal laden, waste transportation,
industrial and domestic waste transportation.
2.2 Sampling
Five sampling stations (DC-A, DC-B, DC-C, DC-D, and DC-E) were established
along the upstream, midstream and downstream stretch of Douglas Creek extending into Qua
Iboe estuary for the collection of surface water samples. Similarly, locations DC-V, DC-W,
DC-X, DC-Y and DC-Z were also mapped out as sampling locations for collection of
intertidal (epipellic) sediments and crabs samples. At each sampling station, one (1) surface

Page 5 of 33
Accep
ted
Man
uscr
ipt
5
water sample and three (3) each of the intertidal sediments and crab samples were obtained
from different locations, and were carefully transferred into clean polyethylene glass
containers, polythene bags and preserved in ice-cooled boxes. All water samples were
collected from the surface (10–25 cm) in sterile polyethylene glass bottles fitted with airtight
stoppers. The containers were opened to fill and closed below the water. All containers were
prewashed with 20% analytical grade nitric acid and rigorously rinsed with distilled
deionized water. Prior to sampling, the containers were further rinsed at least three times with
the water being sampled before collection. Preservation of collected water samples was done
by acidifying with 5 mL of analytical grade nitric acid to give pH < 2, in order to minimize
precipitation and sorption losses to the container walls. A short core sampler was used to
collect the intertidal sediment with undisturbed sediment-water interfaces and intertidal
sediment samples were collected from the top layer 1 to 5 cm, homogenized and the
subsamples were stored in a black polythene bag with proper labelling. The crab (Leptodius
exarata) was also handpicked along the tidal shores of Douglas Creek and thoroughly
cleaned with fresh water followed by distilled water in order to get rid of soil and sediment
before transferring them into labelled aluminium foil. Therefore, a total of 35 samples,
comprising 5 samples of surface water and 15 each of intertidal sediment and crab samples
were collected from the study area. After collection, all the samples were stored in ice-packed
boxes and transported to the laboratory. They were further refrigerated in the laboratory at
4oC to inactivate microbes and preserve the integrity of the samples prior to analysis.
2.3 Analytical procedures for sample pre-treatment and chemical analysis
The surface water samples collected were preconcentrated following a standard
procedure as described by Ramesh et al. [27] and Essien et al. [6]. Five polyethylene bottles
with snap caps were first treated with dilute HNO3 and subsequently washed with a warm

Page 6 of 33
Accep
ted
Man
uscr
ipt
6
organic detergent dissolved in distilled water. Thereafter, about 100 mL of water samples
from each location ((DC-A, DC-B, DC-C, DC-D, and DC-E) were filtered using a 0.2 μm
filter to remove any suspended matter and stored in prepared polyethylene bottles. After
filtration, the filtrates were treated separately with concentrated HNO3 to adjust their pH
value to 4.00±0.05 before they were buffered with 2 mL of 0.1M potassium hydrogen
phthalate solution (pH 4). Precisely, 2 mL of 1% (w/v) methanolic solution of sodium
dibenzyl dithiocarbamate was later added to each filtrate and the solutions were stirred
intermittently for about 18 - 20 minutes. Each solution was thereafter filtered under vacuum
through a 0.45 μm pore membrane filter. The sorbed trace metals on the filters were
subsequently eluted with 4M HNO3 and the acid eluates were kept for metal analysis.
The intertidal sediment samples collected were air-dried by exposure to ambient air for
48 hours. Stones, sticks, organic matter and shells were manually removed from air-dried
samples, while sediments with large aggregate grains were further pulverized using porcelain
pestle and mortar, and sieved through a 2 mm mesh, which was hand shaken for 5-10 minutes.
The sieved samples were subsequently transferred into labelled polythene bags and stored for
subsequent treatment. Care was taken to avoid mixing and cross contamination of samples.
Later, sieved intertidal sediment samples were separately placed in a pre-combusted glass jar,
freeze dried, homogenized and sieved to collect less than 63 μm grain sizes and stored at -
20oC until further analysis. Thereafter, each intertidal sediment sample was digested as
described by Ho et al. [28]. About 2.0 g of each sample was digested with a solution of
concentrated HCl (6.0 mL) and HNO3 (0.3 mL) to near dryness and allowed to cool before 20
mL of 5.0 M (1 M = 1 mol dm-3
) HNO3 solution was added. Each digested intertidal
sediment sample solution was allowed to stay for about 12 hours before they were filtered.
The filtrates were subsequently transferred into 100 mL volumetric flask and made up to the
mark with 0.5M HNO3 prior to elemental analysis. A reagent blank was also prepared using a
Page 7 of 33
Accep
ted
Man
uscr
ipt
7
mixture of HCl and HNO3 following the stepwise analytical procedure described for the
sample preparation.
Samples of Leptodius exarata were dissected with sterilized scissors to collect tissue
samples. Each tissue samples were oven dried at 105ºC for 1 hour and allowed to cool at
room temperature, and then ground to powder using porcelain pestle and mortar. Precisely,
2.0 g of each sample was digested with a combination of concentrated HNO3 (2.5 mL) and
H2SO4 (2.5 mL) as described by Hosseini et al. [29]. The digested sediment and crab sample
solution, acid eluates desorbed from the filter, and the blank were analyzed for the
concentrations of trace metals (cadmium (Cd), chromium (Cr), nickel (Ni), lead (Pb), Zinc
(Zn)) using an Atomic Absorption Spectrophotometer (S Series S4 AA System – Thermo
Electron Corporation). Blanks were used for zeroing the instrument before each analysis to
avoid matrix interference. The analysis was duplicated to verify the precision of the method
of digestion.
2.4 Quality assurance / quality control
Buffalo River Sediment Reference Material (SRM 8704), sourced from National
Institute of Standards and Technology (US), intended primarily for use in the analysis of
sediments, soils, or materials of a similar matrix was analysed with the sediment samples for
quality assurance purposes. Reference values and the analytical results for the concentrations
of five trace metals are given in Table 1. The recoveries of the AAS analytical results for Cd,
Cr, Ni, Pb and Zn ranged between 97.67 – 104.23%. The concentrations of certified materials
SRM 8704 indicated results within the range of the reference values. Therefore, the method
employed for this work is reliable and reproducible. Blanks were also monitored throughout
the analyses and blank subtractions were employed to correct metal concentrations obtained.
2.5 Statistical analysis

Page 8 of 33
Accep
ted
Man
uscr
ipt
8
The data were analysed using the XLSTAT-Pro software (AddinSoft, Inc., NY, USA).
Pearson’s correlation analysis, Factors analysis (FA) and Principal component analysis (PCA)
were employed to explore the interrelationships among trace metals in epipellic sediment
samples and identify their probable origin. The various statistical methods were performed
with a 95% confidence interval (significance p<0.05).
2.6 Assessment of bioaccumulation factors
Bioaccumulation factors (BAFs) are multipliers used to estimate concentrations of
chemicals that can accumulate in tissues through any route of exposure [30]. It is refereed to
as bioconcentration factor (BCF) for aquatic invertebrates. The BCF and biota to sediment
accumulation factor (BSAF) of trace metals from sediment or surface water to animal tissues
can be determined in different samples using the following equations:
)2(dim
)1(
sampleentseinmetalheavyofionconcentrat
tissueanimalinmetalheavyofionconcentratBSAF
samplewaterinmetalheavyofionconcentrat
tissueanimalinmetalheavyofionconcentratBCF
2.7 Contamination factor (CF) and Pollution load index (PLI)
The integrity of this intertidal ecosystem vis-à-vis the degree of anthropogenic trace
metal accumulation in aquatic sediments was evaluated using Tomlinson’s pollution load
index (PLI) [31,32]. Generally, the PLI presents a generic signature of the trace metal
toxicity status of a specific sediment sample of interest while expressing the number of times
by which the trace metal level could actually exceeds the average natural background
concentration. Thus, PLI can be employed to determine and evaluate the integrated pollution
status of combined trace metals at sampling sites [3]. This parameter is expressed as a
contamination factor (CF) of individual trace metal with reference to the natural background
Page 9 of 33
Accep
ted
Man
uscr
ipt
9
concentrations of each metal in sediment. The PLI is usually expressed as the nth root of the
product of the n CF as:
CF =Cmetal
Cbackground(3)
PLI = CF1 x CF2 x CF3 x........... CFnn (4)
where, CF is the contamination factor, n = number of metals (five in the present study)
metalC = the mean metal concentration in polluted sample,
backgroundC = the mean natural background value of that metal
For this work, the “background concentration” simply refers to predetermined concentrations
of trace metals in pristine sediment devoid of any anthropogenic contamination. However,
considering the unprecedented contamination of marine and coastal ecosystems in the Niger
Delta region of Nigeria associated with crude oil spillages, industrial effluents, municipal
sewage runoff, untreated waste dumping, urbanization and deforestation, the attribution of
“background concentration” to sediment from these aquatic systems could be misleading and
inappropriate. Thus, the concept of “background concentration” used here refers to the pre-
anthropogenic (preindustrial) concentrations of trace elements in shale sediments as reported
by Loska et al. [33] and Turekian and Wedepohl [34].
2.8 Modified degree of contamination (mCd) and Geoaccumulation index (Igeo)
The modified degree of contamination commonly denoted as mCd is an empirical and
generalized form of the Håkanson [35] equation introduced by Abrahim [36] for the
calculation of the overall degree of contamination at a given sampling site. It is expressed as
follows:
)5(1
n
CF
mCd
n
i
i

Page 10 of 33
Accep
ted
Man
uscr
ipt
10
The following gradations was proposed for the classification and description of the modified
degree of contamination in sediments: mCd < 1.5 refers to nil to very low degree of
contamination; 1.5 ≤ mCd < 2 indicates low degree of contamination; 2 ≤ mCd < 4 implies
moderate degree of contamination; 4 ≤ mCd < 8 indicates high degree of contamination; 8 ≤
mCd< 16 means very high degree of contamination; 16 ≤ mCd < 32 implies extremely high
degree of contamination and mCd ≥ 32 refers to ultra high degree of contamination.
The Igeo values for the studied trace metals were calculated using the following
equation developed by Müller [37,38]:
)6(5.1
log 2
n
ngeo
B
CI
where, Cn is the measured concentration of selected element (n) in the sediment sample and
Bn is the natural background concentration of metal n. The Igeo consists of seven grades
along with associated sediment quality according to the degree of metal pollution (Table 5).
3. Results and discussion
3.1 Trace metal content
Trace metal levels (mg/L) in water samples were generally low with mean
concentrations of Cd (0.0018±4.5×10⁻¹
), Zn (0.0022±1.3×10⁻³
), Pb (0.0024±8.9×10⁻⁴
), Ni
(0.0024±1.9×10⁻³
), and Cr (0.020±6.0×10⁻³
) (Table 2). The values were within the WHO
limit (mg/L) for these trace metals (Table 2), except at locations DC-Z where Cd and Pb
levels exceeded the WHO water quality criteria [39]. As can be seen from Table 2, the
concentrations of trace metals studied in the surface water were relatively low when
compared with those obtained from the sediment and Leptodius exarata tissues.
Sediments are important host for toxic metals. Due to their static nature, they tend to
accumulate more toxicant than water, which may undergo relatively rapid self-purification.

Page 11 of 33
Accep
ted
Man
uscr
ipt
11
Results (Table 2) revealed that the three sampling locations recorded the highest mean levels
of trace metals, i.e, DC-X: Zn (161.4 mg/kg) and Ni (13.96 mg/kg), DC-Z: Pb (8.90 mg/kg)
and Cd (1.142 mg/kg) and DC-V: Cr (15.95 mg/kg). A comparison with USEPA sediment
quality guideline indicated that epipellic sediment of the investigated ecosystem was
moderately polluted by Zn (Fig. 2). However, the enhanced levels of Cd, Cr, Ni, Pb and Zn in
the coastal sediments indicated possible human-induced pollution such oil spillage,
agricultural runoff (fertilizers, herbicides, pesticides), discharge of untreated industrial
effluents and sewage containing metals into water bodies [21], and less of natural enrichment
through geological weathering in the study area.
Of all trace metals examined in Leptodius exarata tissues (Table 2), Zn was found to be
the most abundant metal. However, Cd levels observed at DC-Y (0.550 mg/kg) and DC-Z
(0.931 mg/kg) and Pb levels (1.90 to 7.35 mg/kg) at all sampling locations exceeded the
FAO/WHO permissible level of Cd (0.5 mg/kg) and Pb (0.3 mg/kg) (FAO/WHO [40],
indicating that Leptodius exarata is unsuitable for human consumption. This finding
emphasises the need for enforcement of stricter methods of wastes/effluents disposal, regular
monitoring of metal status in this fragile ecosystem for effective management and
conservation of the estuary to ensure the safety of the environment and safeguard public
health. The order of trace metals accumulation potential in L. exarata tissues followed the
sequence: Zn > Ni > Cr > Pb > Cd.
3.2 Trace metal accumulation using bioaccumulation factors
The bioaccumulation factors (BAFs), bioconcentration factor (BCF) and biota to
sediment accumulation factor (BSAF) computed for Leptodius exarata are presented in Table
3. Results revealed a significant increase in levels of all the trace metals in L. exarata than in
the surface water samples. The BCF values for trace metals in L. exarata followed the order:

Page 12 of 33
Accep
ted
Man
uscr
ipt
12
Zn>Ni>Pb >Cr>Cd. Relatively high concentration factors were observed for Zn (269,750) at
DC-Y; Ni (11,650) and Pb (3300) at DC-W; Cr (478.89) and Cd (465.5) at DC-Z. The
enhanced bioconcentration factors for these trace metals in tissues of L. exarata showed that
the organism might serve as a good bioindicator for monitoring metals in polluted aquatic
ecosystems. However, the BCF values for Cr and Cd were comparatively lower than Zn, Ni
and Pb factors. This might suggest that Leptodius exarata has low retention of Cr and Cd
when compared with other aquatic organisms such as oyster and mussels, which had been
reported to accumulate Cd in their tissues at levels up to 100,000 times the levels observed in
background water where they live [41-43]. The trend of trace metal accumulation in
organisms used in the present study agrees with reports by other authors on different species
of freshwater organisms [44-46]. Therefore our results indicate that L. exarata is a sentinel
organism for biomonitoring of Zn, Ni and Pb in freshwater ecosystem.
BSAF explores the rate of metal uptake from sediment and accumulation by the crabs
(Leptodius exarata). In the present study, high BSAF values for trace metals were recorded
for Zn (2.95), Pb (1.56) and Ni (1.42) at DC-Y; Cd (0.82) at DC-Z and Cr (0.74) at DC-X;
while low BSAF values were calculated for Pb (0.21) at DC-Z; Cd (0.27) at DC-W; Cr (0.32)
and Ni (0.49) at DC-V; and Zn (0.98) at DC-X. From the result obtained, the metal
enrichment sequence in tissues of L. exarata followed the order: Zn>Pb>Ni>Cd>Cr. Zinc
and lead contamination levels were found to be higher in the crabs than in the sediments,
suggesting a higher rate of accumulation of Zn and Pb by Leptodius exarata. Also our results
showed higher contamination levels in the crabs than sediments in the following trace metals:
Zn (DC-V, DC-W and DC-Z), Ni (DC-Y and DC-Z) and Pb (DC-V, DC-W, DC-X and DC-
Y). However, Cd and Cr concentrations were generally lower in the crab tissues than in the
sediments, suggesting that the levels of contamination of these metals in the estuary were
within the capacity of the crabs to regulate. The observed differences in tissue metal

Page 13 of 33
Accep
ted
Man
uscr
ipt
13
concentration in crabs is similar to reports by other authors [24, 29] and this might be
attributed to variations in body size, age, growth, weight, feeding habit, reproductive
condition, and metabolic rate.
3.3 Sediment pollution indices
Pollution indices are used to assess and classify metal contamination in sediment. In
this study, pollution load index (PLI), contamination factor (CF), modified contamination
degree (mCd), and geoaccumulation index (Igeo) have been applied to assess trace metals
(Zn, Pb, Cd, Ni and Cr) contamination in the sediment samples of the study area (Table 4, 5).
3.3.1 Contamination factor (CF) and Pollution load index (PLI)
In order to understand the contamination state of epipelagic sediment and surface water
of the investigated ecosystem, Tomlinson’s contamination factors and pollution load index
were calculated. Results of CF and PLI computed for Douglas Creek of Qua Iboe estuary are
given in Tables 5. According to Håkanson classification [35] (Table 4), there are locational
differences to the degree of sediment metal contamination of the studied ecosystem. The
status of integrated sediment contamination based on the CF values indicated that the
epipelagic sediments showed low contamination (CF<1) for Pb, Ni and Cr (at all locations)
and Zn (DC-Y only); moderate degree of contamination (1 ≤ CF < 3) for Cd (DC-V, DC-W
and DC-X) and Zn (DC-V, DC-W, DC-X and DC-Z); and considerable degree of
contamination (3 ≤ CF < 6) for Cd at DC-Y and DC-Z locations. It is imperative that regular
monitoring and assessment should be carried out at the sampling locations, where Zn and Cd
indicated categories of moderate and considerable contamination. This is necessary since
sediments are major repositories of metals, and long term environmental inputs of these toxic
trace metals could eventually lead to enhanced degree of ecosystem sedimentary
Page 14 of 33
Accep
ted
Man
uscr
ipt
14
contamination as well as attendant biotransfer and bioaccumulation in plants and animals of
economic importance, which may ultimately get biomagnified up the food web [47-50].
PLI was also used to further probe the degree of pollution of the intertidal sediments
collected from our study area. Based on our results, the PLI values ranged between 0.42 and
0.56 (Table 4). The generally low values of PLI (< 1) at all studied locations implied that the
intertidal ecosystem might not have been critically impacted by anthropogenic contamination.
However, the bioavailability of anthropogenic trace metals load into similar ecosystem has
been reported as remarkably enhanced in concentrations compared to their natural
background sources [29,51,52].
3.3.2 Assessment of modified degree of contamination and geoaccumulation index
The range of mCd values (0.74 – 1.17) for the analysed metals in this study suggests a
very low degree of contamination in all sites. Based on the Igeo data and Müller
geoaccumulation index, the contamination level with respect to each metal is shown in Table
5 (Igeo class). The geoaccumulation index values (Igeo) showed very low values (<0) for Pb,
Ni and Cr and Zn (except at DC-X), implying that there is no contamination by these trace
metals in the Douglas creek sediments. The Igeo values (> 0) for Cd at DC-V, DC-W and
DC-X sites and Zn (DC-X only) indicated that sediments from investigated locations are
uncontaminated to moderately contaminated with Cd and Zn as a result of anthropogenic
activities. However, the Igeo values (> 1) for Cd at DC-Y and DC-Z indicated that the
epipellic sediments from these two locations were moderately contaminated with Cd.
3.4 Potential ecological risks
In order to assess the characteristics and the extent of potential ecological hazards posed
by metals in sediments, a quantitative method proposed by Håkanson [35] was adopted. The
potential ecological risk index (PERI) primarily assesses the probable degree of trace metal

Page 15 of 33
Accep
ted
Man
uscr
ipt
15
contamination in coastal sediments, taking into perspective the relative toxicity of the overall
metals and the short- to long-term response of the environment. The risk index (RI) is
calculated based on the equation:
RI = E fiå (7)
E fi = Tr
iåCsi
Cni
æ
èçö
ø÷(8)
where IR is calculated as the sum of individual risk factors for all trace metals in sediments,
i
fE is the monomial PERI for a single metal, i
sC is the observed concentrations of metals in
sediment samples, and i
nC is the background values of trace metals, and Tri is the toxic
response factor for a selected metal. The Tri for Cd, Cr, Ni, Pb and Zn are 30, 2, 5, 5 and 1
respectively [8, 35, 53].
Table 6 shows the potential ecological risk index of each trace metal at their respective
studied sites as well as the integrated ecological risk index, IR . The mean PERIs for
individual metal stressors showed that the degree of trace metal pollution in the intertidal
sediments was sequenced as Cd>Pb>Zn>Ni>Cr. The DC-V ( i
fE = 54.9) and DC-W ( i
fE =
59.40) sampling sites indicated moderate degree of potential ecological risk for Cd, while
DC-X ( i
fE = 90.0), DC-Y ( i
fE =110.10) and DC-Z ( i
fE =114.3) exhibited considerable
ecological risk. Nevertheless, the coastal ecosystem under investigation generally showed
low potential ecological risk that was associated with Cr, Pb, Ni and Zn. Results of the multi-
elemental potential ecological risk index (RI) computed for DC-Y and DC-Z sites indicated
moderate potential ecological risk, while DC-V, DC-W and DC-X showed low ecological
risk. However, the mean RI for the entire intertidal estuarine ecosystem indicated the
existence of low degree of potential ecological risk ( IR < 95).

Page 16 of 33
Accep
ted
Man
uscr
ipt
16
3.5 Ecotoxicological assessment of trace metals levels in sediments
To evaluate the sediment contamination and potential ecotoxicological effects
associated with the observed concentration of contaminants, two sets of SQGs developed for
marine and estuarine ecosystems [54,55] were applied in this study to assess the
ecotoxicological potential of trace metal concentrations in sediments (a) the effect range-low
(ERL)/effect range-median (ERM); and (b) the threshold effect level (TEL)/probable effect
level (PEL) values (Table 7). Low range values (ERLs/TELs) are concentrations below
which adverse effects upon sediment dwelling fauna would infrequently be expected. In
contrast, the ERMs and PELs represent chemical concentrations above which adverse effects
are likely to occur [55].
Two different ways of comparison that have been included in this study are: the number
of single-species limits values exceeded and the mean quotient calculable from the two
empirically derived sets of SQGs using PEL and ERM values. Table 7 gives the number of
all samples in three ranges of chemical concentrations where adverse biological effects are
expected rarely (<TEL/ERL), occasionally (≥TEL/ ERL and <PEL/ERM) and frequently
(≥PEL/ERM). For Pb, Ni, Zn and Cr in all the sediment samples were in the minimal effect-
range (<TEL/ERL); while for Cd at DC-X, DC-Y and DC-Z sampling locations were above
the threshold effect level (> TEL). For all the metals studied, none of the sediments were in
the probable effect-range and effect range median (≥PELs/ERMs).
In order to determine the possible biological effect of combined toxicant groups, one
can calculate the mean quotient for a large range of contaminants. This mean ERM quotient
(m-ERM-Q) has been calculated according to [56] as follows:
)9(
)/(1
n
ERMC
QERMm
n
i
ii

Page 17 of 33
Accep
ted
Man
uscr
ipt
17
where Ci is the sediment concentration of compound i, ERMi is the ERM for compound i and
n is the number of compound i. Similarly, the mean PEL quotient (m- PEL- Q) can be
calculated according to the equation:
)10(
)/(1
n
PELC
QPELm
n
i
ii
where, PELi is the PEL for compound i.
Mean ERM quotients have been related to probability of toxicity [55, 57, 58] based
on the analysis of matching chemical and toxicity data from 1068 samples from the USA
estuaries. The mean ERM quotient of <0.1 has a 12% probability of being toxic; a mean
ERM quotient of 0.11- 0.5 has a 30% probability of toxicity; a mean ERM quotient of 0.51-
1.5 has a 40% of being toxic and a mean ERM quotient of >1.50 has a 74% of toxicity.
According to this classification, all the sediment samples studied can be classified as
“medium–low priority” sites with 30% probability of toxicity (m-ERM-Q = 0.12 – 0.16).
Similarly, the mean PEL quotient ranged from 0.19 for DC-V to 0.25 for DC-X and DC-Z.
The mean PEL quotients have been classified into four grades as follows: low degree of
contamination (≤0.1), medium-low degree of contamination (0.11–1.5), high-medium degree
of contamination (1.51–2.3), and high degree of contamination (>2.3), respectively having a
8%, 21%, 49% and 73% probability of being toxic [57]. The values of mean PEL quotients
obtained for these sediments are low (0.19-0.25), and as such will be expected to have
medium-low degree of contamination with 21% probability of being toxic.
3.6 Health risk assessment of trace metals
The health risk assessment associated with trace metal pollution was evaluated using the
edible muscle tissues of Leptodius exarata by calculating the estimated dietary intake (EDI)
and target hazard quotients (THQ).
Page 18 of 33
Accep
ted
Man
uscr
ipt
18
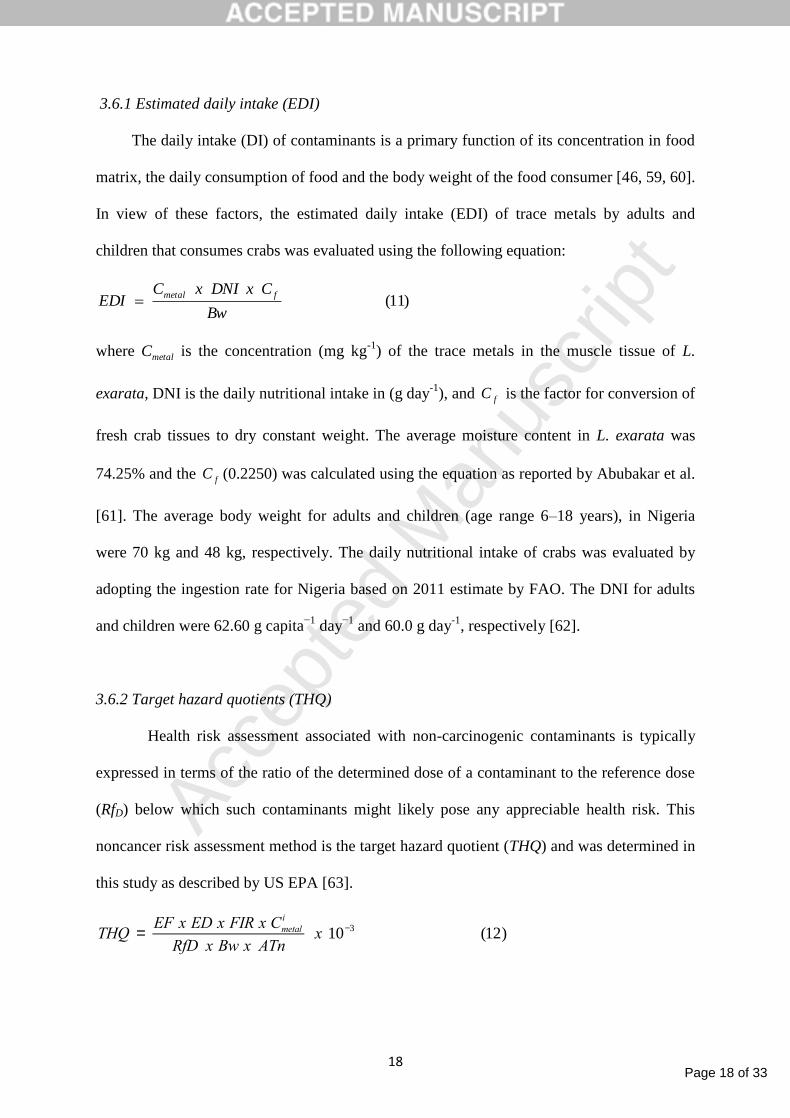
3.6.1 Estimated daily intake (EDI)
The daily intake (DI) of contaminants is a primary function of its concentration in food
matrix, the daily consumption of food and the body weight of the food consumer [46, 59, 60].
In view of these factors, the estimated daily intake (EDI) of trace metals by adults and
children that consumes crabs was evaluated using the following equation:
)11(Bw
CxDNIxCEDI
fmetal
where metalC is the concentration (mg kg-1
) of the trace metals in the muscle tissue of L.
exarata, DNI is the daily nutritional intake in (g day-1
), and fC is the factor for conversion of
fresh crab tissues to dry constant weight. The average moisture content in L. exarata was
74.25% and the fC (0.2250) was calculated using the equation as reported by Abubakar et al.
[61]. The average body weight for adults and children (age range 6–18 years), in Nigeria
were 70 kg and 48 kg, respectively. The daily nutritional intake of crabs was evaluated by
adopting the ingestion rate for Nigeria based on 2011 estimate by FAO. The DNI for adults
and children were 62.60 g capita−1
day−1
and 60.0 g day-1
, respectively [62].
3.6.2 Target hazard quotients (THQ)
Health risk assessment associated with non-carcinogenic contaminants is typically
expressed in terms of the ratio of the determined dose of a contaminant to the reference dose
(RfD) below which such contaminants might likely pose any appreciable health risk. This
noncancer risk assessment method is the target hazard quotient (THQ) and was determined in
this study as described by US EPA [63].
THQ =EF x ED x FIR x Cmetal
i
RfD x Bw x ATnx 10-3 (12)
Page 19 of 33
Accep
ted
Man
uscr
ipt
19
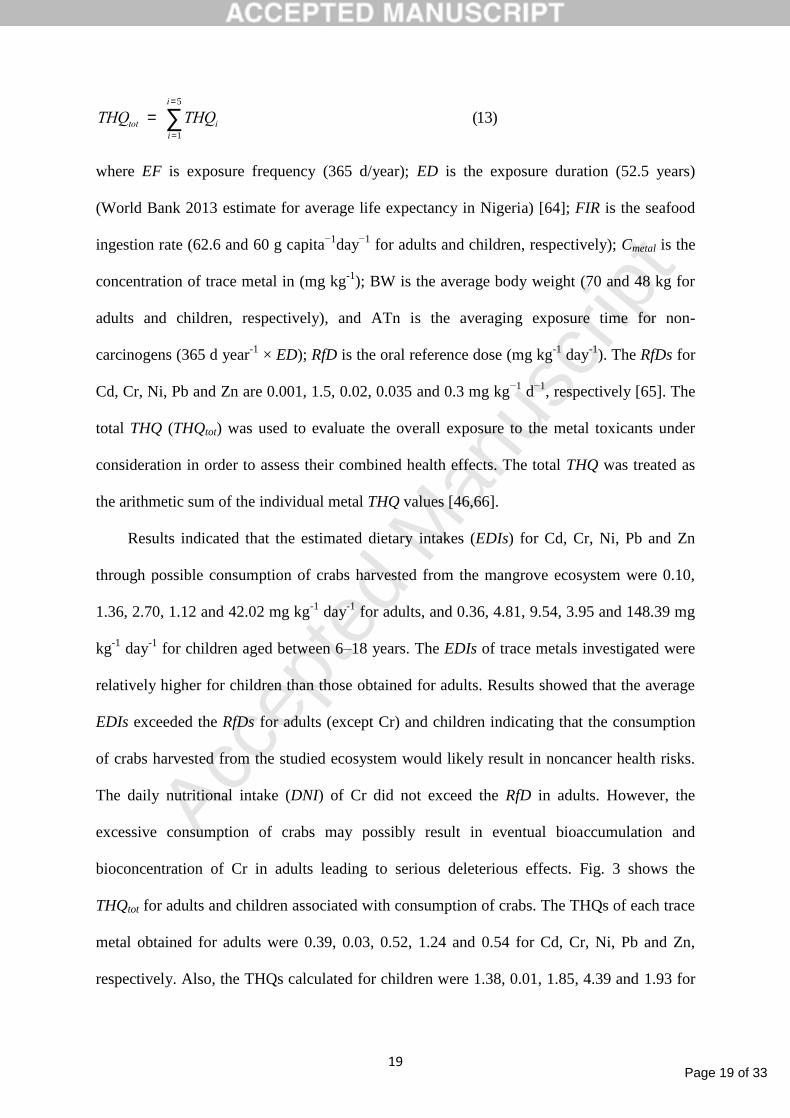
THQtot = THQii=1
i=5
å (13)
where EF is exposure frequency (365 d/year); ED is the exposure duration (52.5 years)
(World Bank 2013 estimate for average life expectancy in Nigeria) [64]; FIR is the seafood
ingestion rate (62.6 and 60 g capita−1
day−1
for adults and children, respectively); Cmetal is the
concentration of trace metal in (mg kg-1
); BW is the average body weight (70 and 48 kg for
adults and children, respectively), and ATn is the averaging exposure time for non-
carcinogens (365 d year-1
× ED); RfD is the oral reference dose (mg kg-1
day-1
). The RfDs for
Cd, Cr, Ni, Pb and Zn are 0.001, 1.5, 0.02, 0.035 and 0.3 mg kg−1
d−1
, respectively [65]. The
total THQ (THQtot) was used to evaluate the overall exposure to the metal toxicants under
consideration in order to assess their combined health effects. The total THQ was treated as
the arithmetic sum of the individual metal THQ values [46,66].
Results indicated that the estimated dietary intakes (EDIs) for Cd, Cr, Ni, Pb and Zn
through possible consumption of crabs harvested from the mangrove ecosystem were 0.10,
1.36, 2.70, 1.12 and 42.02 mg kg-1
day-1
for adults, and 0.36, 4.81, 9.54, 3.95 and 148.39 mg
kg-1
day-1
for children aged between 6–18 years. The EDIs of trace metals investigated were
relatively higher for children than those obtained for adults. Results showed that the average
EDIs exceeded the RfDs for adults (except Cr) and children indicating that the consumption
of crabs harvested from the studied ecosystem would likely result in noncancer health risks.
The daily nutritional intake (DNI) of Cr did not exceed the RfD in adults. However, the
excessive consumption of crabs may possibly result in eventual bioaccumulation and
bioconcentration of Cr in adults leading to serious deleterious effects. Fig. 3 shows the
THQtot for adults and children associated with consumption of crabs. The THQs of each trace
metal obtained for adults were 0.39, 0.03, 0.52, 1.24 and 0.54 for Cd, Cr, Ni, Pb and Zn,
respectively. Also, the THQs calculated for children were 1.38, 0.01, 1.85, 4.39 and 1.93 for

Page 20 of 33
Accep
ted
Man
uscr
ipt
20
Cd, Cr, Ni, Pb and Zn, respectively. In the adults, the THQ value for Pb was greater than 1
through the consumption of crabs. This implies that there could be possible health risks
associated with Pb.
For the children, there are greater health risks that would be linked to consumption of
crabs since the THQs of Cd, Ni, Pb and Zn were greater than 1. Obviously, the children are
more vulnerable to health risks associated with trace metals contamination than adults. In
general, the THQtot for children (THQtot = 9.58) was higher compared to the THQtot for the
adults (THQtot = 2.70).
3.7 Factor analysis
Factor analysis (FA) was applied to interpret relationships between variables and we
have used the technique of correlation analysis and Principal Component Analysis (PCA) to
extract significant principal components (PCs) and further reduce the contribution of
variables with minor significance. The XLSTAT software (version 2015.1.03) was used for
the PCA. Pearson correlation analysis indicated that a significant correlation (r = 0.799,
p<0.05) was found between Pb and Cr indicating that these trace metals might have
originated from same pollution source(s) [9, 10, 49, 67]. Correlation coefficients derived
from interrelationships among investigated trace metals were either negative or positive but
not significant. Results of n-Pearson PCA conducted, primarily elucidated the
interrelationships among the five studied trace metals and also identify their possible sources
(Table 8). The factors loading presented in Table 9 indicated that the concentrations of trace
metals for the intertidal sediments of the studied ecosystem were grouped into a two principal
component model. The loading plot and the biplot of the PCs are presented in Fig. 4. The
Eigen values of the PCs are greater than 1 and in general accounted for 74.12% of the
variability in concentrations of trace metals found in the intertidal sediments. The PC1
indicated that 44.31% of the total variance was positively related to Cd, Cr, Pb and Ni, with

Page 21 of 33
Accep
ted
Man
uscr
ipt
21
Cr and Pb showing relatively strong relationships. Zn was moderately negatively related to
PC1. However, the loading of Ni and Cd with PC1 suggested possible contamination could
be influenced by anthropogenic pollution sources into the sediment in addition to background
contributions. PC2, which explained 29.81% of the total variance indicated positive
interrelationships with Cd, Ni and Zn, while Pb and Cr were negatively related to PC2.
4. Conclusion
Trace metals (Cd, Cr, Pb, Ni, and Zn) were detected in Leptodius exarata epipellic
sediment and surface water collected from Douglas Creek, Qua Iboe estuary. The
concentrations of the metals exhibited significant variability between sampling sites and
environmental matrices. The mean concentration of some trace metals exceeded the
recommended guideline values in most matrices, implying that the aquatic ecosystem and its
biota may be exposed to short- and long-term metals pollution. Cd levels in L. exarata
obtained at DC-Y and DC-Z, and Pb in all locations exceeded the FAO/WHO permissible
level of 0.5 mg/kg. Trace metal enrichment in the tissues of L. exarata ranked in the
following order: Zn > Pb >Ni > Cd > Cr. However, the modified degree of contamination
(mCd) and pollution load index (PLI) for all analysed metals indicated very low degree of
contamination at all sites. On the contrary, the contamination factor (CF) values showed that
sediments were moderately contaminated with Cd and Zn, and considerably contaminated
with Cd at DC-Y and DC-Z. Most of the calculated Igeo values for Zn showed that the
sediments were practically uncontaminated at all sites (Igeo < 0) except at DC-X site. The
sediments from DC-V, DC-W and DC-X were uncontaminated to moderately contaminated
(Igeo > 0) with Cd and Zn (only at DC-X) as a result of anthropogenic activities. However,

Page 22 of 33
Accep
ted
Man
uscr
ipt
22
epipellic sediments from DC-Y and DC-Z sites were moderately contaminated (Igeo > 1)
with Cd.
The mean-ERM quotient and mean-PEL quotient of all the sediment samples were
low, and as such will be expected to have medium-low degree of contamination with 30%
and 21% probability of being toxic, respectively. The mean RI for the entire intertidal
estuarine system indicated the existence of low degree of potential ecological risk (RI < 150).
PCA has proved to be an effective tool for investigating the source(s) metal pollution. The
results of our analysis revealed underlying relationships among the trace metal data, which
had physical meanings. More specifically, PCA applied on trace metal pollution data resulted
in components attributed to possible contamination, which could be influenced by
anthropogenic pollution sources into the sediment in addition to background contributions.
Health risks (EDI and THQ) associated with trace metals contamination in L. exarata were
significant in children than adults.
Conflicts of interest
The authors declare no conflict of interest
Acknowledgements
We thank anonymous reviewers for their comments and suggestions made to improve the
original manuscript.
5. References
[1] X. Gao, F. Zhou, C.T.A. Chen, Pollution status of the Bohai Sea: an overview of the
environmental quality assessment related trace metals. Environ. Int. 62(2014), 12–30.
[2] L. Huang, X. Pu, J. –F. Pan, B. Wang, Heavy metal pollution status in surface sediments
of Swan Lake lagoon and Rongcheng Bay in the northern Yellow Sea. Chemosphere
93(2013), 1957–1964.
[3] J. Pan, J-F. Pan, M. Wang, Trace elements distribution and ecological risk assessment of
seawater and sediments from Dingzi Bay, Shandong Peninsula, North China. Marine
Pollution Bulletin 89 (2014) 427–434.
[4] N.U. Benson, J.P. Essien, G.A. Ebong, A.B. Williams, Petroleum hydrocarbons and
limiting nutrients in Macura reptantia, Procambarus clarkii and benthic sediment from
Qua Iboe Estuary, Nigeria. Enviromentalist, 28(3)(2007a), 275-282.
[5] J.P. Essien, N.U. Benson, S.P. Antai, Seasonal dynamics of physicochemical properties
and heavy metal burdens in Mangrove sediments and surface water of the brackish Qua

Page 23 of 33
Accep
ted
Man
uscr
ipt
23
Iboe Estuary, Nigeria. Toxicological and Environmental Chemistry, 90(2)(2008a), 259 –
273.
[6] J.P. Essien, V. Essien, A.A. Olajire, Heavy metal burdens in patches of asphyxiated
swamp areas within the Qua Iboe estuary mangrove ecosystem. Environmental Research
109(2009), 690–696.
[7] N.U. Benson, J.P. Essien, A.B. Williams, D.E. Bassey, Mercury accumulation in fishes
from tropical aquatic ecosystems in the Niger Delta of Nigeria. Current Science,
96(2)(2007b), 781-785.
[8] M. Maanan, M. Saddik, M. Maanan, M. Chaibi, O. Assobhei, B. Zourarah,
Environmental and ecological risk assessment of heavy metals in sediments of Nador
lagoon, Morocco. Ecological Indicators, 48(2015), 616–626.
[9] J. Liu, H. Wu, J. Feng, Z. Li, G. Lin, Heavy metal contamination and ecological risk
assessments in the sediments and zoobenthos of selected mangrove ecosystems, South
China. Catena, 119 (2014), 136–142.
[10] N.U. Benson, E.D. Udosen, O. Akpabio, Interseasonal distribution and partitioning of
heavy metals in subtidal sediment of Qua Iboe Estuary and associated Creeks, Niger
Delta (Nigeria). Environmental Monitoring and Assessment, 146(1-3)(2008), 253-265.
[11] M.E. Goher, H.I. Farhat, M.H. Abdo, S.G. Salem, Metal pollution assessment in the
surface sediment of Lake Nasser, Egypt. Egyptian Journal of Aquatic Research, 40(2014),
213– 224.
[12] S. Götze, A. Bose, I.M. Sokolova, D. Abele, R. Saborowski, The proteasomes of two
marine decapod crustaceans, European lobster (Homarus gammarus) and Edible crab
(Cancer pagurus) are differently impaired by heavy metals. Comparative Biochemistry
and Physiology, Part C 162(2014), 62–69.
[13] S. Rahmanpour, N.F. Ghorghani, S. Masoumeh, L. Ashtiyani, Heavy metal in water and
aquatic organisms from different intertidal ecosystems, Persian Gulf. Environmental
Monitoring and Assessment, 186(2014), 5401-5409.
[14] N. Alkan, M. Aktas¸ K. Gedik, Comparison of metal accumulation in fish species from
the southeastern Black Sea. Bulletin of Environmental Contamination and Toxicology
88(2012), 807-812.
[15] N.U. Benson, W.U. Anake, I.O. Olanrewaju, Analytical Relevance of Trace Metal
Speciation in Environmental and Bio physicochemical Systems. American Journal of
Analytical Chemistry, 4(2013), 633-641.
[16] P. Vrhovnik, J.P. Arrebola, T. Serafimovski, T. Dolenec, N.R. Smuc, M. Dolenec, E.
Mutch, Potentially toxic contamination of sediments, water and two animal species in
Lake Kalimanci, FYR Macedonia: Relevance to human health. Environmental Pollution,
180(2013), 92-100.
[17] D. Crafford, A. Avenant-Oldewage, Bioaccumulation of non-essential trace metals in
tissues and organs of Clarias gariepinus (sharptooth catfish) from the Vaal River system-
strontium, aluminium, lead and nickel. Water SA, 36(5)(2010). 621-640.
[18] E.O. Farombi, O.A. Adelowo, Y.R. Ajimoko, Biomarkers of Oxidative Stress and Heavy
Metal Levels as Indicators of Environmental Pollution in African Cat Fish (Clarias
gariepinus) from Nigeria Ogun River. Int. J. Environ. Res. Public Health 4(2)
(2007),158-165.
[19] A. Kasperczyk, S. Kasperczyk, S. Horak, A. Ostalowsk, E. Grucka-Mamczar, E. Romuk,
A. Olejek, E. Birkner, Assessment of semen function and lipid peroxidation among lead
exposed men. Toxicol. Appl. Pharmacol. 228(2008), 378- 384.
[20] C.M. Ramakritinan, R. Chandurvelan, A.K. Kumaraguru, Acute toxicity of metals: Cu,
Pb, Cd, Hg and Zn on marine molluscs, Cerithedia cingulata G. and Modiolus
philippinarum H. Ind. J. Geo-Mar. Sci., 41(2) (2012), 141–145.

Page 24 of 33
Accep
ted
Man
uscr
ipt
24
[21] I.E. Taiwo, A. Henry, A.P Nimbufe, O.O. Adetoro, Heavy metal bioaccumulation and
biomarkers of oxidative stress in the wild African tiger frog, Hoplobatrachus occipitalis.
African Journal of Environmental Science and Technology 8(1) (2014), 6-15.
[22] J. Ivan, V.J. Željka, C. Gorčin, G. Zoran, J. Ljubinko, S. Stefan, L. Mirjana,
Determination of differential heavy metal and trace element accumulation in liver, gills,
intestine and muscle of sterlet (Acipenser ruthenus) from the Danube River in Serbia by
ICP-OES. Microchem. J., 98(2011), 77–81.
[23] N.U. Benson, J.P. Essien, D.E. Bassey, Hydrobiological constraints of trace metals in
surface water, coastal sediments and water lily of Calabar River, Nigeria. African Journal
of Biotechnology, 6 (2007): 2358-2362.
[24] R. Chaiyara, M. Ngoendee, M. Kruatrachue, Accumulation of Cd, Cu, Pb, and Zn in
water, sediments,and mangrove crabs (Sesarma mederi) in the upper Gulf of Thailand.
Science Asia 39(2013), 376–383.
[25] H. Song, Z. Sun, Temporal variations and bioaccumulation of heavy metals in different
Suaeda salsa marshes of the Yellow River estuary, China. Environmental Science and
Pollution Research, 21 (24) (2014), 14174-14187.
[26] M.E. Conti, M. Mecozzi, M.G. Finoia, Determination of trace metal baseline values in
Posidonia oceanica, Cystoseira sp., and other marine environmental biomonitors: a
quality control method for a study in South Tyrrhenian coastal areas. Environmental
Science and Pollution Research, 22 (5) (2015), 3640-3651.
[27] A. Ramesh, M.K. Rama, K. Seshaiah, N.D. Jeyakumar, Determination of trace elements
by inductively coupled plasma atomic emission spectrometry (ICP-AES) after
preconcenration on a support impregnated with piperidine dithiocarbamate. Analytical
Letter 34(2)(2001), 219–229.
[28] S.T. Ho, I.J. Tsai, K.C. Yu, Correlation among aqua-regia extractable heavy metals in
vertical river sediments. Diffuse Pollution Conference, Dublin, 14(2003), 12–18.
[29] M. Hosseini, S.M.B. Nabavi, J. Pazooki, Y. Parsa, The Levels of Toxic Metals in Blue
Crab Portunus segnis from Persian Gulf. J Marine Sci. Res. Dev., 4(2014), 145-148.
[30] US Environmental Protection Agency, Bioaccumulation Testing and Interpretation for
the Purpose of Sediment Quality Assessment. U.S. Environmental Protection Agency,
(2000a), EPA-823-R-00-001.
[31] D.C. Tomlinson, J.G. Wilson, C.R. Harris, D.W. Jeffrey, Problems in the assessment of
heavy metals levels in estuaries and the formation of pollution index. Helgoland Mar. Res.
33(1980), 566–575.
[32] T.D. Sarala, M.T.S.R. Uma, Metal pollution assessment in ground water. Bulletin of
Environment, Pharmacology and Life Sciences, l2(12) (2013), 122-129.
[33] K. Loska, J. Cebula, J. Pelczar, D. Wiechuła, J. Kwapulinski, Use of enrichment and
contamination factors together with geoaccumulation indexes to evaluate the content of
Cd, Cu, and Ni in the Rybnik water reservoir in Poland. Water Air Soil Pollut. 93(1997),
347–365.
[34] K.K. Turekian, K.H. Wedepohl, Distribution of the elements in some major units of the
Earth’s crust. Geol. Soc. Am. Bull. 72(1961), 175–192.
[35] L. Håkanson, Ecological Risk Index for Aquatic Pollution Control. A Sedimentological
Approach. Water Research, 14(1980), 975-1001.
[36] G.M.S. Abrahim, Holocene sediments of Tamaki Estuary: Characterization and impact
of recent human activity on an urban estuary in Auckland, New Zealand, PhD Thesis
University of Auckland, Auckland (New Zealand), (2005), 361.
[37] G. Müller, Index of geoaccumulation in sediments of the Rhine River. Geojournal,
2(1969), 108–118.

Page 25 of 33
Accep
ted
Man
uscr
ipt
25
[38] G. Müller, Schwermetalle in den sediment des Rheins, Veranderungem Seit 1971.
Umschau, 79(1979), 778-783.
[39] World Health Organization, Guideline for drinking water quality–4th Edition (2011).
[40] FAO/WHO, Report of the 32nd session of the Codex Committee on food additives and
contaminant, Appendix XII and XII, (2000). Available at: http://www.fao.org/docrep/
meeting/005/x7137e/ x7137 e20.htm (Accessed: March15, 2014).
[41] M. Baudrimont, J. Schafer, V. Marie, et al., Geochemical survey and metal
bioaccumulation of three bivalve species (Crassostrea gigas, Cerastoderma edule and
Ruditapes philippinarum) in the Nord Medoc salt marshes (Gironde estuary, France). Sci.
Total Environ. 337(1-3) (2005), 265-280.
[42] R.S. Rasmussen, M. T. Morrissey, The Effects of Processing Methods and Storage on
Cadmium Levels in Pacific Oysters (Crassostrea gigas). Journal of Aquatic Food Product
Technology 16(3) (2007), 3-17.
[43] B. Chiarelli, M.C. Roccheri, Marine invertebrates as bioindicators of heavy metal
pollution. Open Journal of Metal, 4(2014), 93–106.
[44] W.E.P. Avelar, F.L.M. Mantelatto, A.C. Tomazelli, D.M.L. Silva, T. Shuhama, J.L.C.
Lopes, The marine mussel Perna perna (Mollusca, Bivalvia, Mytilidae) as an indicator of
contamination by heavy metals in the Ubatuba Bay, Sao Paulo, Brazil. Water Air. Soil
Pollut. 118(2000), 65-72.
[45] C.K. Kwok, Y. Liang, H. Wang, Y.H. Dong, S.Y. Leung, M.H. Wong, Bioaccumulation
of heavy metals in fish and Ardeid at Pearl River Estuary, China. Ecotoxicology and
Environmental Safety, 106(2005), 62–67.
[46] S. Zhao, C. Feng, W. Quan, X. Chen, J. Niu, Z. Shen, Role of living environments in the
accumulation characteristics of heavy metals in fishes and crabs in the Yangtze River
Estuary, China. Marine Pollution Bulletin, 64(6)(2012), 1163–1171.
[47] M.S. Cheung, W. Wang, Analyzing biomagnification of metals in different marine food
webs using nitrogen isotopes. Mar. Pollut. Bull., 56(2008), 2082–2105.
[48] D.K. DeForest, K.V. Brix, W.J. Adams, Assessing metal bioaccumulation in aquatic
environments: the inverse relationship between bioaccumulation factors, trophic transfer
factor and exposure concentration. Aquat. Toxicol. 86(2007), 236–246.
[49] Y. Yi, Z. Yang, S. Zhang, Ecological risk assessment of heavy metals in sediment and
human health risk assessment of heavy metals in fishes in the middle and lower reaches
of the Yangtze River basin. Environ. Pollut. 159(2011), 2575–2585.
[50] A.P. Majer, A.A.V. Petti, T.N. Corbisier, A.P. Ribeiro, C.Y.S. Theophilo, P.A. Ferreira,
R.C.L. Figueira, Bioaccumulation of potentially toxic trace elements in benthic organisms
of Admiralty Bay (King George Island, Antarctica). Marine Pollution Bulletin, 79(2014),
321–325.
[51] B. Deng, J. Zhang, G. Zhang, J. Zhou, Enhanced anthropogenic heavy metal dispersal
from tidal disturbance in the Jiaozhou Bay, North China. Environ. Monit. Assess.
161(2010), 349–358.
[52] A.M. Rabee, Y.F. Al-Fatlawy, A.N. Abdown, M. Nameer, Using pollution load index
(PLI) and geoaccumulation index (I-Geo) for the assessment of heavy metals pollution in
Tigris River sediment in Baghdad Region. Journal of Al-Nahrain University 14(4)(2011),
108-114.
[53] Y. Wang, L. Yang, L. Kong, L. Liu, L. Wang, J. Zhu, Spatial distribution, ecological
risk assessment and source identification for heavy metals in surface sediments from
Dongping Lake, Shandong, East China. CATENA 125(2015), 200–205.

Page 26 of 33
Accep
ted
Man
uscr
ipt
26
[54] D.D. MacDonald, C.G. Ingersoll, T.A. Berger, Development and evaluation of
consensus-based sediment quality guidelines for fresh- water ecosystems. Arch. Environ.
Contam. Toxicol., 39(2000), 20–31.
[55] E.R. Long, D.D. MacDonald, Recommended uses of empirically derived, sediment
quality guidelines for marine and estuarine ecosystems. Human and Ecological Risk
Assessment, (5) (1998), 1019–1039.
[56] E.R. Long, D.D. MacDonald, S.L. Smith, F.O. Calder, Incidence of adverse biological
effects within ranges of chemical concentrations in marine and estuarine sediments.
Environmental Management, 19 (1995), 81–97.
[57] E.R. Long, D.D. MacDonald, C.G. Severn, C.B. Hong, Classifying probabilities of acute
toxicity in marine sediments with empirically derived sediment quality guidelines.
Environmental Toxicology and Chemistry, 19(2000), 2598–2601.
[58] E.R. Long, C.G. Ingersoll, D.D. MacDonald, Calculation and uses of mean sediment
quality guideline quotients: a critical review. Environ. Sci. Technol., 40(2006), 1726–
1736.
[59] J.J. Fu, Q.F. Zhou, J.M. Liu, W. Liu, T. Wang, Q.H. Zhang, G.B. Jiang, High levels of
heavy metals in rice (Oryza sativa L.) from a typical E-waste recycling area in southeast
China and its potential risk to human health. Chemosphere, 71(2008), 1269–1275.
[60] X.L. Wang, T. Sato, B.S. Xing, S. Tao, Health risks of heavy metals to the general
public in Tianjin, China via consumption of vegetables and fish. Science of the Total
Environment, 350(2005), 28–37.
[61] A. Abubakar, A. Uzairu, P.A. Ekwumemgbo, O.J. Okunola, Risk Assessment of Heavy
Metals in Imported Frozen Fish Scomber scombrus Species Sold in Nigeria: A Case
Study in Zaria Metropolis. Advances in Toxicology, ID 303245(2015), 11 pages,
doi:10.1155/2015/303245.
[62] Food and Agriculture Organization of the United Nations (FAO). Food balance sheet of
fish and fishery products in live weight and fish contribution to protein supply: 2011
world by continent. Available: http://faostat3.fao.org/browse/FB/FBS/E, 2015. [Accessed:
13 April 2015].
[63] US EPA, Risk-based concentration table. Philadelphia PA: United States Environmental
Protection Agency, Washington DC, . (2000b).
[64] World Bank (2014). Life expectancy at birth, total (years). Available at:
http://data.worldbank.org/indicator/SP.DYN.LE00.IN/countries/NG-
ZFXN?display=graph. [Accessed: May 5, 2015].
[65] US-EPA, I.S.U., Environmental Protection Agency, Integrated Risk Information System,
CRC (2008).
[66] L.C. Chien, T.C. Hung, K.Y. Choang, C.Y. Yeh, P.J. Meng, M.J. Shieh, et al., Daily
intake of TBT, Cu, Zn, Cd and As for fishermen in Taiwan. Sci. Total Environ.,
285(2002),177–85.
[67] N.U. Benson, F.E. Asuquo, A.B. Williams, J.P. Essien, C.I. Ekong, O. Akpabio, et al.,
Source Evaluation and Trace Metal Contamination in Benthic Sediments from Equatorial
Ecosystems Using Multivariate Statistical Techniques. PLoS ONE 11(6)(2016):e0156485.
doi:10.1371/journal.pone.0156485
[68] World Health Organization, Guidelines for drinking water quality, vol. 1 (1993), Geneva.
[69] US Environmental Protection Agency, Risk Assessment, Management and
communication of drinking water contamination, EPA-625/4-89/024. Office of Drinking
Water, Washington D.C, (1990).
[70] V.I. Frits, The Water Encyclopedia. Lewis Publishers, Boca Raton, FL, (1990).
Page 27 of 33
Accep
ted
Man
uscr
ipt
27
[71] Q. Gong, J. Deng, Y. Xiang, Q. Wang, L. Yang, Calculating pollution indices by heavy
metals in ecological geochemistry assessment and a case study in parks of Beijing. J.
Chin. Univ. Geosci. 19(3) (2008), 230–241.
[72] A. Buccolieri, G. Buccolieri, N. Cardellicchio, et al Heavy metals in marine sediments
of Taranto Gulf, Ionian sea, Southern Italy. Mar. Chem. 99(2006), 227–235.
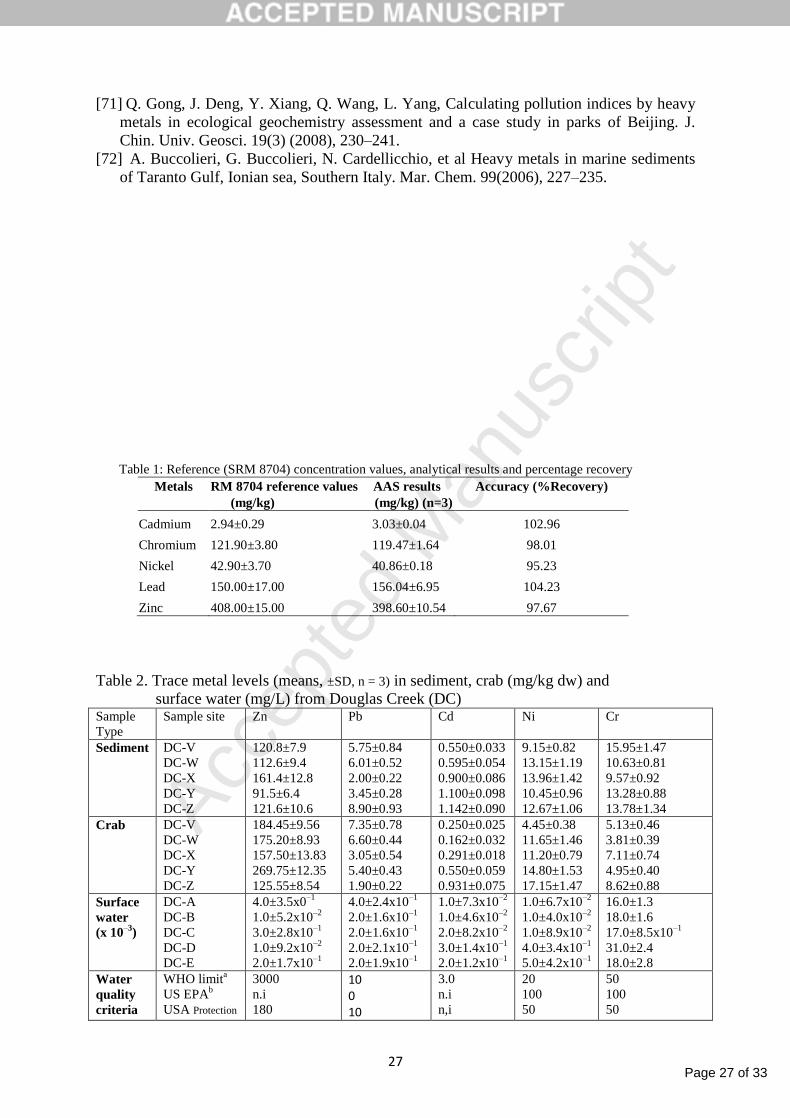
Table 1: Reference (SRM 8704) concentration values, analytical results and percentage recovery
Metals RM 8704 reference values AAS results Accuracy (%Recovery)
(mg/kg) (mg/kg) (n=3)
Cadmium 2.94±0.29 3.03±0.04 102.96
Chromium 121.90±3.80 119.47±1.64 98.01
Nickel 42.90±3.70 40.86±0.18 95.23
Lead 150.00±17.00 156.04±6.95 104.23
Zinc 408.00±15.00 398.60±10.54 97.67
Table 2. Trace metal levels (means, ±SD, n = 3) in sediment, crab (mg/kg dw) and
surface water (mg/L) from Douglas Creek (DC) Sample
Type
Sample site Zn Pb Cd Ni Cr
Sediment DC-V
DC-W
DC-X
DC-Y
DC-Z
120.8±7.9
112.6±9.4
161.4±12.8
91.5±6.4
121.6±10.6
5.75±0.84
6.01±0.52
2.00±0.22
3.45±0.28
8.90±0.93
0.550±0.033
0.595±0.054
0.900±0.086
1.100±0.098
1.142±0.090
9.15±0.82
13.15±1.19
13.96±1.42
10.45±0.96
12.67±1.06
15.95±1.47
10.63±0.81
9.57±0.92
13.28±0.88
13.78±1.34
Crab DC-V
DC-W
DC-X
DC-Y
DC-Z
184.45±9.56
175.20±8.93
157.50±13.83
269.75±12.35
125.55±8.54
7.35±0.78
6.60±0.44
3.05±0.54
5.40±0.43
1.90±0.22
0.250±0.025
0.162±0.032
0.291±0.018
0.550±0.059
0.931±0.075
4.45±0.38
11.65±1.46
11.20±0.79
14.80±1.53
17.15±1.47
5.13±0.46
3.81±0.39
7.11±0.74
4.95±0.40
8.62±0.88
Surface
water
(x 10–3
)
DC-A
DC-B
DC-C
DC-D
DC-E
4.0±3.5x0–1
1.0±5.2x10⁻²
3.0±2.8x10⁻¹
1.0±9.2x10⁻²
2.0±1.7x10⁻¹
4.0±2.4x10⁻¹
2.0±1.6x10⁻¹
2.0±1.6x10⁻¹
2.0±2.1x10⁻¹
2.0±1.9x10⁻¹
1.0±7.3x10⁻²
1.0±4.6x10⁻²
2.0±8.2x10⁻²
3.0±1.4x10⁻¹
2.0±1.2x10⁻¹
1.0±6.7x10⁻²
1.0±4.0x10⁻²
1.0±8.9x10⁻²
4.0±3.4x10⁻¹
5.0±4.2x10⁻¹
16.0±1.3
18.0±1.6
17.0±8.5x10⁻¹
31.0±2.4
18.0±2.8
Water
quality
criteria
WHO limita
US EPAb
USA Protection
3000
n.i
180
10 0 10
3.0
n.i
n,i
20
100
50
50
100
50
Page 28 of 33
Accep
ted
Man
uscr
ipt
28
)/( Lg of aquatic life
aWorld Health Organization[68]; bUSEPA [69], cFrits [70].
Table 3: Trace metal accumulation levels in tissue of crab (loptodius exarata) using
biota to sediment accumulation and bioconcentration factors.
Bioaccumulation
Factors Sample
code
Zn Pb Cd Ni Cr
BSAF DC-V
DC-W
DC-X
DC-Y
DC-Z
1.53
1.56
0.98
2.95
1.03
1.28
1.10
1.52
1.56
0.21
0.45
0.27
0.32
0.50
0.82
0.49
0.88
0.80
1.42
1.35
0.32
0.36
0.74
0.37
0.62
BCF DC-V
DC-W
DC-X
DC-Y
DC-Z
46112.5
175,200
52,500
269,750
62,775
1837.5
3300
1525
2700
950
250
0.162
145.5
183.33
465.5
4450
11650
11200
3700
3430
320.62
211.67
418.24
159.68
478.89
Table 4. Trace metal concentrations (mg/kg) of sediments, SQG by US EPA, and
Pollution Load index (PLI) of metals in sediment types from Douglas Creek Trace
metals
Sediment codes
DC-V DC-W DC-X DC-Y DC-Z
Natural
background
concentration
SQG
Non-polluted Moderately polluted Heavily polluted
Zn
Pb
Cd
Ni
Cr
mCd
PLIb
120.8 112.6 161.4 91.5 121.6
(1.27) (1.18) (1.7) (0.96) (1.28)
5.75 6.01 2.00 3.45 8.90
(0.29) (0.3) (0.1) (0.17) (0.44)
0.55 0.595 0.900 1.10 1.142
(1.83) (1.98) (3) (3.67) (3.81)
9.15 13.15 13.96 10.45 12.67
(0.13) (0.19) (0.21) (0.15) (0.19)
15.95 10.63 9.57 13.28 13.78
(0.18) (0.11) (0.15) (0.15) (0.13)
0.74 0.75 1.03 1.02 1.17
0.44 0.43 0.44 0.42 0.56
95.16±0.20a
20.08±0.18
0.30±0.00
68.48±1.79
88.72±15.67
<90 90–200 > 200
<40 40–60 > 60
– – > 6
<20 20–50 > 50
<25 25–75 > 75
Values in parenthesis are the contamination factors; aAverage natural background concentration (±SD, n=3),
bGong et al.[71].
Table 5. Igeo classesa of trace metals in sediments from Douglas Creek of Qua Iboe
estuary
Trace
metals
Igeob
DC-V DC-W DC-X DC-Y DC-Z
Zn
Pb
Cd
Ni
Cr
0 0 1 0 0
0 0 0 0 0
1 1 1 2 2
0 0 0 0 0
0 0 0 0 0

Page 29 of 33
Accep
ted
Man
uscr
ipt
29
a >5, extremely contaminated; 4–5, strongly to extremely strongly contaminated; 3–4, strongly contaminated;
2–3, moderately to strongly contaminated; 1–2, moderately contaminated; 0–1, uncontaminated to moderately
contaminated; <0, uncontaminated, bBuccolieri et al. [72],
Table 6: The potential ecological risk assessmenta for investigated trace metals in
epipellic sediments from Douglas creek, Qua Iboe Estuary
Sampling
sites
Calculated Eif of individual trace metals
a
Zn Pb Cd Ni Cr RI
b
DC-V
DC-W
DC-X
DC-Y
DC-Z
Min.
Max.
Mean
1.27 1.45 54.90 0.65 0.36
1.18 1.50 59.40 0.95 0.22
1.70 0.50 90.00 1.05 0.30
0.96 0.85 110.10 0.75 0.20
1.28 2.20 114.30 0.95 0.01
0.96 0.50 54.90 0.65 0.01
1.28 2.20 114.30 1.05 0.36
1.27 1.30 85.74 0.87 0.24
58.63
63.25
93.55
112.96
118.74
58.63
118.74
89.43 a
Eif <40, Low risk; 40 ≤ E
if < 80, Moderate risk; 80 ≤ E
if < 160, Considerable risk;
160 ≤ Eif < 320, High risk; E
if ≥ 320, Very high risk;
bRI < 150, Low risk;
150 ≤ RI < 300, Moderate risk; 300 ≤ RI < 600, High risk; RI ≥ 600, Very high risk.
Table 7. TEL, PEL, ERL and ERM guideline values for trace elementsa,b
and mean
quotients using the PEL and ERM values Trace metals Sediments
DC-V DC-W DC-X DC-Y DC-Z
TEL PEL ERL ERM
Zn
Pb
Cd
Ni
Cr
m-PEL-Q
m-ERM-Q
120.8 112.6 161.4 91.5 121.6
5.75 6.01 2.00 3.45 8.90
0.55 0.595 0.90 1.10 1.142
9.15 13.15 13.96 10.45 12.67
12.95 10.63 9.57 13.28 13.78
0.19 0.20 0.25 0.20 0.25
0.12 0.13 0.16 0.12 0.15
124.0 271.0 150.0 410.0
30.2 112.2 46.9 218.0
0.6 3.53 1.2 9.6
15.9 42.8 20.9 51.6
52.3 160.4 81.0 370.0
aLong et al. [56], bConcentrations are in mg/kg dry weight
Table 8: Pearson correlation coefficients (p<0.05) between different trace metals in
epipellic sediment samples.
Zn Pb Cd Ni Cr
Zn 1
Pb -0.308 1
Cd -0.107 0.038 1
Ni 0.385 0.419 0.493 1
Cr -0.309 0.799 0.332 0.199 1

Page 30 of 33
Accep
ted
Man
uscr
ipt
30
Table 9: Loadings of variables on significant principal components for trace metals in
sediment
PC1 PC2
Zn -0.314 0.793
Pb 0.868 -0.207
Cd 0.522 0.417
Ni 0.557 0.766
Cr 0.884 -0.243
Eigenvalue 2.215 1.490
Variability (%) 44.310 29.805
Cumulative % 44.310 74.115

Page 31 of 33
Accep
ted
Man
uscr
ipt
31
Fig. 1: Qua Iboe Estuary mangrove ecosystem showing the sampling location
along Douglas Creek. Insert: Map of Nigeria showing the location of
the study area.

Page 32 of 33
Accep
ted
Man
uscr
ipt
32
Zn
0
20
40
60
80
100
120
140
160
180
DC-V DC-W DC-X DC-Y DC-Z
Sediment
Co
nc. (m
g/k
g d
w)
Pb
0
5
10
15
20
25
30
35
40
45
50
DC-V DC-W DC-X DC-Y DC-Z
Sediment
Co
nc
. (m
g/k
g d
w)
Cd
0
1
2
3
4
5
6
7
8
9
10
DC-V DC-W DC-X DC-Y DC-Z
Sediment
Co
nc. (m
g/k
g d
w)
Ni
0
5
10
15
20
25
30
DC-V DC-W DC-X DC-Y DC-Z
Sediment
Co
nc. (m
g/k
g d
w)
Cr
0
5
10
15
20
25
30
DC-V DC-W DC-X DC-Y DC-Z
Sediment
Co
nc
. (m
g/k
g d
w)
Fig. 2 Trace metal concentrations in sediments from Douglas Creek of Qua Iboe
estuary. Straight horizontal line represents a moderately polluted level (except Cd,
representing heavily polluted) as per SQG by USEPA

Page 33 of 33
Accep
ted
Man
uscr
ipt
33
Fig. 3. Total target hazard quotients due to consumption of Leptodius exarata
Fig. 4: Loading plot and biplot of the principal components obtained for trace metals
at all investigated sites


![Untitled-1 [covenantuniversity.edu.ng]covenantuniversity.edu.ng/content/download/32245/222377/file... · Oyedepo, who is the President and Presiding Bishop, Faith Tabernacle — the](https://static.fdocuments.in/doc/165x107/5acfefee7f8b9ac1478d6a7c/untitled-1-who-is-the-president-and-presiding-bishop-faith-tabernacle-the.jpg)