ecology and habitat protection needs of the southeastern american ...
Distribution And Habitat Ecology Of American Martens And Pacific Fishers In Southwestern Oregon
Progress Report I
1 July 2001 – 15 November 2001
Keith M. Slauson, William J. Zielinski
USDA Forest Service, Pacific Southwest Research Station Redwood Sciences Laboratory
Arcata, California
Department of Forest Science, Oregon State University Corvallis, Oregon
Research Assistants
Jody Pennycook Jonothan Storm
Sponsors:
Oregon Department of Fish and Wildlife USDA Forest Service, Pacific Southwest Research Station
USDA Forest Service, Siskiyou National Forest USDI Fish and Wildlife Service
1

INTRODUCTION The American marten (Martes americana) was historically distributed throughout the coastal forests of Oregon and occurred as one or perhaps two recognized subspecies (Zielinski et al. 2001). M. a. caurina occurred throughout most of this range and was replaced at or near the border with California by M. a. humboldtensis, distributed more extensively to the south within the coastal forests of northwestern California (Grinnell et al. 1937). In California M. a. humboldtensis is currently known from only a single population occupying less than 5% of its historical distribution (Slauson et al. 2002). Insufficient information currently exists to evaluate the status and distribution of martens in the coastal forest of Oregon. Currently the only known populations occur on or immediately adjacent to the Siskiyou and Siuslaw National Forests (Zielinski et al. 2001). The marten is currently listed as ‘vulnerable’ by the Oregon Department of fish and wildlife (ODFW) (Appendix 1) and is still legally trapped throughout its coastal distribution. No studies have been conducted to investigate the habitat ecology of martens in the coastal forest of Oregon. American martens are typically associated with late-successional coniferous forest, with closed canopies, and abundant standing and downed large woody structures (Buskirk and Powell 1994). Marten populations have been shown to be sensitive to the loss and fragmentation of mature forests in several locations across their distribution in North America (Bissonette et al. 1997, Chapin et al. 1998, Potvin et al. 1999). The historical distribution of the fisher in coastal forests of Oregon is unclear, however records exist from the central coast range to the California border (Bailey 1936, Giblisco 1994). Currently native fishers are only known from a small area near the border with California in the interior coast range and Siskiyou mountains (Aubry and Lewis In prep.). The fisher is currently listed as ‘critical’ by ODFW (Appendix 1). In the Pacific northwest, fishers are typically associated with late-successional Douglas fir and white fir-associated forests (Buck et al. 1983, Raphael 1994, Zielinski et al. In review). The coastal forests of Oregon are largely privately owned and focused on intensive logging, which has greatly reduced the amount of late-successional forest from historical levels. Historically, the Oregon coast range contained between 25-75% old growth forest (Whimberly 2000), currently there is approximately 5% remaining (Spies pers. comm.). Federal lands administered by the U.S. Forest Service and Bureau of land management currently hold the majority of the remaining late-successional forest (Spies pers. comm.), however these lands are largely disjunct or patchily distributed. The primary focus of this project is to gather new information on the distribution and habitat ecology of the American marten. However the historical distribution of the fisher overlaps that of the marten in the southern portion of the Oregon coast range. We have taken advantage of this opportunity to collect and present information for both of these species for this region. The initial effort for this project began in 1997 and after a 3-year hiatus we resumed survey efforts in 2001. We report on the new survey results from 2001 and also include new habitat information for locations we surveyed in 1997. A
2
summary of the detection information for the 1997 surveys can be found in Zielinski et al. (1998) and Zielinski et al. (2000). Objectives:
1. Determine the current distribution of American martens and fishers in coastal Oregon.
2. Determine the characteristics of the habitats where American martens and fishers
are detected.
3. Collect genetic samples from the American marten populations in the southern and central Oregon coastal range in order to determine whether recent movement has occurred between these populations and the one in Northwestern California. 4. Characterize the genetic diversity of these marten populations. Study Area The study area includes the entire Oregon coast range, with our initial efforts focused on the Siskiyou National Forest (SNF) located in the southernmost portion of this region. This region occupies portions of both the Central Pacific Coastal Forest and Klamath-Siskiyou Forest ecoregions (Ricketts et al. 1999). Using the Oregon and Washington wildlife habitat classification system (OWWHR) this region is largely comprised of the westside lowland conifer-hardwood and southwest Oregon mixed conifer-hardwood forest types (Johnson and O’Neil 2001). The region is characterized by mild winters with heavy precipitation and warm dry summers. The western side of the SNF is dominated by Douglas-fir and Western Hemlock associations with a transition towards more drier Douglas-fir and mixed conifer hardwood associations on the east side. Large areas composed of serpentine soils, that have given rise to unique habitat types and a rich botanical diversity, are present in the southern portion of the SNF and especially within the Kalmiopsis Wilderness and Illinois Valley Ranger District.
METHODS
Detection Methods We used the nationwide systematic vegetation monitoring grid, referred to as the National Forest Inventory (Stevens 1994) as the template from which we selected locations to survey. This grid consists of points separated by 5.4 km and within National Forest Lands in Region 6 it is referred to as the Current Vegetation Survey (CVS) (USDA 1995). At each selected grid point we established a sample unit composed of 6-sooted track plate stations (Zielinski 1995). A track plate station was placed as close as possible to the CVS point itself, and the remaining 5 track plates were positioned at
3
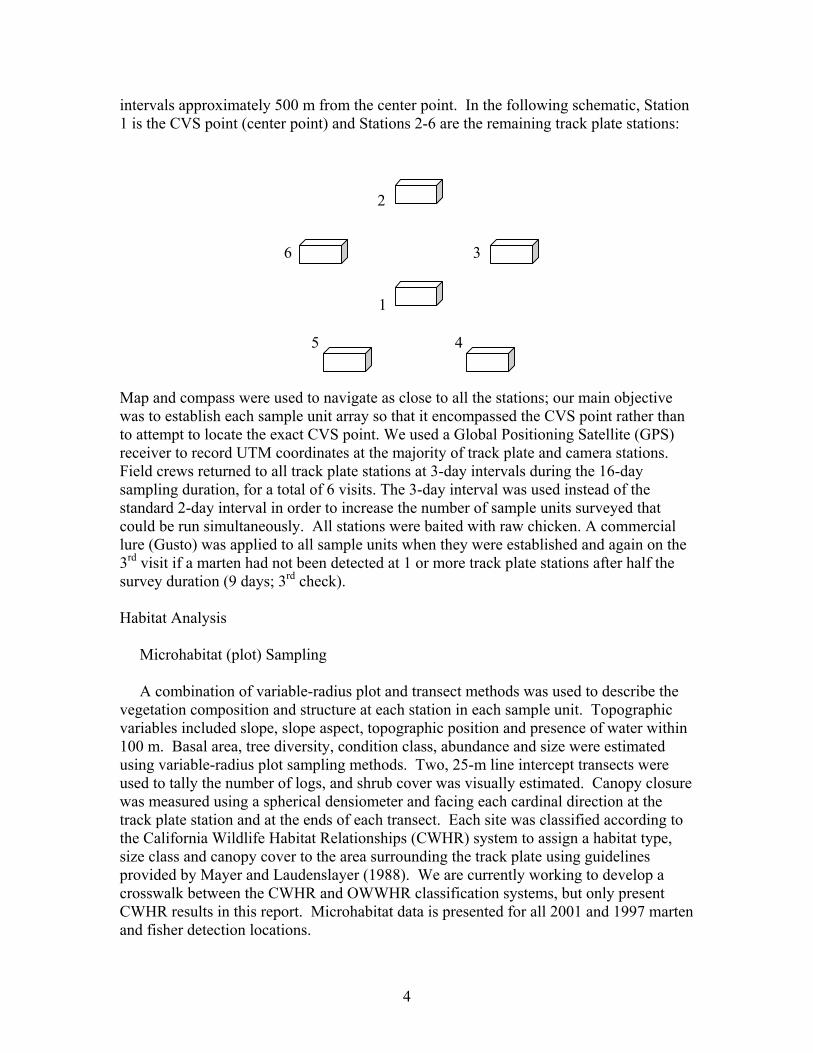
intervals approximately 500 m from the center point. In the following schematic, Station 1 is the CVS point (center point) and Stations 2-6 are the remaining track plate stations:
2
6 3
1
5 4 Map and compass were used to navigate as close to all the stations; our main objective was to establish each sample unit array so that it encompassed the CVS point rather than to attempt to locate the exact CVS point. We used a Global Positioning Satellite (GPS) receiver to record UTM coordinates at the majority of track plate and camera stations. Field crews returned to all track plate stations at 3-day intervals during the 16-day sampling duration, for a total of 6 visits. The 3-day interval was used instead of the standard 2-day interval in order to increase the number of sample units surveyed that could be run simultaneously. All stations were baited with raw chicken. A commercial lure (Gusto) was applied to all sample units when they were established and again on the 3rd visit if a marten had not been detected at 1 or more track plate stations after half the survey duration (9 days; 3rd check). Habitat Analysis Microhabitat (plot) Sampling A combination of variable-radius plot and transect methods was used to describe the vegetation composition and structure at each station in each sample unit. Topographic variables included slope, slope aspect, topographic position and presence of water within 100 m. Basal area, tree diversity, condition class, abundance and size were estimated using variable-radius plot sampling methods. Two, 25-m line intercept transects were used to tally the number of logs, and shrub cover was visually estimated. Canopy closure was measured using a spherical densiometer and facing each cardinal direction at the track plate station and at the ends of each transect. Each site was classified according to the California Wildlife Habitat Relationships (CWHR) system to assign a habitat type, size class and canopy cover to the area surrounding the track plate using guidelines provided by Mayer and Laudenslayer (1988). We are currently working to develop a crosswalk between the CWHR and OWWHR classification systems, but only present CWHR results in this report. Microhabitat data is presented for all 2001 and 1997 marten and fisher detection locations.
4

Patch Analysis Our patch analysis will be conducted using satellite image data for the Siskiyou National Forest. We will use this classification system to describe the composition of forest around each station where martens were and were not detected. This coverage has tree size structure classes for each 25 x 25 m pixel. A 125 m radius circle (4.9 ha) will be used to determine the composition of structure classes associated with each station where a marten was detected. The size/structure classes have been grouped into 5 categories (Seed/Sap/Pole, Pole/Small, Medium/Mature, Large/Old Growth, Giant/Old Growth) using the classification system of Miller et al. (unpubl. report).
PRELIMINARY RESULTS AND DISCUSSION
In 2001, twenty-five sample units were completed on the Illinois Valley Ranger District in the southeastern portion of the Siskiyou National Forest (Figure 1). Eighteen species (16 mammals, 1 reptile, 1 amphibian) were detected at track plate stations (Table 1). A single marten was detected at one sample unit (4.0%) in the headwaters of the south fork of Rough and Ready Creek (Figure 2). This detection constitutes the southernmost, and one of the most inland (32.5 km from ocean), detections of a marten on the Siskiyou National Forest and closest (~60 km) to the only known population of martens in northwestern California (Figure 3). Fishers were detected at four sample units (16.0%), all located south of Highway 199. Three of these detections were at sample units adjacent to the Oregon Caves National Monument and, based on track size differences, probably represent at least two individuals (1 male, 1 female/juvenile). Several additional detections of fishers have occurred in recent years on nearby lands administered by the Bureau of Land Management. In 2002 a fisher was detected using a remotely triggered camera near Mt. Ashland (E. Weir, pers. Comm.). Collectively these detections represent the only region of Oregon currently known to be occupied by native fishers (Aubry and Lewis In prep.). The other fisher detection occurred along the border of the Siskiyou National Forest and the Smith River National Recreation Area (Figure 2). All sample units (1997 and 2001) detecting fishers (mean distance = 50.6 km, SD = 20) are on average more than twice the distance from the coast as those detecting martens (mean distance = 22.6 km, SD = 10). There is no elevational segregation between marten and fisher detection locations with marten detections occurring at a slightly lower mean elevation (mean = 734 m, SD = 157) than fishers (mean = 880 m, SD = 341) (Table 2, 3). Habitat Analysis Microhabitat (Plot Level Sampling) Five of the 16 stations where martens were detected in 1997 (15 stations at 3 sample units) and 2001 (1 station) occurred in a single sample unit located in serpentine influenced forest types. These sites are typically open and rocky with small diameter stunted trees (Jimerson et al. 1995). These five stations all had moderate to dense tree canopy closure (50-70%) and were dominated by lodgepole pine (Pinus contorta),
5

western white pine (Pinus monticola), and Jeffrey pine (Pinus jeffreyi). The serpentine ridge where these five marten detections occurred constitutes one of the only two known locations (the other is in northwestern California) were martens have been found to use serpentine habitat types (Slauson et al. 2002). These two serpentine locations share the closest proximity to the coast and most mesic vegetation associations when compared to all serpentine habitat types located in this region (Jimerson et al. 1995). The 11 stations in non-serpentine forest types all had dense tree canopy cover (80-100%) with the exception of one station that had an overall open tree canopy cover (35%). These sites were dominated by Douglas-fir forest types and were dominated by Douglas-fir in the overstory and tanoak (Lithopcarpous densiflora) or chinquapin (Castanopsis chrysolepus) in the understory. Although the tree layer differed between serpentine and non-serpentine stations, the shrub layer was uniformly dense (mean = 82% cover, SD = 14) (Table 2). The four most common shrub species across all sites in declining rank order were Pacific rhododendron (Rhododendron macrophylum), salal (Gaultheria shallon), dwarf tanoak (Lithocarpous densiflora e.) and evergreen huckleberry (Vaccinium ovatum). A dense shrub layer is the most consistent feature across all sites where martens have been detected in coastal Oregon and northwestern California (Slauson et al. 2002). These shrubs likely provide important cover from predators and may discourage larger bodied competitors. They also provide fruits for martens and their prey (Slauson et al. 2002). Fourteen of the 16 stations where martens were detected occupied the most mesic macro-aspects (270 to 90 degrees) and the two not in mesic positions were within 20 meters of surface water. All seven stations detecting fishers were in non-serpentine forest habitats with dense canopy closure (70-95%) (Table 3). All sites had high coniferous components and were dominated by Douglas fir in the overstory, typically with significant hardwood understories composed largely of tanoak and chinquapin. Shrub cover was variable at stations where fishers were detected (0-100%), but was lower on average (mean = 50%, SD = 39) than sites where martens were found (Table 2, 3). Five of the seven stations where fishers were detected occurred in the most mesic macro-aspects (270 to 90 degrees). Patch Composition Substantial differences exist between the size/structure compositions for serpentine versus non-serpentine locations where martens were detected. Serpentine locations were highly composed of the Seed/Sap/Pole tree size class (mean = 88%, SD = 6), while the non-serpentine locations were dominated by a combination of Pole/Small (mean = 48%, SD = 18) and Medium/Mature tree size classes (mean = 36%, SD = 9) (Table 4). The serpentine locations contain a large amount of large surface rocks which create interstitial spaces that may provide cover for martens and their prey. Serpentine locations used by marten in northwestern California also contained a conspicuous abundance of small mammals (Tamias and Spermophilus) (K. Slauson pers. obs.). Non-serpentine locations also had a consistent, but small, Large/Old Growth component (mean = 13%, SD = 11) present in every patch (Table 4). Given what is known about marten habitat elsewhere (Buskirk and Ruggiero 1994), this may indicate the importance of nearby Large/Old
6
Growth forest for Pole/Small and Medium/Mature structure dominated patches to be used. Further investigation will be required to confirm these associations and caution should be exercised in their interpretation given the limited number of detection locations and the correlated nature of stations within a single sample unit. Landscape scale compositional analysis using 1 km radius circles (314 hectares) around non-serpentine locations in northwestern California showed a large amount of forest in the old growth seral stage (mean = 33%, SD = 20) was associated with marten detections (Slauson et al. 2002).
FUTURE PLANS
In the summer of 2002 we plan to continue our survey efforts in the near-coast portions of the Powers Ranger District, located in the northwestern portion of the Siskiyou National Forest. In 2003 we hope to expand further to the north and begin to work cooperatively with the BLM to survey areas within Coos county. Our long-term goals are to continue to conduct, or coordinate, new surveys throughout the Oregon Coast Range.
ACKNOWLEDGEMENTS
We must first thank the individuals and organizations who provided financial and logistical support: Lee Webb, Randy Miller, and the Siskiyou National Forest; Camryn Lee and the Portland Field Office of the U. S. Fish and Wildlife Service; Terry Farrell and the Oregon Department of Fish and Wildlife; and Redwood Sciences Lab, Pacific Southwest Research Station. We also thank Jan Werren for producing a variety of GIS maps and products that were essential for conducting this work and Annette Albert for editorial assistance. Finally and most importantly, we would like to acknowledge the two members of the field crew who endured the ruggedness of the study area and made many personal sacrifices to make the 2001 effort a success: Jody Pennycook and Jonothan Storm.
LITERATURE CITED Aubry, K. and J. Lewis. In prep. Decline and Reintroduction of the Fisher (Martes
pennanti) in Oregon: Implications for its Conservation in the Pacific States. Bailey, V. 1936. The mammals and life zones of Oregon. North American Fauna No.
55. USDA, Washington, D.C. Bissonette, J. A., D. J. Harrison, C. D. Hargis, and T. G. Chapin. 1997. The influence of
spatial scale and scale-sensitive properties on habitat selection by American
7
marten. Pages 368-385 in J.A. Bissonette, ed., Wildlife and Landscape Ecology. Springer-Verlag , NY.
Buck, S., C. Mullis, and A. Mossman. 1983. Final Report: Corral Bottom-Hayfork Bally Fisher study. USDA Forest Service. 136 pp. Buskirk , S. and R. Powell. 1994. Habitat ecology of fishers and American martens.
Pages 283-296 in S. Buskirk, A. Harestad, M. Raphael, and R. Powell, compilers, editors. Martens, sables, and fishers: biology and conservation. Comstock Publishing Associates, Cornell University Press, Ithica, New York, USA.
Buskirk, S. W. and L. F. Ruggiero. 1994. The American marten. Pages in: Ruggiero, L.
F., K. B. Aubry, S.W. Buskirk, L. J. Lyon, and W. J. Zielinski, (eds.), American marten, fisher, lynx, and wolverine in the western United States. General Technical Report, RM-254. Fort Collins, CO: U.S. Department of Agriculture, Forest Service, Rocky Mountain Forest and Range Experiment Station.
Chapin, T. G., D. J. Harrison, and D. D. Katnik. 1998. Influence of landscape pattern on
habitat use by American marten in an industrial forest. Conservation Biology 12:96-227.
Gibilisco, C. J. 1994. Distributional dynamics of modern Martes in North America.
Pages 59-71 in: S.W. Buskirk, A. S. Harestad, M. G. Raphael, and R. A. Powell, (eds.), Martens, sables, and fishers. Comstock Publishing Associates, Cornell University Press, Ithaca, NY
Grinnell, J., J. S. Dixon, and J. M. Linsdale. 1937. Fur-bearing mammals of California.
Vol. 1. University of California Press, Berkeley, CA.375 pp. Jimerson, T. M., L. D. Hoover, E. A McGee, G. DeNitto, and R. M. Creasy. 1995. A
field guide to serpentine plant associations and sensitive plants in northwestern California. U.S. Department of Agriculture, Forest Service, Pacific Southwest Region. R5-ECOL-TP-006.
Johnson, D. H. and T. A. O’Neil. 2001. Wildlife Habitat Relationships in Oregon and
Washington. Oregon State University Press, Corvallis, Oregon. 736 p. Mayer, K. E., and W. F. Laudenslayer. 1988. A guide to wildlife habitats of California.
California Department of Forestry and Fire Protection, Sacramento, California. Potvin, F., L. Belanger, and K. Lowell. 1999. Marten habitat selection in a clearcut
boreal landscape. Cons. Bio. 14: 844-857. Raphael, M. 1994. Techniques for monitoring populations of fishers and American
Martens. Pages 224 – 240 in S. Buskirk, A. Harestad, M. Raphael, and R. Powell,
8

compilers, editors. Martens, sables, and fishers: biology and conservation. Comstock Publishing Associates, Cornell University Press, Ithica, New York, USA.
Ricketts, T. H., E. Dinerstein, D. M. Olson, C. J. Loucks, W. Eichenbaum, D. DellaSala,
K. Kavanaugh, P. Hedao, P. Hurley, K. M. Carney, R. Abell, and S. Walters. 1999. Terrestrial ecoregion of North America: A conservation assessment. Island Press, Covelo, CA. 485 p.
*Slauson, K. M., W. J. Zielinski, and J. P. Hayes. 2002. Ecology of American martens
in coastal northwestern California: Progress Report II. 5 June 2000 – 10 December 2001. USDAFS, Pacific Southwest Research Station, Redwood Sciences Laboratory, Arcata, California. Stevens, D. L. 1994. Implementation of a national monitoring program. Journal of
Environmental Management 42: 1-29. USDA. 1995. Current Vegetation Survey. Natural Resource Inventory, Pacific
Northwest Region, USDA Forest Service, Portland, Oregon. Version 1.5. Whimberly, M. 2000. Watershed-scale vegetation patterns in a late-successional forest
landscape in the Oregon Coast Range. Dissertation, Oregon State University. *Zielinski, W. J., and T. E. Kucera. 1995. American Marten, Fisher, Lynx, and
Wolverine: Survey Methods for Their Detection. Albany, CA: U.S. Department of Agriculture, Forest Service, Pacific Southwest Research Station; Gen. Tech. Rep. PSW-GTR-157.
Zielinski, W. J., C. R. Carroll, K. M. Slauson. 1998. Coast range carnivore surveys in
California and Oregon: American marten results 1996-1997. USDAFS, PSW, Redwood Sciences Lab. Unpubl. report, 7 p.
*Zielinski, W. J., R. L. Truex, L. A. Cambell, C. R. Carroll, and F. V. Schlexer. 2000.
Systematic surveys as a basis for the conservation of carnivores in California forests. U.S. Department of Agriculture, Forest Service, Pacific Southwest Research Station, Redwood Sciences Laboratory, Arcata, CA. Progress Report II: 1996-1999.
Zielinski, W. J., K. M. Slauson, C. R. Carroll, C. J. Kent, and D. K. Kudrna. 2001.
Status of American marten populations in the coastal forests of the Pacific States. J. Mammalogy 82:478-490.
Zielinski, W., R. Truex, G. Schmidt, F. Schlexer, K. Schmidt, and R Barrett. In review. Habitat ecology and home range characteristics of the fisher in California.
Wildlife Monographs.
9

* Available at http://www.rsl.psw.fs.fed.us/pubs/WILD90S.html Appendix 1. Definitions of State Sensitive Species Criteria (Oregon Department of fish
and wildlife sensitive species, December 1997). CRITICAL Species for which listing as threatened or endangered is pending, or those for which listing as threatened or endangered may be appropriate if immediate conservation actions are not taken. Also considered critical are some peripheral species which are at risk throughout their range and some disjunct populations. VULNERABLE Species for which listing as threatened or endangered is not believed to be imminent and can be avoided through continued or expanded use of adequate protective measures and monitoring. In some cases, populations are sustainable and protective measures are being implemented; in others, populations may be declining and improved protective measures are needed to maintain sustainable populations over time.
10

Figure 1. Forest Carnivore survey locations for 2000-2001 in northwestern California (2 km grid) and 2001 in southwestern Oregon (5 km grid).
11

Figure 2. Forest Carnivore survey results for 1997 and 2001 for American marten and fisher in southwestern Oregon.
12

Figure 3. Contemporary detections of American martens in southwestern Oregon and northwestern California from surveys conducted from 1996 to 2001. Survey methods include: snow tracking (Siskiyou NF only), track plate, and remote camera.

Table 1. Species detected at track-plate stations located on the Siskiyou National Forest in 2001. Species Sample Units (n=25) Stations (n=150) Number (Percent of SUs) Number (Percent of Stations American marten 1 (4.0%) 1 (0.7%) Fisher 4 (16%) 6 (4.0%) Ringtail 7 (28%) 10 (6.7%) Spotted skunk 7 (28%) 22 (14.7%) Striped Skunk 1 (4.0%) 1 (0.7%) Weasel sp. 4 (16%) 4 (2.7%) Gray fox 1 (44%) 21 (14%) American Black bear 6 (24%) 7 (4.7%) American opossum 1 (4.0%) 1 (0.7%) Dusky-footed woodrat 8 (32%) 16 (10.7%) Golden-mantled ground squirrel 3 (12%) 3 (2.0%) California ground squirrel 1 (4.0%) 2 (1.3%) Northern flying squirrel 4 (16%) 5 (3.3%) Douglas squirrel 5 (20%) 11 (7.3%) Chipmunk sp. 10 (40%) 19 (12.7%) Small mammal species* 25 (11%) 97 (64.7%) Pacific giant salamander 1 (4.0%) 1 (0.7%) Western fence lizard 1 (4.0%) 1 (0.7%) *Includes rodents smaller than chipmunks whose tracks are not currently distinguishable.
14
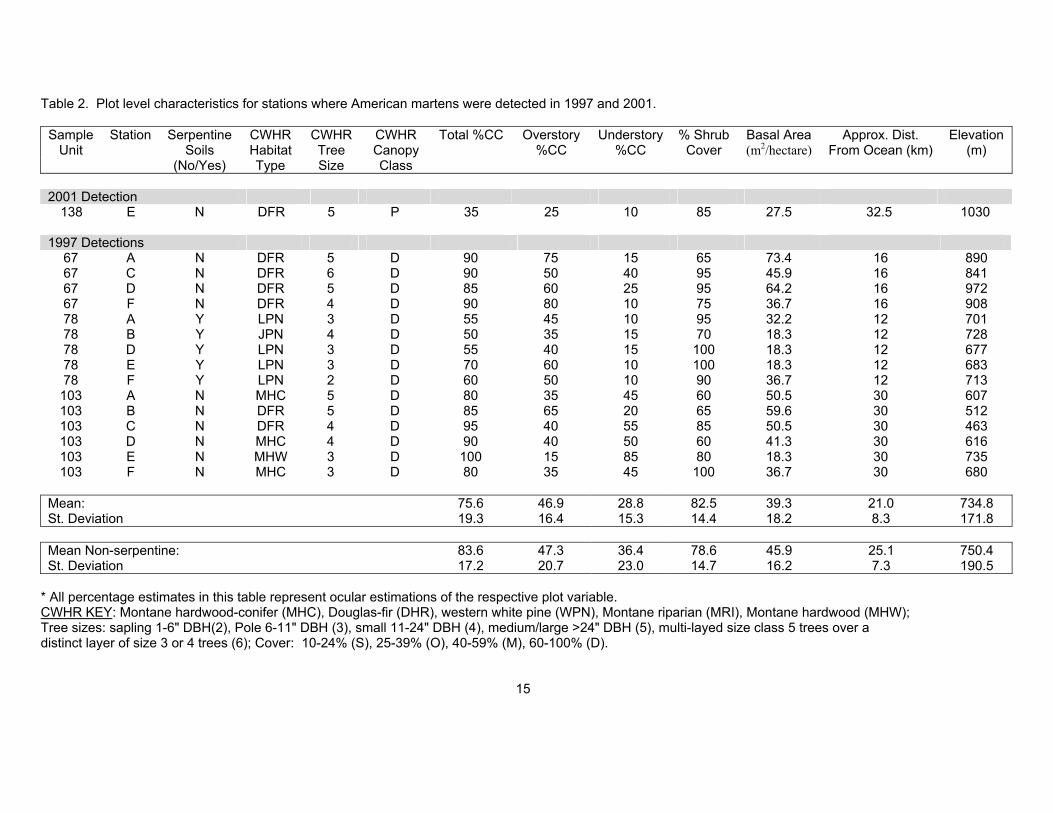
Table 2. Plot level characteristics for stations where American martens were detected in 1997 and 2001. Sample Station Serpentine CWHR CWHR CWHR Total %CC Overstory Understory % Shrub Basal Area Approx. Dist. Elevation
Unit Soils Habitat Tree Canopy %CC %CC Cover (m2/hectare) From Ocean (km) (m) (No/Yes) Type Size Class
2001 Detection
138 E N DFR 5 P 35 25 10 85 27.5 32.5 1030
1997 Detections 67 A
N DFR 5 D 90 75 15 65 73.4 16 89067 C N DFR 6 D 90 50 40 95 45.9 16 84167 D N DFR 5 D 85 60 25 95 64.2 16 97267 F N DFR 4 D 90 80 10 75 36.7 16 90878 A Y LPN 3 D 55 45 10 95 32.2 12 70178 B Y JPN 4 D 50 35 15 70 18.3 12 72878 D Y LPN 3 D 55 40 15 100 18.3 12 67778 E Y LPN 3 D 70 60 10 100 18.3 12 68378 F Y LPN 2 D 60 50 10 90 36.7 12 713103 A N MHC 5 D 80 35 45 60 50.5 30 607103 B N DFR 5 D 85 65 20 65 59.6 30 512103 C N DFR 4 D 95 40 55 85 50.5 30 463103 D N MHC 4 D 90 40 50 60 41.3 30 616103 E N MHW 3 D 100 15 85 80 18.3 30 735103 F N MHC 3 D 80 35 45 100 36.7 30 680
Mean: 75.6 46.9 28.8 82.5 39.3 21.0 734.8St. Deviation 19.3 16.4 15.3 14.4 18.2 8.3 171.8
Mean Non-serpentine: 83.6 47.3 36.4 78.6 45.9 25.1 750.4St. Deviation 17.2 20.7 23.0 14.7 16.2 7.3 190.5
* All percentage estimates in this table represent ocular estimations of the respective plot variable. CWHR KEY: Montane hardwood-conifer (MHC), Douglas-fir (DHR), western white pine (WPN), Montane riparian (MRI), Montane hardwood (MHW); Tree sizes: sapling 1-6" DBH(2), Pole 6-11" DBH (3), small 11-24" DBH (4), medium/large >24" DBH (5), multi-layed size class 5 trees over a distinct layer of size 3 or 4 trees (6); Cover: 10-24% (S), 25-39% (O), 40-59% (M), 60-100% (D).
15

16
Table 3. Plot level characteristics for stations where fishers were detected in 1997 and 2001.
Sample Station Serpentine CWHR CWHR CWHR Total %CC Overstory Understory % Shrub Basal Area Approx. Dist. Elevation Unit Soils Habitat Tree Canopy %CC %CC Cover (m2/hectare) From Ocean (km) (m)
(No/Yes) Type Size Class 2001 Detection
131
F N KMC 4 D 90 50 40 85 45.9 62.5 939142 C N MHC 6 D 95 40 55 10 59.6 62.5 933145 E N WFR 4 D 95 90 5 0 64.2 67.5 1600155 A N DFR 5 D 65 60 5 100 50.5 42.5 703155 B N DFR 2 D 95 85 20 20 36.7 42.5 678155 C N DFR 5 D 70 40 30 65 9.1 42.5 666
1997 Detection
131
B N DFR 4 D 95 10 85 70 59.6 18 642 Mean: 86.4 53.6 34.3 50.0 46.5 48.3 880.1St. Deviation 13.1 27.8 28.8 39.5 19.0 17.3 341.4
* All percentage estimates in this table represent ocular estimations of the respective plot variable. CWHR KEY: Montane hardwood-conifer (MHC), Douglas-fir (DFR), Klamath mixed-conifer (KMC), White fir (WFR); Tree sizes: sapling 1-6" DBH(2), Pole 6-11" DBH (3), small 11-24" DBH (4), medium/large >24" DBH (5), multi-layed size class 5 trees over a distinct layer of size 3 or 4 trees (6); Cover: 10-24% (S), 25-39% (O), 40-59% (M), 60-100% (D).
16

17
17
Table 4. Tree Size/Structure composition for 4.9 hectare circles centered on locations where American martens were detected in 1997 and 2001 using satellite image data for the Siskiyou National Forest.
Sample Station Serpentine Tree Size / Structure Classes Unit Soils Seed/Sap/Pole Pole/Small Medium/Mature Large/Old growth Giant/Old growth
(No/Yes)
2001 Detection 138 E N 0.00 0.26 0.40 0.33 0.00
1997 Detections
67 A
N 0.06 0.37 0.40 0.15 0.0367 C N NA NA NA NA NA67 D N 0.14 0.33 0.33 0.21 0.0067 F N NA NA NA NA NA78 A Y 0.86 0.10 0.01 0.03 0.0078 B Y 0.99 0.01 0.00 0.00 0.0078 D Y 0.86 0.12 0.00 0.02 0.0078 E Y 0.86 0.14 0.00 0.00 0.0078 F Y 0.84 0.15 0.00 0.01 0.00103 A N 0.00 0.49 0.38 0.13 0.00103 B N NA NA NA NA NA103 C N 0.00 0.41 0.51 0.08 0.00103 D N 0.04 0.61 0.31 0.04 0.00103 E N 0.00 0.70 0.25 0.05 0.00103 F N 0.00 0.67 0.30 0.04 0.00
Mean: All 0.36 0.33 0.22 0.08 0.00 St. Deviation 0.44 0.23 0.19 0.10 0.01
Mean: Non-serpentine 0.03 0.48 0.36 0.13 0.00 St. Deviation 0.05 0.18 0.09 0.11 0.01
Mean: Serpentine 0.88 0.10 0.00 0.01 0.00 St. Deviation 0.06 0.05 0.01 0.01 0.00