DISTRIBUTEDBY: Natiopi Technical Infouotion Service, · PDF fileIMPACT STRENGTH AND TOUGHNESS...
56
....- - - - - -- ; . ~ .. .... , .... -:---- .. . --.--. - -------------- ~-, ----- • • A-•- Y AD-753 101' *t IMPACT STRENGTH AND TOUGHNESS OF FIBER COMPOSITE MATERIALS Lawrence J. Broutman, et al . 1 I Illinois Institute' of Technology iti Air Force' Office of Scientific Research , November 1972, DISTRIBUTEDBY: Natiopi Technical Infouotion Service, U.S. DEPARTMENT OF COMMERCE 5285 Port Royai Road, Springfield Va,. 22151 tI II I I I
Transcript of DISTRIBUTEDBY: Natiopi Technical Infouotion Service, · PDF fileIMPACT STRENGTH AND TOUGHNESS...
....- - - - - -- ; . ~ .. .... , .... -:---- .. . --.--. - -------------- ~-, -----• • A-•- Y
AD-753 101'
*t
IMPACT STRENGTH AND TOUGHNESS OF FIBERCOMPOSITE MATERIALS
Lawrence J. Broutman, et al. 1 I
Illinois Institute' of Technology
iti
Air Force' Office of Scientific Research
, November 1972,
DISTRIBUTEDBY:
Natiopi Technical Infouotion Service,U. S. DEPARTMENT OF COMMERCE5285 Port Royai Road, Springfield Va,. 22151
tIII
I I
I

AFOSR Scientific Report
AFOSR TR-
Air Force Office of Scientific Research
Grant AFOSR 72-2214
Technical Report No.1 - -
IMPACT STRENGTH AND TOUGHNESS
OF FIBER COMPOSITE MATERIALS
by
L. J. E'outman and A. Rotem ,.- .
•FIS 1972
Department of Metall.brgical and Materials Engineeri.g,ILLINOIS INSTITUTE OF TECHNOLOGY
Chicago, Illinois 60616
November 1972RoprodL•.ed by
NATIONAL TECHN!CALINFORMATION SERVICE
U S Depirtmeni o CommerceSpr;ngfirld VA 22151
Approved for public release; distribution unlimited
1JA
Qualified requestors may obtain additional copies fromthe Defense Documentation Center, all others shouldapply to the Notional Technical Information Service.
;1
Reproduction, translation, publication, use and disposal- in whole or in part by or for the United'States Govern- '
ment is permitted.
N
.. . ... ........
I.I
t •
.11

UNCLASSIFIEDSeculity Classification
DOCUMENT CONTROL DATA . R & D(Secursiy ¢leaalljation of title. 664t of Abtct ad a ndeWxing anno*.aUon must bt eantered when Us o.tml. ,orop*. I ,lasesilIdI
.ORIGINATING ACTIVITY (Coopomto.author) a0. REIPORT 29CURITY CLASSIFICATION
ILLINOIS INSTITUTE OF TECHNOLOGY UNCLASSIFIEDDEPARTMENT OF METALLURGICAL AND MATERIALS ENGINEERING Wa emoup.CHICAGO, ILLINOIS 60616 1
3 REPORT TITLE
IMPACT STRENGTH AND TOUGHNESS OF FIBER COMPOSITE MATERIALS
COE SCRIP'tIVE NOTES (ye of tplt and hNluNlve d-tee)
Scientific Interim2. AUTMOR18)(PIta? me .w gtjiI,-. -. a)
LAWRENCE J BROUTHAN ASSA ROTEM
S . or AORT OATZ 746 TOTA4;O. OF' PAQSS ' ~ 'UF
f Nov 1972 . OA.OPPGS 7.N.OPRS
"-. CONTRACT Ot GPA T NO. A7OSR 72 -22 14 GI o ei7ow s 0AOT UUUB.tS
b. PoJEc" No. 9782-02
C. 61102F S.OTI4XX IMPORT NO(SI (AI*AM .. ainh.,e 6*1m &Wb asel.Im!~
d. -681307
10. OISTRIOUTION STATIEMENT
Approved for public release; distribution unlimited.
11. SUPPILEMEtNTARY kOTES* 02. SPONSORING MILITARY ACTIVITY
AF Office of Scientific Research (NAM)TECH, OTHER 1400 Wilson Boulevard
AUTRC IArlington, Virginia 2220913|. ABST'RAC T '=,
In recent years the development of advanced high performance fiber compositematerials was mainly concerned with achieving high modulus and strength materials.However, high strength and stiffness by themselves may not be adequate for manystructural applications as this combination of properties usually produces abrittle material. For example, carbon fiber composites possess superior stiffnessand strength to weight ratios, but are quite brittle and have very low energyabsorption capability. During this fir-.t year'the energy absorption capabilityof glass fiber and carbon fiber composites has been studied by performinginstrumented drop weight impact tests on beams. A drop weight impact machinewas designed and built for this purpose. The strength and energy absorption ofthe composite beams has been measured as a function of impact velocity, impactmass, beam geometry, and also as a function of several composite materialparameters., It has been shown that the strength and energy absorption of abeam are a function of impact velocity and the amount of energy supplied comparedto the energy absorbed. The energy absorption is also a function of laminationplane orientation.
2k Deta"ls Of "" ...... r-g "" "Oil document may be betterO. tudied on microfiche
DD INOV .1473 " UNC SSIFIEDT
UNCLASSIFIEDSecuriiy Clausitication
14. Ilm . .
KEY WC~ba LINK A T LINK LINK
- -C - I - -
CAIR.,ON FIBER COMPOSITES ! IIIGLASS FIBER COMPOSITES
IMPACT STRENGTH
TOUGHNES S
CRACK PROPAGATION
FRACTURE
CO14POS ITES
1 i
"i .
"• " I , , Lm.imw
UNCLASS IFIEDSecurity Classification

AFOSR Scientific Report
AFOSR TR-
Air Force Office of Scientific Research
Grant AFOSR 72-2214
Technical Report No. 1
IMPACT STRENGTH AND TOUGHNESS
OF FIBER COMPOSITE MATERIALS
by
L. J. Broutman and A. Rotem
Department of Metallurgical and Materials EngineeringILLINOIS INSTITUTE OF TECHNOLOGY
Chicago, Illinois 60616
November 1972
Approved for public release; distribution unlimited
A•

FOREWORD
This research under Grant AFOSR 72-2214 was sponsored by the Air Al
Force Office of Scientific Research, United States Air Force. Technical
Supervisor for this program is Dr. Jacob Pomerantz, Project Scientist, Aero-
mechanics Division, Directorate of Aeromechanics and Energetics, Air Force
Office of Scientific Research.
•'|' r•'.'• -a ... ,•',• '"• '• • " '• "'• • •' I•I' •'•- • • • • 'I •-'•I-•i=•'••'= • • • •-: -• -,..-•, .. ...-• -•

IMPACT STRENGTH AND TOUGHNESS OF FIBER COMPOSITE MATERIALS
by L. J. Broutman* and A. Rotem**
Department of Metallurgical and Materials EngineeringIllinois Institute of Technology, Chicago, Illinois
I. INTRODUCTION
In recent years, the development of advanced high performance composite
materials was mainly concerned with achieving high modulus and strength materials.
But high strength is not sufficient, as some of the materials developed are of a brittle
nature (the overall elongation to fracture is small), and one of the more important
performance criterion should be the ability to absorb energy and resist impact
loadings.
The energy absorption, or toughness of homogeneous isotropic materials has
been measured by various techniques such as edge notched tensile tests, cleavage
tests, Charpy, Izod and drop weight impact tests. The results obtained for brittle
materials could often be correlated with fracture mechanics theories such as the
Griffith theory for the fracture of brittle materials. However, when theories aeve loped
for simple materials are applied to fiber composites the behavior can not be predicted.
The fracturing process for composites is much different from homogeneous materials
and the energy absorption can certainly not be calculated by application of the
"rule of mixtures" to the two or more phases. Thus, fracture theories were introduced
suggesting fracture modes which include interFace fracture, matrix fracture and the
work done by the fibers as n crack pasmes perpendicular to them.( 1 5 )
* Professor of Materials Engineering
Post.DoctoralResearch Associate (Present Address: Department of MaterialsEngineering, Technion, Israel Institute of Technology, Haifa, Israel)
/
To achie'e an understanding of the fracture behavior of these materiais and to
construct more realistic models for analysis, the testing procedures used for simpler
"materials should not be c, :umed adequate for composites. More sophisticated test
methods have already been introduced by investigators studying metals, for example,
by modifying the Charpy Test Machine with instrumuntation which records the load
history.(6) A more advanced technique used in impact testing was introduced by
chan,44si. the method of impact to a drop weight and instrumented hammer or anvils.( 6 '7)
The study of fibrous composite materials subjected to impact loading has not
been given enough attention even though it should be a major design factor. The few
published resuls on impact behavior were obtained with a standard Charpy impact
machine without any attempt to study the phenomena of impact.(8- 10 ) For a fiber
reinforced plastic material, it is likely that the impact behavior will be time de-
pendent, i.e., dependent on the velocity of the hammer when striking the specimen.
It has been shown that for a glass fiber reinforced plastic matrix, the ultimate strength
increases as a function of the rate of loading in the fiber direction.(") Thus, in this
impcct study, the rate of loading during impact was used as one of the primary variables.
Drop weight impact studies on beams were performed, similar to a Charpy test. For these
studies, a special apparatus was built in order that the impcict process could be studied
as a function of several experimental parameters, which are usually held fixed on
commercial Charpy impact machines.
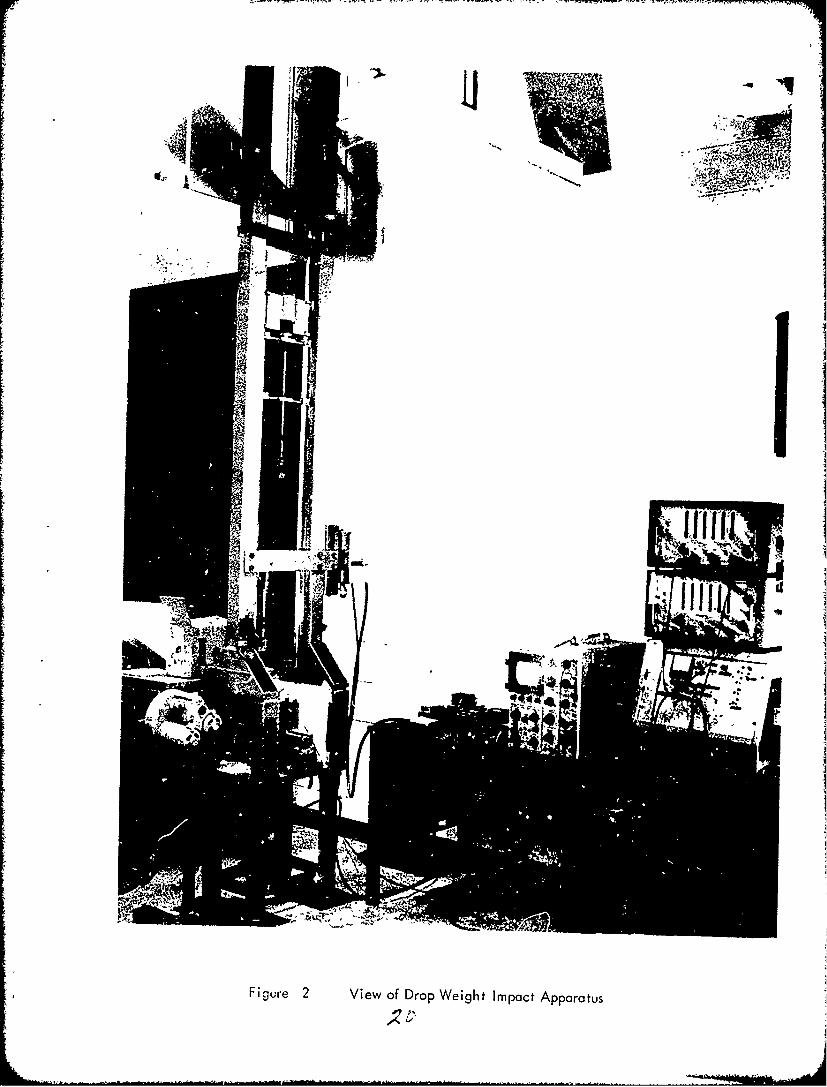
ii. THE APPARATUS
The apparatus which was constructed to perform impact tests in bending is shown
schematically in Fig. I and in a photograph in Fig. 2. The apparatus consists of a
tubular frame 12 feet high with stainless steel guides attached to it. A drop weight
with two cross members is capable of moving with a minimum of friction ir. the vertical
direction. Teflon tips at the ends of the cross members insure the weight will stay in
2

its course. Different types of indentor tips can be attached to the drop weight, and
its weight can be varied by ad'Jng weights on the drop weight shaft. A remote
control hoist, with electromagnet at the end of the cable, is used to raise the weight
to the desired height. The specimen is placed on two supports which have been de-
signed to also serve as strain gage load cells. The supports can be moved to vary
the span. The machine has been designed so that a high speed camera can be used
from the side to photograph the process of fracture. The velocity of the indentor is
measured just before striking the specimen by passing through infrared beams of two
photo diodes, located one inch apart. These two photo diodes also trigger a time
interval meter, and the lower one also triggers a storage oscilloscope which records
the load cell response. After breaking the specimen, the weight posses through the
beams of another two photo diodes, which trigger another time interval meter. Thus,
the velocity of the weight just before and after striking the specimen is measured.
The energy abscrbed by the fracture of the specimen can be calculated* and the
ultimate strength can be calculated from the oscilloscope load recording. A 'iigh
speed movie camera located at the side of the apparatus and triggered by the photo
device was used to photograph the fracture process at a framing rate of 6000 crames
per second.
Ill. GLASS FIBER COMPOSITES
1. Experimental Procedures and ResultsOne of the composite materials selected for study was a nonwoven glass
fiber reinforced epoxy resin. These materials were obtained either as laminates,
fabricated by the 3M Co. or as pre-preg unidirectional tape which was fabricated
into lamirintes in our own laboratory. Four types of specimens were used:
*The fracture energy was calculated from Ef= ] + where S,S and S3 are the distance between the two upper p oto devices, the two lower photodevices and the distance between the upper and the lower, respectively, t ant t arethe time interval measured, W is the weight of the drop, and g - the gravitationalacceleration.
3

(1) Scotchply type 1002 (E - glass in epoxy matrix) 25 plies with
00 - 900 lay up (cross plied).
(2) Scotchply type 1002, 25 plies unidirectional lay up (1-2-19-2-1)
with 4 plies at 90.
(3) Scotchply type 1002, 25 plies all unidirectional lay up.
(4) Scotchply XP251S (S-glass in epoxy matrix) 18 plies, oil uni-
directional lay up.
The specimens were cut from the plates with a diamond wheel in various widths
from 1/4" to V" and in various lengths from 2.5" to 1o".
The drop weight and the supports have tips with 1/4 inch diameter. The supports
were moved to the desired span and tightened on the slides. Locators were placed on
the supports to adjust for the width of the specimen. The drop weight was raised by
means of a winch to the selected height and then released from the electiomagnet.
Every test was performed at least five times. Tests were conducted primarily with
unnotched specimens although a few tests were made with notched specimens. Experi-
ments were also performed on a Charpy impact machine (11 ft./sec., 30 ft. lb.) to
compare the results. For the quasi-static results, tests were performed on an Instron
testing machine using the same type of specimens and loading conditions.
Fig. 3 show- rhe ultimate stress calculated from the load recording, versus the
velocity of the drop weight just before striking the specimen (E-glass cross ply and
unidirectional). Results are shown for the two drop weights, 6.34 lbs. and 12.68 lbs.
The span was kept constant at 4 inches and the widths of specimens were 1/4", 1/"
and 1". It can be seen that the fracture stress is not dependent on the weight as long
as the energy is great enough to break the specimen, and also, not dependent on the
specimen width. However, there is a 40% increase in the strength relative to
the strength determined at a low rate of loading in the Instron testing machine.
4

IIU$
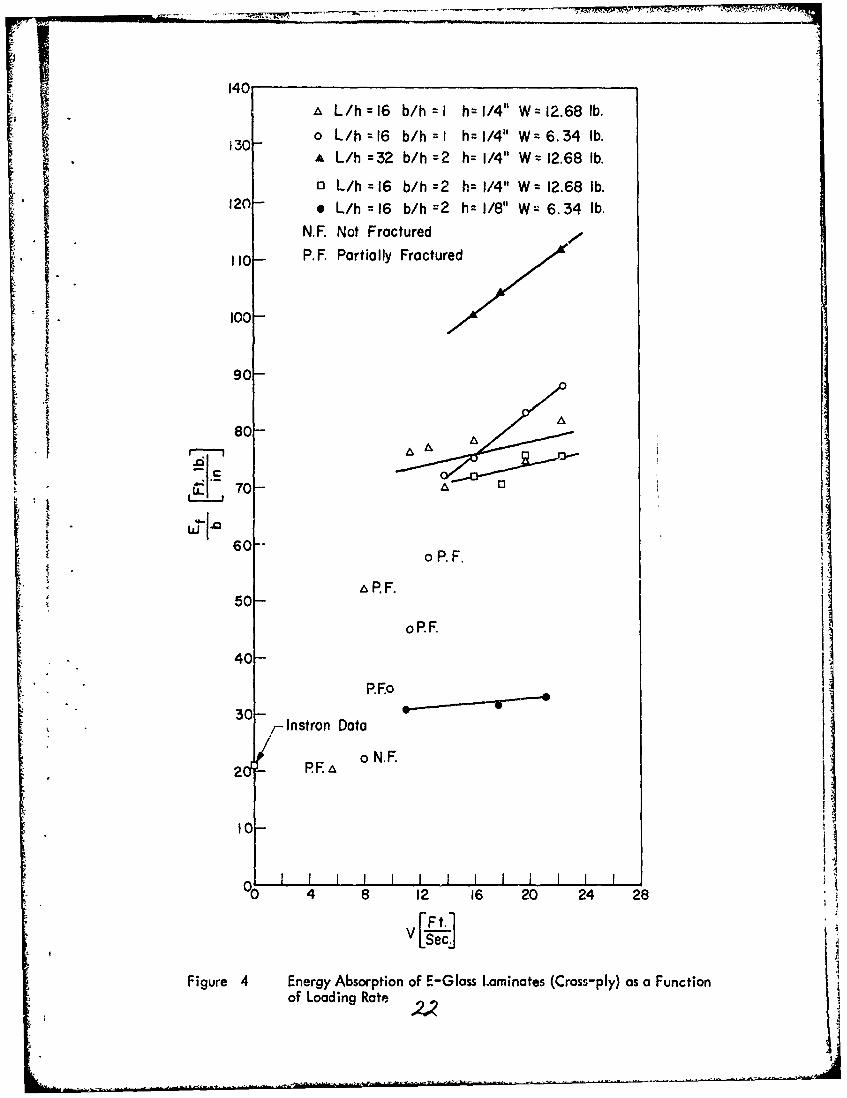
Fig. 4 shows the energy absorbed by the specimens (E-glass/cross ply) versus
the impact velocity, for various combinations of span, width and drop weight. The
energy absorption is rate sensitive, the sensitivity dependent upon the above para-
meters. These results will be discussed later. Note that when the specimen width,
span and the drop weight are doubled the curves have in some cases the some slope
but never double the energy absorbed. Also note that just by changing the specimen
width the level of the energy absorbed per unit width was hardly changed. Also
shown in Fig. 4 is the region where the impact energy was not enough for complete
fracture, and the region where no visual external damage was observed. For the zero
rate, the energy was calculated as the area under the stress strain curve from an Instron
test. It includes the total area under the curve till the load returns to zero.
Fig. 3 also shows the ultimate stress of the all-unidirectional specimens (3)* made
from the pre-preg in our laboratory. The results are similar to those for the cross ply
laminates, an increase of about 40% in the fracture stress compared to the quasi-
static fracture stress. Again there is no effect by changing the drop weight or the
width of the specimens (except in certain intervals as will be shown later). In Fig. 5
the results for energy absorption of the unidirectional specimens is plotted vs. the
rate of loading. Different specimen widths are compared, and also the results for a
Charpy test for the some specimen dimensions is shown. It can be seen that there is
an increase in the amount of the energy abscirbed with increasing impact velocity.
The Charpy test seems to give lower results as do the widest one inct specimens (this
phenomena is discussed later). Another phenomenon which occurred was transverse
buckling of the specimen sides and this produces a high value of energy absorption
as shown by the point in Fig. 5. This will also be discussed later. Fig. 6 shows the
* Number in parentheses refers to specimen number as shown on po. 4.

I!ultimate stress for the 3M Co. fabricated unidirectional specimens (2) which shows
the same behavior as the other materials having an increase in strength over the quasi-
static value of about 40 percent. The results for S-glass specimens ore shown in Figs.
6 and 7. The fracture stress is again higher than the quasi-static value but at longer
" 3I. spans (which gives actually a lower rate and a larger bending deflection) the fracture
stress is not influenced by impact velocity. The energy absorbed is also rate sensitiveas shown in Fig. 7.
The effect of the direction of loading relative to the lamination planes was also
examined. Specimens were placed in the impact apparatus so that the lamination
Splanes (the panel surface of the plate before cuttitag the specimens) were in the ver-
"tical direction. The results are shown in Fig. 8. While for the unidirectional,
square cross-section specimens there is no difference in the results for either direction
of loading, for the cross ply specimens there is a large difference. Furthermore, the
cross ply specimens with the lamination planes vertical are not sensitive to the rate
of loading. The Charpy test results for these specimens are also shown in Fig. 8 and
agree with the general trend of the data. The lower energy absorption for the cross
ply specimen with the lamination planes placed in a vertical position is a result of
a different failure mode. This phenomena will be discussed later. Even though the
energy absorption was lower, the fracture stress was the same for both specimen
orientations.
The effect of a notch and specimen thickness was investigated and the results
are presented in Table 1. The specimens were notch insensitive; when the energy
absorbed was divided by the net cross-section area, the same results were obtained
for notched and unnotched specimens. However, there is a large difference in the
energy absorbed for the direction of loading with respect to the lamination planes
and it is not linearly dependent on rne cross-section area. To complete the informa-
tion on the dimensional dependence, tests were made with different beam spans.
6j

~ 0 0 00
*0 -C - 0 0 0 0 0 0
6- ~ 2 C C4e C4 C; 8C;4
""t "q "gr "CiC%4C N %0 ~ U)'
C:uic c N* N ~ C'4 00 0 .CV m
t) ___x_ C~4 C*4
-C
4 0 ~ C~4 % .OOC4 C4C' 4 4 C4 4C~ C a- ec 4c 0~4 C4 Jc~C
E
0-C00 0z CC0.--
0 -C ImEIuý~ zl znU l ý0
0~ ~~~~ x En,.-C** ) *
0z a0
0 00
uc O
00 0 0%-- %. 0
0 00016 - I - -?000c
u,'A'Ac CA'
u u UD t *) 4

TWT. ý_
The results are shown in Fig. 9. Also appeaiing in Fig. 9 is the computed elastic'
energy which was stored in the specimen Just before fracture.* It is seen that the
absorbed energy is much greater than the stored Lelastic energy.
Tests were also performed on a high speed closed loop tension ,machine with
controlled velocity. A bending fixture was adapted to the machine and specimens
(unidirectional) of S-glass/epoxy were, tested with 4" and2" spans. Velocities of
10, 17 and 21.5 ft/sec. (1600 in/min) were used. Typical results from the oscillo-
scope are shown in Fig. 10. The straight line is the displacement record and the
other line is the load. The results from the high speed tension machine were combined
to form loadideflection curves shown in Fig., L. It is seen that the highest strength
was achieved at the highest speed of loading, but the lower loading rate produced the
higher energy absorption. When the photograph (Fig. 10) for the low rate of loading
ii is carefully examined it is seen that at a deflection corresponding to 0.70 inches there
is a disturbance w, the curve, which can be correlated to the beginning of fracture.
For'the specimens tested at the higher rates ultimbte fracture occurred atthis de-
flect ion. The deflection is seen to be linear with time, but not the load. Because
of the long span and the low mýodulus of the material, the specimen deflection is so
great that the linear relation between load and deflection does not apply. For com-
parison, oscilloscope records taken from the impact apparatus show the same behavior.
When the span was reduced to 2 inches, a'linear relation between load and deflection
I The stored elastic energy was calculated from the maximum stress values, recordedon the oscilloscope when impacted, as follows:
max.E= Pd 6 . As P was found to be almost a linear function of the
deflection, then a 2elastic'E = P 6 m V Ft. lb.
where V = the volume of the specimen between the supports (in3)YE = the flexural modulus (psi)amax = the maximum stress before failure (psi)
ma7

occurs as is seen in Fig. 12. Comparison between the results from the falling weight
impact machine and the constant velocity test machine show that there is almost a
constant rate of deflection achieved for the impact tests on the dropweight apparatus
at .Shese loading rates.
Z . Discussion
The series of tests performed here show that adoption of test methods common
fxr metals are not valid for nonmetallic composite materials. The standard Charpy
test is not suitable for fiber glass epoxy composites as this material may not be sen-
sitive to notches in either direction to the laminae, as seen from the results summarized
in Table 1. More important, these materials are rate sensitive and so energy absorp-
tion values depend on the specific apparatus on which they are tested. From Figs. 3,
6, 7, and 11 we can see that the strength is increased as the rate of loading is increased,
reaching a value of 40% over the quasi-static value for the rates considered. The
energy absorbed during fracture also increases with increasing load rot-, as seen from
Figs. 4, 5, 7, nrid 9. But the fracture energy is ver, much dependeat on the specific
mechanism of fracture, which can vary from test to test evena when all the parameters
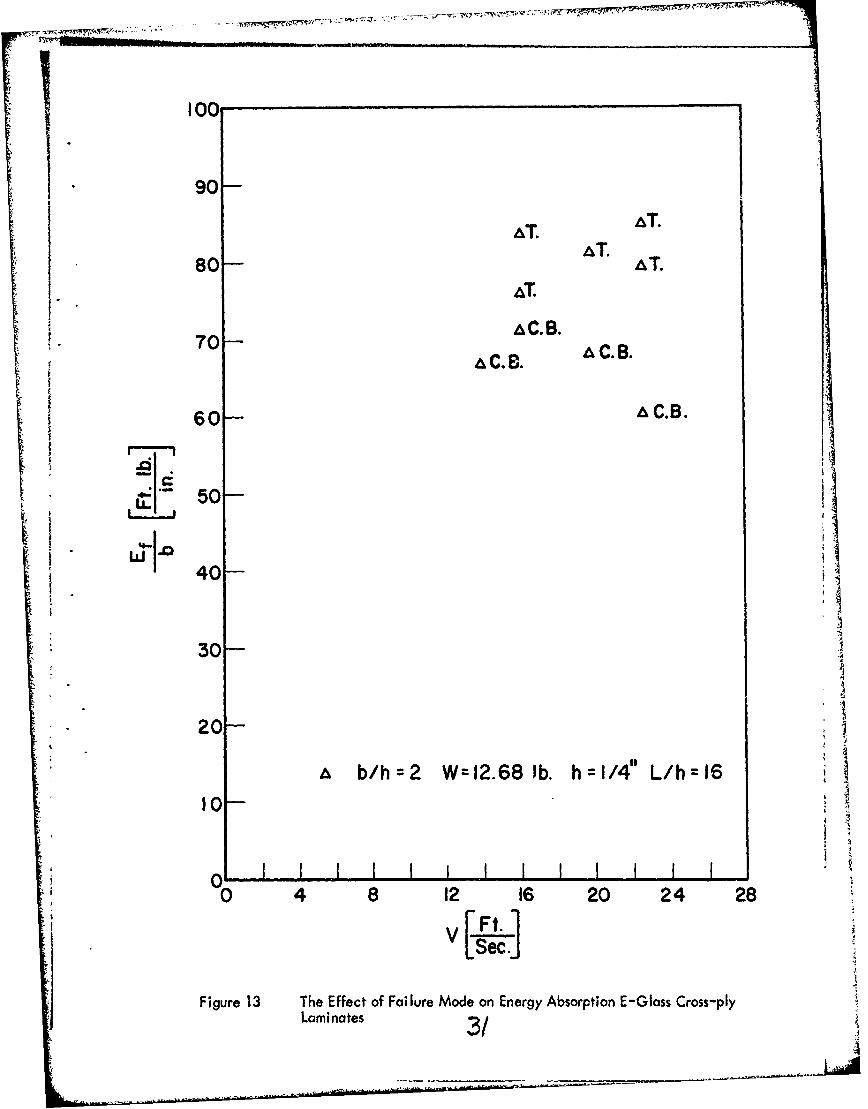
are kept constant. To illustrate this point, Fig. 13 shows some results for cross ply
E-glass/epoxy laminates. The lower values, marked C.B. are associated with a type
of fracture which looks like a sharp cut through the cross section with some spreading
or "brooming" of the fibers near the cut. This type of fracture is thought to occur by
crack propagation through the cross section while some delaminotion of the fibers
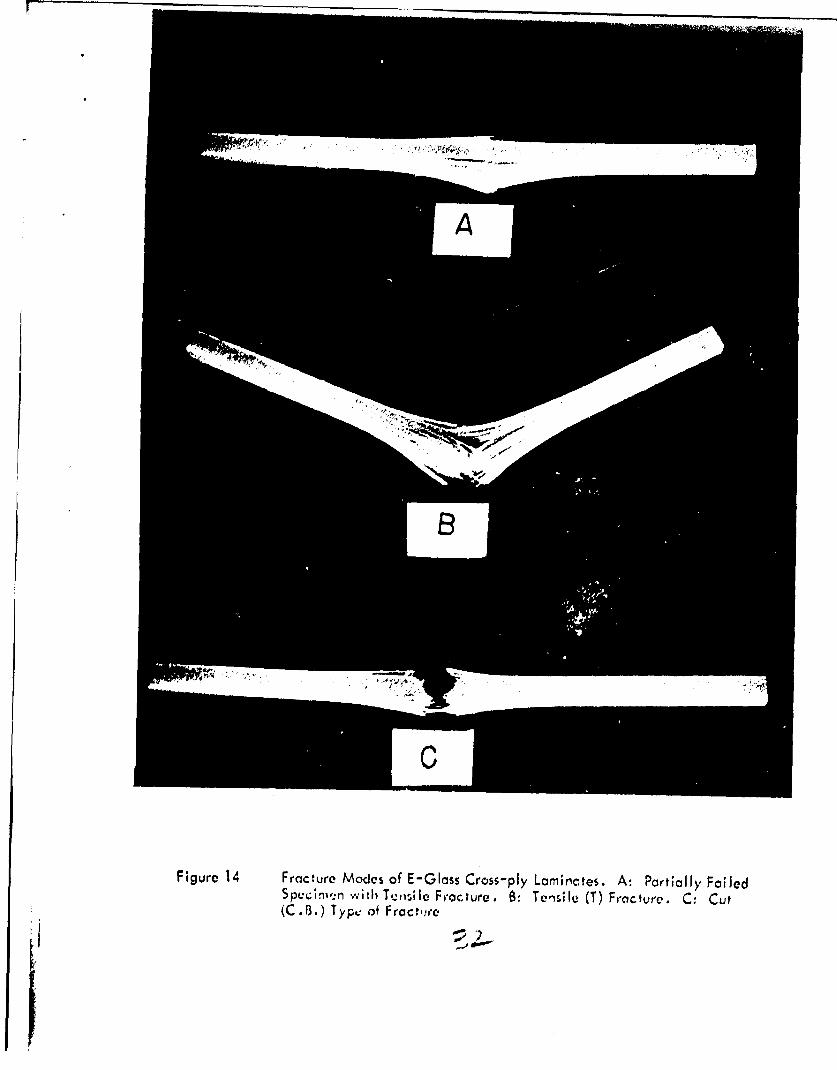
occur as the crack passes perpendicular to them. A photograph of such failures is
shown in Fig. 14. The higher energy absorption values marked with "T"i' are associated
with a different kind of failure. As the specimen deflects, tha outer layer is first
fractured by tensile stresses but the crack does not propagate clearly perpendicular
to the fibers; instead, extensive branching to the sides and delaminations along the
fibers occurs. As the specimen continues to bend another layer is fractured in ten,,ion
8
LI
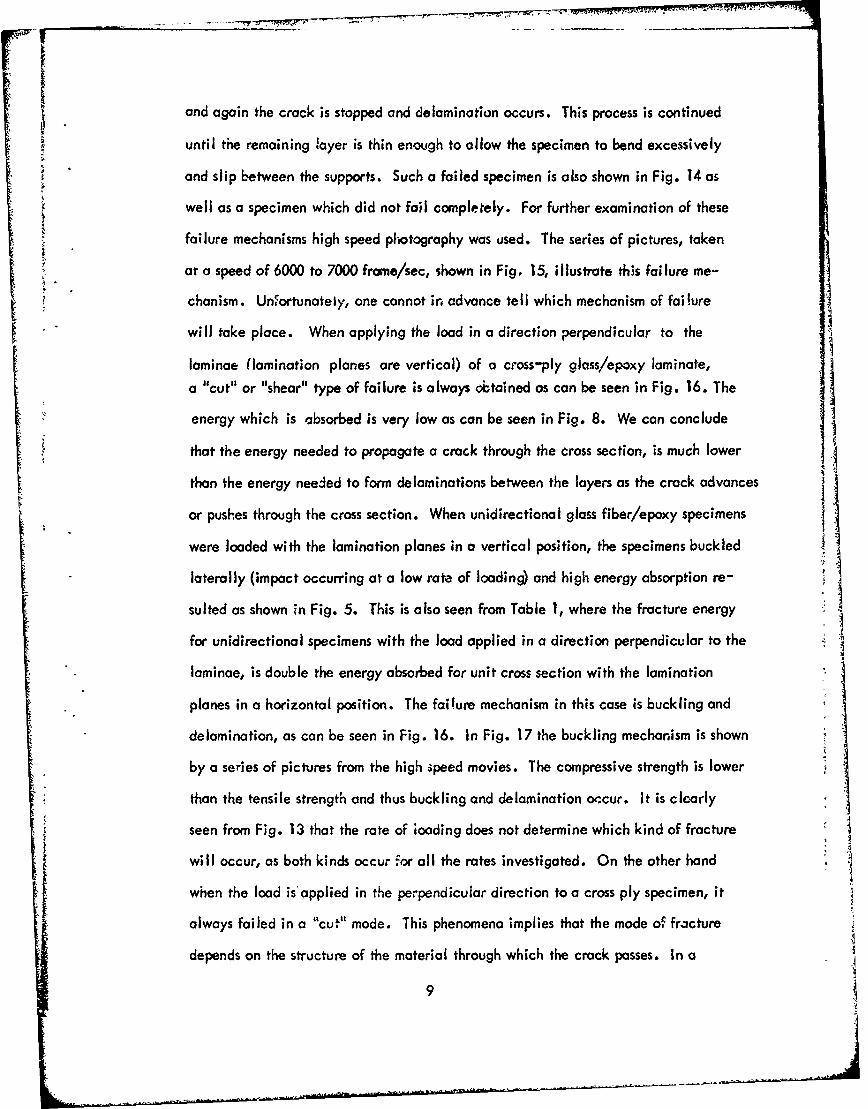
and again the crack is stopped and delamination occurs. This process is continued
until the remaining layer is thin enough to allow the specimen to bend excessively
and slip between the supports. Such a failed specimen is also shown in Fig. 14 as
well as a specimen which did not fail completely. For further examination of these
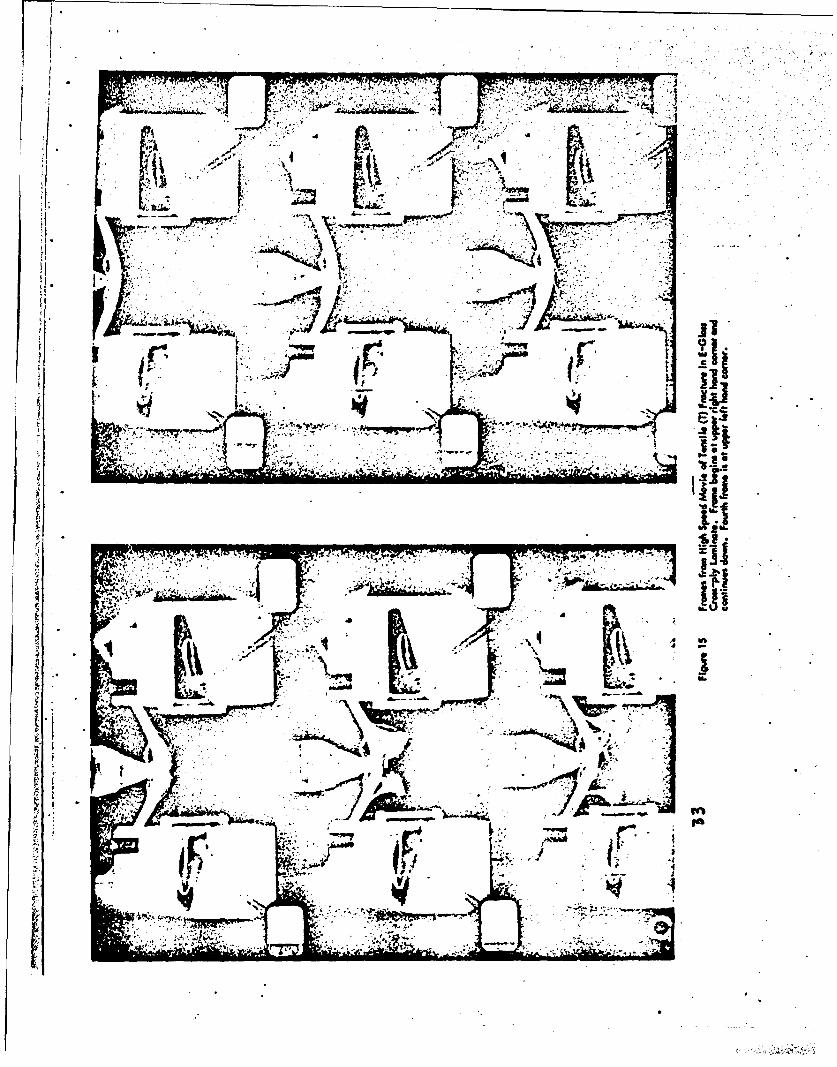
failure mechanisms high speed photography was used. The series of pictures, taken
at a speed of 6000 to 7000 frame/sec, shown in Fig. 15, illustrate this failure me-
chanism. Uneortunately, one cannot in advance tell which mechanism of failure
will take place. When applying the load in a direction perpendicular to the
laminae (lamination planes are vertical) of a cross-ply glass/epoxy laminate,
a "cut" or "shear" type of failure is always obtained as can be seen in Fig. 16. The
energy which is absorbed is very low as can be seen in Fig. 8. We can conclude
that the energy needed to propagate a crack through the cross section, is much lower Ithan the energy needed to form delaminations between the layers as the crack advances
or pushes through the cross section. When unidirectional glass fiber/epoxy specimens
were loaded with the lamination planes in a vertical position, the specimens buckled
laterally (impact occurring at a low rate of loading) and high energy absorption re-
sulted as shown in Fig. 5. This is also seen from Table 1, where the fracture energy
for unidirectional specimens with the load applied in a direction perpendicular to the
laminae, is double the energy absorbed for unit cross section with the lamination
planes in a horizontal position. The failum mechanism in this case is buckling and
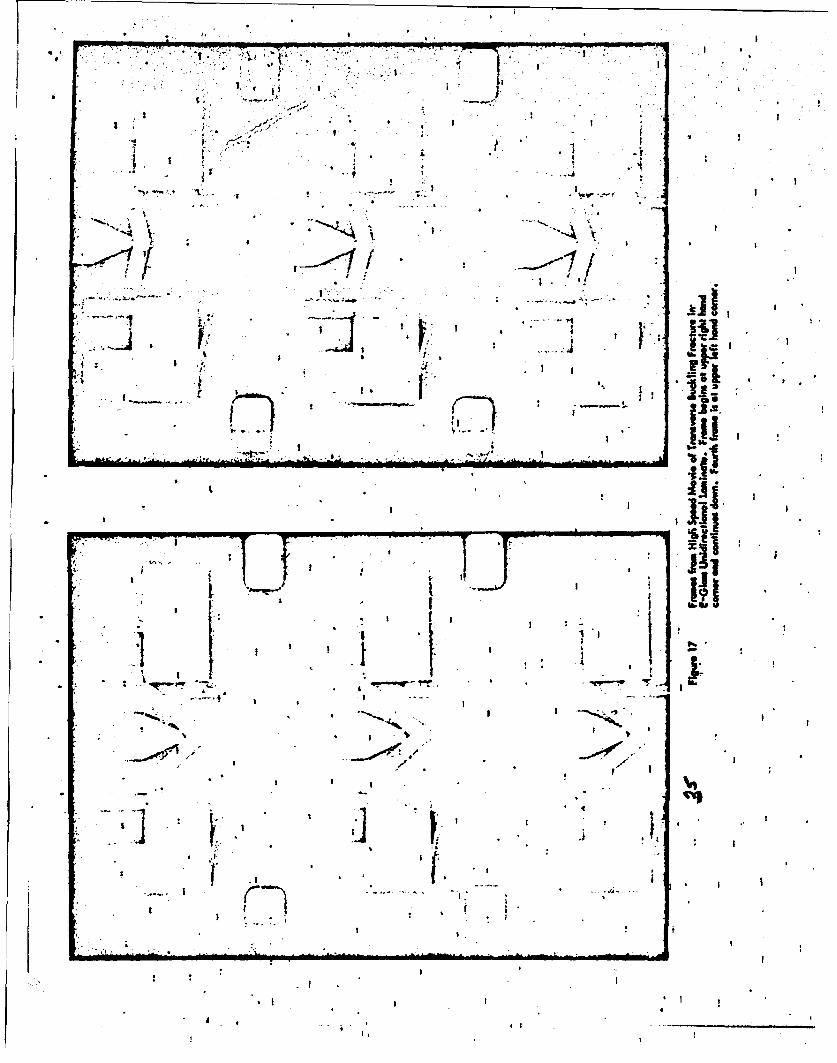
delamination, as can be seen in Fig. 16. In Fig. 17 the buckling mechanism is shown
by a series of pictures from the high speed movies. The compressive strength is lower
than the tensile strength and thus buckling and delamination occur. It is clearly
seen from Fig. 13 that the rate of ioading does not determine which kind of fracture
will occur, as both kinds occur for all the rates investigated. On the other hand S
when the load is'applied in the perpendicular direction to a cross ply specimen, it
always failed in a "cut" mode. This phenomena implies that the mode of fracture
depends on the structure of the material through which the crack passes. In a
9
Tr
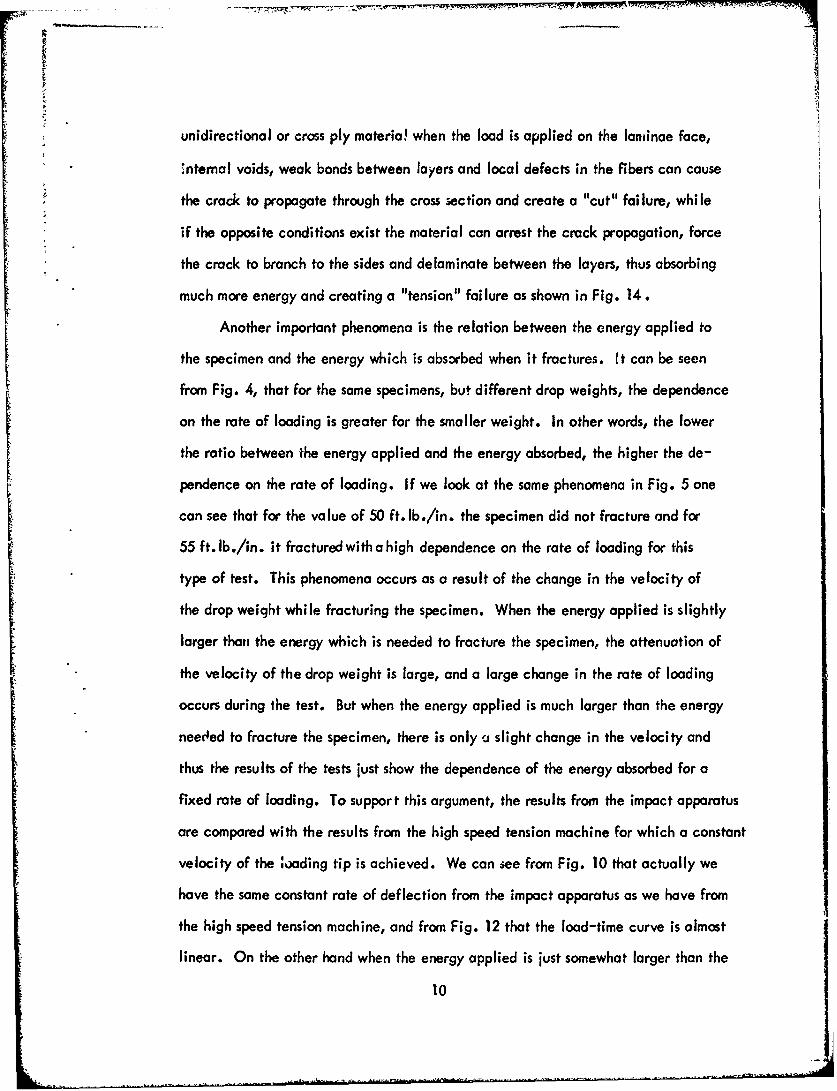
unidirectional or cross ply materia! when the load is applied on the laminae face,
Jntemal voids, weak bonds between layers and local defects in the fibers can cause
f the crack to propagate through the cross 5ection and create a "cut" failure, while
if the opposite conditions exist the material can arrest the crack propagation, force
the crack to branch to the sides and delaminate between the layers, thus absorbing
much more energy and creating a "tension" failure as shown in Fig. 14.
Another important phenomena is the relation between the energy applied to
the specimen and the energy which is absorbed when it fractures. tt can be seen
from Fig. 4, that for the same specimens, but different drop weights, the dependence
on the rate of loading is greater for the smaller weight. In other words, the lower
the ratio between the energy applied and the energy absorbed, the higher the de-
pendence on the rate of loading. If we look at the same phenomena in Fig. 5 one
can see that for the value of 50 ft. lb./in. the specimen did not fracture and for
55 ft. lb./in. it fractured with a high dependence on the rate of loading for this
type of test. This phenomena occurs as a result of the change in the velocity of
the drop weight while fracturing the specimen. When the energy applied is slightly
larger than the energy which is needed to fracture the specimen, the attenuation of
the velocity of the drop weight is large, and a large change in the rate of loading
occurs during the test. But when the energy applied is much larger than the energy
neecded to fracture the specimen, there is only u, slight change in the velocity and
thus the results of the tests just show the dependence of the energy absorbed for a
fixed rate of loading. To support this argument, the results from the impact apparatus
are compared with the results from the high speed tension machine for which a constant
velocity of the ;oading tip is achieved. We can see from Fig. 10 that actually we
have the same constant rate of deflection from the impact apparatus as we have from
the high speed tension machine, and from Fig. 12 that the load-time curve is almost
linear. On the other hand when the energy applied is just somewhat larger than the
10

energy needed to break the specimen, the load-time curve which we get is as shown
in Fig. 18. It can be seen that this is not a linear dependence, but the rate of
loading decreases with time.
A very important result can be obtained by comparing the data in Figs. 4
and 5. The cross ply composite and the unidirectional composite absorb the same
amount of energy. It is obvious from this result, that the mechanism of energy
absorption is mainly by delarnination, as the amount of fibers which fractured in a
unidirectional specimen is double tWe amount fractured in a cross ply specimen.
Moreover, comparing the data from Figs. 4 and 7 for the 1/8" thick specimens we see
that the cross ply E-glass/epoxy and the unidirectional S-glass/epoxy also absorbed
the same amount of energy. Hence it is obvious that the mechanism of absorbing
energy is controlled by the amount of delamination between layers and between
fibers and matrix. The fracture of the fibers themselves contribute only a small
amount to the overall energy absorption.
3. Model of Fracture
Consider the loading of a beam supported ut both ends, with a span long
enough to create a tension failure mode on the tension side of the beam. The
suggested failure modes for cases A, B and C are shown in Fig. 19.
Case A. The material is unidirectional, but consists of layers. The impact applied
suddenly on the beam causes the beam to deflect (after the stress waves have decayed).
As the loading continues a failure of the outer layer occurs at the mid point where
the stress is maximum (or near it, at the weakest point). The crack tip propagates
through the matrix material until it reaches the next layer of fibers and is arrested
there. As the fibers in the fir.st layer were broken a high shear stress exists in the
matrix between these two layers which initiates cracks running to both sides parallel
to the layers. Since tne stress is decreasing toward the supports, the cracks will be
11

arrested after some distance. The impact is continued and when the stress in
the second layer is high enough, the fibers will be broken and again a crack will
propagate up to the third layer and branch to the side. Those cracks which run to
the sides delaminating the specimen absorb the greatest amount of energy during the
failure process.
"Case B. The material is a cross ply laminate with the lamination planes in the
horizontal direction. The same mechanism is valid here, except that there are less
layers to arrest the propagating crack. Since in the unidirectional case, delamina-tion d id not occur at every layer, in the cross ply case approximately the same number
of branching cracks occur as in 'he unidirectional composite. Hence the amount of
energy absorption is almost identical in both cases. A
Case C. The material is a cross ply laminate with the lamination planes in the
vertical direction. In this case, the crack front is not straight as there are weak
layers in the thickness where it can propagate easily. These weak layers let the
crack surround the other layers and fracture the fibers without arresting the crack
propagation. Thus we get a clean cut through the material, as can be seen in Fig.
16, without branching of cracks to the sides, and with a low level of energy absorption.
Case D. The material is a unidirectional laminate with the lamination planes in the
vertical direction. Unlike all the other cases, here the failure occurs on the topside
of the beams or the compression side. As the interlaminar surface is the weak link,
the failure occurs by buckling and delamination between the layers, as can be seeninFigs.
|6and 17. This mechanism of failure occurs only here because at the bottom layer
all the fibers are in the load direction, while in the cross ply material (vertical
position) only half of the fibers are in the load direction and thus it is half as strong
as the former case. In the horizontal position we do have delamination at the com-
p.nession side as can be seen in Fig. 15, but it is restric-od to a few layers while in
12

the vertical case it starts with many kAyers and propagates downward thus absorbing
a large amount of energy.
4. Conclusions
This research study has thus far shown that fiber glass reinforced epoxies
are rate sensitive when an impact load is applied on such materials. This fact must
be considered when testing such materials. As a result, a common impact test, as
the Charpy test, cannot give complete information since it supplies a constant amount
of energy for different specimens some of which absorb most of the energy which is
applied to them.
The higher strength and the higher energy associated with a high rate of loading
is an advantage since it serves as safety factor for high rate loading. A deeper under-
standing of the mechanism of energy dissipation can lead to construction of materials
to optimize the energy absorption.
As the mechanism of absorbing energy is delamination between layers and
between fibers, the type of glass fiber does not change the material's toughness. The
treatment which the fibers may have on their surface and the surface characteristics
of the laminae, which control the delamination process, may change the ability of
the material to absorb energy.
IV. CARBON FIBER COMPOSITES
I. Experimental Procedures and Results
The carbon fiber epoxy composites which were investigated were of two kinds
and were fabricated by two different manufacturers.* The specimens were 'ut in the
shape of rectangular bars from the plates supplied by the manufacturers. All the
specimens were unidirectional, tested with the fibers along the length of the bars.
Two types of fibers were used:
13

1. Hercules HMS (high modulus fibers)
2. Hercules HTS (high strength fibers)
The composite plates were made by Ferro Co.with the epoxy E-293 (Ferro
designation) as matrix (Z 35% by weight) and some were made by Fibeh :re** with the
epoxy X904 (Fiberite designation) as matrix for the high modulus fiber ( z 35% by
weight) and with the epoxy X05 (Fiberite designation) as matrix for the high strength
fibers (z 35% by weight). The high strength material supplied by Ferro Co. was of
two thicknesses. One plate was made with 25 layers and the other wiih 28 layers.
Tests were performed on the Impact machine and on the high speed tension machine
described earlier in the report. The quasi static values were taken from tests on an
Instron testing machine, with velocities of 0.1 in/min for the crosshead. The flexural
specimens were tested on three spans - 2", 3" and 4" using different impact velocities. 4
For measuring the energy absorption, a special light weight tup was built from Lexan,
because of the low energy absorption values of the carbon fiber composites. The
fracture stress was measured also by applying the regular tup whose weight was
6.34 lb. The Lexan weight was only 0.936 lbs.
Fig. 20 shows the results of the fracture stress versus impact velocity for four
different materials. As the thickness of the plates from which the specimens were
cut was variable, the specimens are not all of the same thickness. Any point shown
in Fig. 20 and on the subsequent figures are an average of at least 5 tests. It is
seen that for the HTS fiber composites there is a slight increase in the fracture stress,
while for the HMS fiber composites there is a slight decrease for increasing impact
velocity. Manufacturer I identified in Fig. 20 is Fiberite Co. while Manufacturer
il is Ferro Co. Where the manufacturer is not identified in other figures it was
Ferro Co. Fig. 21 shows the influence of changing the span on the fracture stress.
* Ferro Corporation, Culver City, California**Fiberite Corporation, Winona, Minnesota
14

As this is a high modulus and brittle material, the fracture initiates and propagates
from the tension side of the bar. The failure staris when the combination of tension Astress and shear stress reaches the failure stress for this material, which means that
the failure stress depends on the span to thickness ratio as a change in failure mode
may occur. The fracture was not an interlaminar shear fracture even at the smallest
span shown; the calculated shear stress was much lower than the shear strength but
the presenc.e of the shear stress can influence crack initiation. Fig. 22 shows the
failure tension stress as function of the span to thickness ratio. It is clearly seen
that the strength depended on this ratio, and even the data for the materials from
different manufacturers agrees well. Tests were performed on a high speed tension
machine to compare the behavior with the impact machine and also to control the
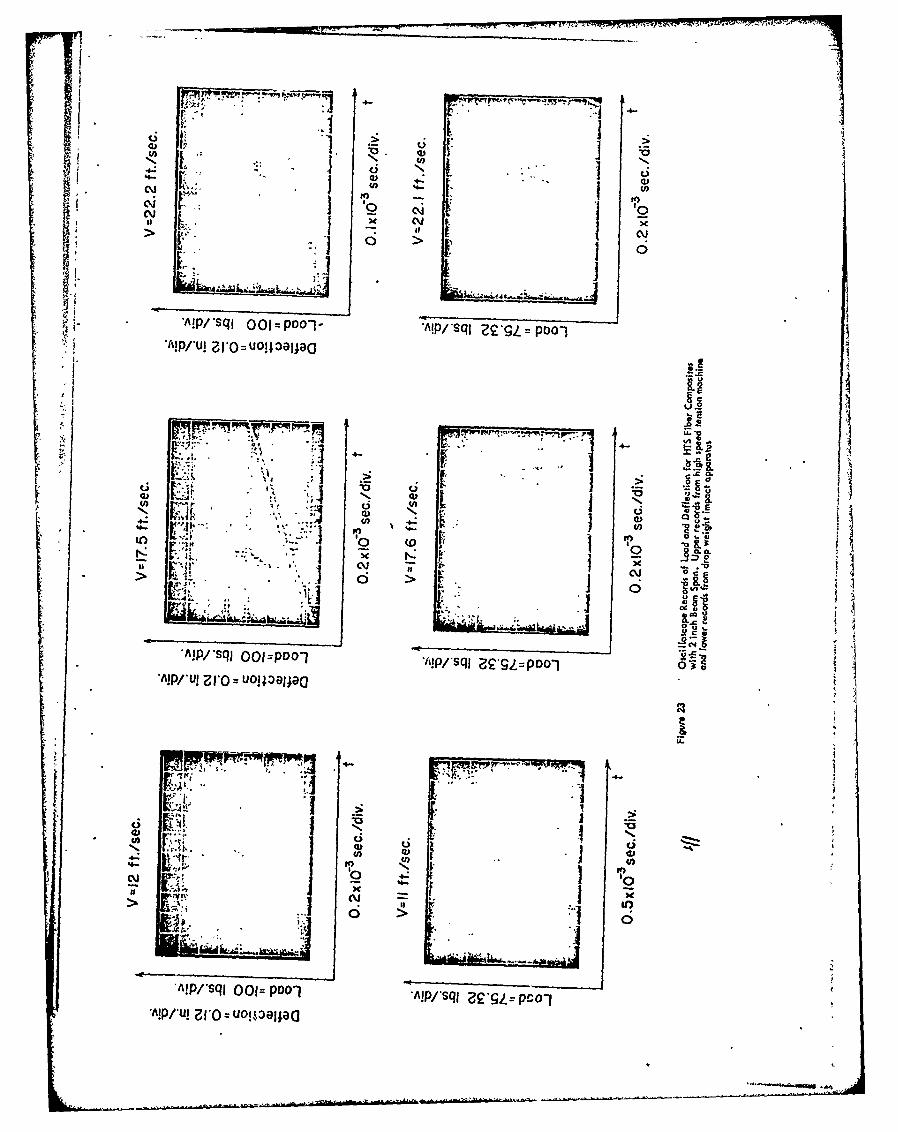
deflection rate. Fig. 23 shows some oscilloscope records taken from the high speed
tension machine and from the impact apparatus. Both records show the same load-
time curve, which is linear, and hence the deflection is linear with time, when per-
forming drop weight impact tests as it is on the high speed tension machine. Fig. 24
shows the results from the high speed tension machine along with some results from the
impact tests. It is seen that there is good agreement between these results for different
spans and impact velocities. There is a slight increase in the strength for both the HTS
material and the HMS material. Fig. 25 shows oscilloscope records for the HMS
material tested on the high speed tension machine as well as from the impact apparatus.
The load-time curve from the high speed tension machine has an initial region of non-
linear loading compared to the impact. This is a result of the machine stiffness. The
strength results are very similar from both machines. For studying the mechanism of
fracture and energy absorption, a high speed camera was used while impacting the
specimen. The failure mode was found to be crack initiation from the tension side
of the specimen followed by propagation through the cross section with considerable
15

pull-out of fibers. Fig. 26 shows a series of pictures taken from the high speed movie
i.•.;showing the crock growth. The material contains the HMS carbon fibers, and the
time interval between each frame is 0. 16 ms. The crack started at the bottom tension
side of the beam as seen at the top picture and propagated to the upper compression
side of the beam. Because of the acceleration given to the specimen by the drop
weight, the specimen moves faster than the weight tip after fracture as seen on the
"other pictures. The mechanism of the fracture is not a smooth crack propagation
through the cross section, but it involved pull-out of fibers from both sides of the
cross section. This is seen clearly on the series of pictures in Fig. 27 for both the
HMS fiber composites and the HTS fiber composites. Fiber pull-out occurs for both
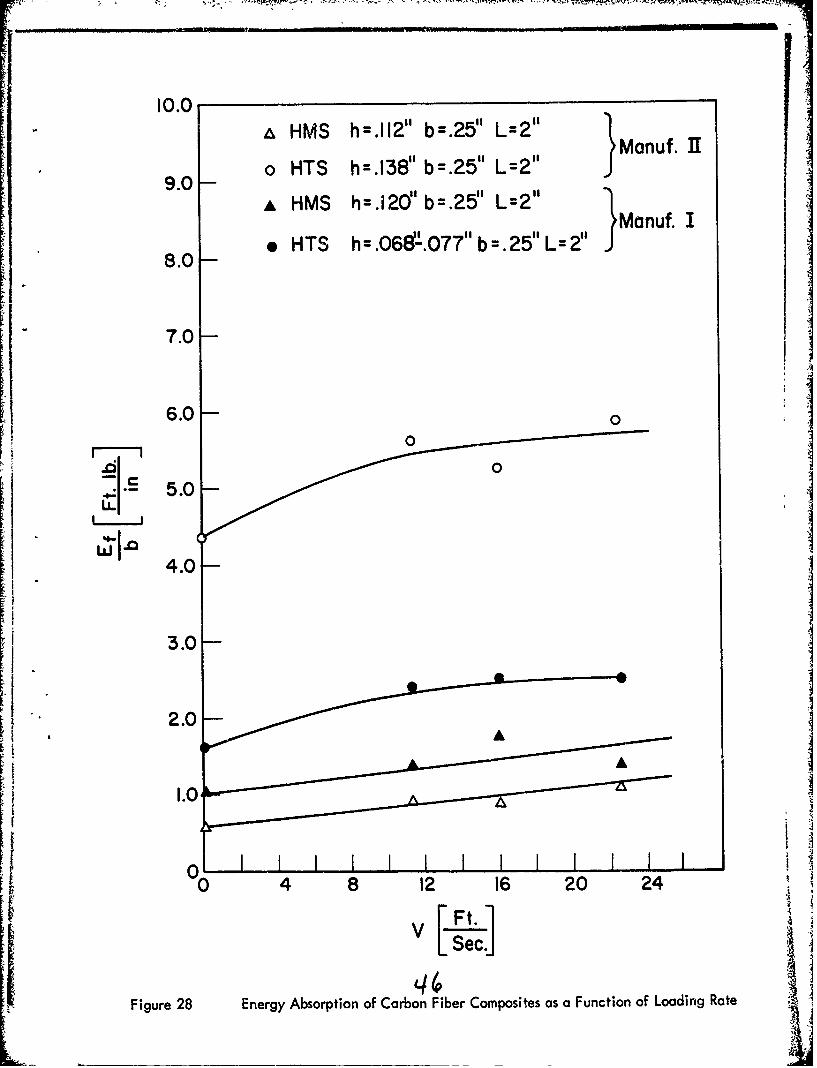
types of materials. The energy ,+ich was absorbed by the fracture of the specimens
during the impact loading for the 2" span is shown in Fig. 28. The zero velocity
values were measured as the area under the stress-strain curve from a test performed
on an Instron machine. Since the thickness of the specimen varied, the data was
first plotted with the fracture energy divided by the cross section area. It was con-
cluded that the cross section area was not a parameter which could normalize the
results, or in other words the energy absorbed is not a linear function of the thick-
ness (as it is a linear function of the width). The energy absorption as a function of
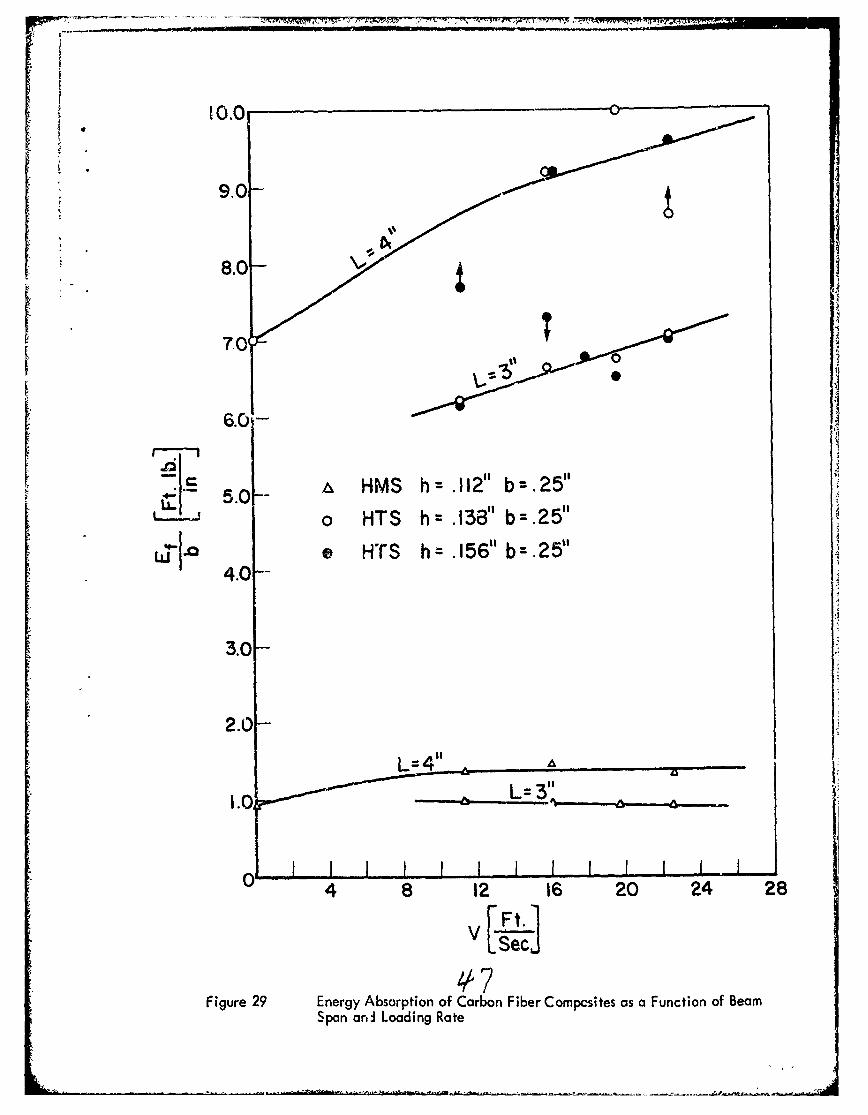
load rate for a 3" span and 4" span is plotted in Fig. 29. It appears that the HMS
fiber composites are not sensitive to the rate of loading while the HTS fiber composites
have some dependence on the rate. In Fig. 30, the overage fracture energy (from
Figs. 28 and 29) is plotted as a function of the span and also compared with the
elastic energy which was stored in the material just before it failed. The calcula-
tion of the elastic stored energy is based on the applied load during impact and the
modulus of elasticity measured from the high speed tension machine. We can see
that the energy absorbed is ainearly related only to the width of the specimen, and
it is not a simple function of tne orher dimensions or a relation between them, and
16
S -- d• ,•, • • • • •t• --- - •-- • =" m ° -- m ,•--I,,-' | -• : • - ,•& ... • -It'm• • w •.,,* -..,-I

therefore of course it is Pot related to the elastic energy stored in the material
just before failure.
2. Conclu-,'ons
Further work must be done with the carbon fiber composites to elucidate
the failure mechanism. The high speed photography must be improved so that a
greater number of frames/second is achieved due to the rapid crack propagation
through the specimen. The re5ults thus far indicate only a slight increase in strength
with loading rate, contrary to the glass fiber composites. The energy absorption
increase with increasing loading rate is also not as great as for some glass fiber
reinforced rfl'stics. Also, the calculated value of elastic strain energy absorbed
for carbon fiber composites is much nearer the measured value of energy absorption
than for glass fiber composites. At this time, it is clear that energy absorption is
not simply related to most experimental variables and the results of standard tests
such as the Charpy test should be interpreted carefully when trying to relate them to
real problems. I
1
17
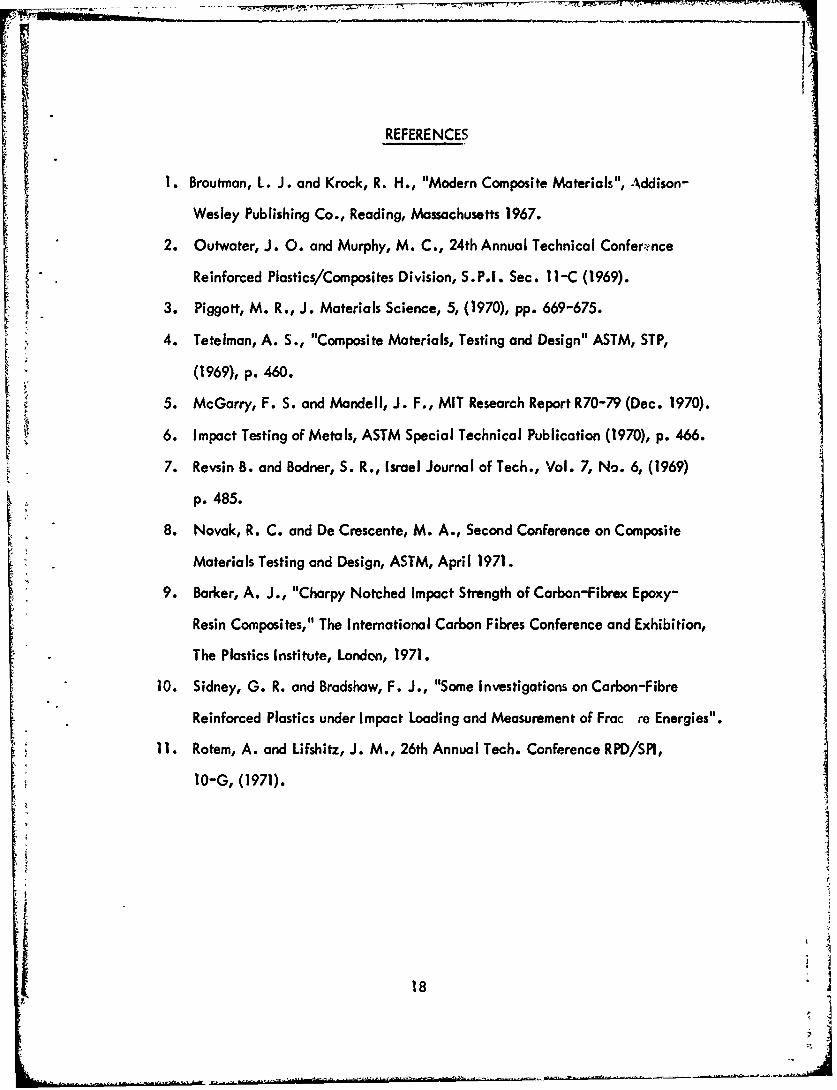
REFERENCES
1. Broutman, L. J. and Krock, R. H., "Modern Composite Materials", Addison-
Wesley Publishing Co., Reading, Massachusetts 1967.
2. Outwater, J. 0. and Murphy, M. C., 24th Annual Technical Confere-,nce
Reinforced Plastics/Composites Division, S.P.I. Sec. 11-C (1969).
3. Piggott, M. R., J. Materials Science, 5, (1970), pp. 669-675.
4. Tetelman, A. S., "Composite Materials, Testing and Design" ASTM, STP,
(1969), p. 460.
5. McGarry, F. S. and Mandell, J. F., MIT Research Report R70-79 (Dec. 1970).
6. Impact Testing of Metals, ASTM Special Technical Publication (1970), p. 466.
7. Revsin B. and Bodner, S. R., Israel Journal of Tech., Vol. 7, No. 6, (1969)
p. 485.
8. Novak, R. C. and De Crescente, M. A., Second Conference on Composite
Materials Testing and Design, ASTM, April 1971.
9. Barker, A. J., "Charpy Notched Impact Strength of Carbon-Fibrex Epoxy-
Resin Composites," The International Carbon Fibres Conference and Exhibition,
The Plastics Institute, London, 1971.
10. Sidney, G. R. and Bradshaw, F. J., "Some Investigations on Carbon-Fibre
Reinforced Plastics under Impact Loading and Measurement of Frac re Energies".
11. Rotem, A. and Lifshitz, J. M., 26th Annual Tech. Conference RPD/SPI,
10-G, (1971).
I
18

I"
Electro MagnetDrop Weight
-- V Added Weights
I.Winch
Load CellSuppcrts
Time Interval Time IntervalMeter Meter
High SpeedMovie Camera
"-, Scope \\Scope Trigger
Specimen
Slides for Supports
Figure 1 Schematic Diagram of Drop Weight Impact Apparatus
/1-A
.z1u
I,7
Ne- 4,
-e.
Fiur 2 Viwo rpW ihtIpc paau

400 = 1~h/4" b/h I L /h'=16 W =6.134 l b.
oh0 hI1/4" b/h I L/h=16 W 12.68 lb.3* h= 1/4" b/h 2 L/h= 16 W= 12.68 lb.
360- 0 h = 1/4" b/h=4 L/h= 16, W= 12.68 lb.o o h= 1/4" b/h I L/h= 16 W= 6.34 Ilb.
320
h -280
240-Ii
20 Unidirectionall C0
I II11I.! II
8 1602 24
1207/
' , Crossply
40-
0) 4 8' : 12 16 20 24, 28
Figure 3 Strength of E-Giass Laminates as a Function of Lo'ading Rate
140
A L/h=16 b/h--I h=l14" W"12.68 lb.
130 o L/h'-16 b/h =I h=1/4" W=6.34 lb.A L/h =32 b/h =2 h= 1/4" W- 12.68 lb.
0 L/h =16 b/h =2 h= 114" W= 12.68 lb.120 * L/h =16 b/h =2 h 1/8" W" 6.34 lb.
N.F. Not Fracturedj110 P.F Partially Fractured
! - I00
I90-
.1
8C
70r
60-o P. F.
50 A P. F.50 -
* 40F
30 ,-Instron Data
2PFA oN.F.
10-
01 , , I I I I I I J i I I i I"0 4 8 12 16 20 24 28
t~.
Figure 4 Energy Absorption of E-Glass Laminates (Cross-ply) as a Functionof Loading Rate

100
90- 0 Transverse Buckling90 A
80
70 /
60 // i
m / A not fracturedLLo
S40,,40
30L/h=16 (h:=/4")
20 b/h=4 W=12.68 l.bs. a
b/h=2 W=12.68 Ibs. .Charpy (without notch)e10-b/h=1b/h=l W = 12.68 1 bs. o
10 b/h =
b/h=i W:6.34 Ibs.,&
001 I_ t 1 I , I Il II 10 4 8 12 16 20 24
Figure 5 Energy Absorption of E-Glass Laminates (Unidirectional) as aFunction of Loading Rate 23

360 •3 h= 1/8" b/h=2 L/h =16 W=6.34 lb.o h= 1/8" b/h=2 L/h=32 W=6.34 lb.* h: 1/8" b/h=6 L/h = 16 W= 6.34 lb.
320- A h= 1/8" b/h-2 L/h=32 High Speed Tension
280- 4
S-glass Unidirectional •
240-A A
0 0
r?200 -
16- 0 00
120 0
Unidirectional (1-2-19-2-1)
• 80- l:3 h = 1/4" b/h = 2 L/h=16 W=7.731b.LoadDirection o h = 1/4" b/h = 2 L/h= 16 W = 14.641b.Drc i h = h/4" b/h = I L/h= 16 W = 6.34 lb.
n h = 1/4" b/h = I L/h= 16 W = 6.34 lb.
0 4 8 12 16 20 24 28
v F
Figure 6 Strength of E-Glas and S-Glass Laminates (Unidirectional) asa Function of Loading Rate

• _•' .... -I I I -|-I I - - I q I
100
Z L/h=16 b/h=2 W=6.341b.h=l/8"o L/h=16 b/h=6 W=6.341b.h= /8"
9 L/h=32 b/h =2 W=6. 341b. h= 1/8"
80
70-
60
- 50.
00wr
40- 0
30
20O
10--
"0 4 8 12 16 20 24 28
PetJ
Figure 7 Energy Absorption of S-Glass Laminate (Unidirectional) as a Functionof Loading Rate

100
90-
00
70- .
60-
• 50 -
40- 13
300
30 h=l/4" b/h=l L/h=16 w=6.34 lb.
Ii Icross ply ! * unidirectional 0 o
20-
0--
o ° I I I , I I i I I 1 I I
0 4 8 12 16 20 24
v[FI.Sec.
Figure 8 The Effect of the Lamination Plane Orientation on the Energy
Absorption of E-Glass Laminates

200
&A Cross ply E -glass b/h=2 h=.25"W= 12.68 lb. V=22.3 Ft/SecU 0 Cross ply E-glass b/h=2 h=.25"W=12.68 lb. V=16.0 Ft/Sec180-* 0 Cross ply E-glass b/h=2 h=.25'W=12.68 lb. V=18.0 Ft/Se* o Unidirectional S-glass b/h=2 h =.125" W= 6.34 lb.
V = 22.3 Ft/Sec160- vUnidirectional S-glass b/h=2 h=.l 25" W=6.34 lb.
V=16.0 Ft/Sec
140 -Elastic Energy (Closed Symbols)
120A
I00 0 0
0
wA
80
60
400 0
An
20-
,C I
'_C0 2 4 6 8 10 12 14
Span in]J
Figure 9 Energy Absorption of E-Glass and S-Glass Laminates as a Functionof Beam Span

L OV
(0 1
0 .
2!O
Alp/*sql og~poo-I t/ ~ Po
U) J
> 0 b*1
.'A/,q Ogp I 61 0 -;
'Alpf*U 0ZuI'OUa4jja(]
4- 44
>I AN
_A I-I
Alpsq 09 =P001 *Aip/,sqJ 99 L!E pc00-i*Alp/*UI 31* UO113aJpa

I',
(.)
0Cl) N
U4) LLU/) I1,,-
0, 0
0
t.-> C;
C;
n ~It
-Y
_0.
0 0 0 00 if)0
Figure I I Load-Deflection Curves for S-Glass Laminates in Bendi ng. ResultsTaken from Oscilloscope Records in Figure 10
___- V6

Ist>
Lc))
4- eQ
c'J . 0l
c'jUPU)t
A~pfsl ~~9APTO
-;Cc
100
90
&T. I&T.
80 AT.AT.
70 AC.B.A&C.8. &C.B.
60- C.B.
C'40
50
i 40 -
30-
20-
A b/h=2 W=12.68 lb. h 1/4" L/h=1610--
C o , ,1 1 , I I 1 1 1 10 4 8 12 16 20 24 28
sec.
Figure 13 The Effect of Failure Mode on Energy Absorption E-Glass Cross-plyLaminates
Ar
B
F;gure 14 Fracture Modes of E-Glass Cross-ply Laminates. A: Partially FailedSpvýIm'2in with Tcosiile Fracture. S: Tensile (T) Fracture. C: Cut(C. B.) Ty;;,: of Fractrre
Mett
L Oai
~o
~ -
I. S .'~NI I

Figure 16 Fracture Modes when the Laminate is Impacted so thrit the LaminationPlanes are Vertical. Photograph shows top surface or impacted surface.
A. Shear mode of fracture in E-Glass cross-ply' laminateB. Transverse ouckling mode of fracture in unidirecztionc-1 laminateC. Delamination mode of fracture in unidirectional lcminate
, I
,'*. •I ," n.- ,
• , . ",
v~ S
* .,,
"I . . , .I
' ,•/ * . . *
4: I
-. . .. . . . . . . _ . 1 _ _ _
I -t I!,
I.I
* S I
*-*j,*]2q i:j , '1 -
S *
S I,
* ' ] . . I . * *I
It.
I S
i" .1
S, I I *
4 I - -t - -

II
CROSS PLY E GLASS/EPOXY
h=l/4" L/'h=16 b/h=2 v=l6ft/sec
Figure 18 Oscilloscope Record for Case when Applied Energy is only SlightlyGreater than that Needed to Fail Specimen

CA A
CASE A
CASE C
Figure 19 Suggested Failure Modes for Unidirectional and Cross-ply Laminates

e0 HTS h 068"- .077" L 2"b I/4"o HMS h . 10"-. 120" L= 2" b= I/4" Manuf. I
& HTS h =138" L=2" b= I/4"
320* HMS h. 1i2" L 2" b= I/4"
280-
¶ 240 -A
200-• AXA
it
120 0 '
00000
80-
S~40-
12 16 20 24 28
Ft 3
Figure 20 Strength of Carbon F'imeroComposites as a Function of Loading Rate

400
*HTS L 2 1 h 1l38 1 b .25 tSHTS L =3" h:.138" b=. 25"
360 A HTS L =4" h=.13811 b .2511*HMS L =2" h = .112"1 b =.25"
o HMS L =3" h =.11611 b =.2511
320-
280 H
1'240-AA
1600
120 L
0 13
0
80-
40-
0 4 8 12 16 20 24 28
[Ft. 1V[ec.J
Figure 21 The Effect of Beam Spýn3?nd Loading Rote in the Strength of CarbonFiber Composites

360
- HTS h = .068"- 077" Monuf. I
320 HTS h = .138" Manuf. Hio HMS h= .110" .116" Manuf. II* HMS h = .110" J20" Monuf. 1
280
240
200
,,160b
120- 0
80-
40-
0 ! I I I Io 5 10 15 20 25 30 35 40
h
Figure 22 The Effect of Beam Span to Depth Ratio on Strength of Carbon FiberComposites
'• •..,. . . . .. .. . .. .. .. . , .. .. •_ ..,.,. , - -• •,-, , .. . . .. ... . . .. .. .... . . ... [- 2L --•- 1- 1
A!p/*sql ocn=POo- Z!~qI ?S pDO,
ic -0
at) C) ( 1ý
cic
to.
*A~p/ sj 001 P01 'iilp/,sqj 2rg2. poo'AlPful I*0 uoloigpaQ

400 . HTS L=2" h=.138" b=.25" High Speed Ten.o HTS L= 4" h=.138" b=.25" High Speed Ten.o HMS L=4 h =. 138" b=.25" High Speed Ten.
360 & HMS L=2" h=.107" b=.25"High Speed Ten.o HMS L=4" h: .107" b:.25" High Speed Ten.
320 - HTS L=4" h=.138" b=.25"Impact W=.936Ib.
o HMS L =4" h= .110" b=.25"Impact W:.936 lb.280-
, ~~240 -- !0
200--
* U)
L-L
A
120--
80-
40
04 8 12 16 20 24 28
Figure 24 Strength of Carbon Fiber Composites Determined from High SpeedTension Machine and Drop Weight Impact Apparatus

'Ap*q ?=q01 -gL"Po
1 0
iAT
*ApsI gZ=C pA~/Sq 99*Lg=PDOO1ol
'Alp/'Ul z,-o~uo!PBai -a
10
c5 d.4 c-
AM(
Cip/sq -op/s ggL =r))'

Figure 26 Frames from High Speed Movie Camera Showing Crack PropagationThrough HMS Carbon Fiber Composite. Time interval between framesis 0. 16 milliseconds.
,/
__ ]

-t.
0L.
.so
TIMMV !"OW PSIM Wl7- o UU
77,
'T 00 "'hi~ili..-..s 1gi
10.0SHMS h=.112" b=.25" L=2"9.0 }Manuf. H
9.0- o HTS h=.138t' b=.2511 L=2
A HMS h=.i20'b=.25" L=211
8.0 . HTS h=.06d-±.077" b=.25"L2' MnfI
7.0-
6.0- 1m
AI
.~5.0-
I4.0
2.0-
HA
0~ Ii0 4 8 12 16 20 24
Figue 2 Enegy bsortio ofCarbon Fiber Composites as a Function of Loading Rate
- I* I
* a (0.0
9.01
8.0
S- 0"
5.01-
5.0- z•HMS h= .12" b=.25"
o HTS h= .138" b=.25"
w1.. . HTS h= .156" b .25"'4.0-
3.0-
2.0-
•.o ~L= 11- • L•
{L3
4 8 12 16 20 24 28
vF FLSecJ
4t7Figure 29 Energy Absorption of Carbon Fiber Compcsites as a Function of Beam
Span arnl Loading Rate

10.04 0 A A HMS h=.112"b=.25
* o HTS h-.138"b=.25" Manf. I1* , HTS h=.156"b=.251,
9.0 0 HMS h=.120"b=.25 Manf. /v HTS h=.068-.077"b=.25j"
Calculated ElasticStored Energy
6.0-I
6.0-
I,
5.0
4.0-
3.0-
2.0-
1.0-010
0 1.0 2.0 3.0 4.0
LO Ey n]
Figure 30 Energy Absorption of Carbon Fiber Composites as a Function of Beam Span 7