Distributed Tracing
23
DISTRIBUTED TRACING KEVIN LINGERFELT / @KLINGERF SF MICROSERVICES / 22 NOV 2016
-
Upload
kevin-lingerfelt -
Category
Technology
-
view
77 -
download
0
Transcript of Distributed Tracing

DISTRIBUTED TRACINGKEVIN LINGERFELT / @KLINGERF SF MICROSERVICES / 22 NOV 2016

INTRO
ABOUT ME
▸ Buoyant employee, 2015 – present
▸ Twitter employee, 2010 – 2015
▸ Tech lead for Twitter’s monolith, helped with decomposition
▸ Contributor to zipkin and linkerd open source projects
▸ twitter.com/klingerf

INTRO
WHY TRACING?
▸ Microservices are fast and flexible, but debugging and profiling can be problematic, especially as size of application grows
▸ No one service provides complete picture of system performance
▸ Distributed tracing collects and aggregates metadata about requests as they transit through your application
▸ Allows you to observe your production system from within the system itself, rather than lying on external reporting
▸ Instrumenting services and centralizing trace data is way more achievable than digging through logs

INTRO
WHY TRACING?

BACKGROUND

BACKGROUND

BACKGROUND
DAPPER
▸ Written in-house at Google
▸ Used to diagnose issues in complex distributed systems
▸ Highly scalable, low overhead for running services
▸ Small surface area for instrumentation libraries
▸ Technical report:research.google.com/pubs/archive/36356.pdf

BACKGROUND
ZIPKIN
▸ Written in-house at Twitter
▸ Based on Dapper, originally called “Big Brother Bird”
▸ Open sourced by Twitter in 2012
▸ Now maintained by OpenZipkin
▸ Provides trace instrumentation, collection, storage, API, UI
▸ Supports dozens of languages and frameworks

BACKGROUND
OPEN-TRACING
▸ Aims to unify disparate tracing concepts, APIs, wire formats
▸ Separates trace representation from collection, making it possible to swap out tracing backends with little or no code changes
▸ Provides instrumentation libraries in six languages, more coming
▸ Works with Zipkin, appdash, Tracer, Jaeger, and Lightstep backends

CONCEPTS

CONCEPTS
TERMINOLOGY
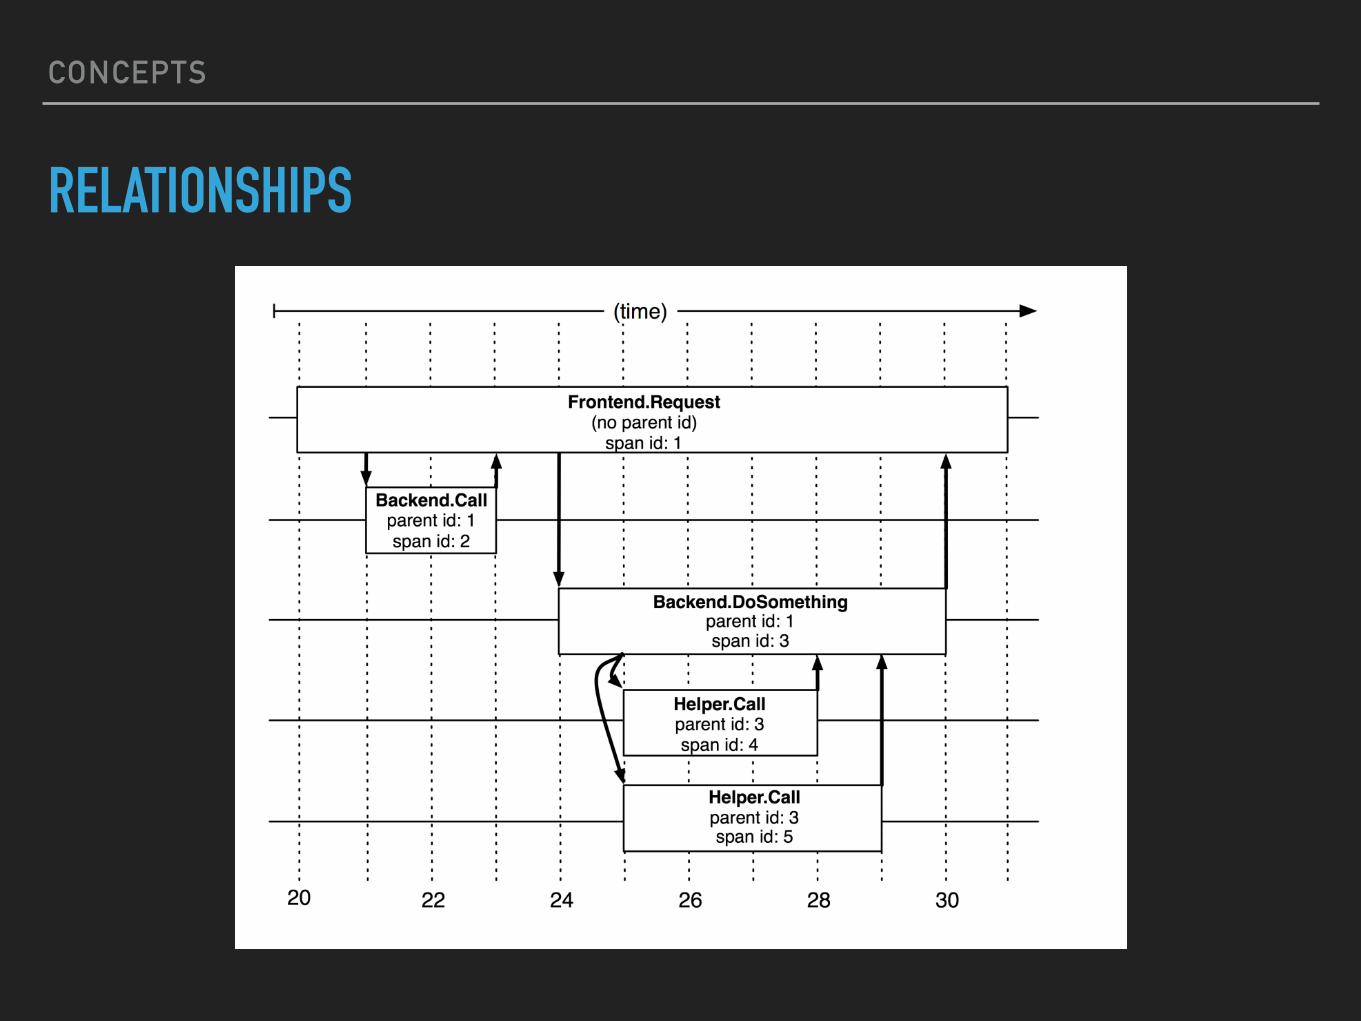
▸ Trace: All data pertaining to a distributed request; a collection of spans.
▸ Span: A logical unit of work within a request. Spans have start/end times, and may define relationships to other spans (e.g. parent/child).
▸ Context: Metadata that is propagated across spans, includes trace and span ids, as well as key-value pairs (AKA baggage).
▸ Collection: Mechanism by which trace data is collected from span producers (e.g. HTTP, Kafka, Scribe).
▸ Storage: Location where collected trace data is stored (e.g. MySQL, Cassandra, ElasticSearch).
CONCEPTS
RELATIONSHIPS

CONCEPTS
ARCHITECTURE

ROLLING YOUR OWNEXAMPLE

ROLLING YOUR OWN
CONFIGURE THE TRACER

ROLLING YOUR OWN
CONFIGURE YOUR SERVERS

ROLLING YOUR OWN
CONFIGURE YOUR CLIENTS

ROLLING YOUR OWN
DEMO

USING A SERVICE MESHEXAMPLE

USING A SERVICE MESH
DRAWBACKS TO ROLLING YOUR OWN
▸ Adding tracing code to each of your clients and servers can be invasive, and will complicate your applications.
▸ Using frameworks helps, but collection is still configured per-application, and it’s easy to overlook it.
▸ Instrumentation may not be standardized across all frameworks in use polyglot microservice architectures.
▸ Tracing happens in the request path, so it’s critical that instrumentation libraries add as little overhead as possible.

USING A SERVICE MESH
CONFIGURE THE TRACER

USING A SERVICE MESH
DEMO