Distributed Power-Management Architecture for a...
8
Distributed Power-Management Architecture for a Low-Profile Concentrating-PV System Mohammad Shawkat Zaman ∗ , Shahab Poshtkouhi ∗ , Vishal Palaniappan ∗ , King Wai Li ∗ , Henk Jan Bergveld † , Stefan Myskorg ‡ , and Olivier Trescases ∗ ∗ The Edward S. Rogers Sr. Electrical and Computer Engineering Department, University of Toronto, Ontario, Canada † NXP Semiconductors, Eindhoven, Netherlands ‡ Morgan Solar Inc., Toronto, Canada Abstract—This paper presents a low-cost dc-dc distributed power-management architecture for a low-profile concentrating- photovoltaic (CPV) system. The proposed scheme uses invert- ing buck-boost converters connected across neighboring series- connected CPV cells to achieve a virtual-parallel connection and thus improve the tolerance of the overall system to parameter variations. Since the converters process the difference between corresponding cell currents and the string current, they have reduced power-handling and efficiency requirements. Current cascading is identified as the main challenge with this archi- tecture. Statistical simulations are used to investigate the current distributions in the converters, and power benefits are analyzed using measured data from a six-cell CPV system. Experimental results from four- and three-cell systems using digitally controlled converters demonstrate clear power benefits in the presence of tracker misalignment and short-circuit current mismatches. Index Terms—Concentrated PV, Delta Converter, Distributed Power Management. I. I NTRODUCTION Worldwide interest in harvesting solar energy using photo- voltaic (PV) panels has grown dramatically in recent years. While conventional mono-crystalline silicon and thin-film technologies dominate the market today, new concentrating- PV (CPV) systems are emerging as a promising alternative in certain markets [1, 2]. CPV technology uses 500-1000× less semiconductor material than conventional PV modules, and replaces it with low-cost recyclable materials, enabling rapid scale-up with low capital costs [3]. CPV systems typically use multi-junction, III-V semiconductor-based photovoltaic cells that utilize the solar spectrum more effectively than single junction materials, achieving cell-level efficiencies in excess of 40% [4]. By combining three III-V semiconductor junctions having a different bandgap in series, a high responsivity over a broad range of wavelengths from 300–1800 nm can be achieved. The CPV system used in this work is based on the Light- guide Solar Optic (LSO) technology developed by Morgan Solar, Inc. Unlike conventional CPV concentrators, the LSO is a low-profile, light-weight device that acts as a waveguide and uses total internal reflection to transfer the direct normal irradiance onto a triple-junction cell located at the center. This process is shown in the ray-trace simulation of Fig. 1(a). The system achieves an efficiency of 25% while operating at a concentration of 900 suns. Triple Junction Cell LSO Concentrator (a) (b) (c) Fig. 1. (a) Ray-trace simulation of the low-profile LSO showing the irradiance concentration. Each packaged LSO includes an optical concentrator and a multi-junction cell. (b) Four-LSO experimental CPV system used in this work. (c) Dual-axis CPV mechanical tracking system. The high concentration allows the quantity of semiconductor material to be minimized. The system is primarily composed of Polymethyl-methacrylate (PMMA) and glass, making the manufacturing inexpensive. Each LSO is hexagonal in shape, measuring approximately 200 mm across the flats and has a maximum power in the sub-10W range. The LSOs can be tiled to create arbitrarily large PV systems, as shown in Fig. 1(c), where a dual-axis mechanical tracker is used to maintain alignment with the sun. In conventional PV and CPV systems, dozens of modules are connected in series to form high-voltage strings and the current is controlled using a central inverter to achieve Maximum Power Point Tracking (MPPT) under varying en- vironmental conditions. Performing MPPT in each module using a dedicated power converter has gained momentum in recent years in both academic research [5–10] and products from industry [11,12]. High granularity, or distributed MPPT (DMPPT), has been shown to yield significant power benefits
Transcript of Distributed Power-Management Architecture for a...

Distributed Power-Management Architecture fora Low-Profile Concentrating-PV System
Mohammad Shawkat Zaman∗, Shahab Poshtkouhi∗, Vishal Palaniappan∗, King Wai Li∗,Henk Jan Bergveld†, Stefan Myskorg‡, and Olivier Trescases∗
∗The Edward S. Rogers Sr. Electrical and Computer Engineering Department,University of Toronto, Ontario, Canada
†NXP Semiconductors, Eindhoven, Netherlands‡Morgan Solar Inc., Toronto, Canada
Abstract—This paper presents a low-cost dc-dc distributedpower-management architecture for a low-profile concentrating-photovoltaic (CPV) system. The proposed scheme uses invert-ing buck-boost converters connected across neighboring series-connected CPV cells to achieve a virtual-parallel connection andthus improve the tolerance of the overall system to parametervariations. Since the converters process the difference betweencorresponding cell currents and the string current, they havereduced power-handling and efficiency requirements. Currentcascading is identified as the main challenge with this archi-tecture. Statistical simulations are used to investigate the currentdistributions in the converters, and power benefits are analyzedusing measured data from a six-cell CPV system. Experimentalresults from four- and three-cell systems using digitally controlledconverters demonstrate clear power benefits in the presence oftracker misalignment and short-circuit current mismatches.
Index Terms—Concentrated PV, Delta Converter, DistributedPower Management.
I. INTRODUCTION
Worldwide interest in harvesting solar energy using photo-voltaic (PV) panels has grown dramatically in recent years.While conventional mono-crystalline silicon and thin-filmtechnologies dominate the market today, new concentrating-PV (CPV) systems are emerging as a promising alternative incertain markets [1, 2]. CPV technology uses 500-1000× lesssemiconductor material than conventional PV modules, andreplaces it with low-cost recyclable materials, enabling rapidscale-up with low capital costs [3].
CPV systems typically use multi-junction, III-Vsemiconductor-based photovoltaic cells that utilize the solarspectrum more effectively than single junction materials,achieving cell-level efficiencies in excess of 40% [4]. Bycombining three III-V semiconductor junctions having adifferent bandgap in series, a high responsivity over a broadrange of wavelengths from 300–1800 nm can be achieved.
The CPV system used in this work is based on the Light-guide Solar Optic (LSO) technology developed by MorganSolar, Inc. Unlike conventional CPV concentrators, the LSOis a low-profile, light-weight device that acts as a waveguideand uses total internal reflection to transfer the direct normalirradiance onto a triple-junction cell located at the center. Thisprocess is shown in the ray-trace simulation of Fig. 1(a). Thesystem achieves an efficiency of 25% while operating at aconcentration of 900 suns.
TripleJunctionCellLSO
Concentrator
(a)
(b) (c)
Fig. 1. (a) Ray-trace simulation of the low-profile LSO showing the irradianceconcentration. Each packaged LSO includes an optical concentrator and amulti-junction cell. (b) Four-LSO experimental CPV system used in this work.(c) Dual-axis CPV mechanical tracking system.
The high concentration allows the quantity of semiconductormaterial to be minimized. The system is primarily composedof Polymethyl-methacrylate (PMMA) and glass, making themanufacturing inexpensive. Each LSO is hexagonal in shape,measuring approximately 200 mm across the flats and hasa maximum power in the sub-10W range. The LSOs canbe tiled to create arbitrarily large PV systems, as shown inFig. 1(c), where a dual-axis mechanical tracker is used tomaintain alignment with the sun.
In conventional PV and CPV systems, dozens of modulesare connected in series to form high-voltage strings andthe current is controlled using a central inverter to achieveMaximum Power Point Tracking (MPPT) under varying en-vironmental conditions. Performing MPPT in each moduleusing a dedicated power converter has gained momentum inrecent years in both academic research [5–10] and productsfrom industry [11,12]. High granularity, or distributed MPPT(DMPPT), has been shown to yield significant power benefits
when the string experiences partial shading [13]. Unlike con-ventional PV modules that have a power rating of over 250 Wand occupy well over 1 m2, the CPV LSOs used in this workare approximately 25× smaller and thus offer a potential for amuch more fine-grained MPPT approach that is incompatiblewith existing high-power DMPPT solutions [11, 12] due tocost constraints. The focus of this work is a fine-grained, low-cost power-management strategy specifically optimized for thenovel CPV system shown in Fig. 1(c).
II. DISTRIBUTED POWER ELECTRONICS FOR CPV
Today’s CPV systems are usually deployed in rural areashaving few obstacles and near-uniform irradiance conditions.Performance degradation in these systems is therefore primar-ily due to non-uniform optical characteristics, misalignment inthe concentrators, electrical and thermal parameter variationsin the multi-junction cells, non-uniform aging, as well as self-shading of the system at dusk and dawn.
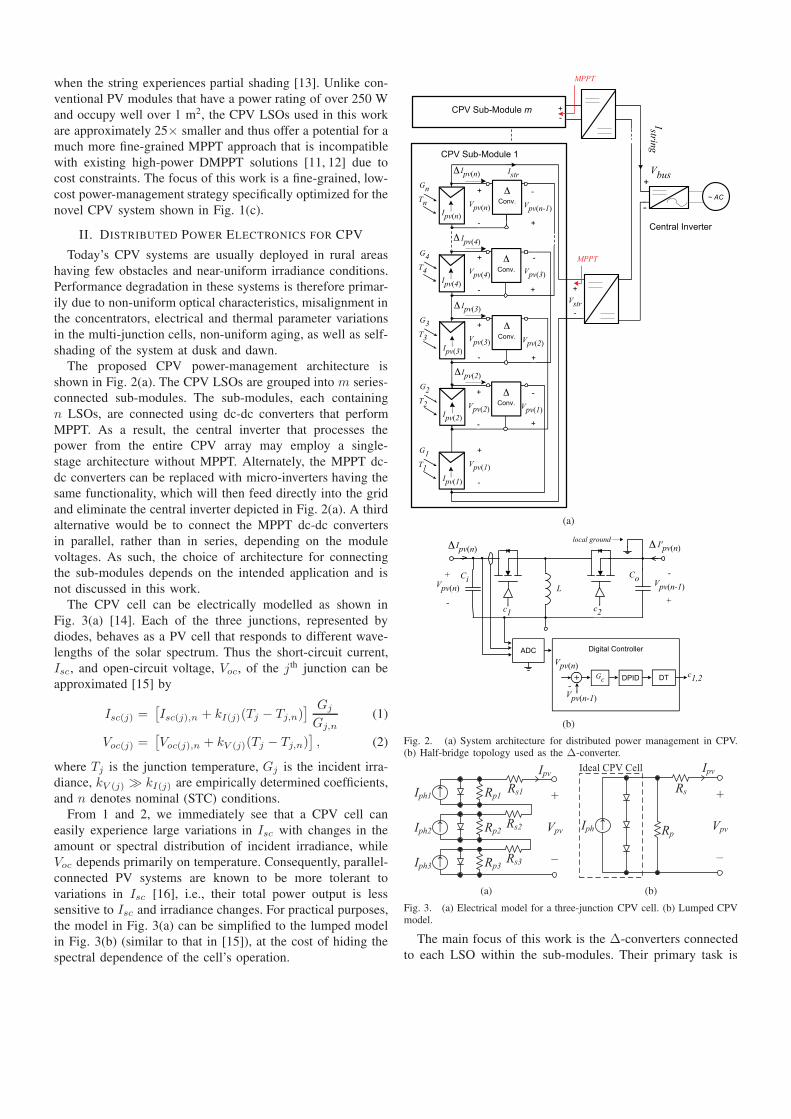
The proposed CPV power-management architecture isshown in Fig. 2(a). The CPV LSOs are grouped into m series-connected sub-modules. The sub-modules, each containingn LSOs, are connected using dc-dc converters that performMPPT. As a result, the central inverter that processes thepower from the entire CPV array may employ a single-stage architecture without MPPT. Alternately, the MPPT dc-dc converters can be replaced with micro-inverters having thesame functionality, which will then feed directly into the gridand eliminate the central inverter depicted in Fig. 2(a). A thirdalternative would be to connect the MPPT dc-dc convertersin parallel, rather than in series, depending on the modulevoltages. As such, the choice of architecture for connectingthe sub-modules depends on the intended application and isnot discussed in this work.
The CPV cell can be electrically modelled as shown inFig. 3(a) [14]. Each of the three junctions, represented bydiodes, behaves as a PV cell that responds to different wave-lengths of the solar spectrum. Thus the short-circuit current,Isc, and open-circuit voltage, Voc, of the j th junction can beapproximated [15] by
Isc(j) =[Isc(j),n + kI(j)(Tj − Tj,n)
] Gj
Gj,n(1)
Voc(j) =[Voc(j),n + kV (j)(Tj − Tj,n)
], (2)
where Tj is the junction temperature, Gj is the incident irra-diance, kV (j) � kI(j) are empirically determined coefficients,and n denotes nominal (STC) conditions.
From 1 and 2, we immediately see that a CPV cell caneasily experience large variations in Isc with changes in theamount or spectral distribution of incident irradiance, whileVoc depends primarily on temperature. Consequently, parallel-connected PV systems are known to be more tolerant tovariations in Isc [16], i.e., their total power output is lesssensitive to Isc and irradiance changes. For practical purposes,the model in Fig. 3(a) can be simplified to the lumped modelin Fig. 3(b) (similar to that in [15]), at the cost of hiding thespectral dependence of the cell’s operation.
G4T4
G3T3
G1T1
Ipv(4)
Vbus+
Istring
Ipv(3)
Vpv(3)
-
+
Vpv(2)
+
~ AC
Central Inverter
GnTn
Ipv(n)
Vpv(n-1)
-
+
CPV Sub-Module 1
CPV Sub-Module m
-
MPPT
Δ
Δ
Δ
Ipv(1)
Ipv(3)
Ipv(4)
Ipv(n)
Istr
+-
MPPT
G2T2
Ipv(2)
Vpv(1)
-
Δ
Ipv(2)+
Conv.Δ
Conv.Δ
-Conv.Δ
Conv.Δ
Vstr
Vpv(n)
+
-
Vpv(4)
+
-
Vpv(3)
+
-
Vpv(2)
+
-
Vpv(1)
+
-
+
-
(a)
Digital Controller
L+
Vpv(n)
-
-Vpv(n-1)
+c1 c2
c1,2
ADC
Ci Co
Ipv(n)local ground
Gc
Vpv(n)DPID
-Vpv(n-1)
DT)+
Δ I'pv(n)Δ
(b)
Fig. 2. (a) System architecture for distributed power management in CPV.(b) Half-bridge topology used as the Δ-converter.
Rs1Ipv
+
Vpv
–
Rp1
↓Iph1
Rp2
↓Iph2
Rp3
↓Iph3
Rs2
Rs3
(a)
↓
Rs
Ipv
Iph
Ideal CPV Cell
+
Vpv
–
Rp
(b)
Fig. 3. (a) Electrical model for a three-junction CPV cell. (b) Lumped CPVmodel.
The main focus of this work is the Δ-converters connectedto each LSO within the sub-modules. Their primary task is

to achieve a so-called virtual parallel connection between theLSOs by actively equalizing their voltages. The Δ-converters,which are built using the half-bridge architecture shown inFig. 2(b), allow bi-directional power flow between neighboringLSOs to achieve voltage equalization. The Δ-converter nameis chosen because they nominally process only the differencebetween the current of the associated CPV cell and the modulestring current. The system requires two additional wires fromeach LSO to its neighbors, which come at a low cost sincethey carry much lower currents than the main branch onaverage, as shown in Section III. Each Δ-converter regulatesVpv(n) to Vpv(n−1) using a digital PID regulator, and voltageequalization is thus achieved in a distributed way, withoutcommunication. Each Δ-converter operates with duty cycle, Dnear 50% in steady-state, which yields a high switch utilizationand simplifies the design of the power stage. The Δ-conversionscheme was conceptually illustrated in [6], and demonstratedfor conventional crystalline Si-PV modules in [7] and [17] ata lower level of granularity (module and sub-string vs. cell-level in this work) and with different performance trade-offs.More recently, the Δ-scheme was applied to a string of Si-PV module-integrated converters (MIC) [18], where the Δ-converters were used to balance the outputs of the MICs ratherthan the PV modules directly. In this work we show the effectsof current cascading in detail and demonstrate the applicationto CPV systems at the cell-level.
This distributed approach is similar to the active cell balanc-ing used in large batteries [19], with the important distinctionthat the CPV system lacks any significant energy-storagecapacity. This implies that the power must be balanced at alltimes throughout the string. The chosen Δ-architecture hasseveral important benefits:
1) The energy yield is improved due to the increased robust-ness to mismatches in the system.
2) Nominally, the Δ-converters only process the differencebetween the associated cell current and the module stringcurrent. This leads to reduced average power-handling re-quirements and associated losses, as shown in Section III.
3) The Δ-converters are a parallel add-on to the string;hence they do not represent an insertion loss and theirefficiency does not need to be as high as the downstreamdc-dc converters that perform MPPT. If the CPV systemis perfectly matched, all Δ-converters are off and loss-less.
4) The system can still operate reliably even if one or moreΔ-converters fail as open-circuits.
These factors result in a low incremental cost for the useof Δ-converters in CPV applications, while imposing someimportant design challenges, as described in Section III.
III. Δ-CONVERTER SYSTEM CHALLENGES: CURRENT
CASCADING
A MATLAB Simulink model of the Δ-conversion system,shown in Fig. 4, illustrates the relationship between the variousquantities in the system. Assuming that the j th converter has
an efficiency of ηj , its current is given recursively by
ΔIpv(j) =
(1 + kj
Vpv(j)
Vpv(j−1)
)−1
×(Ipv(j) − Ipv(j−1) +ΔIpv(j−1) + kj+1
Vpv(j+1)
Vpv(j)ΔIpv(j+1)
),
where kj =
{ηj , if ΔIpv(j) ≥ 01ηj, if ΔIpv(j) < 0
.
(3)
The components in Fig. 2(b) can be bundled in one of twoways and associated with an LSO, which leaves either thetop or the bottom cell of the string without a converter, asin Fig. 2(a) where ΔIpv(1) = 0. A string of n cells thereforerequires (n− 1) active converters.
The current feedback between the CPV cells and associatedΔ-converters, coupled with the nonlinear I-V characteristicsof the CPV cells, makes it impractical to solve Eq. (3) inclosed-form. The Simulink setup used in this work, shownin Fig. 4, provides the steady-state operating points for theproposed system using transient simulations. The relationshipbetween each Vpv(j) and Ipv(j) is determined by the simplifiedCPV electrical model shown in Fig 3(b). A current-controlledmodel is used for the Δ-converters, with a PID regulatorthat controls the average inductor current to equalize theconverter’s input and output voltages. The current-dependentefficiency of each converter, similar to that shown in Fig. 12,is accurately modeled, and Istr is optimized using an externalMPPT block.
�I'pv(n)�Ipv(n) Ipv(n)PID
Gn TnIL(n)
PIDG3 T3IL(3)
CPV(2)PID
G2 T2IL(2) �Ipv(2) Ipv(2)
�Ipv(3) Ipv(3)
�Ipv(n–1)Vpv(n–1) Ipv(n–1)
�I'pv(4)
�I'pv(3)
Istr
G1 T1Vpv(1)Ipv(1)
�I'pv(2)Vpv(2)
Vpv(3)
Vpv(n)
�
MPPT Vstr
–
–
–
–
–
Averaged Converter ModelWith Efficiency{
–
–
–
�Conv.
�Conv. CPV(3)
�Conv. CPV(n)
CPV(1)
Fig. 4. MATLAB Simulink setup used to simulate current cascadingscenarios.
As the converters transfer current to their neighbors in order

to equalize the voltages, each successive Δ-converter has alarger current variability, a process which is designated ascurrent cascading.
A. Statistical Current Distribution Simulations
A statistical system simulation for n = 12 was run inSimulink to illustrate the current cascading phenomenon,using the simulation setup shown in Fig. 4. The simulationwas run with a fixed irradiance input for each of the 12 LSOs.In each simulation, the LSOs are randomly selected from abatch that has a normal distribution in the short-circuit currentparameter, Isc, in order to simulate process variations. The Iscis normally distributed with a standard deviation of σI/μI =10%. The statistical distribution of the normalized convertercurrents, ΔIpv(j)/Ipv(j), is shown in Fig. 5(a) for a 3000-pointsimulation.
(a)
70 80 90 100 110 120 130 140 1500
10
20
30
40
50
60
70
80
90
Total Extracted Power (W)
His
togr
am C
ount
Without Δ−ConvertersWith Δ−Converters
(b)
Fig. 5. (a) Δ-converter current distributions. (b) String power distributionswith and without Δ-converters, with uniform irradiance and 10% variation inIsc.
The quantity ΔIpv(j)/Ipv(j) is an important measure of therelative current spread in the converters, which is useful fordesigning the current-limiting strategy and sizing the powerstage based on economic considerations. For some rare caseswhere ΔIpv(j)/Ipv(j) > 0.5, the Δ-converters can carry morethan 50% of the current as the CPV cell to which they areassociated. High currents lead to low efficiency and reducedenergy yield. The Δ-converter concept is therefore generallymore suitable for systems having relatively small statisticalvariations, such as CPV systems that operate in a nearly shade-free environment for most of the day.
The simulation shows a very interesting effect: the spreadin ΔIpv(j)/Ipv(j) is minimized at the top and bottom of thestring and gradually increases towards the middle of the string.The middle Δ-converters are therefore more likely to carrysubstantially higher currents, and have reduced reliability.The statistical distribution for the total extracted power withand without the converters added to the system is shownin Fig. 5(b), which clearly demonstrates the benefit of theΔ-converters. Despite the limited efficiency of the dc-dcconverters, as shown in Fig. 12, the mean power, μP , increasesby 13% from 115 W to 130 W, while the spread, σP /μP ,is reduced by 52%. The simulation platform is useful forinvestigating the effects of other system parameters, such asirradiance and thermal distributions.
B. Current Distributions Under Specific Scenarios
The statistical results in Fig. 5(a) show that, on average,the converters near the middle of the CPV string carry alarger current than the others. However, this does not illustratehow individual converter currents vary under a given set ofconditions. Scenarios of interest include heavy shading on asingle cell in the string due to dirt and gradient shading acrossthe string during sunrise and sunset. These conditions wereinvestigated using a simulation setup similar to Fig. 4 and theresults are shown in Figs. 6 and 7.
0 5 10 15 20 25 30 35 40 45 500.6
0.7
0.8
0.9
1
1.1
Cell Number, j
Nor
mal
ized
Cel
l Irr
adia
nce,
G j/G
nom
48−cell String32−cell String16−cell String
(a)
0 5 10 15 20 25 30 35 40 45 50−0.3
−0.2
−0.1
0
0.1
0.2
0.3
Cell Number, j
Nor
mal
ized
Con
vert
er C
urre
nt,
ΔIpv
(j)/I pv
(j)
48−cell String32−cell String16−cell String
(b)
Fig. 6. (a) Irradiance profile of the CPV string, and (b) corresponding Δ-converter current profile, where CPV Cell #8 is 30% under-irradiated.
Fig. 6(a) shows the scenario where Cell #8 has 30% lowerirradiance than the rest of the string, and Fig. 6(b) shows the

resulting converter currents, normalized, as a function of thecell number, for various string lengths, n, while the stringoperates at MPP. The virtual parallel architecture causes powerto flow from each of the fully illuminated cells to the under-performing cell through the Δ-converters. Because of voltageequalization, power flow is also equivalent to current flow forthis setup, as reflected in Fig. 6(b). The power flow towardthe j = 8 cell begins at the edges of the string, and thepower contribution from the other cells, ΔPj , accumulatesthrough the converters, represented by a rise in the convertercurrents, ΔIpv(j). Near the edges of the string, the amountof power flowing through the converters is low, and theyoperate with high efficiency. As such, the power flow increasestoward j = 8 with the contribution from each successivecell. But this also causes the converters located further downthe string (in the direction of flow of ΔIpv(j)) to operatewith lower efficiency, such that the net increase in powerflow at each cell, i.e., the difference between ΔPj and thecorresponding converter’s loss, diminishes. The cell locationwhere this diminishing effect becomes significant depends onthe efficiency profile of the converters and the specific modulestring current, Istr. The external MPPT algorithm adjusts Istrto maximize total power output of the system.
0 5 10 15 20 25 30 35 40 45 500.8
0.9
1
1.1
1.2
Cell Number, j
Nor
mal
ized
Cel
l Irr
adia
nce,
G j/G
nom
48−cell String32−cell String16−cell String
(a)
0 5 10 15 20 25 30 35 40 45 500
0.1
0.2
0.3
0.4
0.5
0.6
0.7
0.8
Cell Number, j
Nor
mal
ized
Con
vert
er C
urre
nt,
ΔIpv
(j)/I pv
(j)
48−cell String32−cell String16−cell String
(b)
Fig. 7. (a) Irradiance profile of the CPV string, and (b) corresponding Δ-converter current profile, with a 30% irradiance gradient across the string.
In the second scenario, there is a 30% irradiance gradientacross the string, i.e., the irradiance of the CPV cells varylinearly from 115% of nominal at the j = 16/32/48 end, to
85% of nominal at j = 1 (as shown in Fig. 7(a)). Fig. 7(b)shows the resulting converter currents, normalized, at the MPP.This again shows a similar phenomenon as Fig. 6(b), withpower flowing from one end to the other. As before, thecells near the strongly irradiated end contribute power to thecells near the weakly irradiated end through the Δ-converters.As a result, ΔIpv(j) increases and reaches a peak as powercontributions from the stronger cells accumulate through theΔ-converters, and then begin to decrease as the weaker cellsabsorb part of the power being transferred. The location ofthe peak ΔIpv(j), as in the previous case, depends upon theefficiency profile of the converters and Istr .
These two scenarios illustrate two important design consid-erations for the Δ-architecture:
1) On average, Δ-converters carry higher currents in longerstrings under similar conditions. This limits the practicalstring length.
2) Partial shading can cause a large number of convertersto carry significant amounts of current, and the situationworsens with longer strings.
Both of these observations imply that it is not economicalto allow ΔPj to travel long distances along a string, anddemonstrate the need for an intelligent limiting of power flowat the system level.
IV. EXPERIMENTAL RESULTS
A. Power Analysis Using Measured CPV Characteristics
The first verification of the Δ-conversion scheme wasobtained by utilizing the simulation setup shown in Fig. 4.The I-V characteristics of 6 CPV cells were measured over 8days using a custom data acquisition (DAQ) setup. The cellswere kept aligned to the sun during this time using a two-axismechanical tracker. The DAQ system performs I-V sweeps oneach cell every minute, and the cells are regulated to their MPPin between the sweeps, in order to maintain a realistic junctiontemperature. The days were sunny with mostly clear skies,except for the fifth day which had significant cloud coverageand thus yielded very little power.
Fig. 8(a) shows the short-circuit currents, Isc, of the cellsfor each sample point, normalized to the peak current in theset. Since Isc is proportional to the incident irradiance (andthus output power as well), this provides an indication ofthe fluctuation in cell power over the course of the days.Fig. 8(b) shows the maximum variation in Isc and Voc as apercentage of the average for each sample point. Since theΔ-converters operate on current mismatches by equalizingvoltages, Fig. 8(b) provides a sense of the expected benefitsfrom the Δ-scheme. The current mismatches are generallyaround 5%, and usually well below 10% (except duringlow-irradiance conditions), which agrees with the statisticalsimulations in Section III. On the other hand, the mismatchesin voltages are much lower than in currents, which means thatthe Vmp of the cells are generally very similar. This justifiesthe use of simple voltage equalization in the Δ-conversionscheme, which will still bring the cells close to their MPPs.

12AM 12PM 12AM 12PM 12AM 12PM 12AM 12PM 12AM 12PM 12AM 12PM 12AM 12PM 12AM 12PM 12AM
0
0.1
0.2
0.3
0.4
0.5
0.6
0.7
0.8
0.9
1
Time of the Day
0 12 24 36 48 60 72 84 96 108 120 132 144 156 168 180 1920
0.1
0.2
0.3
0.4
0.5
0.6
0.7
0.8
0.9
1
1.1
Elapsed Time (h)
Nor
mal
ized
Cel
l Sho
rt−ci
rcui
t Cur
rent
, Isc
Cell #1Cell #2Cell #3Cell #4Cell #5Cell #6
(a)
12AM 12PM 12AM 12PM 12AM 12PM 12AM 12PM 12AM 12PM 12AM 12PM 12AM 12PM 12AM 12PM 12AM
0
0.1
0.2
0.3
0.4
0.5
0.6
0.7
0.8
0.9
1
Time of the Day
0 12 24 36 48 60 72 84 96 108 120 132 144 156 168 180 1920
2.5
5
7.5
10
12.5
15
Elapsed Time (h)
Max
Per
cent
Mis
mat
ch (%
)
Isc Mismatch
Voc Mismatch
(b)
Fig. 8. (a) Measured short-circuit currents (normalized), and (b) maximumpercent mismatch in short-circuit currents and open-circuit voltages over time,for a typical 6-LSO string.
12AM 12PM 12AM 12PM 12AM 12PM 12AM 12PM 12AM 12PM 12AM 12PM 12AM 12PM 12AM 12PM 12AM
0
0.1
0.2
0.3
0.4
0.5
0.6
0.7
0.8
0.9
1
Time of the Day
0 12 24 36 48 60 72 84 96 108 120 132 144 156 168 180 1920.7
0.75
0.8
0.85
0.9
0.95
1
1.05
Elapsed Time (h)
Nor
mal
ized
Stri
ng P
ower
With Ideal DMPPTWith Ideal Δ−convertersWith Non−ideal Δ−convertersWithout Δ−converters (Series)
Fig. 9. Extracted string power (normalized) over eight days, for a typical6-LSO string under various scenarios.
A six-cell, five-converter system was constructed inMATLAB Simulink, similar to Fig. 4, where the analyticalCPV cell models were replaced by lookup tables driven by
the experimental data obtained from the DAQ system, andthe simulation was run for each sample point. The resultingsteady-state output powers are shown in Fig. 9.
The four quantities represented in Fig. 9 are as follows.1) With Ideal DMPPT: Sum of the MPP power values of
the six cells at the given point in time. This is calculatedfrom the measured I-V profiles, and corresponds to themaximum possible power output of the string at thatmoment. Thus, it is the basis for normalization, andcoincides with the unity line throughout. This wouldcorrespond to the string output power if DMPPT wasperformed at the cell level using lossless components.
2) With Ideal Δ-converters: Total power obtained from thesix-cell string when the Δ-scheme is applied on the seriesconfiguration using ideal (lossless) converters.
3) With Non-ideal Δ-converters: Same as 2, except in thiscase the converters have an efficiency profile similar tothat in Fig. 12.
4) Without Δ-converters: Total string power when the sixcells are arranged in the conventional series configuration,without the Δ-converters.
Obviously, the power produced by the CPV cells vary overa wide range with ambient conditions and the time of the day.In order to avoid meaningless comparisons, the simulationswere run only for cases where the six-cell string producedpower beyond a minimum threshold.
The most appropriate comparison can be made between thecases 3 and 4, demonstrating the benefit of introducing the Δ-converters. Clearly, utilizing Δ-conversion consistently resultsin higher power output compared to the basic series scheme,up to 10%. Moreover, in a practical large-scale system, nwould be much larger than 6, greatly improving the powerbenefits. Since the six LSOs are new and well-matched,the benefits would increase over time as the cells age andare subjected to environmental variations, causing increasedinter-cell mismatches. As such, the Δ-conversion system canproduce significant improvements to the energy yield of thesystem in the long term.
Fig. 10 shows the section of the data presented in Fig. 9corresponding to the 3rd day, but normalized to the peakDMPPT power of the day, rather than the DMPPT powerat each sample point. The data points demonstrate that Δ-conversion generally yields better power output, and in certaincases the improvements are significant (such as near 9AM inFig. 10, due to higher mismatches among the cells). AlthoughΔ-conversion provides little benefit when the cell currents arerelatively well-matched, it does not detract from the system’sperformance either, because in such scenarios the Δ-convertersare effectively off and thus lossless.
B. Experimental Results from Prototype Systems
For a practical verification of the Δ-conversion scheme, onesub-module of the system shown in Fig. 2(a) was constructed.Each converter was constructed on a separate Printed-CircuitBoard (PCB), as shown in Fig. 11, with the parameters listedin Table I.

7AM 8AM 9AM 10AM 11AM 12PM 1PM 2PM 3PM 4PM 5PM 6PM 7PM 8PM 9PM
0
0.1
0.2
0.3
0.4
0.5
0.6
0.7
0.8
0.9
1
Time of the Day
55 56 57 58 59 60 61 62 63 64 65 66 67 68 690
0.1
0.2
0.3
0.4
0.5
0.6
0.7
0.8
0.9
1
1.1
Elapsed Time (h)
Nor
mal
ized
Stri
ng P
ower
With Ideal DMPPTWith Ideal Δ−convertersWith Non−ideal Δ−convertersWithout Δ−converters (Series)
Fig. 10. Extracted string power (normalized) over one day, for a typical6-LSO string under various scenarios.
TABLE IΔ-CONVERTER SPECIFICATIONS
Parameter Value Unit
Switching frequency, fs 500 kHz
Inductance, L 33 µH
Input capacitance, Cin 40 µF
Output capacitance, Cout 40 µF
Nominal Open-circuit Voltage, Voc 3.125 V
Cell MPP Voltage, Vmpp 2.762 V
Maximum inductor current, IL 1 A
Drive Voltage, Vdr 8 V
Switch On-resistance, Ron 50 mΩ
QgateRon Product for the Switches 312.5 mΩnC
The maximum current limit of the Δ-converters was chosenbased on the simulations of Section III. The digital controllerprototype was implemented in HDL code on a Xilinx Spartan-3A FPGA, with two off-chip, single-channel 10-bit ADCs.The measured converter efficiency is shown in Fig. 12. Apeak efficiency of 91% is achieved for the low-cost powerstage having the specifications listed in Table I. The drivevoltage is generated using auxiliary circuits. In future designs,the entire power stage, controller and auxiliary circuits couldbe integrated on-chip, with the exception of L, Ci and Co.
Obviously, the effects of Fig. 5(b) are only measurableby conducting large field trials with meaningful productionspreads. Preliminary test results for the four-LSO, three-converter system of Fig. 1(b) on a virtually cloud-less day(May 22nd, 2011) are shown in Fig. 13. The mechanicaltracker was aligned to the sun before the start of the testwith MPPT continuously running. The Isc of the four LSOprototypes were found to be within 10% of each other. Themechanical tracker was stopped at t = 0 to observe thepower decline as the sun moves approximately 1o in fiveminutes. Each LSO is affected differently by this gradualmisalignment. The results show a clear trend in power benefits,as well as properly equalized voltages, Vpv(1−4), when theconverters are on. The string power during this time without
Fig. 11. Prototype PCB for each Δ-converter.
Fig. 12. Measured efficiency versus load current, in log scale.
� �� ��� ��� ��� ��� ��� ��� �����
��
��
��
��
��
��
��
��
�
�
�
��
��
��
��
� ������
������ ���������
������� ������ �
���! �"��#������$��%���& '���
(a)
� �� ��� ��� ��� ��� ��� ��� �����
��
��
��
��
��
��
� ������
*����'���*�
"��#������$��%���& '���
+++�*,#���
+++�*,#���
+++�*,#���
+++�*,#���
(b)
Fig. 13. (a) Measured extracted power (normalized), and (b) individualpanel voltages over time, with and without Δ-converters, for a matched 4-LSO string.

� �� ��� ��� ��� ��� ��� ��� ������
���
���
���
�-�
���
��
�
��
��
��
��
� ������
������ ���������
������� ������ �
���! �
"��#������$��%���& '���
(a)
� �� ��� ��� ��� ��� ��� ��� �����
��
��
��
��
��
��
� ������
*����'���*�
"��#������$��%���& '���
+++�*,#���
+++�*,#���
+++�*,#���
(b)
Fig. 14. (a) Measured extracted power (normalized), and (b) individual panelvoltages over time, with and without Δ-converters, for a mismatched 3-LSOstring.
the converters is estimated by extrapolating from the powerreadings during the time when the converters are off, and thepower benefit is computed from the difference between thisestimated power and the measured power obtained with theconverters. The benefits increase with time as the sun movesthroughout the test and reach 20%, despite the relatively lowconverter efficiency. The small mismatches in Vpv(1−4) whilethe converters were running are primarily due to ohmic lossesin the cell-converter interconnections. The same experimentwas repeated with a three-LSO, two-converter system wherethe Isc mismatch between the LSOs was more pronounced(> 20%), and the results are shown in Fig. 14. The powerbenefits seen at the beginning of the experiment are 3–4×larger than that of the four-LSO case due to higher currentmismatch. However, as the cells become more misaligned andconverter currents increase, the rising losses in the convertersbegin to negate the power benefits from the virtual parallelsetup, and the power benefits reach a peak of 31%.
V. CONCLUSIONS
A low-cost distributed power-management scheme for CPVsystems using cell-level dc-dc converters has been demon-strated and verified with experimental results from a matchedfour-cell and a mismatched three-cell system. Furthermore, theeffect of current cascading and limited converter efficiency inthe proposed architecture has been investigated using a flexiblesimulation setup, and it is demonstrated that the Δ-convertersnear the middle of the string are more likely to carry higher
currents. Various experimental measurements with cells havingvarious degrees of mismatch and shading have been used toverify the effectiveness of the proposed scheme under realisticconditions.
REFERENCES
[1] C. Seshan, “CPV: Not just for hot deserts!” in Proc. IEEE PhotovoltaicSpecialists Conference, Jun. 2010, pp. 3075–3080.
[2] R. Sherif, A. Paredes, H. Cotal, and H. Hayden, “A 2-kW concentratingPV array using triple junction cells,” in Proc. IEEE PhotovoltaicSpecialists Conference, May 2002, pp. 1380–1383.
[3] A. W. Bett, B. Burger, F. Dimroth, S. G., and H. Lerchenmuller,“High-concentration PV using III-V solar cells,” in Proc. IEEE WorldConference on Photovoltaic Energy Conversion, vol. 1, May 2006, pp.615–620.
[4] H. Cotal, C. Fetzer, J. Boisvert, G. Kinsey, R. King, P. Hebert, H. Yoon,and N. Karam, “III-V multijunction solar cells for concentratingphotovoltaics,” Energy & Environmental Science, vol. 2, pp. 174–192,2009. [Online]. Available: http://dx.doi.org/10.1039/B809257E
[5] L. Linares, R. W. Erickson, S. MacAlpine, and M. Brandemuehl, “Im-proved energy capture in series string photovoltaics via smart distributedpower electronics,” in Proc. IEEE Applied Power Electronics Conferenceand Exposition, Feb. 2009, pp. 904–910.
[6] G. Walker, J. Xue, and P. Sernia, “PV string per-module maximum powerpoint enabling converters,” in Proc. Australasian Universities PowerEngineering Conference, Sep. 28–Oct. 1 2003.
[7] G. R. Walker and J. C. Pierce, “Photovoltaic DC-DC module integratedconverter for novel cascaded and bypass grid connection topologies –design and optimisation,” in Proc. IEEE Power Electronics SpecialistsConference, Jun. 2006, pp. 1–7.
[8] G. R. Walker and P. C. Sernia, “Cascaded DC-DC converter connectionof photovoltaic modules,” IEEE Transactions on Power Electronics,vol. 19, no. 4, pp. 1130–1139, Jul. 2004.
[9] N. Femia, G. Lisi, G. Petrone, G. Spagnuolo, and M. Vitelli, “Distributedmaximum power point tracking of photovoltaic arrays: Novel approachand system analysis,” IEEE Transactions on Industrial Electronics,vol. 55, no. 7, pp. 2610–2621, Jul. 2008.
[10] E. Roman, R. Alonso, P. Ibanez, S. Elorduizapatarietxe, and D. Goitia,“Intelligent PV module for grid-connected PV systems,” IEEE Trans-actions on Industrial Electronics, vol. 53, no. 4, pp. 1066 –1073, Jun.2006.
[11] “Solar magic,” Solar Magic Datasheet, 2009, availablehttp://www.solarmagic.com/products.
[12] “Solaredge powerbox- module embedded solution,” solaredge datasheet,2010, available http://www.solaredge.com.
[13] S. Poshtkouhi, V. Palaniappan, M. Fard, and O. Trescases, “A generalapproach for quantifying the benefit of distributed power electronics forfine grained mppt in photovoltaic applications using 3D modeling,” IEEETransactions on Power Electronics, vol. PP, no. 99, p. 1, Oct. 2011.
[14] Y. Ota, Y. Sakurada, and K. Nishioka, “Temperature characteristicsanalysis of ingap/ingaas/ge triple-junction solar cell under concentratedlight using spice diode model,” in Proc. IEEE Photovoltaic SpecialistsConference, Jun. 2010, pp. 2093–2096.
[15] M. Villalva, J. Gazoli, and E. Filho, “Comprehensive approach tomodeling and simulation of photovoltaic arrays,” IEEE Transactions onPower Electronics, vol. 24, no. 5, pp. 1198–1208, May 2009.
[16] L. Gao, R. A. Dougal, S. Liu, and A. P. Iotova, “Parallel-connected solarPV system to address partial and rapidly fluctuating shadow conditions,”IEEE Transactions on Industrial Electronics, vol. 56, no. 5, pp. 1548–1556, May 2009.
[17] H. Bergveld, D. Buthker, C. Castello, T. Doorn, A. de Jong, R. van Otten,and K. de Waal, “Module-level DC/DC conversion for photovoltaic sys-tems,” in Proc. International Telecommunications Energy Conference,Oct. 2011, pp. 1–9.
[18] R. Kadri, J.-P. Gaubert, and G. Champenois, “Nondissipative stringcurrent diverter for solving the cascaded dc-dc converter connectionproblem in photovoltaic power generation system,” Power Electronics,IEEE Transactions on, vol. 27, no. 3, pp. 1249 –1258, march 2012.
[19] J. Cao, N. Schofield, and A. Emadi, “Battery balancing methods: Acomprehensive review,” in Proc. IEEE Vehicle Power and PropulsionConference, Sep. 2008, pp. 1–6.