ebooks-islam.fuwafuwa.info Asy-Syuyuti/Asbabun... · ebooks-islam.fuwafuwa.info

Distributed Generationin Liberalised
Electricity Markets
I N T E R N AT I O N A L E N E R GY AG E N C Y

Distributed Generationin Liberalised
Electricity Markets
I N T E R N AT I O N A L E N E R GY AG E N C Y


FOREWORDEarly electric power systems consisted of small generation plants located near consumers. Although most power today is produced in large central generation plants, small-scale “distributed” generation isenjoying a renaissance. Power consumers are using distributed generationtechnologies to ensure very high electrical reliability, to provide capacityin emergencies and, in some cases, to displace costly electricity fromthe grid. Network owners are using distributed generation to deferinvestments in network expansion.
This book provides a guide to energy policy makers on this growingphenomenon. It surveys the status of distributed generation in selectedOECD countries. It looks at the economics of distributed generationversus central generation. It identifies key regulatory barriers. It discussesthe environmental and energy security implications of thesetechnologies.
This book also looks ahead to a future in which a substantial share ofelectricity is produced by distributed generation. Such a future wouldrequire a fundamental redesign of the electricity system. While ouranalysis finds that distributed generation is not yet ready to replaceexisting systems, there are changes to regulations and market rules whichcould ensure that it finds its proper place.
The principal author of this report is Peter Fraser. Shin Morita providedsubstantial assistance on Japan.
Robert PriddleExecutive Director
3
foreword

TABLE OF CONTENTS
EXECUTIVE SUMMARY 7
INTRODUCTION 19
DISTRIBUTED-GENERATION TECHNOLOGIES 25
ECONOMICS OF DISTRIBUTED GENERATION 33
DISTRIBUTED GENERATION IN JAPAN, THE US, THE NETHERLANDS, AND THE UK 53
POLICY ISSUES 72
FUTURE OF DISTRIBUTED GENERATION 97
CONCLUSIONS AND RECOMMENDATIONS 101
ANNEX I 109
Comparing Energy Consumption and Emissions from CHP, and Conventional Heat and Power Generation 109
LIST OF TABLES
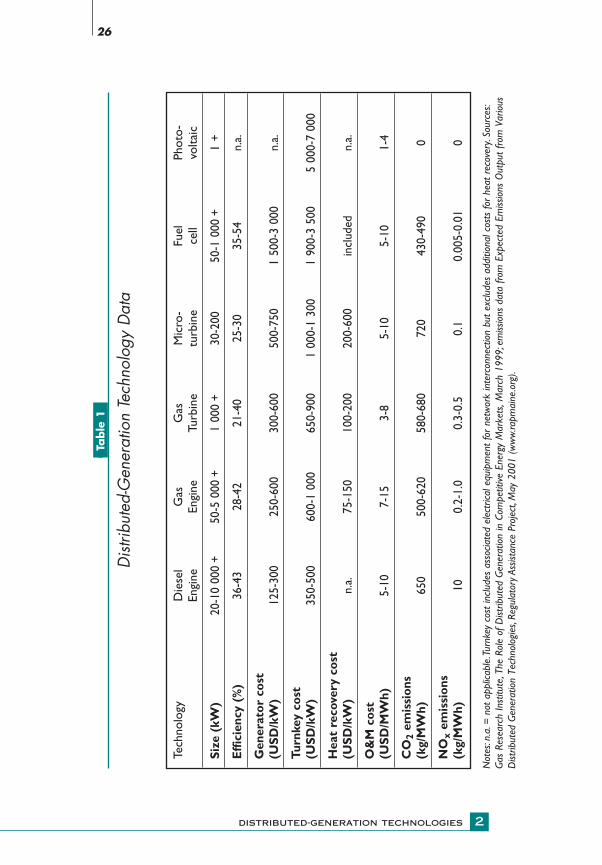
1. Distributed-Generation Technology Data 26
2. Costs of Various Distributed-Generation Technologies 37
3. Capital Costs and Efficiencies of CHP Technologies 42
7
6
5
4
3
2
1
5
table of contents

4. European Union CHP 1998 44
5. Cost of a One-Hour Power Outage for Different USBusinesses 49
6. Economics of Gas CHP in Japan 54
7. Cogeneration System Capacity (in MW) by Sector and Generator Type 55
8. Comparison of Distributed-Generation Issues in Japan, the US, the Netherlands, and the UK 71
9. Estimates of “Embedded Benefit” to UK DistributedGenerators (USD per MWh) 79
10. New South Wales (Australia) Distribution Loss Factors 85
11. Japanese NOx Limits on Cogeneration Systems 89
11. Examples of NOx Limits in the US Applicable toDistributed Generation (in kg/MWh) 90
LIST OF FIGURES
1. Distributed Generation in an Electricity Network 21
2. Orders for Engines and Turbines, 1-30 MW, for Peaking or Continuous Use, 1998/99 – 2000/01 31
3. Ratio of Industrial Fuel to Electricity Prices in Selected Countries 34
4. Ratio of Household Fuel to Electricity Prices in Selected Countries 35
5. Comparison of PV Costs/Output to Household Electricity Rates in Selected OECD Countries 38
6. NOx Emissions from Distributed-Generation Technologies (kg per MWh) 88
7. CO2 Emissions from Distributed-Generation Technologies (kg per MWh) 91
6
table of contents ===

EXECUTIVE SUMMARY
Most of the electricity produced in the OECD is generated in largegenerating stations. These stations produce and transmit electricitythrough high-voltage transmission systems then, at reduced voltage,transmit it through local distribution systems to consumers. Someelectricity is produced by distributed-generation (DG) plants. Incontrast with large generating stations, they produce power on acustomer’s site or at a local distribution utility, and supply powerdirectly to the local distribution network. DG technologies includeengines, small turbines, fuel cells, and photovoltaic systems.
Although they represent a small share of the electricity market,distributed-generation technologies already play a key role: forapplications in which reliability is crucial, as a source of emergencycapacity, and as an alternative to expansion of a local network. In somemarkets, they are actually displacing more costly grid electricity.Worldwide, more DG capacity was ordered in 2000 than for newnuclear power. Government policies favouring combined heat andpower (CHP) generation, and renewable energy and technologicaldevelopment should assure growth of distributed generation. Thiskind of generation has the potential to alter fundamentally thestructure and organisation of our electric power system.Yet marketconditions in some countries pose serious challenges to somegenerators, particularly those producing combined heat and power.
This book provides a guide to this growing phenomenon by:
■ surveying the current situation and market status of distributedgeneration in selected OECD countries, including the impact ofcurrent energy policies;
■ examining the economic, environmental, and energy-securityimplications of wider deployment of various DG technologies as wellas the consequences for electricity transmission and distribution; and
■ making general recommendations for accommodating distributedgeneration into liberalised electricity markets.
7
executive summary1

Distributed-generation Technologies
Diesel and gas reciprocating engines and gas turbines are well-established technologies. Industrial-sized engines and turbines canachieve fuel efficiencies in excess of 40% and are low in cost perkilowatt.These big engines and turbines accounted for most new DGcapacity installed in the year 2000, of approximately 20 GW or 10% oftotal new electricity capacity. While nearly half of the capacity wasordered for standby use, the demand for units for continuous orpeaking use has been increasing.
Other DG technologies have yet to make a large commercial impact.Microturbines are a new technology.They have lower emissions thanengines, but their capital cost is higher.Their fuel economy is similar tothat of natural gas engines. Fuel cells are the object of much researchand development, primarily for transportation applications.They havebeen deployed for power generation in a limited way, but their capitalcosts will need to drop sharply to be competitive. The cost ofphotovoltaic systems, while still high, is expected to go on falling overthe next decade.
Economics of Distributed Generation
Distributed generation has some economic advantages over powerfrom the grid, particularly for on-site power production:
■ On-site production avoids transmission and distribution costs,which otherwise amount to about 30% of the cost of deliveredelectricity.■ Onsite power production by fossil fuels generates waste heat thatcan be used by the customer.■ Distributed generation may also be better positioned to useinexpensive fuels such as landfill gas.
On the other hand, DG has higher unit capital costs per kilowatt thana large plant. It has lower fuel economy, unless used in CHP mode, anduses a more limited selection of fuels. For photovoltaic systems,operating costs are very low but high capital costs make ituncompetitive.
8
executive summary ===
The relative price of retail electricity compared with fuel costs iscritical to the competitiveness of any distributed-generation option.This ratio varies greatly from country to country. In Japan, for example,where electricity and natural gas prices are high, DG is attractive onlyfor oil-fired generation. In other countries, where gas is inexpensivecompared with electricity, distributed generation with gas can becomeeconomically attractive.
Conventional economic assessments of generating options tend tounderstate the value of the flexibility of a distributed generation plantto its owner. Many DG technologies can be very flexible in theiroperation, size, and expandability. A distributed generation plant canoperate during periods of high electricity prices (peak periods) andthen switch off during periods of low prices.The ease of installation ofDG allows capacity to be expanded readily to take advantage ofanticipated high prices. Some DG assets are portable.They can literally“follow the market”. New analytical techniques, such as “real optionvaluation”, can quantify the economic value of flexibility.
In addition to this technological flexibility, a distributed generator mayadd value to some power systems by delaying the need to upgrade acongested transmission or distribution network, by reducingdistribution losses, and by providing support or ancillary services tothe local distribution network.
CHP is economically attractive for distributed generation because ofits higher fuel efficiency and low incremental capital costs for heat-recovery equipment.The size of the CHP system matters: the mosteconomical match the heat load. Economies of scale also matter.More than 80% of CHP capacity is in large industrial applications,mostly in four industries: paper, chemicals, petroleum refining, and food processing. Even so, much of the CHP capacity in the OECD has been developed as a consequence of supportive governmentpolicies.Such policies have also encouraged systems to produce powerfor export to the grid.
CHP for domestic use, called “micro-CHP”, is attracting much interest,particularly where it uses external combustion engines and in some
9
executive summary

cases fuel cells. Despite the potential for a short payback period, highcapital costs for the domestic consumer are a barrier to thepenetration of these two technologies.
The provision of reliable power represents the most important marketniche for DG. Emergency diesel generating capacity in buildings isgenerally not built to export power to the grid. If it could be exported,it would represent several percent of total peak demand for electricity.The existence of this neglected source of potential grid power isgaining increased attention, particularly in the United States, wheredemand growth has led to tighter capacity margins. In the summer of2001, system operators in New Mexico and Oregon arranged for theuse of existing standby generators to supply additional power to thegrid under emergency conditions.
In addition to improving the reliability of grid electricity, DG can servegrowing consumer demand for higher quality electricity. Electricityconsumers who require higher electric reliability than the grid cannormally provide, i.e. in continuous manufacturing processes orInternet services, are looking to distributed generation to assure acontinuous supply of power. Two DG technologies are potentiallysuperior in this regard:
■ fuel cells, and
■ backup systems comprising gas engines combined withuninterrupted power supplies (such as flywheels), which recently havebeen commercialised.
While this kind of capacity will contribute only a very small part ofoverall electricity production, it is likely to become an increasinglyimportant source of peak supply and a bigger factor in electricity-supply security.
10
executive summary ===

DG can also have economic applications to meet off-grid needs, suchas in communities remote from the main grid. Photovoltaic systemscombined with battery storage, for example, can be the mosteconomical method of powering remote lighting, telephone, and otherlow capacity applications.
Distributed Generation in Japan, the US, the Netherlands, and the UK
The status of distributed generation differs in each OECD country.While economics is certainly a fundamental factor, government policyalso affects the role of distributed generation. This report examinesthese and other influences on the development of distributedgeneration in Japan, the US, the Netherlands, and the UK.
Distributed generation is a viable option in Japan because of high pricesand limited market opening for electricity.There are three commontypes of DG in the country:oil-fired generation, designed principally tomeet peak demand; oil-fired CHP using diesel engines and steamturbines; and gas-fired CHP with engines, gas or steam turbines.Thehigh retail price of natural gas in Japan makes gas-fired distributedgeneration without CHP uneconomical. Gas-fired CHP is onlymarginally economical but is the only DG option in Tokyo,Yokohama,and Osaka, due to tight environmental regulations. A survey by theJapan Engine Generator Association (NEGA) estimates that from 1997to 2000, installation of distributed generation, excluding emergencypower, grew by 2 418 MW, or about 11% of the amount installed bythe utilities during the period. Distributed generation is recognised asa business opportunity for the utilities. Eight of the ten electric utilitiesin Japan have established subsidiaries to offer DG services.
Japan has removed several regulatory barriers to encourage thedevelopment of distributed generation and, in particular, cogenerationsystems.These actions include adjustments to fire regulations and on-site staffing requirements. However, some regulatory barriers stillremain. Selling excess distributed generation to another electricity
11
executive summary

customer generally is not allowed.The costs of electrical protectionequipment can be substantial: about 10% of the total cost of the facilityor more.
Distributed generation in the US is limited by low electricity prices andaffected by the widely varied pace of electricity-market liberalisation inthe 50 states. CHP accounts for 50.4 GW, or about 6% of total USelectrical generating capacity, nearly all in large industrial plants.Emergency power generators in buildings have been identified as apotential source of emergency capacity for the grid. A detailed surveyof standby generators in California by the California EnergyCommission found 3.2 GW of such capacity, equivalent to more than6% of peak electricity demand in the state1.
Aside from economic competitiveness, there are several challenges tothe growth of distributed generation in the US. Obtaining a permit fora site is difficult and expensive on a per-kilowatt basis.The lack of anational standard for interconnection further increases transactioncosts, even though such a standard is now under development.Incomplete regulatory reform has left distribution utilities competingwith distributed generation. Environmental standards have beentoughened in some states, with the same standard applied regardlessof the size of the generator.This approach effectively limits fossil-firedDG in these states.
The Netherlands has an advanced liberalised market where distributedgeneration is well-established, principally because government policieshave supported CHP and renewable energy sources. But the generalpolicy thrust in Holland is to avoid using favourable grid policies ortariffs to subsidise the development of these technologies, and to relyinstead on other methods.The substantial Dutch experience with DGhas had some important advantages. Unlike the situation in the US,interconnection rules in the Netherlands are standardised. Marketrules were adjusted soon after their introduction so that CHPproducers could more accurately predict how much electricity to
12
executive summary ===
1. CEC, 2001.
supply to the grid. Power parks have been established where the mainproducer is the only customer with a direct connection to the grid.ButCHP producers still faced difficulties because of rising gas prices andfalling electricity prices.To help them cope, the Dutch government hasincreased direct subsidies to producers and has encourageddistribution companies to ensure that the network value of distributedgeneration is appropriately reflected in tariffs.
The United Kingdom, which also has an advanced liberalised market,has policies that favour development of CHP and renewables as well.The government has set targets for increasing the contributions ofrenewables, from around 2% in 2000 to 10% by 2010, and CHP, from4.6 GW to 10 GW by 2010.The government has also identified thedevelopment of embedded generation as an important way to increasecompetition among electricity producers.
New electricity trading rules, known as the New Electricity TradingArrangements (NETA), nonetheless have been disadvantageous tosmall embedded generators. The rules require that all generatorspredict their output at least 3.5 hours in advance of actual production;they face penalties if they produce less than forecast but receive onlymodest remuneration for supplying more. So far NETA has resulted ina drop in electricity prices and a decline in power produced for thegrid by embedded generators.
In anticipation of these problems, the UK government commissionedan Embedded Generation Working Group to examine the role of DGin the liberalised market.The group’s report, issued in January 2001,identified a number of practical measures to ensure DG is integratedinto the power system in an economically efficient way. Thegovernment and the regulator (Ofgem) have both acted on thereport’s recommendations by:
■ proposing new principles for setting tariffs and simpler rules for gridconnection;
■ requiring distributors to provide additional information on the valueof distributed generation at different points in their grid; and
■ establishing a Distributed Generation Co-ordinating Group tofollow up on the Working Group’s recommendations.
13
executive summary
Policy Issues
Policy issues affecting distributed generation can be grouped under the three Es of energy policy: economic efficiency, environmentalprotection, and energy security. Under the heading of economicefficiency, issues include:
■ market access, i.e. the connection of distributed generation todistribution grids and to distribution networks;■ pricing, i.e. incorporating the benefits and costs of distributed powerin distribution-network tariffs; and ■ market conditions.
In the area of environment, the report considers the emissionsperformance of different DG technologies and whether environmentalregulations could limit the deployment of DG.As for energy security,the report examines the implications of distributed generation for thediversification of fuels and on the reliability of the electricity network.
■ Economic Efficiency
Connecting distributed generation to the distribution grid can impairthe performance and reliability of the local grid, which is normallydesigned to deliver power to end users. Connection thus creates atechnical problem, particularly without standard rules.
Costs incurred by the local grid operator to connect DG can besubstantial, especially if the distribution system must be reinforced.These costs need to be recovered from either the DG producer orpower consumers.The principle of economic efficiency suggests thatthe producer should pay all of the costs of upgrading the distributionsystem. However, large central generators, which compete with DGproducers, do not have to pay for transmission-system upgrades.Under these circumstances, the only fair solution is for DG plantowners to pay direct connection costs and for all users to pay theremainder in the form of operating charges.
In Western Europe, market liberalisation has negatively affecteddistributed generation, particularly on CHP, mainly because natural gas
14
executive summary ===

prices have risen as electricity prices have fallen. In response,governments in some countries have increased their financial supportto CHP producers. Yet market liberalisation is exposing all powerproducers to the vagaries of the marketplace.DG producers, like otherproducers, have to respond. In the long run, the current challenges bythemselves may encourage more efficient and less expensivedevelopment of DG.
Liberalisation of the electricity market, in fact, is not broad enough.Prices are not sensitive to location, a key value of distributedgeneration. For example, electricity distribution losses vary from lessthan 1% to 20% or more depending on the voltage and the location ofthe consumer. Location also plays a role in the value of distributedgeneration in deferring expansion of transmission infrastructure,providing ancillary services or relieving distribution congestion.Whileretail liberalisation may be a necessary condition for the DGdevelopment, it is not sufficient to ensure nondiscriminatory access.Utilities that own generating capacity or supply customers directly willcontinue to have an incentive to discriminate against DG.To avoid suchdiscrimination, regulatory vigilance will be needed.
In certain markets where they can avoid charges on transmission,distributed generators may have an advantage over central generation.Elsewhere, in wholesale markets that are designed with large centralgeneration in mind, smaller distributed generators may be at adisadvantage because of the additional costs and complexities ofdealing with the market.Difficulties in the NETA market in the UK andin the new Dutch market suggest that further market measures areneeded to make the system fair to smaller generators.
Pricing reforms that accompany market liberalisation can benefitdistributed generation.These reforms will raise the price of electricityduring peak periods and thus make distributed generation moreeconomical. The application of time-of-use rates in Japan is creditedwith the installation of cogeneration systems that operate only duringpeak hours.
15
executive summary

■ Environmental Protection
Distributed generation embraces a wide range of technologies with awide range of emissions. For fossil-fired distributed technologies, thereare two key areas of concern: NOx emissions on local/regional airquality and greenhouse-gas emissions on climate change.
Emissions per kilowatt-hour of NOx from distributed generation(except by diesel generators) tend to be lower than those from a coal-fired power plant or a utility system using a large proportion of coal.At the same time, the emissions rate from existing distributedgeneration (except by fuel cells and PV) are higher than the “bestavailable” central generation: a combined-cycle gas turbine withadvanced emissions control.This disadvantage puts a serious limitationon distributed generation in areas where NOx emissions arerigorously controlled, even when DG could reduce overall emissionssharply.
The case of carbon-dioxide emissions is similar. Emissions rates fordistributed generation are generally lower than those for coal plants,but not as low as those for new combined cycles – except for DG usedin CHP mode. Measures can be designed that encourage distributedgenerators to reduce emissions.The use of economic instruments likecarbon-emissions trading, for example, would give DG operators anincentive to design and operate their facilities in ways that minimiseemissions of greenhouse gases.
■ Energy Security
The implications of distributed generation for energy security take twoforms:
■ on the diversification of primary energy supplies; and
■ on the reliability of electricity supply.
The effect on primary fuels depends on the underlying technology.Photovoltaic systems help diversify supply away from fossil fuels. Mostof the other technologies rely directly or indirectly on natural gas.Sincemuch of the new investment in DG is for natural gas, the effect on fuel
16
executive summary ===

diversity in the power system is limited.The exception is CHP, as itshigher fuel efficiency (compared with separate heat and powerfacilities) means lower fuel consumption and thus enhanced energysecurity.
The reliability of electric power systems can be enhanced bydistributed generation.The availability of standby generators in the USelectricity market in the summer of 2001 helped reduce the risk ofblackouts. Better integration of standby resources into the systemwould further enhance security of supply. Furthermore, the use ofdistributed generators at selected locations helps distributorsovercome local bottlenecks. Increasing distributed generation couldreduce the demand for transmission, thereby increasing margins ontransmission lines.Ultimately, a power system based on a large numberof reliable small generators can operate with the same reliability and a lower capacity margin than a system of equally reliable largegenerators.
The main drawback of distributed generation for energy securitywould be a weakening of the network’s ability to supply primaryreserve power if DG cannot respond to load changes.This would bethe case if most DG capacity is nondispatchable because of naturalvariability (wind and photovoltaic systems) or operating variability(CHP where power output is tied to heat demand).The operators ofthe Nordel system have identified the expansion of wind and CHP asa reliability concern and are studying how best to address it.They havesuggested that the operational control of the network may need to bedecentralised by creating a system operator for each Nordel subarea.
Future of Distributed Generation in Electricity Networks
The wide range of potential applications and favourable governmentpolicies for CHP and for renewables should ensure greater marketshare for distributed generation over the next decade. But furtherresearch and development is needed to reduce costs and improveenvironmental performance. Substantial R&D money is already being
17
executive summary

directed to fuel cells and photovoltaic systems. Investments are alsoneeded to reduce the capital costs and improve the efficiency ofmicroturbines. Improvements in the environmental performance ofengines and small turbines also will be needed, to ensure that theirNOx emissions do not preclude deployment. Further developments incombining DG with cooling or with uninterrupted-power supplytechnologies would enhance its attractiveness.
Despite the limited penetration of distributed power in today’smarkets, the future will probably see an evolution to a much moredecentralised power system.Such a system could have advantages withrespect to security and reliability of supply. It could emerge from thepresent system in three stages:
■ accommodation of distributed generation in the current system;
■ the creation of decentralised network system that works in tandemwith a centralised generation system; and
■ a dispersed system where most power is generated bydecentralised stations and a limited amount by central generation.
There are a few signs that electricity networks are beginning thisevolution. For example, new technologies are already being used tocontrol output from distributed generation at several sites to respondto market conditions, creating a kind of “virtual utility”.The operationof a network with a large number of virtual utilities will require muchgreater real-time information flow than is now the case. For thepresent, however, there is a need to redesign distribution systemssimply to accommodate DG.
18
executive summary ===

Many terms have emerged to describe power that comes elsewhere thanfrom large generating units exporting electricity into a high voltagenetwork. Because there are no universally accepted terms, this report usesthe following ones:
Distributed generation is generating plant serving a customer on-siteor providing support to a distribution network, connected to the grid atdistribution-level voltages.The technologies generally include engines, small(and micro) turbines, fuel cells, and photovoltaic systems. It generallyexcludes wind power, since that is mostly produced on wind farms ratherthan for on-site power requirements.
Dispersed generation is distributed generation plus wind power andother generation, either connected to a distribution network or completelyindependent of the grid.
INTRODUCTION
Electric power systems in OECD countries are organised to supplyelectricity mainly through the co-ordinated operation of largegenerating stations that produce and transmit electricity through high-voltage transmission systems then, at reduced voltage, send the powerthrough local distribution systems to consumers. Some electricity isproduced by distributed generation (DG) plants.They differ from thelarge generating stations in producing power on a customer’s sitewhere some or all is consumed and in sending any surplus powerdirectly to the local distribution network. Distributed generation canalso be used by a distributor to deliver additional power to the localdistribution network. Figure 1 illustrates where DG and energy-storage technologies fit into an electricity network.
What is Distributed Generation?
19
introduction1

20
introduction === 1
Distributed power is distributed generation plus energy-storagetechnologies such as flywheels, large regenerative fuel cells, or compressedair storage.
Distributed energy resources refer to distributed generation plusdemand-side measures.
Decentralised power refers to a system of distributed-energy resourcesconnected to a distribution network.
The importance of distributed generation varies by country. In theNetherlands, about half of total electricity generation is from largeCHP plants supplying electricity to local distribution networks. In manyother countries, however, most DG is used on-site; little or no poweris made available to the local network.Most DG capacity in the OECDis provided by diesel engines for emergency power, not powerproduction.
Distributed generation is attracting increasing interest and policyattention. There are five major factors behind this trend: electricitymarket liberalisation, developments in DG technology, constraints onthe construction of new transmission lines, increased customerdemand for highly reliable electricity, and concerns about climatechange. Government policies in several OECD countries already aimto increase the role of CHP in electricity production.
Distributed generation, through CHP plants or by renewable sources,also could have an important role in improving energy efficiency andreducing greenhouse-gas emissions. Various estimates suggest thatCHP can reduce greenhouse-gas emissions from power generationand associated generation by 20%-30% compared with separate fossil-fired power and heating systems. Supplying power directly toconsumers also avoids transmission and distribution losses, whichaverage 6.8% in the OECD, further increasing efficiency compared withcentral generation.

21
introduction1
Figure
1
Dis
tribu
ted
Gen
erat
ion
in a
n El
ectri
city
Net
wor
k
= D
istr
ibut
ed G
ener
atio
n
DIS
TRIB
UTE
D G
ENER
ATI
ON
DIS
TRIB
UTE
DG
ENER
ATI
ON
Dis
trib
utio
nSu
bsta
tion
Fuel
Cel
l
Gas
Tur
bine
Phot
oVo
ltaic
sFu
elC
ells
Reci
pEn
gine
Reci
pEn
gine
Cen
tral
Pla
ntSt
ep-U
pTr
ansf
orm
erTr
ansm
issi
onSy
stem
Mic
roTu
rbin
e

Distributed generation is also a possible solution to constraints on theconstruction of new transmission lines.The rate of transmission-lineconstruction has slowed in a number of OECD countries2.Although market liberalisation is increasing interest in expandingtransmission interconnections, the ability to do so has been limited forenvironmental reasons. Growth in regional electricity demand mightbe met more easily by increases in distributed generation.
Electricity-market liberalisation is affecting distributed generation intwo ways. New suppliers are identifying substantial niche marketswhere DG can be profitably deployed, such as enhancing reliability,peak clipping, and combined power and heating or cooling. Liberalisedmarkets also put a premium on flexibility, an area where DGtechnologies, with their comparatively small size and short lead times,have a substantial advantage over large central plants.
Substantial technical advances are also increasing interest in distributedgeneration. New DG technologies, such as microturbines, are beingintroduced, while older technologies, such as reciprocating engines,have been improved.Fuel cells,which are being developed primarily fortransportation applications, are a potential technology for the future.
Distributed generation has also faced difficulties in some countries asa result of liberalisation. In 2000, the European CHP association,CogenEurope,published a report arguing that with the fall in electricity pricessince market opening, CHP was at risk from “unfettered marketliberalisation without regard to other policy objectives”3. Newelectricity-market arrangements in the UK have also been criticised forhampering distributed generators.
Investors in distributed generation face several regulatory barriers tothe development and operation of DG. These include oneroustechnical requirements for interconnection, high charges for backuppower and other ancillary services, and difficulties in obtaining sitingpermits, since some regulations do not take into account the relativelysmall scale of DG technologies.
22
introduction === 1
2. IEA, 2002.3. Cogen Europe, 2000.

Many OECD governments and regulators are studying these issues.The key remaining challenge is designing a framework that fully reflectsthe costs and benefits of DG to the economy,environment and energysecurity.The wide diversity of DG technologies makes it impossible togeneralise about these costs and benefits.
Over the longer term, improved technologies or continued favourablegovernment policies could ensure more widespread use of distributedgeneration. But distributed generation has been described as a“disruptive technology” that could fundamentally alter the organisationof the electricity-supply industry4.The arrival of DG on a large scalecould herald a third generation of power sector reform5. The firstgeneration of reform created independent power producers sellingpower to utilities,and the second created wholesale and retail markets.The third generation would provide for the widespread deployment ofpower generation directly at the sites of customers. As a result,electricity networks would operate in a much more decentralisedmanner. More power would be generated and managed by the systemoperator at low voltages. In such a system, the high-voltage networkwould backup the local decentralised systems. This decentralisednetwork design would, however, require profound changes in the waythe electricity networks are organised, constructed, and operated.
This study has three main objectives:
■ Survey the economic and regulatory status of distributed generationin selected OECD countries.
■ Examine the implications of wider deployment of various DGtechnologies on the market, environment, and energy security, as wellas on the operation of electricity transmission and distributionnetworks.
■ Make general recommendations on accommodating distributedgeneration in liberalised electricity markets..
23
introduction1
4. Dunn, S. 2000.5. See, for example, Lonnroth, M. 1989


DISTRIBUTED-GENERATIONTECHNOLOGIES
This chapter discusses the principal distributed-generationtechnologies in use in the OECD today. Diesel or gas reciprocatingengines and gas turbines make up most of the capacity being installed.At the same time that new DG technologies such as microturbines arebeing introduced, older technologies such as reciprocating engineshave been improved. Fuel cells are seen as a potential technology forthe future. The costs of photovoltaic systems, while still high, areexpected to continue falling over the next decade. Table 1 lists thevarious distributed-generation technologies and their estimated costs.
Reciprocating Engines
Reciprocating engines are the most common technology used fordistributed generation.They are a proven technology with low capitalcost, large size range, fast start-up capability, relatively high electricconversion efficiency (up to 43% for large diesel systems), and goodoperating reliability.These characteristics, combined with the engines’ability to start up during a power outage, make them the main choicefor emergency or standby power supplies.They are by far the mostcommonly used power generation equipment under 1 MW.
Two types of engines are used. Gas-powered engines are mainlyoperated with natural gas, although biogas or landfill gas can also beused. Diesel engines can use diesel fuel, but can also be operated onother petroleum products such as heavy fuel oil or biodiesel.
An annual worldwide survey of orders for power-generating enginesindicates that 16.2 GW of reciprocating engines (1-30 MW) wereordered from June 2000 to May 2001. Approximately 80% of theorders came from OECD countries. Most of them used oil fuel.Approximately half of total capacity was for emergency or standbyservice6.
25
distributed-generation technologies2
6. See DTGW, 2001.
26
distributed-generation technologies === 2
0Ta
ble
10
Dis
tribu
ted-
Gen
erat
ion
Tech
nolo
gy D
ata
Not
es:n
.a.=
not
app
licab
le.T
urnk
ey c
ost
incl
udes
ass
ocia
ted
elec
trica
l equ
ipm
ent
for
netw
ork
inte
rcon
nect
ion
but
excl
udes
add
ition
al c
osts
for
heat
rec
over
y.So
urce
s:G
as R
esea
rch
Inst
itute
,The
Rol
e of
Dist
ribut
ed G
ener
atio
n in
Com
petit
ive E
nerg
y M
arke
ts, M
arch
199
9;em
issio
ns d
ata
from
Exp
ecte
d Em
issio
ns O
utpu
t fr
om V
ario
usD
istrib
uted
Gen
erat
ion
Tech
nolo
gies
,Reg
ulat
ory
Assis
tanc
e Pr
ojec
t,M
ay 2
001
(ww
w.ra
pmai
ne.o
rg).
Tech
nolo
gyD
iese
lG
asG
asM
icro
-Fu
elPh
oto-
Engi
neEn
gine
Turb
ine
turb
ine
cell
volta
ic
Size
(kW
)20
-10
000
+50
-5 0
00+
1 00
0+
30-2
0050
-1 0
00+
1 +
Effi
cien
cy (
%)
36-4
3 28
-42
21-4
025
-30
35-5
4n.
a.
Gen
erat
or c
ost
(USD
/kW
)12
5-30
025
0-60
030
0-60
050
0-75
01
500-
3 00
0n.
a.
Turn
key
cost
(USD
/kW
)35
0-50
060
0-1
000
650-
900
1 00
0-1
300
1 90
0-3
500
5 00
0-7
000
Hea
t re
cove
ry c
ost
(USD
/kW
)n.
a.75
-150
100-
200
200-
600
incl
uded
n.a.
O&
M c
ost
(USD
/MW
h)5-
107-
153-
85-
105-
101-
4
CO
2em
issi
ons
(kg/
MW
h)65
050
0-62
058
0-68
072
043
0-49
00
NO
xem
issi
ons
(kg/
MW
h)10
0.2-
1.0
0.3-
0.5
0.1
0.00
5-0.
010

The main drawbacks of reciprocating engines are noise, costlymaintenance and high emissions, particularly of nitrogen oxides.Theseemissions can be reduced, with a loss of efficiency, by changingcombustion characteristics. Catalytic converters are a provenemissions-control technology. Larger systems can use selectivecatalytic reduction (SCR) to reduce emissions. Particulate emissioncontrol is usually necessary with diesel engines.
Gas Turbines
Originally developed for jet engines, gas turbines of all sizes are nowwidely used in the power industry. Small industrial gas turbines of 1-20 MW are commonly used in CHP applications.They are particularlyuseful when higher temperature steam is required than can beproduced by a reciprocating engine.The maintenance cost is slightlylower than for reciprocating engines,but so is the electrical conversionefficiency.
In the annual power-generation survey referred to above, gas turbinesunder 30 MW accounted for 4.3 GW of capacity ordered worldwide,with the majority coming from OECD countries.
Gas turbines can be noisy. Emissions are somewhat lower than forengines, and cost-effective NOx emissions-control technology iscommercially available.
Microturbines
Microturbines extend gas-turbine technology to smaller scales. Thetechnology was originally developed for transportation applications,but is now finding a niche in power generation. One of the moststriking technical characteristics of microturbines is their extremelyhigh rotational speed.The turbine rotates up to 120 000 rpm and thegenerator up to 40 000 rpm. Individual units range from 30-200 kWbut can be combined readily into systems of multiple units. Lowcombustion temperatures can assure very low NOx emissions levels.They make much less noise than an engine of comparable size.Natural
27
distributed-generation technologies2

gas is expected to be the most common fuel, but flare gas, landfill gas,or biogas can also be used.
The main disadvantages of microturbines at this stage are its shorttrack record and high costs compared with gas engines. Thetechnology has been commercialised only recently and is offered by asmall number of suppliers. Recent rises in natural gas prices anddecreases in electricity prices have shifted marketing of these products“from a global market to niche applications”7 such as burning flare gasat remote locations or landfill sites8. Significant cost reductions arelikely to be made as manufacturing volume increases.
Fuel Cells
Fuel cells are compact, quiet power generators that use hydrogen andoxygen to make electricity. The transportation sector is the majorpotential market for fuel cells, and car manufacturers are makingsubstantial investments in research and development. Powergeneration, however, is seen as a market in which fuel cells could becommercialised much more quickly.
Fuel cells can convert fuels to electricity at very high efficiencies(35%-60%), compared with conventional technologies. Theirefficiency limits the emissions of greenhouse gases. As there is nocombustion, other noxious emissions are low. Fuel cells can operatewith very high reliability and so could supplement or replace grid-based electricity.
Only one fuel-cell technology for power plants, a phosphoric acid fuel-cell plant (PAFC), is currently commercially available.This plant has anoutput of 200 kW with a conversion efficiency of approximately 37%.Capital costs are approximately USD4 500 per kW, according to themanufacturer9. Over 200 have been ordered, for total worldwideinstalled capacity of over 40 MW.
28
distributed-generation technologies === 2
7. Courcelle, B. 2001.8. Gillette, S. 2001.9. www.internationalfuelcells.com

Three other types of fuel cells, molten carbonate (MCFC), proton-exchange membrane (PEMFC)10,and solid oxide (SOFC),are the focusof intensive research and development. The PEMFC is a low-temperature fuel cell and currently the leading choice fortransportation applications.The PEMFC is also being tested for powergeneration.An early field-trial plant of approximately 200 kW yieldedconversion efficiencies of approximately 34%. The MCFC is a high-temperature fuel cell with efficiencies estimated at 50-55%. It isexpected that the MCFC will prove to be more economical in sizesabove 1 MW.The SOFC is also a high-temperature fuel cell with similarefficiencies. Several companies plan to commercialise a household-sizefuel cell (with a capacity of a few kW) in the next few years.
Fuel cells require a source of hydrogen as fuel.Most fuel cells currentlyunder development plan to use hydrogen “reformed” (derived from)from natural gas, although in the future other sources of hydrogencould be used. The reformation process does produce limitedemissions of NOx and of carbon dioxide.
Photovoltaic Systems
Unlike the other DG technologies discussed above, photovoltaicsystems are a capital-intensive, renewable technology with very lowoperating costs.They generate no heat and are inherently small-scale.These characteristics suggest that PV systems are best suited tohousehold or small commercial applications, where power prices onthe grid are highest.
According to the IEA’s Photovoltaic Power Systems Programme, theinstallation cost of a basic photovoltaic system ranges from USD5 000to USD7 000 per peak kW11. Operating costs are very low, as thereare no fuelling costs. However, capacity factors are also low, rangingfrom 10% Germany to 22% in California.Although PV operates duringdaylight hours when demand (and generally prices) for power arehigher, changing weather conditions affect its output.
29
distributed-generation technologies2
10. Sometimes referred to as a solid polymer fuel cell (SPFC).11. Bulk purchases of PV systems for grid use can reduce these costs.

Photovoltaic technology has a wide range of applications.About half ofthe existing PV systems in the OECD are off-grid. Stand-alonephotovoltaic systems can be less expensive than extending powerlines. Most of the currently profitable applications are remotetelecommunications systems, where reliability and low maintenanceare the principal requirements. PV systems also are widely used indeveloping countries, serving rural populations that have no otheraccess to basic energy services. PV systems can be used to provideelectricity for a variety of applications in households, communitylighting, small businesses, agriculture, healthcare, and water supply.
The other half of existing PV capacity is on-grid, mostly as distributedgeneration. Most on-grid PV installations to date have enjoyed verylarge investment subsidies or favourable prices for the electricity theygenerate.The economic viability of PV systems is much higher whenthey can displace an extension to a distribution line.
Wind
Wind generation is rapidly growing in importance as a share ofworldwide electricity supply.About 4.2 GW of capacity was installedduring the year 200012.Wind power is sometimes considered to bedistributed generation, because the size and location of some windfarms makes it suitable for connection at distribution voltages.However, investments in wind power today are increasingly made inlarge wind farms by generating companies rather than by individualpower consumers. In this sense, wind power is more like centralgeneration than distributed generation as discussed above. Wind is not considered as distributed generation for the purposes of thisreport.
The variability of wind-farm output is, however, an issue that hasbecome relevant to the operation of transmission and distributionnetworks. Market liberalisation has drawn attention to the costsimposed by this variability on power systems and the charges imposedon wind producers as a result.
30
distributed-generation technologies === 2
12. IEA Wind, 2001.
Impact on the Market for GeneratingEquipment
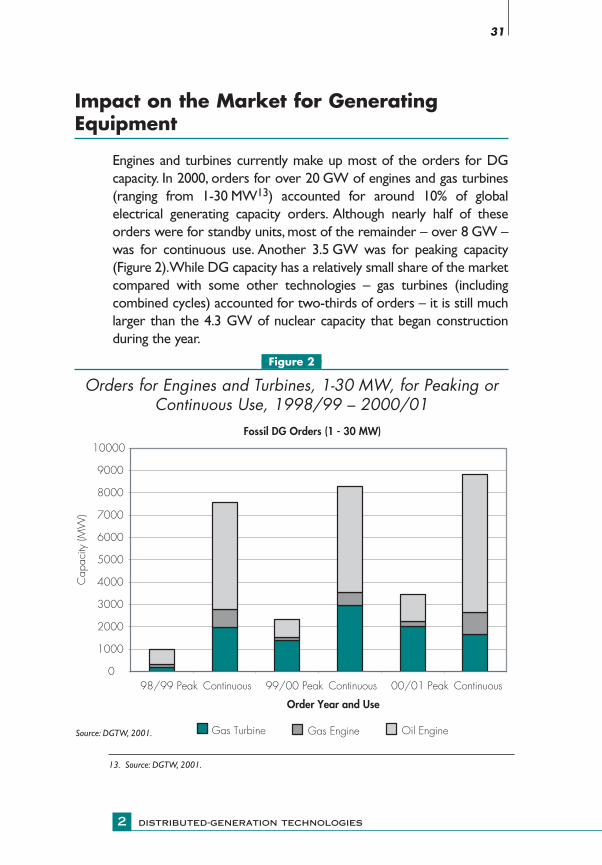
Engines and turbines currently make up most of the orders for DGcapacity. In 2000, orders for over 20 GW of engines and gas turbines(ranging from 1-30 MW13) accounted for around 10% of globalelectrical generating capacity orders. Although nearly half of theseorders were for standby units, most of the remainder – over 8 GW –was for continuous use. Another 3.5 GW was for peaking capacity(Figure 2).While DG capacity has a relatively small share of the marketcompared with some other technologies – gas turbines (includingcombined cycles) accounted for two-thirds of orders – it is still muchlarger than the 4.3 GW of nuclear capacity that began constructionduring the year.
0Figure 20
Orders for Engines and Turbines, 1-30 MW, for Peaking orContinuous Use, 1998/99 – 2000/01
31
distributed-generation technologies2
13. Source: DGTW, 2001.
Fossil DG Orders (1 - 30 MW)
0
1000
2000
3000
4000
5000
6000
7000
8000
9000
10000
98/99 Peak Continuous 99/00 Peak Continuous 00/01 Peak Continuous
Order Year and Use
Cap
acity
(MW
)
Gas Turbine Gas Engine Oil EngineSource: DGTW, 2001.

ECONOMICS OF DISTRIBUTEDGENERATION
An evaluation of the economics of distributed generation must takeinto account:
■ The cost of electricity produced by DG versus the cost of deliveredelectricity from the grid.
■ The “option value” of DG to reduce costs and risks associated withenergy consumption and production.
■ The value of any electricity exported from the DG project to thedistribution grid.
■ The value of any ancillary services, reduced congestion on thedistribution grid,or the costs of any increased network investment thatmay result from a DG project.
■ The value of the flexibility of DG technologies.
■ The value of other services that DG can offer customers, includinggreater electric reliability or CHP.
Distributed Generation Versus CentralPower
The biggest potential market for distributed generation is displacingpower supplied through the transmission and distribution grid.On-sitepower production circumvents transmission and distribution costs forthe delivery of electricity.These costs average about 30% of the totalcost of electricity.This share, however, varies according to customersize. For very large customers taking power directly at transmissionvoltage, the total cost and percentage are much smaller; for a smallhousehold consumer,network charges may constitute over 40% of theprice.
Distributed generation has other economic advantages for particularcustomers. For example, customers with sizeable heat loads may
33
economics of distributed generation3

produce both heat and power economically. Some customers haveaccess to low cost fuel (such as landfill gas or local biomass), comparedwith commercially delivered fuel (which usually has a higher unit costthan for large central generators).
Distributed generation can also encourage greater competition inelectricity supply, allowing even customers without DG greater choicein suppliers.
On the other hand, small-scale generation has a few direct costdisadvantages over central generation. First, there is a more limitedselection of fuels and technologies to generate electricity – oil, naturalgas, or photovoltaic systems, and, in certain cases, biomass or wastefuels. Second, the smaller generators used in DG cost more perkilowatt to build than larger plants used in central generation.Third,the costs of fuel delivery are normally higher. Finally, unless run in CHPmode, the smaller plants used in DG operate at lower fuel-conversionefficiencies than those of larger plants of the same type used in centralgeneration.
0Figure 30
Ratio of Industrial Fuel to Electricity Prices in Selected Countries
34
economics of distributed generation === 3
0,00
0,05
0,10
0,15
0,20
0,25
0,30
0,35
0,40
0,45
1996 1997 1998 1999 2000Year
Ratio
of I
ndus
trial
Fue
l/El
ectri
city
Pric
e
Japan (Gas) Japan (HFO) UK (Gas) US (Gas)Neth (Gas)Source: based on data from IEA 2001a.
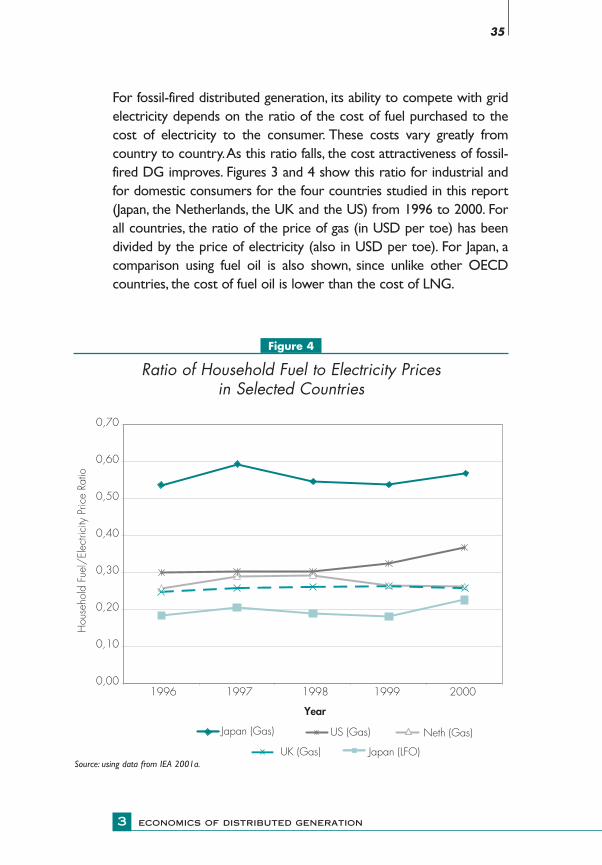
For fossil-fired distributed generation, its ability to compete with gridelectricity depends on the ratio of the cost of fuel purchased to thecost of electricity to the consumer. These costs vary greatly fromcountry to country.As this ratio falls, the cost attractiveness of fossil-fired DG improves. Figures 3 and 4 show this ratio for industrial andfor domestic consumers for the four countries studied in this report(Japan, the Netherlands, the UK and the US) from 1996 to 2000. Forall countries, the ratio of the price of gas (in USD per toe) has beendivided by the price of electricity (also in USD per toe). For Japan, acomparison using fuel oil is also shown, since unlike other OECDcountries, the cost of fuel oil is lower than the cost of LNG.
35
economics of distributed generation3
0Figure 40
Ratio of Household Fuel to Electricity Prices in Selected Countries
0,00
0,10
0,20
0,30
0,40
0,50
0,60
0,70
1996 1997 1998 1999 2000
Year
Hou
seho
ld F
uel/
Elec
trici
ty P
rice
Ratio
Japan (Gas)
Japan (LFO)
Neth (Gas)
UK (Gas)
US (Gas)
Source: using data from IEA 2001a.

The ratio also indicates the conversion efficiency of the distributedgenerator at which its cost of fuel equals the cost of the electricityreplaced. For example, in the Netherlands in 2000, the fuel cost of anindustrial generator running a DG plant at 28% efficiency would barelyoffset the cost of purchased power from the grid.
The figures show important differences in the ratio among countries,years – and fuels in the case of Japan. Perhaps the most strikingdifference is that Japan (for LNG) and the United States bothconsistently have the highest ratios, indicating that gas-fired DG inthose countries is less economically feasible. By contrast, the UK andthe Netherlands both have much lower ratios, suggesting that DGproduction is likely to be more viable. In 2000, as both fuel prices roseand electricity prices fell, the ratio increased sharply for all countries,except the UK. Further increases in gas prices in 2001 haveexacerbated this trend.As for Japan, the figures illustrate that fuel-oilDG in Japan is much more viable compared with distributedgeneration from natural gas.
The total cost of generating electricity per kWh depends on a numberof factors, particularly:
■ the cost of fuel, accounting for 50%-80% of the total cost perkilowatt hour;
■ the cost of the capital investment, making up 15%-35%; and
■ the capacity factor of the equipment.
Operating and maintenance costs, 10%-15% of total generating costs,are of secondary significance. Table 2 estimates of the cost ofgeneration for various DG technologies for industrial consumers. (It isvery difficult make precise calculations because of the different sizes ofthe equipment and variations in fuel costs within and betweencountries.) For household consumers, generation costs will be 4-6 U.S.cents per kWh higher because of higher fuel-delivery costs.
■ Economics of Photovoltaic Electricity
The economics of photovoltaic technology is almost the opposite ofother technologies used in distributed generation. PV systems havehigh capital costs, but no fuel costs and modest operating costs.
36
economics of distributed generation === 3

The competitiveness of PV power, compared with grid electricity, alsomust take into account the cost of electricity and the location of thePV installation. PV systems in sunny locations in lower latitudes (suchas California) produce nearly twice as much power annually as innorthern Europe.While fossil-fired distributed generation reduces thecustomer’s exposure to volatile electricity prices,PV reduces exposureto volatile electricity and fuel prices.
Due to its high capital cost alone, however, PV is currentlyuncompetitive for grid applications, unless it is subsidised. The lines on Figure 5 illustrate the break-even electricity prices of PV at differentcapacity factors.The dots show the current household retail prices andcapacity factors for the four countries in this study. For the US, thestate of California is used; it is a best case that has both high capacityfactors and high electricity prices.The figure shows that PV costs needto be reduced by at least a factor of two for California and Japan, andby much more for the Netherlands and the UK,before the technologybecomes remotely competitive at displacing grid-based power forhousehold use in OECD countries.
■ Flexibility Increases the Value of Distributed Generation
Conventional cost assessments of generating options tend tounderstate the value of flexibility to the owner of generating plant.
37
economics of distributed generation3
0Table 20
Indicative Costs of Various Distributed-Generation Technologies
Distributed-Generation Indicative Cost of GenerationTechnology Industrial (U.S. cents/kWh)
at 60% Load Factor
Diesel Engine 7-11
Gas Engine 6-9
Gas Turbine 6-9
Microturbine 7-9
Fuel Cell 11-14

38
economics of distributed generation === 3
0Figure 50
Comparison of PV Costs/Output to Household Electricity Rates in Selected OECD Countries
Current Cost
30% Reduction
50% Reduction
70% ReductionJapan
UKNetherlands
Capacity Factor
¢/k
Wh
USA (CA)
70
60
50
40
30
20
10
010% 12% 14% 16% 18% 20% 22% 24% 26%
¢
Source: IEA, 2001b.
Many DG technologies are flexible in operation, size, and expandability.
A distributed generator can respond to price incentives reflected in
fluctuating fuel and electricity prices. When fuel prices are high and
electricity prices are low, the distributed generator purchases from the
electricity market. In the opposite situation, the producer supplies to
the market. In other words, the availability of on-site power is a physical
hedge for the customer against volatility in electricity prices. Many
distributed generators in Japan operate in precisely this fashion,
displacing power from the grid only during peak periods and meeting
all their needs from the grid off-peak.

A distributed generator can expand generating capacity more readilythan a central generator and may be able to do so quickly in responseto a rapid increase in demand – created by inadequate generation,transmission, or distribution – depending on the configuration andthe size of the interconnection. Modular generating plants can beordered and installed in weeks. Distribution utilities already usecombustion-turbine units installed at distribution substations for thispurpose.
Market liberalisation greatly increases the flexibility of the distributedgenerator. In a captive market, a distributed generator may not beallowed to export power to the network or may be permitted to sellonly to the local distributor. In a liberalised market, the excess can besold to any consumer in the same distribution network.That abilitymay allow the distributed generator to justify the purchase of a largergenerating plant, which can lower unit capital and operating costs.The liberalised market also allows distributed generators to contractwith other producers for backup electricity. The ability to sourcebackup power competitively should reduce costs of this source ofsupply.
The flexibility of distributed generation is difficult to assess but maybe very important in determining its overall value. “Real optionvaluation” is attracting increased interest in the field of powergeneration, in part because it attempts to value the flexibility ofdifferent types of generating plants in volatile market conditions.Recent work in this area suggests that flexible power plantsoperating during peak periods may be much more profitable thanconventional evaluations suggest14. Fossil-fired DG has similarcharacteristics and thus should have similar option values. Whilesome distributed generation is clearly flexible in operation, otherforms, e.g. PV or CHP where output is determined by the heat load,have limited operational flexibility. The Edison Electric Institute haspublished a study using real options to estimate the value of the gridinterconnection to the distributed generator15.
39
economics of distributed generation3
14. Frayer J., and N. Uludere, 2001.15. Pati, M., Ristau, R., Sheblé, G. and M.Wilhelm, 2001.

■ Distributed Generation Can Provide Grid Benefits
Distributed generators, depending on location, may offer additionalvalue to the grid:
■ Deferral of upgrades to the transmission system. When atransmission system is congested, an appropriately located DG canreduce the congestion and thus can defer the need for an upgrade,particularly when the growth in congestion is low16.
■ Deferral of upgrades to the distribution system. If adistribution network is operating near capacity or needs to beupgraded to accommodate power flows from the generator, DGinstalled at a transformer station, for example,may allow a distributioncompany to cope with the problem, delaying the need to upgradedistribution assets.
■ Reduction of losses in the distribution system. System lossesare affected by changes in power flows in the distribution network.On-site generation will cut system losses by reducing power demandon the system. Furthermore, if a distributed generator is located neara large load, then its exported power will also tend to cut systemlosses. In contrast, power exported to the grid from remotedistributed generators may increase these system losses.
■ Provision of network support or ancillary services17. Theconnection of distributed generators to networks generally leads to arise in voltage in the network. In areas where voltage support isdifficult, installation of a distributed generator may improve quality ofsupply.
A full evaluation of the economics of distributed generation mustdetermine whether its benefits to the grid are passed on to theproducer. This question is discussed in more detail in the policychapter.
40
economics of distributed generation === 3
16. See Chapel, S. and C. Feinstein, 2000.17. Ancillary services include provision of reserve power, controlling the frequency and voltage of electricity, andreactive power.

Combined Heat and Power (CHP)
The combination of heat with power generation is a well-establishedtype of distributed generation. Most CHP generating capacity meetsdemand for process heat in larger industries, particularly the iron andsteel, chemical, refining, pulp and paper, and food-processing industries.Most of the rest,which includes process heat as well as district heating,is either used in smaller industries or in buildings. Surplus power,normally sold to the local utility,can then be exported to the electricitynetwork.
Integrating heat production with power production only slightlyincreases capital costs (less than 10% for industrial systems). Thosecosts can be more than offset by the value of heat energy produced.For example, UK projects have an average electricity conversionefficiency of 20% and utilise a further 51% as heat.The size of the CHPsystem matters: the most cost-effective match the heat load.
As with other technologies, there are significant economies of scale.For example, a CHP system using a 100 kW engine costs about 60%per kilowatt than one with a 3 MW engine. The most economicallyattractive CHP technology up to a few MW is usually gas engines andat the larger sizes, steam turbines. At this stage, CHP usingmicroturbines is not competitive; it has somewhat higher capital costsand lower overall efficiencies compared with gas engines. Fuel cells aremuch further from being commercially competitive but do offer theadvantage of higher electrical efficiencies.
Because of the significant capital investment, CHP is moreeconomically attractive at high utilisation rates. UK systems operate ata moderately high capacity factor of 57%, even though many of themrun at part load nearly continuously. However, in countries with asignificant amount of district heating, overall capacity factors in CHPmode are much lower.
The cost-effectiveness of CHP facilities are more site-specific than forother DG projects because of the need to find customers with a needfor heat. At the industrial level, experience in Denmark and the
41
economics of distributed generation3

Netherlands shows that payback time is crucial to the investmentdecision.The payback is considered prohibitive in excess of 4-5 years18.
The growth in CHP in OECD countries is largely due to favourablegovernment and regulatory policies19. These policies have taken theform of investment tax credits and national targets for electricity fromCHP, obligations on the electric utility to purchase CHP power,favourable prices for fuel or ancillary services provided to the CHPproject,and favourable electricity prices for CHP power (in some casessupported by government subsidies). As a result, CHP generatingcapacity has continued to grow despite overcapacity in somecountries.The policies have also encouraged CHP systems to producea higher proportion of power for the grid than if based only on theheat load.
42
economics of distributed generation === 3
18. See NEA/IEA 1998,Annex 4.19. Finland is a notable exception where substantial CHP capacity has been constructed and operated withoutmajor subsidies.
0Table 30
Capital Costs and Efficiencies of CHP Technologies
Type Size Installed Cost Electrical Overall(MW) (USD/kW) Efficiency Efficiency
Micro-CHP (Stirling Engine) < 0.015 2 700 15-25% 85-95%
Microturbine 0.1 1 970 28.7% 59%
Engine 0.1 1 380 28.1% 75%
Fuel Cell 0.2 3 764 36.0% 73%
Engine 0.8 975 30.9% 65%
Engine 3 850 33.6% 62%
Turbine 1 1 600 21.9% 72%
Turbine 5 1 075 27.6% 73%
Turbine 10 965 29.0% 74%
Turbine 25 770 34.3% 78%
Turbine 40 700 37.0% 78%
Source: Onsite Sycom 2000b and c; Future Cogen, 2001 (micro-CHP).

In the European Union20, CHP accounted for 72 GW of capacity and11% of total electricity generated in 1998, although the share variedgreatly from 1.9% in Ireland to 62.3% in Denmark. In a 1997communication, the European Commission proposed a communitystrategy to promote CHP to increase energy efficiency and reducegreenhouse-gas emissions. It said that a doubling of CHP from its 1994level of 9% to 18% was “realistically achievable” but required Memberstates to remove various obstacles to CHP21.
Four industries (chemical, refining, food, and pulp and paper) accountfor 80% of industrial CHP in the EU.And industry as a whole accountsfor 80% of total CHP. Most CHP capacity is large and tends to beconnected at high voltages (i.e. 110 kV or above)22.
43
economics of distributed generation3
20. Data problems make detailed analysis of CHP very difficult.The statistical information is often incomplete andnot always comparable because of differences in definitions.The IEA collects data on heat sold to third parties.Theheat that CHP units provide for consumption in place is not reported in IEA data as part of the output of the CHPunit.This report relies on national sources and on Eurostat. However, quantitative comparisons between countriesmust be made with caution.21. EC, 1997.22. Eurostat, the European statistical body, recently adopted a new methodology for calculating CHP, starting withthe 1999 statistics.The new methodology uses a stricter definition of CHP, which may result in lower estimates ofCHP capacity.

44
economics of distributed generation === 3
Member State CHP generating CHP Electricity Share of totalcapacity (MW) (GWh) electricity production (%)
Austria 3 416 14 268 24.8
Belgium 797 3 410 4.1
Denmark 7 027 25 591 62.3
Finland 5 097 25 128 35.8
France 3 485 12 660 2.5
Germany 22 160 41 770 7.5
Greece 257 981 2.1
Ireland 114 404 1.9
Italy 9 802 45 990 17.8
Luxembourg 98 320 22.5
Netherlands 8 500 47 835 52.6
Portugal 965 3 288 8.4
Spain 3 558 21 916 11.2
Sweden 3 205 9 544 6.0
United Kingdom 3 842 20 759 5.8
EU-15 72 323 273 864 11.0Source: Eurostat.
0Table 40
European Union CHP 1998
In the United States, CHP provides 50.4 GW, or about 6% of totalelectrical generating capacity. Industrial CHP accounts for about 90% of all CHP. As in the European Union, 80% of industrial CHP is present in the same four industries.
Japan’s CHP installations, known as “cogeneration systems”, have totalcapacity of 5 GW,accounting for 2% of power production.Nearly 80%of this capacity is installed in the industrial sector.
■ Most CHP is Large CHP
In the US and the UK, large installations account for most of the CHPcapacity. In the US,CHP plants greater than 10 MW account for nearly

half of the total and 97% of all CHP capacity. UK statistics show thatwhile CHP units over 10 MW make up only 5% of the total, theyrepresent over 78% of CHP capacity.
■ Small CHP Applications
Small CHP plants, those producing under 10 MW, to date contributelittle to overall CHP capacity. They are less cost-effective due to higher unit capital costs and more limited requirements for heating inthe commercial sector. Recent growth in the EU has been slow23.However, CHP may be a viable option for commercial consumerswhose electricity prices are much higher than for industrial consumers.Gas engines and microturbines can be easily sized for this market. Fuelcells have the same potential. Japan, for example, has been an earlyadopter of DG technologies in the commercial sector in response tohigh electricity prices.
■ Combining Cooling with Power Generation Can be Economically Attractive in the Commercial Sector
The demand for cooling represents a large portion of peak electricalload and a substantial large share of electricity consumption in manyOECD countries. It is a particularly important electrical load in thecommercial sector. Although electrical chillers provide nearly all thecooling today,gas-absorption chilling is a viable alternative where needsare large, such as in the commercial sector and for some industrialapplications. A gas-absorption cooling system running on waste heatfrom on-site power generation can be even more economicallyattractive. Some new buildings – particularly “Internet hotels” housingcomputer hardware for Web sites – have both high cooling and powerloads, i.e. 20-30 MW compared with 5 MW for a hospital. Thosebuildings are installing combined systems as the most economical way of meeting these needs as well as providing increased reliability.The NY Cybercentre in New York City will have a “trigeneration”
45
economics of distributed generation3
23. See SAVE, 2001.

system (combining power generation, heating and cooling) withgenerating capacity of 47 MW and chilling capacity of 16 000 tons forits 37 000 m2 of office space24.
The market penetration of gas-absorption cooling technology in thecommercial sector is limited to these special applications because ofhigher capital costs (approximately 50% over a conventional electricalchiller), the larger size of the chilling equipment, and limited familiaritywith the technology.
■ Household CHP Technologies are being Commercialised
Nearly all CHP applications to date have been developed for either theindustrial or commercial sectors. Development of CHP systems forthe household market – micro-CHP systems as they are commonlycalled – has been largely neglected because of high unit costs.
Recent technological developments with gas-fired engines, however,have made household systems economically viable. They can beoperated to provide all home-heating needs (for hydronic heatingsystems); electricity is produced as a by-product. Some systems haveattained electricity-only efficiencies of 12%-25% and overall heatutilisation rates of up to 90%.
A number of companies have announced plans to commercialiseengine-based micro-CHP for household use. Costs of an installedsystem vary widely because the technological is in an early stage butare estimated at USD1 300-USD1 500 per kW. Total operatinghours depend on the climate, of course, but are likely to be 2 000 –4 000 hours annually in Europe. If all the electrical output from thesystem can displace grid power, the payback period is as short asfour years.
46
economics of distributed generation === 3
24. Perrault, L. 2001.

Fuel cells are the other major technology being explored forhousehold CHP use. The domestic market for power generation isseen as one of the first for fuel-cell technology. Costs on the domesticmarket are less of a constraint than on the automotive market, forexample, even though a fuel-cell CHP system would be much moreexpensive than an engine-based system. Several companies, includingautomotive companies, electric utilities as well as smaller firms, haveannounced intentions to market fuel cells as domestic powergenerators within the next few years.
Several attempts have been made to forecast the market for micro-CHP. One assessment concludes that the European market willexperience very rapid growth – up to half a million units annually from2003 to 2010. Germany, the UK, the Netherlands, Italy, Austria, andSwitzerland are likely to be the biggest markets25. The study alsopredicts slower penetration of Asian and North American marketsbecause of the warmer climate in Asia and because hydronic heatingsystems in North America are less common.
Significant barriers remain to be overcome before the market growsthat quickly.The most important is the high initial cost of householdCHP systems compared with that of conventional boilers. Sales ofmore efficient condensing domestic boilers in the UK, for example,are very low despite a small price premium (about USD200 or 15%over conventional boilers) and payback periods of 3-4 years. As theprice of a household CHP system is two to three times higher than aregular gas boiler, it is difficult to imagine that consumers will accept the higher initial investment. A more promising route to commercialisation may be leasing and installation of the systems by third parties.
As some systems may need to export power to the grid, a secondbarrier is related to costs and possibilities for doing so. The mainadditional costs involve the grid interconnection. The feasibility ofselling small amounts of power in a liberalised market is discussedfurther in the policy chapter.
47
economics of distributed generation3
25. See Huhn, K. 2001.

Reliability, and Standby or Emergency Power
The most important application of distributed generation today is asemergency power. More than 100 GW of diesel generating capacity isavailable in the US alone26. Over 70% of that is estimated to be forstandby or emergency use. The existence of this largely neglectedsource of grid power is gaining increased attention, particularly in theUnited States where demand growth has led to tighter capacitymargins. In the summer of 2001, system operators in New Mexico andOregon arranged for the use of existing standby generators to supplyadditional power to the grid under emergency conditions. Electricutilities have co-ordinated the operation of these standby generatorsthrough communications networks and software that permit theutilities to remotely operate the standby generators as needed27.
Distributed generation is also used by distribution utilities to deal withlocal network congestion problems resulting from load growth. Bymoving portable power generators (usually portable diesel generatorsor combustion turbines powered by natural gas) to distributionsubstations, utilities have been able to cope with rapid load growthmore quickly than by upgrading distribution facilities.
A new application for DG is supplying companies for which outagesfrom the local electricity grid would be very expensive. Thesecompanies include those in industries that use continuousmanufacturing processes (chemicals, petroleum refining, paper, metals,and others) and those that provide essential services.They particularlyinclude so-called “digital economy” industries like telecommunications,data storage and retrieval, and financial companies.
Table 5 shows estimated costs of a one-hour power outage forselected US businesses. A recent survey of US manufacturers and“digital economy” companies underscored the expenses of even shortoutages.The average cost of a one-hour outage was USD7 795 andUSD1 477 for a one-second outage28.
48
economics of distributed generation === 3
26. Singh,V. 2001.27. Peltier, R., 2001.28. Primen, 2001.

Companies are investing in the key area of preventing power losses totheir computers.A simple uninterrupted power supply (UPS) systemusing capacitors or batteries to protect a network server costs a fewhundred USD. With such a system, the server can survive a shortdisruption and safely back up information before the UPS batteries aredepleted. While the cost of a UPS battery system may seem highcompared with bulk electricity supply in USD per kW or USD perMWh, it is inexpensive compared with the cost of the server, lost data,and productivity.
As a consequence, demand has been growing for higher reliability inelectricity supply.An oft-cited standard for highly reliable power is “sixnines” of reliability (i.e. 99.9999%), equivalent to 30 seconds of outageper year.As most outages are caused by the distribution system, on-site protection is the only feasible solution.Two DG technologies couldprovide such protection: backup systems combined with UPS systemsand fuel cells. A gas-engine backup system combined with a flywheelUPS system recently has been commercialised. A US bankclearinghouse has installed four fuel cells as part of a UPS system toensure nearly continuous operation (outage time of 1 second peryear).The Harvard Medical School,where a single outage could lead tothe loss of years of research, is considering a power system based onfuel cells29.
49
economics of distributed generation3
Industry Hourly outage cost(USD)
Cellular communications 41 000
Telephone ticket sales 72 000
Airline reservations 90 000
Credit card operations 2 580 000
Brokerage operations 6 480 000
Source: US Department of Energy.
0Table 50
Cost of a One-hour Power Outage for Different US Businesses
29. See Milford, L. 2001.

Reliability concerns are fuelling the purchase of DG generatingcapacity. While this capacity is a tiny share of overall electricityproduction, it can be expected to become an increasingly importantsource of peak supply. In this way, distributed generation is contributing to the security of electricity supply.
Offgrid and Remote Consumers
Service to customers not connected to the main electricity grids isdistributed generation. Although a relatively small percentage ofconsumers are served off-grid in the OECD30, that share representsabout half a million electricity consumers in the US, Canada, andAustralia alone.
The main policy question regarding off-grid consumers is whether thegrids should be expanded to serve these consumers. For the mostpart, grids already have been expanded where expansion has madeeconomic sense. In liberalised markets,off-grid consumers generally donot have as many suppliers to choose from as on-grid consumers.Theremoteness of these off-grid communities may impede competitionand keep prices high in the local power grid.
Nevertheless, use of the latest DG technologies may reduce thepremium that individual consumers in off-grid communities pay for ahigh-quality power supply. Hybrid systems, such as diesel-windgenerators, are becoming increasingly viable options for utilities andindividual consumers. Encouraging individual consumers to developtheir own power supply also could enhance power reliability in thesecommunities.
Pricing policy also influences the efficient development of the powersupply to off-grid communities.A number of jurisdictions have pricingpolicies that set similar retail electricity rates for remote communitiesand grid-connected customers, for reasons of equity. However, thesepolicies discourage local customers from developing their own supply.
50
economics of distributed generation === 3
30. The issue is of great importance outside the OECD, where “offgrid” is more likely to imply no electricity serviceat all.

Rescinding these policies would encourage greater investment inenergy efficiency and in distributed generation.
Besides these community-sized applications, there are even smallerapplications of off-grid DG technologies that are more cost-effectivethan grid power. Photovoltaic systems combined with battery storagecan be the most economical method of powering low-capacity factorapplications such as remote lighting and telephone service. Thesemethods are obviously attractive when the application is distant fromthe distribution grid. But sometimes the cost alone of adding a singlestreet light to a grid can exceed the capital cost of installing a PV-basedlighting system. Falling costs for DG systems can be expected to resultin their greater use for these niche applications.
51
economics of distributed generation3


DISTRIBUTED GENERATION IN JAPAN, THE US, THE NETHERLANDS, AND THE UK
The status of distributed generation differs in each OECD country.While economics is certainly a fundamental factor, as discussed in the previous chapters, other factors come into play. This chapterexamines other influences on the development of distributedgeneration in the OECD, particularly market structure and electricity-market reform, and reviews policies in Japan, the United States, theNetherlands, and the United Kingdom.
Japan
The Japanese electricity industry consists of ten vertically integrated,privately owned utilities that serve virtually all electricity consumers.The total electrical generating capacity of approximately 253 GWproduces 1 062 TWh of electric power generation.
Electricity prices in Japan are the highest of all OECD countries,reflecting high capital costs for generation, transmission anddistribution equipment; high costs for land; and the moderately highcost of fossil fuels, particularly natural gas, which must be imported inliquefied form. High power prices account for a large proportion ofindustrial autoproduction of power in Japan. Over 30% of electricityconsumption in the manufacturing sector is taken care of by on-sitepower production, which amounts to nearly 28 GW or 116 TWh ofpower consumption – 12% of total Japanese consumption31. Many ofthese large industrial plants generate electricity with coal.Approximately one-sixth of this industrial power production issupplied by cogeneration.
The electricity market has been partly liberalised in Japan. Extra-highvoltage consumers, which represent 30% of electricity consumption,
53
distributed generation in japan, the us, the netherlands, and the uk4
31. METI, 2001.
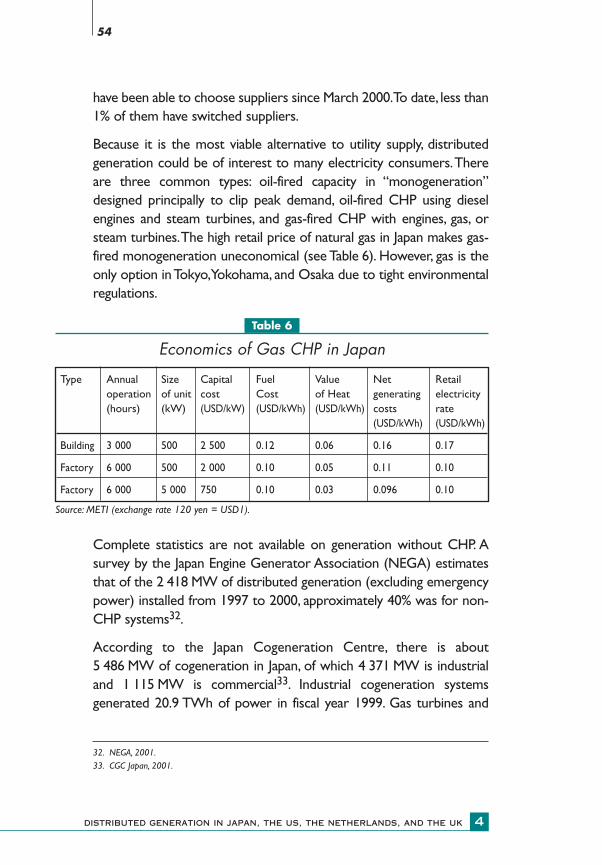
have been able to choose suppliers since March 2000.To date, less than1% of them have switched suppliers.
Because it is the most viable alternative to utility supply, distributedgeneration could be of interest to many electricity consumers.Thereare three common types: oil-fired capacity in “monogeneration”designed principally to clip peak demand, oil-fired CHP using dieselengines and steam turbines, and gas-fired CHP with engines, gas, orsteam turbines.The high retail price of natural gas in Japan makes gas-fired monogeneration uneconomical (see Table 6). However, gas is theonly option in Tokyo,Yokohama, and Osaka due to tight environmentalregulations.
Complete statistics are not available on generation without CHP. Asurvey by the Japan Engine Generator Association (NEGA) estimatesthat of the 2 418 MW of distributed generation (excluding emergencypower) installed from 1997 to 2000, approximately 40% was for non-CHP systems32.
According to the Japan Cogeneration Centre, there is about5 486 MW of cogeneration in Japan, of which 4 371 MW is industrialand 1 115 MW is commercial33. Industrial cogeneration systemsgenerated 20.9 TWh of power in fiscal year 1999. Gas turbines and
54
distributed generation in japan, the us, the netherlands, and the uk === 4
Type Annual Size Capital Fuel Value Net Retailoperation of unit cost Cost of Heat generating electricity(hours) (kW) (USD/kW) (USD/kWh) (USD/kWh) costs rate
(USD/kWh) (USD/kWh)
Building 3 000 500 2 500 0.12 0.06 0.16 0.17
Factory 6 000 500 2 000 0.10 0.05 0.11 0.10
Factory 6 000 5 000 750 0.10 0.03 0.096 0.10
Source: METI (exchange rate 120 yen = USD1).
0Table 60
Economics of Gas CHP in Japan
32. NEGA, 2001.33. CGC Japan, 2001.

diesel engines account for over 90% of the generators (see Table 7).Growth in cogeneration systems has been steady, averaging more than360 MW a year since the late 1980s.
Cogeneration in Japan benefits from:
■ investment incentives in the form of high depreciation or initial taxcredit, plus low interest rate loans from the Development Bank ofJapan, and;■ subsidies up to 15% for major district heating and cooling projects.Monogeneration receives no subsidies.
In Japan, most cogeneration that is classified as “gas turbine” uses fuelsother than natural gas (e.g. fuel oil, blast furnace gas, or refinery gas).METI, which considers cogeneration fired by natural gas to be a formof “new energy”, forecasts it will grow from 1.52 GW of capacity in1999 (excluding steam turbines) to 3.44 GW by 2010.With additionalmeasures such as support for research, development, demonstration,and diffusion of the technologies, METI foresees 4.64 GW of capacityby 2010.
Charges for backup power for a customer using a DG system aresubstantial but less than regular capacity charges. Capacity charges are10% above the normal rate when backup power is actually used.Whenbackup is not needed, capacity charges for business are 30% of thenormal rate (20% for industry). Energy charges for backup power are10% above the normal rate for a scheduled outage and 25% above foran unscheduled one.
55
distributed generation in japan, the us, the netherlands, and the uk4
Gas Turbine34 Gas Engine Diesel Engine
Commercial 209 291 483
Industrial 2 252 186 1 552
Total 2 461 477 2 035Source: Japan Cogeneration Centre.
0Table 70
Cogeneration System Capacity (in MW) by Sector andGenerator Type as of March 2001
34. Includes gases other than natural gas.
Several firms are active in selling DG systems including Eneserve,Yanmar, and Mitsubishi Heavy Industries.A ten-year contract to build-own-operate (BOO) is the most common arrangement. Notsurprisingly,some electric utilities have identified distributed generationas a new growth business.Tokyo Electric Power has created the newsubsidiary “My Energy” to sell oil-fired engine systems to industrial andcommercial consumers. As of March 2001, My Energy had signedcontracts with 44 customers, 42 of them will use diesel enginegeneration35. My Energy achieved a notable first in Japan as the firstutility affiliate to take a customer away from another (Tohoku Electric).Seven other utilities have also established similar subsidiaries. Leasingarrangements are becoming increasingly common.
Several regulatory barriers have been removed to encourage thedevelopment of distributed generation and cogeneration systems inparticular.These include adjustments to fire regulations, the repeal of arequirement for an on-site electrical engineer, and reduced inspectionrequirements.The government also plans to eliminate the requirementfor an on-site boiler engineer.
However, some regulatory barriers remain. Selling excess distributedgeneration to another electricity customer is generally not allowed,even though that ability would improve the cost-effectiveness of anumber of projects. The requirements for electrical protectionequipment,which add at least 10% to the total cost of the facility, couldbe simplified.
Another factor is the behaviour of utilities in the partly liberalisedmarket.Although METI guidelines clearly state that utilities are not toimpede the development of self-generation, suppliers of DGequipment have suggested that utilities discourage customers fromdeveloping their own distributed generation by selectively cutting theirelectricity rates.
A large potential market exists for natural gas cogeneration,particularly when combined with cooling in urban areas. Gascogeneration and gas cooling together account for 45% of gas sales by
56
distributed generation in japan, the us, the netherlands, and the uk === 4
35. Hangai, E. 2001.
Tokyo Gas.They are expected to account for over half of the growthin the company’s gas demand over the next five years. Future technicaldevelopments aim at producing more cost-effective systems forcogeneration and for gas cooling. Microturbine systems appearpromising because of good environmental performance but will not bea viable option until the capital costs of CHP systems decline further.
In summary, distributed generation is already playing a role in Japan byapplying competitive pressure, at least in selected market segments, onthe utility market. It appears to be one reason that utilities haverecently cut prices, since competition for liberalised consumers,particularly among utilities, has so far been very limited. DG couldcontribute to the electricity supply, however, with:
■ further market liberalisation, to allow more customers to choose,generate, and export energy; and
■ appropriate pricing of backup energy, transmission, and ancillaryservices.
If DG is to make a large contribution, however, its cost – through technological improvements and lower gas prices – mustdecline compared with the cost of grid electricity.
The United States
The US electric power system is very complex, representing thediverse federal nature of the country. Although more than 200investor-owned utilities supply about three-quarters of customers,over 2 900 municipal and rural utilities supply the remaining quarter.Wholesale electricity markets are the responsibility of the federalgovernment through its regulatory agency the Federal EnergyRegulatory Commission, but retail commerce in electricity is theresponsibility of the states.
This decentralised responsibility means that retail electricity-marketliberalisation is proceeding at very different rates in different states.Although 23 states have enacted legislation to liberalise the electricitymarket, many others have indicated that they will not proceed withsuch reforms in the near future. Events in California have slowedreforms in several states.
57
distributed generation in japan, the us, the netherlands, and the uk4
Energy costs in the US are lower than in most OECD countries, bothfor electricity and for gas. Prices for these commodities, however, varygreatly across the country. The low cost of energy has limited thespread of distributed generation and particularly CHP, which accountsfor 50.4 GW or about 6% of total electrical generating capacity.Industrial CHP accounts about 90% of all CHP. Of that share, 80% ofexisting industrial CHP is in four industries:paper,chemicals,petroleumrefining, and food processing.
A large application for distributed generation is emergency power.Diesel emergency generators at industrial sites and commercialbuildings account for over 100 GW of US generating capacity. Standbygenerators in California alone provide 3.2 GW of capacity, equivalentto over 6% of peak electricity demand in the state, according to adetailed survey by the California Energy Commission36. Electricitysystem operators in New York developed mechanisms to make thiscapacity – totalling 120 MW – available to supply peak loads duringpower emergencies37. The prospect of increased use of dieselgeneration has also increased concern about the associated emissionsimpact38.
An analysis prepared for the US Department of Energy suggests thatthe market potential for CHP in the country is over 160 GW –88 GW in the industrial sector and the rest in the commercial sector.The US Combined Heat and Power Association, in co-operation withthe US Department of Energy and US Environmental ProtectionAgency, developed a “National CHP Roadmap” intended to doubleCHP capacity from 46 GW in 1998 to 92 GW by 201039.
The US Department of Energy is involved in a large research anddevelopment effort to promote distributed generation that considersall renewable resources. Its Distributed Energy Resources StrategicPlan40 budgets USD279.9 million in fiscal year 2000 for R&D the areas
58
distributed generation in japan, the us, the netherlands, and the uk === 4
36. CEC, 2001.37. NYISO, 2001.38. Singh,V. 2001.39. USCHPA, 2001.40. USDOE, 2000.

of: technology development (PV, fuel cells, wind, geothermal, industrialpower, and other solar), technology base (advanced engine materialsand turbine technologies), systems architecture, and systemsimplementation (including integration of DG into grids).
The current administration under President George W. Bush hasidentified a need to expand generating capacity in the US.The NationalEnergy Policy makes favourable references to encouraging CHPthrough tax incentives, encouraging development at existing industrialsites, and by encouraging greater flexibility in the environmentalpermitting process41.
The main issues regarding distributed generation in the US are:
■ A need to improve cost-effectiveness.Relatively low electricityprices and recent spikes in natural gas prices limit the growth ofdistributed generation. The US Department of Energy estimatesadditional DG capacity by 2020 of 1.) 20 GW of CHP, 2.) 12.7 GW of“distributed generation” (primarily gas-fired peaking plants used byutilities), and 3.) 0.54 GW of solar PV42. Little new capacity is forecastfor the commercial sector until 2015, when falling costs for fuel cellsand microturbines, in particular, is expected to make these optionscompetitive43.
■ Permitting processes. The decentralised system of permitting inthe US hinders siting approval.
■ Variable interconnection standards.There is not yet a nationalstandard for interconnection of distributed generation to the network.Utilities lacking experience with DG may require stringentinterconnection limits for small units that are more appropriate forlarger units. Connection costs for DG projects vary, according to astudy prepared for the National Renewable Energy Laboratory thatlooked at both fossil-fired and renewable DG. Many projects reportedexcess costs associated with the technical requirements of connection.One 500 kW cogeneration system project said the cost was
59
distributed generation in japan, the us, the netherlands, and the uk4
41. National Energy Policy, p. 4-11.42. EIA, 2000.43. See EIA, 2001.

USD1 000 per kW44. A national standard (IEEE P1547) is underdevelopment and may be adopted in 2002.
■ Incomplete regulatory reform.Many states have not liberalisedtheir electricity markets. Many of those give utilities public serviceresponsibilities such as supplier of last resort. Distributed generatorsgenerally have difficulty gaining the co-operation of distribution utilities.They report obstacles such as lack of access to the distribution system,high charges for backup power (up to USD200 per kW a year)45, andutility price cuts to customers interested in installing their owngeneration. On the other hand, public and private utilities areconcerned that customers generating their own electricity will lead tohigher electricity rates. Some have argued that distributed generatorsshould pay stranded costs.
■ Environmental standards. First, environmental regulations aremade at the state or local level. Generating companies cannot easilypersuade regulators to adopt a uniform standard. Second, someregulatory authorities have established standards based on emissionsrate, in pounds per MWh for example, regardless of size. In Texas, air-quality regulators set the same standard for NOx in high pollutionareas for gas turbine with advanced NOx control (SCR) – 2 ppm ofNOx or lower46.This cannot be achieved by a natural gas engine, evenwith SCR added. It barely can be achieved by a microturbine equippedwith an SCR, but the cost of such a system is prohibitive. Suchstandards effectively rule out fossil-fuel DG.
■ Technical limitations. The greater use of radial grids in the US,compared with much of Europe,presents a technical challenge47.Radialgrids are not designed to accommodate backward flows. Small utilities,especially,may find it difficult to handle distributed generation sent intothe network. Heavy investments to upgrade distribution networkswould be needed to accommodate large amounts of DG. Upgradingcosts are normally passed onto the distributed generator.
60
distributed generation in japan, the us, the netherlands, and the uk === 4
44. Alderfer, B., M. Eldridge and T. Starrs, 2000.45. Alderfer, B., M. Eldridge and T. Starrs, 2000.46. TNRCC, 2001.47. Onsite Sycom, 2000a.

The Netherlands
The Dutch electricity system is served by four generating companiesthat supply approximately half of the total electricity supply.Decentralised production accounted for nearly 40% and importsnearly 20% of the total in 1999. Over 60% of power production is from natural gas, which is produced domestically and is generally themost economical option for power generation.
The Dutch electricity sector is strongly influenced by the government’spolicies to reduce carbon-dioxide emissions and improve energysustainability. The 1989 Electricity Act strongly encouraged marketentry by decentralised combined heat and power for environmentalreasons. A variety of incentives resulted in a doubling of CHP from1990 including:
■ government investment subsidies of up to 17.5% (until 1995);
■ an obligation by generating companies to purchase surplus powergenerated from these facilities at the estimated full cost of new centralgeneration facilities (also until 1995);
■ favourable natural gas prices from the 50% state-owned gas supplierGasunie (until 2000); and
■ an exemption (until 1997) from paying for reserve capacity orancillary services48.
Growth in CHP created so much overcapacity that central generationoutput had to be curtailed to accommodate its surplus power.
In 1998, the government passed legislation to introduce marketreforms to the electricity sector. A wholesale electricity market started operating the next year. A new network regulator, DTE,which regulates network charges, was created. Customers are beingliberalised in stages; only small customers have yet to be liberalised.A new transmission company, TenneT, operates the transmissionsystem. Distributors, which are owned by municipal and regionalgovernments, have been obliged to separate their distribution
61
distributed generation in japan, the us, the netherlands, and the uk4
48. IEA, 2000.

businesses from other activities (including retailing electricity and jointventures with customers on generation).
The presence of a large share of distributed generation in the Dutchsystem before the reform meant that the design of the electricitymarket had to take DG into account from the outset. The systemoperator, TenneT, co-ordinates the system and controls the centralgenerators.Nevertheless, local network operators are actively involvedin balancing their own systems (starting at 110 kV and below).They areable to cope with high levels of CHP without compromising reliability.Some operational problems have resulted from a lack ofcommunication between TenneT and distributed producers, but arenow uncommon.
The Netherlands feature a few industrial CHP producers that haveformed their own “power parks”.Each industrial CHP producer has itsown generating capacity and connection to the grid, and also suppliespower to other sites that are not connected to the grid.
Much of Dutch distributed generation is the result of investment bydistributors in joint ventures with industry. As a result of theseparation requirements of electricity-market liberalisation, theownership and operation of CHP is now operationally separate fromthe ownership of the networks. Separation aids competition butprohibits investment by a distributor in generation to support the localnetwork.
Interconnection issues are not generally a problem.A study by CogenEurope comparing Dutch, French, and UK interconnection rules foundthat the Dutch rules were comparatively clear and transparent49.
Market rules do incorporate some advantages for distributedgeneration:
■ While small distributed generation, of under 10 MVA does not haveto pay connection or use of system charges, central generation doespay for using transmission (roughly EUR1.6 per MWh).
■ Some small plants are still captive customers and so sell their outputdirectly to the local distributor, who is obliged to buy it.
62
distributed generation in japan, the us, the netherlands, and the uk === 4
49. Cogen Europe, 1999.

■ Although large distributed generation is generally paying full costsfor connection and use of system,and the rules about this were initiallytoo rigid, most industrial CHP producers are now satisfied that moreflexible rules are being worked out.
■ Rules regarding imbalance charges have been adjusted to help DG.The Dutch introduced their new electricity trading arrangements inJanuary 2001. These arrangements penalised power producers thatcould not predict their output accurately (two hours in advance ofdelivery) through imbalance charges.Wind producers were particularlydisadvantaged because of the difficulties in forecasting wind speedswithin that time period. Initially, imbalance charges and volumes werehigh and caused some hardship. However, this situation led to a reviewby the system operator, which decided to allow producers to makefinal adjustments to their predicted output only one hour in advance,effective at the end of March 200150.
Market liberalisation has had a number of interesting effects on themarket for distributed generation, particularly CHP51:
■ Electricity prices have generally fallen as a result of overcapacity inthe Netherlands and due to lower prices from imported electricity inneighbouring countries with excess capacity.
■ CHP plants, which formerly received favourable natural gas tariffs,now purchase natural gas competitively.
■ Rises in natural gas prices have financially strained CHP plants.Plantswith large power-generation components have been more stronglyaffected. One went bankrupt.
As a result of the financial difficulties faced by the CHP units, thegovernment responded in late 2000 with measures to support CHPfurther, including:
■ An increase in the Energy Investment Allowance (a tax credit) fornew CHP.
63
distributed generation in japan, the us, the netherlands, and the uk4
50. DTE, 2001.51. See ECN, 2000.
■ Exemption of CHP electricity consumption from the regulatoryenergy tax.
■ Financial support to CHP output up to 200 GWh of EUR2.28 perMWh.
These measures supplemented an accelerated depreciation program(known as VAMIL) for CHP investments that met certain efficiencytargets.
In 2001, new rules were proposed to increase financial support forCHP output to EUR5.7 per MWh to a maximum of 1 000 GWh perplant, provided that the unit meets certain efficiency targets.
As a result of the financial strain on CHP, the government is under pressure to alter network tariffs, for example, to waiveconnection fees for large CHP. The government is reluctant to use the network as a mechanism for subsidising generation. However,distribution companies are examining different tariff proposals toreward CHP that adds value to the local grid, such as in the form ofvoltage or reactive power.
Despite the current financial difficulties with CHP, new large CHPprojects continue to be announced.Much of this capacity will,however,be connected at high voltage.
64
distributed generation in japan, the us, the netherlands, and the uk === 4

The United Kingdom
Electricity markets in most of the United Kingdom have been fullyliberalised since 1999, as have natural gas markets. Electricity laws andregulations require distribution network operators (DNOs) to belegally separate from electricity generation or retailing businesses.The Utilities Act 2000 also specifies that the DNOs have a duty topromote competition in electricity.
Much recent policy development on distributed generation (known as“embedded generation” and which includes wind power in the UK) hasfocused on its environmental benefit, particularly regarding climatechange. As a consequence, in addition to measures to support renewable energy, the government has developed several to promoteCHP:
■ A target to raise CHP capacity from 4.6 GW in 2000 to 10 GW in2010.
■ An exemption from the climate-change levy on fuel for “good qualityCHP”.
■ Exemption of CHP from business taxes.
■ An 80% discount on their climate-change levy for industriesinstalling CHP, in agreements between particular industries and thegovernment on climate-change measures.
■ Support for the modernisation of community-heating systems.
Partly as a result of these measures,“good quality” CHP capacity hasgrown by 1.3 GW a year in the past four years.Nearly half of the totalof 4.6 GW was added in 2000.The total additional capacity generated23.3 TWh of electricity at an average capacity factor of 57% and overallefficiency of 71%. CHP power generation accounts for approximately6% of total electricity generated in the UK. These figures exclude5.4 GW of CHP plant that did not meet the “good quality” criteria52.
65
distributed generation in japan, the us, the netherlands, and the uk4
52. “Good Quality” CHP is defined as achieving a certain minimum efficiency of heat and electricity productionfrom the CHP project.The required power efficiency is at least 20% (15% until 2005 for existing projects), with arequired combined heat and power efficiency that decreases as power output increases. For a small CHP scheme(1-10 MW) producing power at 20% efficiency, the required CHP efficiency would be 69%. See CHPQA 2000 andAnnex I of this report.
In addition to these measures to promote CHP and renewable energy,the government has identified the development of embeddedgeneration in general as important to increase competition amongelectricity producers.
Market liberalisation has also meant that charges for using the grid havebeen unbundled, so that distributors generators need only pay for thegrid services they use.As in the Netherlands, power from distributedproducers is exempt from charges from the use of transmissionsystem and associated losses, and requirements for balancing. Thisexemption results in a competitive advantage for DG, compared withcentrally generated power, of USD3-USD4 per MWh.
The creation of the New Electricity Trading Arrangements (NETA) waspart of the government’s efforts to enhance competition in theelectricity sector. However, embedded generators were concernedthat NETA, which became operational in March 2001, would work totheir disadvantage. NETA abolished the system whereby embeddedgenerators could effectively supply the local network and receivewholesale prices, regardless of the costs of balancing their output.Instead, NETA required all generators to predict their output at least3.5 hours in advance; they pay penalties if they produce less thanforecast but receive only modest compensation if they produce more.These rules were designed to give all producers incentives to balancetheir outputs, but wind producers (because their output is difficult topredict) and some CHP producers felt that the new rules would beburdensome for embedded generators.
Ofgem published an assessment of the effect of NETA on smallgenerators. The report, published a few months after theimplementation of the arrangements, showed that they hurt smallgenerators, though principally through a decline in power prices53.Specifically, Ofgem found that:
■ Electricity prices received by small generators fell by around 17%,somewhat less than the price decline in the overall wholesale market.Prices for CHP fell around 12%.
66
distributed generation in japan, the us, the netherlands, and the uk === 4
53. Ofgem, 2001a.
■ Costs to generators rose by 16%, mostly due to fuel costs.
■ Overall exports by small generators fell 44%.The drop for CHP wasover 60%.
■ While smaller generators were concerned about predicting theiroutput accurately, with the exception of wind generators, their actualimbalances were not much greater than for larger plants.
■ The balancing mechanism sends a strong signal to avoid imbalances.A generator supplying more power than committed output nettedonly USD13 per MWh from June to July 2001. Producing less than thecommitted output cost USD58 per MWh.This compares to an averageselling price of USD34 per MWh.
On the other hand, the Ofgem report clearly shows that the newtrading arrangements can create additional costs for distributedgenerators since:
■ Participation in the market as a generator or supplier, or both,involves large transaction costs. Many DG producers, which arerelatively small, cannot afford such costs. Thus, they are discouragedfrom participating directly in the market and are encouraged to workwith a larger supplier.
■ For all generators, imbalance comes at a price,but most existing DGsystems cannot completely control balances. Most of them are eithergenuinely variable generators (such as wind) or CHP.Their power salesto the system are dictated by customer load and heat requirements.
The report also found that the separation of distribution from the saleof electricity removed any incentive for the former distribution utility(now a “Distribution Network Operator” or DNO) to encouragelocal generation.
To further investigate the implications of NETA for DG systems, inearly 2000 the government formed the Embedded GenerationWorking Group (EGWG), comprising distributed generators andother stakeholders.The EGWG studied:
■ The role of the DNO in facilitating competition in generation.
67
distributed generation in japan, the us, the netherlands, and the uk4

■ The contribution of DG to network performance and security.
■ Charging principles for both connection and use of the distributionnetwork.
■ The role of “micro” DG.
■ The impact of DG on design and evolution of distribution network.
The central problem identified in the EGWG report, published inJanuary 2001, is the lack of incentives for DNOs to encourage DGdevelopment54. On the contrary, DNOs find DG to be an additionalcost and distraction from their main business of delivering electricityto consumers.As a consequence, DG developers face several barriers.First, they have little information about where to make an economicalconnection in the distribution network. Each DNO has its ownprocedures for applying for connection.DNOs either aren’t interestedor don’t invest in active generator or load management technologies.Since DNOs are regulated monopolies, the role of the regulator(Ofgem) is critical in changing the situation.The underlying message isthat Ofgem will need to give DNOs an incentive to take a more activerole in managing their networks in real time, much like transmissionnetwork operators.
A second key issue is the level of charges for both connection andoperation. Currently, DG pays “deep” connection charges, i.e. it paysfor not only the cost of connecting to the nearest network supplypoint, but also for network reinforcement at higher voltages. Whilethese deep charges give DG a locational price signal, they can raiseproject costs.The report proposes various compromise arrangementswhere the reinforcement costs are shared between the networkoperator (and ultimately other consumers) and the DG developer.
A third issue explored in the report regards the role of household DG,mainly micro-CHP. The main barrier is the need for the simplerconnection requirement (which applies only to PV installations) to beextended, where practical, to micro-CHP.
68
distributed generation in japan, the us, the netherlands, and the uk === 4
54. DTI, 2001a.

Finally,DNOs were found to have little information about the potentialvalue of DG in deferring expansion of distribution networks or inproviding ancillary services.The report recognises that if DG is to playa big role in the expansion of generating capacity, DNOs must be ableto give developers estimates of the benefits of DG for the network.
Most of the report’s specific recommendations are directed at Ofgem,which as the network regulator is responsible for developing thedetailed regulatory policies to address the government’s objectives.
DTI and Ofgem are jointly chairing a group to implement the EGWGrecommendations. Ofgem has identified the following priorities:
■ Amending the overall regulatory framework to facilitatecompetition in generation and ensure that embedded generatorsaren’t discriminated against.
■ Analysing the implications of growth in embedded generation.
■ Making changes to price-control mechanisms.
■ Analysing the implications of micro-generation for networkoperation.
In September 2001, Ofgem issued a consultation paper on pricecontrols and incentives for DNOs regarding embedded generationthat proposes55:
■ Encouraging DNOs to introduce shallow connection charges and toallow them to recover other costs through use-of-system charges.
■ Requiring DNOs to publish the basis for connection charges andcharges for the use of the distribution system by embeddedgenerators.
■ Requiring simple, standard connection procedures and charges formicrogeneration (i.e. household generation).
■ Requiring separate meters for electricity imported to and exportedfrom the embedded generator’s site.
69
distributed generation in japan, the us, the netherlands, and the uk4
55. Ofgem, 2001b.
■ Making additional technical information available to prospectivegenerators regarding network development needs.
A Distributed Generation Co-ordinating Group has now beenestablished to follow up on the recommendations of the EmbeddedGeneration Working Group56. In addition, the UK government hasproposed measures to: ensure that imbalance prices genuinely reflectcosts, develop new mechanisms to encourage smaller generators toconsolidate, and examine changes to NETA rules that affect smallergenerators57.
Summary
Each of the four countries considered in this chapter has their ownpolicy issues arising from their specific circumstances. Table 8summarises these issues and circumstances in terms of share ofdistributed-generation capacity, the sectors involved in market reform,and the numbers and types of distribution companies.
70
distributed generation in japan, the us, the netherlands, and the uk === 4
56. DTI, 2001b.57. DTI, 2001c.

71
distributed generation in japan, the us, the netherlands, and the uk4
DG
Cap
acity
Stat
us o
f Mar
ket
Dis
trib
utio
nK
ey D
GSh
are
(%)
Libe
ralis
atio
nC
ompa
nies
Issu
es
Japa
n3
Larg
e10
ver
tical
lyG
rid
acce
sscu
stom
ers
only
inte
grat
ed u
tiliti
es (
VIU
s)C
ompe
titio
n vs
.util
ities
The
Uni
ted
Stat
es6
Vari
es b
y st
ate
200
+ VI
Us,
Inte
rcon
nect
ion
stan
dard
s(0
-100
%)
290
0+
Envi
ronm
enta
l sta
ndar
dsm
unic
ipal
/rur
al d
istri
buto
rsM
arke
t ac
cess
Back
up p
ower
cha
rges
The
Net
herl
ands
30La
rge
and
med
ium
20 m
unic
ipal
/reg
iona
lC
HP
finan
ces
dist
ribu
tors
Clim
ate
chan
geG
rid
bene
fits
The
Uni
ted
Kin
gdom
6A
ll cu
stom
ers
12 d
istri
buto
rsC
HP
finan
ces
New
mar
ket
rule
sG
rid
bene
fits
Mic
ro-C
HP
0Ta
ble
80
Com
paris
on o
f Dis
tribu
ted-
Gen
erat
ion
Issue
s in
Jap
an, t
he U
S, th
e N
ethe
rland
s, a
nd th
e U
K

POLICY ISSUESThis chapter assesses the policy issues raised in the last chapter thatarise from distributed generation.These issues can be grouped underthe three Es of energy policy: economic efficiency, environmentalprotection, and energy security. Under the heading of economicefficiency, issues include:
■ market access, i.e. the connection of distributed generation todistribution grids and to distribution networks;
■ pricing, i.e. incorporating the benefits and costs of distributed powerin distribution network tariffs; and
■ market conditions. In the area of environment, the report considersemissions and the effect of regulations on DG technologies.
As for energy security, the report examines the implications ofdistributed generation for the diversification of fuels and reliability ofthe electricity sector.
Economic Efficiency
■ Grid Interconnection
Distribution networks traditionally have been designed to take powerfrom high voltage grids and distribute this power to end consumers.The introduction of generating capacity connected to the distributionsystem need not cause great changes to this system, provided that thecapacity does not actually send power into the network.
Once power is sent into the network, the flows of electricity will bechanged and even reversed from the normal design.This can lead to anumber of technical problems that can affect the stability of thenetwork and quality of electricity supplied.These problems include58:
■ Voltage control. Distribution network operators are normallyobliged to keep network voltages within a certain range. Electricitysent into the distribution network tends to cause an increase involtage.This can be beneficial in some instances (e.g. for some rural
73
policy issues5
58. For a detailed discussion, see Jenkins N., R. Allan, P. Crossley, D. Kirschen and G. Strbac, 2000.

networks) where operators have problems with low voltages. But in asystem operating under normal conditions, these electricity flows cancause difficulties. Difficulties can be alleviated by requiring connectionat higher voltage or by upgrading transformers for improved localvoltage control.There are related concerns with voltage fluctuationsand their potential impact on neighbouring consumers.
■ Reactive power. Depending on the type of generation, DG caneither supply reactive power or will be dependent on it.
■ Protection. DG flows can reduce the effectiveness of protectionequipment and create operational difficulties under certain conditions.For example, while customers may want the ability to operate in“island” mode (separate from the grid) during a distribution circuitoutage, restoring power to them involves important technical andsafety considerations. Protection systems are required to ensure thatDG systems are not supplying the network during outage conditionsand can be resynchronised to the grid when power is restored.
Interconnection of distributed generation may appear to be a purelytechnical issue but a number of policy concerns are involved.The lackof technical interconnection standards in the US, for example, has leda proliferation of requirements. Second, the ability of distributors todeal with distributed generation varies according to utility size andexperience. Finally, regardless of expertise, a utility may see distributedgeneration as a competitor and may impede interconnection.This isparticularly a concern for a non-liberalised system or non-liberalisedconsumers, and where vertically integrated utilities can useinterconnection requirements (or prices for backup services) todiscourage distributed generation.
The development of interconnection standards, guidelines for dealingwith interconnection requests, and procedures to help distributorsassess the effect of distributed generation on a local distributionsystem will reduce transaction costs (the full costs of interconnection)for distributors and developers. The use of national standards iscommon in Europe; these are usually stricter than the European norm(EN 50160).The US is currently considering protection standards (IEEEstandard P1547) that would reduce guesswork by utilities and DGdevelopers about the kinds of protection equipment that are needed.
74
policy issues === 5
Finally, for household generation such as household PV or micro-CHP,connection costs could be a big percentage of the cost of the system,if it must adhere to technical standards developed for large generation.If there are only a few domestic systems, technical protectionrequirements can be simplified. Obviously, the more such systemsthere are, the more complex the requirements would have to be.
■ Electricity Market Reform and Distributed Generation
Prior to electricity market reform, distributed generation in OECDcountries was carried out under a controlled situation. For generatorsnot exporting to the grid, distributed generation simply displacedpower purchased from the grid. For DG exporting into the grid, theoutput was usually purchased by the vertically integrated utility,normally under a long-term contract.The main policy issues associatedwith DG at this stage were the prices charged for backup power forancillary services, and the prices paid for exported electricity.
Market liberalisation has affected distributed generation by:
■ Increasing market opportunities by opening access to networks.
■ Increasing market complexity.
■ Placing a premium on the flexibility of a technology or system.
■ Freeing the prices of electricity and natural gas.
Market liberalisation opens access to the distribution network, thusgiving distributed generators the opportunity to sell their powerdirectly to customers. Distributed generators, therefore, have thepotential to increase competition in the supply of electricity andthereby support economic efficiency.
Market liberalisation has greatly increased the complexity of thestructure of the market, its operation, and pricing for all powerproducers, including distributed generators. Wholesale markets havebeen created, pricing has become more dynamic, and the geographicscope of markets has broadened.
75
policy issues5
While these changes have had consequences for all generators,distributed generators have been more strongly affected due to theirsmaller size and proportionately higher costs of dealing with:
■ Competition. Existing distributed generators are now competingin a geographically larger market, where generation capacity may beheld by a few, big owners.
■ Bilateral contracts. Generators are encouraged to enter intobilateral contracts with consumers to reduce exposure to volatileprices in spot electricity markets.
■ Scheduled energy dispatch. Electricity-trading arrangementshave been introduced that require generators to declare the amountof energy they export to the grid. While inability to meet thiscommitment results in penalties, excess generation has low rewards.
■ Procurement of backup power. Distributed generators mustnow purchase backup power in case of equipment failure, instead ofreceiving it at regulated rates from the distributor.
The liberalisation of electricity markets has also changed the way power-generation technologies are valued. Attributes such as shortconstruction lead times, low capital costs, flexibility in operation, andability to expand output are likely to be more greatly valued.Distributedtechnologies that have these attributes can expect to benefit.
While the reforms have greatly increased the complexity of doingbusiness, the indirect short-term effects have been even moreprofound. Electricity prices have fallen in Western Europe as a result ofexcess capacity and the increased geographic scope for tradingelectricity. Electricity prices are also falling in Japan. This has beencoupled with large increases in natural gas prices.
As a result, generators in Western Europe are under financial strain.Those dependent on gas-fired generation and the CHP industry,whichprincipally use natural gas for power generation, have been particularlyaffected. Some CHP producers have depended on revenue fromelectricity sales to ensure profitability. However, many of themconsidered these sales to be a side business.They made fewer effortsto reduce financial risk in this area than in their main business.
76
policy issues === 5

Some CHP producers have responded to market conditions by cuttingback on output or stopping CHP altogether.A few have gone bankrupt.On the other hand,CHP facilities that have been more “balanced” withrespect to heat and power generation, i.e. less reliant on revenue fromelectricity sales, have been less financially affected.The rise in prices fornatural gas has given new CHP an incentive to make more efficient useof that resource.
Despite the temporary negative effects of market liberalisation onCHP, governments have responded with concern about the need forpolicies to expand CHP, particularly programmes to provide financialrelief.The Dutch government recently agreed to provide an incentiveof EUR5.7 per MWh to CHP producers for 2001. The Germangovernment has gone further and recently passed a subsidy system forCHP electricity that will offer subsidies to existing CHP until the year2010. The cost of the German programme, estimated at EUR4.09billion, is to be recovered from consumer tariffs.
On the whole,market liberalisation is exposing all power producers tofinancial risks of the marketplace. DG producers, like the others, haveto be able to respond. In the long run, current conditions mayencourage new DG development to be more efficient and lower cost.
Regarding the inclusion of DG in the liberalised electricity market,there are,however, important issues to consider in the areas of marketstructure, market operation, and pricing. These are discussed in thefollowing sections.
■ Market Structure
Liberalisation of the retail market is vital for the economically efficientdevelopment of distributed generation. Retail liberalisation involvesaccess by producers and customers to the distribution system.WithDG as an option, customers can generate their own power inresponse to signals from the market.
If the reforms are limited to wholesale liberalisation, the distributedgenerator essentially faces the same conditions as under the monopolyregime.This might well be favourable to DG if there are obligations for
77
policy issues5

its purchase. In that case, however, the DG is unlikely to beeconomically efficient. For example, excess capacity in the Dutchmarket can at least partly be attributed to policies that encouraged thecreation of decentralised generation regardless of need.
Limited reforms might also be unfavourable to distributed generation.In some markets, only high-voltage consumers have the ability tochoose suppliers. Smaller customers must notify the verticallyintegrated utility of their intent to install distributed generation.Theutility can respond by offering to discount the regulated electricityprice in order to discourage the installation of DG.
Thus, while the liberalisation of the retail market may be a necessarycondition for development, it is not a sufficient condition to ensure thatDG receives nondiscriminatory access. Distribution companies thatcontinue to own generating capacity to supply their customers directlywill still have an incentive to discriminate against distributedgeneration. Separation of distribution from generation and retailremove this incentive to discriminate.
The inability of distributors to own and operate DG, however, mayresult in some inefficiency. For example, the operation of distributedgeneration at a transformer station to relieve distribution-systemcongestion is forbidden under the conditions of separation but may bethe most efficient solution.
■ Market Operation
Electricity trading is a central feature of liberalised electricity systems.In most OECD countries with liberalised markets, spot markets existfor the trade of wholesale electricity.Although spot electricity marketsmay furnish a small share of final customer demand, they play animportant role in setting prices and in fine-tuning the balance betweensupply and demand.
Not surprisingly, electricity-trading systems are organised to serveparticipants at the transmission level. However, the markets are not run entirely to the disadvantage of distributed generators.They offerthem a number of advantages:
78
policy issues === 5

■ A framework for accessing other market participants, customers, genera-tors, aggregators (and others) and for entering into supply agreements.
■ A potential market for ancillary services59.
■ Transmission-price unbundling, which in some markets requirescentral generators (not DG) to pay some transmission costs.
■ An ability to choose suppliers of backup power.
■ An ability to aggregate supply from a number of sites.
The New Electricity Trading Arrangements (NETA) in the UK clearlyshow how the generator can capture the benefits of distributedgeneration. The UK regulator, Ofgem, has estimated the “embeddedbenefit”, essentially the charges central generators pay that embeddedgenerators need not pay, as shown in Table 9.
79
policy issues5
Embedded Benefit London South Yorkshire North
Transmission Network Use of System charges avoided (Demand) 2.73 0.99 0.20
Transmission Network Use of System charges avoided (Generation) – 2.10 0.75 1.73
Balancing System Use of System charges avoided 1.77 1.77 1.77
Transmission Losses charges avoided 0.06 0.06 0.06
Balancing system administrative costs avoided 0.29 0.29 0.29
Avoided trading charges 0.06 0.06 0.06
Total 2.80 3.92 4.10
Source: Ofgem.
0Table 90
Estimates of “Embedded Benefit” to Distributed Generators in the UK (in USD per MWh)
59. Currently in the UK, ancillary service operations are co-ordinated centrally by the transmission system operator(TSO). In practise, there is a size limit below which certain ancillary services can be reliably monitored and co-ordinated by the TSO.While there is significant experience in contracting for reserve and frequency response, highunit costs for monitoring, metering, and communication limit the economic effectiveness of DG participating inthese markets. Aggregation of smaller DG might increase the possibilities (see Kirby, B. and E. Hirst, 2001).

80
policy issues === 5
The transmission-charging system in the UK is designed to provideincentives for central generation in areas where load exceedsgeneration (as in London) and disincentives where generation exceedsload (as in the North). However, since it doesn’t pay location-basedcharges, distributed generation has less “embedded benefit” to locatein London and greater incentive to locate in the north of England.When transmission pricing does not vary by location (so-called“postage-stamp”), there is no incentive to locate new generatingcapacity to relieve congestion.
Market liberalisation has created other costs for distributedgenerators, some of which are related to size. Participation in themarket as a generator or supplier (or both as the case may be for DG),involves large transaction costs. Many DG producers, which arerelatively small, cannot afford such costs. Thus, they are discouragedfrom participating directly in the market and are encouraged to workwith a larger supplier.
The trend toward requiring generators and loads to balance theirrequirements may particularly affect DG.The Dutch electricity tradingarrangements begun in January 2001 and the New Electricity TradingArrangements (NETA) in the UK effective as of March 2001 requiregenerators supplying power to the grid and retail suppliers takingpower from the grid to meet their forecasted output or to paypenalties for any shortfall. As an immediate result, balancing marketswere created in both countries, where producers pay high prices fortheir imbalances. Distributed generators were particularly affected bythese changes because of their relatively small size and difficulty inbalancing their output.
In the Dutch market, a rule was changed that reduced the finalcommitment time for generators to one hour from two.As a result,imbalances have declined substantially60.
In the UK market,small generator output to the grid has dropped by 44%since the introduction of NETA.The dramatic decrease may well be theprimary result of market conditions, namely, the fall in electricity prices
60. Problems with very small CHP units in the Netherlands are avoided because they are owned by “captive”customers. Distributors are obliged to buy their output regardless of balancing.

and the rise in fuel costs.However, the balancing mechanism also appearsto be a factor for plants that have difficulty predicting their output.
Distributed generators in the UK have complained that the newimbalance mechanism is discouraging new CHP and renewables,contrary to the government’s policy. However, the imbalancemechanism does reflect a real cost to the electricity system: units withvariable output will create a need for a system operator to carry alarger primary reserve. Early evidence from the NETA suggests thatsmall generators (at least those still exporting) are coping better thanexpected with the mechanism.They have not been much more variablein their output than large generators. If some of the other benefits of DG technologies – such as reducing distribution congestion orproviding ancillary services – are to be realised, the electricity systemmust be able to schedule supply to the network.
For wind in the UK market, the variability of power output is 40%-50%,very high compared with roughly 5% or less for large generators. Betterweather-forecasting software is becoming available that claims to be ableto reduce the variability between forecast and actual output to 5%-8%61.
Other simple steps could reduce considerably the exposure ofdistributed generation to imbalance markets. With shortercommitment times for output (as in the Netherlands), DG can moreeasily make better forecasts and thus reduce their imbalances.Mechanisms to encourage smaller DG producers to work togetherwould help them to reduce their net imbalances and the resultingimbalance charges, and enable them to take advantage of economies ofscale. Finally, very small producers such as household PV should betreated like variations in household loads.
■ Pricing
Prices are the key signal for influencing market behaviour. Prices aresupposed to reflect underlying demand and supply conditions atdifferent locations and at different times within the electricity system.The trend in liberalised markets is toward increasingly exposingcustomers and generators to the variability of electricity prices.
81
policy issues5
61. See Zacharias, P. and K. Rohrig, 2001.

Such pricing trends will, at least in principle, encourage the more economically efficient development of all generation,including distributed generation. Whenever there is a surplus ofgenerating capacity in the system, prices will be low, discouraging theconstruction of new power generation and the use of higher costexisting generation. Conversely, when demand is tight, price increasesprice should encourage new capacity.
Distributed generation should benefit from such pricing reform.Customer exposure to the higher costs of electricity during peakperiods encourages the development of distributed generation.Time-of-use rates in Japan are credited with the installation of cogenerationsystems that operate only during peak hours. Distributed generation,by reducing purchases from the network, is also seen as a mechanismfor reducing customer exposure to the volatility of electricity prices.
■ Pricing and Location
From the point of view of the electricity network, however, distributedgeneration offers maximum economic efficiency gains because of itsflexibility in location. A distributed generator brings value to adistribution system insofar as its location defers expansion ofdistribution assets, reduces distribution-system losses, or deliversnetwork support or ancillary services.
Location-based pricing for distributed generation falls into threecategories:
■ Connection charges. Charges for connection to the grid caninclude the full costs of connection, including location-dependentsystem upgrades.
■ Operating charges. Charges for services provided to the localnetwork, e.g. to relieve congestion, to provide voltage support, to payfor the costs of serving DG, and to reduce losses.
■ Congestion-related pricing. Tariffs paid by all load customers fordistribution services that rise or fall according to the level of congestion.
82
policy issues === 5

Connection charges, the most common type of location-based pricing,can be a large barrier to distributed generation. Some operatingcharges are an incentive to DG, particularly those aimed at reducingdistribution losses, as they are already reflected in system prices.Congestion-related pricing is not carried out at the retail level.However, in some systems distributed generators can be rewarded fordeferral of upgrades to the distribution system.
■ Connection Charges
In the UK, DG developers pay the full cost of connection, known as“deep” connection charges, up front.This approach factors in location-based prices and in principle allows for discounts to these charges forthe value of generation deferral. Partially as a consequence, DG doesnot pay any charge for use of the distribution system but also does notreceive any additional charges or credits from the distributor for lossesor ancillary services.
By contrast, in the Netherlands, DG pays only the direct or “shallow”connection costs for distribution. Distributed generators larger than10 MVA also pay costs for using the system. However, these use-of-system charges are not location-dependent. At the urging of thegovernment, distributors in the Netherlands are currently developinga tariff proposal that would reward DG for contributions to thesystem (e.g. in reducing losses).
There are advantages to both systems. The UK system sends astronger “locational” signal but can be a barrier for DG, as connectioncosts can amount to a large percentage of installation costs.Furthermore, an upgrade usually allows more than one DG on thesystem. Subsequent DG may not need to pay and can “free ride”,arguably distorting competition with the first-comer62. The Dutchsystem, while encouraging DG entry, presents the opposite problem.
83
policy issues5
62. The French system is a hybrid of the UK system. It has deep connection charges but allows a DG to collectrevenues from subsequent DG installations that benefit from the upgrade.
The lack of a locational price signal can lead to overinvestment that hasto be recovered from all customers, not just those benefiting fromDG63.
The position of distributed generators stands in contrast with that ofhigh-voltage “central” generators. Central generators typically do notpay “deep” costs for connection, even though one or more of themmay require a major upgrade to the transmission network. Increasingly,however,transmission system charges are including locational signals toencourage generators to locate closer to loads.
In both the UK and the Netherlands, distribution systems are obligedto provide non-discriminatory access to generators and to consumers.In addition, in the UK, the Utilities Act gives distributors a duty topromote competition. In both countries, distribution-networkoperators tend to be neutral overall and indifferent about offeringlocational information that would assist developers in choosing sitesfor distributed generation.
A compromise between “deep” or “shallow” approaches thatencompasses the efficiency of location-based connection pricing and“competitive neutrality” (non-discrimination between central anddistributed generation, and greater competition among participants)might consist of the following:
■ Distributors provide detailed information about distributioncapacity and identify areas of congestion, to accommodate DG atvarious points in the network.
■ New DG pays “shallow” connection charges up front.
■ Additional expenditures by the distributor to accommodate a DGproject are recovered from both DG and all loads though systemcharges.The share attributed to the DG project is reduced if more DGis connected that can use the upgrade.
84
policy issues === 5
63. The small size of the Netherlands is, of course, a factor in the decision to use postage-stamp pricing.
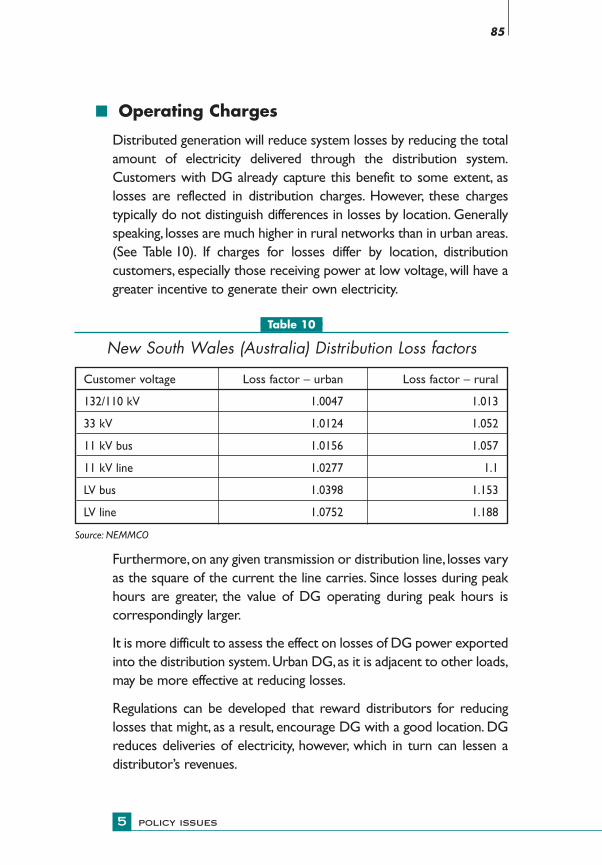
■ Operating Charges
Distributed generation will reduce system losses by reducing the totalamount of electricity delivered through the distribution system.Customers with DG already capture this benefit to some extent, aslosses are reflected in distribution charges. However, these chargestypically do not distinguish differences in losses by location. Generallyspeaking, losses are much higher in rural networks than in urban areas.(See Table 10). If charges for losses differ by location, distributioncustomers, especially those receiving power at low voltage, will have agreater incentive to generate their own electricity.
Furthermore,on any given transmission or distribution line, losses varyas the square of the current the line carries. Since losses during peakhours are greater, the value of DG operating during peak hours iscorrespondingly larger.
It is more difficult to assess the effect on losses of DG power exportedinto the distribution system.Urban DG,as it is adjacent to other loads,may be more effective at reducing losses.
Regulations can be developed that reward distributors for reducinglosses that might, as a result, encourage DG with a good location. DGreduces deliveries of electricity, however, which in turn can lessen adistributor’s revenues.
85
policy issues5
Customer voltage Loss factor – urban Loss factor – rural
132/110 kV 1.0047 1.013
33 kV 1.0124 1.052
11 kV bus 1.0156 1.057
11 kV line 1.0277 1.1
LV bus 1.0398 1.153
LV line 1.0752 1.188
Source: NEMMCO
0Table 100
New South Wales (Australia) Distribution Loss factors

In some locations, DG can be helpful in furnishing voltage support.Regulatory incentives to improve the quality of electricity supply canencourage distributors to reward DG for this service.
■ Congestion Pricing
The way to efficiently relieve distribution congestion is obvious, inprinciple:All load customers would pay a congestion-dependent tarifffor distribution services. Customers in a congested system areencouraged to reduce their demand, either through a demand-sidemeasure or through the installation of their own generation. Powerexported into the distribution system from customers that reducecongestion would be rewarded by higher prices. Such a pricing systemwould provide the right incentives to DG.
Such a system may be difficult to put into practice. There has beengreat reluctance to expose electricity consumers to congestioncharges, even at the transmission level, for equity reasons.Furthermore, it remains to be proven whether the systemic benefitsfrom congestion-based prices exceed the costs.
Without such a pricing system, the distribution-system operatorremains the key entity in managing congestion on the system andattempting to do so at least cost. The distributor, given regulatoryincentives to carry out this task,will find it profitable to pay a customerto supply electricity (or reduce demand) during congested periods.While upgrades to the distribution system can be made more quickly(1-3 years) compared with transmission upgrades, so can upgrades toDG systems, particularly at a site already containing DG.
■ Net Metering
In developing policies to promote some distributed technologies, thereis a temptation to modify the design or operation of the electricitymarket to increase the penetration of DG technologies.Net metering,which pays small generators retail electricity prices for power suppliedto the local grid, is an example of a support policy sometimes offeredto household customers producing power with PV.
86
policy issues === 5

Such approaches forgo economic efficiency and can distort markets. Ina fully liberalised electricity market, small generators – whether PV ormicro-CHP – should be able to choose their retailers or consumers.The local distributor, depending on the market design, then may nolonger be in the business of purchasing electricity for sale toconsumers but instead of raising revenue on the amount of electricitydelivered.
The Embedded Generation Working Group in the UK identified anumber of problems with net metering, such as the effect ondistributor revenues,and examined ten different metering and chargingoptions64.The report concludes that the issue of net energy tariffs iscomplex and needs a detailed cost-benefit analysis.
Price signals are a logical way to encourage DG developers to locatetheir plant efficiently and discourage them from locating where theywould place additional costs on the system. Deep connection charges,as in the UK, are an example of such pricing.
However, such prices must also consider other factors besideseconomic efficiency gains. Competitive neutrality may be impaired ifefficient pricing rules are applied to DG and not central generators.There is an inequality, for example, if distributed generators are liablefor all of the costs of upgrades to the distribution network incurred bytheir connection but if generators connecting at high voltage are not.Furthermore, the costs and complexity of putting into place an ideallocation-based pricing may exceed the benefits. Finally, the social equityaspects of pricing must also be considered. Location-based pricing, inparticular, is likely to result in higher tariffs for rural consumers.
Environmental Protection
Distributed generation embraces a wide range of technologies with awide range of emissions. For fossil-fired distributed technologies, thereare two key areas of concern: NOx emissions on local and regional airquality, and greenhouse-gas emissions on climate change.
87
policy issues5
64. EGWG Report, Annex 5,“Options for Domestic and Other Micro-Scale Generation”.

■ Air Quality
Figure 6 summarises the NOx emissions from different technologies inkg per MWh generated.The first point to note is that NOx emissionsamong DG technologies vary by a factor of 2 000 from fuel cells (atthe low end) to diesel power (at the top) partly due to differences indesign (for fuel cells) and partly because of the large reductions inemissions that can be achieved from emissions-control technologies.Emissions control by Selective Catalytic Reduction (SCR) increases incost per kW as size decreases. It is prohibitively expensive for a smallerplant.
0Figure 60
NOx Emissions from Distributed-Generation Technologies (kg/MWh)
88
policy issues === 5
0.005 0.01 0.05 0.18 0.23 0.27 0.27 0.50 0.62 1.00
2.13
9.89
0.000
2.000
4.000
6.000
8.000
10.000
12.000
SOFC
PAFC
CCGT/SC
R
Microtu
rbine
Gas en
gine/
cat.
Large
SCGT
Medium
SCGT
Small
SCGT
Coal/S
CR
Lean G
as En
gine
Diesel
/SCR
Diesel
NO
x (k
g/M
Wh)
Notes: SCGT = simple cycle gas turbine, SOFC = Solid Oxide Fuel Cell, PAFC = Phosphoric Acid Fuel Cell, Lean Gas engine =lean fuel mixture gas engine, Gas engine/cat. = Gas engine with three-way catalyst, /SCR = with selective catalyst (NOx)reduction technology, Source: RAP 2001 (www.rapmaine.org), except Coal/SCR from new US EPA Standard (0.15 lb./mmBTU)assuming net efficiency of 37% (including transmission and distribution losses). Assumed CCGT efficiency of 51% includestransmission and distribution losses.

Diesel stands out as a high NOx-emitting technology. Even when fittedwith selective catalytic reduction (SCR) emissions control, itsemissions are higher than for a similarly equipped central coal-firedstation.
In general, for electricity systems with a large share of coal-firedelectricity and with advanced NOx control, NOx emissions will bemuch higher than for a gas engine. In these cases, the installation of gas-fired DG can reduce NOx emissions. Gas engines require some formof emissions control (such as three-way catalysts similar to those oncars) to bring their emissions below those of a coal plant with SCRcontrol.
Except for fuel cells, none of the fossil-distributed technologies canmatch the NOx performance of a combined-cycle gas turbineequipped with SCR control, even when operating as a CHP plant65.
The emissions of NOx from distributed generation are attractingincreased environmental regulatory attention. In Japan, nationalemissions standards for diesel engines are high enough to permit theirinstallation. In larger cities, stricter limits apply that effectively eliminatediesels from consideration (see Table 11).
89
policy issues5
National NOx limit Tokyo NOx
(ppm at 0% O266) limit (ppm)
Gas Turbine 294 100
Diesel Engine 2 493 300
Gas Engine 600 200
Source: Japan CGC, 2001.
0Table 110
Japanese NOx limits on Cogeneration Systems
65. See Kaarsberg,T. J. Bluestein, J. Romm, and A. Rosenfeld, 1998.66. For comparison with ppm at 15% O2, multiply by 0.28. Thus, the regulated level for gas turbines in Tokyocorresponds to 28 ppmv at 15% 02.This compares with the California figure for turbines of 0.23 kg per kWhoutput which is based on 9 ppmv at 15% O2.
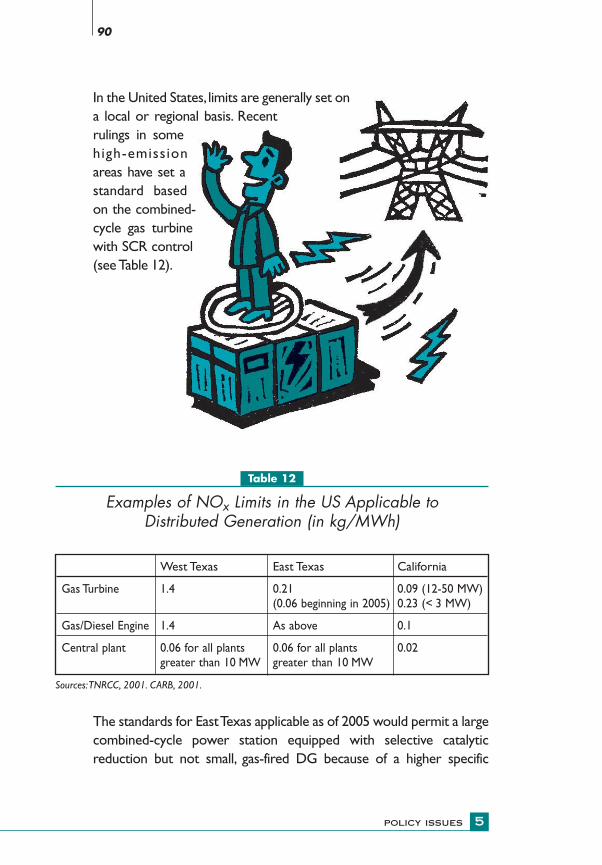
In the United States, limits are generally set ona local or regional basis. Recentrulings in somehigh-emissionareas have set astandard basedon the combined-cycle gas turbinewith SCR control(see Table 12).
The standards for East Texas applicable as of 2005 would permit a largecombined-cycle power station equipped with selective catalyticreduction but not small, gas-fired DG because of a higher specific
90
policy issues === 5
West Texas East Texas California
Gas Turbine 1.4 0.21 0.09 (12-50 MW)(0.06 beginning in 2005) 0.23 (< 3 MW)
Gas/Diesel Engine 1.4 As above 0.1
Central plant 0.06 for all plants 0.06 for all plants 0.02greater than 10 MW greater than 10 MW
Sources:TNRCC, 2001. CARB, 2001.
0Table 120
Examples of NOx Limits in the US Applicable to Distributed Generation (in kg/MWh)

emissions rate.The California standard does show sensitivity to size.Both Texas and California, in estimating emissions, use output-basedstandards that give full credit to the useful energy output of a CHPplant.
■ Greenhouse-Gas Emissions
Carbon-dioxide emissions from fossil DG technologies are shown inFigure 7.
0Figure 70
CO2 Emissions from Distributed-Generation Technologies (in kg/MWh)
The figure shows that all fossil-fired DG technologies that operatewithout heat recovery have higher carbon-dioxide emissions67 thanthe combined-cycle plant and somewhat lower emissions than the coalplant.Therefore, increased use of fossil DG will result in a reduction in
91
policy issues5
352431
489 503581 602 624 650 650 678
724
909
0
100
200
300
400
500
600
700
800
900
1000
CCGT/SC
R
SOFC
PAFC
Lean G
as En
gine
Large
SCGT
Medium
SCGT
Gas en
gine/
cat.
Diesel
/SCR
Diesel
Small
SCGT
Microtu
rbine
Coal/S
CR
CO2
(kg/
MW
h)
Notes/sources: same as previous figure.
67. Fuel-cell emission rates come from use of natural gas as the source of hydrogen.

greenhouse-gas emissions, if the DG is displacing coal-fired electricityor if the DG is a CHP system.
Assessing the greenhouse-gas emissions from CHP is complex. Thecomplexity arises from assumptions about what type of electricity andheat production the CHP unit is replacing. A UK study estimated that domestic CHP with an overall efficiency of 67% (19% electricity)reduced CO2 emissions by 41% in 1999, assuming that it displaced thecurrent mix of generating capacity and boilers.However,the savings are20% assuming that the CHP displaces only new gas-fired generationand gas-fired boilers68. Calculating emissions savings from CHP isexplained in detail in Annex I.
With improvements in central station efficiency (with new gas-turbineplants claiming efficiencies of up to 56%69), CHP schemes will reducegreenhouse gas emissions, provided that:
■ They use low (or no carbon fuels) such as natural gas, renewables,or waste fuels (e.g. refinery gas).
■ When they use natural gas, they achieve a high overall efficiency.
Policies and measures that encourage higher efficiency in the use ofdistributed generation (e.g. through CHP) or upgrading of outdatedCHP facilities can reduce total greenhouse gas emissions. One set ofsuch policies is the “good quality CHP” measures in the UK (see AnnexI). Measures should be designed so that distributed generators areencouraged to reduce their emissions. In particular, the use ofeconomic instruments (such as carbon-emissions trading) wouldencourage DG operators to design and operate their facilities tominimise emissions of greenhouse gases.
Energy Security
The implications of distributed power for energy security take twoforms: first, on the diversification of primary energy supplies andsecond, on the reliability of electricity supply.
92
policy issues === 5
68. DTI, 2000.69. 60% before accounting for transmission and distribution losses.
■ Energy Diversification
The impact on primary fuels depends on the technology used indistributed generation. The use of photovoltaic systems results indiversification of supply away from fossil fuels. Most of the othertechnologies rely directly or indirectly (in the case of fuel cells) onnatural gas. Given that much of the new investment in generatingtechnology is directed toward natural gas, the effect of distributedgeneration on supply diversity is limited. CHP is seen to contribute toenergy security because its higher fuel efficiency results in loweroverall fuel consumption.
Japan is a possible exception, since much of its DG capacity is oil-fired.Enlarging DG capacity will, in principle, increase Japan’s dependence onoil. Less than 2% of all power generation is currently DG, however, sothe impact on energy security currently is very limited.
■ Electricity-System Reliability
The reliability of the electricity system can be enhanced by distributedgeneration.The availability of standby generators in tight US electricitymarkets in the summer of 2001 helped reduce the risk of blackouts.Better integration of standby resources into system operations canfurther enhance the electricity system’s security of supply.Furthermore, the use of distributed generators at selected locationshelps distributors overcome local bottlenecks in the distributionsystem. Increased distributed generation could reduce demand fortransmission and thereby increase margins on transmission lines.Ultimately, a power system based on a large number of reliable smallgenerators can operate with the same reliability and a lower capacitymargin than a system with equally reliable large generators70.
The main potential negative effect of distributed generation is anincreased need for regulating (backup) power.This additional backupcapacity will be needed if the DG technologies cannot be centrallycontrolled because of natural variability (wind and PV) or because of
93
policy issues5
70. Hoff,T., H.Wenger, C. Herig and R. Shaw, 1997.

operating characteristics (e.g.CHP where power output is matched toheat demand). Power systems with a larger share of these resourcestend to increase transmission requirements, if reserve power is mosteconomically available through interconnection with neighbouringsystems.
The Danish transmission and distribution network illustrates botheffects.The implementation of policies to favour wind power and CHPin the Danish system has reportedly led to a increased investment inthe lower voltages (10 kV and 60 kV) but reduced loading on the132 kV and 150 kV systems. However, the high-voltage system(400 kV) is being expanded in part to meet increased load and partlybecause of the need for greater regulating power that CHP and windare unable to provide71. Interconnection with neighbouring countriesin Nordel eases the problem because it provides access to powergeneration that can respond in real time. Nevertheless, a Nordelreport has identified the expansion of wind and CHP as a designconcern that it is studying72. The report notes that a big expansionoptimally will require more than one network regulator to achievebalancing regulation throughout the system, given existing flowconstraints.The report suggests that “distributed network regulation”,where subareas of Nordel each have their own regulator, may beneeded73.
Summary
How does distribution generation measure up against the three Es ofeconomic efficiency, energy security, and environment? It is difficult togeneralise when discussing such a wide range of technologies with awide range of characteristics. Regarding economic efficiency, thedecision to build distributed generation is largely an issue for anindividual customer.The policy issue is principally to ensure that thecustomer has access to markets – through retail liberalisation – andsuitable price signals – from grid pricing.As for energy security, there
94
policy issues === 5
71. See CIGRE, 1999.72. See Nordel 2000.73. Increased use of large energy-storage technologies (such as compressed air storage or large regenerative fuelcells known as “flow batteries”) may be part of the solution to this problem.

is a small concern about the increased use of gas (or fuel oil) in powergeneration. This issue is offset, however, by the enlarged generationcapacity of systems with a larger share of DG. Regarding theenvironment, while distributed generation as a whole does not haveclear benefits compared with the best-performing new plants, unless ituses CHP, it may do so compared with the existing mix of generatingcapacity. Environmental policies related to DG need to keep both ofthese aspects in mind.
95
policy issues5

FUTURE OF DISTRIBUTEDGENERATION IN ELECTRICITYNETWORKS
Generation Technology Research andDevelopment
The wide range of potential applications and favourable governmentpolicies for CHP and for renewables is likely to ensure a greatermarket share for distributed generation over the next decade. Oneestimate suggests that distributed generation worldwide could accountfor 7%-14% of total additions to generating capacity through increaseduse in, e.g. industrial cogeneration, microgeneration, and decentralisedpeaking units.
For DG to grow by this amount, the cost of technology has to decline.Substantial private and some government efforts aim at reducing thecosts of a variety of DG technologies, particular fuel cells andphotovoltaic systems. Improvements to fuel efficiency and declines inthe capital cost of microturbines are needed to greatly enlarge theirmarket, since natural gas prices are expected to rise in the future.Research continues on improving the efficiency of engines.
The more established technologies, engines and gas turbines, also mayto be developed further to enhance environmental performance, giventhe trend toward tighter NOx emissions standards. Research anddevelopment may need to focus on low-cost NOx controls.
As for CHP development, there are two promising areas for furtherR&D:
■ Less expensive, smaller absorption-cooling equipment.Themarket for cooling and power generation in commercial buildings ispotentially large. To date, the higher capital cost and larger size ofabsorption-cooling equipment has limited its penetration.
97
future of distributed generation in electricity networks6

■ Adjustable power CHP. Market liberalisation is putting a greaterpremium on generating output that can respond to changing systemconditions. CHP whose power can be adjusted could be a profitabletechnology as retail electricity markets develop.
The increased demand for uninterrupted power supplies could makeenergy-storage technologies (such as flywheels) important comple-mentary technologies.
Implications for Electricity Network Design
How might the electricity system evolve if distributed generation anddistributed power play a larger role? For example, if micro-CHPtechnologies or fuel cells become successful,what changes to the localdistribution network will be required? As mentioned in theintroduction, increased distributed power may be the third generationof electricity reform.While the first generation created independentpower producers that sell power to utilities and the second createdwholesale and retail markets, the third generation may involve powergenerated directly at the sites of customers.
The third generation may evolve in three distinct stages74:
■ Accommodation. Distributed generation is accommodated intothe current market with the right price signals. Centralised control ofthe networks remains in place.
■ Decentralisation. The share of DG increases. Virtual utilitiesoptimise the services of decentralised providers through the use ofcommon communications systems75. Monitoring and control by localutilities is still required.
■ Dispersal. Distributed power takes over the electricity market.Microgrids and power parks effectively meet their own supply withlimited recourse to grid-based electricity76. Distribution operatesmore like a co-ordinating agent between separate systems rather thancontroller of the system.
98
future of distributed generation in electricity networks === 6
74. See, for example, Lougheed, J. 2001.75. See, for example, Bitsch, R. 2000.76. See Hoff T., H.Wenger, C. Herig, and R. Shaw, 1997.

This report is concerned mainly with the first of these three stages:how to accommodate distributed generation in the existing liberalisedenergy market. However, if the cost of generating capacity falls sharplyas a result of greater use of DG, the market may move towardsdecentralisation and even dispersal.
There are already some signs of decentralisation.Technology is alreadybeing used to run emergency generators at customer sites. Thistechnology enables a company, acting like a virtual utility77, to controlboth individual customer loads and generation at several sitessimultaneously through the Internet. Distribution planning studies arebeginning to take distributed generation into account78.
The integration of large numbers of distributed generators supplyingpower directly into distribution networks is more challenging andrequires additional research. The operation and control of adistribution network of this type is different than that of a networkwith a few generators.The distribution network operator of the futurewill need the ability to:
■ optimise the operation of the system to supply power and ancillaryservices, and to minimise losses; and
■ protect the system against faults in the individual generators.
The system operator will need to do so for complex systems, whichmay comprise very flexible elements that can be co-ordinated andcontrolled locally. These elements may include wind power and PVsystems, both of which are highly variable, and increased use of CHP,whose electric output varies with heat demand79.
Even if networks are managed in a decentralised way, for example,withindividual customers responding to the needs of the local network,they will require a greatly increased flow of information to ensuresmooth operation of the system.The distribution utility of the futurewill need to be in a position to provide information, and to monitorand control its own system in a more sophisticated manner.The firststep is development of hardware and software for the more
99
future of distributed generation in electricity networks6
77. See, for example, Cohen, D. 2001.78. See Peco J. and T. Gomez, 2000.79. Handschein, E. 2001.

sophisticated monitoring and operational control over the distributionsystem. This would include increased control and co-ordination of DG operations through the distribution system, associatedcommunications devices, more elaborate protection systems toaccount for the presence of distributed generation, and moresophisticated metering. As distributed generation increases its share of total power generation, the design specifications of distributionsystems will need to evolve, just as the capabilities of other networkindustries such as telecommunications have had to develop. Researchefforts such as the Dispower project for the European Commission isaddressing these issues80.
Therefore, a much more sophisticated institution will be needed in thefuture to manage the distribution of electricity.Distribution companieshave already drastically evolved from simply providing electricity at aregulated price to supplying “distribution network services” toelectricity consumers. However, the change to a company that iscapable of actively managing a large number of generators on theirnetwork is even larger step.
The emergence of decentralised systems also requires energy-serviceproviders acting as virtual utilities. In principle, these entities may simplyoperate and manage a co-ordination service of distributed energyresources owned by several customers. They are also potentiallyvehicles for building, owning, and operating generating assets atcustomer sites.The build-own-operate model has been successfully inthe development of distributed generation in Japan. It has theadvantage of allowing the customer to avoid the complexities and thefinancial risks involved in developing their own power-generationassets. Thus, the “virtual utility” becomes in many respects a “real”entity that uses its superior financing capability to develop thedistributed resource market more rapidly than otherwise would bethe case.
100
future of distributed generation in electricity networks === 6
80. EC Research, 2001.

CONCLUSIONS ANDRECOMMENDATIONS
Distributed generation already represents a small but important shareof power generation in the OECD. Diesel engines make up much ofthe installed generating capacity of distributed generation but little ofits power generation. Combined heat and power technologies alreadymake a substantial contribution to total power production in severalOECD countries. A small number of remote OECD electricityconsumers are supplied by decentralised grids.Worldwide demand fordistributed power generation capacity in 2000 was 7% of total orders,which is small but greater than new construction of nuclear generatingcapacity.
Distributed generation is expected to play a greater role in OECDpower generation over the next decade.There is a growing interest bypower consumers to install their own generating capacity to:
■ Take advantage of the flexibility of DG technologies to producepower during favourable times and to expand output readily inresponse to increased requirements.
■ Use existing emergency or standby generators to supply powerduring peak periods.
■ Supply heating and cooling needs, and sell electricity.
■ Improve the reliability and quality of power consumed.
Concerns about reliability can drive the purchase of DG capacity, ifnetwork reliability is insufficient for a customer’s needs.While this kindof capacity contributes little to overall electricity production, it isexpected to become an increasingly important source of peak supply.In this way, distributed generation will contribute to the security ofelectricity supply. However, the introduction of increased wind andCHP systems may increase the need for reserve capacity.
Combining heating, cooling, and power generation is proving to be animportant niche for distributed power, aided in some countries by
101
conclusions and recommendations7
favourable policies. As long as effective use of heat generation isensured, CHP also has the advantage of reducing greenhouse-gasemissions, compared with conventional fossil power and heatgeneration. Much of the growth of CHP will be driven by favourablegovernment policies. Additional research and development work isrequired to improve environmental performance and reduce the costsof some technologies.
There are hundreds of thousands of electricity customers in theOECD in remote communities served by distributed generation.Theseconsumers cannot enjoy the benefits of electricity-marketliberalisation. One option to increase competition and thus reduceenergy costs in these communities is to encourage these consumers,through pricing policies that include the full cost of generation, togenerate their own electricity and supply their local community.
Retail market liberalisation will play the key role in opening upeconomically efficient development of distributed generation in thelonger term, by giving consumers access to the distribution system.Structural reform will leave the distributor indifferent rather than incompetition with distributed generation. Unbundled pricing will makeit possible, at least in principle, for a distributed generator to capturethe value it brings to a distribution system and to pay the costs itimposes.
Conversely, distributed generation promotes retail marketliberalisation by giving power consumers additional options for powersupply and creating more competitive power producers.
So far, the opening of electricity markets has hurt distributedproducers in some markets. Some problems are related to increasedtransactions costs, which affect smaller producers more than largerproducers.However, the main problem has been an increase in naturalgas prices and a fall in electricity prices. Some governments haveestablished programmes to support CHP producers that were affectedby liberalisation.
Many institutional and regulatory barriers continue to thwart the fulldevelopment of distributed generation:
102
conclusions and recommendations === 7

■ In many OECD jurisdictions, partially liberalised markets leavedistributed generation, due to a lack of legal access to the distributiongrid, in competition with the utility.
■ The lack of standards for connection of smaller distributedgeneration increases transaction costs for distributor and distributedgenerator.
■ The variation in capabilities of distribution companies.
■ The lack of incentives for distribution companies to encourage DGand power exports to the grid that reduce system costs.
■ Emissions regulations that are overly demanding for small sources.
Reforms to OECD electricity markets, therefore, need to ensure thatdistributed generators can obtain access to local electricity grids anddo not compete with the distribution company for supply. Regulatorswill play a key role in ensuring that distributors, instead ofdiscriminating against distributed generators, are rewarded when theyencourage distributed generation that reduces distribution networkcosts. Standardising interconnection rules would reduce transactioncosts.
The benefits of distributed generation to grids are specific to locationand difficult to quantify. While location-based pricing is increasinglyused for central generation, it is not yet practised for distributedgeneration. If distributed generators are to be encouraged to locatesuitably, distributors will need to make information available on moresuitable locations. Distributors in turn will need regulatoryencouragement to improve their performance at least cost, and so berewarded when additional distributed generation reduces systemcosts.
When compared with the existing mix of generating capacity in mostOECD countries, both renewable and CHP distributed-generationtechnologies offer environmental advantages. However, fossil-fireddistributed technologies not using CHP, or even those using CHP andnot using natural gas as fuel,will generally have higher specific emissionsof both greenhouse gases and nitrogen oxides compared with large
103
conclusions and recommendations7

combined-cyle gas generation technologies. Environmental regulationsneed to take into account that small is not necessarily beautiful, andaccommodate more efficient technologies such as CHP. Standards are very useful in encouraging the uptake of more efficient CHPtechnology. Economic instruments such as taxes or emissions permitscan give all generating technologies incentives to reduce emissions.Internalising the external cost of pollution (e.g. through taxation) alsowill result in a more optimal mix of electricity production.
In developing policies to promote some distributed technologies, thereis a temptation to modify the design or operation of the electricitymarket. The difficulty with such approaches is that they reduceeconomic efficiency in the operation of the power system and thusincur costs that might otherwise have been avoided. Given thatdistributed generation comprises heterogeneous technologies,changing electricity market rules for them on environmental groundsalone is inappropriate. However, other mechanisms can and have beenimplemented to further raise the share of “environmentally benign”distributed-generation technologies in total power generation.
It is difficult to estimate the current level of DG capacity in OECDelectricity markets because of a lack of national statistics. Distributedgeneration tends to be invisible to policy makers except where it isbeing supported for other purposes, e.g. the environment. Good dataabout distribution generation will become necessary as it begins toplay an important role in electricity markets.
Over the long haul, changes are needed to the design of distributionsystems to accommodate distributed generation. Simply put,distribution companies need to become more sophisticated.Distribution systems must be capable of accommodating two-wayflow, and have greater communications and control capabilities. Theskills required to operate and manage a distribution system willbecome correspondingly more complex. Such technical andinstitutional changes technically would make feasible a moredecentralised electric power system.
104
conclusions and recommendations === 7

Recommendations
■ Market Access
■ Liberalise electricity markets to ensure access to the distributionsystem by distributed generators.
■ Separate distribution network operations from the competitivebusiness of retail supply.
■ Standardise interconnection rules for distributed generation.
■ Market Organisation
■ Where feasible, establish wholesale-market trading arrangementsthat allow distributed power to participate in the provision of energy,reserve, or ancillary services.
■ Ensure that wholesale-market trading arrangements have effectivemechanisms that can help smaller generators participate in thesemarkets.
■ Consider developing the technical capabilities of distributionnetworks to accommodate greater proportions of distributedgeneration.
■ Pricing
■ Consider location-based pricing for transmission to give incentivesto generators, including distributed generators, to locate closer toloads.
■ Consider location-based pricing for distribution that:
• provides incentives to distributors to connect distributed generationwhen it reduces overall distribution costs;
• rewards distributed generation where it can help relievetransmission or distribution congestion, reduce losses, or providesystem services; and
• avoids using grid pricing as a way to subsidise distributed generation.
105
conclusions and recommendations7

■ Recover grid reinforcement costs for distributed generationthrough use of system charges rather than connection fees.
■ Ensure that prices for services such as balancing reflect costs for allgenerators.
■ Consider pricing electricity for remote consumers that includes thefull cost of generation, to encourage efficiency and the development ofself-generation.
■ Environment
■ Consider both size, and short-term and long-term impacts whenregulating air emissions from distributed generation.
■ Consider including distributed generators in policies and measuresto reduce greenhouse-gas emissions, to encourage them to improvetheir fuel efficiency or use renewable fuels.
■ Develop policies to encourage consumers in off-grid systems todevelop their own power generation.
■ Consider that policies that promote the use of CHP are likely toimprove efficiency and reduce emissions.
■ Energy Security
■ Develop policies, which include emissions limits, to ensure thatstandby-power generators can access markets.
■ Research and Development
■ Focus distributed generation R&D on:
• Decreasing costs and reduced emissions from generation.
• Increasing the flexibility of electric output from the operation ofCHP plants.
• Evaluating the impact of increased DG on design requirements fordistribution systems.
106
conclusions and recommendations === 7
■ Other
■ Develop and collect statistics on distributed generation.
107
conclusions and recommendations7

ANNEX I
Comparing Energy Consumption andEmissions from On-site CHP andConventional Heat and Power Generation
■ Introduction
Several IEA countries have specific policies to promote combined heatand power (CHP) generation as a way to save energy and to reduceemissions, particularly of carbon dioxide. One question that inevitablyarises is : how much are fuel consumption and emissions reducedcompared with heat supply by conventional boilers and electricitysupply from grid-based electricity.
The answer to this question involves making assumptions about thetechnologies displaced by the CHP plant.The choice of technologiesmay well be guided by consideration of short-term versus long-termperspectives. For example, it would be reasonable to assume that, inthe short term, a CHP plant would replace boilers that are currentlylocated at the site (but remain available for backup purposes) as wellas the current average grid electricity.A longer-term perspective mightassume that a general policy to promote CHP plant would displacenew conventional generation (e.g. combined-cycle gas turbines) andnew boilers.
This annex presents simple formulae for comparing fuel consumption,and CO2 and NOx emissions from on-site CHP facilities with powersupply from the grid and heat production from a boiler.Two examplesusing data from other research (DTI, 2000 and Kaarsberg et al., 1998)illustrate the use of the formulae.A third example, examining diesel-fired CHP in India, shows large potential for CHP savings in powersystems in developing countries. Finally, there is a brief discussion ofdifferent methods of allocating emissions between power and heat.
109
annex i
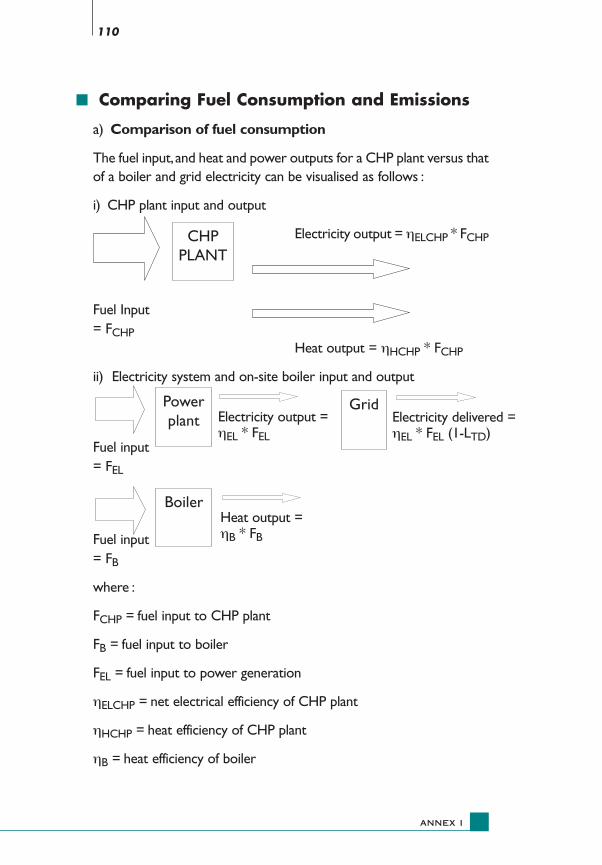
■ Comparing Fuel Consumption and Emissions
a) Comparison of fuel consumption
The fuel input,and heat and power outputs for a CHP plant versus thatof a boiler and grid electricity can be visualised as follows :
i) CHP plant input and output
Electricity output = ηELCHP * FCHP
Fuel Input = FCHP
Heat output = ηHCHP * FCHP
ii) Electricity system and on-site boiler input and output
Fuel input = FEL
Fuel input = FB
where :
FCHP = fuel input to CHP plant
FB = fuel input to boiler
FEL = fuel input to power generation
ηELCHP = net electrical efficiency of CHP plant
ηHCHP = heat efficiency of CHP plant
ηB = heat efficiency of boiler
110
annex i ===
CHPPLANT
Powerplant Electricity output =
ηEL * FEL
GridElectricity delivered = ηEL * FEL (1-LTD)
BoilerHeat output = ηB * FB

ηEL = net electrical efficiency of electricity generator
LTD = transmission and distribution losses of grid electricity
To produce the same quantity of electricity and heat, the deliveredelectricity from the grid must equal the electricity produced by theCHP plant and the heat produced by the boiler must equal the heatproduced by the CHP plant, i.e. :
ηEL * FEL (1-LTD) = ηELCHP * FCHP
and
ηB * FB = ηHCHP * FCHP
Then the ratio of fuel consumed by separate heat and electricitygeneration versus CHP is given by :
Fuel consumed by grid power and boiler (FEL + FB)
Fuel consumed by CHP (FCHP)
= ηELCHP + ηHCHP
ηEL * (1-LTD) ηB
> 1 for the CHP to save energy compared with separate systems
b) Comparison of emissions
Calculating the emissions of NOx or CO2 from the CHP plant isrelatively straightforward.
Emissions for the ith pollutant (e.g. NOx or CO2) from CHP = EFiCHP * FCHP(GJ)
Where EFiCHP is the emissions of a particular pollutant per unit of fuelinput to the CHP plant (g/GJ).
Comparing emissions is somewhat more complicated since differentfuels and emissions control technologies (for NOx) can result in largechanges in the emissions factors and hence the results. Nevertheless,one can calculate the ratio:
Emissionsi (separate) =
EFiEL * ηELCHP EFiB * ηHCHP
Emissionsi (CHP) EFiCHP * ηEL * (1-LTD) EFiCHP * ηB
> 1 for the CHP to save emissions compared with separate systems
111
annex i
+

Note that for CO2 emissions, if the input fuels are the same for CHPplant, boiler and grid electricity, the ratio of emissions equals the ratioof fuel consumption.However, for NOx emissions,even when the samefuel is used for all three processes, emission factors are differentbecause of different NOx control technologies.
■ Examples
CO2 Emissions from CHP Compared with Displaced GridElectricity and Boiler Emissions in the UK
The UK Department of Trade and Industry has analysed the carbon-dioxide emissions from UK CHP plants and compared them with theaverage UK fossil grid and UK boiler emissions displaced (see DTI,2000).The DTI analysis assumes that only emissions from fossil-firedpower stations are displaced at the current mix.They estimate that thefossil mix (including coal, gas and oil) has an average efficiency(accounting for losses) of 38.7% with average CO2 emissions per unitof electricity output (= EFCEL/ηEL * (1-LTD)) of 183 gC/kWh. Theboiler mix (which includes oil and coal as well as gas boilers) has anaverage efficiency of 75% with average emissions per unit heat output(= EFCB /ηB) of 81 gC/kWh.The average emission factor for CHP is43.3 gC/kWh. This is a relatively low value as approximately one-quarter of CHP production in the UK is from waste or renewablefuels,which are considered to have zero greenhouse-gas emissions.Theelectric efficiency is 18.4% and heat efficiency is 49.2%. Relative energyconsumption is :
Fuel consumed (separate) = 18.4%/37.7% + 49.2%/75% = 1.13Fuel consumed (CHP)
In other words, energy consumption is 13% higher when the powerand heat are generated separately than by CHP, implying fuel savings ofapproximately 11% when CHP is used.
For carbon emissions :
Emissions (separate) = 183 * 0.184/43.3 + 81*0.492/43.3 = 1.7Emissions (CHP)
implying that emissions from the ensemble of CHP facilities are 41% lower.
112
annex i ===

NOx Emissions from an Efficient Gas Engine Versus USAverage and New CCGT
Kaarsberg et al. 1998 estimate NOx emissions for a gas engine andcompare them to the US grid average data. In their case, they assumethat a gas engine generates electricity at 39% efficiency and has a heatefficiency of 50%. NOx emissions are 108 g/GJ of fuel input or1.0 g/kWh of electricity output. In one example, they assume theengine replaces an average boiler (65% efficient, emissions of 120 g/GJ)and the US average grid (30% efficient,with 2.18 g NOx/kWh deliveredelectricity).This gives the ratio of emissions :
= 2.18/1.00 + 0.50*120/108*0.65 = 2.54
implying a 60% emissions reduction by using CHP.
However, a second example assumes a new gas boiler (85% efficient,with NOx emissions at 24 g/GJ i.e. 80% lower) and a new combined-cycle gas turbine 55% efficient, with NOx emissions of 0.05 g/kWh (orover 40 times lower than the grid average) :
= 0.05/1.00 +0.50*24/108*0.85 = 0.14
implying that NOx emissions from reciprocating engine CHP are seventimes higher than used for separate new technologies.
Diesel CHP in India
In developed countries, the relatively high efficiencies of both powerplants and grids reduces the emissions impact of central generation.However, central power systems in developing countries may havepoorer technical performance.One example is India,where the powersystem is heavily reliant on coal, much of it of low quality, andtransmission and distribution losses are very high, averaging 22%including “nontechnical” losses (technical losses alone have beenestimated at 13%), compared with an OECD average of 6.8%. Powerreliability problems make distributed power an attractive option forsome Indian industries. Industrial power-generating capacity amountsto 15 GW, of which 6 GW is by diesel generation.
113
annex i

As a consequence, an efficient industrial-size diesel generation CHPunit can have a significant carbon-emissions benefit compared with gridelectricity. In 1999, the Indian electric utility power system produced478 TWh of electricity from 4840 PJ of fuel and emitted 399 Mt ofCO2 (given an average efficiency of 35.5% and 82.4 kg CO2/GJ of fuelinput).A 43% efficient diesel engine has an emissions factor of 74.1 kgCO2/GJ of fuel used. Assuming that the CHP produces heat at 37%efficiency and that it replaces an oil boiler at 75% efficiency (carbonemissions factor of 74.1 kgCO2/GJ), the emissions ratio is :
= 82.4*(0.43)/(74.1*0.355*0.87) + 74.1*0.37/(74.1*0.75) = 2.04
Thus, replacing grid electricity with diesel-fired CHP reduces emissionsby 51%, even allowing for non-fossil production for the grid. If it isassumed that the diesel generator replaces coal-fired generation only(which averages 32% efficiency and has a higher carbon-emissionsfactor), emissions with diesel CHP are 60% lower than from gridelectricity and separate oil boiler.
Quality Index for UK “Good Quality CHP”
The above analysis shows that develop a definition of CHP that savesenergy and emissions is straightforward. For governments developingfiscal or other policies to favour CHP, energy and emissions-savingcriteria can easily be used to screen eligibility.The UK government hasused such an approach in developing a Quality Index for CHP schemesthat want to qualify for a variety of fiscal benefits.
The Quality Index is defined as (DETR, 2001).
Quality Index (QI) = XηELCHP + Y ηHCHP.
Where X and Y are parameters that vary with the size of the CHPproject (for a 10-25 MW project X = 205,Y = 125).
The requirements for good quality CHP include :
ηELCHP > 0.2
and QI > 100.
114
annex i ===

Comparing the result with the first equation on energy savings
X = 1/ηEL * (1-LTD) for X = 205 ηEL * (1-LTD) = 100/205 = 0.488
Y =1/ηB for Y = 125 ηB = 0.8.
Given that the current electricity system and boilers in the UK havemuch lower average efficiency than CHP, the Quality Index criterionimplies that a CHP project must result in a large energy savings toqualify as “Good Quality CHP”.This is illustrated in the figure below.
0Figure A10
Comparison of Good Quality CHP Output with Average UK Grid
115
annex i
0
0,1
0,2
0,3
0,4
0,5
0,6
0,7
0,8
0,9
1
0 0,1 0,2 0,3 0,4 0,5 0,6
CHP Electrical Efficiency
CHP
Heat
Effi
cienc
y
Average Grid and Boiler 100% efficiency
"Good Quality CHP" (10-25 MW)

Allocating CHP Emissions to ElectricityProduction and Heat Production81
While the above analyses calculate the overall emissions benefit ofCHP, it may be necessary to allocate emissions to power generation orheat separately. One reason is statistical : emissions from powerproduction and from heat production are often recorded separately82.Also, some emissions regulations or trading schemes (for carbondioxide and for NOx) focus exclusively on the power-generationsector. Third, customers for the heat and for the electricity may bedifferent and thus need to be charged separately.
The actual allocation is notional.There are three different methods :
■ Allocate remaining emissions to power generation.Emissions from heat are assumed equal to some comparator e.g. aboiler with a given fuel and efficiency.Emissions remaining are allocatedto power generation.This approach would allocate all emissions savingsto power generation. This convention is used by the EuropeanCommunity.
■ Allocate remaining emissions to heat. Emissions fromelectricity production are assumed equal to some comparator, i.e. gridelectricity. Remaining emissions are then allocated to heat production.This approach allocates all emissions savings to heat production.
■ Split the allocation. This approach recognises that more fuel isrequired to make electricity than heat, and allocates fuel use andemissions to the two outputs likewise.The UK guidelines for companyreporting on greenhouse-gas emissions allocates twice as much fuel(and associated emissions) per unit of power generated from a CHPproject as per unit of heat generated.
116
annex i ===
81. This discussion is largely derived from DTI, 2000.82. IEA statistics record these emissions jointly and estimate emissions rates (in gCO2/kWh) by adding the heatoutput to the electrical output.


BIBLIOGRAPHYAlderfer, B., M. Eldridge, and T. Starrs, 2000. Making Connections : CaseStudies of Interconnection Barriers and their Impacts on DistributedPower Projects, National Renewable Energy Laboratory, Golden,Colorado.
Bitsch,R., 2000.“Decentralised Energy Supply Options in Industrialised& Developing Countries”, WorldPower 2000, Siemens AG, 61-65.
CARB, 2001.“Guideline for the Permitting of Electrical GenerationTechnologies”, State of California Environmental Protection Agency,Air Resources Board, Stationary Source Division, September 2001.
Caudron, L., 2000. “Distributed Energy : Fad or InevitableEvolution ? Summary and Closing Remarks”, Decentralised Power2000, Nice, France, 7-9 February 2000.
CEC, 2000. The Role of Energy Efficiency and Distributed Generation inGrid Planning, California Energy Commission, Report to theGovernor and Legislature, Publication # 300-00-003,April 2000.
CEC, 2001. “BUGS-1, Database of Public Back-up Generators inCalifornia”, California Energy Commission, 15 August 2001.
CIGRE, 1999. Impact of Increasing Contribution of DispersedGeneration on the Power System, CIGRÉ (Conseil International desGrands Réseaux Électriques) Working Group Report 137, February1999.
CIRED, 1999. CIRED Working group No. 4 on Dispersed Generation,Preliminary Report For Discussion at CIRED 1999, CongrèsInternational des Réseaux Electriques de Distribution, 1999.
Chapel S. and C. Feinstein, 2000. “Strategic Role of DR inDistribution Systems”, EPRI Workshop on Distributed ResourceEconomic Evaluation, Chicago, 13 December 2000.
CHPQA, 2000. “Defining Good Quality CHP”, Guidance Note 10,CHPQA, UK Department of Environment, Food and Rural Affairs,2000.
119
bibliography

CGC Japan, 2001. Current State and Trend of Cogeneration in Japan,CGC Japan Cogeneration Center, January 2001.
Cogen Europe, 1999. The Administrative Obstacles to the Developmentof Decentralised Cogeneration – Electrical Network Limits, CogenEurope, 1999.
Cogen Europe, 2000. Press Release, “Electricity Liberalisation : ADisaster for Clean Energy”, Brussels, 7 March 2000.
Cohen, D. 2001. “Using Real-Time Web Technology to Manage DENetworks”, Silicon Energy, Distributed Power 2001, Intertech, Nice,France, May 2001.
Cotard, E. 2000. “Electricity Transport Regimes : Their Impact onCogeneration”, Cogeneration and On-site Power Production, No. 6,November-December 2000, 57-67.
Courcelle, B. 2001.“Distributed Generation : From a Global Marketto Niche Applications”, Honeywell, Distributed Power 2001, Nice,France, May 2001.
DTI EGWG, 2001. Embedded Generation Working Group, Reportinto Network Issues for Embedded Generation,Volume 1 Main Reportand Volume 2, Annexes, UK Department of Trade and Industry,January 2001.
DTI, 2000. Savings in Carbon Emissions from Combined Heat andPower, Energy Trends, October 2000.
DTI, 2001a. Digest of United Kingdom Energy Statistics 2001, UKDepartment of Trade and Industry, July 2001.
DTI, 2001b. “Wilson Seeks System Changes for GreenGenerators”, DTI Press Release, 30 November 2001.
DTI, 2001c. Government Response to Ofgem’s Reports “The NewElectricity Trading Arrangements – Review of the First Three Months” and“Report to the DTI on the Review of the Initial Impact of NETA on SmallGenerators” of 31 August 2001, UK Department of Trade andIndustry, 1 November 2001.
120
bibliography ===

DGTW, 2001. “Orders up Across all Engine Ranges” (24th AnnualPower Generation Survey), Diesel and Gas Turbine Worldwide(www.dieselpub.com/ww/ww_power2000.htm).
DTE, 2001.“DTe : Increase in Market Forces through the Relaxationof the Imbalance System”, DTE (Office for Energy Regulation) PressRelease, 5 March 2001.
Dunn, S. 2000. Micropower : The Next Electrical Era, WorldwatchInstitute,Washington, DC, Paper 151, July 2000.
EC, 1997.“A Community Strategy to Promote Combined Heat andPower (CHP) and to Dismantle Barriers to its Development”,European Commission, COM (97) 514, 15 October 1997.
EC Research, 2001.“Distributed Generation with High Penetrationof Renewable Sources – DISPOWER”, EC Research,ftp ://ftp.cordis.lu/pub/eesd/docs/ev260901_poster_dispower.pdf,20 September 2001.
ECN, 2000. Energy Market Trends in the Netherlands 2000, ECN (TheNetherlands Energy Research Foundation), 2000.
EIA, 2000. Annual Energy Outlook 2001, Energy InformationAdministration, US Department of Energy, Report# :DOE/EIA-0383(2001), December 2000.
EIA, 2001. Modeling Distributed Electricity Generation in the NEMSBuildings Models, Erin Boedecker, John Cymbalsky and Stephen Wade,Energy Information Administration, US Department of Energy,www.eia.doe.ogv/oiaf/analysispaper/electricity_generation.html, lastmodified 28 August 2001.
Frayer, J. and N. Uludere,2001. “What is it Worth ? Application ofReal Options Theory to the Valuation of Generation Assets”,Electricity Journal, Volume 13, Issue 8, 40-51.
Future Cogen, 2001. The Future of CHP in the European Market – TheEuropean Cogeneration Study, prepared for the European CommissionSAVE program, Report no. XVII/4.1031/P/99-169, May 2001.
121
bibliography

Gas Research Institute, 1999. The Role of Distributed Generation inCompetitive Energy Markets.
Gillette, S. 2001. “Emerging Technology Markets : Microturbines”,2nd International CHP Symposium,Amsterdam, the Netherlands, May2001.
Handschein, E. 2001. Integration, Control and Management ofDispersed Generation, Distributed Power 2001, Intertech, Nice,France, May 2001.
Hangai, E. 2001. “MyEnergy’s On-site Energy Service based onCustomer Perspective”, MyEnergy presentation, 4 April 2001.
T. Hoff, H. Wenger, C. Herig, and R. Shaw, Jr., 1997. “DistributedGeneration and Microgrids”, 18th USAEE/IAEE, San Francisco,California, September 1997, available at http ://www.clean-power.com/research/microgrids/MicroGrids.pdf.
Huhn, K., 2001. “Cogeneration in Europe Heading for Applicationsbelow 10 kW”, Cogeneration and On-Site Power Production, July-August 2001, 55-59.
IEA, 2000. Energy Policies of the Netherlands, 2000 Review,International Energy Agency, Paris, 2000.
IEA, 2001a. Energy Prices and Taxes, 3rd Quarter 2001, Paris, 2001.
IEA 2001b. WEO Insights 2001 : Today’s Energy Supplies FuellingTomorrow’s Growth, International Energy Agency, Paris, 2001.
IEA 2002. Security of Supply in Electricity Markets : Evidence and PolicyIssues, International Energy Agency, Paris, 2002.
IEA Wind 2001, IEA Wind Energy Annual Report 2000, InternationalEnergy Agency Implementing Agreement for Co-operation in theResearch and Development of Wind Turbine Systems, May 2001.
Kaarsberg, T., J. Bluestein, J. Romm, and A. Rosenfeld, 1998. “TheOutlook for Small Scale CHP in the USA”, CADDET EnergyEfficiency Newsletter No. 2, 1998.
122
bibliography ===

Kirby, B. and E. Hirst 2001. Kirby, Bulk-Power Reliability andCommercial Implications of Distributed Resources, NARUC,April 2000,(http ://www.ornl.gov/ORNL/BTC/Restructuring/Rapdr.pdf).
Jenkins, N., R. Allan, P. Crossley D. Kirschen, and G. Strbac, 2000.Embedded Generation, The Institution of Electrical Engineers,London, 2000.
Arthur D. Little, Inc., Distributed Generation : Policy Framework forRegulators, Cambridge, Massachusetts, 1999.
Arthur D. Little, Inc., Distributed Generation : System Interfaces,Cambridge, Massachusetts, 1999.
Arthur D. Little, Inc., Distributed Generation : Understanding theEconomics, Cambridge, Massachusetts, 1999.
Lenssen, N., “Current and Future Markets for DistributedGeneration in the OECD”, presentation to Aspen Clean EnergyRoundtable VII, 27-29 September 2000.
Lönnroth,M., 1989.“The Coming Reformation of the Electric UtilityIndustry”, Electricity, Efficient End Use and New GenerationTechnologies, and Their Planning Implications, T.B. Johannson editor,1989, 765-786.
METI, 2001. Preliminary Report on the 1999 Structural Survey of EnergyConsumption, Japan Ministry of Economy,Trade and Industry, 2001.
Milford, L. 2001. “The Harvard Medical School Fuel Cell Project”,Clean Energy Group, 2nd International CHP Symposium,Amsterdam, the Netherlands, May 2001.
NEA/IEA, 1998. Projected Costs of Generating Electricity Update 1998,Nuclear Energy Agency and International Energy Agency, Paris1998.
NEGA, 2001. “Survey on Installation of Non-emergency On-sitePower Generation Facilities”, Japan Engine Generator Association,annual surveys 1997-2000 (in Japanese).
123
bibliography
Nordel, 2000. Non-dispatchable Production in the Nordel System,Nordel’s Grid Group, May 2000.
NYISO, 2001. NY Independent System Operation, EmergencyDemand Response Program Status Report, 20 August 2001.
Onsite Sycom Energy Corporation 2000a. Interconnection inCalifornia : Connecting Distributed Generation to the Grid, Consultant’sReport to the California Energy Commission, October 2000.
Onsite Sycom Energy Corporation 2000b. The Market and TechnicalPotential for Combined Heat and Power in the Commercial/InstitutionalSector, prepared for the US Department of Energy, EnergyInformation Administration, January 2000 (revision 1).
Onsite Sycom Energy Corporation 2000c. The Market and TechnicalPotential for Combined Heat and Power in the Industrial Sector,prepared for the US Department of Energy, Energy InformationAdministration, January 2000.
Ofgem 2001a. Report to the DTI on the Review of the Initial Impact ofNETA on Smaller Generators, UK Office of Gas and ElectricityMarkets,August 2001.
Ofgem 2001b. Embedded Generation : Price Controls, Incentives andConnection Charging, a Preliminary Consultation Document, UK Officeof Gas and Electricity Markets, September 2001.
Pati, M., Ristau, R., Sheblé, G., and M. Wilhelm 2001. Real OptionValuation of Distributed Generation Interconnection, prepared for theEdison Electric Institute, March 2001.
Patterson, W. 1999. Royal Institute of International Affairs,Transforming Electricity :The Coming Generation of Change, Earthscan,London, 1999.
Peco, J. and T. Gomez, 2000. “A Model for Planning Large Scale MVNetworks considering Uncertainty in Reliability Modelling”, 6thInternational Conference on Probabilistic Methods Applied toPower Systems, Funchal, Madeira -Portugal, 25-28 September 2000.
124
bibliography ===

Peltier, R. 2001. “Proven Performers Capture DG market”, Power,July/August 2001, 44-50.
Perrault, L., 2001. “CHP and the Information Age – Cooling andUltra-reliable Power for Data Centres”, Cogeneration and On-SitePower Production, July-August 2001, 61-63.
Primen, 2001. The Cost of Power Disturbances to Industrial and DigitalEconomy Companies, by Primen Consultants, submitted to EPRI’sConsortium for Electric Infrastructure for a Digital Society, June2001.
RAP, 2001. Expected Emissions Output from Various DistributedGeneration Technologies, Regulatory Assistance Project, May 2001(www.rapmaine.org).
SAVE, 2001. Risks and Chances for Small Scale Combined Heat andPower in the Liberalised Energy Market, Final Report, prepared byAmbiente Italia srl, Kraftwärmeanlagen GmbH, Eicher + Pauli AG,and CIT Energy Management AB, SAVE Contract XVII/4.1031/z/99-063, 30 March 2001.
Singh, V., 20001. Blending Wind and Solar into the Diesel GeneratorMarket, Renewable Energy Policy Project Research Report No. 12,Winter 2001.
TNRCC, 2001.Texas Natural Resource Conservation Commission,Air Quality Standard Permit for Electric Generating Units, June 2001.
USDOE, 2000. Strategic Plan for Distributed Energy Resources, USDepartment of Energy, September 2000.
Zacharias, P and K. Rohrig, 2001.“Integration of Wind and other RESources in Power Supply”, Distributed Power 2001, Nice France, 16-18 May 2001.
125
energy market reform1


OECD TOKYO CENTRE
Tel: (+81-3) 3586 2016
Fax: (+81-3) 3584 7929
E-mail: [email protected]
OECD WASHINGTON CENTER
Tel: (+1-202) 785-6323
Toll-free number for orders:
(+1-800) 456-6323
Fax: (+1-202) 785-0350
E-mail: [email protected]
INTERNATIONALENERGY AGENCY
O R D E R F O R M
You can also send
your order
to your nearest
OECD sales point
or through
the OECD online
services:
www.oecd.org/
bookshop
OECD PARIS CENTRE
Tel: (+33-01) 45 24 81 67
Fax: (+33-01) 49 10 42 76
E-mail: [email protected]
OECD BONN CENTRE
Tel: (+49-228) 959 12 15
Fax: (+49-228) 959 12 18
E-mail: [email protected]
OECD MEXICO CENTRE
Tel: (+52-5) 280 12 09
Fax: (+52-5) 280 04 80
E-mail: [email protected]
IEA BOOKS
Fax: +33 (0)1 40 57 65 59
E-mail: [email protected]
www.iea.org/books
DELIVERY DETAILS
Name Organisation
Address
Country Postcode
Telephone E-mail
PAYMENT DETAILS
I enclose a cheque payable to IEA Publications for the sum of $ or €
Please debit my credit card (tick choice). Mastercard VISA American Express
Card no:
Expiry date: Signature:
PUBLICATIONS ISBN QTY PRICE TOTAL
Distributed Generation in Liberalised Electricity Markets 92-64-19802-4 $75 €82
Security of Supply in Electricity Markets - Evidence and Policy Issues 92-64-19805-9 $100 €110
Competition in Electricity Markets 92-64-18559-3 $75 €82
Regulatory Institutions in Liberalised Electricity Markets 92-64-18583-6 $75 €82
Nuclear Power in the OECD 92-64-18579-8 $60 €66
Electricity in India - Providing Power for the Millions 92-64-19724-9 $125 €137
World Energy Outlook - 2001 Insights 92-64-19658-7 $150 €165
Russia Energy Survey 2002 92-64-18732-4 $150 €165
TOTAL
I would like to order the following publications
9, rue de la FédérationF-75739 Paris Cedex 15

IEA PUBLICATIONS, 9, rue de la Fédération, 75739 PARIS CEDEX 15PRINTED IN FRANCE BY JOUVE
(61 02 24 1P1) ISBN 92-64-19802-4 – 2002
Illust
rations
by P
hili
ppe
Lagautr
ière