
Distributed Generation Drivetrain for High Torque … · Public Interest Energy Research (PIER)...
87
Public Interest Energy Research (PIER) Program FINAL PROJECT REPORT DISTRIBUTED GENERATION DRIVETRAIN FOR HIGH TORQUE WIND TURBINE APPLICATIONS DECEMBER 2011 CEC ‐ 500 ‐ 2011 ‐ 002 Prepared for: California Energy Commission Prepared by: Clipper Windpower Technology Inc.
Transcript of Distributed Generation Drivetrain for High Torque … · Public Interest Energy Research (PIER)...
Publ ic Interest Energy Research (P IER) Program FINAL PROJECT REPORT
DISTRIBUTED GENERATION DRIVETRAIN FOR HIGH TORQUE WIND TURBINE APPLICATIONS
DECEMBER 2011CEC ‐500 ‐2011 ‐002
Prepared for: California Energy Commission Prepared by: Clipper Windpower Technology Inc.
i
Prepared by: Primary Author: Amir Mikhail Clipper Windpower Technology Inc Carpinteria, CA 93013 Contract Number: 500-00-034 Prepared for: California Energy Commission Hassan Mohammed Contract Manager Linda Spiegel Office Manager Energy Generation Research Office Laurie ten Hope Deputy Director RESEARCH AND DEVELOPMENT DIVISION Robert P. Oglesby Executive Director
DISCLAIMER This report was prepared as the result of work sponsored by the California Energy Commission. It does not necessarily represent the views of the Energy Commission, its employees or the State of California. The Energy Commission, the State of California, its employees, contractors and subcontractors make no warrant, express or implied, and assume no legal liability for the information in this report; nor does any party represent that the uses of this information will not infringe upon privately owned rights. This report has not been approved or disapproved by the California Energy Commission nor has the California Energy Commission passed upon the accuracy or adequacy of the information in this report.

ii
Acknowledgements The development and testing of the Distributed Generation Drivetrain, was a successful collaboration of many teams and individual contributors from Clipper Windpower Technology, Inc., its consultants and vendors, and National Renewable Energy Laboratory. Several individuals contributed to the design, fabrication, setup, and execution of the planned tests for the project.
Appreciation is expressed to all who participated in the drivetrain development and testing. The project team offers special thanks to Sacramento Municipal Utility District, National Renewable Energy Laboratory, and the Energy Commission for their sponsorship and mentoring of this technology development.
The following is a non‐all‐inclusive list of responsibilities of key contributors.
Amir Mikhail—President, Clipper Windpower Technology
Dr. Mikhail is the principal investigator for this contract, is responsible for all technology programs for Clipper Windpower, and is a co‐inventor of the patented DGENQ technology.
Geoff Dean—Director, Engineering, Clipper Windpower
Dr. Dean was responsible for initial design studies relating to the drivetrain concept and is a co‐inventor of the patented DGDI technology.
Tom Nemila, Clipper Windpower—Test Engineer/Program Manager
Mr. Nemila was responsible for the program schedule and shared planning responsibilities with Mr. McNiff on behalf of Clipper Windpower to achieve the test objectives.
Kevin Cousineau, Director, Electrical Engineering, Clipper Windpower
Mr. Cousineau was responsible for the development of electrical design, test objectives, and electrical test method.
Ed Hahlbeck, Powertrain Engineers, Inc.—Gear Designer
Mr. Hahlbeck was responsible for the mechanical system design and operation of the Drivetrain system and the mechanical test method. Ed was also responsible for the rotating machinery test apparatus design. He is a co‐inventor of the patented DGENQ technology.
Carlos Gottfried, Chief Executive Officer of Potencia Industrial
Mr. Gottfried and his team at Potencia were responsible for the mechanical and electrical design, manufacture, and testing of the generator system.
Bill Erdman, President, BEW Engineering
Dr. Erdman was responsible for the architectural design of the power electronic converter and generator systems.

iii
Walt Musial, National Renewable Energy Laboratory—Project Leader
Mr. Musial is the team leader of Testing at the NWTC. He is in charge of all site personnel on this project and his responsibilities include scheduling, test planning, mechanical engineering support, test operation, data quality, and reporting.
Vahan Gevorgian, National Renewable Energy Laboratory—Test Engineer
Mr. Gevorgian is the on‐site test engineer providing electrical engineering support, data collection and processing, data quality assurance and reporting. He is in charge of seeing that the testing is proceeding as planned, that the test article and VFD are operational, and he works with the customer engineers as needed.
Ed Overly, National Renewable Energy Laboratory—DTF Master Technician
Mr. Overly is the master technician in charge of the Dynamometer test facility. He facilitates access and operations of the facility, and he is the main point of contact for operational details, including shipping, building access, environmental health and safety, dynamometer operation, and daily planning.
Brian McNiff, McNiff Light Industry—Test Engineer
Mr. McNiff was responsible for planning the details to achieve the test objectives. In addition, he worked with NREL and Clipper Windpower to make sure that all safety interconnects were in place to account for safe Dyno and test article response in the case of any possible failure modes.
Larry Howes, Clipper Windpower—Electrical Engineer/Controls Designer
Mr. Howes was responsible for the design of the generator system field control apparatus and various aspects of the test instrumentation.
Scott Taylor, Clipper Windpower—Mechanical Engineer
Mr. Taylor provided mechanical engineering support as required by the program.
Michelle Graf, Brian O’Connor, Lubrizol Corp—Lubrication Specialists
Throughout the testing, Lubrizol Corporation performed on‐line monitoring of the gearbox lubricant using experimental systems they are developing. They provided all the drain oil analysis throughout the test as well as filter and wear analysis.
Jeff Holbrook and Chuck Johnson, Xantrex
Xantrax technician and engineer responsible for the power conversion system installation and commissioning. Additionally, they were responsible for training the National Renewable Energy Laboratory facility operators on operations of the power conversion system.

iv
Preface
The California Energy Commission’s Public Interest Energy Research (PIER) Program supports public interest energy research and development that will help improve the quality of life in California by bringing environmentally safe, affordable, and reliable energy services and products to the marketplace.
The PIER Program conducts public interest research, development, and demonstration (RD&D) projects to benefit California.
The PIER Program strives to conduct the most promising public interest energy research by partnering with RD&D entities, including individuals, businesses, utilities, and public or private research institutions.
• PIER funding efforts are focused on the following RD&D program areas:
• Buildings End‐Use Energy Efficiency
• Energy Innovations Small Grants
• Energy‐Related Environmental Research
• Energy Systems Integration
• Environmentally Preferred Advanced Generation
• Industrial/Agricultural/Water End‐Use Energy Efficiency
• Renewable Energy Technologies
• Transportation
Distributed Generation Drivetrain for High‐Torque Wind Turbine Applications is the final report for the SMUD ReGen project (Contract Number 500‐00‐034), conducted by Clipper Windpower Technology Inc. The information from this report contributes to PIER’s Renewable Energy Technologies program.
For more information about the PIER Program, please visit the Energy Commission’s website at www.energy.ca.gov/research/ or contact the Energy Commission at 916‐654‐4878. Please cite this report as follows:
Mikhail, Amir. 2005. Distributed Generation Drivetrain for High Torque Wind Turbine Applications. California Energy Commission, PIER Renewable Energy Technologies Program. CEC‐500‐2011‐002.

v

vi
Table of Contents
Preface ......................................................................................................................................................... iv Abstract ....................................................................................................................................................... x Executive Summary ................................................................................................................................... 1 1.0 Introduction .......................................................................................................................................... 3 2.0 Project Approach ........................................................................................................................... 5 3.0 Project Outcomes........................................................................................................................... 7
3.1 Turbine Scaling ........................................................................................................................... 7 3.2 Completion of Spatial Envelope Analysis and Dynamometer Layout Considerations ... 7 3.3 Turbine Loads Development .................................................................................................... 8 3.4 Geometric and Loads Constraints ........................................................................................... 8 3.5 Turbine Control and Safety Systems ....................................................................................... 9 3.6 Turbine Control and Safety System Overview .................................................................... 10 3.7 Powertrain Component Specifications .................................................................................. 11 3.8 Design of Gearbox Housing, Bearings, and Lubrication Systems .................................... 12
3.8.1 Gear Box Housing .................................................................................................................. 12 3.8.2 Bearings ................................................................................................................................... 13 3.8.3 Lubrication System ................................................................................................................. 14
3.9 Final Mechanical Design ......................................................................................................... 14 3.9.1 Loads ........................................................................................................................................ 14 3.9.2 Optimal Configuration .......................................................................................................... 15 3.9.3 Mechanical Design ................................................................................................................. 16
3.10 Circuit Design and Controller Specification.................................................................... 21 3.10.1 Control System Description ................................................................................................ 21
3.11 Final Electrical Design ........................................................................................................ 23 3.11.1 Generator Final Design ........................................................................................................ 25 3.11.2 Converter/Controller Final Design .................................................................................... 26
3.12 Test Planning and Completion of the Test Specification ................................................ 28 3.12.1 Test Project Summary ...................................................................................................... 28 3.12.2 Gearbox Testing .................................................................................................................... 29
3.13 No‐Load Spin Testing ......................................................................................................... 30 3.14 System Operation at High Power Levels .......................................................................... 31 3.15 DGDI Start of Fatigue Testing ............................................................................................ 32 3.16 Gearbox Fatigue Testing ..................................................................................................... 33 3.17 Evaluation of Gear Mesh Contact with Strain Gages ............................................................. 35
3.17.1 Introduction .......................................................................................................................... 35 3.17.2 The Process ............................................................................................................................ 36
3.18 Gear Contact Mesh Conclusion and Comments .............................................................. 49 3.18.1 Lead Tuning, Results of Regrind ........................................................................................ 49 3.18.2 Corrections after Retest ....................................................................................................... 50
4.0 Electrical System Success, Failures and Lessons Learned ............................................................ 51 4.1 Generator System Description ..................................................................................................... 51
vii
4.2 Generator Successes ...................................................................................................................... 51 4.3 Generator Challenges .................................................................................................................... 51 4.4 Converter System Description ..................................................................................................... 52 4.5 Converter System Successes .............................................................................................. 52 4.6 Converter System Challenges ...................................................................................................... 53 4.7 Control System Description—Original DC Bus Voltage Regulator ....................................... 53 4.8 Converter System Successes With the Original Regulator ................................................. 54 4.9 Original DC Bus Voltage Regulator Challenges ....................................................................... 54 4.10 Final Manual Control System Used for Load Testing ............................................................ 54 4.11 Final Manual Control System Successes .................................................................................. 54 4.12 Manual Control System Challenges .................................................................................. 54 4.13 Electrical Safety System Description ......................................................................................... 54 4.14 Safety System Success ................................................................................................................. 55 4.15 Safety System Failures ......................................................................................................... 55 4.16 Lessons Learned From DGD‐I Testing, Successes and Failures ............................................ 55
5.0 Conclusions .................................................................................................................................. 59 5.1 Recommendations & Benefits ...................................................................................................... 59
6.0 Distributed Generation Drive Technology – Next Steps ....................................................... 61 6.1 Advantages of the DGEN‐Q Electrical System Compared to the Original DGD‐I ......... 61
6.1.1 Generators ......................................................................................................................... 61 6.1.2 Converter ........................................................................................................................... 62 6.1.3 Controls ............................................................................................................................. 62
7.0 General C‐93Turbine Configuration ......................................................................................... 65 7.1 C‐93 Rotor ................................................................................................................................. 65 7.2 C‐93 Gearbox ............................................................................................................................ 65 7.3 Generators ................................................................................................................................. 66 7.4 C‐93 Prototype Installation ........................................................................................................... 66 Appendix A: Gearbox Inspection Letter
List of Figures
Figure 1. Gear train cost vs. number of generators .............................................. .................. 15 Figure 2. DGD‐I gearbox front view ..................................................................... .................. 16 Figure 3. FEA of forward housing, axial fatigue stresses .................................... .................. 19 Figure 4. FEA of generator adapter, stresses due to nacelle yawing ................. .................. 20 Figure 5. DGD gearbox rear view ........................................................................... .................. 20 Figure 6. DGD compared to conventional 1.5 MW drivetrain ........................... .................. 21 Figure 7. Control system single‐line diagram ....................................................... .................. 23 Figure 8. DGD‐I gearbox & generator assembly .................................................. .................. 26 Figure 9. Converter system enclosures .................................................................. .................. 27 Figure 10. DGD‐I system installed on NREL dynamometer ................................ .................. 29 Figure 11. Gearbox bearing temperature rise ......................................................... .................. 30
viii
Figure 12. Gear fatigue bending life vs. test load ................................................... .................. 35 Figure 13. Time vs. mainshaft torque, DGDI load spectrum ............................... .................. 37 Figure 14. LVR 3D model of HS mesh ..................................................................... .................. 37 Figure 15. Typical tooth modifications resulting from analysis ......................... .................. 38 Figure 16. Example of micro‐geometry used in 3D mesh analysis ...................... .................. 38 Figure 17. Strain during contact progression ......................................................... .................. 40 Figure 18. Typical signal produced by tooth passing through mesh ................. .................. 40 Figure 19. Gage layout ............................................................................................... .................. 41 Figure 20. Removing gage signals with spinning amplifiers and slip rings ..... .................. 41 Figure 21. Readings on second test iteration, Shaft A ........................................... .................. 42 Figure 22. Readings on second test iteration, Shaft B ............................................ .................. 43 Figure 23. Example of stress plots at gage locations ............................................. .................. 44 Figure 24. Comparison of measured data to model prediction .......................... .................. 45 Figure 25. Comparison of model with slope bias and measured results ............ .................. 45 Figure 26. Results of pinion 10091‐01 (A), RH, model biased ............................. .................. 46 Figure 27. Results of pinion 100091‐01 A LH, model biased ............................... .................. 46 Figure 28. Results of pinion 10092‐01 (B) RH, model biased ............................... .................. 46 Figure 29. Results of pinion 10092‐91 (B) LH, model biased ............................... .................. 47 Figure 30. Pinion A, RH, with adjusted micro‐geometry .................................... .................. 47 Figure 31. Predicted mesh load intensity based on new micro‐geometry .......... .................. 48 Figure 32. NREL DGD‐I test safety system diagram ............................................. .................. 56 Figure 33 DGEN‐Q 2.5 MW drivetrain installed at NREL dynamometer ......... .................. 63 Figure 34 DGEN‐Q gearbox being installed in Goleta, California ..................... .................. 64 Figure 35 Clipper C‐93 “Liberty‐1” prototype ...................................................... .................. 67
List of Tables
Table 1. Casting inspection requirements ........................................................... .................. 12 Table 2. Gearbox bearings ...................................................................................... .................. 13 Table 3. 1.5 MW drive system specification ........................................................ .................. 24 Table 4. Drivetrain test instrumentation .............................................................. .................. 29

ix
x
Abstract
Designing wind turbines to reduce the cost of energy and increase the life of system components is a major goal of the wind industry. As the power rating of modern wind turbines increases, gearboxes are becoming increasingly expensive per kilowatt of rated power. Reducing the cost, size, and weight and increasing the reliability of the turbine gearbox and generator systems are critical elements toward achieving this goal.
The trend toward large turbines has resulted in very expensive gearboxes. These gearboxes are more expensive per kilowatt than smaller turbines due to the large increase in rotor shaft torque. The rotor torque increases as the cube of the rotor diameter while the power increases with the square of the diameter. This is due to the constrained rotational speed of large wind turbines due to aero‐acoustic noise. The rotor torque increases as the cube of the rotor diameter increases in size; therefore, resulting in an increase of the produced power. Multiple generator drive train configurations can reduce the drivetrain cost for large turbines while improving reliability and increasing energy capture.
The distributed generation drivetrain development program engineers, builds, and tests an optimized solution to provide a cost‐effective, commercial‐scale (1.5 megawatt) drivetrain.
The benefits of this program to California include advancement of the state‐of‐the‐art wind turbine technology, a reduction in the cost of energy from a non‐polluting, renewable energy resource, and the ability to reduce California’s dependence on fossil fuels and their associated negative environmental and health impacts.
Keywords: Wind, turbine, distributed generation, drivetrain, gearbox, rotational speed

xi

1
Executive Summary
Introduction
This report describes development and testing of the distributed generation drivetrain system including the gearbox, generators, power converter, and the control system that integrates the drive components. A full‐scale prototype of the drivetrain was constructed and installed with a closed‐loop generator field control system at the National Renewable Energy Laboratory dynamometer test facility at the National Wind Technology Center near Golden, Colorado. The testing centered on maturing the whole subsystem design, verifying the operating characteristics and design assumptions, and endurance testing the gearbox.
The distributed generation drivetrain is a patented solution to the exponentially increasing torque and gearbox costs characteristic of increasing turbine diameters. The distributed generation drivetrain reduces gear tooth stress by splitting the torque path at the low‐speed end of the gearbox between small, parallel gearboxes and generators. This reduces gearbox cost, weight, installation requirements, and warranty risk. The Project scope was to engineer, construct, and test a commercial‐scale 1.5 megawatt drivetrain.
Project Goals and Objectives
• Engineer a commercially viable gearbox that either will enable retrofit of existing turbines or will become the center of a new turbine design
• Construct the distributed generation drivetrain system
• Integrate the distributed generation drivetrain controller
• Test the distributed generation drivetrain system on the National Renewable Energy Laboratory test stand
Project Outcomes
• Conducted turbine scaling, envelope, and configuration studies
• Developed turbine loads
• Executed drivetrain, generator, and power converter designs
• Wrote system performance and fatigue test plans
• Configured the National Renewable Energy Laboratory dynamometer to drive the distributed generation drivetrain ( The dynamometer measures mechanical power)
• Conducted system performance and drivetrain fatigue testing
Conclusions
• The torque‐splitting architecture of the distributed generation drivetrain system demonstrated its design, cost, and serviceability objectives.

2
• The system successfully operated at 130 percent of rated torque for more than 600 hours.
• The system final design demonstrated a 35 percent cost improvement compared with conventional 1.5 megawatt gearbox designs.
• The distributed generation drivetrain system weighed 15 percent less and the total drivetrain system length was more than 10 feet compared to the baseline 1.5 megawatt turbine design.
• The development of the distributed generation drivetrain prototype under this program was extremely successful with respect to demonstrating the advantages of the system architecture compared with the conventional systems. The architecture lends itself to further turbine scaling and further improvements in system cost of energy. The architecture significantly reduces the warranty risk and major component system replacement logistical costs associated with multi‐megawatt, single‐generator system failures.
• The successful outcomes from this program help position this technology for further development under a $16.9 million cost‐shared grant from the United States Department of Energy and National Renewable Energy Laboratory.
Recommendations
In some cases wind generation at some high wind sites has become competitive with conventional generation without federal subsidies. However, the high wind resource sites are limited and are being rapidly developed. This will lead to future project development in lower wind sites that may be less economical than those currently under development . Researchers will need to develop new turbines that can economically generate power in lower wind speed sites and greatly expand the wind resource potential in the state. Research should include new, longer, flexible blades that sweep a larger area and enable increased generation at low speeds. Additionally, the improved blades could be combined with improved power trains that have lower cut in speeds to increase the generation benefit. Similar turbines could be developed on a small‐scale allowing small (less than 10 kilowatt) turbines to be installed in a distributed fashion as photovoltaic systems are installed on homes now.
While wind has rapidly grown as a renewable generation technology in terms of installed capacity, continued support for a diverse set of technologies will be necessary in to meet California’s renewable portfolio goals and growing electricity demand.
Benefits to California
The benefits of this program to California include advancement of the state‐of‐the‐art wind turbine technology, a reduction in the cost of energy from a non‐polluting, renewable energy resource, and the ability to reduce California’s dependence on fossil fuels and their associated negative environmental and health impacts.

3
1.0 Introduction Present speed‐increasing gearboxes cost $170,000 (at 1.5 Megawatt scale). The size of the systems requires the largest available cranes to hoist them or to remove them from the turbine tower. The extreme torque found in these systems yields unpredictable gear tooth wear, making warranty issues of extreme concern. The Distributed Generation Drivetrain (DGD) is one solution to the exponentially increasing torque and gearbox costs characteristic of increasing turbine diameters. The DGD reduces gear tooth stress by splitting the torque path at the low‐speed end of the gearbox between small, parallel geartrains and generators. This reduces gearbox cost, weight, installation requirements, and warranty risk.
Clipper Windpower Technology, Inc., has designed an innovative wind turbine drivetrain subsystem driving multiple generators. The company initially developed the 1.5 MW drivetrain under a grant from the California Energy Commission and prototyped and tested the system under a subcontract awarded from National Renewable Energy Laboratory (NREL) through its Low Wind Speed Turbine program.

4

5
2.0 Project Approach
The project approach was to engineer, build, and test a commercially viable drivetrain that would enable retrofit of existing turbines or become the focal point for a new turbine design. The team developed an optimized configuration and cost‐scaling data through cost optimization studies. Detailed loads, specifications, and physical envelope interfaces were then defined. Detail electromechanical and controls design were then completed, followed by procurement and prototype fabrication.
The prototype design was verified through full‐scale testing. The system was installed at the NREL Dynamometer Test Facility (DTF), and, incrementally, each of the critical drive train subsystems was tested and verified. The test gearbox was fitted with sensors and instrumentation to monitor vibration, system temperatures, and lubricant system pressure and to affect shutdown and/or alarms if these parameters deviated from normal. The Clipper system faults were interlocked with the dynamometer fault system to assure fail‐safe shutdown.
The specific test objectives were:
• Verify mechanical assembly, proper load transfer, and parking brake function.
• Verify through operational testing that the field regulator(s) are capable of achieving constant voltage regulation at the generator(s) output terminals over the design speed and load range.
• Connect and operate the 1.8 MW Xantrax power converter, which conditions the generated 3Ø 575 Vac power. Develop and refine controls for management of the power converter in all normal operation modes and fault/ alarm response.
• Perform accelerated life testing of the gearbox at nominally 130% of rated torque for 1600 hours to simulate a full, operational, 30‐year design lifetime.
• Subject the drivetrain to anticipated fault conditions including loss of phase, overspeed, and electrical load loss.
• Determine the influence of elastomeric bushings on the sound and vibration level of gearbox.
• Gain experience from assembly and operation of DGD‐1 to use on future units.

6
7
3.0 Project Outcomes 3.1. Turbine Scaling Clipper Windpower Technology (CWT) completed a study to determine the optimal size for two products: (1) the Distributed Generation Drivetrain (DGD), and (2) the Clipper Quantum Turbine. Optimization was performed for the system‐projected costs in 2007.
CWT performed the scaling studies by constructing a spreadsheet examining the predicted initial capital costs of all components of the turbine. Costs and scaling factors were collected from past studies and from the ongoing findings of U.S. Department of Energy (DOE) WindPACT studies. The U.S. DOE has spent more than $6 million to determine the impact of different technologies and configurations on the cost of energy of wind‐generated electricity. Operation and maintenance (O&M), land lease, and levelized parts replacement costs were also considered. Turbine size cost optimization was performed using the EPRI‐TAG method of calculating the cost of energy.
The independently marketed turbine was selected through examination of existing turbines and communication with turbine manufacturers. The average turbine rating being installed today is approximately 1 MW; most turbine manufacturers produce equipment rated at or near 1.5 MW. Following its turbine scaling study, CWT believes that, even though technology advances in the next five years may enable turbines to grow beyond this size, turbine logistics and crane capacities constrain the size of land‐based wind turbines, especially when deployed in the United States. Independent assessments performed as part of the U.S. DOE’s WindPACT studies corroborate these findings.
Based upon these assessments, CWT believes that the optimal size for land‐based wind turbines will be between 1.5 MW and 2.5 MW in 2007. While larger turbines are presently in development by several European manufacturers, the project team believes the offshore market drives the larger sizes.
The results of this study lead CWT to target a gearbox designed to operate within the load constraints of the industry‐standard baseline 1.5 MW, 70 m‐rotor diameter turbine. While the loads for the present DGD will be constrained to these limits, CWT believes the geometric optimization of the powertrain will allow for some variation in the size of generators installed. The research team is hopeful that new rotor technology being developed by CWT for application to its Quantum Turbine will produce 1.8 MW of electricity, while operating within the loads profile of the present 1.5 MW baseline turbine. This potential additional generator capacity may require some spatial consideration while designing the present test unit.
3.2. Completion of Spatial Envelope Analysis and Dynamometer Layout Considerations The spatial envelope of the DGD was studied in a joint effort between Clipper, Global Energy Concepts, and Powertrain Engineers, Inc (PEI). PEI developed complete designs, including bearings, gear diameters and pitches, lubrication systems, mounts, shafts, etc., for each of five separate bull gear diameters and for a range of numbers of generators. Cost estimates were
8
applied to the designs, and a first approximation was offered as to the optimal design configuration. This specification included gear sizing as well as numbers and diameters of generators. The potential designs were compared against known geometric layout constraints of one major turbine manufacturer and against estimated constraints of two other manufacturers. ProEngineer drawings were developed for the baseline industry standard turbine, and sensitivities to specific design parameters were noted.
A dialog was opened with the NREL test facility manager, Walt Musial. Clipper, working with Powertrain Engineers, Inc., identified a list of characteristics of the NREL dynamometer that must be observed in the design of the test unit. These considerations generally pertained to torque‐speed capabilities of the equipment, physical layout issues, components provided by NREL and those to be supplied by Clipper, electrical systems, and test scheduling. Clipper deemed the information it gathered to be sufficient and moved forward with detailed mechanical design.
3.3. Turbine Loads Development Global Energy Concepts worked with Clipper to compose the DGD load documentation. The resultant document represents the input loads to the DGD if installed on a baseline 1.5 MW wind turbine with a rotor diameter of 70 m. The Automatic Dynamic Analysis of Mechanical Systems (ADAMS) load‐modeling code was utilized to predict the operating loads on all major components, including the DGD. This model is the most sophisticated load modeling tool for wind turbines load predictions. The turbine loads analysis was based on International ElectroTechnical Committee (IEC) Standard 61400‐1, Class II winds. This document is a global American National Standards Institute/International Standard organization (ANSI/ISO) standard that is currently utilized for the loads and safety of wind turbines. Class II certification corresponds to sites with average hub height wind speeds up to 8.5 meter per second (m/s) (19 mph) and an extreme wind speed of 59.5m/s (133 mph).
The predicted loads include extreme and fatigue loads. The project team calculated the extreme loads for International Electrotechnical Commission (IEC) load cases 1.1 and 1.3 to 6.1, which classify specific extreme load environments. A factor of safety of 1.3 is included in the calculations of extreme loads. Fatigue loads were calculated for IEC load case 1.2 (Normal Turbulence Model) with a fatigue safety factor of 1.0.
The results included in this load documents were transferred to Powertrain Engineers Inc. to utilize in the design of the DGD. A factor of 1.15 was applied to these loads to account for possible load variation resulting from the changes anticipated in rotor configuration.
3.4. Geometric and Loads Constraints This task combined the results from the loads and spatial constraints study. A Pro/Engineering solid model was constructed of the baseline turbine, bedplate, and bearing mounts. Because a principal goal for the development effort was to be able to adapt the product to a variety of wind turbine generators, for sale to the wind industry, special care was taken to assess the geometric limitations of the leading industry wind turbines. In order to do this, CWT performed
9
an evaluation of the makers of gearboxes presently in use by the leading industry turbine manufacturers.
A primary goal of this task was to combine the findings of the loads study with the geometric study to result in a useful optimization model. Ed Hahlbeck developed a detailed trade study for Clipper in which he examined different gear arrangements that would be functional for the specified loads and which would fit within the turbine geometric constraints. In this study, he considered a number of variables, including number of generators, sizing of gearing and, above all else, forecasted cost and weight. PEI found that the loads and sizing constraints resulted in a specific set of curves for cost versus gear design. Clipper was able to select an optimum layout based upon these constraints.
As a part of the design optimization, Clipper was able to identify a novel gear arrangement that reduces the weight (and cost) of the second stage gearing by 40%. This arrangement was deemed sufficiently novel to merit patent protection.
As a part of this work, Dr. Amir Mikhail and Dr. Geoff Deane traveled to Golden, Colorado, to meet with NREL staff at the National Wind Technology Center. During this meeting, design assumptions and preliminary drawings of the DGD arrangement were presented to the technical staff. Feedback was received on the design, and a discussion was had on how the product concept may fit into the market. CWT received more detailed data for design of test rigging required to mount the DGD to the dynamometer, and the dynamometer test stand was reserved for the end of 2002 and beginning of 2003.
3.5. Turbine Control and Safety Systems The 1.5 MW “Clipper” turbine, for which the DGD drivetrain is proposed, is a variable‐speed machine driven at the input shaft by a three‐bladed 77‐ to 80‐meter diameter rotor. Individual Electric pitch control is used. Clipper’s control system employs advanced algorithms allowing large‐span blades and individual pitch control of each blade for optimum operation in low wind speed sites.
Clipper’s DGD variable speed technology is made possible through the use of wound‐field synchronous generators and power electronics. The alternating current (AC) output of each generator is rectified at the generator to produce direct current (DC). This DC output is then inverted back into AC allowing interconnect of the turbine output power, at constant frequency, to the utility grid while the generator speed varies from about 700 to 1800 revolutions per minute (rpm).
DGD technology has many advantages including:
• Reduced nacelle weight. Overall the DGD gearbox is smaller and lighter than the conventional single generator gearbox approach.
• Reduced generator weight, reduced cost and easier maintenance. Any single generator may be removed and replaced by a simple hoist where a large 1.5 MW generator would require a large expensive crane for this process. Overall, replacement of a damaged
10
generator is far less complex than replacement of a single 1.5 MW generator. Finally, the wound field synchronous generator is less expensive to manufacture then the wound rotor induction generator.
• Increased reliability due to the use of redundant, multiple generators. The turbine may be operated with any number of generators, including as few as one, when a generator failure is detected. Further, load reduction on the turbine is easily achieved by operating with fewer than eight generators during periods when this may be required if, for instance, damage has occurred to a blade that would not allow for operation at full rated power.
The power electronics conversion complexity is reduced when compared to systems using a single, wound‐rotor induction generator now common in the wind industry. Because the output of the synchronous generators is rectified directly, they require only a single inverter instead of two full six‐pulse inverters as required for the conventional induction generator approach. Further, by employing multiple inverters—one for each one or two generators or, alternately, two inverters fed by four generators—redundancy and increased availability are achieved much like the case when using multiple generators.
3.6 Turbine Control and Safety System Overview Overall wind turbine control is accomplished with three separate systems. Those control systems are: (1) the Pitch Control Unit (PCU), (2) the Generator Control Unit (GCU) and (3) the Turbine Control Unit (TCU).
The TCU is the heart of the turbine control system that is responsible for all the overall wind turbine operation, including generator torque command, pitch position, rotor speed control, yaw control, alarms, Supervisory Control and Data Acquisition (SCADA) communication, and operator interface control.
The GCU is a power electronics package using both rectification and inversion of the DGD generator outputs as discussed above.
The PCU is a motion control system consisting of three independent pitch gear motors, one for each of the three blades. These gear motors are driven by a servo motor amplifier or by separate packages. To assure pitch control redundancy, three battery packages are used, one for each motor, to pitch the blades to feather during a fault condition. Other electrical storage devices such as Ultra Capacitors were considered by CWT as a replacement for batteries. Although Ultra Capacitors offer several advantages over batteries, including reduced weight, faster charging and larger operating temperature range, they are currently 5 to 10 times the cost of batteries. For the purposes of this design, it is assumed that either batteries or capacitors may be used.
To assure proper operation of these systems, a separate turbine safety monitor is employed. The turbine safety monitor is an independent system used to monitor the health of the control system. The turbine safety monitor consists of a series‐connection of switches (called the safety loop), tied to three emergency feather command relays located inside the PCU. These relays
11
command the pitch motors to operate on their individual internal batteries, pitching the blades to a 90° feathered position. Any single open switch will cause the turbine to pitch to 90°, protecting it from damage. All switches must be in their normally closed position in order for the TCU and PCU to pitch the turbine blades to their operating position for normal turbine control.
The turbine safety monitor safety loop includes several Emergency Stop Buttons attached to both the nacelle and to a down‐tower junction box located just inside the base of the tower. Other safety functions included in the loop are: hub lock switch, independent over speed monitor switch, independent vibration monitor, PCU Watch Dog Timer switch, GCU Watch Dog Timer switch, and finally a TCU Watch Dog Monitor switch. The TCU Watch Dog Monitor (WDM) will not only indicate when the TCU processor fails, but when there is failure in communication between the TCU and PCU or, TCU and GCU.
Controller design includes protection of the turbine control and drivetrain components from induced and conducted transient over voltages through proper grounding, shielding, and electrical bonding techniques. Each control enclosure is manufactured from steel and bonded to the turbine nacelle grounding system. A single‐point ground system is used to assure low circulating currents and increased lightning protection. The turbine nacelle, although manufactured from fiberglass, contains an internal web of copper, forming a Faraday cage for overall protection. A lightning rod is employed, attached to the top of the nacelle. Finally, all incoming and outgoing copper wires from the GCU, TCU, and PCU are protected by a series of transient surge protection devices such as transient voltage suppression (TVS) diodes, capacitors, gas discharge tubes, and Metal Oxide Varistors (MOV), as required by the type of circuits being protected.
The entire control system including the PCU, GCU, TCU, and the Turbine Safety System is designed to operate over an extended temperature range of –40 to +50° C and 0 to 100% humidity including condensing atmosphere. This extended environmental range encompasses what is expected in the United States and especially in the Midwest and Southwestern states.
3.7. Powertrain Component Specifications The primary goal of this task was to design and specify the different DGD drivetrain components in enough detail to obtain valid quotations from gearbox manufacturers. The drawing package and BOM were sent to nine gear manufactures.
The DGD bill of materials and detailed drawings were developed based on the loads document. The design life of the box is 30 years, based on IEC and American Gear Manufacturers Association (AGMA) standards. The bull gear, together with the eight intermediate shaft assemblies, and eight high‐speed shaft assemblies were specified. The intermediate assembly includes an intermediate pinion and an intermediate gear. The high‐speed assembly includes a duplex gear on a common pinion shaft.

12
The balance of the system including bearings, housing details, low‐speed shaft and coupling, and torque arms was also specified. The high‐speed slip coupling for the generator was also specified.
Another important outcome of this study is that the projected weight of the DGD system was about 35% lower than any comparable commercial system available. This is basically the promise of the DGD concept, higher reliability and lower weight.
The synchronous generator and general power electronics (PE) specifications were completed. A generator was ordered from Potencia Industrial, S. A. The detailed design of the PE and generator system was led by Dr. William Erdman under a consulting agreement. Clipper was also successful in hiring Mr. Kevin Cousineau as Director of Electrical and Controls Engineering. Mr. Cousineau together with Dr. Erdman and Larry Howes completed the detailed specifications for the PE and generator systems controls.
3.8. Design of Gearbox Housing, Bearings, and Lubrication Systems 3.8.1. Gear Box Housing The gearbox housing was completed. The components were cast at a foundry in Brazil, Industrias Romi S/A, and arrived at Brad Foote Gear Works around December 1, 2003. Brad Foote then completed all of the machining on the housings, which were then assembled with the rest of the gearbox components.
Source Clipper Windpower Technology
Table 1. Casting Inspection RequirementsPart Number
Name NDT Prototype
NDT Production
10029-03 1 FORWARD HOUSING UT UT 10030-04 6 INTERMEDIATE BEARING RETAINER UT - 10031-04 1 FORWARD RETAINER UT - 10033-03 1 HOUSING COVER UT - 10034-03 1 MAIN HOUSING UT - 10036-03 8 INTERMEDIATE COVER UT - 10039-02 1 INPUT SHAFT X-RAY UT 10048-03 4 GENERATOR ADAPTOR UT - 10050-04 1 CONDUIT SEAL UT - 10052-04 1 INPUT SHAFT RETAINER UT - 10053-04 1 FORWARD CONDUIT SEAL UT - 10062-04 2 INTERMEDIATE BEARING RETAINER UT - 10065-07 8 INTERMEDIATE ADAPTOR UT - 10066-04 8 HIGH SPEED RETAINER UT - 10067-07 8 HIGH SPEED LABYRINTH UT - 10068-07 8 HIGH SPEED LABYRINTH SLEEVE UT - 10069-07 16 HIGH SPEED BUSHING UT -
13
Each casting is permanently marked with a heat number. Individual castings may then be
traced back to reports that detail the chemical and mechanical properties of the batch from which it originated from. Each report contains the required metal composition, pour temperature, heat number, pour time, and mold number.
Some cast components have special testing requirements; these are shown on the part drawings. The stress critical components require radiograph (X‐Ray) or ultrasonic testing (UT) to the proper American Society for Testing and Materials (ASTM) specification. Table 1 shows the inspection requirements for both the prototype and production castings. Once the casting process is validated, the components don’t require extensive special testing.
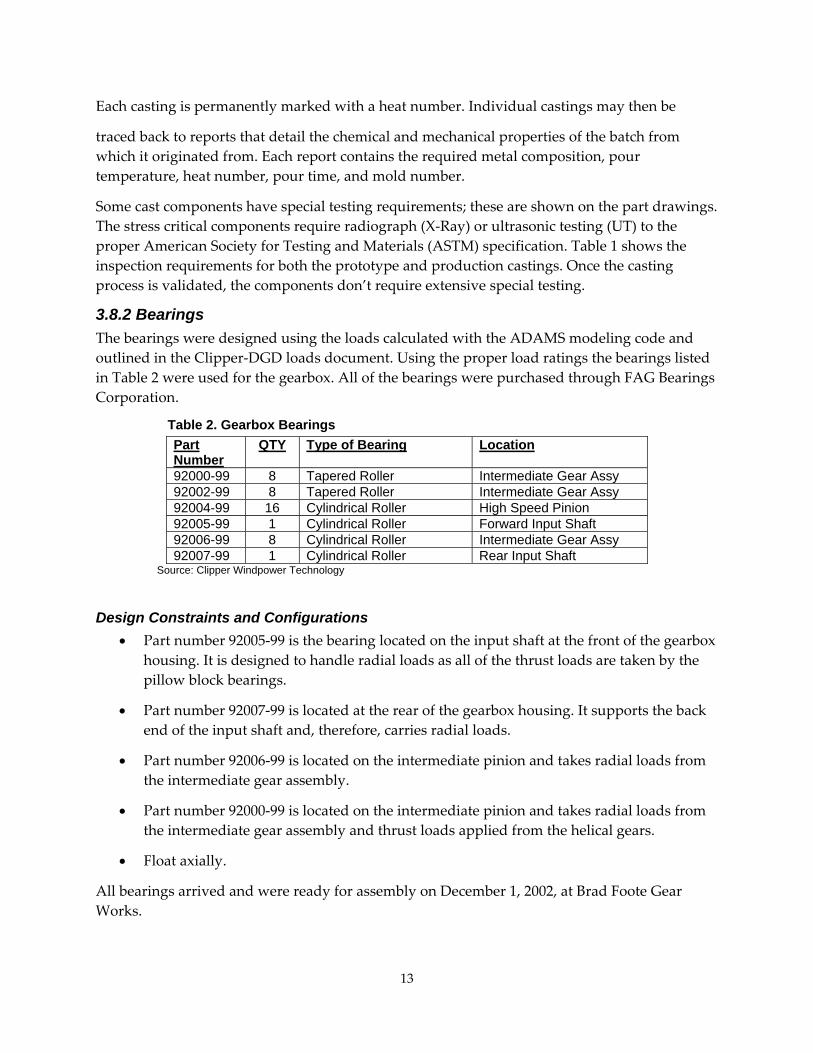
3.8.2 Bearings The bearings were designed using the loads calculated with the ADAMS modeling code and outlined in the Clipper‐DGD loads document. Using the proper load ratings the bearings listed in Table 2 were used for the gearbox. All of the bearings were purchased through FAG Bearings Corporation.
Table 2. Gearbox Bearings Part Number
QTY Type of Bearing Location
92000-99 8 Tapered Roller Intermediate Gear Assy 92002-99 8 Tapered Roller Intermediate Gear Assy 92004-99 16 Cylindrical Roller High Speed Pinion 92005-99 1 Cylindrical Roller Forward Input Shaft 92006-99 8 Cylindrical Roller Intermediate Gear Assy 92007-99 1 Cylindrical Roller Rear Input Shaft
Source: Clipper Windpower Technology
Design Constraints and Configurations
• Part number 92005‐99 is the bearing located on the input shaft at the front of the gearbox housing. It is designed to handle radial loads as all of the thrust loads are taken by the pillow block bearings.
• Part number 92007‐99 is located at the rear of the gearbox housing. It supports the back end of the input shaft and, therefore, carries radial loads.
• Part number 92006‐99 is located on the intermediate pinion and takes radial loads from the intermediate gear assembly.
• Part number 92000‐99 is located on the intermediate pinion and takes radial loads from the intermediate gear assembly and thrust loads applied from the helical gears.
• Float axially.
All bearings arrived and were ready for assembly on December 1, 2002, at Brad Foote Gear Works.
14
3.8.3 Lubrication System The lubrication system design was completed. The heat load was calculated using the assumed gearbox transmission efficiency and the estimated radiation and convection cooling.
The lubrication system will provide a combination of cooling, pumping, and filtration. CWT specified a system from HYDAC Technology Corporation. The following requirements were specified to HYDAC:
• 15 gallon per minute (gpm) flow minimum.
• 40 kW heat dissipation.
• ISO VG 320 oil.
• 45 pound per square inch (psi) maximum working outlet pressure.
• 10 micron at operating temp / 50 micron during cold start filtration.
• Air‐cooled.
• Temperature and pressure monitoring.
The above system uses an electronic pump that runs off 230/460 or 575 volts. There is a mechanical pump that is attached to the gearbox for “no‐power” situations when the turbine is pin‐wheeling. A 320 viscosity synthetic oil was deemed optimal for the DGD operating temperatures. The pump was ordered from HYDAC in October 2002 and delivered to Brad Foote for installation.
3.9. Final Mechanical Design Below is a summary describing the evolution of the gearbox design, component specification, design constraints, manufacturing specifications, finite element analysis, and development of detailed mechanical and assembly drawings.
3.9.1. Loads Global Energy Concepts, LLC, developed the loads used for the design of the DGD. The loads document defines load cases for the major structural components between the rotor hub and tower top. It also specifies the required partial safety factors for loads and materials.
Geometric constraints were present because the DGD was designed to fit within a 1.5 MW baseline turbine. Ed Hahlbeck of Powertrain Engineers, Inc., completed a report that discusses the physical envelope constraints for the gearbox. One such limitation is the width of the bedplate. Rails on each side of the bedplate constrain the width of the gear housing. Other geometric constraints are possible interferences between generators, main shaft alignment, and other nacelle structural components. Parametric iterations were performed in order to arrive at the optimal gear and housing sizes.
15
There were many different generator configurations that were considered for the DGD. Some of these possibilities were equal number of generators on both sides of the gearbox (upwind and downwind); different number of generators on the downwind side compared to the upwind side; and generators located only on the downwind side.
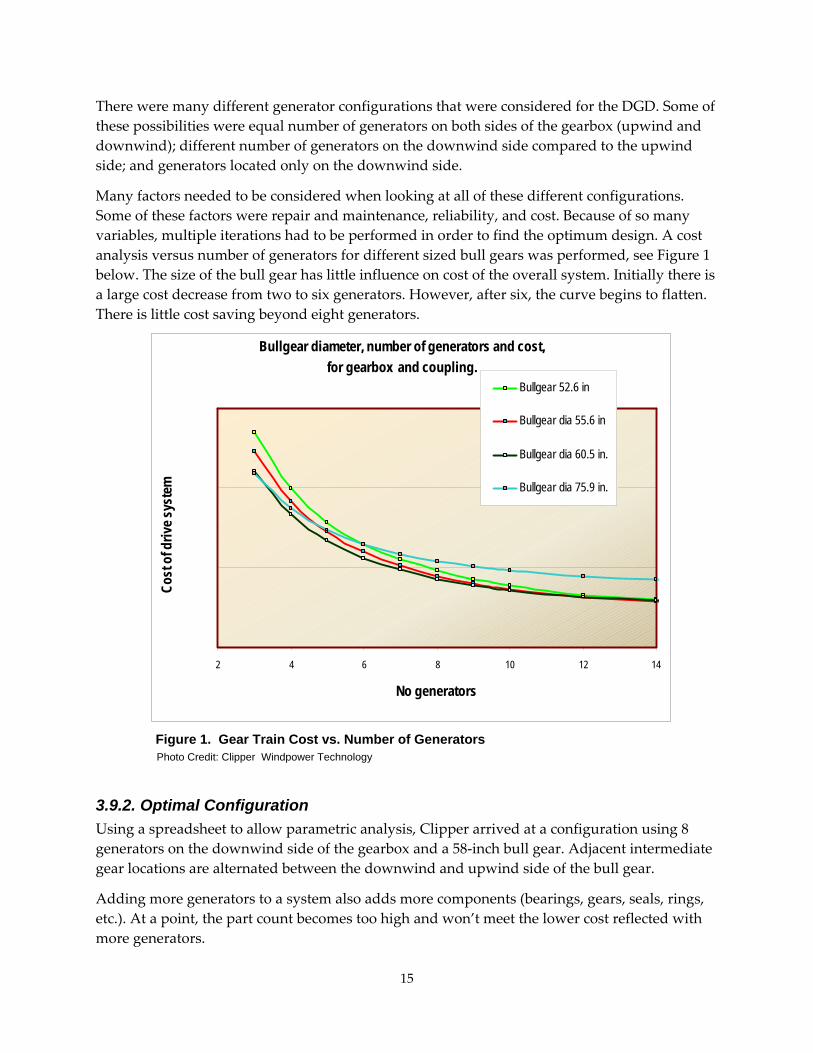
Many factors needed to be considered when looking at all of these different configurations. Some of these factors were repair and maintenance, reliability, and cost. Because of so many variables, multiple iterations had to be performed in order to find the optimum design. A cost analysis versus number of generators for different sized bull gears was performed, see Figure 1 below. The size of the bull gear has little influence on cost of the overall system. Initially there is a large cost decrease from two to six generators. However, after six, the curve begins to flatten. There is little cost saving beyond eight generators.
Figure 1. Gear Train Cost vs. Number of Generators Photo Credit: Clipper Windpower Technology
3.9.2. Optimal Configuration Using a spreadsheet to allow parametric analysis, Clipper arrived at a configuration using 8 generators on the downwind side of the gearbox and a 58‐inch bull gear. Adjacent intermediate gear locations are alternated between the downwind and upwind side of the bull gear.
Adding more generators to a system also adds more components (bearings, gears, seals, rings, etc.). At a point, the part count becomes too high and won’t meet the lower cost reflected with more generators.
Bullgear diameter, number of generators and cost,for gearbox and coupling.
2 4 6 8 10 12 14
No generators
Cost
of d
rive s
yste
m
Bullgear 52.6 in
Bullgear dia 55.6 in
Bullgear dia 60.5 in.
Bullgear dia 75.9 in.
16
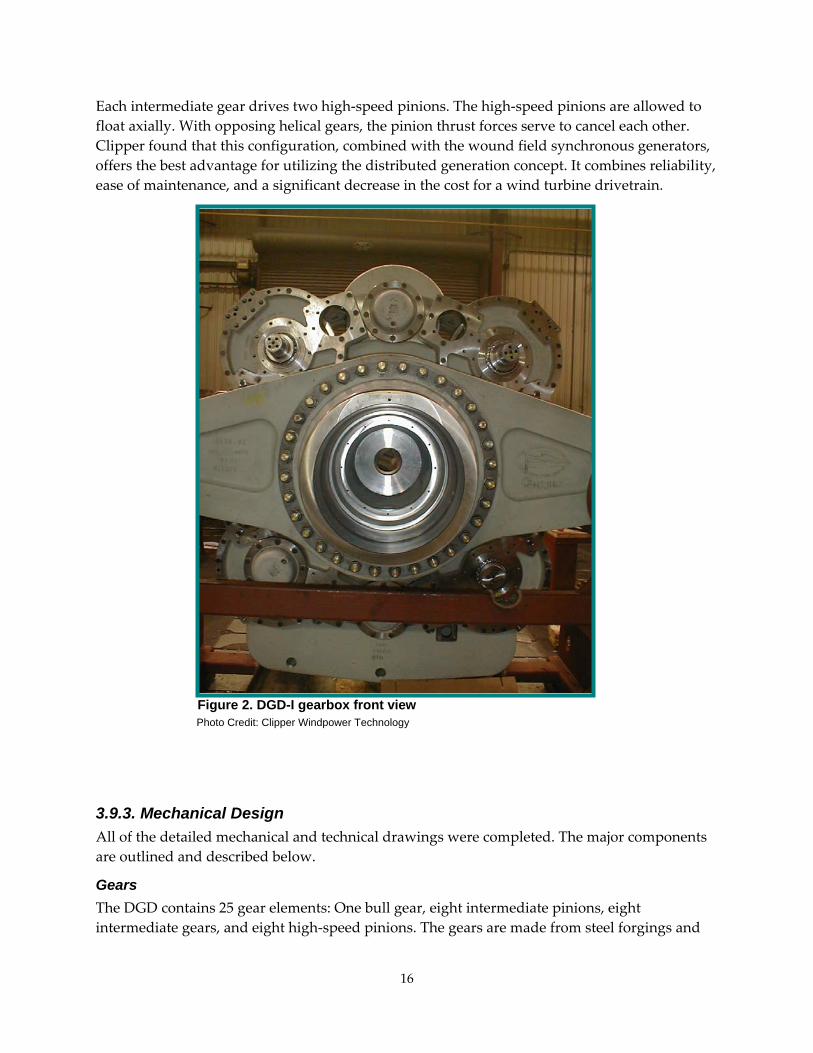
Each intermediate gear drives two high‐speed pinions. The high‐speed pinions are allowed to float axially. With opposing helical gears, the pinion thrust forces serve to cancel each other. Clipper found that this configuration, combined with the wound field synchronous generators, offers the best advantage for utilizing the distributed generation concept. It combines reliability, ease of maintenance, and a significant decrease in the cost for a wind turbine drivetrain.
Figure 2. DGD-I gearbox front view Photo Credit: Clipper Windpower Technology
3.9.3. Mechanical Design All of the detailed mechanical and technical drawings were completed. The major components are outlined and described below.
Gears The DGD contains 25 gear elements: One bull gear, eight intermediate pinions, eight intermediate gears, and eight high‐speed pinions. The gears are made from steel forgings and
17
the pinions from steel bar stock. All gear teeth are heat treated to AGMA standard effective depth and hardness.
The gearing is controlled by a ratio of pinion face width to pitch diameter. Increasing pinion face width results in greater risk of losing contact between teeth because of deflection and manufacturing errors. This ratio is limited to 1.25 by AGMA/AWEA 921‐A97 “Recommended Practices for Design and Specification of Gearboxes for Wind Turbine Generator Systems.”
All of the gear elements were designed using the calculations analyzed with the program AGMA218.
Bearings The proper bearings were selected using the developed loads. Cumulative fatigue damage on the bearings was estimated using Miners Rule. Using AGMA and ISO bearing life calculations, as well as an IEC Class II 30‐year design loads spectra, the bearings were deemed to have sufficient life.
Lubrication The lubrication system is a combination of cooling, pumping, and filtration elements. The bull gear provides oil to the intermediate pinion by way of the sump. A pressurized “spitting” system is needed in order to lubricate the other gear elements in addition to the bearings. Lubrication calculations were performed in order to determine the heat load on the gearbox.
It was calculated that the heat load needed on the cooling system was 32 kilowatts (kW). This was calculated by computing the overall transmission efficiency and the estimated radiation and convective cooling that would occur through the casing.
A secondary mechanical pump is used in “no‐power” conditions. The pump is driven off of the bull gear at a speed of 3 rpm (pin wheeling). The mechanical pump will deliver about 10% of the flow of the powered system. This was deemed a sufficient amount of oil delivery to bearings and gears to prevent fretting during no‐load conditions.
Gear Housings The gearbox is encased by a sandwich‐style housing. The three components‐ main housing, housing cover and intermediate covers‐ are what contain the gears and bearings. This portion of the gearbox sees no mainshaft bending loads from the rotor, only gravity loads. The forward housing through two support arms supports the entire gearbox. The forward housing reacts rotor loads and supports the weight of the gearbox.
The forward housing is made from cast ductile iron. All of the other housing pieces are cast from gray iron.
Brakes The brake system on the DGD utilizes the intermediate speed pinions. Their location is an ideal compromise between the low‐speed (high‐torque) shaft and the high‐speed shafts. The DGD is configured to allow four brakes on the intermediate pinions. However, only two systems are needed to achieve the proper braking limits, which are that of parking brakes. The intermediate

18
pinion is fit to a brake disc rotor via a splined shaft. The calipers are hydraulically applied through a power pack unit.
Couplings There are two different coupling systems used in the DGD. The first is a shrink disc that couples the main shaft of the turbine to the input shaft on the gearbox. The disc being used is a double‐taper inner ring‐locking device.
The other coupling system is located between the high‐speed pinion and generator. It connects the high‐speed pinion to the rotor on the generator but also contains a torque‐limiting coupling between the two.
The torque coupling is in place in case of faults that can occur on the generator side. Because of the possibility of high torque input due to electric faults, a slip coupling is needed. The high‐speed pinion has a spline fit to the slip coupling. A cast iron torque clutch is placed into the slip portion of the coupling at one end and bolted to a thrust disc at the other. The thrust discs are multiple thin pieces of sheet metal that allow for misalignment axially. The inner portion of the thrust disc is bolted to the generator rotor. The entire system provides a safety barrier between the electrical and mechanical sections of the power train.
Manufacturing Specifications Manufacturing lot control for all piece parts is vital to the manufacturing and quality programs. Each part is permanently marked with a unique number to identify its lot number. The lot number will be a link to information such as inspection data, material certificates, materials vendor, and heat treatment information.
Heat treatment information should contain pour dates and time, heat number, material composition, furnace charts, and test coupons. Detailed gearing information: tooth accuracy, analytical inspection, tooth finish, and materials are needed as well. There are 17 castings for the DGD. All of the large castings are checked 100% for Brinell hardness. All prototype castings were inspected by either X‐Ray or UT.
Finite Element Analysis Finite element analysis was performed on the two components subjected to the highest structural loads. The first was the forward housing, and the second was the generator adaptor.
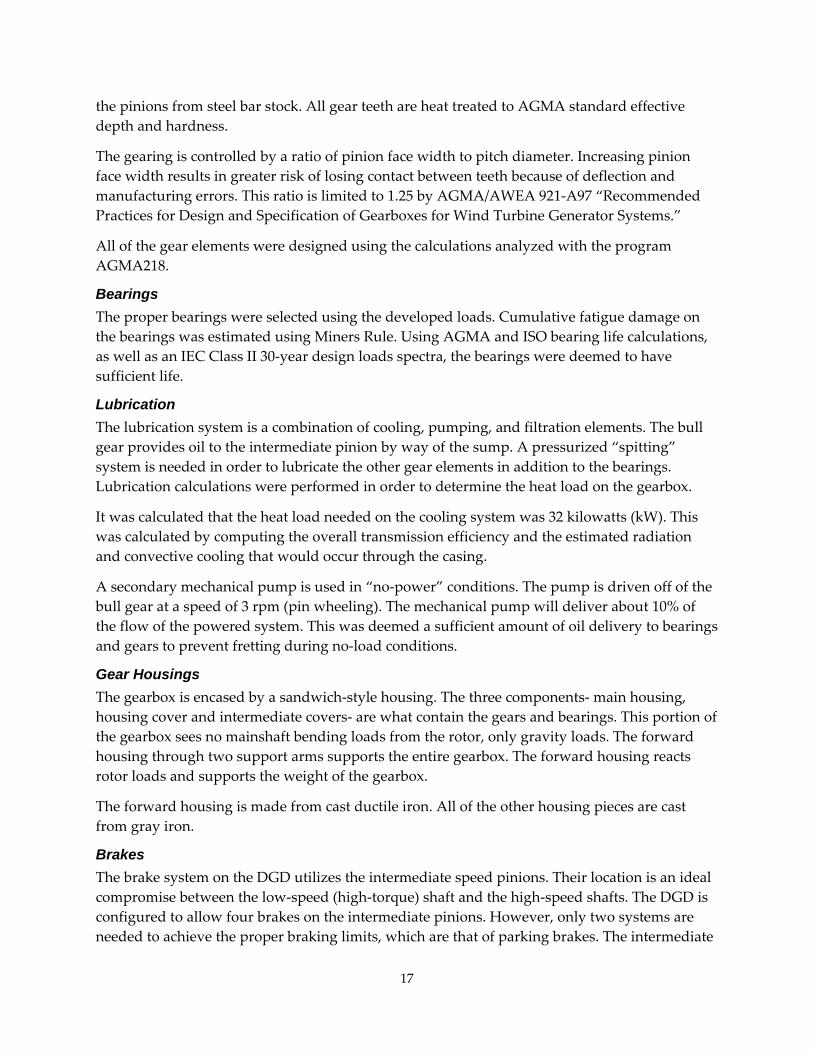
Forward Housing The support arms of the forward housing are subject to rotor hub loads and, therefore, were analyzed for fatigue strength. The ultimate design loads were defined from the loads document. The analysis consisted of two load cases: axial fatigue stress and bending fatigue stress.
The conclusion from the analysis was the forward housing would meet the 30‐year fatigue life requirements. The Finite Element Analysis (FEA) analysis was performed by Mechanical Design Engineering Consultants (MDEC), see Figure 3 below.
19
Figure 3. FEA of forward housing, axial fatigue stresses Photo Credit: Clipper Windpower Technology
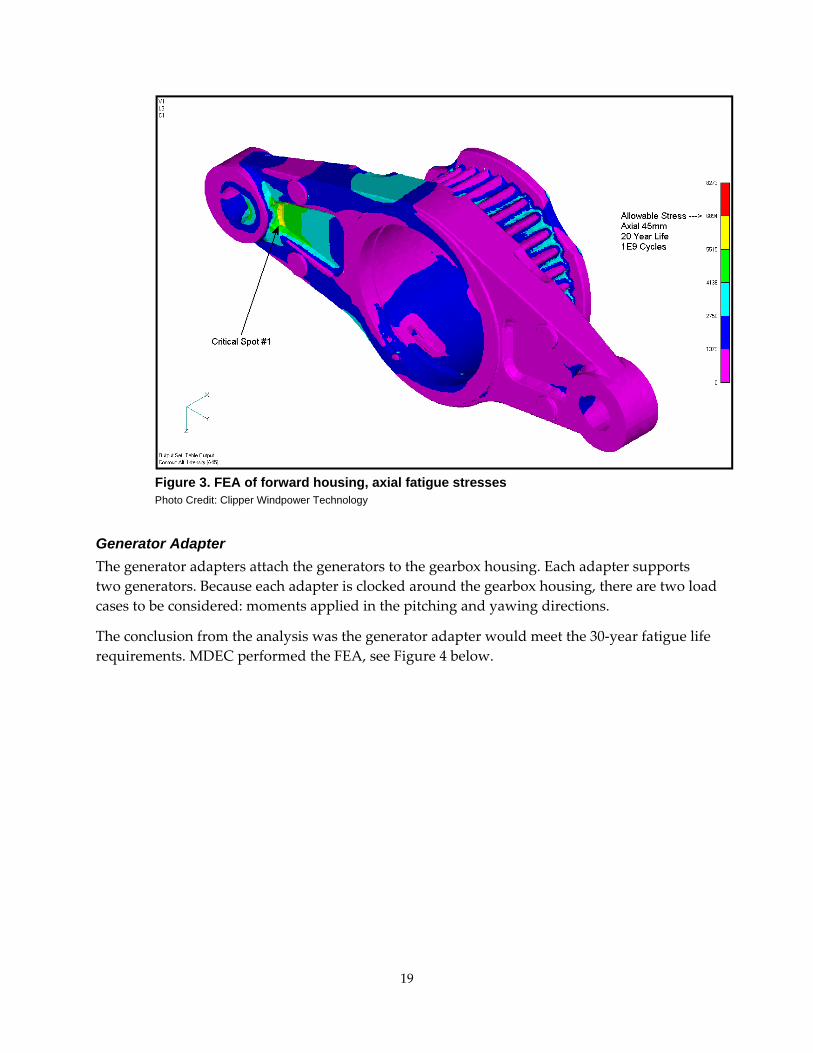
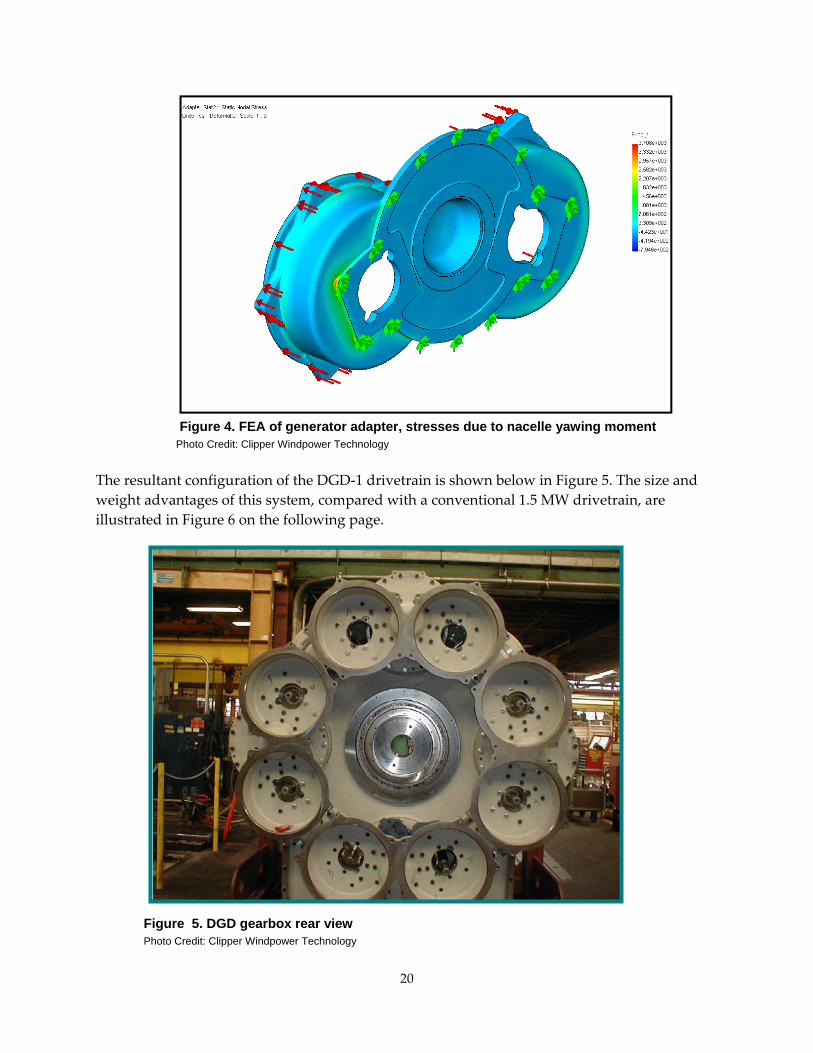
Generator Adapter The generator adapters attach the generators to the gearbox housing. Each adapter supports two generators. Because each adapter is clocked around the gearbox housing, there are two load cases to be considered: moments applied in the pitching and yawing directions.
The conclusion from the analysis was the generator adapter would meet the 30‐year fatigue life requirements. MDEC performed the FEA, see Figure 4 below.
20
Figure 4. FEA of generator adapter, stresses due to nacelle yawing moment Photo Credit: Clipper Windpower Technology
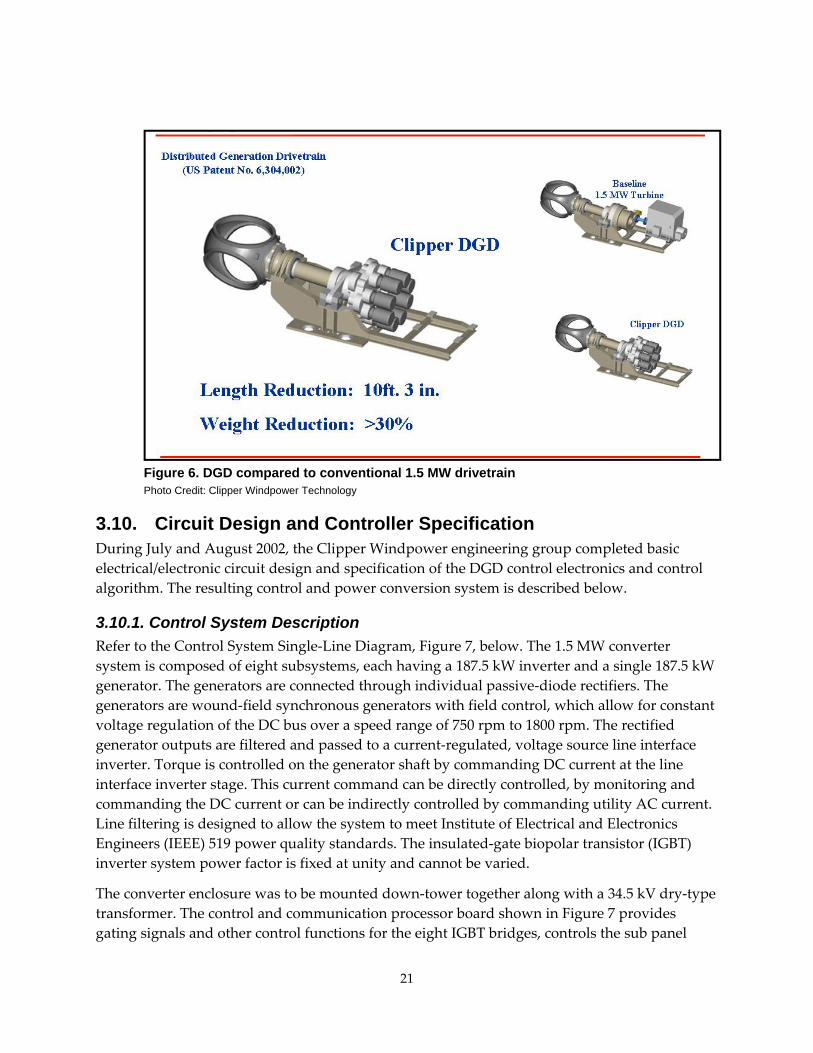
The resultant configuration of the DGD‐1 drivetrain is shown below in Figure 5. The size and weight advantages of this system, compared with a conventional 1.5 MW drivetrain, are illustrated in Figure 6 on the following page.
Figure 5. DGD gearbox rear view Photo Credit: Clipper Windpower Technology
21
Figure 6. DGD compared to conventional 1.5 MW drivetrain Photo Credit: Clipper Windpower Technology
3.10. Circuit Design and Controller Specification During July and August 2002, the Clipper Windpower engineering group completed basic electrical/electronic circuit design and specification of the DGD control electronics and control algorithm. The resulting control and power conversion system is described below.
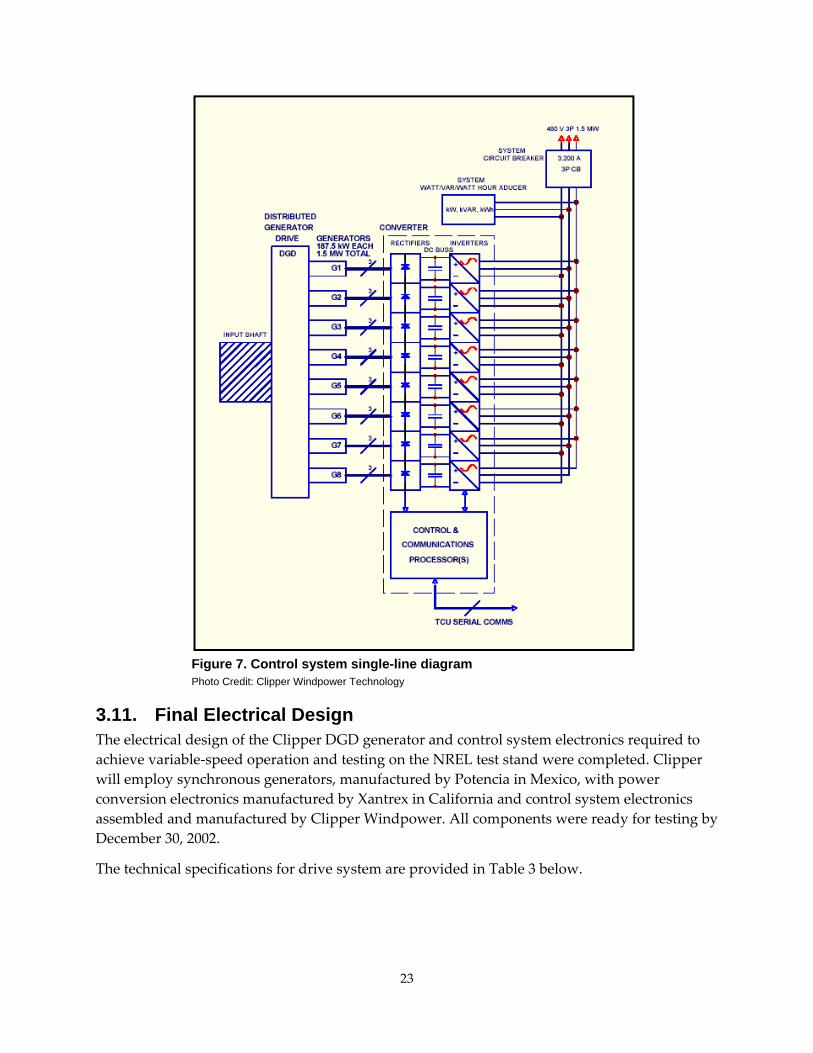
3.10.1. Control System Description Refer to the Control System Single‐Line Diagram, Figure 7, below. The 1.5 MW converter system is composed of eight subsystems, each having a 187.5 kW inverter and a single 187.5 kW generator. The generators are connected through individual passive‐diode rectifiers. The generators are wound‐field synchronous generators with field control, which allow for constant voltage regulation of the DC bus over a speed range of 750 rpm to 1800 rpm. The rectified generator outputs are filtered and passed to a current‐regulated, voltage source line interface inverter. Torque is controlled on the generator shaft by commanding DC current at the line interface inverter stage. This current command can be directly controlled, by monitoring and commanding the DC current or can be indirectly controlled by commanding utility AC current. Line filtering is designed to allow the system to meet Institute of Electrical and Electronics Engineers (IEEE) 519 power quality standards. The insulated‐gate biopolar transistor (IGBT) inverter system power factor is fixed at unity and cannot be varied.
The converter enclosure was to be mounted down‐tower together along with a 34.5 kV dry‐type transformer. The control and communication processor board shown in Figure 7 provides gating signals and other control functions for the eight IGBT bridges, controls the sub panel

22
(where solid‐state relay and other switchgear reside), and performs communication and reporting functions to the Turbine Control Unit (TCU). This TCU, mounted uptower, is responsible for control of the turbine, and provides torque commands to the converter system.
187.5 kW Individual Drive Description Each 187.5 kW converter system is replicated eight times for a total power output of 1.5 MW. The generator field regulator, not shown in Figure 7, is used to regulate the generator AC voltage and thereby provides a relatively constant DC bus voltage for the IGBT utility interface inverter. With individual field regulators for each generator, power delivery expects to be balanced within 2%. With field control on multiple generators (should the IGBT converter vendor want to supply a larger inverter(s) serving multiple generators, for cost reduction), any differences in field current will show up as an imbalance in the power delivered by the generators. The inherent voltage imbalance is expected to be small, and the generator series impedance reduces the difference in power delivery further. This series impedance has the effect of reducing terminal voltage on any one generator, which attempts to take on too much load. Also, the thermal coefficient of the resistive portion of the generator impedance provides an imbalance mitigating effect, which further helps to match generator loads. Using this approach, generator power delivery is balanced to within 2 to 3%.
A second control function designed for this system is a torque/DC current regulator. This regulator looks at both wind turbine speed and commanded torque. The relationship is executed in the main TCU microprocessor. The torque command is passed from the TCU to the power conversion system over the serial communication link. The torque command is received by the converter, and together with the measured field current, a particular DC current is requested. The commanded DC current is formed essentially from the product of Torque (T) and field current (IF). This simple relationship is complicated somewhat when field saturation is included; however, this phenomenon can be determined a priori and compensated for.
23
Figure 7. Control system single-line diagram Photo Credit: Clipper Windpower Technology
3.11. Final Electrical Design The electrical design of the Clipper DGD generator and control system electronics required to achieve variable‐speed operation and testing on the NREL test stand were completed. Clipper will employ synchronous generators, manufactured by Potencia in Mexico, with power conversion electronics manufactured by Xantrex in California and control system electronics assembled and manufactured by Clipper Windpower. All components were ready for testing by December 30, 2002.
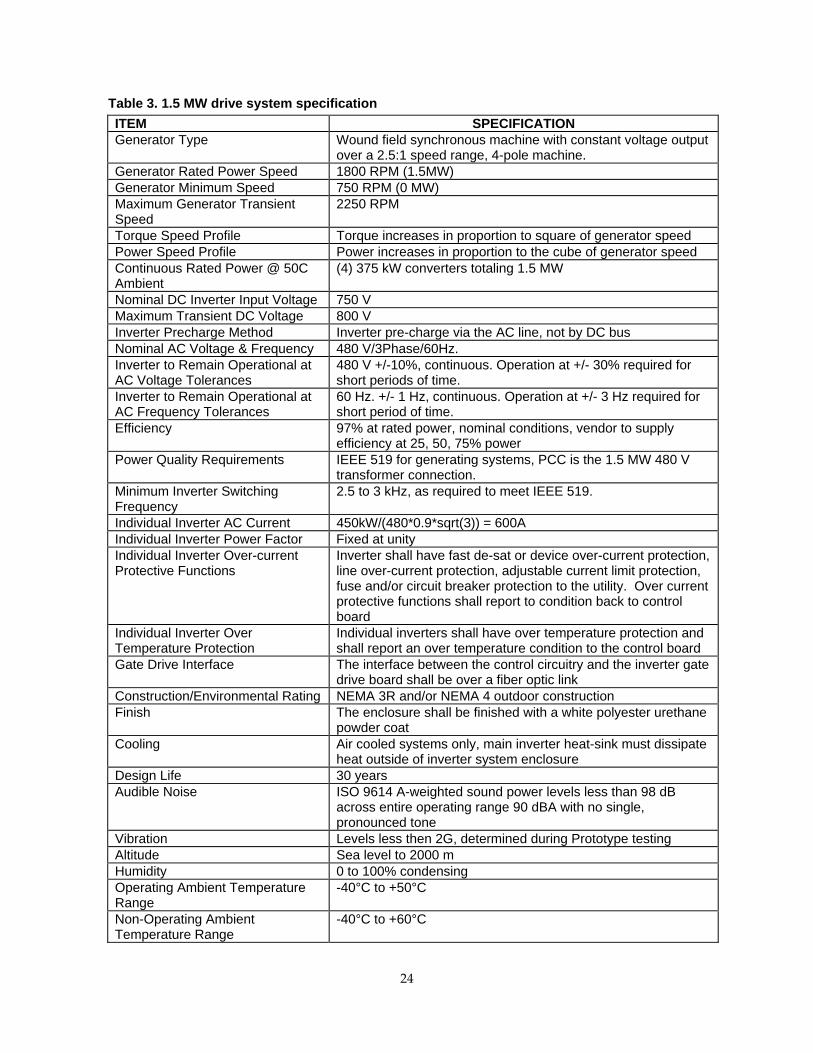
The technical specifications for drive system are provided in Table 3 below.
24
Table 3. 1.5 MW drive system specification ITEM SPECIFICATION Generator Type Wound field synchronous machine with constant voltage output
over a 2.5:1 speed range, 4-pole machine. Generator Rated Power Speed 1800 RPM (1.5MW) Generator Minimum Speed 750 RPM (0 MW) Maximum Generator Transient Speed
2250 RPM
Torque Speed Profile Torque increases in proportion to square of generator speed Power Speed Profile Power increases in proportion to the cube of generator speed Continuous Rated Power @ 50C Ambient
(4) 375 kW converters totaling 1.5 MW
Nominal DC Inverter Input Voltage 750 V Maximum Transient DC Voltage 800 V Inverter Precharge Method Inverter pre-charge via the AC line, not by DC bus Nominal AC Voltage & Frequency 480 V/3Phase/60Hz. Inverter to Remain Operational at AC Voltage Tolerances
480 V +/-10%, continuous. Operation at +/- 30% required for short periods of time.
Inverter to Remain Operational at AC Frequency Tolerances
60 Hz. +/- 1 Hz, continuous. Operation at +/- 3 Hz required for short period of time.
Efficiency 97% at rated power, nominal conditions, vendor to supply efficiency at 25, 50, 75% power
Power Quality Requirements IEEE 519 for generating systems, PCC is the 1.5 MW 480 V transformer connection.
Minimum Inverter Switching Frequency
2.5 to 3 kHz, as required to meet IEEE 519.
Individual Inverter AC Current 450kW/(480*0.9*sqrt(3)) = 600A Individual Inverter Power Factor Fixed at unity Individual Inverter Over-current Protective Functions
Inverter shall have fast de-sat or device over-current protection, line over-current protection, adjustable current limit protection, fuse and/or circuit breaker protection to the utility. Over current protective functions shall report to condition back to control board
Individual Inverter Over Temperature Protection
Individual inverters shall have over temperature protection and shall report an over temperature condition to the control board
Gate Drive Interface The interface between the control circuitry and the inverter gate drive board shall be over a fiber optic link
Construction/Environmental Rating NEMA 3R and/or NEMA 4 outdoor construction Finish The enclosure shall be finished with a white polyester urethane
powder coat Cooling Air cooled systems only, main inverter heat-sink must dissipate
heat outside of inverter system enclosure Design Life 30 years Audible Noise ISO 9614 A-weighted sound power levels less than 98 dB
across entire operating range 90 dBA with no single, pronounced tone
Vibration Levels less then 2G, determined during Prototype testing Altitude Sea level to 2000 m Humidity 0 to 100% condensing Operating Ambient Temperature Range
-40°C to +50°C
Non-Operating Ambient Temperature Range
-40°C to +60°C

25
TCU Interface Fiber Optic Serial Connection, up to 115 k baud. Protection System Interface Single Emergency Stop Button wired into Safety Loop
Source: Clipper Windpower Technology 3.11.1. Generator Final Design The generators used are wound‐field, synchronous machines. Although custom in their construction, they are a standard generator design used throughout the aerospace and automotive industries. The size and physical layout of the individual generators, as installed on the system,are illustrated in Figure 8.
A total of eight generators are used, each rated at 240 kW, allowing the total maximum power output of 1.92 MW or 28% higher than the 1.5 MW rated power of the DGD. This extra power capacity provided for easy overload testing of the gearbox without electrically overloading the generators. Each generator is rated at 690 Vac, a voltage level required to achieve power flow into the 575V utility line.
Generator output voltage is maintained between 670 and 740 Vac through the turbine control system developed by Clipper. This system measures the generators RMS output voltage, generator frequency and the torque demand (process variables) and outputs a field voltage and current required to maintain the line voltage based on the process variables.
The generator is designed to maintain its output voltage based on a required exciter field voltage and current over an operating speed range of 800 to 1800 rpm, a 2 to 1 speed/ratio range. This is by far the largest variable speed range of any utility grade drivetrain or wind turbine currently in production or in operation.
Eight of 10 generators manufactured were shipped to Brad Foote Gear Works on November 26, 2002. The remaining two generators ordered arrived at NREL before Dec. 30, 2002.
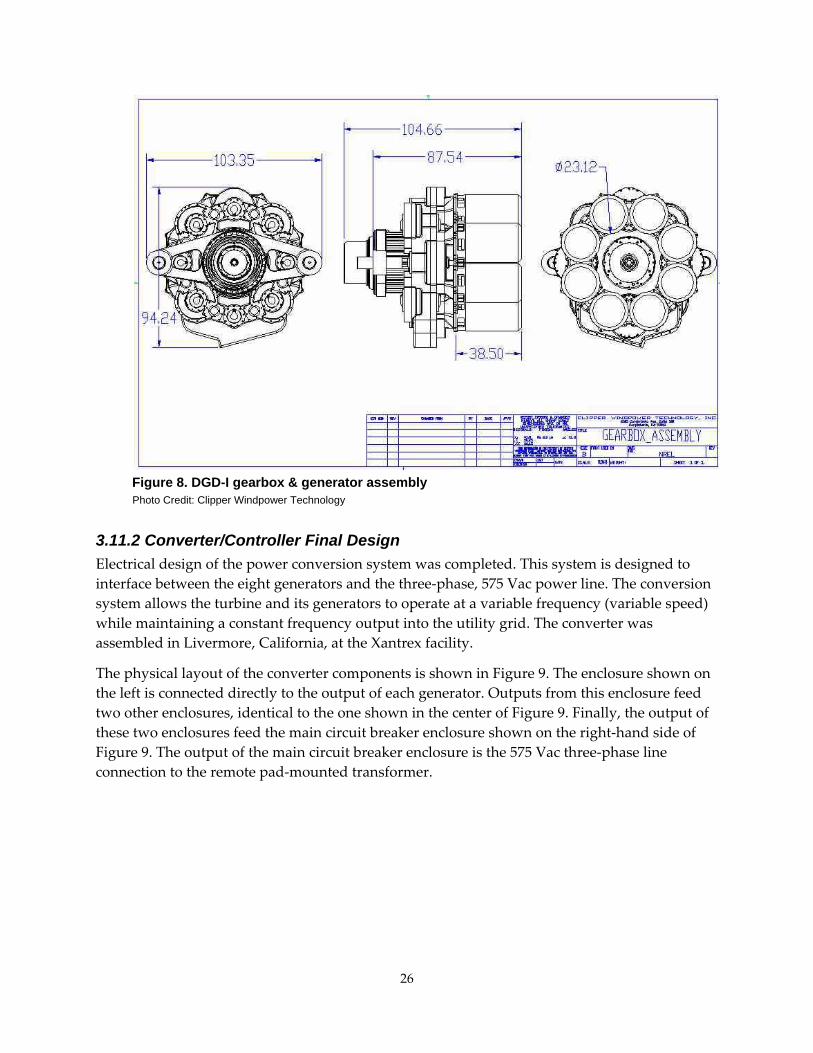
26
Figure 8. DGD-I gearbox & generator assembly
Photo Credit: Clipper Windpower Technology
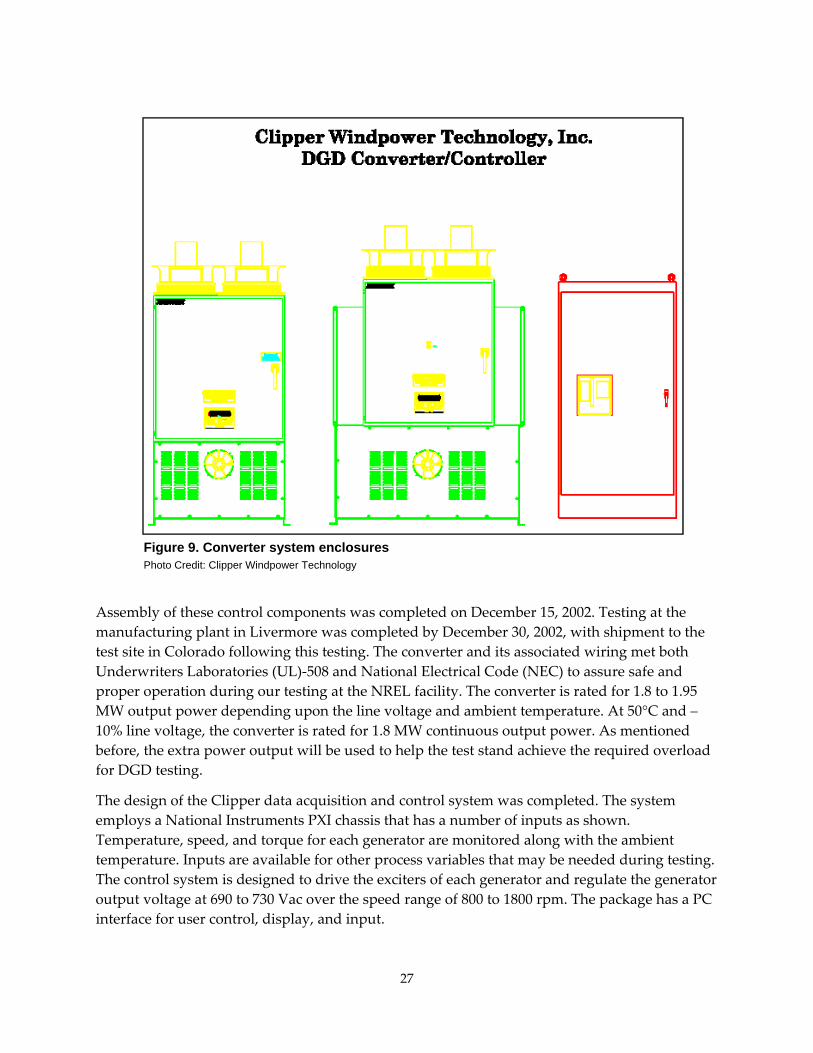
3.11.2 Converter/Controller Final Design Electrical design of the power conversion system was completed. This system is designed to interface between the eight generators and the three‐phase, 575 Vac power line. The conversion system allows the turbine and its generators to operate at a variable frequency (variable speed) while maintaining a constant frequency output into the utility grid. The converter was assembled in Livermore, California, at the Xantrex facility.
The physical layout of the converter components is shown in Figure 9. The enclosure shown on the left is connected directly to the output of each generator. Outputs from this enclosure feed two other enclosures, identical to the one shown in the center of Figure 9. Finally, the output of these two enclosures feed the main circuit breaker enclosure shown on the right‐hand side of Figure 9. The output of the main circuit breaker enclosure is the 575 Vac three‐phase line connection to the remote pad‐mounted transformer.
27
Figure 9. Converter system enclosures Photo Credit: Clipper Windpower Technology
Assembly of these control components was completed on December 15, 2002. Testing at the manufacturing plant in Livermore was completed by December 30, 2002, with shipment to the test site in Colorado following this testing. The converter and its associated wiring met both Underwriters Laboratories (UL)‐508 and National Electrical Code (NEC) to assure safe and proper operation during our testing at the NREL facility. The converter is rated for 1.8 to 1.95 MW output power depending upon the line voltage and ambient temperature. At 50°C and –10% line voltage, the converter is rated for 1.8 MW continuous output power. As mentioned before, the extra power output will be used to help the test stand achieve the required overload for DGD testing.
The design of the Clipper data acquisition and control system was completed. The system employs a National Instruments PXI chassis that has a number of inputs as shown. Temperature, speed, and torque for each generator are monitored along with the ambient temperature. Inputs are available for other process variables that may be needed during testing. The control system is designed to drive the exciters of each generator and regulate the generator output voltage at 690 to 730 Vac over the speed range of 800 to 1800 rpm. The package has a PC interface for user control, display, and input.
28
3.12. Test Planning and Completion of the Test Specification The items below describe the tests to be conducted and describe the test setups. Below is a summary of the test objectives to be executed per the DGD‐1 Test specification.
3.12.1. Test Project Summary This project developed and tested the gearbox, generators, power electronic converter, and drivetrain control system for the Clipper 1.5 MW Turbine. A full‐scale drivetrain was constructed and was tested with a closed‐loop generator field control system on the NREL 2.5 MW dynamometer in Golden, Colorado. Specific operating characteristics were assessed.
Specific objectives included:
• Mechanical Setup and Mechanical Testing: This includes attachment of the drivetrain to the bedplate, filling the gearbox with oil, rotating the input shaft slowly, and checking for noises and leaks. The flow rate and pressure of the lubricating system will also be verified. The drivetrain brake will be tested.
• The high‐speed pinions are instrumented to verify loadsharing and contact patterns at different load levels.
• Generator Field Regulator Testing: Verify through operational testing that the field regulator(s) are capable of achieving constant voltage regulation at the generator(s) output terminals over a 2:1 speed range and full load range.
• Converter Connection: Connect and operate the 1.8 MW Xantrex Power Electronics conversion system, which will feed the drivetrain, generated three‐phase 575 Vac power into the NREL grid during testing. Develop and refine controls for management of the power converter run mode, start mode, stop mode, fault, and alarm modes.
• Functional testing: Incremental additions of generator pairs, verify speed range, and compute efficiency of system and components.
• Accelerated Life Test: Subject the gearbox to running loads at 130% of rated for 1600 hours total time period, which will accomplish accelerated life testing; dismantle and inspect gearbox components at TBD running time interval.
• Fault test: Subject the drivetrain to anticipated Fault conditions: Fault conditions including but not limited to: loss of phase, over‐speed, and electrical (open circuit) load loss.
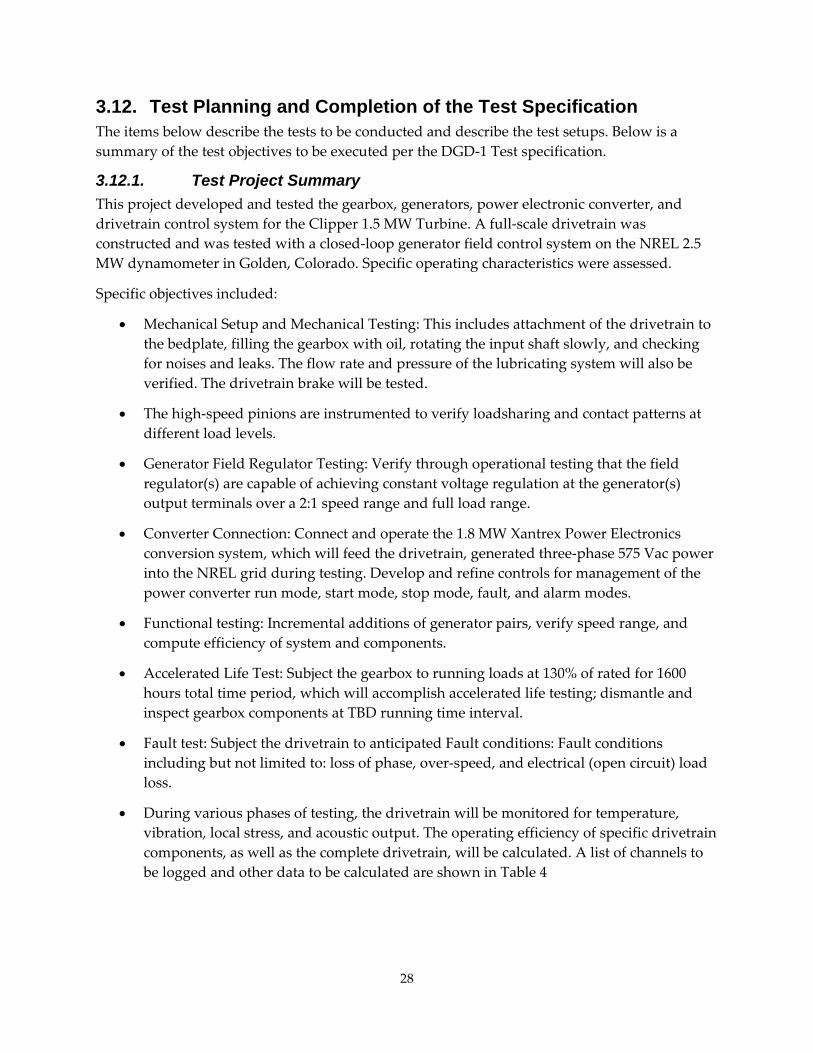
• During various phases of testing, the drivetrain will be monitored for temperature, vibration, local stress, and acoustic output. The operating efficiency of specific drivetrain components, as well as the complete drivetrain, will be calculated. A list of channels to be logged and other data to be calculated are shown in Table 4
29
Table 4. Drivetrain test instrumentation
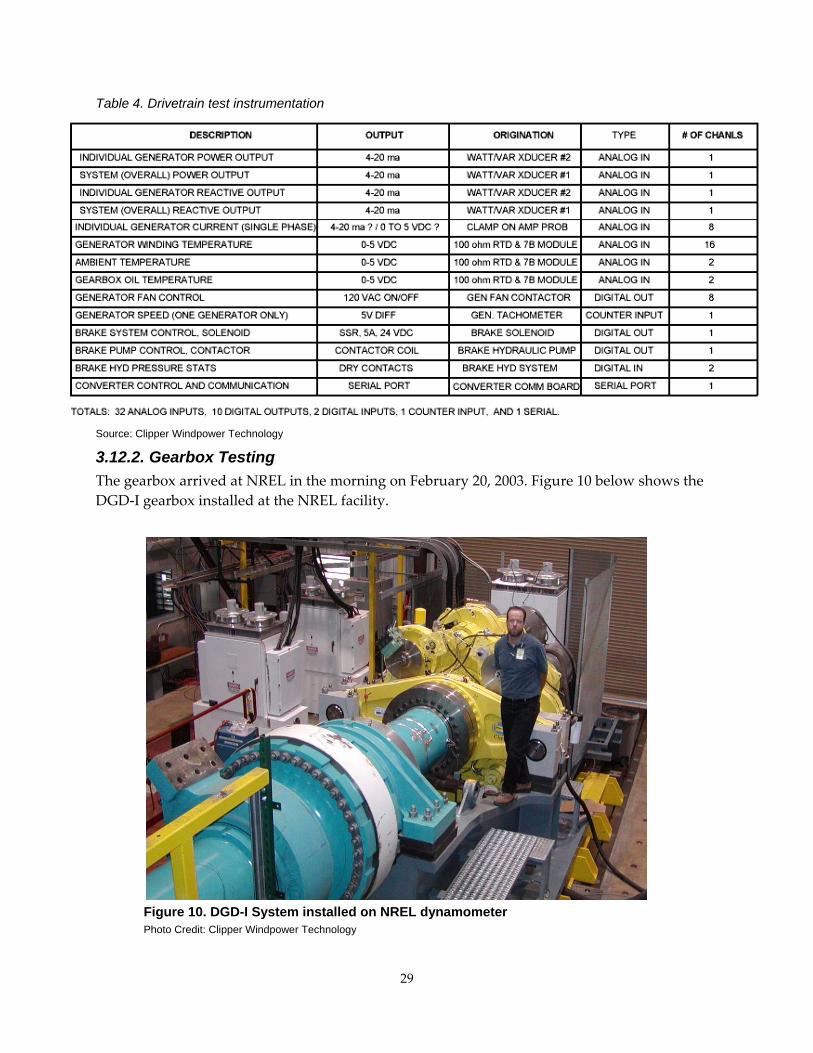
Source: Clipper Windpower Technology 3.12.2. Gearbox Testing The gearbox arrived at NREL in the morning on February 20, 2003. Figure 10 below shows the DGD‐I gearbox installed at the NREL facility.
Figure 10. DGD-I System installed on NREL dynamometer Photo Credit: Clipper Windpower Technology
30
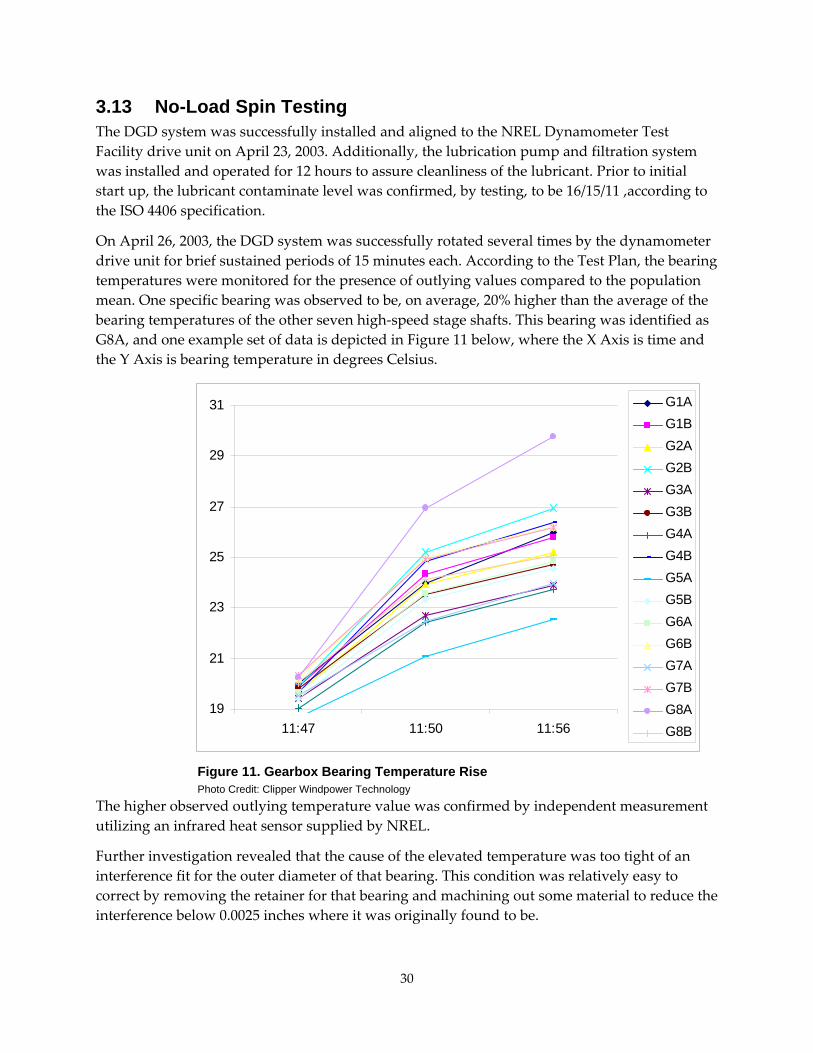
3.13 No-Load Spin Testing The DGD system was successfully installed and aligned to the NREL Dynamometer Test Facility drive unit on April 23, 2003. Additionally, the lubrication pump and filtration system was installed and operated for 12 hours to assure cleanliness of the lubricant. Prior to initial start up, the lubricant contaminate level was confirmed, by testing, to be 16/15/11 ,according to the ISO 4406 specification.
On April 26, 2003, the DGD system was successfully rotated several times by the dynamometer drive unit for brief sustained periods of 15 minutes each. According to the Test Plan, the bearing temperatures were monitored for the presence of outlying values compared to the population mean. One specific bearing was observed to be, on average, 20% higher than the average of the bearing temperatures of the other seven high‐speed stage shafts. This bearing was identified as G8A, and one example set of data is depicted in Figure 11 below, where the X Axis is time and the Y Axis is bearing temperature in degrees Celsius.
Figure 11. Gearbox Bearing Temperature Rise Photo Credit: Clipper Windpower Technology
The higher observed outlying temperature value was confirmed by independent measurement utilizing an infrared heat sensor supplied by NREL.
Further investigation revealed that the cause of the elevated temperature was too tight of an interference fit for the outer diameter of that bearing. This condition was relatively easy to correct by removing the retainer for that bearing and machining out some material to reduce the interference below 0.0025 inches where it was originally found to be.
19
21
23
25
27
29
31
11:47 11:50 11:56
G1AG1BG2AG2BG3AG3BG4AG4BG5AG5BG6AG6BG7AG7BG8AG8B
31
The system was reassembled and operated without load up to rated speed for a sustained period. The bearing temperature of G8A was found to be in the lower population of values, and no other extreme outlying temperatures were observed on any bearings.
3.14. System Operation at High Power Levels As part of the preparation for the gear contact pattern testing, it was necessary to stabilize converter output power at high levels. The research team was able to produce power at the 1 MW level at the test stand at the beginning of May 2003. However, as noted in last month’s monthly report, a vibration due to pinion (axial) shuttling was discovered during that test.
Clipper and consultant Bill Erdman traveled to NREL the week of May 19 to research the cause of the oscillations. The data gathered indicated two major causes: (1) a narrow exciter that responds to any slight axial shaft motion by modulating the voltage excitation, which results in large voltage and power oscillations on the generators, which in turn results in pinion shuttling; and (2) the proximity of the DC bus voltage 1000 V to the max line voltage of 813 (575 2 ) which can also produce instability at higher power levels. This results in DC bus oscillation, higher capacitor voltage, and capacitor failures.
To correct these issues, the following was undertaken during the month of June:
1. Removed generators and sent to a Denver shop to rewire from Y to Delta. Generators were delivered to NREL by July 11, 2003.
2. The longer exciters were shipped from Potencia. They arrived at NREL for assembly into the generators in June.
3. New fans were shipped and arrived in June.
4. Generators were rebalanced.
5. A generator connection ring was shipped to NREL the end of June.
6. All four matrices were shipped to Xantrex, which completed repair in June. Capacitors arrived the third week of July.
7. The field control system was rewired, which includes series connections of the exciters with a constant voltage supply and a safety system shutdown package.
Testing resumed July 18. After completion of all upgrades, the research team tested the DGD‐I to 1.1 MW. A coupling slipped in one of the generators. The manufacturer admitted to making a mistake in setting the coupling slip torques 25 to 50% of specified torque. The couplings were retorqued and shipped back to NREL for reinstallation in August.
The project team was able to achieve up to 1.65 MW power level after all the corrections on August 26, 2003. However, a rather severe low‐speed gearbox oscillation was noted at 2.9 hertz (Hz), and the test stopped to solve the oscillation problem.

32
Kevin Cousineau and Bill Erdman traced the problem to a torsional frequency excitation throughout the gearbox/generator system. This resulted in a fluctuation of the DC bus because of the variation in rpm.
The solution suggested was to put a band pass filter at the center frequency and modulate the torque in the opposite phase to attenuate the 2.9 Hz primary oscillation. This was quite effective, resulting in ‐25dBg excitation, or a factor of 13 in oscillation reduction.
3.15. DGDI Start of Fatigue Testing The DGEN had experienced mechanical interference between the bull gear and the forward high‐speed intermediate stage gear hub. Rather than risk bearing failures, Clipper decided to change all high‐speed and intermediate bearings.
The DGEN was then transported to Brad Foote in October 2003 to complete pinion replacement, and to solve on interference issue resulting from oscillation in preparation for contact pattern testing. In addition, the following tasks were performed:
1. Comprehensive contact analysis of the high‐speed pinion was conducted. New pinions were manufactured to the correct lead angle modification.
2. The low‐speed pinions were replaced due to debris dents.
3. The low‐speed and high‐speed gears were surface ground.
4. Bearing races were reconfigured based on recommendation from Don McVittie as part of due diligence.
5. Reconfigured output shaft seals and implemented a more sophisticated labyrinth arrangement.
6. Clutch stiffness on the generator was modified and rebalanced, based on McVittie’s recommendation.
The plan, as of December 2003, was to complete the modification to the D‐GEN drivetrain at Brad Foote, transport it back to NREL and commence fatigue testing at NREL the week of January 17.
As of January 7, 2004, the D‐GEN was back at NREL fully assembled and ready for installation on the dynamometer. The oil was filtered for 24 hours prior to operation, and the generators were reinstalled by January 14. No load and low‐power rotational testing commenced the next day.
The DGD was then operated at 1.5 MW for four hours starting on January 20. This was done in accordance with the test plan to “break‐in” the new components that had been replaced during the rebuild. Faults then occurred on the dynamometer, requiring troubleshooting and corrective action by NREL. Gear tooth loading data was taken on the high‐speed pinions for the period from January 29 through February 6, reference DGDN test procedure 7.3.2.2. The pinions were then removed for regrinding.
33
The pinion tooth profile was modified, and reground pinions were received on February 24. The complete dynamometer and test article rebuild was completed by March 9. Load testing was initiated, and several faults and fuse failures occurred. These failures were investigated and corrected by March 15. Operation was again resumed followed shortly thereafter by a failure of one of the generator exciter coils. A new coil was installed on March 23. Again the test was resumed, and a (test article) converter fuse failure occurred. The converter failure required further troubleshooting than could be accomplished at NREL, and it was shipped back to Xantrex in Livermore, California.
The converter was repaired and re‐installed by April 12. Two days later, after resuming re‐commissioning of the system, another generator exciter coil failure occurred. This failure mode was ultimately corrected by a rewind of the generator exciter stators. (See additional information below).
3.16. Gearbox Fatigue Testing Attended fatigue testing of the DGEN began on April 23. After five days of attended operation the system was deemed reliable enough to commence unattended operation on April 28, 2004.
During May and early June, unattended fatigue testing operation continued. By June 19, 248 hours were accumulated toward the research team’s goal of 1,000 hours of testing. By July 3, the test stand had accumulated 607 hours of total operation.
Unattended operations continued throughout May, June, and into early July. NREL personnel provided attendance during working hours, following all Clipper guidelines. Operation of the generators continued to be manual, with DC bus voltage set by an operator through adjustment of a DC power supply connected to the eight DC exciters. Despite voltage variations in DC bus, due to temperature variations inside the test bay, the system continued to operate over periods of 24, 36, 46, and 64 hours without faulting. From June 19 on, the average number of hours of operation was nearly 22 out of every 24, exceptional for a manually operated system.
Operation and testing showed that the converters and generators performed best when the DC bus voltage remained below 1000 Vdc. Further, operation at this level (and lower, down to a minimum of 920 Vdc) resulted in a generator AC voltage quite close to the rated value, 700 Vac. With the failure of two generator stators, it was determined that insulation fatigue occurred due to high generator voltage as a result of operating the DC bus above 1200 Vdc, or nearly 900 Vac on the generators.
Achieving fewer than 1000 Vdc on all four DC buses required that all generators be closely matched in their output. This was achieved through the rewind of all DC generator exciter stators, along with individual transient voltage protection of these exciters. Once completed in late May of 2004, no further exciter failures occurred, and voltage balance between all four DC buses, was close to +/‐ 40 Vdc. This allowed operations to proceed with one DC bus operating at 960 Vdc and the remaining three buses at 990 to 1000 Vdc.
Since matrix temperature on each of the inverters is directly proportional to DC bus voltage, converter operations were successful throughout the 607 hours of full power operation. Despite
34
ambient temperatures inside the test bay of 30°C (86°F), no single converter exceeded its 85°C (185°F) operational extreme, with average temperatures near 70 to 75°C (158°F to 167°F) in most cases.
After 620 hours of operation, at 130% of rated torque, a failure occurred. Inspection of the system showed that a first stage pinion tooth had failed in bending fatigue. The failure has several possibilities for the root cause. Possible causes include poor gear flank contact distribution, unintended loads arising from testing, or metallurgical flaws in the gearing.
Poor contact distribution in the low‐speed stage may be attributed to excess bearing clearance, errors in bearing bore locations in the gear housings, and/or manufacturing errors in the gears. The necessity for testing the low‐speed stage mesh contact pattern was established. The observed bearing endplays were measured to be out of specification, but the amounts were deemed to have a poor correlation to the failure. The manufacturer did not validate the bearing bore locations in the housings. CMM measurement of the housings was not performed as the housings exceeded the size constraints of the available inspection machine at the gear vendor. This remains as a possible contributor of poor gear contact. Errors in the gearing were perceived to be an unlikely contributor to poor contact distribution as the gears were fabricated on modern, calibrated gear grinders.
Unintended loading experienced during testing is another possible contributor to the gear failure. Early testing determined that there was a flaw in the generator field voltage control scheme.
During testing, the field control system was adjusted to provide voltage regulation at power outputs between 40 and 1000 kW at input shaft speeds of 1150 to 1800 rpm. Testing also included unloaded cases. Testing showed that heavy loads were nearly always followed by vibration of the generators and gearbox. Compounding this vibration was a noticeable oscillation in the DC bus during certain periods of operation, especially following the application of a heavy load. Further complications to the vibration and oscillation problems were noticeably large axial motions of the generator rotors as viewed from their fans. These dynamics caused internal interferences, resulting in the need to rebuild the gearbox as described above.
A post‐mortem examination of the generator overload clutches indicated that there was some slippage during service. The clutch slippage was evidence of torque loads up to 3.75 times the nominal generator rating (2.98 times the test torque). Figure 12 below illustrates the dramatic life reduction that occurs under loading of this magnitude.
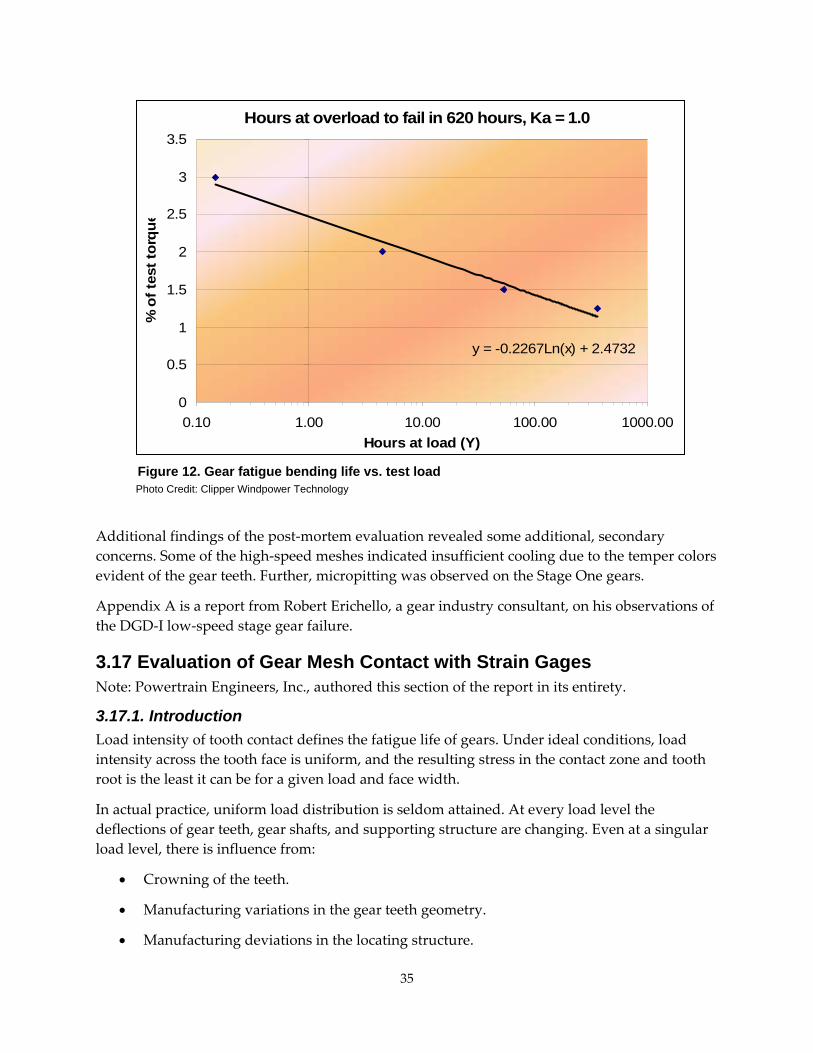
35
Figure 12. Gear fatigue bending life vs. test load
Photo Credit: Clipper Windpower Technology
Additional findings of the post‐mortem evaluation revealed some additional, secondary concerns. Some of the high‐speed meshes indicated insufficient cooling due to the temper colors evident of the gear teeth. Further, micropitting was observed on the Stage One gears.
Appendix A is a report from Robert Erichello, a gear industry consultant, on his observations of the DGD‐I low‐speed stage gear failure.
3.17 Evaluation of Gear Mesh Contact with Strain Gages Note: Powertrain Engineers, Inc., authored this section of the report in its entirety.
3.17.1. Introduction Load intensity of tooth contact defines the fatigue life of gears. Under ideal conditions, load intensity across the tooth face is uniform, and the resulting stress in the contact zone and tooth root is the least it can be for a given load and face width.
In actual practice, uniform load distribution is seldom attained. At every load level the deflections of gear teeth, gear shafts, and supporting structure are changing. Even at a singular load level, there is influence from:
• Crowning of the teeth.
• Manufacturing variations in the gear teeth geometry.
• Manufacturing deviations in the locating structure.
Hours at overload to fail in 620 hours, Ka = 1.0
y = -0.2267Ln(x) + 2.4732
0
0.5
1
1.5
2
2.5
3
3.5
0.10 1.00 10.00 100.00 1000.00Hours at load (Y)
% o
f tes
t tor
que
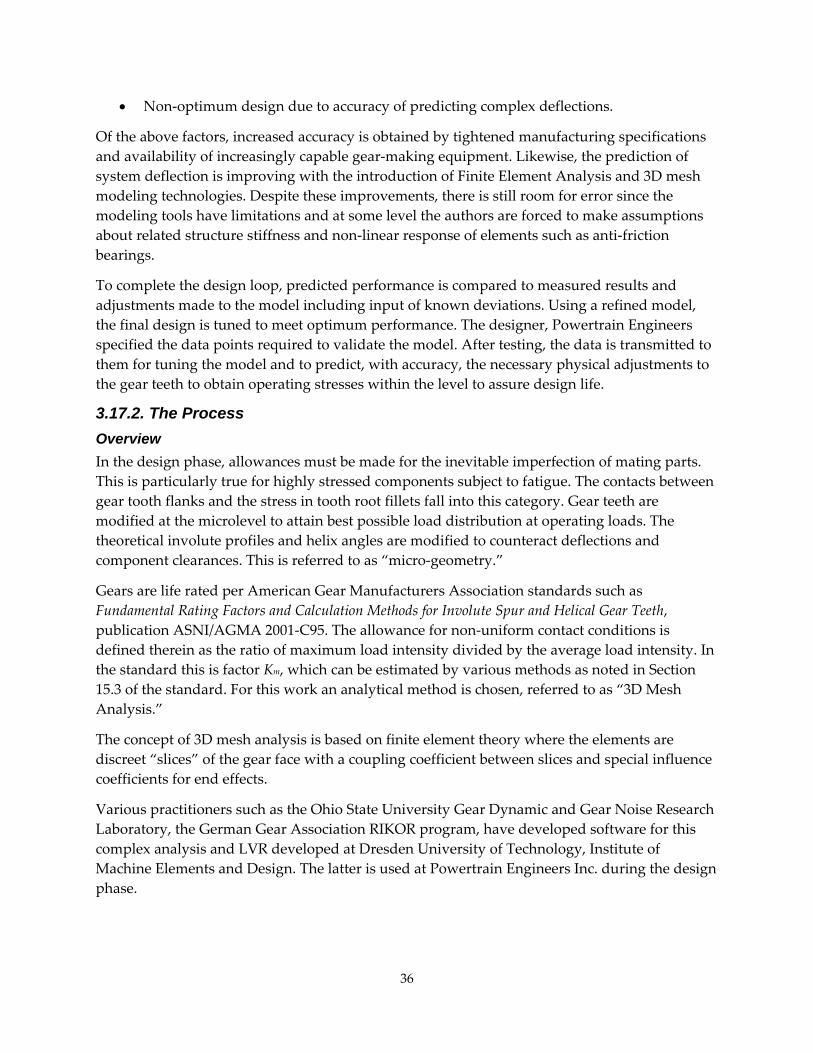
36
• Non‐optimum design due to accuracy of predicting complex deflections.
Of the above factors, increased accuracy is obtained by tightened manufacturing specifications and availability of increasingly capable gear‐making equipment. Likewise, the prediction of system deflection is improving with the introduction of Finite Element Analysis and 3D mesh modeling technologies. Despite these improvements, there is still room for error since the modeling tools have limitations and at some level the authors are forced to make assumptions about related structure stiffness and non‐linear response of elements such as anti‐friction bearings.
To complete the design loop, predicted performance is compared to measured results and adjustments made to the model including input of known deviations. Using a refined model, the final design is tuned to meet optimum performance. The designer, Powertrain Engineers specified the data points required to validate the model. After testing, the data is transmitted to them for tuning the model and to predict, with accuracy, the necessary physical adjustments to the gear teeth to obtain operating stresses within the level to assure design life.
3.17.2. The Process Overview In the design phase, allowances must be made for the inevitable imperfection of mating parts. This is particularly true for highly stressed components subject to fatigue. The contacts between gear tooth flanks and the stress in tooth root fillets fall into this category. Gear teeth are modified at the microlevel to attain best possible load distribution at operating loads. The theoretical involute profiles and helix angles are modified to counteract deflections and component clearances. This is referred to as “micro‐geometry.”
Gears are life rated per American Gear Manufacturers Association standards such as Fundamental Rating Factors and Calculation Methods for Involute Spur and Helical Gear Teeth, publication ASNI/AGMA 2001‐C95. The allowance for non‐uniform contact conditions is defined therein as the ratio of maximum load intensity divided by the average load intensity. In the standard this is factor Km, which can be estimated by various methods as noted in Section 15.3 of the standard. For this work an analytical method is chosen, referred to as “3D Mesh Analysis.”
The concept of 3D mesh analysis is based on finite element theory where the elements are discreet “slices” of the gear face with a coupling coefficient between slices and special influence coefficients for end effects.
Various practitioners such as the Ohio State University Gear Dynamic and Gear Noise Research Laboratory, the German Gear Association RIKOR program, have developed software for this complex analysis and LVR developed at Dresden University of Technology, Institute of Machine Elements and Design. The latter is used at Powertrain Engineers Inc. during the design phase.
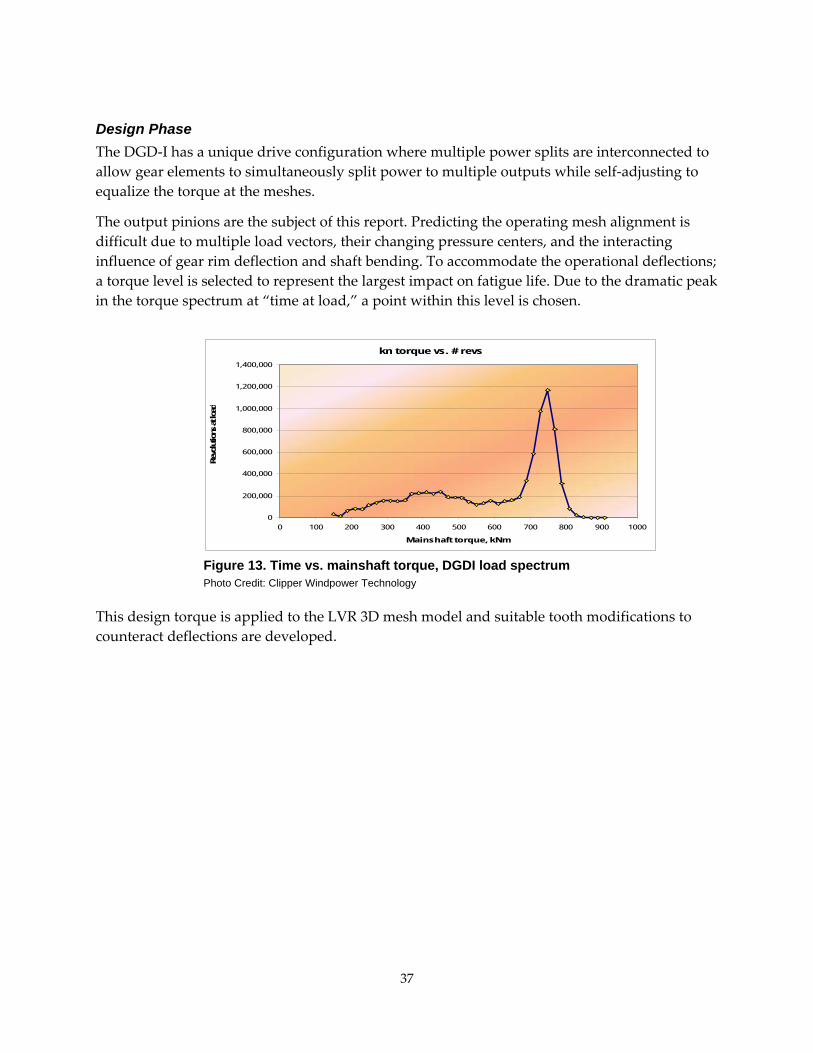
37
Design Phase The DGD‐I has a unique drive configuration where multiple power splits are interconnected to allow gear elements to simultaneously split power to multiple outputs while self‐adjusting to equalize the torque at the meshes.
The output pinions are the subject of this report. Predicting the operating mesh alignment is difficult due to multiple load vectors, their changing pressure centers, and the interacting influence of gear rim deflection and shaft bending. To accommodate the operational deflections; a torque level is selected to represent the largest impact on fatigue life. Due to the dramatic peak in the torque spectrum at “time at load,” a point within this level is chosen.
Figure 13. Time vs. mainshaft torque, DGDI load spectrum
Photo Credit: Clipper Windpower Technology This design torque is applied to the LVR 3D mesh model and suitable tooth modifications to counteract deflections are developed.
kn torque vs. # revs
0
200,000
400,000
600,000
800,000
1,000,000
1,200,000
1,400,000
0 100 200 300 400 500 600 700 800 900 1000
Mainshaft torque, kNm
Revo
lutio
ns at
load
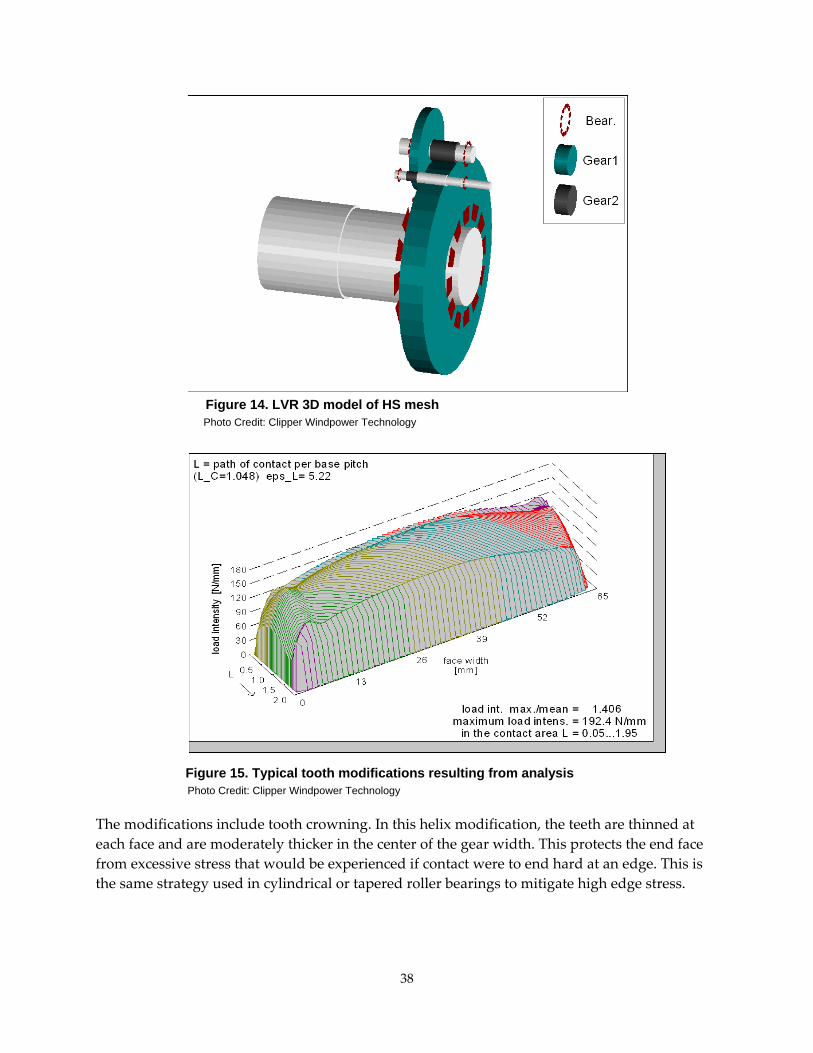
38
Figure 14. LVR 3D model of HS mesh
Photo Credit: Clipper Windpower Technology
Figure 15. Typical tooth modifications resulting from analysis Photo Credit: Clipper Windpower Technology The modifications include tooth crowning. In this helix modification, the teeth are thinned at each face and are moderately thicker in the center of the gear width. This protects the end face from excessive stress that would be experienced if contact were to end hard at an edge. This is the same strategy used in cylindrical or tapered roller bearings to mitigate high edge stress.
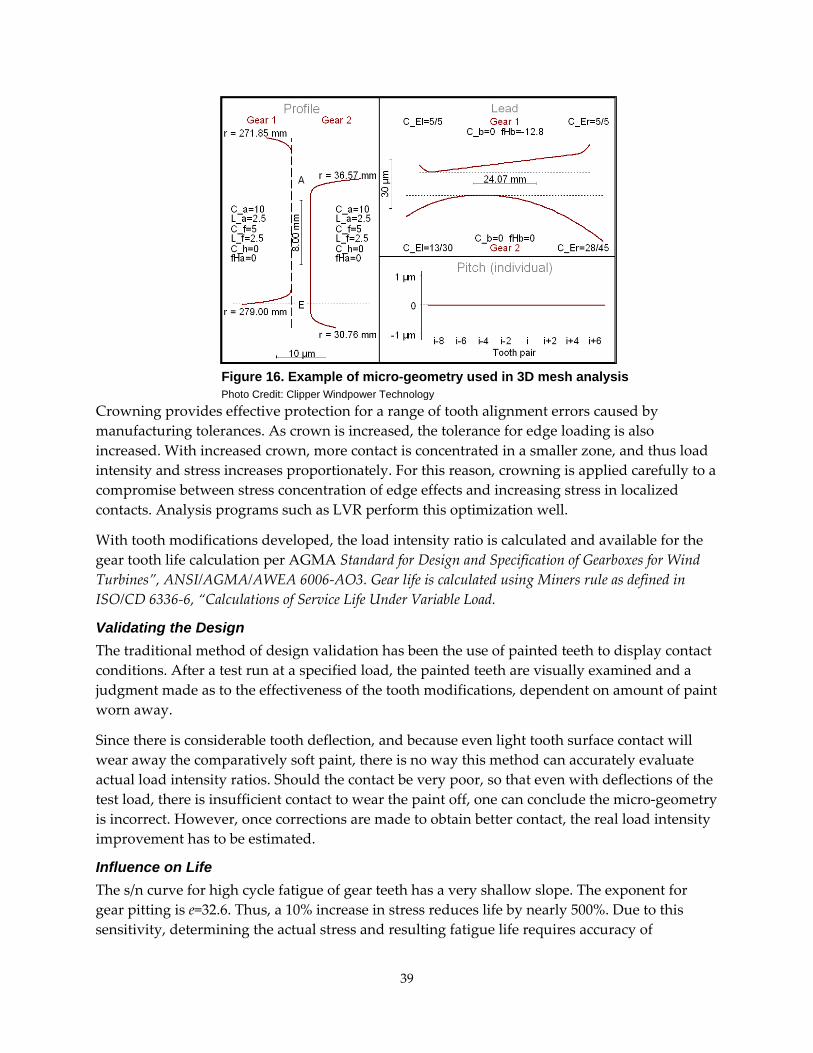
39
Figure 16. Example of micro-geometry used in 3D mesh analysis
Photo Credit: Clipper Windpower Technology Crowning provides effective protection for a range of tooth alignment errors caused by manufacturing tolerances. As crown is increased, the tolerance for edge loading is also increased. With increased crown, more contact is concentrated in a smaller zone, and thus load intensity and stress increases proportionately. For this reason, crowning is applied carefully to a compromise between stress concentration of edge effects and increasing stress in localized contacts. Analysis programs such as LVR perform this optimization well.
With tooth modifications developed, the load intensity ratio is calculated and available for the gear tooth life calculation per AGMA Standard for Design and Specification of Gearboxes for Wind Turbines”, ANSI/AGMA/AWEA 6006‐AO3. Gear life is calculated using Miners rule as defined in ISO/CD 6336‐6, “Calculations of Service Life Under Variable Load.
Validating the Design The traditional method of design validation has been the use of painted teeth to display contact conditions. After a test run at a specified load, the painted teeth are visually examined and a judgment made as to the effectiveness of the tooth modifications, dependent on amount of paint worn away.
Since there is considerable tooth deflection, and because even light tooth surface contact will wear away the comparatively soft paint, there is no way this method can accurately evaluate actual load intensity ratios. Should the contact be very poor, so that even with deflections of the test load, there is insufficient contact to wear the paint off, one can conclude the micro‐geometry is incorrect. However, once corrections are made to obtain better contact, the real load intensity improvement has to be estimated.
Influence on Life The s/n curve for high cycle fatigue of gear teeth has a very shallow slope. The exponent for gear pitting is e=32.6. Thus, a 10% increase in stress reduces life by nearly 500%. Due to this sensitivity, determining the actual stress and resulting fatigue life requires accuracy of
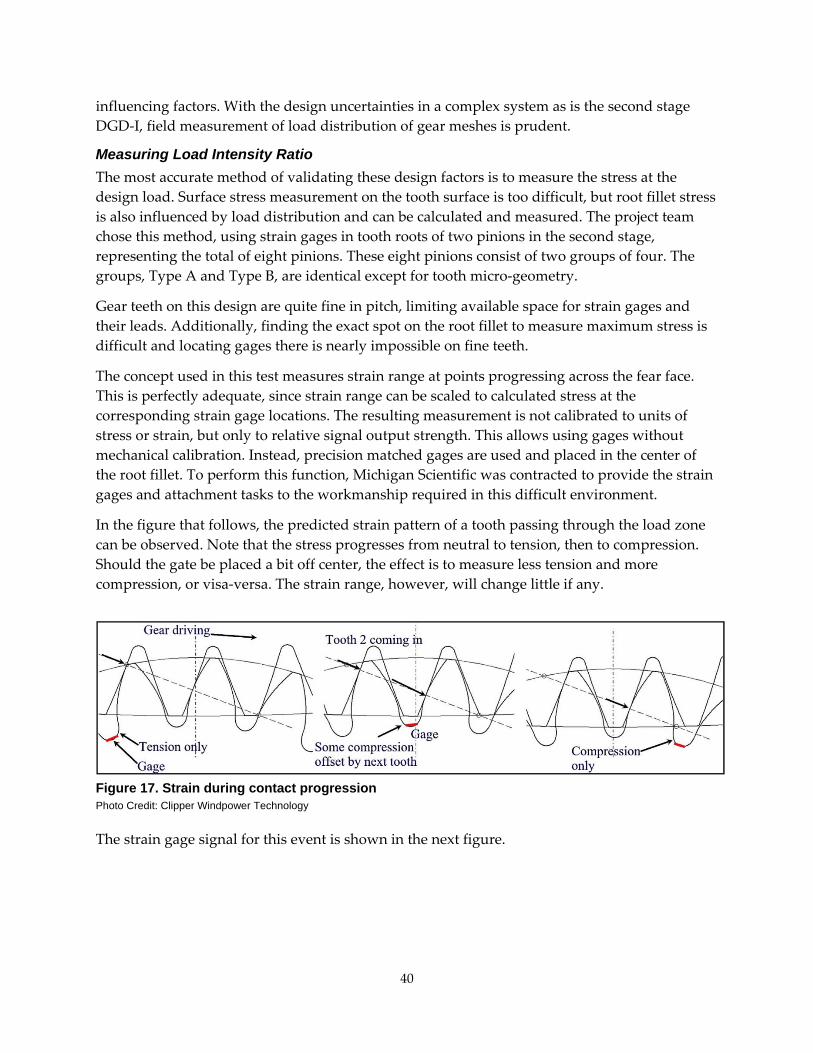
40
influencing factors. With the design uncertainties in a complex system as is the second stage DGD‐I, field measurement of load distribution of gear meshes is prudent.
Measuring Load Intensity Ratio The most accurate method of validating these design factors is to measure the stress at the design load. Surface stress measurement on the tooth surface is too difficult, but root fillet stress is also influenced by load distribution and can be calculated and measured. The project team chose this method, using strain gages in tooth roots of two pinions in the second stage, representing the total of eight pinions. These eight pinions consist of two groups of four. The groups, Type A and Type B, are identical except for tooth micro‐geometry.
Gear teeth on this design are quite fine in pitch, limiting available space for strain gages and their leads. Additionally, finding the exact spot on the root fillet to measure maximum stress is difficult and locating gages there is nearly impossible on fine teeth.
The concept used in this test measures strain range at points progressing across the fear face. This is perfectly adequate, since strain range can be scaled to calculated stress at the corresponding strain gage locations. The resulting measurement is not calibrated to units of stress or strain, but only to relative signal output strength. This allows using gages without mechanical calibration. Instead, precision matched gages are used and placed in the center of the root fillet. To perform this function, Michigan Scientific was contracted to provide the strain gages and attachment tasks to the workmanship required in this difficult environment.
In the figure that follows, the predicted strain pattern of a tooth passing through the load zone can be observed. Note that the stress progresses from neutral to tension, then to compression. Should the gate be placed a bit off center, the effect is to measure less tension and more compression, or visa‐versa. The strain range, however, will change little if any.
Figure 17. Strain during contact progression Photo Credit: Clipper Windpower Technology The strain gage signal for this event is shown in the next figure.
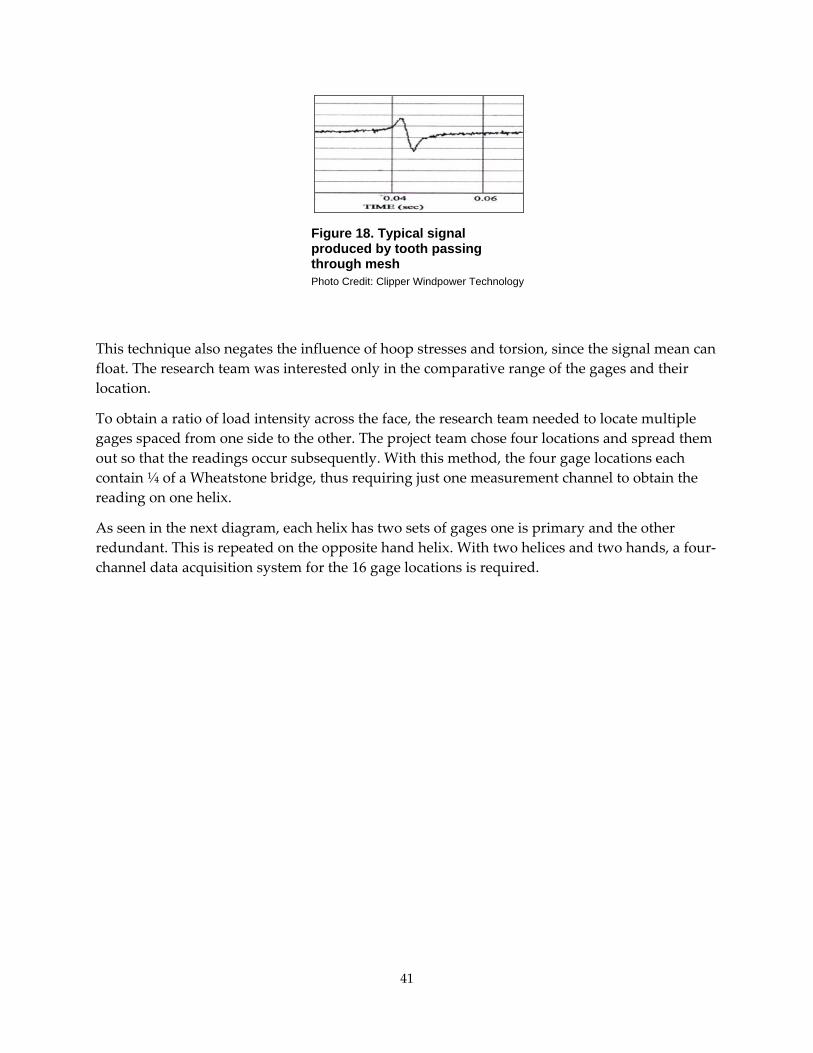
41
Figure 18. Typical signal produced by tooth passing through mesh
Photo Credit: Clipper Windpower Technology This technique also negates the influence of hoop stresses and torsion, since the signal mean can float. The research team was interested only in the comparative range of the gages and their location.
To obtain a ratio of load intensity across the face, the research team needed to locate multiple gages spaced from one side to the other. The project team chose four locations and spread them out so that the readings occur subsequently. With this method, the four gage locations each contain ¼ of a Wheatstone bridge, thus requiring just one measurement channel to obtain the reading on one helix.
As seen in the next diagram, each helix has two sets of gages one is primary and the other redundant. This is repeated on the opposite hand helix. With two helices and two hands, a four‐channel data acquisition system for the 16 gage locations is required.
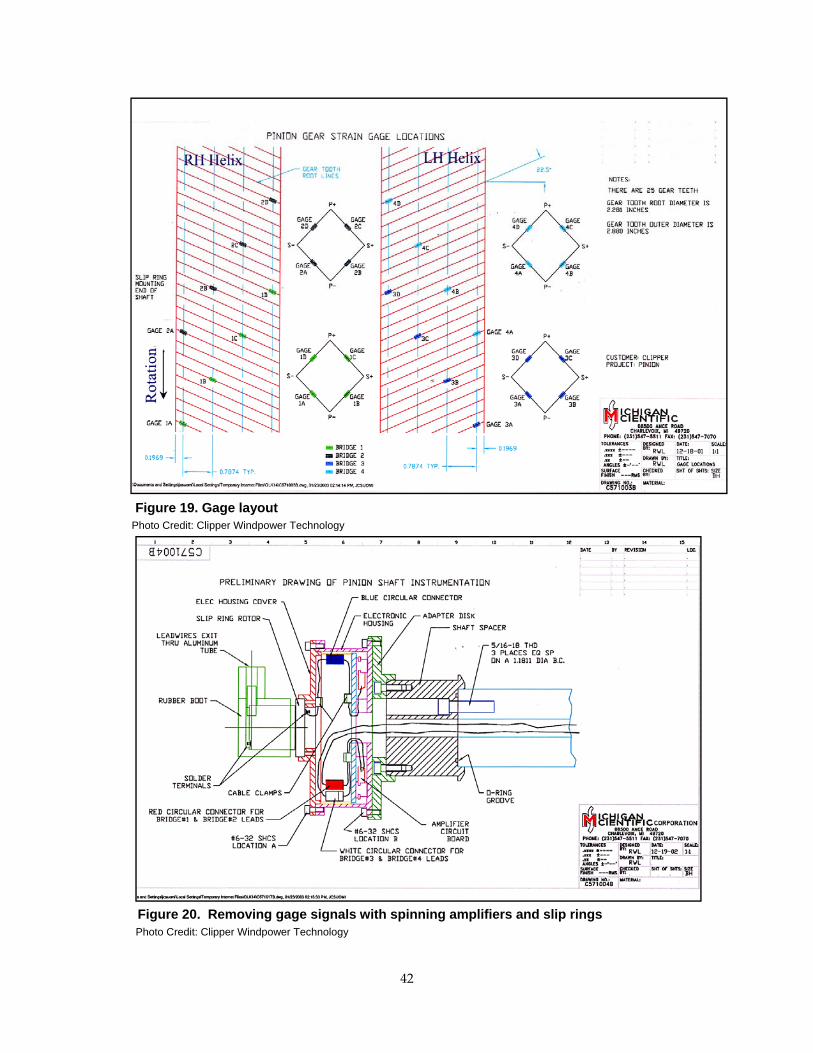
42
Figure 19. Gage layout Photo Credit: Clipper Windpower Technology
Figure 20. Removing gage signals with spinning amplifiers and slip rings
Photo Credit: Clipper Windpower Technology

43
Results of Initial Test After breaking in at partial load, the unit is run at the design load, and data is taken. These results are shown in the following figures.
Figure 21. Readings on second test iteration, Shaft A.
Photo Credit: Clipper Windpower Technology
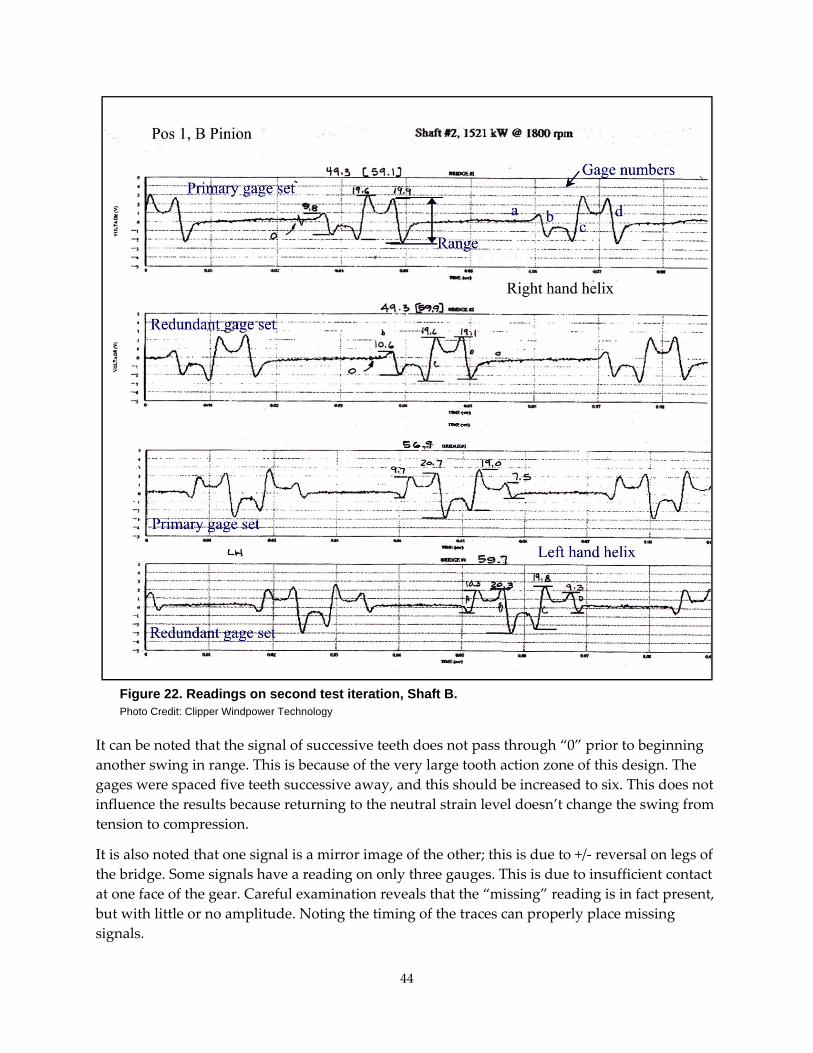
44
Figure 22. Readings on second test iteration, Shaft B.
Photo Credit: Clipper Windpower Technology It can be noted that the signal of successive teeth does not pass through “0” prior to beginning another swing in range. This is because of the very large tooth action zone of this design. The gages were spaced five teeth successive away, and this should be increased to six. This does not influence the results because returning to the neutral strain level doesn’t change the swing from tension to compression.
It is also noted that one signal is a mirror image of the other; this is due to +/‐ reversal on legs of the bridge. Some signals have a reading on only three gauges. This is due to insufficient contact at one face of the gear. Careful examination reveals that the “missing” reading is in fact present, but with little or no amplitude. Noting the timing of the traces can properly place missing signals.
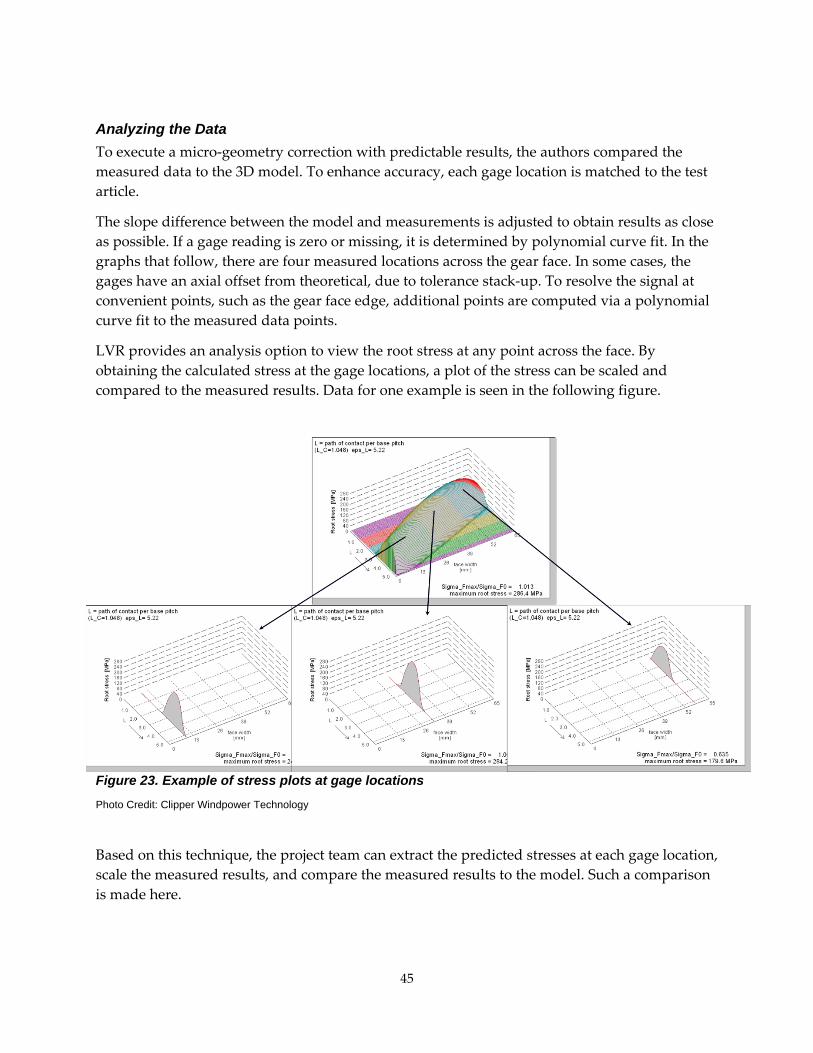
45
Analyzing the Data To execute a micro‐geometry correction with predictable results, the authors compared the measured data to the 3D model. To enhance accuracy, each gage location is matched to the test article.
The slope difference between the model and measurements is adjusted to obtain results as close as possible. If a gage reading is zero or missing, it is determined by polynomial curve fit. In the graphs that follow, there are four measured locations across the gear face. In some cases, the gages have an axial offset from theoretical, due to tolerance stack‐up. To resolve the signal at convenient points, such as the gear face edge, additional points are computed via a polynomial curve fit to the measured data points.
LVR provides an analysis option to view the root stress at any point across the face. By obtaining the calculated stress at the gage locations, a plot of the stress can be scaled and compared to the measured results. Data for one example is seen in the following figure.
Figure 23. Example of stress plots at gage locations
Photo Credit: Clipper Windpower Technology
Based on this technique, the project team can extract the predicted stresses at each gage location, scale the measured results, and compare the measured results to the model. Such a comparison is made here.
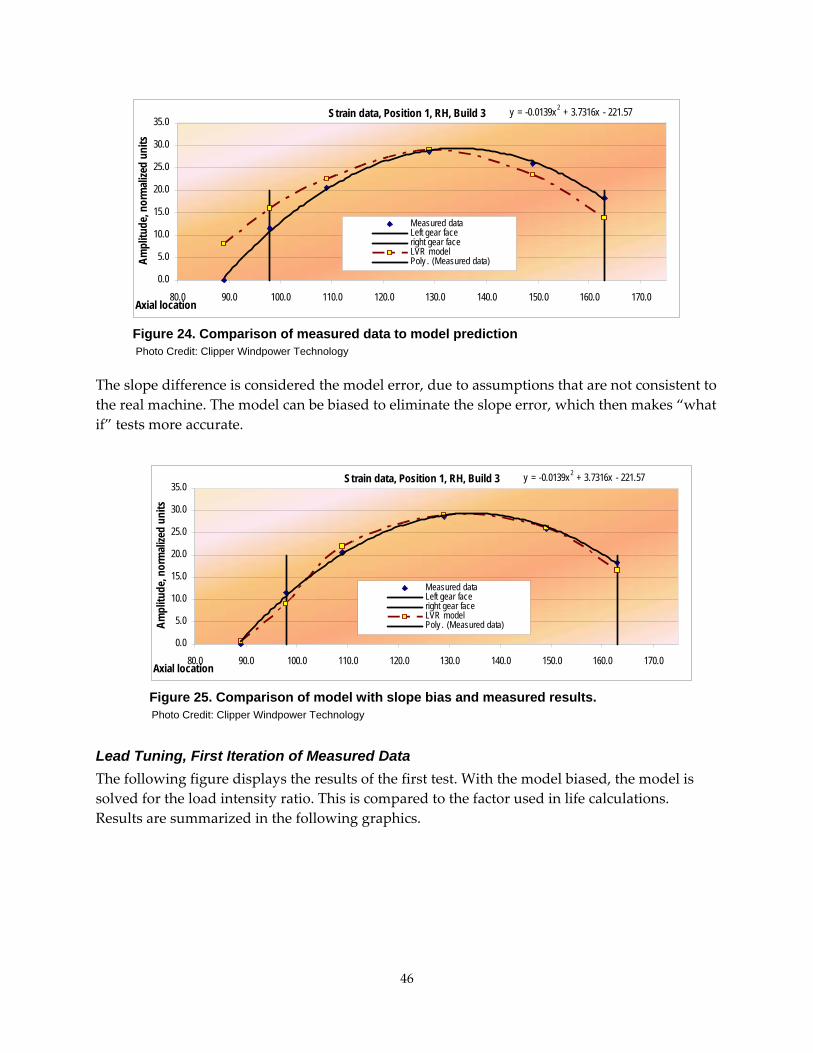
46
Figure 24. Comparison of measured data to model prediction Photo Credit: Clipper Windpower Technology The slope difference is considered the model error, due to assumptions that are not consistent to the real machine. The model can be biased to eliminate the slope error, which then makes “what if” tests more accurate.
Figure 25. Comparison of model with slope bias and measured results.
Photo Credit: Clipper Windpower Technology Lead Tuning, First Iteration of Measured Data The following figure displays the results of the first test. With the model biased, the model is solved for the load intensity ratio. This is compared to the factor used in life calculations. Results are summarized in the following graphics.
Strain data, Position 1, RH, Build 3 y = -0.0139x2 + 3.7316x - 221.57
0.0
5.0
10.0
15.0
20.0
25.0
30.0
35.0
80.0 90.0 100.0 110.0 120.0 130.0 140.0 150.0 160.0 170.0Axial location
Ampl
itude
, nor
mali
zed
units
Measured dataLeft gear faceright gear faceLVR modelPoly . (Measured data)
Strain data, Position 1, RH, Build 3 y = -0.0139x2 + 3.7316x - 221.57
0.0
5.0
10.0
15.0
20.0
25.0
30.0
35.0
80.0 90.0 100.0 110.0 120.0 130.0 140.0 150.0 160.0 170.0Axial location
Ampl
itude
, nor
mali
zed
units
Measured dataLeft gear faceright gear faceLVR modelPoly . (Measured data)
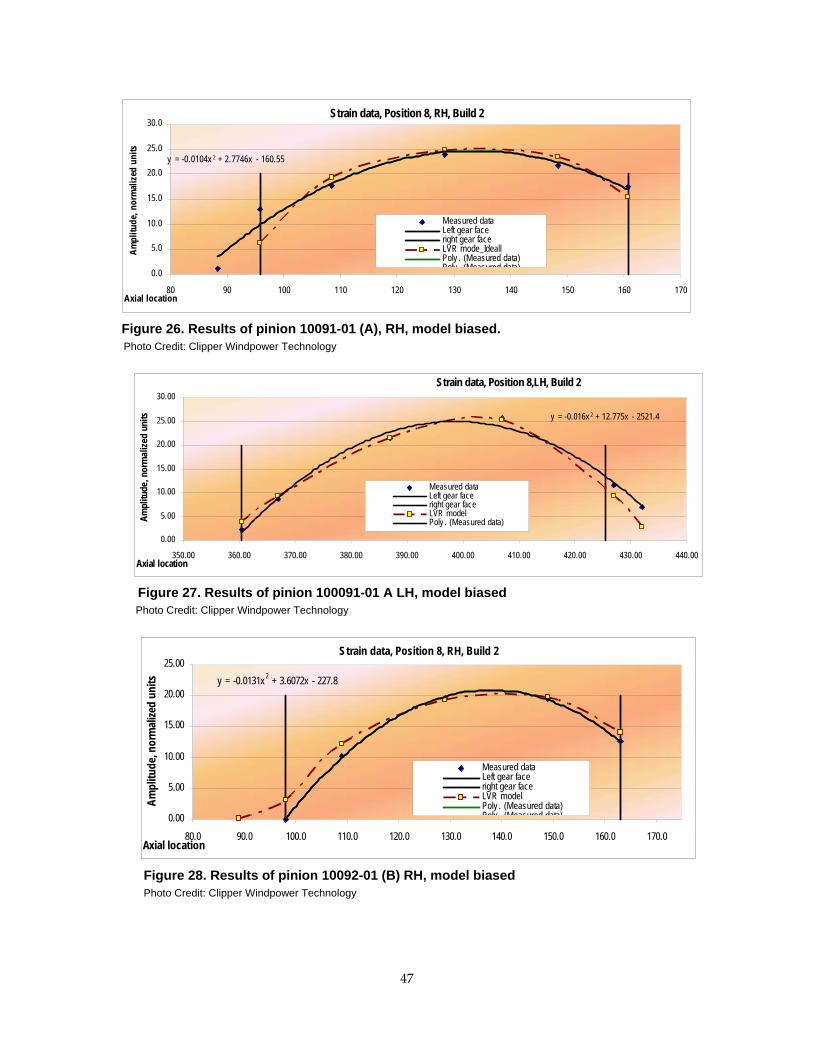
47
Figure 26. Results of pinion 10091-01 (A), RH, model biased. Photo Credit: Clipper Windpower Technology
Figure 27. Results of pinion 100091-01 A LH, model biased
Photo Credit: Clipper Windpower Technology
Figure 28. Results of pinion 10092-01 (B) RH, model biased
Photo Credit: Clipper Windpower Technology
Strain data, Position 8, RH, Build 2
y = -0.0104x 2 + 2.7746x - 160.55
0.0
5.0
10.0
15.0
20.0
25.0
30.0
80 90 100 110 120 130 140 150 160 170Axial location
Ampl
itude
, nor
mal
ized
uni
ts
Measured dataLeft gear faceright gear faceLVR mode_IdeallPoly . (Measured data)Poly (Measured data)
Strain data, Position 8,LH, Build 2
y = -0.016x 2 + 12.775x - 2521.4
0.00
5.00
10.00
15.00
20.00
25.00
30.00
350.00 360.00 370.00 380.00 390.00 400.00 410.00 420.00 430.00 440.00Axial location
Ampl
itude
, nor
mal
ized
units
Measured dataLeft gear faceright gear faceLVR modelPoly . (Measured data)
Strain data, Position 8, RH, Build 2
y = -0.0131x2 + 3.6072x - 227.8
0.00
5.00
10.00
15.00
20.00
25.00
80.0 90.0 100.0 110.0 120.0 130.0 140.0 150.0 160.0 170.0Axial location
Ampl
itude
, nor
mali
zed
units
Measured dataLeft gear faceright gear faceLVR modelPoly . (Measured data)Poly (Measured data)
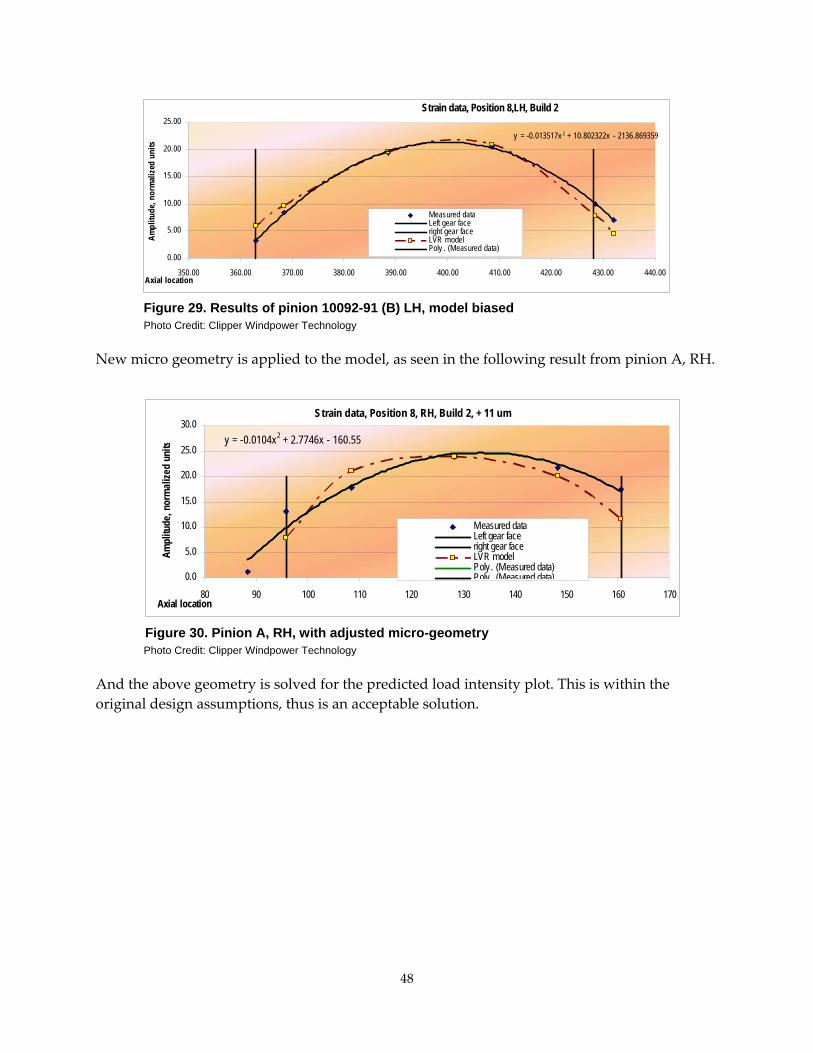
48
Figure 29. Results of pinion 10092-91 (B) LH, model biased
Photo Credit: Clipper Windpower Technology New micro geometry is applied to the model, as seen in the following result from pinion A, RH.
Figure 30. Pinion A, RH, with adjusted micro-geometry
Photo Credit: Clipper Windpower Technology And the above geometry is solved for the predicted load intensity plot. This is within the original design assumptions, thus is an acceptable solution.
Strain data, Position 8,LH, Build 2
y = -0.013517x 2 + 10.802322x - 2136.869359
0.00
5.00
10.00
15.00
20.00
25.00
350.00 360.00 370.00 380.00 390.00 400.00 410.00 420.00 430.00 440.00Axial location
Ampl
itude
, nor
mal
ized
uni
ts
Measured dataLeft gear faceright gear faceLVR modelPoly . (Measured data)
Strain data, Position 8, RH, Build 2, + 11 um
y = -0.0104x2 + 2.7746x - 160.55
0.0
5.0
10.0
15.0
20.0
25.0
30.0
80 90 100 110 120 130 140 150 160 170Axial location
Ampl
itude
, nor
mal
ized
units
Measured dataLeft gear faceright gear faceLVR modelPoly . (Measured data)Poly (Measured data)
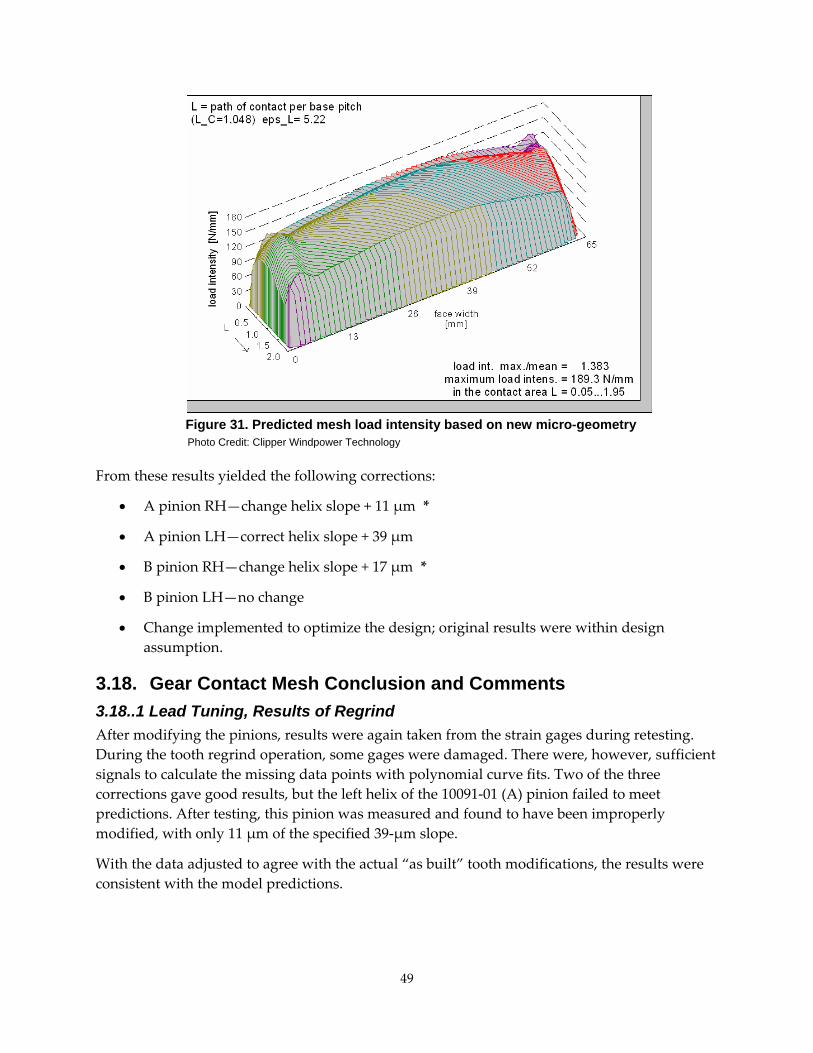
49
Figure 31. Predicted mesh load intensity based on new micro-geometry
Photo Credit: Clipper Windpower Technology
From these results yielded the following corrections:
• A pinion RH—change helix slope + 11 μm *
• A pinion LH—correct helix slope + 39 μm
• B pinion RH—change helix slope + 17 μm *
• B pinion LH—no change
• Change implemented to optimize the design; original results were within design assumption.
3.18. Gear Contact Mesh Conclusion and Comments 3.18..1 Lead Tuning, Results of Regrind After modifying the pinions, results were again taken from the strain gages during retesting. During the tooth regrind operation, some gages were damaged. There were, however, sufficient signals to calculate the missing data points with polynomial curve fits. Two of the three corrections gave good results, but the left helix of the 10091‐01 (A) pinion failed to meet predictions. After testing, this pinion was measured and found to have been improperly modified, with only 11 μm of the specified 39‐μm slope.
With the data adjusted to agree with the actual “as built” tooth modifications, the results were consistent with the model predictions.

50
3.18.2. Corrections After Retest With the reground gauged pinions retested, all pinions were removed from the unit and inspected. The test pinion inspections were used to once again validate the model and modifications and all eight pinions ground to the correct helix slope and tooth form.
High technology tools such as FEA and 3D mesh analysis are invaluable for designers for sizing components. With 3D mesh analysis, for example, some designs are more sensitive to crowning levels and manufacturing deviations than others. Designs, constrained for necessary performance issues such as noise, are sized with the extra margins needed. Accurately accessing the rating factors at this stage saves valuable time and expense of later redesign.
Although these tools provide accuracy of calculations at a level heretofore unavailable, they cannot encompass all external influences. For the simplest systems they are quite accurate, but as the system increases in complexity, testing is needed to validate the model and replace assumptions with measured data.
To add perspective to this activity, the final maximum adjustment was 15 microns, and this is 1/5 the thickness of a human hair. Yet, this correction to the modifications was required to bring the rating factors within the values used in theoretical design. The traditional practice of interpreting contact patterns with painted teeth has a resolution estimated at 25% the accuracy of the above concept.
The authors conclude that the placement of precision gages in root centerlines provides adequate accuracy without the very difficult and expensive gage calibration step. The research team found that the primary and redundant signals were very consistent, with no abnormalities. Measured results were consistent with the predictions of the 3D mesh model. Careful placement of miniature gages in the root centerline allows for regrinding of the tooth flanks while preserving the gages.
Validating gear tooth micro‐geometry design assumptions using the process described herein is necessary to achieve reliability in the life calculations. The previous method of visual interpretation of contact patterns has inadequate resolution for gears in critical service.
The experiment proves the value of advanced computer analysis for gear design details and describes a method to validate the model and provide assurance that design assumptions are valid. This method is applicable to any gear element that can be modeled and strain gauged. This includes spur and helical gears, external and internal. As certainty is added to the predicted stresses, the design margins can be safely reduced to the minimums allowed by certification. Thorough analysis, including influence of tolerances and validation of the model by testing, has to become the norm for these drives if the project team was to meet the design life and reliability without unnecessary cost.
51
4.0 Electrical System Success, Failures, and Lessons Learned Below is a summary of the electrical system operation and failures during the fatigue testing of the Clipper DGEN1 system over a 600‐plus‐hour period of full power operation. The majority of these failures occurred during the first 250 hours of full power fatigue testing. The last 350 hours of testing were without failures except the final gearbox problems observed at 607 hours into the test.
4.1. Generator System Description • 240 kW, four‐pole, 700 Vac, Open Frame, Wound Field Synchronous machine with
rotating rectifiers and DC exciters.
• Designed for continuous voltage output over an extended speed range.
• Ungrounded WYE winding original, changed to DELTA later in the testing to help lower the output voltage.
• Operated at a 700 Vac output voltage at 1800 rpm and 215 kW.
• Random‐wound, open‐frame, air‐cooled with internal fan.
4.2. Generator Successes • All generators operated without overheating, exceeding 85°C on only a few occasions
and never exceeding 90°C (194°F), far below their rated 140 °C (284°F) set point for over temperature.
• The generators size and weight allowed for change out using the “shop” overhead crane.
• Generator construction was straightforward, allowing for repair at a local winding shop without problems.
4.3. Generator Challenges • Fan Clearance Problems: Fan location and design width caused rubbing at gearbox
interface during operation under load. All fans were machined to a smaller width and relocated on the shaft to their extreme southern position in order to solve this problem.
• DC Exciter Failure. Four out of eight of the DC exciters failed either open circuit or short to ground. One of these failures occurred after all eight were rewound. The final solution was to place transient voltage protection in the form of a MOV and Transient Voltage Suppression (TVS) diodes across each field individually along with grounding the negative side of the field connections to the gearbox system ground. See Figure 3.
• Main Stator Failures. The research team suffered failures on three of the eight main output stators. The first failure occurred early in the program due to a bolt that was
52
dropped into the stator. Replacing all of the wire mesh stator covers after generator assembly later solved this problem.
• The second and third failures occurred during the fatigue‐testing portion ofthe author’s testing and were probably due to the change from a Wye to a Delta configuration on the stator windings and possible oil contaminants leaking into the generator.
• The change from Wye to Delta placed a higher voltage stress level on the stator windings than they were designed for by a factor of about two. Although the manufacturers insist that this higher voltage level was well within the insulation levels of the windings and would not cause a failure, this extra stress along with operation at higher DC bus voltages in excess of 1250 could have resulted in a winding failure. Add to this higher voltage a small amount of contamination, and it is possible to see a cause of these failures. In addition, the rewind itself could have resulted in failures due to problems with the rewind quality.
Once rewound, these generators performed without failures throughout the remaining test. There were both wound with higher voltage wire and greater insulation material.
4.4 Converter System Description • 1.8 MW, 450 ampere, 575 Vac, IGBT matrix, current limited converter. Four inverters,
one for each pair of generators.
• Air‐cooled IBGT matrix, four each, one for each pair of generators.
• T‐type filters for AC output. One filter per inverter. To help achieve IEE 519 specifications.
• DC bus capacitors rated at 1350 Vdc, 1500 peak, originally. Changed to 1500 Vdc, 1650 peak later in test.
• Interface using a standard PC with a Graphical User Interface (GUI) program provided by the vendor.
4.5 Converter System Successes • The converter regulated current as per our specifications with little variation over time.
• The converter’s fault output easily drove the safety system without failures or false indications of a failure.
• When the DC bus voltages were held to 1000 Vdc and lower, there was little problem with overheating.
• With the repair of the inductor, the converter operated without failure for nearly 360 hours at 1.6 MW output.
• Converter software successfully damped the gearbox/mainshaft natural frequency by more than 20 decibels (db).
53
4.6. Converter System Challenges • GUI Software Problems:
o Inability to synchronize all four inverters with a single current command. This was solved by installation of new software for the GUI computer.
o Inability to change the gearbox oscillation filter frequency.
o Inability to change the gearbox oscillation filter gain using a single command. The GUI required eight commands to change this value.
o GUI would drop out during startup.
• DC Bus Capacitor Failure:
o The DC bus capacitors failed due to an overvoltage event caused by an uncontrolled field excitation input during testing of the original field control system.
• AC Output Inductor Failure:
o A single inductor, on one of the four inverters, failed due to a short to ground caused by a splice in the winding wires. This caused failures of the output fuses and clearing of the main circuit breaker due to a ground fault. The solution to this problem was to replace the failed inductor with another one. The root cause of the inductor failure was due to a “splice” within the winding of the inductor in combination with overheating of the inductor itself due to a lack of cooling fans and airflow within the enclosure.
• Faults Due to Matrix Over Temperature:
o The converter overheated when operated at amibient temperatures exceeding 30°C at the 6‐foot level and with DC bus voltages exceeding 1000 Vdc. At first the project team operated the converted at 1200 to 1250 Vdc. In addition, operation at rated power caused overheating of the IGBT matrix.
4.7. Control System Description—Original DC Bus Voltage Regulator • A National Instruments‐based multiple proportional‐integral‐derivative (PID) loop
controller designed to keep the DC bus constant at 1025 Vdc throughout a change in load from zero to 1.8 MW and a change in speed from 900 to 1800 rpm.
• Data inputs included input shaft speed, DC bus voltage for each of the four DC buses, DC exciter field current for each of the four series field, and DC exciter field voltage for each of the four series field.
• Control outputs were four DC exciter field voltage and current amplifiers.
54
4.8. Converter System Successes With the Original Regulator • The original regulator operated well at low power levels, (less than 600 kW), providing
constant DC bus voltage even during changes in input drive speed.
• The original regulator allowed Clipper to learn more about National Instruments control systems and their capabilities.
4.9. Original DC Bus Voltage Regulator Challenges • Unstable control of DC bus voltages due to oscillation of the gearbox at 2.9 Hz. At the
time it was not known if the controller was causing this oscillation or the gearbox was driving the oscillation. The oscillation itself was not recognized until after extensive testing. There was a constant tradeoff between very tight tuning of the field regulator to maintain a narrow voltage regulation specification and the introduction of an oscillation due to the field regulator. Only after the project team removed the automatic field regulator and went to a manually operated, constant current supply did the 2.9 Hz come to a fundamental drivetrain mode.
• Overvoltage of the DC bus due to unstable control of the regulator during testing resulting in failure of all four DC bus capacitor systems.
• Inability of this control system to operate unattended.
4.10. Final Manual Control System Used for Load Testing • Consisted of a DC power supply connected to all eight DC exciter fields in series.
• Manual operation required to control the DC bus voltage to the level necessary for testing.
4.11. Final Manual Control System Successes • The manual system operated without problems for the entire 600‐hour period once the
DC exciter fields were properly connected, grounded, and protected.
• The manual system provided an easy method of generator excitation control, especially during fault events, allowing for faults to de‐energize.
4.12. Manual Control System Challenges • The original power supplies used for the National Instruments automatic field regulator
controller were used to supply the necessary power for the manual field system. These supplies failed when operated into the large inductive load of the DC exciters. These power supplies were replaced by a HP‐6655A supply that operated without failure for the remaining testing and for the entire fatigue testing.
4.13. Electrical Safety System Description • The safety system, shown in Figure 34, drove both the NREL Safety System (designated
to shut down the Dynamometer drive motor) and the Clipper field supply. Outputs
55
from the Converter were connected into this system to assure that the field was shut down during a converter fault. Outputs from the gearbox lubrication system were also connected into the safety system to shut down the drive in case of low oil level or overload on the pump motors. In addition, as shown in Figure 2, fuses were used on both the generator and the converter along with a single overall circuit breaker protection between the 575‐volt line and the converter output.
4.14. Safety System Success • The Safety System operated as required by NREL during the entire 600 hours of fatigue
testing. Failures that generated faults caused the system to shut down without harm to other system components.
4.15. Safety System Failures • There were no direct failures of the safety system during the 600 hours of fatigue testing
of the D‐GEN1 system. The safety system performed correctly during all testing. When connected, it shut down the drive and protected the system at all times.
4.16. Lessons Learned From DGD-I Testing, Successes, and Failures • Using the automatic field voltage regulator to tightly control the DC bus voltage close to
the maximum converter rated DC bus voltage was extremely difficult and was at the root cause of many of the problems the authors had to deal with early on in the test period. This has been completely eliminated in the DGDQ design where a large voltage margin is maintained between the generator output voltage and the converters’ operational DC bus voltage.
• The generators’ output voltage versus excitation and speed should be designedfrom the start to match the converter system it is connected to. The converter is required to meet the generator voltage output at all operational speed ranges.
• Generator output voltage should be tested and unloaded over the entire speed range, prior to connection of the converter’s DC bus capacitors to determine the generators voltage curve and to compare with the designed values. This is part of the authors’ overall test plan for the DGENQ assembly.
• At voltage levels exceeding 600 Vac, form winding should be used for generator construction. Further, this new generator shall be water‐cooled and totally enclosed.
• The converters DC bus capacitors should be rated for operation higher than the output voltage of the generator over the generators entire operational speed range. The DGENQ converter has a rated DC bus capacitor system voltage of 2,250 Vdc with a peak voltage for 30 seconds not to exceed 2,500 Vdc. This is 67% greater than the DGEN‐1 capacitor bank and, more importantly, greater than the highest voltage expected from the generator during the highest over speed test to be performed.
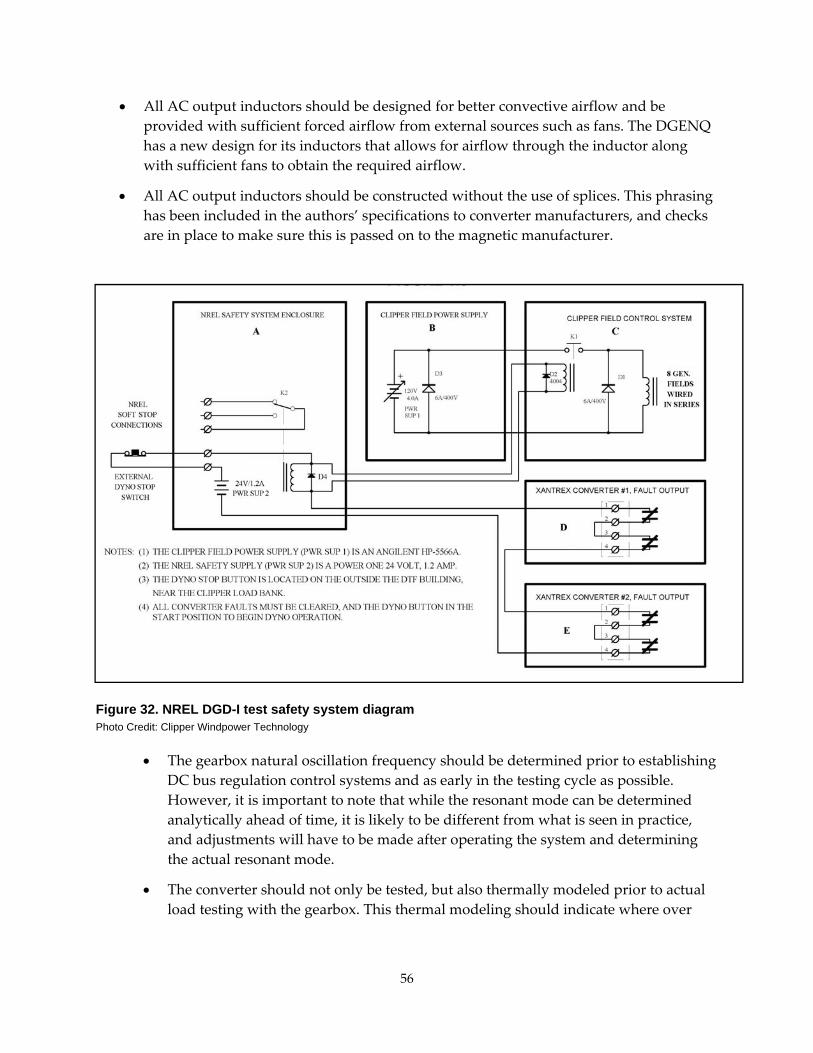
56
• All AC output inductors should be designed for better convective airflow and be provided with sufficient forced airflow from external sources such as fans. The DGENQ has a new design for its inductors that allows for airflow through the inductor along with sufficient fans to obtain the required airflow.
• All AC output inductors should be constructed without the use of splices. This phrasing has been included in the authors’ specifications to converter manufacturers, and checks are in place to make sure this is passed on to the magnetic manufacturer.
Figure 32. NREL DGD-I test safety system diagram Photo Credit: Clipper Windpower Technology
• The gearbox natural oscillation frequency should be determined prior to establishing DC bus regulation control systems and as early in the testing cycle as possible. However, it is important to note that while the resonant mode can be determined analytically ahead of time, it is likely to be different from what is seen in practice, and adjustments will have to be made after operating the system and determining the actual resonant mode.
• The converter should not only be tested, but also thermally modeled prior to actual load testing with the gearbox. This thermal modeling should indicate where over

57
heating will be a problem and allow the manufacture to correct this problem prior to shipment to the test facility.
• The test facility should employ sufficient airflow to prevent over temperature ( the temperature where if it reached the equipment(converter) will miss function or stop working) due to overheated input air at the level of the heat sinks attached to the converter (10 feet above ground for the 2.5 MW converter).
• The GUI software, used with the converter, shall have inputs for both oscillation center frequency set point and gain set point for easy field adjustment of this important parameter.
• Generator to Gearbox mechanical interface shall be tested prior to installation at the dynamometer facility to assure proper fitting and operation.
• The generator used on the DGENQ shall have a permanent magnetic exciter with no provision for external controls, manual, or automatic, required. Further such a generator will not require rotating rectifiers, rotating wound fields, or DC exciter coils for its operation.
• Safety system shall be employed to shut down the dynamometer due to converter faults and generator over temperature faults.
• Fuse and circuit breaker protection shall be part of the converter system as previously applied to the DGD1 testing.

58

59
5.0 Conclusions The DGD‐I development program was extremely successful with respect to demonstrating the advantages of the system architecture compared with the conventional wind turbine drivetrain systems. The architecture lends itself to further turbine scaling and yet further improvements in wind turbine system cost of energy. The architecture significantly reduces the warranty risk and major component system replacement logistical costs associated with multi‐megawatt, single‐generator system failures.
• The torque‐splitting architecture of the DGD system demonstrated its design, cost, and serviceability objectives.
• The system successfully operated at 130% of rated torque for over 600 hours.
• The system final design demonstrated a 35% cost improvement compared with conventional 1.5 MW gearbox designs.
• The DGD system delivered a 15% reduction in weight and a reduction in total drivetrain system length of more than 10 feet compared to the baseline 1.5 MW turbine design.
5..1 Recommendationsand Benefits As of the time of this writing, Clipper Windpower has completed testing on the NREL dynamometer of a next generation 2.5MW DGEN‐Quantum TM drivetrain that will be integrated into a prototype turbine to be erected in Wyoming in the first quarter of 2005. The DGD‐I program provided invaluable learning opportunities and helped to demonstrate the technology advantages of the torque splitting, multiple‐generator, drivetrain system. The successful outcomes arising from this program help to position this technology for further development under a $16.9 million cost‐shared grant from the U.S. DOE and NREL.
The benefits of this program to California include furthering the state‐of‐the‐art of wind turbine technology, a reduction in the cost of energy from a non‐polluting, renewable energy resource, and the ability to reduce California’s dependence on fossil fuels and their associated negative environmental and health impacts.

60

61
6.0 Distributed Generation Drive Technology – Next Steps The Clipper C‐93 2.5 MW series wind turbine is currently being developed under the DOE/NREL low wind‐speed turbine (LWT) project. The goal of the LWT project is to develop technology that allows wind energy to be a competitive power generation option, by producing electricity for 3.0 cents/kWh, in Class 4 wind sites by 2012.
The Clipper turbine uses innovative hardware and controls designs to achieve a dramatic cost of energy reduction. Central to the design concept is the Clipper Distributed Generation Drive, which uses split power (torque) paths and four permanent magnet generators. Advanced State‐Space turbine controls and adaptive algorithms will be used to mitigate rotor loads while energy capture is increased through variable‐speed operation of its 93‐meter rotor.
The prototype turbine is currently being commissioned in Medicine Bow, Wyoming. The prototype installation was completed in March 2005.
The DGEN‐Q drivetrain has benefited from the lessons learned on the DGD‐1 and is about to be launched for series production. The DGEN‐Q is a 2.5 MW system that uses four output shafts and four generators.
Features of the DGEN‐Q or “Quantum Drive” prototype and its development process that differ from the DGD‐1 are as follows:
• Four permanent magnet generators with low torque rise if shorted.
• Double helical gear on Stage One.
• Single helical gear on Stage Two.
• No adjustable bearing sets used on gear shafts.
• Mainshaft bearings set via Timken “Set‐Right.”
• Load distribution strain gage verification on both gear stages.
• High‐ resolution torque measurement on high speed shafts and mainshaft.
• Coordinate measuring machine reports for all gearbox housings.
• Metallurgical control of gearing heat lots with “toothed slugs.”
6.1. Advantages of the DGEN-Q Electrical System Compared to the Original DGD-I 6.1.1. Generators
• No field windings, no rotating stator fields, no rotating rectifiers, and no field excitation control system required.
• Generator stator is Form Wound and rated for operation at medium voltages.
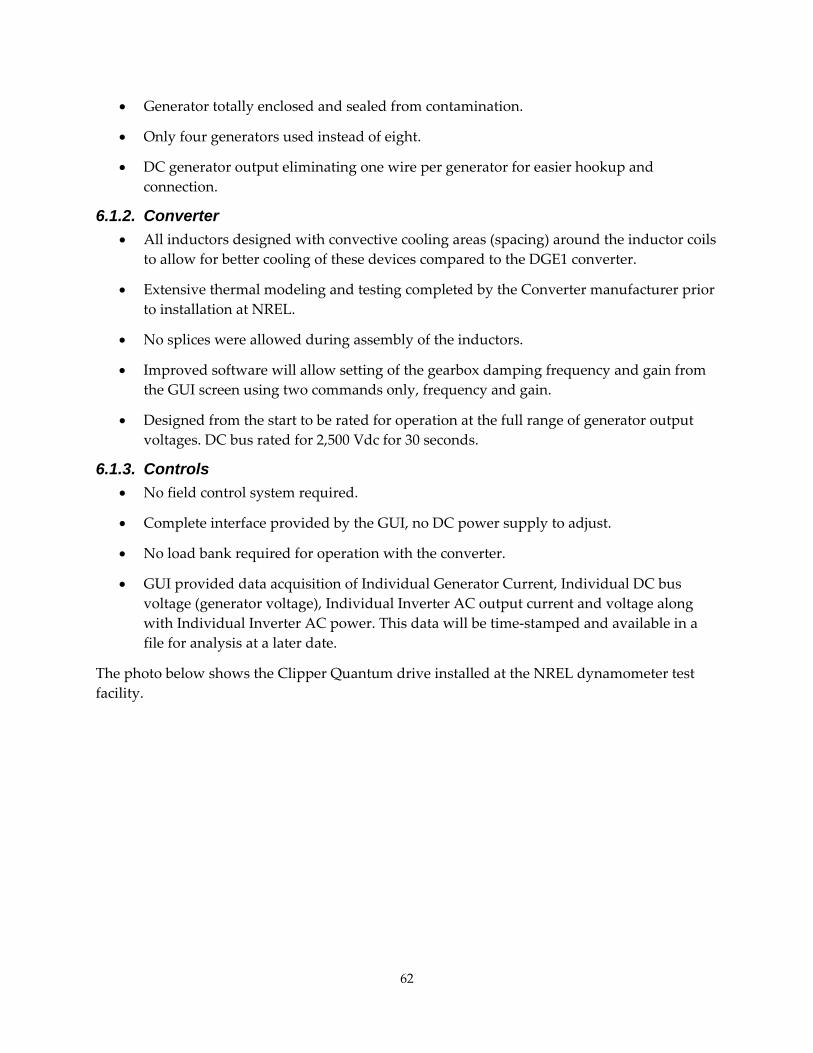
62
• Generator totally enclosed and sealed from contamination.
• Only four generators used instead of eight.
• DC generator output eliminating one wire per generator for easier hookup and connection.
6.1.2. Converter • All inductors designed with convective cooling areas (spacing) around the inductor coils
to allow for better cooling of these devices compared to the DGE1 converter.
• Extensive thermal modeling and testing completed by the Converter manufacturer prior to installation at NREL.
• No splices were allowed during assembly of the inductors.
• Improved software will allow setting of the gearbox damping frequency and gain from the GUI screen using two commands only, frequency and gain.
• Designed from the start to be rated for operation at the full range of generator output voltages. DC bus rated for 2,500 Vdc for 30 seconds.
6.1.3. Controls • No field control system required.
• Complete interface provided by the GUI, no DC power supply to adjust.
• No load bank required for operation with the converter.
• GUI provided data acquisition of Individual Generator Current, Individual DC bus voltage (generator voltage), Individual Inverter AC output current and voltage along with Individual Inverter AC power. This data will be time‐stamped and available in a file for analysis at a later date.
The photo below shows the Clipper Quantum drive installed at the NREL dynamometer test facility.
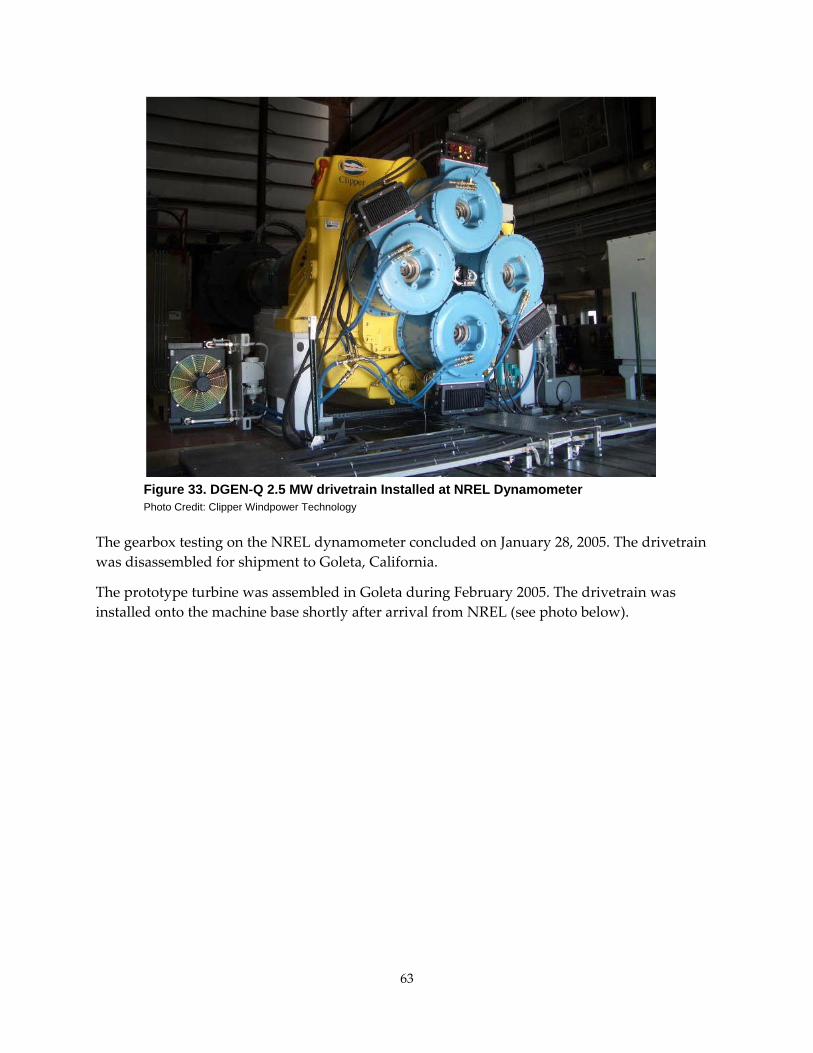
63
Figure 33. DGEN-Q 2.5 MW drivetrain Installed at NREL Dynamometer
Photo Credit: Clipper Windpower Technology The gearbox testing on the NREL dynamometer concluded on January 28, 2005. The drivetrain was disassembled for shipment to Goleta, California.
The prototype turbine was assembled in Goleta during February 2005. The drivetrain was installed onto the machine base shortly after arrival from NREL (see photo below).
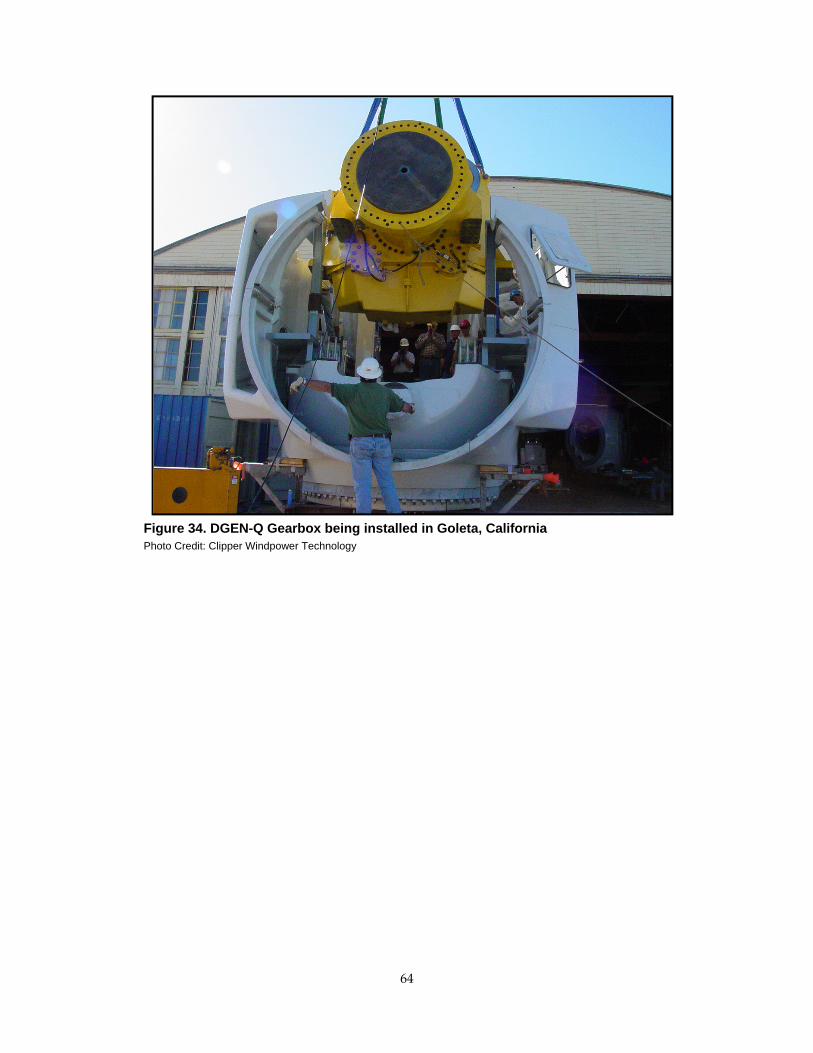
64
Figure 34. DGEN-Q Gearbox being installed in Goleta, California Photo Credit: Clipper Windpower Technology
65
7.0 General C-93Turbine Configuration The Liberty 2.5 MW Wind Turbine is designed to IEC Code for a 30‐year life and has an upwind, three bladed, horizontal axis configuration. It is a torque‐ and speed‐regulated, variable‐speed machine that employs an independent, full blade span pitch control system as the primary braking system. The D‐GEN Q gearbox is an integrated, distributed generation type (patented) that has helical gears and four output shafts. Mechanical power is converted to electrical power via synchronous generators and a pulse‐width modulated conversion system that delivers AC power at the nominal grid frequency. The turbine is yawed into the wind with an active yaw bearing system driven by four electro‐mechanical drivers and fixed by yaw brake calipers when not engaged. This entire system sits atop a tubular steel tower with a hub height of 80 m (other hub height options available). All turbine modes of operation, fault protection parameters, and condition monitoring are controlled by Clipper’s purpose‐designed, imbedded power‐pc controller, which interfaces with commercially available SCADA systems.
7.1. C-93 Rotor The CWT 2.5 MW Wind Turbine Generator rotor is 89 meter for IEC Class I, 93 meters in diameter for IEC Class II, and 99 meters for IEC Class III, and has a swept area of 6221 m2 for Class I, 6793 m2 for a Class II, and 7698 m2 for Class III. The three classes for the “C” turbine allows the maximum utilization of the wind resource at the highest and lowest wind speed site.
The variable speed operation of the rotor results in a nominal speed range of 9.6 to 15.5 rpm. The variable speed system is a cost effective means of achieving variable speed operation (Patent pending) without interference with utility requirements for ride through and VAR support.
The rotor is equipped with CWT purpose‐designed blades 45.2 meters long. Fiberglass‐reinforced epoxy is the material utilized to make the blades. T‐bolts are used to connect the blades to the pitch bearings that are secured to the cast ductile iron hub. Access to the blade pitch system within the hub may be made from any one of three manholes provided.
Primary and secondary braking is executed by the independent blade pitch system. This system is composed of a PCU, three Emergency Power Units (EPU), and three pitch drives. The PCU manages the pitch activity under controlled conditions (such as rotor speed regulation in rated winds and commanded shut downs) and the EPUs are battery‐powered and serve as the secondary or emergency system to pitch the blades to the feather position in all other conditions. The pitch drive is composed of a DC motor and speed reduction gearbox. In both the controlled and emergency operation modes, the pitch drive output pinion drives the blade bearing internal gear teeth. The pitch system is a fail‐safe system whereby all three blades are pitched independently of each other when functioning in the secondary or emergency mode.
7.2. C-93 Gearbox The CWT 2.5 MW Wind Turbine Generator gearbox is a two‐stage helical gearbox with 4 individual output shafts (Patents issued and pending). The integral design includes a forged
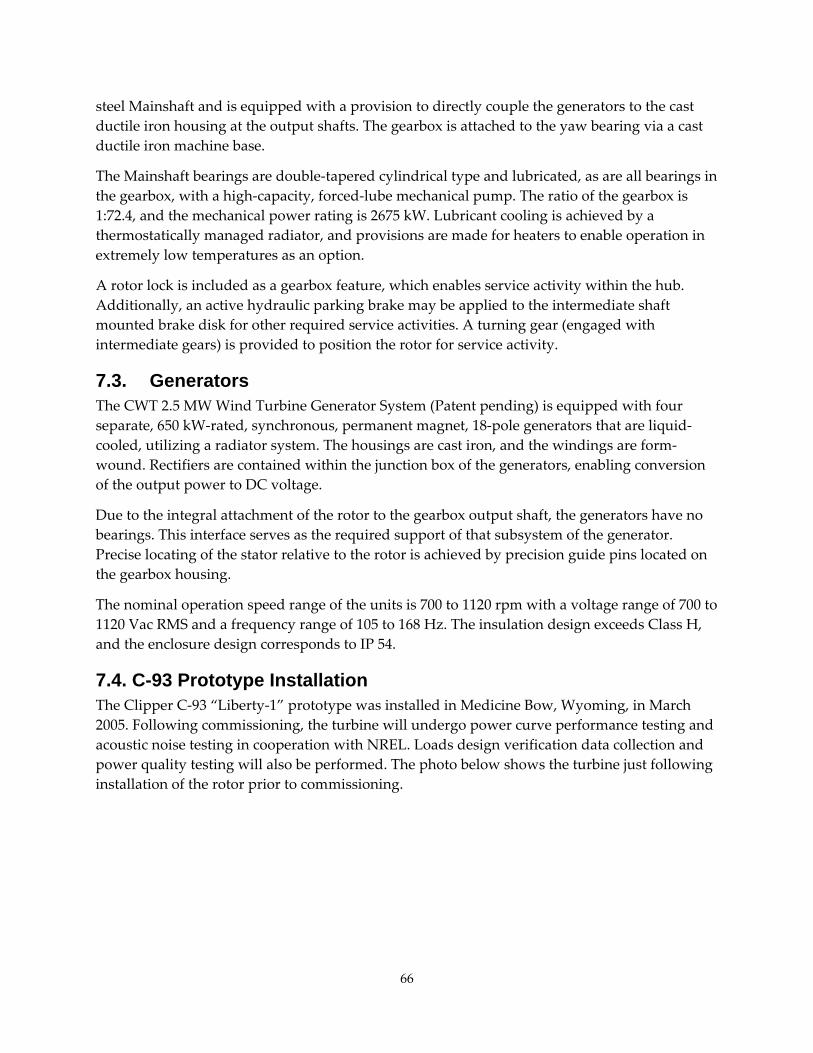
66
steel Mainshaft and is equipped with a provision to directly couple the generators to the cast ductile iron housing at the output shafts. The gearbox is attached to the yaw bearing via a cast ductile iron machine base.
The Mainshaft bearings are double‐tapered cylindrical type and lubricated, as are all bearings in the gearbox, with a high‐capacity, forced‐lube mechanical pump. The ratio of the gearbox is 1:72.4, and the mechanical power rating is 2675 kW. Lubricant cooling is achieved by a thermostatically managed radiator, and provisions are made for heaters to enable operation in extremely low temperatures as an option.
A rotor lock is included as a gearbox feature, which enables service activity within the hub. Additionally, an active hydraulic parking brake may be applied to the intermediate shaft mounted brake disk for other required service activities. A turning gear (engaged with intermediate gears) is provided to position the rotor for service activity.
7.3. Generators The CWT 2.5 MW Wind Turbine Generator System (Patent pending) is equipped with four separate, 650 kW‐rated, synchronous, permanent magnet, 18‐pole generators that are liquid‐cooled, utilizing a radiator system. The housings are cast iron, and the windings are form‐wound. Rectifiers are contained within the junction box of the generators, enabling conversion of the output power to DC voltage.
Due to the integral attachment of the rotor to the gearbox output shaft, the generators have no bearings. This interface serves as the required support of that subsystem of the generator. Precise locating of the stator relative to the rotor is achieved by precision guide pins located on the gearbox housing.
The nominal operation speed range of the units is 700 to 1120 rpm with a voltage range of 700 to 1120 Vac RMS and a frequency range of 105 to 168 Hz. The insulation design exceeds Class H, and the enclosure design corresponds to IP 54.
7.4. C-93 Prototype Installation The Clipper C‐93 “Liberty‐1” prototype was installed in Medicine Bow, Wyoming, in March 2005. Following commissioning, the turbine will undergo power curve performance testing and acoustic noise testing in cooperation with NREL. Loads design verification data collection and power quality testing will also be performed. The photo below shows the turbine just following installation of the rotor prior to commissioning.
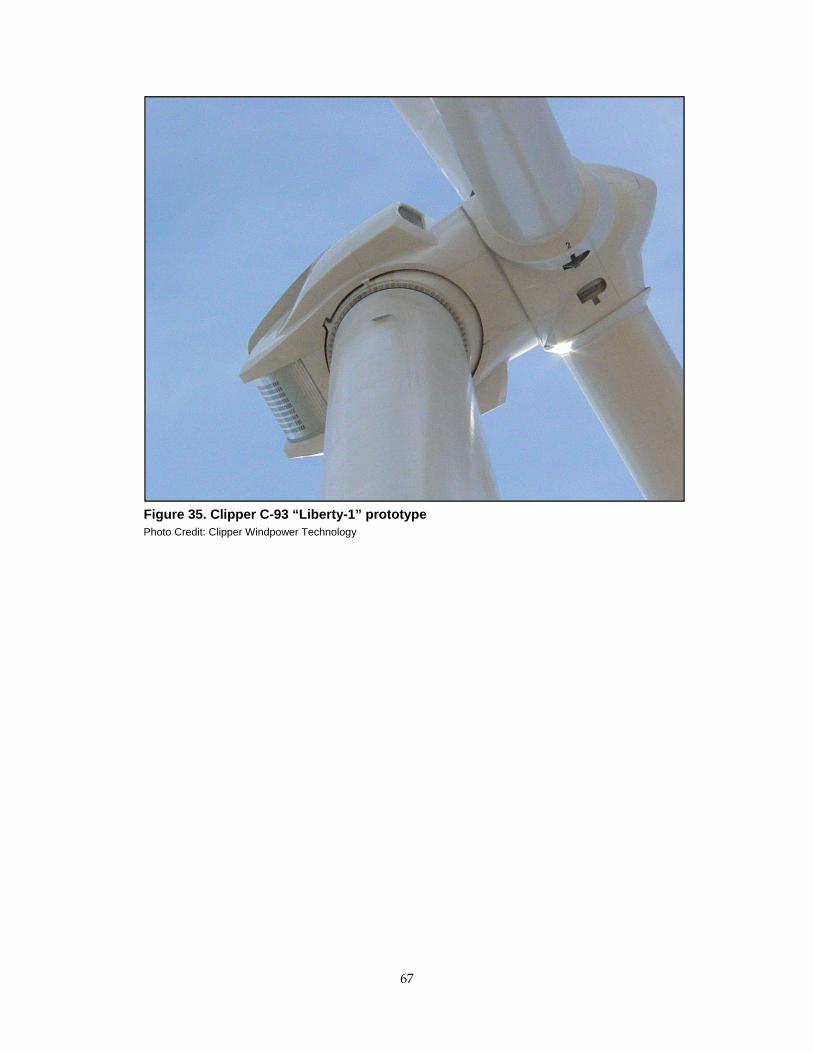
67
Figure 35. Clipper C-93 “Liberty-1” prototype
Photo Credit: Clipper Windpower Technology

68
Glossary
AGMA American Gear Manufacturers Association ASTM American Society for Testing & Materials CWT Clipper Windpower Technology
Delta The delta winding style of three‐phase generator construction requires no common but each coil is connected in series to the other.
Db Decibels
DGD‐I Distributed generator drivetrain #1. The prototype test article employed at the NREL Dynamometer test stand until July 2004.
DGENQ The Quantum Distributed Generator drivetrain. The next generation of distributed generation drive‐train technology tested on the NREL Dynamometer in the fourth quarter of 2004.
DTF Dynanometer test facility EPU Emergency power units FEA Finite Element Analysis GCU Generator Control Unit
GUI Graphical user interface. Sometimes called a Human Machine Interface, or HMI. A program used on a computer to help interface a machine with an operator.
Hz Hertz IEC International Electrotechnical Commission IEEE Institute of Electrical and Electronics Engineers
IGBT Insulated‐gate bipolar transistor. A modern switching element employing a combination of both bipolar and field affect transistors.
kW Kilowatt LWT Low wind‐speed turbine MDEC Mechanical Design Engineering Consultants MW Megawatt
MOV Metal oxide varistor. A resistor whose resistance is proportional to its applied voltage, above a set point. A transient voltage protection device.
NEC National Electrical Code NREL The National Renewable Energy Laboratory. O&M Operations & Maintenance PCU Pitch control unit PE Power Electronics PEI Powertrain Engineers Inc. PID Proportional‐integral‐derivative Rpm Revolutions per minute SCADA Supervisory Control and Data Acquisition TCU Turbine control unit
TVS Transient voltage suppressor. A zener type silicon diode with enhanced transient voltage suppression capabilities.

69
U.S. DOE United States Department of Energy UL Underwriters Laboratories Inc. UT Ultrasonic testing Vac or AC Volts alternating current or alternating current Vdc or DC: Volts direct current or direct current
Wye A “Y” winding style of three‐phase generator construction where all phase coils share a common connection.

1
Appendix A
Gearbox Inspection Letter
2
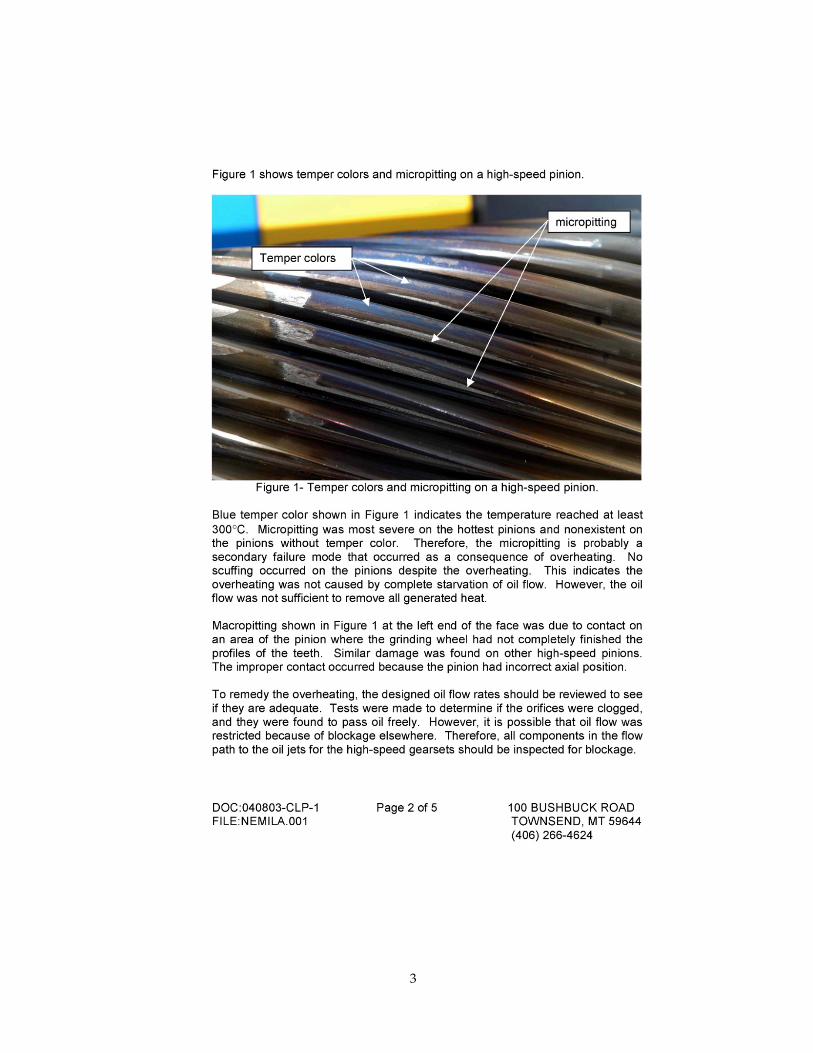
3
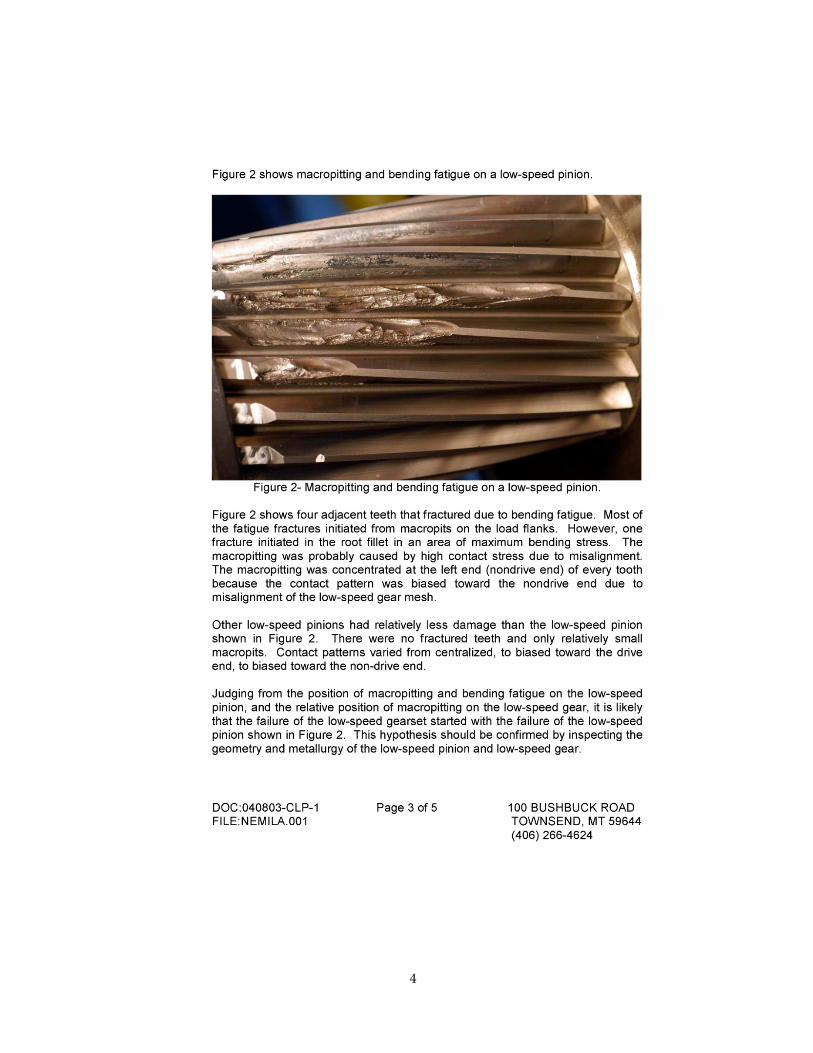
4
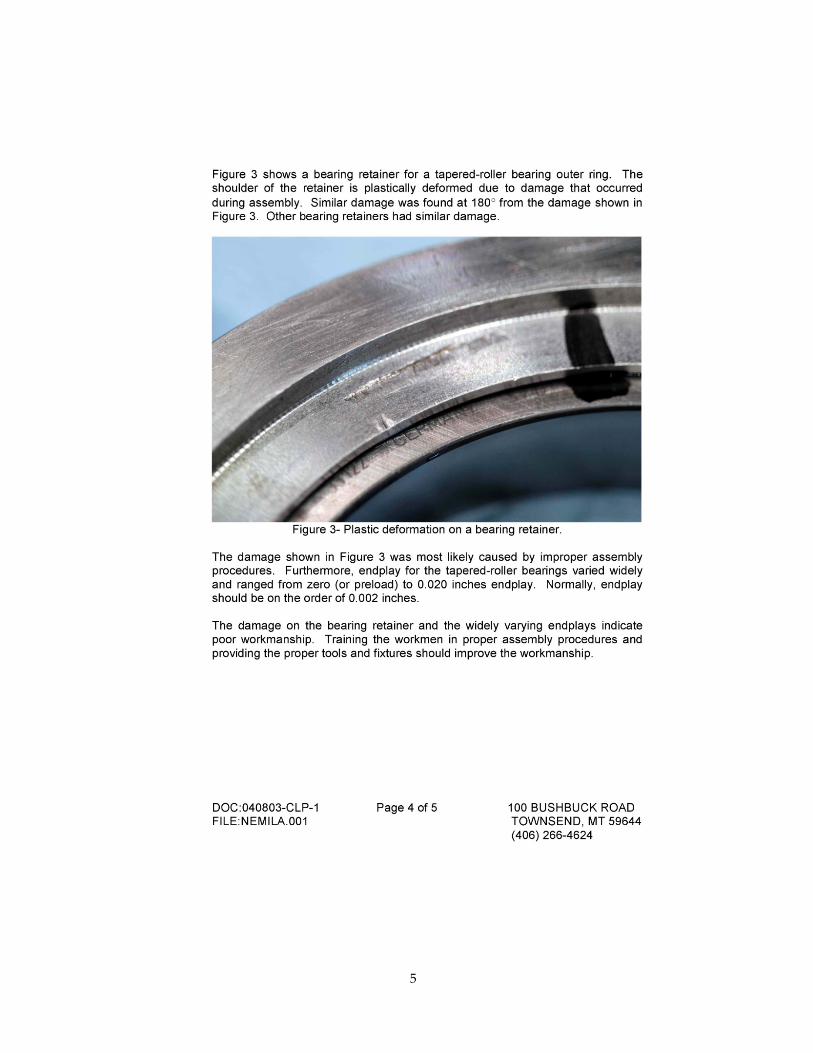
5
1