
Investing in distressed financial assets in Russia and Ukraine
Upload
vuongtuyenCategory
view
218download
0
Distressed For Control Investing
New Playbook for the Mega Cycle in Defaults
Atlanta ~ March 11, 2009

MatlinPatterson O er ieMatlinPatterson Overview
MatlinPatterson—$9+ billion in asset management for a globally diverse group of institutionalinvestors including government and corporate pension funds, endowments, foundations, andinsurance companies, as well as funds of funds and family offices
Private Equity Strategy: Investing globally in distressed securities and assets for corporatecontrol. $2.2 billion in Fund I—13 companies $1.7 billion in Fund II—fully deployed in 18companies; $5 billion in Fund III—54% drawn in 7 companies
Hedge Fund Strategy: Non-control distressed/value investing globally, est. ‘07• $200 million AUM, tripled since inception, +10.76% net first 2 months‘08
Founded in 1994 by David Matlin and Mark Patterson within Credit Suisse• Established independently in 2002, team of 60 investment and support professionals
Over 70 distressed control investments, exposures in 40 countries
Offices in New, London and Hong Kong
2 2

Di t d I ti i C t l d N C t l E i tDistressed Investing in Control and Non-Control Environments
Atlanta ~ December 5, 2007,“Distressed for Dummies”f
3

S bP iSubPrime
4

St t d P d tStructured Products
5

C dit C i iCredit Crisis
6

Did you ever think that making a speechDid you ever think that making a speech on economics is a lot like pissing down your leg? It seems hot to you, but it never does to anyone else.y
~Lyndon B. Johnsony
7

C t M k t C ditiCurrent Market Conditions
Does anything make sense?Does anything make sense?
8

C t M k t C ditiCurrent Market Conditions
B k t b ti i US t k k t D f lt t dBear market observation in US stock markets Default trends
Bank Market cap shrinkage
High yield pricing
Loan sector pricingp g
Loans verses Bonds
D f l dDefault trends
LBO Model
9

F B d B M k tFour Bad Bear Markets
10

Fi i l M k t CFinancials: Market Cap
11

Hi h Yi ld S d t T iHigh Yield Spread to Treasuries
2000
1600
1800
2000
1520
1000
1200
1400
ps
15202/26/09
600
800
1000bp
0
200
400
1996 1997 1998 1999 2000 2001 2002 2003 2004 2005 2006 2007 2008
12Source: Bloomberg

Hi h Yi ld B d P i (1998 02/26/09)High Yield Bond Prices (1998 - 02/26/09)
PAR
58
13Source: Bloomberg

L d B k L P i (1998 02/28/09)Leveraged Bank Loan Prices (1998 - 02/28/09)
PAR
65 1365.13
14Source: Bloomberg

Hi h Yi ld M t it S h d l (U S )High Yield Maturity Schedule (U.S.)
200
250Leveraged Loans* High Yield Bonds
150
200
ons)
100($B
illi
0
50
2008 2009 2010 2011 2012 2013 2014 >2014
*Includes Term Loans, Revolvers, and Other Loans; Assumes Revolvers are Fully Drawn.
15Source: DealLogic, Fitch Ratings
y

M k t F t Th 2007 B bblMarket Factors - The 2007 Bubble
Ed Alt Q3 2007 “42% f hi h i ld t b d i d i 2003 t d B
D efau lt R ates vs. N ew Issuance Am o un t and Qu ality
Ed Altman, Q3 2007 – “42% of high-yield corporate bonds issued since 2003 were rated B- or lower, rising to nearly 50% in the first six months of this year”
$500
$600
12.0%
14.0%
$300
$400
llion
s 8.0%
10.0%
ate
%
$200
$300
US$
in B
i
4.0%
6.0%
Defa
ult R
a
$0
$100
1993 1994 1995 1996 1997 1998 1999 2000 2001 2002 2003 2004 2005 2006 1H070.0%
2.0%
16Source: CSFB and S&P LCD. Note: 2005 default data does not include the Calpine default.
1993 1994 1995 1996 1997 1998 1999 2000 2001 2002 2003 2004 2005 2006 1H07
HY B and Lower HY S plit B B and Higher Ins t. Loan B and Lower Ins t. Loan S plit B B and Higher Com bined Default Rate

D f lt T dDefault Trends
20%
16%
20%
12%
8%
4%
0%1988 1989 1990 1991 1992 1993 1994 1995 1996 1997 1998 1999 2000 2001 2002 2003 2004 2005 2006 2007 2008
HY Default Rate Prior Recession Today's Recession
17Source: Moody’s, Bloomberg

A E it C t ib ti t LBO (2001 2007)Average Equity Contribution to LBOs (2001-2007)
50%
40%
50%Rollover Equity Contributed Equity
Average: 36 2%
40.6%
30%
Average: 36.2%
%40.0%
39.5%
35.1%32.1% 33.3% 32.9%20%
6%3% 5% 3% 2% 2% 2%0%
10%
2% 2% 2%0%2001 2002 2003 2004 2005 2006 2007
Note: Equity includes common equity and preferred stock as well as holding company debt and seller note proceeds downstreamed to the
18Source: Standard and Poor’s LCD
operating company as common equity

Thi C lThis Cycle
C dit k t t b t t i i iCredit market stress, but no systemic crisis– Residential mortgages were early indicators that the world was over levered
• Direct leverage• Structured products (CDOs CDO2)• Structured products (CDOs, CDO )• Commercial real estate
Unwind will take time
Default triggers are staggered– Cov-lite deals– PIK-Toggle bonds– Lack of DIP Financing
This distressed cycle is economically driven affecting different sectors and credits at different timesdifferent times
– NOT a “V” shape– Market timers will be unsuccessful
Long/Short strategies will outperform
19
– Long/Short strategies will outperform

Di t d St t iDistressed Strategies
The FutureProfiting from the situation
20
B i C it li i i Di t d E i tBasics—Capitalizing in Distressed Environments
U d t d t ’ f di tUnderstand a sector or company’s causes of distress
Leverage consultants and board members
Is control available or not? Hedge funds don’t ask this question
Keep powder dry for the unforeseen, even after gaining controlp p y , g g
Change management, sometimes often (family companies?)
I i i h LBO d lIncentivize management more than LBO model
Seek out add-on complimentary acquisitions
Stress-test regulatory impact/intervention
Wear a helmet
21
Wear a helmet

CS L d L R t b I d t 2008CS Leveraged Loan Returns by Industry—2008
YTD D b 2008
-10 00%
-5.00%
0.00%YTD December 2008
-15.53%-16.48%
-20.35%21 17%
-20.00%
-15.00%
10.00%
-21.17%
-23.84%-24.12%-24.15%-25.61%
-27.79%-28.22%-28.75%-29.40%-29.71%-31.09%-31.41%
-32.54%-35 00%
-30.00%
-25.00%
-37.89%-38.20%-39.34%
-40.44%
-44.32%-45.00%
-40.00%
35.00%
-50.00%
Food/Toba
cco
Healthca
reore
st Prod
ucts
Utility
Manufac
turing
Non-D
urable
sFoo
d and D
rugEne
rgyServ
ice
Metals/
Minerals
ev L
oan I
ndex
Financia
lAero
space
Chemica
lsMed
ia/Tele
com
on Tec
hnolog
y
umer Dura
bles
Retail
Gaming
/Leisu
reHous
ingTrans
portati
on
22
Fo
For MCons
umer N Fo
MetCS Le
v MeInf
ormati
onCons
um
Ga T
Source: Credit Suisse

CS L d L R t b I d t 2009
5 00%
CS Leveraged Loan Returns by Industry—2009
F b 20093.90%
2.99% 2.82%2.54%
2.29% 2.10% 1 93%
3.00%
4.00%
5.00% February 2009
1.93% 1.72%1.47% 1.44%
0.86% 0.66%0.35%
0 11% 0 22%0.00%
1.00%
2.00%
-0.11% -0.22% -0.37%-0.81%
-3.00%
-2.00%
-1.00%
-4.31%-4.35%-4.85%
-5.15%6 00%
-5.00%
-4.00%
-6.00%
Service
Food and
Drug
mation
Techno
logy
Healthca
reEne
rgyHous
ing
mer Non
-Dura
bles
Aerosp
aceFoo
d/Tobacc
o
Forest
Produc
tsFina
ncial
Metals/
Minerals
SLe
v Lo
an Ind
exMan
ufactur
ing
Media/
Teleco
mRetail
onsumer D
urable
sUtili
tyTrans
portati
on
Gaming
/Leisu
reChem
icals
23
Inform
a
Consum CS
Con
Source: Credit Suisse

C tl I t ti S t /C iCurrently Interesting Sectors/Companies
Fi i l B k d Th iftFinancials—Banks and Thrifts
Infrastructure—Chemicals, utilities, energy
Home Building/Supply sectors
Non-Bank Financials—Mortgage Lenders/Insurance Companiesg g p
Casinos
M di R di blMedia: Radio, cable, newspapers
24

V l C ti D iValue Creation Drivers
“B Ri h ” “R W ll” “R W ll”“Buy Right” “Restructure Well” “Run Well”
DUE DILIGENCE ANDT
REORGANIZATION PHASEPOST-REORGANIZATION
ACQUISITION PHASE
REORGANIZATION PHASEPHASE
Expeditiously conduct due dili
Manage and dominate the i ti
Set agenda for management d b d i till “ fdiligence
Establish toe-hold position in fulcrum securities
d i f i f i
reorganization process
Replace management when necessary
d if i l l
and board—instill “sense of urgency”
Active board member
id i l i “Trade price for information”
Execute transactions in a highly expedited time frame
Identify optimal plan to satisfy most other stakeholders
Use bankruptcy process to
Provide strategic planning
Provide capital markets expertise
Advantage of non-disclosure Use bankruptcy process to shed business units, reject contracts, negotiate terms
Define business plan
Pursue selective acquisitions and divestitures
Aggressively manage exit opportunities
25
p
Creative structuring to solve intractable problems
opportunities

C t M k t C ditiCurrent Market Conditions
Old Playbook New TwistsOld Playbook, New Twists
26

R t t i T dRestructuring Trends
C hi l hCap structures this cycle are top heavy
DIP Financing is scarceg
Justice system is moving rapidly
Many players were early and have tainted portfolios
Little to no refinancing interest at the top of capital structures (banks are not lending and structured products are out of the market)
27

NRG C St d P t E (Old St l )NRG: Case Study: Post-Enron (Old Style)
M h ffili f E l EMerchant power affiliate of Excel Energy
$10B in NRG debt, no core holders of size – i.e. control is available
Retain R W Beck to evaluate 63 power plants around the world – outside/in due diligenceRetain R.W. Beck to evaluate 63 power plants around the world outside/in due diligence
Build intricate asset-by-asset model to predict sub debt recoveries 3 years hence
Acquire large blocks of sub debt in publicly traded markets without NRG’s knowledge
Meet with CEO of Excel to fine tune parent settlement offer to creditors
Hire NRG CEO through creditor committee, 7 months emergence from bankruptcy
3 MatlinPatterson Partners on 11 person board
MPAM controls 20% of NRG; 2nd largest shareholder controls 1%
$6 billion of emergence financing and refinancing – no NRG CFO
Re-list (IPO) NRG stock on NYSE
MatlinPatterson exits in 3 public secondaries monetizing 3X
28
MatlinPatterson exits in 3 public secondaries monetizing 3X

NRG B f Ch t 11 (Old St l ) 2002NRG: Before Chapter 11 (Old Style) - 2002
Secured DebtSecured Debt$4,000,000,000
Unsecured Debt$5 000 000 000$5,000,000,000
Total Debt: $9B
29

N C t l Pl T E lNon-Control Players Too Early…
Masonite*Masonite
30*Numbers are rounded to make the math easy.

M it *Masonite*
2006 KKR l d $3 1B d l2006 KKR led $3.1B deal
332mm EBITDA in 2006 Bank Debt$1 500 000 000
$2.27B debt
$650mm of equity
$1,500,000,000L+250
$650mm of equity
Equity
Junk Bonds$770,000,000
Equity$650,000,000
31*Numbers are rounded.

M it * Hit Th W ll 2008 Fi t H lf R ltMasonite Hits The Wall—2008 First Half Results
S l d li d 16 1% $972 1 f $1 158 3 i h fi i hSales declined 16.1% to $972.1mm from $1,158.3 mm in the first six months of 2007
O ti EBITDA d d 42 8% t $92 8 f $162 2Operating EBITDA decreased 42.8% to $92.8 mm from $162.2 mm
Adjusted EBITDA decreased 39.5% to $109.5 mm from $181.0 mm
Adjusted EBITDA margin decreased to 11.3% from 15.6%
Net debt increased $124.9 mm to $2,035.2 mm on June 30, 2008Net debt increased $124.9 mm to $2,035.2 mm on June 30, 2008
32*Numbers are rounded.

M it * T t l E t i V l ti Q4 2008Masonite Total Enterprise Valuation—Q4 2008
2006 LBO $3.1B
Bank Debt$1,500,000,000
November 2008 $1.5B
Bank Loan Value$1,200,000,000Junk Bonds
$770,000,000Bank Debt trading @ 80
Bank Loan Value$1,200,000,000
Bond Value$300,000,000
Equity$650,000,000 Bonds trading @ 40 Bond Value
$300,000,000
33*Numbers are rounded.

M it * I t ti l Pl P k M h 2009Masonite International Plan – Prepack March 2009
B k $300 d b 97 5% f iBanks get $300mm new debt, 97.5% of equity
Senior Subordinated Notes: 2.5 % of equity, plus warrants for 17.5%
Trade is unimpaired due to $160mm cash on the books
KKR Equity: NothingKKR Equity: Nothing
34*Numbers are rounded.

M it * T dMasonite Today
2006 LBO $3.1 Billion
Bank Debt$1,500,000,000
November 2008$1.5 Billion
J k B d
March 2009$550 Million
Equity
Junk Bonds$770,000,000
Bank Loan Value$1,200,000,000
New Loans$300,000,000
New Loans$300,000,000
Equity$650,000,000 Bond Value
$300,000,000
Equity$250,000,000
Bank Debt trading @ 36
Equity$250,000,000
35*Numbers are rounded.
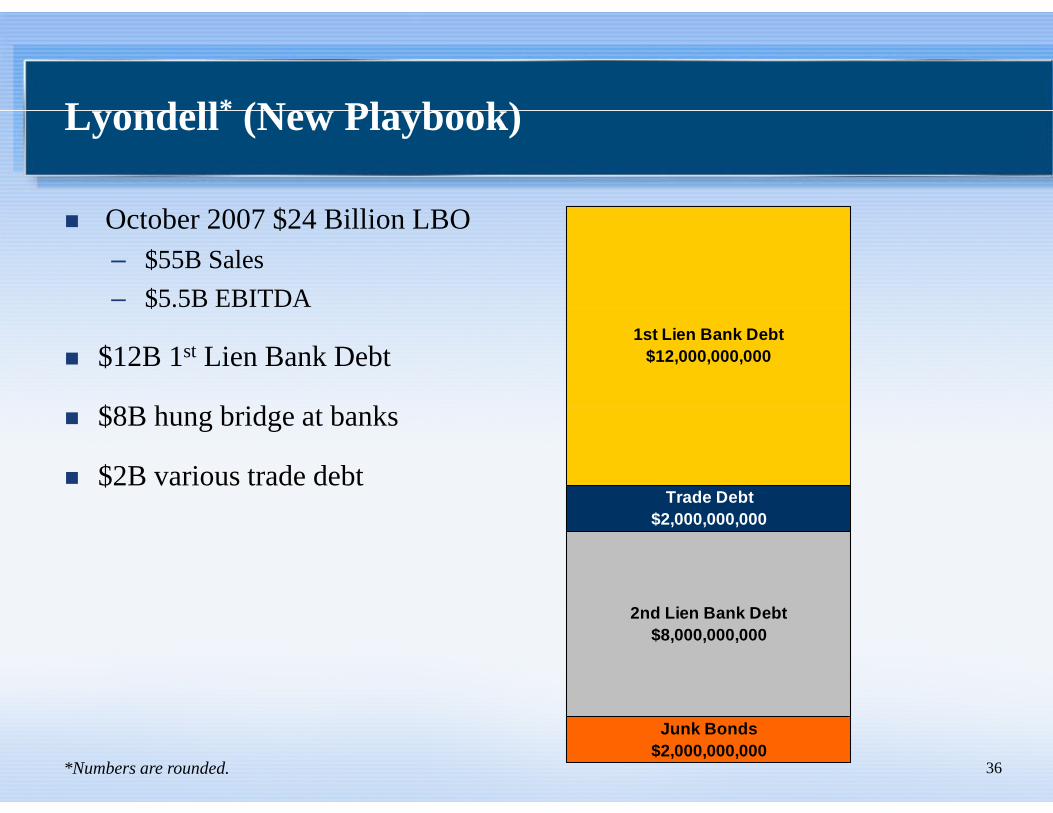
L d ll* (N Pl b k)Lyondell (New Playbook)
O b 2007 $24 Billi LBOOctober 2007 $24 Billion LBO – $55B Sales– $5.5B EBITDA$
$12B 1st Lien Bank Debt
$8B h b id b k
1st Lien Bank Debt$12,000,000,000
$8B hung bridge at banks
$2B various trade debtTrade Debt
$2,000,000,000
2nd Lien Bank Debt$8,000,000,000
36
Junk Bonds$2,000,000,000
*Numbers are rounded.

L d ll* R llLyondell – Roll up
O i i l D bt St t DIP R ll
DIP Financing$3,250,000,000
Original Debt Structure DIP Roll up
Trade Debt$2,000,000,000
Roll up$3,250,000,000
Old 1st Lien Bank Debt$8,750,000,000
1st Lien Bank Debt$12,000,000,000
Trade Debt$2,000,000,000
2nd Lien Bank Debt$8,000,000,000
2nd Lien Bank Debt$8,000,000,000
37
Junk Bonds, $2,000,000,000
Junk Bonds$2,000,000,000
*Numbers are rounded.

L d ll* C t V l tiLyondell – Current Valuation
P t DIP R ll T t l V l ti $7 9BDIP Financing$3,250,000,000
Post DIP Roll up
DIP trading @ 95
Total Valuation $7.9B
Trade Debt$2,000,000,000
Roll up$3,250,000,000 Roll up trading @ 95
Super Senior$6,200,000,000
Old 1st Lien Bank Debt$8,750,000,000 Old 1st Lien trading @ 15
Old 1st Lien Bank Debt$1,300,000,000
2nd Lien Bank Debt$8,000,000,000 Not trading
38
2nd Lien Bank Debt$400,000,000
Junk Bonds, $2,000,000,000 Not trading
*Numbers are rounded.

L d ll* (N Pl b k) F b R t t iLyondell (New Playbook) – February Restructuring
1 t Li b k d b i fili d d 451st Lien bank debt prior to filing traded at 45
DIP financing created $3.25B Super Senior
Roll up of existing 1st Lien by new money DIP providers upgraded $3.25 Billion of 1st Lien debt
Value transfer of roll up is $3.25B x (Super Senior Price of 95 – 1st Lien post re-org price of 15) = $2.6B
New cap structure creates fulcrum security potential down the road for private equity distressed control player
39*Numbers are rounded.
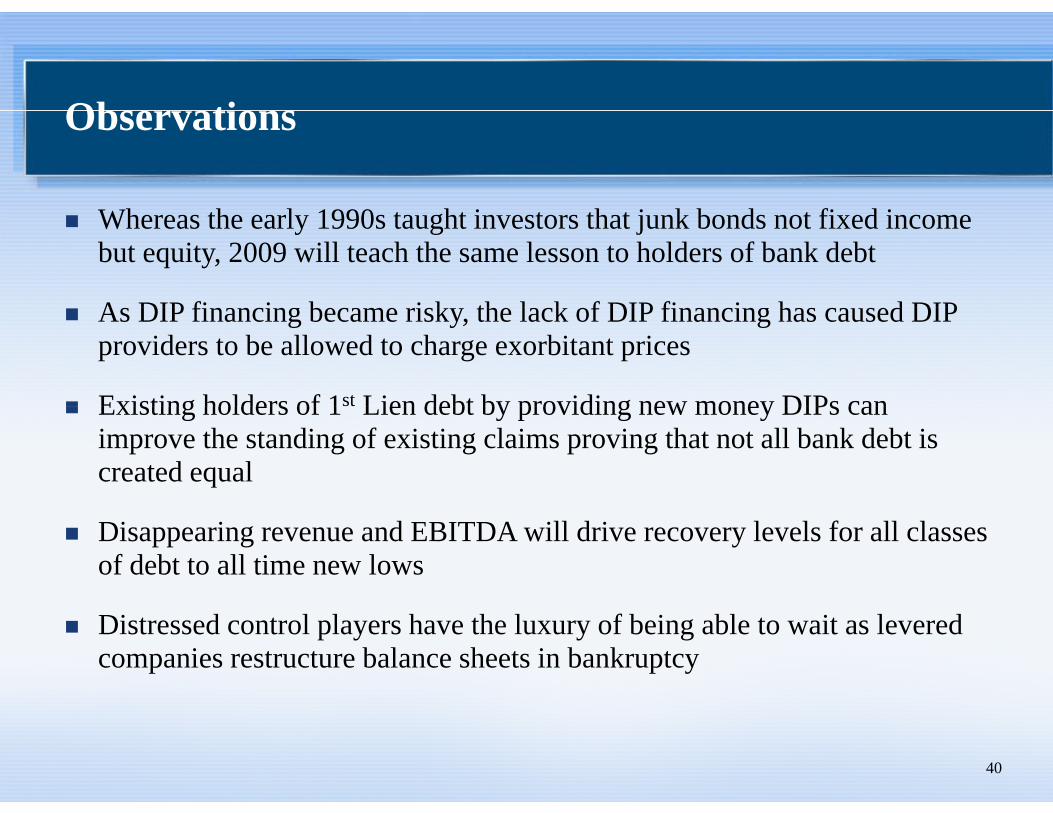
Ob tiObservations
Wh h l 1990 h i h j k b d fi d iWhereas the early 1990s taught investors that junk bonds not fixed income but equity, 2009 will teach the same lesson to holders of bank debt
A DIP fi i b i k th l k f DIP fi i h d DIPAs DIP financing became risky, the lack of DIP financing has caused DIP providers to be allowed to charge exorbitant prices
Existing holders of 1st Lien debt by providing new money DIPs canExisting holders of 1 Lien debt by providing new money DIPs can improve the standing of existing claims proving that not all bank debt is created equal
Disappearing revenue and EBITDA will drive recovery levels for all classes of debt to all time new lows
Distressed control players have the luxury of being able to wait as levered companies restructure balance sheets in bankruptcy
40

P ibl O t /C l iPossible Outcomes/Conclusions
C B k D b P i i M M k SCurrent Bank Debt Pricing May Make Sense
Recovery levels for Junk and Loans will be shocking
The Cost to Companies of Leverage could be permanently more expensive
DIP Lending will attract capital (Buyout dollars from PE)g p ( y )
Restructuring time frames will be lengthened
b l h ld i f i hAbsolute Managers should continue to outperform in the space
41

Di t d I tiDistressed Investing
Q & AQ & A
42

E l t N tExplanatory Notes
Thi i d i ff f i i i d i iThis presentation does not constitute an offer of any securities or investment advisory services.Any such offer may be made only by means of a definitive private offering memorandum whichwill contain a description of material terms and risks.
This presentation which has been furnished on a confidential basis is exclusively for the use ofThis presentation, which has been furnished on a confidential basis, is exclusively for the use ofthe person to whom it has been delivered by MatlinPatterson Capital Management, L.P., and it isnot to be reproduced or redistributed to any other person.
All information contained herein concerning the Fund is subject to revision and completion ForAll information contained herein concerning the Fund is subject to revision and completion. Forall of the foregoing reasons as well as other factors, past performance data contained hereincannot be construed as a prediction or indication of future results.
43

Now this is not the end It is not even theNow this is not the end. It is not even the beginning of the end. But it is, perhaps, the end of the beginning.
Wi Ch hill~Winston Churchill
44


