Distortions to Agricultural Incentives in Japan, Korea and
39
Distortions to Agricultural Incentives in Japan, Korea and Taiwan Masayoshi Honma and Yujiro Hayami University of Tokyo [email protected] Foundation for Advanced Studies on International Development [email protected] Agricultural Distortions Research Project Working Paper xx, October 2006 This is a product of a research project on Distortions to Agricultural Incentives, under the leadership of Kym Anderson of the World Bank’s Development Research Group. The authors are grateful for helpful comments from workshop participants and for funding from World Bank Trust Funds provided by the governments of Ireland, Japan, the Netherlands (BNPP) and the United Kingdom (DfID). This Working Paper series is designed to promptly disseminate the findings of work in progress for comment before they are finalized. The views expressed are the authors’ alone and not necessarily those of the World Bank and its Executive Directors, nor the countries they represent, nor of the institutions providing funds for this research project.
Transcript of Distortions to Agricultural Incentives in Japan, Korea and
Distortions to Agricultural Incentives
in Japan, Korea and Taiwan
Masayoshi Honma and Yujiro Hayami
University of Tokyo
Foundation for Advanced Studies on International Development [email protected]
Agricultural Distortions Research Project Working Paper xx, October 2006 This is a product of a research project on Distortions to Agricultural Incentives, under the leadership of Kym Anderson of the World Bank’s Development Research Group. The authors are grateful for helpful comments from workshop participants and for funding from World Bank Trust Funds provided by the governments of Ireland, Japan, the Netherlands (BNPP) and the United Kingdom (DfID). This Working Paper series is designed to promptly disseminate the findings of work in progress for comment before they are finalized. The views expressed are the authors’ alone and not necessarily those of the World Bank and its Executive Directors, nor the countries they represent, nor of the institutions providing funds for this research project.
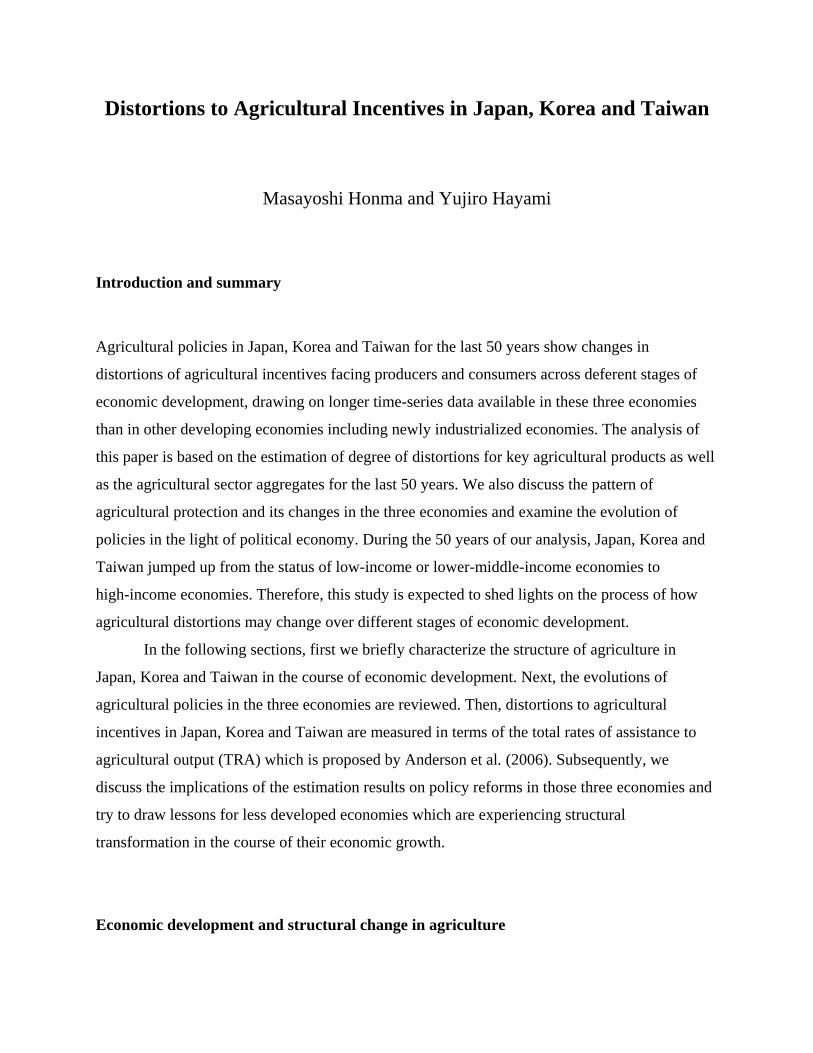
Distortions to Agricultural Incentives in Japan, Korea and Taiwan
Masayoshi Honma and Yujiro Hayami
Introduction and summary
Agricultural policies in Japan, Korea and Taiwan for the last 50 years show changes in
distortions of agricultural incentives facing producers and consumers across deferent stages of
economic development, drawing on longer time-series data available in these three economies
than in other developing economies including newly industrialized economies. The analysis of
this paper is based on the estimation of degree of distortions for key agricultural products as well
as the agricultural sector aggregates for the last 50 years. We also discuss the pattern of
agricultural protection and its changes in the three economies and examine the evolution of
policies in the light of political economy. During the 50 years of our analysis, Japan, Korea and
Taiwan jumped up from the status of low-income or lower-middle-income economies to
high-income economies. Therefore, this study is expected to shed lights on the process of how
agricultural distortions may change over different stages of economic development.
In the following sections, first we briefly characterize the structure of agriculture in
Japan, Korea and Taiwan in the course of economic development. Next, the evolutions of
agricultural policies in the three economies are reviewed. Then, distortions to agricultural
incentives in Japan, Korea and Taiwan are measured in terms of the total rates of assistance to
agricultural output (TRA) which is proposed by Anderson et al. (2006). Subsequently, we
discuss the implications of the estimation results on policy reforms in those three economies and
try to draw lessons for less developed economies which are experiencing structural
transformation in the course of their economic growth.
Economic development and structural change in agriculture
2
Economic growth and structural transformation
Agricultural policies, particularly distortion policies, are increasingly related with the process of
economic development. As Schultz (1978) identified the two agricultural problems, i.e., “the
food problem” and “the farm problem”, as underlying the policies to exploit or tax agriculture
commonly adopted in low-income countries in contrast to the policies to protect or subsidize
agriculture in high-income countries. His hypothesis has been established as a paradigm among
agricultural economists as it found supports from several empirical studies (Anderson and
Hayami 1986; Hayami 1988; Krueger, Schiff and Valdes 1991). Thus, it is important to see how
distortions in agricultural incentives changed in the three economies under investigation over the
different stages of economic development. More recently, Hayami and Godo (2004) added “the
disparity problem” as a problem specific to middle-income economies.
Table 1 shows some indicators of economic development. The first three rows indicate
real GDP per capita in 2000 constant prices at purchasing power parity (PPP) in Japan, Korea
and Taiwan, which are taken from Heston, Summers and Aten (2006). In 1955, Japan’s GDP per
capita was more than $3,000 whereas Korea and Taiwan’s was less than $1,500. Japan spurted
the economic growth thereafter, reaching $4,500 in 1960 and $5,000 in 1961. Korea and Taiwan
stayed at a low level of per capita GDP around $1,500 in 1960. Korea and Taiwan had to wait
until the late 1970s or the early 1980s to reach their per capita GDP at a level of $5,000.1 Japan
reached already a level beyond $10,000 in per capita GDP by 1970 but it was the late 1980s or
the early 1990s when Korea and Taiwan reached the level of $10,000.2
Based on the above observations, it is convenient to classify the development of the three
economies under investigation into 4 stages by the level of per capita real GDP as follows:
• Low-income stage ($1,500 or less): Before 1950 for Japan and before 1960 for Korea and
Taiwan.
• Lower middle-income stage ($1,500-$5,000): 1950-60 for Japan and 1960-80 for Korea
and Taiwan.
1 Precisely, it was 1983 and 1978, respectively, when Korea and Taiwan exceeded $5,000 in their per capita GDP. 2 Precisely, it was 1991 and 1988, respectively, when Korea and Taiwan exceeded $10,000 in their per capita GDP.
3
• Upper middle-income stage ($5,000-$10,000): 1960-70 for Japan and 1980-90 for Korea
and Taiwan.
• High-income stage ($10,000 or more): After 1970 for Japan and after 1990 for Korea and
Taiwan.
The criteria of classification are not universal but are convenient for the comparison of the
economic development in these three economies.3
Changes in other indicators in Table 1 are closely related with changes in per capita real
GDP over the four stages. The GDP share of agriculture in 1955, the middle-income stage, in
Japan was 17 percent, which was much smaller than those of Korea and Taiwan in the
low-income stage at 47 percent and 29 percent, respectively. It was 1970 and 1980 when Taiwan
and Korea decreased their shares to 15 percent and 16 percent, respectively, which were similar
to that of Japan at the lower middle-income stage. When Japan entered the high-income stage in
1970, the GDP share declined to 4 percent, which was about the same as that of Taiwan entering
the high-income stage in 1990. Korea was a decade behind Taiwan in the decline of agricultural
GDP share.
Similar correspondences are observed for the share of agriculture in labor force
(economically active population). Agricultural labor share was 15-30 percent in the upper
middle-income stage as in Japan for 1960-70 and in Korea and Taiwan for 1980-90 whereas it
declined to less than 10 percent in the high-income stage. The structural transformation in terms
of the labor force share progressed at slower rates than in terms of the GDP share so that the
share in labor force is much larger than that in GDP for each economy even in 2004. Overall, in
the structural adjustment in shifting labor from agriculture to other sectors, Japan has been about
a decade ahead of Taiwan, and Taiwan has been about a decade ahead of Korea.
Roughly speaking, in economic growth and structural transformation Japan has gone
ahead of Taiwan in about two decades and ahead of Korea in about two decades and a half,
though the gaps have narrowed over time.
Changes in the structures of agriculture
3 In terms of real GDP per capita in 2000 constant prices, for example, China exceeded $1,500 in 1990 and $5,000 in 2004 whereas Thailand passed $1,500 level in 1968 and $5,000 level in 1991. For high-income stage, the UK and France exceeded $10,000 in 1960 and 1964, respectively, whereas the US had already more than $10,000 in 1950.
4
Among the three economies Japan produced 8.8 trillion yen of agricultural products valued at
farm-gate sales and value added of 5.3 trillion yen in 2004. There are 2.6 million workers
engaged mainly in agricultural activities from 2.9 million farm households as of 2004.
Agriculture’s weight in total economy, however, is declining. The share is 1.1 percent in GDP
and 4.1 percent in labor force (Table 1). It should be noted that the number of workers engaged
mainly in agriculture is less than that of farm households. This means that some farm households
have no worker engaged mainly in agriculture. Japan’s Agricultural Census defines a farm
household as one that operates on 10 ares (0.1 hectare) or more of farmland, or annual sales of
agricultural products of 150,000 yen (US$1,250 for the exchange rate of 120 yen/$) or more.
Thus, very small units of farm operation in which no full-time worker engages in farm
production are classified in the category of farm households. Indeed, full-time farm households
in which no family member engaged in non-agricultural employment accounted for only 15
percent of total farm households in 2004.
On the other hand, non-commercial farm households, which operate less than 30 acres of
farmland or annual sales of less than 500,000 yen, account for 26 percent of total farm
households. Moreover, Type II part-time farm households whose income from non-agricultural
sources exceeds agricultural income accounted for a half of total farm households. (Type I
part-time farm households are farm households whose income from farming exceeds income
from non-agricultural sources.)
Agricultural workers in Japan declined from 14 million in 1955 to 2.6 million in 2004 but
the number of farm households declined only from 6.0 million in 1955 to 2.9 million in 2004 as
seen in Table 2. The slow decreases in the number of farm households, together with decreases
in agricultural land, resulted in a very small increase in agricultural land per farm from 1.01
hectare in 1955 to 1.61 hectares in 2004. Average size of agricultural land per farm in Japan is so
small, only one 125th of the United States and one 20th to 45th of European countries. This has
the decisive implication on the comparative advantage of Japanese agriculture, particularly of
land intensive sectors.
In Japan farm households maintained 7.4 percent of total population in 2004, which is
larger than in Korea, which had 1.24 million farm households with 3.4 million people accounting
for 7.1 percent of total Korean population in the same year. In contrast, Taiwan had 0.72 million
5
farm households holding 3.2 million people, which accounted for 14.3 percent of total population
in 2004. In 1955, the population in 6 million farm households accounted for 41 percent of total
population in Japan, whereas 2.2 million farm households held 62 percent of total population in
Korea and 0.73 million farm households held 51 percent of total population in Taiwan,
respectively. The number of farm household in Taiwan has been relatively stable.
It is noted that the share of agricultural population (population in farm households) in
Korea had declined at faster rates than in Japan and Taiwan resulting from faster decreases in
both the number of farm households and the number of persons per household in the former than
the latter. Such contrasts may be explained by the difference in job opportunity in rural areas.
There are a wide range of non-farm job opportunities available in rural areas in Japan and
Taiwan but non-farm job opportunities are limited in rural Korea. Indeed the share of agricultural
income in total income of farm households on the average declined to 17 percent in 1980 in
Japan and 20 percent in 1990 in Taiwan, whereas in Korea it was still about 40 percent in 2004.
Japan lost arable land area by 23 percent for the last 50 years whereas changes in arable
land in Korea and Taiwan were small. Arable land in Japan was 6.1 million hectares in 1955 but
decreased to 4.7 million hectares in 2004. Korea had about 2 million hectares in 1955 and
increased to 2.3 million hectares by 1970 but declined to 1.8 million hectares in 2004. Arable
land in Taiwan also increased from 0.87 million hectares in 1955 to 0.97 million hectares in 1980
but declined to 0.84 million hectares in 2004. Thus the changes in farm size in terms of arable
land per farm household resulted from the declines both in arable land area and in the number of
farm household in Japan, but the farm-size changes in Korea and Taiwan were mostly resulted
from changes in the number of farm households. In Japan and Korea, average farm size
increased from 1.0 and 0.9 hectares in 1955 to 1.6 and 1.5 hectares in 2004, respectively,
whereas the farm size in Taiwan has remained almost constant during this period.
An important difference is the changes in the commodity mix in farm production. Rice
was traditionally the most important crop in these three economies, but the changes in its relative
importance were different. In Japan rice has been losing the share in the value of total
agricultural production from 47 percent in 1960 to 23 percent in 2004. Korea maintained the
weight of rice in the total value of agricultural production as large as 28 percent in 2004, though
it declined from 34 percent in 1980. In contrast, Taiwan declined the share of rice in total
production from 20 percent in 1980 to only 7 percent in 2004. This contrast suggests the fact that
6
Taiwan was able to shift agricultural production resources more efficiently than Japan and Korea
in response to the shift in demand for more income-elastic commodities.
In the last rows in Table 1 the ratios of agricultural GDP per worker to the total GDP per
worker are shown. This is the relative labor productivity of agriculture to total labor productivity
of whole economy in nominal value. It may also indicate the changes in income gapes between
agricultural sector and the whole economy. This relative labor productivity of agriculture in
nominal term was interestingly not much different among the three economies in 1955. But, this
ratio in Japan declined sharply from 52 percent in 1955 to 26 percent in 1970, and has remained
at about the same level since then. It was after 1960 when Korea and Taiwan started to decline
the ratio. In Korea it reached 44 percent in 1980 from 65 percent in 1960 but stayed nearly
constant thereafter. Taiwan, however, continued to decline the ratio until recently and reached at
23 percent in 2000 that is lower than that of Japan. The differences in this ratio may reflect the
differences in the efficiency in structural adjustment of agriculture among the three economies.
Evolution of agricultural policy
Japan’s agricultural policy4
Before the mid 1950s Japan tried hard to recover from the devastation of the Second World War,
the primary emphasis of agricultural policy was directed toward increasing domestic food
production and delivering them equitably at low costs to consumers. For this end, the
government invested heavily in agricultural research, extension and land infrastructure and, at
the same time, placed rigid controls on rice procurement from farmers and delivery to consumers
under the Food Control Laws enacted during the War.
Right after the Second World War, the land reform was carried out in accordance with
the strong recommendations of the occupation authorities. The urgent need to increase
agricultural production by increasing production incentives to the cultivators was sufficiently
strong to overcome the opposition of the landlords against strengthening of the rights of tenants
7
by controlling rents and controlling land prices. For the four years from 1947 to 1950 the
government purchased 1.7 million hectares of farmland from landlords and transferred 1.9
million hectares, including state-owned land to tenant farmers, which amounted to about 80
percent of the land under tenancy before the land reform.
Although the land reform resulted in a considerable change in the distribution of
landownership, the size distribution of operational holdings experienced no basic changes. As the
result, the traditional agrarian structure of Japan characterized by small-scale family farms with
the average size of about l hectare remained essentially unchanged, despite the rise and the fall of
landlordism (see Table 2).
There is no doubt that the land reform promoted more equal assets and income
distributions among farmers, and hence contributed to the social stability of the rural sector.
However, the reform did not induce changes in the basic direction of technological developments
because the small-scale family farms continued to be the basic unit of agricultural production.
Although land reform contributed to an increase in the level of living and consumption, its
contributions to capital formation and productivity growth in agriculture are not significant in
terms of quantitative analysis (Kawano 1969).
As Japan set off on its ‘miraculous’ economic growth in the mid 1950s, agriculture began
to face serious adjustment problems. The rate of growth in agricultural productivity, which was
rapid by international standards, was not rapid enough to keep up with the growth in the
industrial sector. Inter-sectoral terms of trade did not improve for agriculture during the 1950s
since the end of the Korean War, partly because of the pressure of surplus agricultural
commodities in the United States and other exporting countries, and partly because the domestic
demand for major staple cereals (especially rice) approached saturation after the bumper crop of
1955. In consequence, the levels of income and living standards of farm households lagged
behind those of urban households during the 1950s.
In 1961 real GDP per capita in Japan exceeded $5,000, which means Japan entered the
upper middle-income stage of economic development according to our stage classification.
Correspondingly, the major goal of agricultural policy shifted from the increase in the production
of food staples to the reduction in the rural-urban income gap. The need for assisting agricultural
4 This section draws heavily on Hayami (1988).
8
adjustments increased in the 1960s, as the rural-urban income gap progressively widened and the
out-migration of agricultural labor accelerated. The difficulty of adjusting agriculture to the
rapidly growing economy led to the enactment of the Agricultural Basic Law, a national charter
for agriculture, in 1961. This Law declared that it was the government’s responsibility to raise
agricultural productivity and thereby close the gap in income and welfare between farm and
non-farm people.
In order to raise agricultural productivity and to improve farming efficiency, it was
considered essential to increase the scale of the farm operation by reducing inefficient farm units
and by promoting cooperative operations among remaining farms. Despite such efforts for
structural adjustment, the rate of agricultural productivity growth was not raised sufficiently to
prevent the rural-urban income gap from widening further. In such a situation the Food Control
System, which was originally designed to provide food security to consumers turned to become
the major instrument to protect farms. Under the Food Control System based on the Food
Control Law of 1942 most food items had been placed under the direct government control.
However, as Japanese economy had recovered from the war damage, the control had been
reduced so that rice alone remained under the direct control after 1952. Rice was directly
controlled in its distribution. Initially, the whole marketing process of rice from producers to
consumers was under direct control of the Food Agency and prices were regulated from the
farm-gate to the retail level, although the regulations were relaxed gradually.
The Food Control System became a powerful instrument for rice farmers and they
organized political lobbying for raising rice prices for government purchases. Their pressure
resulted in 1960 in a rice price determination formula called the ‘Production Cost and Income
Compensation Formula’ under the Food Control System.
This formula was designed to reduce the gap between farm and non-farm income and
wages by raising rice prices. This target appears to have been achieved. Income per agricultural
worker compared to income per worker in manufacturing improved after 1960 with the rapid rise
in agricultural relative to manufacturing prices. The increase in the price of rice, which
constituted about 40 percent of the total value of agricultural output before 1970, was a major
factor in improving the domestic terms of trade for agriculture. The rise in agricultural prices,
together with increase in off-farm income, resulted in a marked reduction in the gap in income
per capita between agricultural and non-agricultural households.

9
Protecting rice farmers through the price policy was possible because rice trade was
completely controlled by the state-trading system. During the 1960s the price of rice was raised
not only far above the world price but also above the market equilibrium price under autarky. In
the early 1960s, Japan entered the upper middle-income stage. At that stage, Japan became able
to let consumers and tax payers shoulder the costs of agricultural protection.
However, there was a limit on increasing agricultural protection by the price policy. The
high prices of rice with protection resulted in expansion of rice production in the excess of
consumption and in the accumulated surplus rice in government storage, which obliged the
government to introduce the control on rice acreage in 1969, which has been continuing until
today.
With the dramatic increase in income and wages of industrial workers after 1960, their
diet rapidly changed. Indeed average compensation per industrial employee deflated by the
consumer price index doubled in the 1955-70 period (and it doubled in the following decade and
half again). Rice was no longer a major wage good for industrial development. Correspondingly,
the Food Control System was also eroded. The direct control on rice distribution was relaxed by
introducing non-government distribution channels. In 1995 finally the Food Control Law was
replaced by the Staple Food Law, by which the role of the government is limited to stock holding
operations of rice for food security, though the state-trading of rice is maintained for
international trade.
Real GDP per capita in Japan exceeded $10,000 after 1969. As the economy advanced to
the high-income stage, the demand for protection from the farm bloc increased. Japan’s
comparative advantage continued to shift away from agriculture to industry, while internal
resistance to protectionism declined because the non-farm population became affluent and less
resistant to shouldering the cost of agricultural protection in the form of high food prices or
subsidies to farm producers. However, external pressures on Japan for liberalization in
agricultural imports were increasing.
It was the Uruguay Round Agreement on Agriculture, by which Japan had to adjust
agricultural policies to be more consistent with globalization of the economy. Following the
agreement, in 1995 Japan converted the non-tariff border measures to tariffs for 28 commodities.
At the beginning of implementation rice was exempted from tariffication in compensation of
larger minimum access imports of rice, namely 4 percent of domestic consumption in 1995,
10
rising to 8 percent in the final year of the implementation period. Later Japan accepted
tarriffication for rice in 1999 and the minimum access imports remained at 7.2 percent of
domestic consumption.
The new agricultural trade regime under the World Trade Organization (WTO)
established in 1995 forced the government to reform domestic agricultural policy. In 1999 the
Basic Law on Food, Agriculture and Rural Areas was enacted as a replacement for the 1961
Agricultural Basic Law. Four years earlier the Food Control Law was abolished in 1995 to
liberalize the domestic rice market as mentioned previously.
The 1999 Basic Law obliged the government to draft a Basic Plan for Food, Agriculture
and Rural Areas for the promotion of the comprehensive and systematic implementation of
policies on food, agriculture and rural areas, which is supposed to be redrafted every five years.
Under the current Basic Plan made in 2005 a key point of the new agricultural policy is to target
government assistance to farmers who satisfy certain conditions, especially on the minimum
farm size. It compels farmers who want to continue farming under the government assistance to
expand the size of farm operation.
Korea’s agricultural policy5
Before 1960 in Korea the real GDP per capita was less than $1,500 and it is classified in the
low-income stage of economic development. Agricultural policy adopted in this stage in Korea
was to maintain low domestic prices for staple foods, notably rice and barley, and fertilizer. The
Grain Management Law, enacted in 1950, gave the government the authority to regulate the
prices of staple foods. The market share of government-controlled rice was less than 10 percent
during the 1950s.
The government was supposed to purchase grain directly from farmers but the
government faced difficulty to make direct purchases due to budgetary constraints and spiraling
grain prices under inflation in the mid 1950s. Then the schemes to collect land tax in kind and to
barter fertilizer for rice were initiated. The former was successful but the latter was not because
the implicit price of rice in the barter was lower than the market price.
5 This section draws heavily on Moon and Kang (1989).
11
Gain imports from the United States under Public Law 480 enabled the Korean
government to keep grain prices low. Grain imports under this program amounted to 8 to 12
percent of total domestic grain production during 1956-65.
In the 1960s Korea shifted its economic policy more toward promoting industrialization,
which required maintaining the prices of staple food crops low so as to keep the costs of living
and wage rates low for industrial workers, rather than maintaining adequate farm income. The
government purchase prices were kept below the market prices, which were considered
necessary for the purpose of increasing industrial profits and capital formation. These were
typical of agriculture-taxing policies commonly observed at the low-income stage of
development.
The real GDP per capita in Korea exceeded $1,500 in 1961 and Korean economy entered
the lower middle-income stage, which lasted till the early 1980s when Korean per capita real
GDP became more than $5,000. In this stage Korean government price intervention became
more intense. The market share of government-controlled rice was expanded to 20-25 percent
during the 1960s. In the early 1970s, the buffer-stock operation for non-cereal products was set
in motion, and pesticides and farm machinery were added to the list of subsidized inputs. The
government’s purchase prices for rice and barley had been steadily raised with the aim of
increasing food production as well as reducing the urban-rural income gap. Although the
government raised the producer prices for staple food grains, it did so without a comparable rise
in the market prices of rice and barley in order to prevent the cost of living and the wage rate of
industrial workers from rising.
The implementation of the two-price system, however, conflicted with financial and
monetary stability. As the difference between the purchase and selling prices of rice and barley
widened, the financial losses of the grain management fund increased. Since a large portion of
this deficit was financed by long-term overdrafts from the Bank of Korea, this policy became a
major factor to increase money supply and cause inflation. Expansion of the government deficit
due to the two-price policy became a serious constraint to the policy.
Entering the upper middle-income stage in the 1980s with more than $5,000 of the real
GDP per capita, the Korean government took a step toward reducing both tariff and non-tariff
protection for manufacturing industries. In contrast, the agricultural policies were strengthened
toward protecting agriculture sector. The producer prices of farm products were increased to the
12
levels that were far above border prices and for the most agricultural commodities the
quantitative import restrictions were maintained.
Korea entered the high-income stage in the early 1990s. Thereafter, significant policy
changes on Korean agriculture were mostly related to WTO Agreement on Agriculture (AoA)
stipulated in 1995. According to the provisions of the AoA, all measures of quantitative
restrictions were converted into tariffs for all agricultural products except for rice in Korea. In
the Uruguay Round negotiations, Korea obtained the status of developing country for which
special treatments were given in implementing the commitment to reduce border protection. The
agricultural products under the tariffication were subject to protection reduction commitment by
24 percent on average within ten years with the minimum cut of 10 percent. Tariff rates of
Korean agricultural products were as high as over 60 percent on average. Tariffs for the products
which were considered particularly important in Korea were cut by the minimum rate of 10
percent.
In addition, imports of many agricultural products began under the minimum market
access (MA) commitment. This requires that of all agricultural products at least 3 percent of
consumption must be purchased from overseas in the first year and the import share must
increase annually up to 5 percent of consumption in 10 years. Low tariff rates are applied to the
in-quota volume so as to guarantee easy market access from exporting countries. Many key
agricultural products such as rice, barley, orange, red pepper, garlic, onion newly began to be
imported under this MA commitment.
Rice is an important item for Korean agriculture and was temporarily exempted from the
tariffication as provided in Annex 5.B of the AoA. As an exception, rice was subject to import
quota, beginning with 1 percent of total consumption and gradually increasing up to 4 percent in
the final implementation year. If Korean rice had not been exempted from tariffication, it should
have complied with the MA commitment from 3 percent to 5 percent. The temporary exemption
from tariffication expired in 2004. But Korea decided to continue for rice exemption from
triffication for another 10 years until 2014.
Taiwan’s agricultural policy6
6 This section draws heavily on Mao and Schive (1995).
13
After World War II Taiwan suffered from high inflation rates, serious shortages of food and
other necessities, and a heavy defense burden. The government gave the highest priority to
economic stabilization, food production increases, and the repair of war damages. To alleviate
the intense population pressure on limited land, it decided to grant incentives to farmers.
Together with the land reform program implemented between 1949 and 1953, war-damaged
irrigation and drainage facilities were repaired, fertilizers and other farm inputs were made
available, and farmers’ organizations were strengthened.
In the stage of recovery of Taiwan economy and agriculture, the Sino-American Joint
Commission on Rural Reconstruction (JCRR), established in Nanking in 1948, played an
important role. JCRR served as a nonpermanent agency for the postwar rural reconstruction of
China. From 1951 to 1965 the United States provided a total of $1.465 billion in aid.
Approximately one-third went to agriculture, which was used to build infrastructure and foster
human resources for agriculture. Also, substantial imports of U.S. aid-financed commodities and
increases in domestic production, especially of food, helped relieve the pressure on demand.
In the low-income stage of development before 1960, agricultural policy in Taiwan
aimed mainly to supply rice at low stable prices to non-farm population. In those days two
important taxes were imposed on Taiwan’s farmers; the farm land tax and the hidden rice tax by
means of compulsory purchases and the rice-fertilizer barter system. The compulsory purchase
of paddy from landowners at official prices was another source of government-controlled rice.
All the paddy lands were subject to the paddy land tax plus the compulsory procurement of rice.
The compulsory procurement was assessed on the basis of tax units determined with land
productivity. The difference between the government procurement prices and farmers’ market
prices constituted a hidden tax on the paddy landowners who are mostly farm operators after the
implementation of land reform program. The difference, however, was abolished in 1973 in
order to increase farm incomes.
The government’s rice collection by all of these methods averaged 50 percent to 60
percent of the total amount of rice produced minus farmers’ home consumption during 1950-70.
By 1973, however, this share had declined to 20 percent. In subsequent years it increased again
because of the guaranteed rice price policy. The total of this hidden rice tax was larger than
14
Taiwan’s total income tax before1963 and was more than twice the farm land tax before 1961,
except in 1954.
After 1969 when Taiwan moved to the lower middle-income stage, the hidden rice tax
decreased rapidly. The ratio of the hidden rice tax to the total income tax dropped to only 8.5
percent in 1971 (Kuo 1975). Thus, the agricultural policy geared to exploit agriculture for the
sake of supporting industrial development (and military development) largely ended during the
1970s.
In the 1970s, the shift from taxing to subsidizing agriculture began. However, at the same
time Taiwan rapidly expanded production on light industrial commodities in response to
increases in export demand. Because many light industries such as garments and foot-wears were
located in rural areas, nonagricultural income became increasingly more important to farmers.
Taiwan farmers were able to take advantage of employment in manufacturing without leaving
home and many of them engaged in non-farm activities in off-farm seasons. Therefore, the need
for them to rely on agricultural protection policies was relatively small.
It was 1978 when Taiwan entered the upper middle-income stage with its real GDP per
capita exceeding $5,000. Still, to help equalize farm income with that of the rapidly expanding
industrial sector, the government offered loans and subsidies for promoting farm mechanization,
which was hoped to raise farmers’ labor productivity.
At this time the growth of rice production began to slow down in response to an increased
emphasis on livestock and fishery products and high-value export crops. Increases in industrial
employment also were pushing up the costs of farm labor. Labor productivity in agriculture
continued to lag behind that in the industrial sector, and the gap between farm and non-farm per
capita incomes was increasing, especially for farmers relied on rice production. These problems
faced by Taiwan agriculture were similar to those that many other industrial countries
experienced at a comparable development stage in the past, especially Japan in the early 1960
and Korea in the late 1970s .
Per capita consumption of rice fell from 140 kilograms per year in 1968 to 74 kilograms
in1988. Correspondingly, the accumulation of rice stock became a serious problem. In order to
reduce production, farm extension workers encouraged farmers to plant other crops in rice fields,
but their efforts were not successful because no economic incentive was provided. A six-year
rice-crop substitution plan inaugurated in 1984 gave direct subsidies of 1 metric ton of paddy
15
rice per hectare to farmers who shifted their rice fields to corn or sorghum, or 1.5 metric tons of
paddy rice per hectare to farmers who shifted to crops other than corn and sorghum. In addition,
corn and sorghum were to be purchased by the government at guaranteed prices. Under the
program, rice production declined to 1.84 million metric tons in 1988, which was smaller by 0.9
million metric ton than the peak of 1976. The paid-in-kind subsidy was changed to a cash
payment in 1988 to improve efficiency in the management of the program.
Taiwan entered in the high-income stage in the late 1980s with its real GDP per capita
exceeding $10,000 since 1988. The most important changes in recent agricultural policy in
Taiwan were related with the accession to the WTO that became effective on January 1, 2002. In
line with the level of economic development, Taiwan agreed to bring its tariff rates to a level
between those of Japan and Korea. Taiwan agreed to reduce its tariffs from the average nominal
tariff rate of 20.01 percent (the average rates in 2001) to 14.01 percent in the first year of its
accession and gradually reduce it to 12.86 percent by 2004. The target date for tariff reductions
was 2002, except those 137 items that are under tariff-rate quota (TRQ).
Of the 41 products that were under import quota restrictions before accession, 18 were
moved to tariffication after the WTO accession. Rice received a special treatment and the
remaining 22 items to be governed by the tariff-rate quota regimes.
The special treatment on rice is based on the rules of Annex V of the WTO Agreement on
Agriculture by which the quota of rice imports was set to be 8 percent in 2002 of the average
domestic consumption between 1990 and 1992, i.e. 144,720 tons of brown rice. By negotiation,
this amount was divided into governmental and private import quotas. The government quota
rice (65 percent of the rice import) must be subject to the same treatment as with the rice
purchased from the local growers. The imported rice cannot be exported for food aid nor can be
used for animal feed.
The remaining (35 percent) shall be imported by private firms and will be allocated on
first-come-first-serve basis. For both private and government quotas, there is a ceiling of price
mark-up of NT$23.26 per kilogram for rice and NT$25.59 for rice products when they are sold
on the domestic market. If the sale of quota rice is slow, the price mark-up can be cut by NT$3
for every two weeks. The mark-up reduction can be continued until all of the quantities are sold
out.
16
Measurement of distortions to agricultural incentives
Measures of distortions
Distortions are defined as the effects of governments’ interventions into the market to create gaps
between marginal social returns to sellers and marginal social costs to buyers in market
transactions. To measure such distortions, there are several approaches. We use the most
common measure that is ad valorem tax on competing imports. If the tariff on the imported
primary agricultural product is the only distortion policy, its effect on producer incentives can be
measured as the nominal rate of assistance (NRA) to farm output, which is the unit value of
production at the distorted price minus its value at the undistorted free market price expressed as
a fraction of the undistorted price.
However, it is not only the tariff that distorts agricultural incentives but also there are
many other distortion policies including non-tariff barriers. It is conventional to measure the
direct trade or price policy-induced distortions to incentives with domestic-to-border price
comparisons for traded goods. In practice, there are also divergences across farmer, processor,
consumer and border prices for reasons other than subsidies or taxes on production,
consumption, trade or foreign currency. These shall be recognized when using comparisons of
domestic and border prices to derive estimates of distortions. Therefore, NRA is measured as the
difference between the domestic wholesale price of a domestic product and the import c.i.f. or
export f.o.b. price of the same kind.
Commodities covered in the calculation for NRA include rice, wheat, barley, beef, pork,
chicken, eggs, and milk for Japan and Korea. Covered for Taiwan are rice, wheat, beef, pork,
chicken, and eggs. NRA is calculated for each commodity as a ratio of difference of domestic
wholesale price from border price (c.i.f. unit value) divided by border price. The domestic prices
are converted to US dollars using market rates of foreign exchange rates. Then the average rate
of NRA over the commodities for county is calculated using the weights of domestic production
of commodities valued at border prices.

17
The coverage of the commodities in this study is about 60 percent in the value of
production in each economy. It is difficult to judge the levels of NRA for other commodities not
covered in this study. As an easy treatment, it is assumed that the other commodities are not
directly distorted by the government. In this treatment, the direct rate of assistance to the whole
agricultural sector (DRA) is estimated in multiplying the weighted average NRA by the share of
the products under the calculation in the total value of agricultural production. Thus, the
estimated DRA is considered the lower limit of the real DRA.
In addition to direct assistance to farmers, their incentives are also affected if the nominal
direct rate of assistance to non-agricultural production (DRN) in the national economy is
non-zero. The higher is DRN, the more other sectors will have bid up the value of mobile
resources that would otherwise have been employed in agriculture. If the average DRA for
agriculture is below the average for all non-agricultural sectors, DRN, then one would expect
that fewer resources are used in agriculture than those used under free market conditions in this
country and conversely if agriculture’s DRA is above DRN.
To take into account the DRN, trade weighted tariffs of non-primary commodities are
used to estimate the total rate of assistance in the agricultural sector as a whole (TRA). TRA is
DRA minus DRN. The weighted tariffs are available in only selected years for Korea and
Taiwan so that the tariff rates are linearly interpolated for the years between those for which the
data are available. For early years the tariff rates are estimated with the real average tariff rates
obtained with total tariff revenue divided by value of imports, assuming it to move parallel with
the weighted average of tariffs for non-primary commodities.
The weighted average tariff is corrected with the share of tradable goods to obtain DRN.
Actually, the share of non-service sector in the non-agricultural GDP is multiplied by the
weighed tariff, assuming that only service sector is non-tradable. Finally TRA is calculated by
subtracting DRN from DRA.
Estimation results
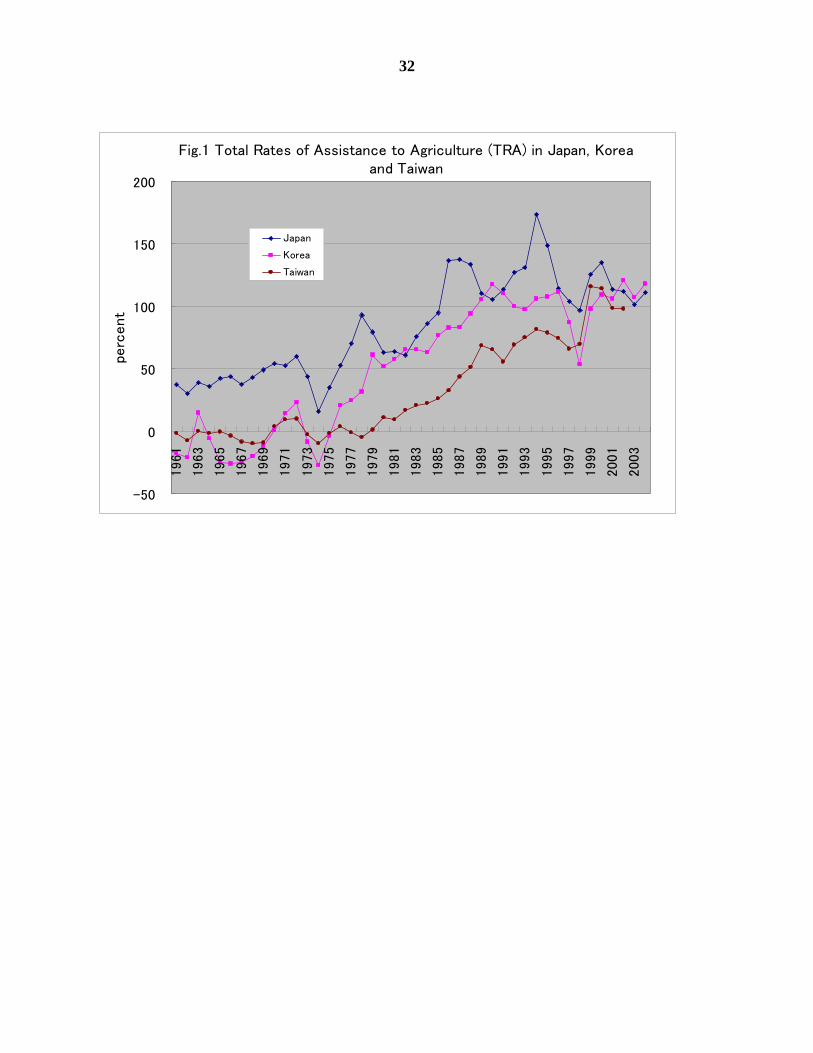
The results of estimated TRA for Japan, Korea and Taiwan since 1961 are shown in
Figure 1, while all the estimates of NRA, DRA, DRN, and TRA are detailed in Appendix Table.
Japan’s TRA was already 30-40 percent in the 1960s when Japan was already in the upper
18
middle-income stage of economic development. However, TRAs for Korea and Taiwan, both in
the lower middle-income stage, were at a very low level, involving negative rates for some years
before the mid 1970s. Japan increased its TRA steadily over time except the period of the
“World Food Crises” in the mid 1970s.
Japan entered the high-income stage in the 1970s and increased its TRA, reaching a peak
in 1994, though it was the year followed by bad rice harvest recording 26 percent less than the
regular season. Japan’s TRA was rather stable in a range of 100-110 percent after the mid 1980s.
Korea began the rapid growth of agricultural assistance in the late 1970s when Korea was
shifting from the lower to the upper middle-income stage. Korea was soon followed by Taiwan
in the growth of TRA. It is interesting to see that Taiwan had been five to eight years behind
Korea in the TRA growth until the late 1990s when Taiwan caught up Korea at a 100-120
percent level in the TRA despite the fact that Taiwan was slightly ahead of Korea in reaching the
upper middle-income stage. When Korea and Taiwan entered the high-income stage in the
1990s, the growth of TRA apparently decelerated in both economies.
Note that wide fluctuations in the late 1990s were caused by the currency crises in Asia
that began in 1997, which resulted in the sharp declines of TRA in Korea in 1997 and 1998. The
sharp increases in Taiwan’s TRA in 1999 and 2000 were caused by the shortages of livestock
products due to the earthquake in September 1999 and reduced production of hogs resulting from
the foot-mouth disease in 1997. Although the past growth paths were different, all the three
economies have reached about the same level of TRA by the beginning of the new millennium.
The calculation of TRA is based on wholesale prices so that it includes the protection for
distribution and handling sectors in the supply chains of agricultural products. It is interesting to
see directly the movement of protection level for farmers at the farm gate level. It is also
interesting to examine the transmissibility and accumulation of assistance in the supply chains by
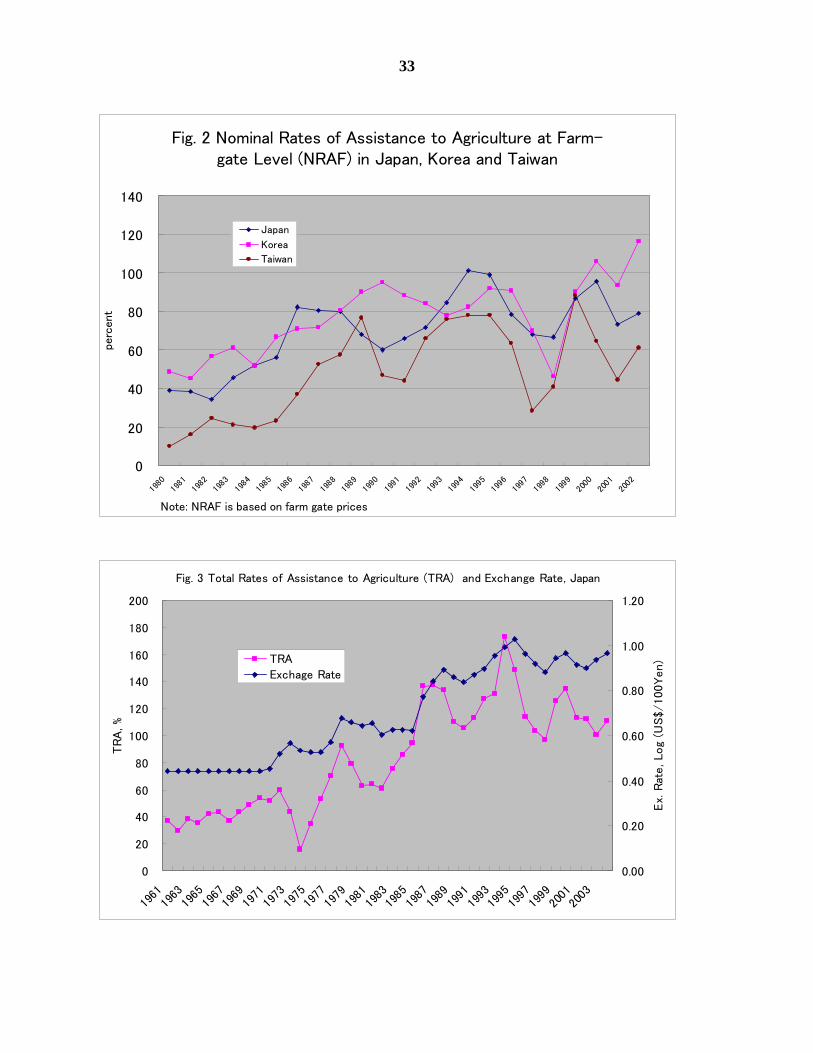
comparing the protection level between the wholesale and the farm-gate levels. For this purpose,
the weighted averages of nominal rates of assistance using farm-gate prices (NRAF) were
calculated for 1980-2002, as shown in Figure 2.
The movements in NRAF at the farm gate were parallel to those in TRA at the wholesale
level in the 1980s though the fluctuations in the former are smaller than that of the latter,
implying that changes in the wholesale price are not perfectly transmitted to the farm gate. In the
1990s when all the three economies entered the high-income economies, however, the
19
differences between the TRA and the NRAF widened particular in Taiwan. This might mean that
distortions are increasing all in the three economies but the share of institutional rent accruing to
the distribution and handling sectors increased particularly in Taiwan. It might also reflect the
fact that value added by marketing and processing activities, whose roles are getting more
important in the high-income stage, increased relative to value added at farms, especially for
livestock products.
The degree of distortions was still in rising trends for Japan, Korea and Taiwan in the
1980s to the early 1990s. But, thereafter, as far as NRAF is concerned, their trends seem to differ
slightly. In Korea assistance to farmers as measured by NRAF has continued rising, whereas it
has slightly decelerated in Japan and Taiwan since the late 1990s. It is also noted that the
outbreak of the foot-mouth disease on hogs in 1997 in Taiwan increased the farm gate price more
than the wholesale price relative to the border price, which may explain the sharper decline in
NRAF than that of TRA.
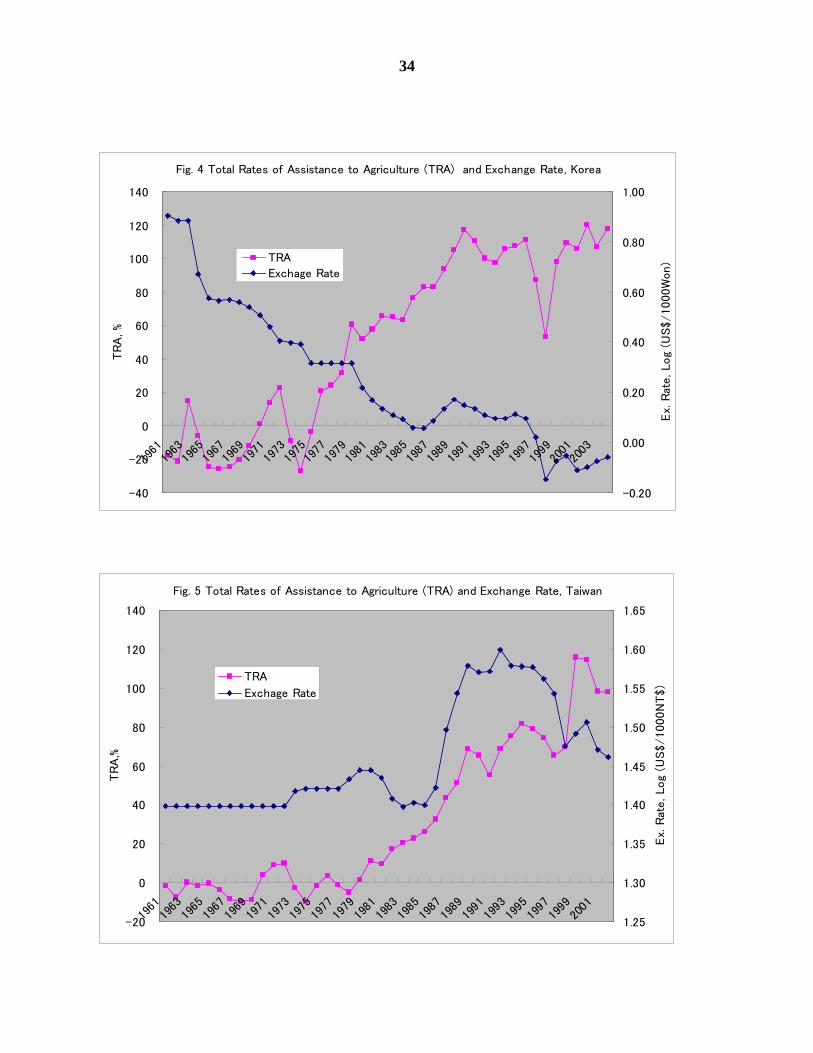
It is particularly important to see the relationship between fluctuations in TRA and
changes in exchange rate because it shows the degree of transmission of world market prices to
the domestic prices. Namely, if the border protection measures are only tariffs, TRA is not
affected by changes in exchange rate because border price changes due to exchange rate changes
are fully transmitted to domestic markets. But, if the protection is based on non-tariff barriers,
such as prohibitively high tariffs and tariff rate quotas, TRA tends to move in the same directions
as the exchange rate change does.
The relationships of TRA and exchange rate changes are shown in 3 for Japan, Figure 4
for Korea and Figure 5 for Taiwan. It is clear that Japan’s TRA are positively correlated with the
exchange rate, reflecting continued heavily dependence on non-tariff barriers. In Korea the
movements of TRA and the exchange rate were negatively correlated until the mid 1980s, which
should have resulted from increases in domestic agricultural prices at faster rates than the rates of
exchange rate depreciations, particularly in the 1980s when Korea was in the upper
middle-income stage, though they became rather parallel in the late 1990s. Movements of TRA
in Taiwan were largely parallel with those of the exchange rate.
These observations imply that tariffs are not the very appropriate indicators of border
protection level. Although all the non-tariff barriers have been converted to tariffs following the
WTO Agreement on Agriculture in 1995, many tariffs contain the so called “water” meaning that

20
the tariffs are greater than the price differences between domestic and border prices. Especially,
the secondary tariffs in tariff rate quotas (TRQ) are extremely high. The existence of these “dirty
tariffs” led current WTO negotiations on agriculture to propose capping tariffs in harmonization
of tariff peaks.
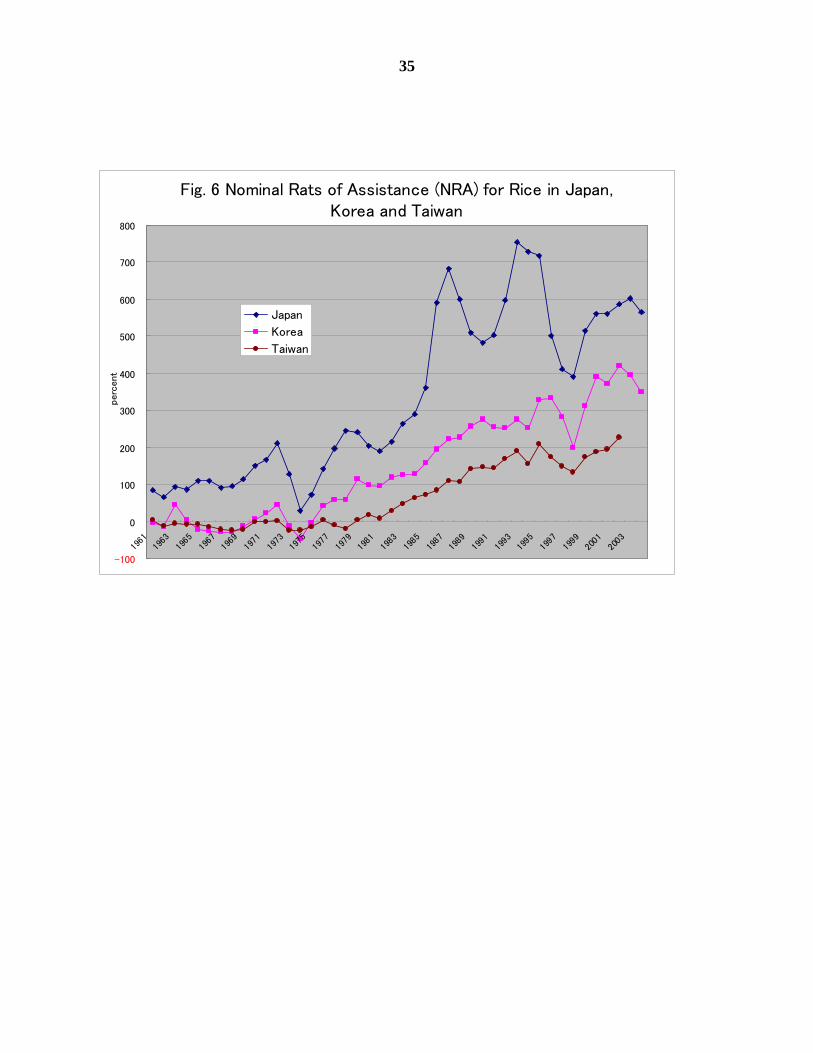
Fluctuations in TRA consist of mainly changes in NRA of individual commodities and
changes in the weight of each commodity. Same for Japan, Korea and Taiwan, the most
important agricultural product is rice. Its protection therefore has had large influences on TRA.
The movements of NRA for rice in the three economies are shown in Figure 6. The NRA of rice
has a clear upward trend in all three economies. In particular, Japan increased NRA for rice
sharply in the late 1980s and 1990s. Sharp increases in rice NRA in the late 1980s to a peak in
1987 resulted from rapid depreciations of US dollar by which the border price of rice declined
sharply. But the border price declines were not transmitted into Japanese rice market under the
perfect control of rice imports by the government. Another peak of rice NRA in Japan was
caused by bad harvests of rice in 1993 resulting in the shortage of Japonica rice in world market
that raised border prices, while domestic prices were kept relatively stable under the Food
Control System.
In Korean and Taiwan, NRA for rice stayed at almost zero before the late 1970s when
both economies were in the lower middle-income stage. Thereafter it showed a clear rising trend.
Increases in NRA of Korean rice are considered a major factor underlying the high growth rate
of the TRA. In Korea, the weight of rice in agricultural production is still high so that the trend
of assistance to rice continues to be a major determinant on the trend of the total assistance to
agriculture. Korea started to protect rice sector in the late 1970s and increased the NRA of rice
steadily thereafter. As discussed in the previous section, Korea was exempted from tariffication
dictated by the WTO Agreement on Agriculture. This treatment allows the NRA to grow even
after the implementation of the WTO commitments.
It is interesting to see that Taiwan lagged about five years behind Korea in the growth of
NRA for rice. The gap in NRA for rice between Taiwan and Korea has widened in recent yeas.
Still, the protection level of rice in Taiwan has been rising. Indeed, Taiwan became a member of
WTO in 2002 but tariffication of rice was exempted.
21
Sources of agricultural protection growth
Among past studies on agricultural protection in East Asia, Anderson, Hayami and Honma
(1986) pointed three characteristics of East Asian growth of agricultural protection, based on the
estimated the nominal rates of protection (NRP) for agricultural products in Japan, Korea,
Taiwan in comparison with other economies from 1955 to 1980.
First was the rapid rise over time in protection rates in the three economies in East Asia.
Second was the much faster increase in agricultural protection in East Asia than other industrial
countries for the period of 1955 to 1980. Third was the highest level of agricultural protection
that the three economies reached as of 1980, which was rivaled only by Switzerland.
The experience of these three economies in East Asia shows a good example of policy
switching from exploitation to protection of agriculture when economies grow based on
industrial development. This shift is most clearly illustrated by the cases of Korea and Taiwan
whose agricultural protection levels were negative in the 1950s and the 1960s and began the rise
sharply from the 1970s with the success of industrial development.
In Anderson, Hayami and Honma (1986), the growth of agricultural protection in those
economies during the three decades up to 1980 was found to be exceptionally rapid, compared
with the earlier starters of industrialization in the West. East Asia was not exceptional in its bent
forward agricultural protection in the course of successful industrial development but exceptional
in its speed in reaching the world highest level. Figure 1 indicates that the protection growth in
terms of TRA continued at the same speed for 20 years after the previous study period.
The rapid growth of agricultural protection was largely explained by the shift in
comparative advantage away from agriculture to industry as the result of successful
industrialization. The decline in agriculture’s comparative advantage increases the inter-sectoral
resource adjustment costs that have to be shouldered by farmers if left to the competitive market
mechanism and, hence, increases their demand for agricultural protection. This typically applies
to East Asia where the industrial growth has been exceptionally rapid so that inter-sectoral
22
adjustments at a sufficient scale to prevent rural-urban income disparity from widening have
been more difficult to achieve under the free market.7
Indeed, the association of the level of agricultural protection with the decline in
agriculture’s comparative advantage was tested in Honma and Hayami (1986) by a multiple
regression analysis. A strong correlation was found between the level of aggregate NRP8 and the
index of agriculture’s labor productivity relative to total economy’s labor productivity in a
pooled data set of 15 countries at 6 points of time ending in 1980.
According to the results of the regression analysis, Honma and Hayami (1986) concluded
that the high level of agricultural protection in East Asia resulted not so much from factors
unique to East Asia but resulted mainly from the factors common to all industrial countries, such
as the high social cost of inter-sectoral resource adjustments arising from the rapid decline in
agriculture’s comparative advantage in the process of industrial development.
However, it is observed that there are differences in the process of the inter-sectoral
resource adjustment between Japan and other two economies. In 1955, the first year for our
investigation, Japan was already in the middle-income stage of economic development and
entering the so-called “High Growth Era” characterized by extremely rapid industrialization,
associated with the widening income gap between rural and urban households. Japan introduced
protection measures for agriculture soon after it entered the High Growth Era through which
Japan was able to jump up from a middle-income to a high-income economy by 1970 within less
than two decades. Correspondingly, Japan’s agricultural protection was raised to a level
comparable with that of the European Community already during the 1960s.
Meanwhile, Korea and Taiwan stayed in the low-income stage in economic development
in the 1950s. But they entered in a middle-income stage soon in the 1960s. In the-middle income
stage, productivity growth in agriculture tends to lag behind that in non-agriculture as a result of
the successful industrialization. Therefore, farmers’ income level tends to decline relative to
non-farmers’ corresponding to the widening inter-sectoral productivity gap. Nevertheless, it is
impossible for the government in the middle-income stage to secure sufficient finance for closing
the income gap since the shares of agriculture in both national income and labor force still
7 For agricultural policies in the process of economic development, see Hayami and Godo (2004). 8 Actual data used for the level of agricultural protection in the regression analysis are the nominal protection coefficients (NPC=NRPS + 1).

23
remain large. Thus, Korea and Taiwan remained at a low level of agricultural protection despite
growing rural-urban income disparity until the late 1970s or the early 1980s, respectively.
The agricultural problem in the middle-income economies like Korea and Taiwan in the
1960s and 1970s is called the “disparity problem” It is by nature the problem of income disparity
between the farm and the non-farm sectors.9 This problem is brought about by a lag in
productivity growth in agriculture behind non-agriculture as a result of the successful
industrialization that raised these economies to a middle-income stage. At this stage as compared
with the previous low-income stage, the food supply capacity rises and factors causing growth in
demand for foods, such as high population growth and high demand elasticities, are weakened,
though people’s per-capita incomes do not yet reach a level at which food consumption is
completely saturated as in the high-income economies. As a result, the terms of trade between
agriculture and non-agriculture remain largely stable, despite significant decreases in
agriculture’s productivity relative to non-agriculture due to rapid progress in industrialization.
Therefore, farmers’ income level tends to decline relative to non-farmers’ corresponding
to the widening inter-sectoral productivity gap. By observing non-farm workers’ rapid escape
from poverty, farmers who are left behind begin to realize how poor they are, even if their
income level did not decrease or modestly increased from the previous stage. Dissatisfaction of
farm population on their remaining to be poor despite visible improvements in other sectors often
becomes a significant source of social instability. Thus, at the middle-income stage, it becomes a
prime concern of policymakers to prevent rural-urban income disparity from widening.
So, the government tries to adopt agricultural protection measures to appease farmers’
dissatisfaction that may elevate to serious anti-governmental movements. However, this
protection cannot be strong enough to fill up the income gap between farmers and urban workers
unlike in the high-income stage. Because the shares of agriculture in both national income and
labor force are still large, it is difficult for the government in the middle-income stage to raise
sufficient revenue from the non-farm sectors to subsidize farm population for closing the
growing farm-nonfarm income gap.
It is also difficult to pass on the cost of agricultural protection by means of raising
domestic food prices because increases in food prices result in a major damage to a large number
9 For the details of the disparity problem, see Hayami and Godo (2004).
24
of small-scale enterprises in urban area, which heavily rely on cheap labor. Under the dictate of
this disparity problem, policymakers in middle-income countries are forced to muddle around in
search of ways and means to protect farmers within the constraint of the food problem that is still
binding because a large number of workers in urban informal sectors are still absolutely poor.
Since the early 1990s when all the three economies entered the high-income stage,
declines in the relative agricultural income in terms of agricultural GDP per worker divided by
total GDP per worker stopped in Japan and Korea whereas in Taiwan the relative agricultural
income continued to decline till recently, as observed in Table 1 (Row 5), in spite of the high
level of agricultural protection. The reason why Taiwan’s relative agricultural income continued
to decline is that Taiwan increased its total economy’s labor productivity more rapidly than
agriculture’s labor productivity even after 1990.
In Japan the decline in the relative agricultural income ceased in the 1970s when Japan
reached at the high-income stage. It was due to deceleration in the growth of labor productivity
in whole economy after the completion of its catch-up stage, whereas that of Korea after 1990 is
likely to be explained by fast increases in agricultural labor productivity resulting from the rapid
out-migration of agricultural labor to urban industry as seen in Table 1 (Row 3).
The relationship between the relative agricultural income and the TRA in Japan, Korea
and Taiwan for 1960-2004 is shown in Figure 710 A negative correlation between them is found
except for Korea in 1990, 2000 and 2004. But the correlation is weak when the relative
agricultural income is around 40 percent and larger, which corresponds to the lower middle
income stage in economic development.
Korea and Taiwan strengthened the agricultural protection policies in the 1980s when
both economies entered in the upper middle-income stage as Japan did in the 1960s, in which the
income gap was already widening and requiring to be closed by protection measures. Under such
circumstances in the upper middle-income economies, politicians had not been able to resist
pressures from the farm lobby for instituting policies to prevent farmers’ incomes from lagging
behind non-farm workers’.
In addition, Korea may have had a specific reason for strengthening agricultural
protection, particularly at farm gate level. It was the constant menace of communist aggression
10 TRA for 1961 is used for the pairs in 1960 and TRA for Taiwan in 2002 is used for 2004.

25
from the north that would have made commercial and industrial interests aware of the need to
support farmers for maintaining the political stability.
If the income gap could have been adequately coped with during the middle-income
stage, the problems caused by agricultural protection in the following upper middle-income stage
might have been avoided. But the disparity problem in the middle-income stage has received
relatively little attention. Yet, the growing income disparity between farm and non-farm
population could be a major source of social and political instability for economies attempting to
achieve catching up with the upper middle and high-income economies through industrialization.
This problem is now spreading over Asia from ASEAN nations to China and Vietnam and will
eventually reach South Asia, especially India.
Furthermore, attention should be paid also to changes in the structure of political
economy. In the analysis by Honma and Hayami (1986), it was found that the political power in
agricultural sector would be maximized when the share of agriculture is declining to 4 to 5
percent in GDP or 5 to 8 percent in labor force. Japan passed already in this range, whereas
Korea in both of GDP and labor force and Taiwan in labor force have recently entered this peak
zone. This may well be the factors to underlie the rise of agricultural protectionism in Korea in
recent years, observed in terms of NRA at farm-gate level, despite no significant decrease in
agriculture’s comparative advantage.11
Concluding remarks
This article examined the degree of distortions to agricultural incentives in terms of price
distortions in Japan, Korea and Taiwan in a manner consistent with Methodology for Measuring
Distortions to Agricultural Incentives. Total rates of assistance to agricultural output (TRA) are
estimated for Japan and Korea for 1961-2004 and Taiwan for 1961-2002.
11 Shares of Korean agriculture in GDP and labor force were 3.8 percent and 7.7 percent, respectively, in 2004 while those in Japan and Taiwan were 1.1 percent and 1.7 percent in GDP and 4.1 percent and 7.5 percent in labor force in the same year. See Table 1 (Row 2 and 3).
26
Japan, Korea and Taiwan have continued to raise the TRA over the five decades under
investigation. Experiences of the three economies for the early period of 1955 to 1980 were
explained by the factors common to industrialized economies, especially the high cost of
industrial adjustment shouldered by farm producers in the process of rapid economic growth.
However, the agricultural protection level continued to grow even after 1980 in all the three
economies despite apparently decreased needs for agricultural supports for the sake of preventing
the rural-urban income disparity from widening.
All the three economies suffer from the problems caused by agricultural protection
commonly observed in the high-income stage of economic development. The source of
agricultural protectionism is the income gap between agricultural and non-agricultural sectors,
which starts to widen as the economies enter the middle-income stage. Indeed, the experiences in
East Asia show that agricultural protection continued to grow when the economies advanced
from the middle-income to the high-income stage. If the income gap could have been coped with
more appropriately at the middle-income stage, the problems caused by agricultural protection in
the following high-income stage could have been significantly reduced.
The agricultural problem in the middle-income economies is based on what we call the
“disparity problem”. Greater attention shall be paid on this problem. The difficulty to solve this
problem is how to compromise the conflicting needs to support farmers’ incomes on one hand
and to secure the supply of low-cost food to a large number of workers in urban informal sectors
in another, under the still weak capacity of the government to raise sufficient revenue from
non-agricultural sectors. Somewhat contrasting patterns of agricultural and industrial growth
between Korea and Taiwan may provide a key to the solution, on which further research inputs
shall be called for.
References
Anderson, K. and Y. Hayami with associates (1986), The Political Economy of Agricultural
Protection: East Asia in International Perspective, London and Sydney: Allen and
Unwin.
27
Anderson, K., Y. Hayami and M. Honma (1986), “The Growth of Agricultural Protection”, in
Chapter 2, K. Anderson and Y. Hayami with associates, The Political Economy of
Agricultural Protection: East Asia in International Perspective, London and Sydney:
Allen and Unwin.
Anderson, K., W. Martin, D. Sandri and E. Valenzuela (2006), “Methodology for Measuring
Distortions to Agricultural Incentives”, Agricultural Distortions Research Project
Working Paper 02, World Bank, Washington DC, August.
Hayami, Y. (1988), Japanese Agriculture under Siege: The Political Economy of Agricultural
Policies, London: Macmillan.
Hayami, Y. and Y. Godo (2004), “The Three Agricultural Problems in the Disequilibrium of
World Agriculture”, Journal of Agriculture and Development 1 (June): pp.3-16.
Heston, A., R. Summers and B. Aten, (2006), Penn World Table Version 6.2, Center for
International Comparisons of Production, Income and Prices at the University of
Pennsylvania, September.
Honma, M and Y. Hayami (1986), “Determinants of Agricultural Protection Levels: An
Econometric Approach”, in Chapter 4, K. Anderson and Y. Hayami with associates, The
Political Economy of Agricultural Protection: East Asia in International Perspective,
London and Sydney: Allen and Unwin.
Kawano, S. (1969), “Effects of the Land Reform on Consumption and Investment of Farmers”, in
pp. 374-97, K. Ohkawa, B.F. Johnston and H. Kaneda (Eds.), Agriculture and Economic
Growth; Japan’s Experience, Tokyo: University of Tokyo Press.
Kuo, S.W.Y. (1975), “Effects of Land Reform, Agricultural Pricing Policy, and Economic Growth
on Multiple Crop Diversification in Taiwan”, Philippine Economic Journal 14 (1 and 2).
Kruger, A. O., M. Schiff and A. Valdes (Eds.) (1991), Political Economy of Agricultural Pricing
Policies, 3 volumes, Baltimore: Johns Hopkins University Press.
Mao, Y-K. and C. Schive (1995), “Agricultural and Industrial Development in Taiwan”, in J.
Mellor (Ed.), Agriculture on the Road to Industrialization, Baltimore: Johns Hopkins
University Press.
Moon, P.Y. and B.S. Kang (1989), Trade, Exchange Rate, and Agricultural Pricing Policies in
the Republic of Korea, World BankComparative Studies The Political Economy of
Agricultural Pricing Policy, Washington DC: World Bank.
28
Schultz, T.W. (Ed.), (1978), Distortion of Agricultural Incentives, Bloomington: Indiana
University Press.
Table1. Economic Growth and Structural Transformation in Japan, Korea and
Taiwan, 1955-2004
1955 1960 1970 1980 1990 2000 2004 Japan 3,128 4,509 11,391 15,520 21,703 23,971 24,661
Korea 1,429 1,458 2,552 4,497 9,593 15,702 18,424
(1) Real GDP per capita in 2000 constant prices ($) Taiwan 1,241 1,444 2,846 5,963 11,248 19,184 20,868
Japan 17.4 9.0 4.2 2.4 1.7 1.1 1.1
Korea 46.9 39.1 29.2 16.2 8.9 4.9 3.8
(2) Share of agriculture in GDP ( percent) Taiwan 28.9 28.2 15.3 7.5 4.0 2.0 1.7
Japan 33.8 26.8 15.9 9.1 6.2 4.5 4.1
Korea 79.7 60.2 49.1 37.1 18.1 10.0 7.7
(3) Share of agriculture in economically active population ( percent) Taiwan 53.6 50.2 36.7 19.5 12.8 8.9 7.5
Japan 40.7 36.5 25.1 18.3 14 8.2 7.4
Korea 61.9 58.2 44.7 28.4 15.5 8.6 7.1
(4) Share of farm household population in total population ( percent) Taiwan 50.7 49.8 40.9 30.3 21.1 16.5 14.3
Japan 51.5 33.6 26.4 26.4 27.4 24.4 26.8
Korea 58.8 65.0 59.5 43.7 49.2 49.0 49.4
(5) Agricultural GDP per worker / total GDP per worker ( percent) Taiwan 53.9 56.2 41.7 38.5 31.3 22.5 22.7
Note: Shares of agriculture in GDP and labor force include forestry and fisheries. Source: Heston, Summers and Aten (2006).
JMAFF, Nogyo Hakusho Fuzoku Tokei-hyo (Statistical Appendix of Agricultural White Paper), various issues.
Korean Government, Major Statistics of Agriculture, Forestry and Fisheries, various issues. Taiwan Government, Taiwan Agricultural Yearbook, various issues.
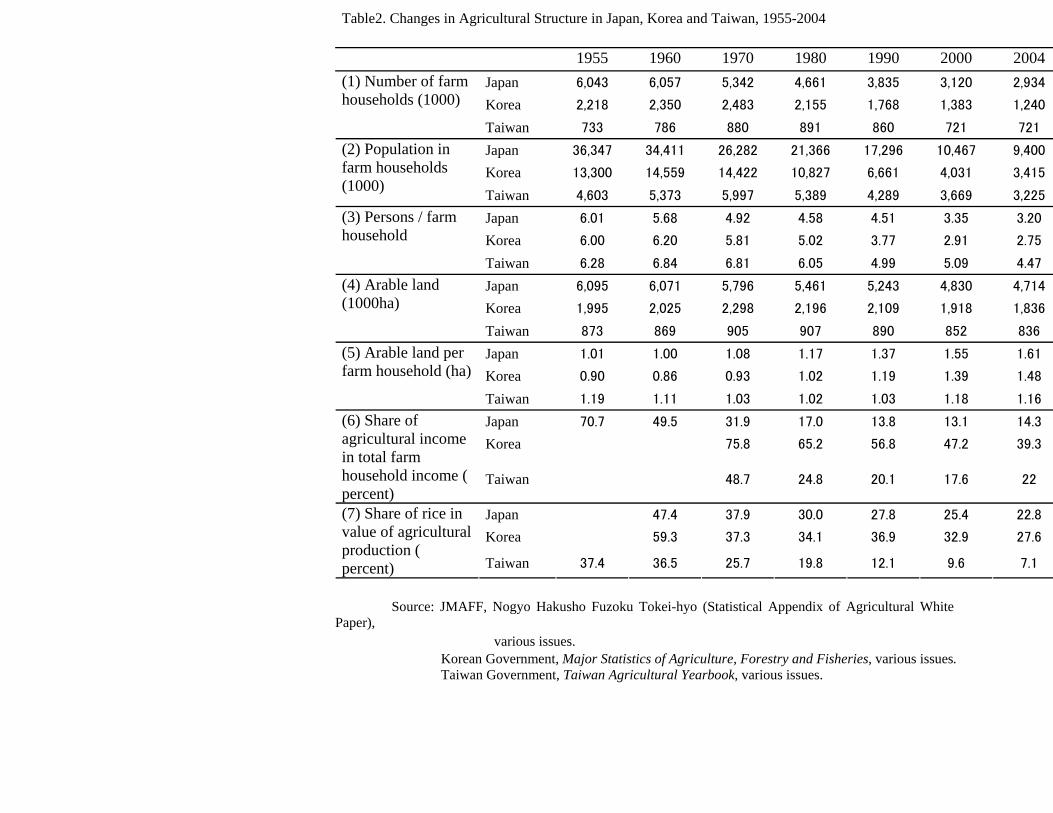
Table2. Changes in Agricultural Structure in Japan, Korea and Taiwan, 1955-2004
1955 1960 1970 1980 1990 2000 2004 Japan 6,043 6,057 5,342 4,661 3,835 3,120 2,934
Korea 2,218 2,350 2,483 2,155 1,768 1,383 1,240
(1) Number of farm households (1000)
Taiwan 733 786 880 891 860 721 721
Japan 36,347 34,411 26,282 21,366 17,296 10,467 9,400
Korea 13,300 14,559 14,422 10,827 6,661 4,031 3,415
(2) Population in farm households (1000) Taiwan 4,603 5,373 5,997 5,389 4,289 3,669 3,225
Japan 6.01 5.68 4.92 4.58 4.51 3.35 3.20
Korea 6.00 6.20 5.81 5.02 3.77 2.91 2.75
(3) Persons / farm household
Taiwan 6.28 6.84 6.81 6.05 4.99 5.09 4.47
Japan 6,095 6,071 5,796 5,461 5,243 4,830 4,714
Korea 1,995 2,025 2,298 2,196 2,109 1,918 1,836
(4) Arable land (1000ha)
Taiwan 873 869 905 907 890 852 836
Japan 1.01 1.00 1.08 1.17 1.37 1.55 1.61
Korea 0.90 0.86 0.93 1.02 1.19 1.39 1.48
(5) Arable land per farm household (ha)
Taiwan 1.19 1.11 1.03 1.02 1.03 1.18 1.16
Japan 70.7 49.5 31.9 17.0 13.8 13.1 14.3
Korea 75.8 65.2 56.8 47.2 39.3
(6) Share of agricultural income in total farm household income ( percent)
Taiwan 48.7 24.8 20.1 17.6 22
Japan 47.4 37.9 30.0 27.8 25.4 22.8
Korea 59.3 37.3 34.1 36.9 32.9 27.6
(7) Share of rice in value of agricultural production ( percent) Taiwan 37.4 36.5 25.7 19.8 12.1 9.6 7.1
Source: JMAFF, Nogyo Hakusho Fuzoku Tokei-hyo (Statistical Appendix of Agricultural White
Paper), various issues.
Korean Government, Major Statistics of Agriculture, Forestry and Fisheries, various issues. Taiwan Government, Taiwan Agricultural Yearbook, various issues.

32
Fig.1 Total Rates of Assistance to Agriculture (TRA) in Japan, Koreaand Taiwan
-50
0
50
100
150
2001961
1963
1965
1967
1969
1971
1973
1975
1977
1979
1981
1983
1985
1987
1989
1991
1993
1995
1997
1999
2001
2003
perc
ent
Japan
Korea
Taiwan
33
Fig. 2 Nominal Rates of Assistance to Agriculture at Farm-gate Level (NRAF) in Japan, Korea and Taiwan
0
20
40
60
80
100
120
140
1980
1981
1982
1983
1984
1985
1986
1987
1988
1989
1990
1991
1992
1993
1994
1995
1996
1997
1998
1999
2000
2001
2002
Note: NRAF is based on farm gate prices
perc
ent
Japan
Korea
Taiwan
Fig. 3 Total Rates of Assistance to Agriculture (TRA) and Exchange Rate, Japan
0
20
40
60
80
100
120
140
160
180
200
1961
1963
1965
1967
1969
1971
1973
1975
1977
1979
1981
1983
1985
1987
1989
1991
1993
1995
1997
1999
2001
2003
TRA
, %
0.00
0.20
0.40
0.60
0.80
1.00
1.20
Ex.
Rat
e, Log
(US$/100Yen)TRA
Exchage Rate
34
Fig. 4 Total Rates of Assistance to Agriculture (TRA) and Exchange Rate, Korea
-40
-20
0
20
40
60
80
100
120
140
1961
1963
1965
1967
1969
1971
1973
1975
1977
1979
1981
1983
1985
1987
1989
1991
1993
1995
1997
1999
2001
2003
TRA
, %
-0.20
0.00
0.20
0.40
0.60
0.80
1.00
Ex.
Rat
e, Log
(US$/1000W
on)TRA
Exchage Rate
Fig. 5 Total Rates of Assistance to Agriculture (TRA) and Exchange Rate, Taiwan
-20
0
20
40
60
80
100
120
140
1961
1963
1965
1967
1969
1971
1973
1975
1977
1979
1981
1983
1985
1987
1989
1991
1993
1995
1997
1999
2001
TRA
,%
1.25
1.30
1.35
1.40
1.45
1.50
1.55
1.60
1.65
Ex.
Rat
e, Log
(US$/1000N
T$)
TRA
Exchage Rate
35
Fig. 6 Nominal Rats of Assistance (NRA) for Rice in Japan,Korea and Taiwan
0
100
200
300
400
500
600
700
800
1961
1963
1965
1967
1969
1971
1973
1975
1977
1979
1981
1983
1985
1987
1989
1991
1993
1995
1997
1999
2001
2003
perc
ent
Japan
Korea
Taiwan
-100
36
Fig. 7 Total Rates of Assistance to Agriculture (TRA) andRelative GDP per Worker in Agriculture
40
60
80
100
120
140
160
60.0 70.0
rker (%)
TR
A (
%)
-40
-20
0
20
0.0 10.0 20.0 30.0 40.0 50.0
Ratio of agricultural GDP per worker to total GDP per wo
Japan
Korea
Taiwan
Appendix Table. Direct and Total Rates of Agricultural Assistance in Japan, Korea and Taiwan
: Japan Korea: Taiwan:
NRA DRA DRN TRA EXR NRA DRA DRN TRA EXR NRA DRA DRN
1961 67.1 40.2 3.1 37.1 360 7.0 4.2 22.0 -17.8 125 6.8 4.1 5.7
1962 55.9 33.5 3.4 30.1 360 0.4 0.2 21.6 -21.3 130 -1.7 -1.0 6.5
1963 69.9 41.9 3.5 38.4 360 55.5 33.3 18.5 14.8 130 11.2 6.7 6.5
1964 65.5 39.3 3.6 35.7 360 18.0 10.8 16.6 -5.9 214 8.9 5.3 6.8
1965 75.9 45.6 3.3 42.2 360 -8.9 -5.3 19.4 -24.8 266 10.1 6.1 6.6
1966 77.9 46.7 3.2 43.6 360 -15.3 -9.2 16.7 -25.9 271 5.2 3.1 6.9
1967 68.0 40.8 3.3 37.5 360 -13.7 -8.2 16.7 -24.9 271 -3.6 -2.2 6.3
1968 77.1 46.3 3.2 43.0 360 -6.6 -4.0 16.3 -20.3 277 -4.2 -2.5 .17
1969 86.7 52.0 3.3 48.7 360 3.0 1.8 13.8 -12.0 288 -3.6 -2.2 6.9
1970 95.3 57.2 3.3 53.9 360 21.5 12.9 12.1 0.8 311 16.9 10.1 6.4
1971 91.9 55.1 3.1 52.0 351 37.1 22.3 8.4 13.9 347 25.0 15.0 5.9
1972 104.4 62.6 2.9 59.7 303 52.0 31.2 8.5 22.7 393 29.1 17.4 7.5
1973 76.8 46.1 2.4 43.7 272 -2.3 -1.4 7.6 -8.9 398 8.1 4.9 7.8
1974 28.4 17.1 1.2 15.8 292 -35.3 -21.2 6.0 -27.2 404 -5.5 -3.3 6.3
1975 60.4 36.2 1.2 35.0 297 7.1 4.2 7.8 -3.6 484 8.5 5.1 6.8
1976 90.4 54.3 1.4 52.8 297 50.3 30.2 9.3 20.8 484 17.5 10.5 6.9
1977 119.2 71.5 1.6 70.0 269 65.7 39.4 15.2 24.2 484 9.8 5.9 7.1
1978 157.3 94.4 1.7 92.7 210 72.3 43.4 11.6 31.7 484 4.1 2.5 7.3
1979 133.9 80.4 1.3 79.1 219 117.4 70.4 9.8 60.6 484 13.4 8.1 6.9
1980 106.5 63.9 1.0 62.9 227 98.4 59.0 7.3 51.7 607 27.8 16.7 5.7
1981 107.9 64.7 1.0 63.7 221 106.8 64.1 6.3 57.8 681 24.5 14.7 .5 3
1982 103.1 61.8 1.0 60.8 249 119.8 71.9 6.6 65.3 731 37.1 22.2 .15
1983 127.5 76.5 0.9 75.5 238 120.9 72.5 7.5 65.1 776 43.2 25.9 5.4
1984 144.6 86.7 0.9 85.8 238 116.6 69.9 6.7 63.2 806 46.8 28.1 .5 6
1985 159.6 95.8 1.0 94.8 239 137.7 82.6 6.1 76.5 870 52.6 31.5 .5 5
1986 229.5 137.7 1.2 136.5 169 149.1 89.4 6.8 82.6 881 63.6 38.2 5.6
1987 231.0 138.6 1.2 137.4 145 150.5 90.3 7.4 82.9 823 81.1 48.7 5.2
1988 224.8 134.9 1.3 133.6 128 167.3 100.4 6.6 93.8 731 92.7 55.6 4.4
1989 185.4 111.2 1.1 110.1 138 183.7 110.2 5.0 105.2 671 121.5 72.9 4.3
1990 177.6 106.6 1.0 105.6 145 203.0 121.8 4.5 117.3 708 115.0 69.0 3.6
1991 191.0 114.6 1.1 113.5 135 191.3 114.8 4.3 110.5 733 97.0 58.2 3.0
1992 213.9 128.3 1.1 127.2 127 173.3 104.0 3.9 100.1 781 118.9 71.3 2.4
1993 220.2 132.1 1.1 131.0 111 168.4 101.0 3.6 97.4 803 128.9 77.4 2.2
1994 290.7 174.4 1.0 173.4 102 182.4 109.4 3.3 106.1 803 139.2 83.5 2.0
1995 249.0 149.4 0.9 148.5 94 184.1 110.4 3.1 107.4 771 134.5 80.7 1.8
1996 191.8 115.1 0.8 114.3 109 191.1 114.7 3.2 111.5 804 126.9 76.1 1.6
1997 173.9 104.3 0.7 103.6 121 150.3 90.2 3.0 87.2 951 111.9 67.1 1.6
1998 162.8 97.7 0.7 97.0 131 93.0 55.8 2.7 53.1 1401 118.6 71.1 1.6
2000 225.3 135.2 0.6 134.6 108 186.3 111.8 2.5 109.3 1131 192.3 115.4 1.1
2001 190.4 114.3 0.7 113.6 122 180.2 108.1 2.4 105.8 1291 165.6 99.3 1.0
2002 187.6 112.5 0.6 112.0 125 204.6 122.7 2.3 120.5 1251 164.7 98.8 0.9
2003 169.0 101.4 0.6 100.8 116 182.2 109.3 2.1 107.2 1192
2004 185.7 111.4 0.6 110.8 108 199.6 119.8 2.0 117.7 1145
Note: NRA is weighted average of nominal rate of assistance for selected products; DRA is
direct agricultural component of TRA; DRN is direct non-agricultural component of TRA; TRA is total rate of assistance to
agricultural outputs; and EXR is exchange rate.