Distinct SagA from Hospital-Associated Clade A1 Enterococcus ...
10
Distinct SagA from Hospital-Associated Clade A1 Enterococcus faecium Strains Contributes to Biofilm Formation F. L. Paganelli, a M. de Been, a J. C. Braat, a T. Hoogenboezem, b,c C. Vink, b,c J. Bayjanov, a M. R. C. Rogers, a J. Huebner, d M. J. M. Bonten, a R. J. L. Willems, a H. L. Leavis a Department of Medical Microbiology, University Medical Center Utrecht, Utrecht, The Netherlands a ; Laboratory of Pediatrics, Pediatric Infectious Diseases and Immunity, Erasmus MC, Sophia Children’s Hospital, Rotterdam, The Netherlands b ; Erasmus University College, Department of Life Sciences, Erasmus University Rotterdam, Rotterdam, The Netherlands c ; Division of Pediatric Infectious Diseases, Hauner Children’s Hospital, Ludwig-Maximilians-Universität München, Munich, Germany d Enterococcus faecium is an important nosocomial pathogen causing biofilm-mediated infections. Elucidation of E. faecium bio- film pathogenesis is pivotal for the development of new strategies to treat these infections. In several bacteria, extracellular DNA (eDNA) and proteins act as matrix components contributing to biofilm development. In this study, we investigated biofilm for- mation capacity and the roles of eDNA and secreted proteins for 83 E. faecium strains with different phylogenetic origins that clustered in clade A1 and clade B. Although there was no significant difference in biofilm formation between E. faecium strains from these two clades, the addition of DNase I or proteinase K to biofilms demonstrated that eDNA is essential for biofilm for- mation in most E. faecium strains, whereas proteolysis impacted primarily biofilms of E. faecium clade A1 strains. Secreted anti- gen A (SagA) was the most abundant protein in biofilms from E. faecium clade A1 and B strains, although its localization dif- fered between the two groups. sagA was present in all sequenced E. faecium strains, with a consistent difference in the repeat region between the clades, which correlated with the susceptibility of biofilms to proteinase K. This indicates an association be- tween the SagA variable repeat profile and the localization and contribution of SagA in E. faecium biofilms. E nterococci, specifically Enterococcus faecium and Enterococcus faecalis, are the third most common cause of nosocomial in- fections (1). The increase in the number of hospital-associated infections caused by E. faecium in recent decades is thought to be driven, at least partly, by the cumulative acquisition of novel adap- tive traits, such as antibiotic resistance determinants and virulence factors, particularly in a defined subpopulation of E. faecium that is enriched in hospital isolates (2, 3). Different molecular technol- ogies and increasingly sophisticated phylogenetic models have been used to study various aspects of the dynamics of E. faecium evolution. As a result, the clinical E. faecium subpopulation was initially designated lineage C1 (4) and was later renamed clonal complex 17 (CC17) (2, 5). Bayesian-analysis-based population genetic modeling of multilocus sequence type (MLST) data of a large set of isolates demonstrated that nosocomial E. faecium strains clustered into distinct subgroups, suggesting different evo- lutionary trajectories for clinical isolates (6, 7). Subsequently, on the basis of whole-genome sequencing, Lebreton et al. (8) de- scribed three clades: (i) clade A1, including the majority of clinical E. faecium isolates, which had previously been classified as lineage C1 or CC17; (ii) clade A2, including the majority of animal-de- rived isolates; and (iii) clade B, containing human commensal isolates (8). We will use an adaptation of the latter nomenclature for our sequence-based phylogenetic analyses in the present study. Many E. faecium infections in hospitalized patients are biofilm mediated and are associated with the use of indwelling medical devices, such as (central) venous and urinary catheters, orthope- dic implants, and prosthetic cardiac valves (9). A critical step in the pathogenesis of these infections is the adherence of entero- cocci to implanted medical devices and the colonization of these surfaces by the formation of biofilms (10). The formation of multilayer biofilms is a complex process, from the attachment of single cells to the development of a 3-di- mensional (3D) bacterial community (11). Under optimal condi- tions, a mature biofilm can develop into multilayered microcolo- nies held together with a matrix and interspersed with water channels, through which nutrients reach deeper parts of the bio- film. The matrix, or extracellular polymeric substances (EPS), is an important biofilm component, stabilizing the biofilm and protecting it against antimicrobials and immune cells. It is com- posed mainly of polysaccharides, proteins, and extracellular DNA (eDNA) (12). Autolysis is the common mechanism by which eDNA is re- leased in Gram-positive bacteria (13–19). DNA can act as an ad- hesive, implicated in biofilm attachment and stability. In E. fae- cium clinical strain E1162, eDNA is generated mainly by the lysis of a bacterial subpopulation by the major autolysin AtlA Efm (19). Structural proteins present in the matrix have been character- ized in several bacterial species (20). These biofilm matrix-associ- ated proteins include extracellular carbohydrate-binding pro- teins, such as LecA, LecB, and CdrA in Pseudomonas aeruginosa (21–24) or TasA in Bacillus subtilis, and high-molecular mass pro- teins, such as the biofilm-associated surface protein Bap in Staph- Received 1 June 2015 Accepted 19 July 2015 Accepted manuscript posted online 24 July 2015 Citation Paganelli FL, de Been M, Braat JC, Hoogenboezem T, Vink C, Bayjanov J, Rogers MRC, Huebner J, Bonten MJM, Willems RJL, Leavis HL. 2015. Distinct SagA from hospital-associated clade A1 Enterococcus faecium strains contributes to biofilm formation. Appl Environ Microbiol 81:6873– 6882. doi:10.1128/AEM.01716-15. Editor: D. W. Schaffner Address correspondence to H. L. Leavis, [email protected]. Supplemental material for this article may be found at http://dx.doi.org/10.1128 /AEM.01716-15. Copyright © 2015, American Society for Microbiology. All Rights Reserved. doi:10.1128/AEM.01716-15 October 2015 Volume 81 Number 19 aem.asm.org 6873 Applied and Environmental Microbiology on March 14, 2018 by guest http://aem.asm.org/ Downloaded from
Transcript of Distinct SagA from Hospital-Associated Clade A1 Enterococcus ...

Distinct SagA from Hospital-Associated Clade A1 Enterococcusfaecium Strains Contributes to Biofilm Formation
F. L. Paganelli,a M. de Been,a J. C. Braat,a T. Hoogenboezem,b,c C. Vink,b,c J. Bayjanov,a M. R. C. Rogers,a J. Huebner,d
M. J. M. Bonten,a R. J. L. Willems,a H. L. Leavisa
Department of Medical Microbiology, University Medical Center Utrecht, Utrecht, The Netherlandsa; Laboratory of Pediatrics, Pediatric Infectious Diseases and Immunity,Erasmus MC, Sophia Children’s Hospital, Rotterdam, The Netherlandsb; Erasmus University College, Department of Life Sciences, Erasmus University Rotterdam,Rotterdam, The Netherlandsc; Division of Pediatric Infectious Diseases, Hauner Children’s Hospital, Ludwig-Maximilians-Universität München, Munich, Germanyd
Enterococcus faecium is an important nosocomial pathogen causing biofilm-mediated infections. Elucidation of E. faecium bio-film pathogenesis is pivotal for the development of new strategies to treat these infections. In several bacteria, extracellular DNA(eDNA) and proteins act as matrix components contributing to biofilm development. In this study, we investigated biofilm for-mation capacity and the roles of eDNA and secreted proteins for 83 E. faecium strains with different phylogenetic origins thatclustered in clade A1 and clade B. Although there was no significant difference in biofilm formation between E. faecium strainsfrom these two clades, the addition of DNase I or proteinase K to biofilms demonstrated that eDNA is essential for biofilm for-mation in most E. faecium strains, whereas proteolysis impacted primarily biofilms of E. faecium clade A1 strains. Secreted anti-gen A (SagA) was the most abundant protein in biofilms from E. faecium clade A1 and B strains, although its localization dif-fered between the two groups. sagA was present in all sequenced E. faecium strains, with a consistent difference in the repeatregion between the clades, which correlated with the susceptibility of biofilms to proteinase K. This indicates an association be-tween the SagA variable repeat profile and the localization and contribution of SagA in E. faecium biofilms.
Enterococci, specifically Enterococcus faecium and Enterococcusfaecalis, are the third most common cause of nosocomial in-
fections (1). The increase in the number of hospital-associatedinfections caused by E. faecium in recent decades is thought to bedriven, at least partly, by the cumulative acquisition of novel adap-tive traits, such as antibiotic resistance determinants and virulencefactors, particularly in a defined subpopulation of E. faecium thatis enriched in hospital isolates (2, 3). Different molecular technol-ogies and increasingly sophisticated phylogenetic models havebeen used to study various aspects of the dynamics of E. faeciumevolution. As a result, the clinical E. faecium subpopulation wasinitially designated lineage C1 (4) and was later renamed clonalcomplex 17 (CC17) (2, 5). Bayesian-analysis-based populationgenetic modeling of multilocus sequence type (MLST) data of alarge set of isolates demonstrated that nosocomial E. faeciumstrains clustered into distinct subgroups, suggesting different evo-lutionary trajectories for clinical isolates (6, 7). Subsequently, onthe basis of whole-genome sequencing, Lebreton et al. (8) de-scribed three clades: (i) clade A1, including the majority of clinicalE. faecium isolates, which had previously been classified as lineageC1 or CC17; (ii) clade A2, including the majority of animal-de-rived isolates; and (iii) clade B, containing human commensalisolates (8). We will use an adaptation of the latter nomenclaturefor our sequence-based phylogenetic analyses in the present study.
Many E. faecium infections in hospitalized patients are biofilmmediated and are associated with the use of indwelling medicaldevices, such as (central) venous and urinary catheters, orthope-dic implants, and prosthetic cardiac valves (9). A critical step inthe pathogenesis of these infections is the adherence of entero-cocci to implanted medical devices and the colonization of thesesurfaces by the formation of biofilms (10).
The formation of multilayer biofilms is a complex process,from the attachment of single cells to the development of a 3-di-mensional (3D) bacterial community (11). Under optimal condi-
tions, a mature biofilm can develop into multilayered microcolo-nies held together with a matrix and interspersed with waterchannels, through which nutrients reach deeper parts of the bio-film. The matrix, or extracellular polymeric substances (EPS), isan important biofilm component, stabilizing the biofilm andprotecting it against antimicrobials and immune cells. It is com-posed mainly of polysaccharides, proteins, and extracellular DNA(eDNA) (12).
Autolysis is the common mechanism by which eDNA is re-leased in Gram-positive bacteria (13–19). DNA can act as an ad-hesive, implicated in biofilm attachment and stability. In E. fae-cium clinical strain E1162, eDNA is generated mainly by the lysisof a bacterial subpopulation by the major autolysin AtlAEfm (19).
Structural proteins present in the matrix have been character-ized in several bacterial species (20). These biofilm matrix-associ-ated proteins include extracellular carbohydrate-binding pro-teins, such as LecA, LecB, and CdrA in Pseudomonas aeruginosa(21–24) or TasA in Bacillus subtilis, and high-molecular mass pro-teins, such as the biofilm-associated surface protein Bap in Staph-
Received 1 June 2015 Accepted 19 July 2015
Accepted manuscript posted online 24 July 2015
Citation Paganelli FL, de Been M, Braat JC, Hoogenboezem T, Vink C, Bayjanov J,Rogers MRC, Huebner J, Bonten MJM, Willems RJL, Leavis HL. 2015. Distinct SagAfrom hospital-associated clade A1 Enterococcus faecium strains contributes tobiofilm formation. Appl Environ Microbiol 81:6873– 6882.doi:10.1128/AEM.01716-15.
Editor: D. W. Schaffner
Address correspondence to H. L. Leavis, [email protected].
Supplemental material for this article may be found at http://dx.doi.org/10.1128/AEM.01716-15.
Copyright © 2015, American Society for Microbiology. All Rights Reserved.
doi:10.1128/AEM.01716-15
October 2015 Volume 81 Number 19 aem.asm.org 6873Applied and Environmental Microbiology
on March 14, 2018 by guest
http://aem.asm
.org/D
ownloaded from

ylococcus aureus and Bap-like proteins in other species (25). Todate, biofilm-associated matrix proteins have not been studied inE. faecium.
In the present study, we analyzed the roles of eDNA and extra-cellular proteins in biofilm formation by hospital-associated andcommunity-associated E. faecium strains that clustered in cladeA1 and clade B, respectively. We demonstrated that eDNA is anessential structural component of the extracellular matrix in all E.faecium strains, irrespective of origin or phylogenetic background.We also identified secreted antigen A (SagA) as the most abundantprotein in the supernatants of biofilm-forming cells and showedthat it is part of the E. faecium biofilm matrix. Moreover, we foundthat the form of SagA that is present in the biofilm matrices ofclade A1 strains contains a distinct repeat motif that correlateswith proteinase K susceptibility.
MATERIALS AND METHODSBacterial strains and growth conditions. The 85 E. faecium strains usedin this study are listed in Table S1 in the supplemental material. Unlessotherwise mentioned, E. faecium was grown in brain heart infusion broth(BHI; Oxoid) at 37°C. For biofilm assays, tryptic soy broth medium (TSB;Oxoid) with 1% glucose (TSBg) was used. Growth was determined bymeasuring the optical density at 660 nm (OD660).
Genome sequencing. For genome sequencing, 21 E. faecium strainswere grown on 4 ml BHI for 24 h at 37°C, and genomic DNA was extractedusing a Wizard genomic DNA purification kit (Promega). Samples wereprepared and sequenced employing the Nextera XT DNA sample prepa-ration kit and the MiSeq reagent kit, version 2, with 2 � 250-bp reads(Illumina Inc.). Reads were first quality filtered using Nesoni Clip, version0.109. Reads with an average quality score of �10 were removed, as well asreads shorter than 150 bp. The remaining reads were assembled de novointo contigs using the SPAdes assembler, version 3.0.0, with default pa-rameters (26). Subsequently, contigs of �500 bp and those below theminimum nucleotide coverage of 6 were discarded.
Functional gene annotation was performed using Prokka (27). Allprotein sequences were aligned using BLAST. On the basis of the align-ment results, orthologous groups (OGs) of proteins were identified usingorthAgogue (28) and the Markov clustering algorithm (MCL) (29).orthAgogue and MCL were run using “– u – o 50” and “–I 1.5” parameters,respectively. Based on the orthology relationship of 1,186 core OGs, in-cluding the 64 previously sequenced E. faecium strains, multiple-sequencealignment of the nucleotide sequences of genes in an OG was performedusing MUSCLE (30). Gaps in multiple-sequence alignments were re-moved using trimAl (31), which results in equal sequence lengths for allgenes in an OG. Subsequently, the core genomes of the 85 strains wereused for building a phylogenetic tree in FastTree 2 with 1,000 bootstrapsamples and the GTR (generalized time-reversible) model as a maximumlikelihood model (32).
The number of single nucleotide polymorphisms (SNPs) between iso-lates was extracted from the core genome alignment described above. Foreach pairwise strain comparison, we considered only SNPs at positions inthe alignment where both nucleotides were A, T, C, or G (i.e., ambiguouspositions were ignored). The number of SNPs for all pairwise strain com-parisons is displayed in Table S2 in the supplemental material.
Biofilm polystyrene assay. The biofilm polystyrene assay was per-formed as described previously, with some modifications (19). In brief,overnight bacterial suspensions were diluted to an OD660 of 0.01 in TSBgand were incubated for 24 h. Where mentioned, 1.5 �g �l�1 of DNase I(Roche) or 1.0 �g �l�1 of proteinase K (Sigma) was added to the bacterialsuspension before the start of biofilm formation. The plates were washedand stained as described previously (19). The experiments were per-formed in triplicate, and statistical analysis of the data was performedusing a two-tailed Student t test.
Proteomics of the biofilm supernatant. To determine the proteinspresent in the supernatant of the clade A1 strain E1162 growing in abiofilm, 6 ml of the supernatant of E1162 cells, after 24 h of growth in abiofilm using the semistatic model as described below, was filtered using a0.2-�m filter (Corning) and was concentrated with a 10-kDa-cutoff col-umn (Amicon Ultra; Merck Millipore). Proteins were loaded onto a12.5% SDS-polyacrylamide gel electrophoresis (SDS-PAGE) gel, electro-phoresed, and stained with Coomassie brilliant blue. The three predom-inant proteins, of approximately 75 kDa, 50 kDa, and 25 kDa, were quan-tified with ImageJ (33) and were excised from the gel. Matrix-assisted laserdesorption ionization–time of flight mass spectrometry (MALDI-TOFMS) of the excised proteins was performed by using an Ultraflex MALDI-TOF/TOF mass spectrometer (Bruker Daltonics), as described previously(34).
Biofilm semistatic model and CLSM. To visualize E. faecium biofilmsand detect SagA, E. faecium biofilms were grown in a semistatic model asdescribed previously by Paganelli et al. (19), with some modifications. Inbrief, biofilms were grown in TSBg on a coverslip coated with poly-L-lysine (thickness, 0.45 �m; diameter, 12 mm; Becton Dickinson) inside awell of a six-well polystyrene plate (Corning Inc.) at 37°C for 24 h at 120rpm. To study the effect of proteolysis, 1.0 �g �l�1 of proteinase K wasadded at the start of biofilm formation (0 min). After 24 h, biofilms werewashed with 3 ml phosphate-buffered saline (PBS) and were fixed with3% paraformaldehyde for 15 min at room temperature. After removal ofthe fixative, cells were washed with PBS. To detect SagA, bacteria wereincubated with polyclonal anti-SagA antibodies (diluted 1:250 in PBSwith 1% bovine serum albumin [BSA]) (35) for 1 h on ice and weresubsequently washed with PBS. A polyclonal anti-SagA antiserum wasraised in rabbit using purified SagA from E. faecium strain E155 (35). As asecondary antibody, Alexa Fluor 488-conjugated goat anti-rabbit IgG(Life Technologies) (diluted 1:500 in PBS with 1% BSA), was added, andbacteria were incubated for an additional 1 h on ice. The cells were washedonce more and were incubated with the FM 5-95 dye (5 �g ml�1; Invit-rogen) for 1 min on ice to visualize cell membranes. The FM 5-95 dye wasremoved, and the coverslips were transferred to microscope slides. Fluo-rescence was analyzed using a confocal laser scanning microscope(CLSM) (Leica SP5) equipped with a Plan Neofluar 63� (numerical ap-erture, 1.4) oil objective. Alexa Fluor 488 and FM 5-95 were excited at 488nm. Pictures were analyzed with LAS AF software (Leica), and the level ofbiofilm formation was quantified using Comstat (36)/Matlab R2010bsoftware (MathWorks). The average thickness and biomass of the biofilmswere measured at five randomly chosen positions. Statistical analysis ofthe data was performed using a two-tailed Student t test. 3D images weregenerated with ImageJ (33), and OrthoView images were generated byLAS AF software (Leica).
Proteolytic stability of SagA. To determine the level of SagA degrada-tion during biofilm development, biofilm supernatants of three clade A1strains (E470, E1162, E1904) and three clade B strains (E980, E3548,E1590) were analyzed. The supernatants originating from biofilms grownin a semistatic model for 4 h (early biofilm) and 24 h (mature biofilm)were filtered and precipitated at �20°C overnight with 1/10 (vol/vol)100% trichloroacetic acid (TCA). After incubation, supernatants werespun down for 10 min at 4,000 � g and 4°C. Protein pellets were washedwith 500 �l 100% acetone and were again centrifuged under the sameconditions. Final protein pellets were resuspended in sample buffer (100mM Tris-HCl, 5% dithiothreitol, 2% SDS, 0.004% bromophenol blue,and 20% glycerol) and were analyzed by SDS-PAGE and Western blottingas described below.
For testing of the stability of SagA in biofilms, supernatants of 24-hbiofilms of E1162 and E980, processed as described above, were incubatedat 37°C for 30 min, 1 h, 4 h, 8 h, or 24 h. The degradation of SagA over timewas analyzed by SDS-PAGE and Western blotting as described above.
To analyze the susceptibility of SagA to proteinase K, filtered superna-tants of 24-h biofilms of E1162 and E980 were incubated with 0.1 �g �l�1
proteinase K at 37°C for 1, 5, 15, 30, or 60 min. After challenge with
Paganelli et al.
6874 aem.asm.org October 2015 Volume 81 Number 19Applied and Environmental Microbiology
on March 14, 2018 by guest
http://aem.asm
.org/D
ownloaded from

proteinase K, supernatants were precipitated at 4°C for 10 min with 1/5(vol/vol) 100% TCA. After incubation, supernatants were spun down for10 min at 4,000 � g and 4°C. Protein pellets were washed with 500 �l100% acetone and were again centrifuged under the same conditions.Final protein pellets were resuspended in sample buffer and were analyzedby SDS-PAGE and Western blotting as described below.
SDS-PAGE and Western blotting. Equal amounts of protein sampleswere mixed with the same volume of sample buffer and were boiled for 5min. Western blotting was carried out as described previously (37). Mem-branes were blocked with 4% skim milk (Campina Holland, Alkmaar, TheNetherlands) in PBS– 0.1% Tween 20 for 24 h at 4°C. Incubation with theprimary antibody (anti-SagA) (35) was carried out for 1 h in 1% BSA inPBS–1% Tween 20 at 37°C, followed by two washes for 10 min (each) inPBS– 0.1% Tween 20 at 37°C. Subsequently, membranes were incubatedfor 1 h with horseradish peroxidase (HRP)-conjugated anti-rabbitIgG(H�L) (Bio-Rad Laboratories, Veenendaal, The Netherlands) in 1%BSA in PBS–1% Tween 20 at 37°C. Membranes were washed twice withPBS– 0.1% Tween 20, and proteins were visualized using the ECL PlusWestern blotting detection system and the ImageQuant LAS 4000 biomo-lecular imager (both from GE Healthcare, Diegem, Belgium).
sagA sequences. For 34 E. faecium strains, the complete sagA genesequence was determined by Sanger sequencing. To this end, the sagA
gene was amplified using AccuPrime Taq DNA Polymerase, High Fidelity(Life Technologies), and primers sagA-F (5=-ATGACCTTGACTGCCGTAGCAT-3=) and sagA-R (5=-TTACATGCTGACAGCAAAGTCAG-3=),which are specific for E. faecium sagA, in a total volume of 50 �l. Thecalculated size of the sagA amplicon was 1,500 bp. The conditions for PCRamplification were as follows: initial denaturation was conducted for 3min at 95°C, and 30 cycles of denaturation, annealing, and extension wereconducted at 94°C for 30 s, 55°C for 30 s, and 72°C for 2 min, respectively.PCR products were purified with the GeneJET PCR purification kit(Thermo Scientific) and were sequenced by Sanger methodology (38).The sagA gene sequences of the remaining 51 strains were extracted fromwhole-genome sequence data. In these strains, sagA was assembled on onecontig.
Phylogenetic tree based on the SagA VRR. The SagA variable repeatregion (VRR) sequences of all 85 E. faecium strains used in this study werealigned using MUSCLE (30), and a maximum likelihood tree was builtfrom the alignment data using the Jones-Taylor-Thornton (JTT) model inMEGA, version 6 (39).
SagA secondary-structure prediction. Based on the SagA primaryamino acid sequence, the SagA secondary structure was predicted usingthe Chou & Fasman Secondary Structure Prediction Server at http://www.biogem.org/tool/chou-fasman/ (40, 41).
FIG 1 Phylogenetic reconstruction of 85 E. faecium strains based on core genome variation. (a) Phylogenetic tree (FastTree) built from an alignment of1,186 core genes in 85 E. faecium genomes. Clades A1 and B and the intermediate group (IG) are indicated by red, green, and blue boundaries, respectively.Selected strains for further phenotypic tests are highlighted in red in clade A1 (E470, E1162, and E1904) and in green in clade B (E980, E3548, and E1590).(b) SagA variable repeat regions (VRRs) are indicated after each strain designation. The VRRs are divided into three types: VRR-1 (boxed in red), VRR-2(boxed in blue), and VRR-3 (boxed in green). The sequences highlighted in yellow, blue, green, and red indicate the different repeat variants.
SagA in Enterococcus faecium Biofilms
October 2015 Volume 81 Number 19 aem.asm.org 6875Applied and Environmental Microbiology
on March 14, 2018 by guest
http://aem.asm
.org/D
ownloaded from

Nucleotide sequence accession numbers. The genome sequences ob-tained for the 85 E. faecium strains used in this study have been submittedto the European Nucleotide Archive (ENA) under study accession num-ber PRJEB9441 (http://www.ebi.ac.uk/ena/data/view/PRJEB9441). ThesagA sequence data determined in this study have been submitted to theEuropean Nucleotide Archive (ENA) and can be accessed by accessionnumbers LN714742 to LN714774.
RESULTSPhylogenetic analysis of E. faecium strains. Phylogenetic recon-struction of the 85 E. faecium strains included in this study wasperformed. Of the 85 genome sequences used in this analysis, 64were publicly available (3, 8, 42–44), whereas the genomes of theother 21 strains were newly sequenced for the purpose of thisstudy (see Table S1 in the supplemental material). A total of 1,186single-copy core orthologous groups (OGs) were identified usingOrthAgogue and MCL. Individual core OG alignments were builtand concatenated to generate a core genome sequence alignment.The resulting phylogenetic tree (Fig. 1a) revealed the presence oftwo of the three clades described previously: clade A1, which in-cludes the majority of hospital-associated strains, and clade B,including mainly human commensal strains. Strains that hadformed a clear monophyletic clade A2 in previous analyses (8)now formed a polyphyletic group located between clades B and
A1, which we designated the intermediate group (IG). This IGshould be considered as a multiclonal group of clinical, animal-derived, and community-associated strains, with a topology verydifferent from the ladder-like topology of clade A1 (Fig. 1a). How-ever, as observed before in clade A2, the strains present in the IGare closely related to clade A1, which makes the separation of theIG from clade A1 uncertain in some cases.
In total, 41 of the strains analyzed clustered in clade A1, 13clustered in clade B, and 31 were assigned to the IG. The clonalrelatedness of the strains was considered based on pairwise SNPcomparisons (see Table S2 in the supplemental material). Thelowest number of SNPs found between two strains was 6 (betweenstrains E1574 and E120), followed by 10 SNPs between strainsE2560 and U317. To avoid overrepresentation of these strains inclade A1, one strain from each pair described (in this case, strainsE120 and U317) was excluded from subsequent analysis.
Biofilm formation among E. faecium strains. Biofilm forma-tion by 83 E. faecium strains (see Table S1 in the supplementalmaterial) in TSBg was tested in a polystyrene (96-well) plate assay.We observed biofilm formation in 59% of E. faecium strains (49strains), with no significant difference in biofilm formation be-tween the different phylogenetic clades (Fig. 2).
eDNA, not secreted proteins, is essential for biofilm forma-tion by E. faecium. eDNA and secreted proteins are extracellularmatrix components important for biofilm attachment and stabil-ity in different bacterial species (20). In polystyrene plates, theimpact of DNase I and proteinase K on initial biofilm formation inTSBg was tested with 49 E. faecium strains belonging to differentphylogenetic clades. Biofilm formation was reduced (10 to 77%reduction) in 41 of 49 strains (83%) from the different phyloge-netic clades when DNase I was added to the biofilms (Fig. 3a). Astatistically significant (P � 0.05) decrease in biofilm formationwas observed among E. faecium clade A1 strains when proteinaseK was added to growing biofilms, but this was not observed forclade B strains (Fig. 3b). These results indicate that both eDNAand proteins are essential for biofilm formation by E. faeciumclade A1 strains and that eDNA is essential for biofilm formationby clade B strains. The fact that we did not observe a reduction inbiofilm formation by clade B strains after proteinase K treatmentmay suggest that proteins are less important than eDNA for bio-film formation by E. faecium clade B strains. Alternatively, it ispossible that proteins in clade B biofilms are less accessible to
FIG 2 Biofilm polystyrene assay. Biofilm formation by 83 E. faecium strains ofdifferent origins incubated in polystyrene plates with TSBg for 24 h was stud-ied. Biofilms were stained with crystal violet, and the amount of biofilm for-mation was measured at 595 nm. The six strains selected for further pheno-typic tests are color coded in yellow (E470), red (E1162), orange (E1904),green (E980), purple (E3548), and blue (E1590).
FIG 3 Sensitivity of initial biofilm formation to DNase I and proteinase K. Biofilm formation by 49 E. faecium strains of different origins incubated in polystyreneplates with TSBg for 24 h in the presence of DNase I (1.5 �g �l�1) (a) or proteinase K (1 �g �l�1) (b) was studied. Biofilms were stained with crystal violet, andthe amount of biofilm formation was measured at 595 nm. Asterisks indicate significant differences (*, P � 0.05; **, P � 0.01) by an unpaired two-tailed Studentt test between clade A1 and B strains or between IG and clade B strains. The six strains selected for further phenotypic tests are color coded in yellow (E470), red(E1162), orange (E1904), green (E980), purple (E3548), and blue (E1590).
Paganelli et al.
6876 aem.asm.org October 2015 Volume 81 Number 19Applied and Environmental Microbiology
on March 14, 2018 by guest
http://aem.asm
.org/D
ownloaded from

proteinase K or that in the context of a biofilm, clade B strains areable to degrade the exogenously added protease.
SagA is the major secreted protein in E. faecium biofilms.Since proteolytic treatment reduced the level of biofilm forma-tion, at least in E. faecium clade A1 strains, we investigated theproteins secreted in the supernatants of biofilm-forming cellsof representative E. faecium strains from clade A1 (E1162) andclade B (E980) (Fig. 4). No differences were observed betweenthe protein profiles of the supernatants of these strains by SDS-PAGE. Using MALDI-TOF MS, we identified the three domi-nant protein bands (highlighted in Fig. 4) as SagA (locus tagEfmE1162_2437; GenBank accession number EFF33872), sul-fatase domain protein (locus tag EfmE1162_1520; GenBankaccession number EFF34609), and LysM domain protein(EfmE1162_2234; GenBank accession number EFF34034) (seeTable S3 in the supplemental material). The three predominantbands in the SDS-PAGE gel were also quantified by ImageJ(33). Since SagA was the most abundant protein quantified inthe supernatants of the biofilm-forming E. faecium cells (60%relative to the other two proteins), we subsequently focused onthe role of SagA in E. faecium biofilms.
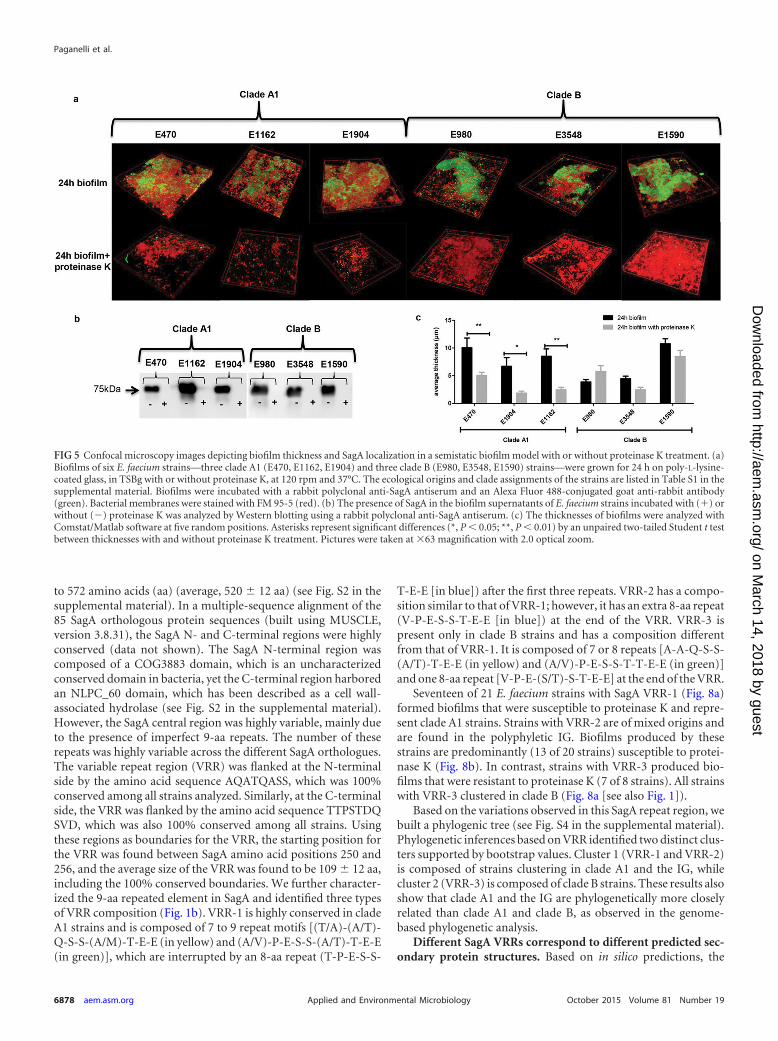
SagA is susceptible to proteinase K, and its localization inbiofilms differs between E. faecium clade A1 and clade B strains.To confirm the presence of SagA in the extracellular biofilm ma-trix and its susceptibility to proteinase K, we selected six E. faeciumstrains, three in clade A1 (E470, E1162, E1904) and three in cladeB (E980, E3548, E1590), and analyzed biofilm formation using asemistatic biofilm model in the presence or absence of proteinaseK. As in the polystyrene assay, all E. faecium strains, irrespective oftheir ecological or phylogenetic origins, were able to form bio-films. After proteinase K treatment, SagA was not detected in anyof the E. faecium biofilms (Fig. 5a) or in the supernatants of cellsgrowing in biofilms (Fig. 5b). In clade A1 strains, biofilm thicknesswas significantly decreased in the presence of proteinase K, incontrast to clade B strains, in which biofilm thickness was not
significantly affected (Fig. 5c). This confirmed the results obtainedin the polystyrene assay (Fig. 3b).
SagA was detected in biofilms of both clade A1 and clade Bstrains, but the localization of SagA in biofilms was different in thetwo clades. In clade A1 strains, SagA was localized in the middle ofthe biofilm (with points of colocalization of bacteria [red] andSagA [green] visualized in yellow [see Fig. S1a in the supplementalmaterial]), suggesting that SagA acts as an adhesive keeping bac-terial cells tightly connected. In contrast, in biofilms of clade Bstrains, SagA seemed more surface localized, which may explainwhy proteolytic removal of SagA does not have a major impact onbiofilm integrity in these strains, as it does in clade A1 strains (seeFig. S1b in the supplemental material).
To confirm the different roles for SagA in clade A1 and clade Bstrains, we attempted to construct a markerless sagA mutant andto select a sagA insertion mutant from a transposon library inE1162 (45). Unfortunately, both approaches failed, most probablybecause SagA has been reported previously to be essential for E.faecium, likely due to its role in cell division (46).
The susceptibility of SagA to proteolytic degradation is sim-ilar for E. faecium clade A1 and clade B strains. Another expla-nation for the observation that proteinase K treatment impactedbiofilm formation by E. faecium clade A1 strains more than bio-film formation by clade B strains, in addition to the difference inlocalization described above, could be that SagA of clade B strainsis less susceptible to proteolytic degradation by proteinase K.Therefore, we analyzed the degradation of SagA in 24-h biofilmsupernatants by proteinase K over time. For strains E1162 (cladeA1) and E980 (clade B), no significant difference was observed inSagA degradation with proteinase K. In both E1162 and E980,SagA was not detected after 30 min of treatment (Fig. 6). Thisindicates that the rates of degradation of SagA from E1162 andSagA from E980 by proteinase K are comparable.
SagA is present in early and mature biofilms without detect-able endopeptidase activity. Another explanation for the differ-ence in the susceptibility of clade A1 and clade B biofilms to pro-teinase K treatment could rely on differences in the proteolysis ofSagA by enterococcal proteases produced by clade A1 or clade Bstrains or in SagA endopeptidase activity. The proteolysis of SagAduring biofilm development was studied by SDS-PAGE and West-ern blotting of early (4-h) and mature (24-h) biofilm supernatantsof all six strains, which were also analyzed by confocal microscopy.In all strains, similar amounts of SagA were detected in early andmature biofilms by SDS-PAGE and Western blotting, with no in-dication of SagA degradation over time (Fig. 7). Alternatively,constitutive production of SagA during biofilm developmentcould explain the detection of apparently stable amounts of SagAin early and late biofilms. Nevertheless, even after the incubationof mature biofilm supernatants from E1162 and E980, which con-tain large amounts of SagA, for 24 h at 37°C, no SagA degradationcould be detected (see Fig. S3 in the supplemental material). Thisvirtually excludes the possibility of SagA endopeptidase activity inearly and mature biofilms.
SagA is present in all E. faecium strains sequenced but hasdifferent amino acid motifs in clade A1 and clade B strains. Weinvestigated the differences in sagA sequence among all E. faeciumstrains used in this study as a possible explanation for differencesin the localization of SagA in biofilms grown from E. faecium cladeA1 or clade B strains. The sagA gene is present in all sequenced E.faecium strains, and the sizes of the SagA proteins ranged from 479
FIG 4 Proteins released in the biofilm supernatants. Proteins present in the24-h biofilm supernatants of E. faecium strains E1162 (clade A1) and E980(clade B) were loaded equally, separated using a 12.5% SDS-PAGE gel, andstained with Coomassie blue. The indicated bands were excised from thegel and were identified by mass spectrometry as secreted antigen A(SagA) (locus tag EfmE1162_2437), sulfatase (EfmE1162_1520), and LysM(EfmE1162_2234).
SagA in Enterococcus faecium Biofilms
October 2015 Volume 81 Number 19 aem.asm.org 6877Applied and Environmental Microbiology
on March 14, 2018 by guest
http://aem.asm
.org/D
ownloaded from
to 572 amino acids (aa) (average, 520 � 12 aa) (see Fig. S2 in thesupplemental material). In a multiple-sequence alignment of the85 SagA orthologous protein sequences (built using MUSCLE,version 3.8.31), the SagA N- and C-terminal regions were highlyconserved (data not shown). The SagA N-terminal region wascomposed of a COG3883 domain, which is an uncharacterizedconserved domain in bacteria, yet the C-terminal region harboredan NLPC_60 domain, which has been described as a cell wall-associated hydrolase (see Fig. S2 in the supplemental material).However, the SagA central region was highly variable, mainly dueto the presence of imperfect 9-aa repeats. The number of theserepeats was highly variable across the different SagA orthologues.The variable repeat region (VRR) was flanked at the N-terminalside by the amino acid sequence AQATQASS, which was 100%conserved among all strains analyzed. Similarly, at the C-terminalside, the VRR was flanked by the amino acid sequence TTPSTDQSVD, which was also 100% conserved among all strains. Usingthese regions as boundaries for the VRR, the starting position forthe VRR was found between SagA amino acid positions 250 and256, and the average size of the VRR was found to be 109 � 12 aa,including the 100% conserved boundaries. We further character-ized the 9-aa repeated element in SagA and identified three typesof VRR composition (Fig. 1b). VRR-1 is highly conserved in cladeA1 strains and is composed of 7 to 9 repeat motifs [(T/A)-(A/T)-Q-S-S-(A/M)-T-E-E (in yellow) and (A/V)-P-E-S-S-(A/T)-T-E-E(in green)], which are interrupted by an 8-aa repeat (T-P-E-S-S-
T-E-E [in blue]) after the first three repeats. VRR-2 has a compo-sition similar to that of VRR-1; however, it has an extra 8-aa repeat(V-P-E-S-S-T-E-E [in blue]) at the end of the VRR. VRR-3 ispresent only in clade B strains and has a composition differentfrom that of VRR-1. It is composed of 7 or 8 repeats [A-A-Q-S-S-(A/T)-T-E-E (in yellow) and (A/V)-P-E-S-S-T-T-E-E (in green)]and one 8-aa repeat [V-P-E-(S/T)-S-T-E-E] at the end of the VRR.
Seventeen of 21 E. faecium strains with SagA VRR-1 (Fig. 8a)formed biofilms that were susceptible to proteinase K and repre-sent clade A1 strains. Strains with VRR-2 are of mixed origins andare found in the polyphyletic IG. Biofilms produced by thesestrains are predominantly (13 of 20 strains) susceptible to protei-nase K (Fig. 8b). In contrast, strains with VRR-3 produced bio-films that were resistant to proteinase K (7 of 8 strains). All strainswith VRR-3 clustered in clade B (Fig. 8a [see also Fig. 1]).
Based on the variations observed in this SagA repeat region, webuilt a phylogenic tree (see Fig. S4 in the supplemental material).Phylogenetic inferences based on VRR identified two distinct clus-ters supported by bootstrap values. Cluster 1 (VRR-1 and VRR-2)is composed of strains clustering in clade A1 and the IG, whilecluster 2 (VRR-3) is composed of clade B strains. These results alsoshow that clade A1 and the IG are phylogenetically more closelyrelated than clade A1 and clade B, as observed in the genome-based phylogenetic analysis.
Different SagA VRRs correspond to different predicted sec-ondary protein structures. Based on in silico predictions, the
FIG 5 Confocal microscopy images depicting biofilm thickness and SagA localization in a semistatic biofilm model with or without proteinase K treatment. (a)Biofilms of six E. faecium strains—three clade A1 (E470, E1162, E1904) and three clade B (E980, E3548, E1590) strains—were grown for 24 h on poly-L-lysine-coated glass, in TSBg with or without proteinase K, at 120 rpm and 37°C. The ecological origins and clade assignments of the strains are listed in Table S1 in thesupplemental material. Biofilms were incubated with a rabbit polyclonal anti-SagA antiserum and an Alexa Fluor 488-conjugated goat anti-rabbit antibody(green). Bacterial membranes were stained with FM 95-5 (red). (b) The presence of SagA in the biofilm supernatants of E. faecium strains incubated with (�) orwithout (�) proteinase K was analyzed by Western blotting using a rabbit polyclonal anti-SagA antiserum. (c) The thicknesses of biofilms were analyzed withComstat/Matlab software at five random positions. Asterisks represent significant differences (*, P � 0.05; **, P � 0.01) by an unpaired two-tailed Student t testbetween thicknesses with and without proteinase K treatment. Pictures were taken at �63 magnification with 2.0 optical zoom.
Paganelli et al.
6878 aem.asm.org October 2015 Volume 81 Number 19Applied and Environmental Microbiology
on March 14, 2018 by guest
http://aem.asm
.org/D
ownloaded from

structural differences between the SagA proteins from clade A1and clade B strains were investigated (40, 41). In both clade A1 andclade B strains, the repeat regions may serve as a linker between theN-terminal and the C-terminal domain (Fig. 9a). SagA proteinswith VRR-1 have relatively more alpha-helices in the N-terminalfragment of the protein than SagA proteins with VRR-3. In con-trast, SagA proteins with VRR-3 are composed of more beta-sheets than proteins with VRR-1 (Fig. 9b). These predicted differ-ences in SagA protein structure might have a distinct effect on thefunctionality of SagA and its localization in the biofilms of hospi-tal-associated and community-associated E. faecium strains.
DISCUSSION
Most difficult-to-treat chronic infections caused by multiresistantE. faecium strains are biofilm mediated. In the present study, wedemonstrated that the major secreted antigen, SagA, is part of thebiofilm matrix produced by E. faecium and as such is implicated inbiofilm formation in this species. The biofilms produced by hos-pital-associated (clade A1) and community-associated (clade B)strains were both found to be destabilized by DNase I treatment.Interestingly, the biofilms generated by hospital-associated strains
were highly sensitive to proteinase K treatment, whereas the com-munity-associated strain-induced biofilms were not.
Three proteins, LysM domain protein, sulfatase domain pro-tein, and SagA, were identified in mature biofilm supernatants ofE. faecium clade A1 and clade B strains. The LysM domain protein(GenBank accession number EFF34034) is a noncovalently bind-ing peptidoglycan protein that has been reported to be involved inerythromycin resistance in E. faecalis (47). Antibodies against theLysM domain protein are protective against E. faecium and E.faecalis infections in a mouse bacteremia model (47). The sulfatasedomain protein (GenBank accession number EFF34609) is a pre-dicted transmembrane protein and has an MdoB conserved do-main, reported to be involved in cell envelope biogenesis (47). Theroles of these proteins in E. faecium biofilms remain to be deter-mined.
The most abundant protein identified was SagA, which has aCOG3883 uncharacterized conserved domain in the N-termi-nal region and an NLPC_60 conserved domain in the C-termi-nal region. Proteins containing an NLPC_60 domain have beencharacterized as lipoproteins or cell hydrolases involved in celldivision, cell wall maturation, and virulence (48). SagA was
FIG 6 Susceptibility of SagA in a 24-h biofilm supernatant to proteinase Ktreatment. (a) Proteins present in the 24-h biofilm supernatants of E. faeciumstrains E1162 (clade A1) and E980 (clade B) were loaded equally, separatedusing a 12.5% SDS-PAGE gel, and stained with Coomassie blue after incuba-tion with 0.1 �g ml�1 proteinase K (ProtK) at 37°C for 1 min, 5 min, 15 min,30 min, or 60 min. (b) The degradation of SagA in the biofilm supernatants ofE. faecium strains incubated with proteinase K was analyzed by Western blot-ting using a rabbit polyclonal anti-SagA antiserum.
FIG 7 Stability of SagA during biofilm development. (a) Proteins present inthe 4-h or 24-h biofilm supernatants of six E. faecium strains—three clade A1(E470, E1162, E1904) and three clade B (E980, E3548, E1590) strains—wereloaded equally, separated using a 12.5% SDS-PAGE gel, and stained with Coo-massie blue. (b) The presence of SagA in the biofilm supernatants of E. faeciumstrains after 4 h or 24 h of growth was analyzed by Western blotting using arabbit polyclonal anti-SagA antiserum.
SagA in Enterococcus faecium Biofilms
October 2015 Volume 81 Number 19 aem.asm.org 6879Applied and Environmental Microbiology
on March 14, 2018 by guest
http://aem.asm
.org/D
ownloaded from

first identified by Teng et al. (46) by screening of an E. faeciumgenomic expression library with serum from a patient whosuffered from E. faecium endocarditis. The SagA protein ap-peared to be essential for growth, to bind to a broad spectrumof extracellular matrix (ECM) proteins, and to be sensitive toproteinase K (46). Subsequently, Kropec et al. (35) demon-
strated that serum raised against purified SagA is opsonic andinhibits E. faecium infections in an experimental animal model.While these data suggest that SagA is an important virulencefactor in E. faecium, its function has not been linked to biofilmformation previously. In the closely related species E. faecalis,however, two secreted antigens that displayed similarity to
FIG 8 Correlation between the proteinase K susceptibility of biofilm formation and the SagA variable repeat region (VRR) type. The percentage of biofilmreduction in 49 E. faecium strains in the presence of 1.0 �g �l�1 proteinase K is indicated along the y axis, while the level of biofilm formation in the polystyrenebiofilm model is indicated along the x axis. (a) E. faecium strains with SagA VRR-1 and VRR-3; (b) E. faecium strains with all three SagA VRRs. The six strainsselected for further phenotypic tests are color coded in yellow (E470), red (E1162), orange (E1904), green (E980), purple (E3548), and blue (E1590).
FIG 9 Prediction of the secondary structure of SagA. Shown are comparisons of the predicted secondary structures of total SagA protein (a) and the variablerepeat regions (VRRs) (b) of E. faecium strain E1162, which represents SagA protein with VRR-1; strain E1575, which represents SagA with VRR-2; and strainE980, which represents SagA with VRR-3. Secondary structures were predicted using the CFSSP (Chou & Fasman Secondary Structure Prediction Server) Webtool. Alpha-helices are indicated in red, beta-sheets in green, beta-turns in blue, and random coils in yellow.
Paganelli et al.
6880 aem.asm.org October 2015 Volume 81 Number 19Applied and Environmental Microbiology
on March 14, 2018 by guest
http://aem.asm
.org/D
ownloaded from

SagA, SalA and SalB, have been found to play a role in biofilmformation (49).
The present study demonstrates that SagA is the major proteinsecreted during biofilm formation in E. faecium. Furthermore,SagA is localized within the biofilm matrix, and proteolytic deg-radation, which also degrades SagA, markedly reduced the thick-ness of biofilms of clade A1 E. faecium strains but not the thicknessof biofilms of clade B strains. The potential difference betweenclade A1 and clade B in the impact of proteolytic degradation onbiofilm formation correlates with differences between these cladesin the repeat profiles of their SagA proteins. We hypothesize thatdifferences in the repeat profiles of SagA can lead to changes in thesecondary structure of the protein, which may determine the lo-calization as well as the role of SagA in E. faecium biofilm matrices,possibly as a result of diverse interactions of SagA variants withother E. faecium cell surface determinants. A difference in SagAlocalization within biofilms may explain the difference in the pro-teolytic susceptibility of biofilms that was observed between cladeA1 strains, all of which express SagA proteins with VRR-1, andclade B strains, which express SagA proteins with VRR-3.
Our findings also demonstrate that eDNA is an essential part ofbiofilms produced by all E. faecium strains tested. This is consis-tent with previous findings that the major autolysin AtlAEfm,which is present in all sequenced E. faecium strains, is responsiblefor eDNA release in E. faecium E1162 biofilms (19). Our observa-tion that E. faecium clade A1 and clade B strains form biofilmswith distinct properties suggests that under different ecologicalconditions, different types of biofilms are produced, possibly con-tributing to adaptation to different niches.
ACKNOWLEDGMENTS
We thank Ellen Brouwer for expert technical assistance during genomicDNA isolation for whole-genome sequencing and Jukka Corander for ahelpful discussion on the interpretation of the phylogenetic analysis.
Part of this work was supported by ZonMW VENI grant 91610058 toH.L.L. from The Netherlands Organization for Health Research and De-velopment and by the European Union Seventh Framework Pro-gramme (FP7-HEALTH-2011-single-stage) under grant agreement282004, EvoTAR, to R.J.L.W.
REFERENCES1. Hidron AI, Edwards JR, Patel J, Horan TC, Sievert DM, Pollock DA,
Fridkin SK. 2008. NHSN annual update: antimicrobial-resistant patho-gens associated with healthcare-associated infections: annual summary ofdata reported to the National Healthcare Safety Network at the Centers forDisease Control and Prevention, 2006 –2007. Infect Control Hosp Epide-miol 29:996 –1011. http://dx.doi.org/10.1086/591861.
2. Heikens E, Singh KV, Jacques-Palaz KD, van Luit-Asbroek M, OostdijkEA, Bonten MJ, Murray BE, Willems RJ. 2011. Contribution of theenterococcal surface protein Esp to pathogenesis of Enterococcus faeciumendocarditis. Microbes Infect 13:1185–1190. http://dx.doi.org/10.1016/j.micinf.2011.08.006.
3. de Been M, van Schaik W, Cheng L, Corander J, Willems RJ. 2013.Recent recombination events in the core genome are associated with adap-tive evolution in Enterococcus faecium. Genome Biol Evol 5:1524 –1535.http://dx.doi.org/10.1093/gbe/evt111.
4. Homan WL, Tribe D, Poznanski S, Li M, Hogg G, Spalburg E, VanEmbden JD, Willems RJ. 2002. Multilocus sequence typing scheme forEnterococcus faecium. J Clin Microbiol 40:1963–1971. http://dx.doi.org/10.1128/JCM.40.6.1963-1971.2002.
5. Willems RJ, Top J, van Santen M, Robinson DA, Coque TM, BaqueroF, Grundmann H, Bonten MJ. 2005. Global spread of vancomycin-resistant Enterococcus faecium from distinct nosocomial genetic complex.Emerg Infect Dis 11:821– 828. http://dx.doi.org/10.3201/1106.041204.
6. Willems RJ, Top J, van Schaik W, Leavis H, Bonten M, Siren J, Hanage
WP, Corander J. 2012. Restricted gene flow among hospital subpopula-tions of Enterococcus faecium. mBio 3(4):e00151-12. http://dx.doi.org/10.1128/mBio.00151-12.
7. Tedim AP, Ruiz-Garbajosa P, Corander J, Rodriguez CM, Canton R,Willems RJ, Baquero F, Coque TM. 2015. Population biology of intes-tinal Enterococcus isolates from hospitalized and nonhospitalized individ-uals in different age groups. Appl Environ Microbiol 81:1820 –1831. http://dx.doi.org/10.1128/AEM.03661-14.
8. Lebreton F, van Schaik W, McGuire AM, Godfrey P, Griggs A, Ma-zumdar V, Corander J, Cheng L, Saif S, Young S, Zeng Q, Wortman J,Birren B, Willems RJ, Earl AM, Gilmore MS. 2013. Emergence ofepidemic multidrug-resistant Enterococcus faecium from animal and com-mensal strains. mBio 4(4):e00534-13. http://dx.doi.org/10.1128/mBio.00534-13.
9. Donlan RM, Costerton JW. 2002. Biofilms: survival mechanisms of clin-ically relevant microorganisms. Clin Microbiol Rev 15:167–193. http://dx.doi.org/10.1128/CMR.15.2.167-193.2002.
10. Sandoe JA, Witherden IR, Cove JH, Heritage J, Wilcox MH. 2003.Correlation between enterococcal biofilm formation in vitro and medical-device-related infection potential in vivo. J Med Microbiol 52:547–550.http://dx.doi.org/10.1099/jmm.0.05201-0.
11. O’Toole G, Kaplan HB, Kolter R. 2000. Biofilm formation as microbialdevelopment. Annu Rev Microbiol 54:49 –79. http://dx.doi.org/10.1146/annurev.micro.54.1.49.
12. Abee T, Kovacs AT, Kuipers OP, van der Veen S. 2011. Biofilm forma-tion and dispersal in Gram-positive bacteria. Curr Opin Biotechnol 22:172–179. http://dx.doi.org/10.1016/j.copbio.2010.10.016.
13. Ahn SJ, Burne RA. 2006. The atlA operon of Streptococcus mutans: role inautolysin maturation and cell surface biogenesis. J Bacteriol 188:6877–6888. http://dx.doi.org/10.1128/JB.00536-06.
14. Allesen-Holm M, Barken KB, Yang L, Klausen M, Webb JS, Kjelle-berg S, Molin S, Givskov M, Tolker-Nielsen T. 2006. A characteriza-tion of DNA release in Pseudomonas aeruginosa cultures and biofilms.Mol Microbiol 59:1114 –1128. http://dx.doi.org/10.1111/j.1365-2958.2005.05008.x.
15. Petersen FC, Tao L, Scheie AA. 2005. DNA binding-uptake system: a linkbetween cell-to-cell communication and biofilm formation. J Bacteriol187:4392– 4400. http://dx.doi.org/10.1128/JB.187.13.4392-4400.2005.
16. Qin Z, Ou Y, Yang L, Zhu Y, Tolker-Nielsen T, Molin S, Qu D. 2007.Role of autolysin-mediated DNA release in biofilm formation of Staphy-lococcus epidermidis. Microbiology 153:2083–2092. http://dx.doi.org/10.1099/mic.0.2007/006031-0.
17. Steinberger RE, Holden PA. 2005. Extracellular DNA in single- andmultiple-species unsaturated biofilms. Appl Environ Microbiol 71:5404 –5410. http://dx.doi.org/10.1128/AEM.71.9.5404-5410.2005.
18. Vilain S, Pretorius JM, Theron J, Brozel VS. 2009. DNA as an adhesin:Bacillus cereus requires extracellular DNA to form biofilms. Appl EnvironMicrobiol 75:2861–2868. http://dx.doi.org/10.1128/AEM.01317-08.
19. Paganelli FL, Willems RJ, Jansen P, Hendrickx A, Zhang X, Bonten MJ,Leavis HL. 2013. Enterococcus faecium biofilm formation: identification ofmajor autolysin AtlAEfm, associated Acm surface localization, andAtlAEfm-independent extracellular DNA release. mBio 4(2):e00154-13.http://dx.doi.org/10.1128/mBio.00154-13.
20. Flemming HC, Wingender J. 2010. The biofilm matrix. Nat Rev Micro-biol 8:623– 633. http://dx.doi.org/10.1038/nrmicro2415.
21. Tielker D, Hacker S, Loris R, Strathmann M, Wingender J, Wilhelm S,Rosenau F, Jaeger KE. 2005. Pseudomonas aeruginosa lectin LecB is lo-cated in the outer membrane and is involved in biofilm formation. Micro-biology 151:1313–1323. http://dx.doi.org/10.1099/mic.0.27701-0.
22. Diggle SP, Stacey RE, Dodd C, Camara M, Williams P, Winzer K. 2006.The galactophilic lectin, LecA, contributes to biofilm development inPseudomonas aeruginosa. Environ Microbiol 8:1095–1104. http://dx.doi.org/10.1111/j.1462-2920.2006.001001.x.
23. Johansson EM, Crusz SA, Kolomiets E, Buts L, Kadam RU, CacciariniM, Bartels KM, Diggle SP, Camara M, Williams P, Loris R, Nativi C,Rosenau F, Jaeger KE, Darbre T, Reymond JL. 2008. Inhibition anddispersion of Pseudomonas aeruginosa biofilms by glycopeptide dendrim-ers targeting the fucose-specific lectin LecB. Chem Biol 15:1249 –1257.http://dx.doi.org/10.1016/j.chembiol.2008.10.009.
24. Branda SS, Chu F, Kearns DB, Losick R, Kolter R. 2006. A major proteincomponent of the Bacillus subtilis biofilm matrix. Mol Microbiol 59:1229 –1238. http://dx.doi.org/10.1111/j.1365-2958.2005.05020.x.
25. Lasa I, Penades JR. 2006. Bap: a family of surface proteins involved in
SagA in Enterococcus faecium Biofilms
October 2015 Volume 81 Number 19 aem.asm.org 6881Applied and Environmental Microbiology
on March 14, 2018 by guest
http://aem.asm
.org/D
ownloaded from

biofilm formation. Res Microbiol 157:99 –107. http://dx.doi.org/10.1016/j.resmic.2005.11.003.
26. Bankevich A, Nurk S, Antipov D, Gurevich AA, Dvorkin M, KulikovAS, Lesin VM, Nikolenko SI, Pham S, Prjibelski AD, Pyshkin AV,Sirotkin AV, Vyahhi N, Tesler G, Alekseyev MA, Pevzner PA. 2012.SPAdes: a new genome assembly algorithm and its applications to single-cell sequencing. J Comput Biol 19:455– 477. http://dx.doi.org/10.1089/cmb.2012.0021.
27. Seemann T. 2014. Prokka: rapid prokaryotic genome annotation. Bioinfor-matics 30:2068–2069. http://dx.doi.org/10.1093/bioinformatics/btu153.
28. Ekseth OK, Kuiper M, Mironov V. 2014. orthAgogue: an agile tool forthe rapid prediction of orthology relations. Bioinformatics 30:734 –736.http://dx.doi.org/10.1093/bioinformatics/btt582.
29. Enright AJ, Van Dongen S, Ouzounis CA. 2002. An efficient algorithmfor large-scale detection of protein families. Nucleic Acids Res 30:1575–1584. http://dx.doi.org/10.1093/nar/30.7.1575.
30. Edgar RC. 2004. MUSCLE: multiple sequence alignment with high accu-racy and high throughput. Nucleic Acids Res 32:1792–1797. http://dx.doi.org/10.1093/nar/gkh340.
31. Capella-Gutiérrez S, Silla-Martinez JM, Gabaldon T. 2009. trimAl: a toolfor automated alignment trimming in large-scale phylogenetic analyses.Bioinformatics 25:1972–1973. http://dx.doi.org/10.1093/bioinformatics/btp348.
32. Price MN, Dehal PS, Arkin AP. 2010. FastTree 2—approximately max-imum-likelihood trees for large alignments. PLoS One 5:e9490. http://dx.doi.org/10.1371/journal.pone.0009490.
33. Schneider CA, Rasband WS, Eliceiri KW. 2012. NIH Image to ImageJ: 25years of image analysis. Nat Methods 9:671– 675. http://dx.doi.org/10.1038/nmeth.2089.
34. Verkaik NJ, de Vogel CP, Boelens HA, Grumann D, Hoogenboezem T,Vink C, Hooijkaas H, Foster TJ, Verbrugh HA, van Belkum A, vanWamel WJ. 2009. Anti-staphylococcal humoral immune response in per-sistent nasal carriers and noncarriers of Staphylococcus aureus. J Infect Dis199:625– 632. http://dx.doi.org/10.1086/596743.
35. Kropec A, Sava IG, Vonend C, Sakinc T, Grohmann E, Huebner J. 2011.Identification of SagA as a novel vaccine target for the prevention of En-terococcus faecium infections. Microbiology 157:3429 –3434. http://dx.doi.org/10.1099/mic.0.053207-0.
36. Heydorn A, Nielsen AT, Hentzer M, Sternberg C, Givskov M, ErsbollBK, Molin S. 2000. Quantification of biofilm structures by the novelcomputer program COMSTAT. Microbiology 146(Part 10):2395–2407.
37. Hendrickx AP, van Wamel WJ, Posthuma G, Bonten MJ, Willems RJ.2007. Five genes encoding surface-exposed LPXTG proteins are enrichedin hospital-adapted Enterococcus faecium clonal complex 17 isolates. J Bac-teriol 189:8321– 8332. http://dx.doi.org/10.1128/JB.00664-07.
38. Sanger F, Coulson AR. 1975. A rapid method for determining sequencesin DNA by primed synthesis with DNA polymerase. J Mol Biol 94:441–448. http://dx.doi.org/10.1016/0022-2836(75)90213-2.
39. Tamura K, Stecher G, Peterson D, Filipski A, Kumar S. 2013. MEGA6:Molecular Evolutionary Genetics Analysis version 6.0. Mol Biol Evol 30:2725–2729. http://dx.doi.org/10.1093/molbev/mst197.
40. Chou PY, Fasman GD. 1974. Conformational parameters for aminoacids in helical, beta-sheet, and random coil regions calculated from pro-teins. Biochemistry 13:211–222. http://dx.doi.org/10.1021/bi00699a001.
41. Chou PY, Fasman GD. 1974. Prediction of protein conformation. Bio-chemistry 13:222–245. http://dx.doi.org/10.1021/bi00699a002.
42. Lam MM, Seemann T, Bulach DM, Gladman SL, Chen H, Haring V,Moore RJ, Ballard S, Grayson ML, Johnson PD, Howden BP, StinearTP. 2012. Comparative analysis of the first complete Enterococcus fae-cium genome. J Bacteriol 194:2334 –2341. http://dx.doi.org/10.1128/JB.00259-12.
43. de Regt MJ, van Schaik W, van Luit-Asbroek M, Dekker HA, vanDuijkeren E, Koning CJ, Bonten MJ, Willems RJ. 2012. Hospital andcommunity ampicillin-resistant Enterococcus faecium are evolutionarilyclosely linked but have diversified through niche adaptation. PLoS One7:e30319. http://dx.doi.org/10.1371/journal.pone.0030319.
44. van Schaik W, Top J, Riley DR, Boekhorst J, Vrijenhoek JE, Schapen-donk CM, Hendrickx AP, Nijman IJ, Bonten MJ, Tettelin H, WillemsRJ. 2010. Pyrosequencing-based comparative genome analysis of the nos-ocomial pathogen Enterococcus faecium and identification of a large trans-ferable pathogenicity island. BMC Genomics 11:239. http://dx.doi.org/10.1186/1471-2164-11-239.
45. Zhang X, Paganelli FL, Bierschenk D, Kuipers A, Bonten MJ, WillemsRJ, van Schaik W. 2012. Genome-wide identification of ampicillin resis-tance determinants in Enterococcus faecium. PLoS Genet 8:e1002804. http://dx.doi.org/10.1371/journal.pgen.1002804.
46. Teng F, Kawalec M, Weinstock GM, Hryniewicz W, Murray BE. 2003.An Enterococcus faecium secreted antigen, SagA, exhibits broad-spectrumbinding to extracellular matrix proteins and appears essential for E. fae-cium growth. Infect Immun 71:5033–5041. http://dx.doi.org/10.1128/IAI.71.9.5033-5041.2003.
47. Aakra A, Vebo H, Snipen L, Hirt H, Aastveit A, Kapur V, Dunny G,Murray BE, Nes IF. 2005. Transcriptional response of Enterococcus faeca-lis V583 to erythromycin. Antimicrob Agents Chemother 49:2246 –2259.http://dx.doi.org/10.1128/AAC.49.6.2246-2259.2005.
48. Tran SL, Guillemet E, Gohar M, Lereclus D, Ramarao N. 2010. CwpFM(EntFM) is a Bacillus cereus potential cell wall peptidase implicated inadhesion, biofilm formation, and virulence. J Bacteriol 192:2638 –2642.http://dx.doi.org/10.1128/JB.01315-09.
49. Mohamed JA, Teng F, Nallapareddy SR, Murray BE. 2006. Pleiotrophiceffects of 2 Enterococcus faecalis sagA-like genes, salA and salB, which en-code proteins that are antigenic during human infection, on biofilm for-mation and binding to collagen type I and fibronectin. J Infect Dis 193:231–240. http://dx.doi.org/10.1086/498871.
Paganelli et al.
6882 aem.asm.org October 2015 Volume 81 Number 19Applied and Environmental Microbiology
on March 14, 2018 by guest
http://aem.asm
.org/D
ownloaded from