Distinct representations of phonemes, syllables - Aix Marseille
32
1 Distinct representations of phonemes, syllables, and supra-syllabic sequences in the speech production network. (Running title: Sublexical representations in the speech network) Maya G. Peeva 1 , Frank H. Guenther 1,2 , Jason A. Tourville 1 , Alfonso Nieto- Castanon 1 , Jean-Luc Anton 3 , Bruno Nazarian 3 , F.-Xavier Alario 4 1 Department of Cognitive and Neural Systems, Boston University, 677 Beacon Street, Boston, MA, 02215, USA 2 Division of Health Sciences and Technology, Harvard University – Massachusetts Institute of Technology, Cambridge, MA 02139, USA 3 FMRI Center of Marseille, CNRS IFR 131, Marseille, France 4 Cognitive Psychology Lab, Aix-Marseille University and CNRS UMR 6146, Marseille, France Correspondence: Maya Peeva Department of Cognitive and Neural Systems, Boston University, 677 Beacon Street Boston, MA 02215 Email: [email protected] Phone: 617-849-2914 Fax: (617) 353-7755 Abstract Functional neuroimaging studies have converged on a core network of brain regions that supports speech production, but the sublexical processing stages performed by the different parts of this network remain unclear. Using an fMRI adaptation paradigm and quantitative analysis of patterns of activation rather than contrast subtractions alone, we were able to identify a set of neural substrates predominantly engaged in phonemic, syllabic, and supra-syllabic levels of processing during speech. Phoneme-level processes were found in the left SMA, pallidum, posterior superior temporal gyrus, and superior lateral cerebellum. Syllable-level processes were found in left ventral premotor cortex, and supra-syllabic processes related to sequencing were found in the right superior lateral cerebellum. Active regions that were not sensitive to sublexical manipulations included primary motor and auditory cortical areas, and medial cerebellum. These results offer a quantitative technique for localizing sublexical neural processes that are difficult to dissociate using non-invasive imaging techniques and provide the beginnings of a “brain map” for language output. Keywords: fMRI, speech, premotor cortex, SMA
Transcript of Distinct representations of phonemes, syllables - Aix Marseille

1
Distinct representations of phonemes, syllables, and supra-syllabic sequences in the speech production network. (Running title: Sublexical representations in the speech network) Maya G. Peeva1, Frank H. Guenther1,2, Jason A. Tourville1, Alfonso Nieto-Castanon1, Jean-Luc Anton3, Bruno Nazarian3, F.-Xavier Alario4 1Department of Cognitive and Neural Systems, Boston University, 677 Beacon Street, Boston, MA, 02215, USA 2Division of Health Sciences and Technology, Harvard University – Massachusetts Institute of Technology, Cambridge, MA 02139, USA 3FMRI Center of Marseille, CNRS IFR 131, Marseille, France 4Cognitive Psychology Lab, Aix-Marseille University and CNRS UMR 6146, Marseille, France Correspondence: Maya Peeva Department of Cognitive and Neural Systems, Boston University, 677 Beacon Street Boston, MA 02215 Email: [email protected] Phone: 617-849-2914 Fax: (617) 353-7755 Abstract
Functional neuroimaging studies have converged on a core network of brain regions that supports speech production, but the sublexical processing stages performed by the different parts of this network remain unclear. Using an fMRI adaptation paradigm and quantitative analysis of patterns of activation rather than contrast subtractions alone, we were able to identify a set of neural substrates predominantly engaged in phonemic, syllabic, and supra-syllabic levels of processing during speech. Phoneme-level processes were found in the left SMA, pallidum, posterior superior temporal gyrus, and superior lateral cerebellum. Syllable-level processes were found in left ventral premotor cortex, and supra-syllabic processes related to sequencing were found in the right superior lateral cerebellum. Active regions that were not sensitive to sublexical manipulations included primary motor and auditory cortical areas, and medial cerebellum. These results offer a quantitative technique for localizing sublexical neural processes that are difficult to dissociate using non-invasive imaging techniques and provide the beginnings of a “brain map” for language output. Keywords: fMRI, speech, premotor cortex, SMA
2
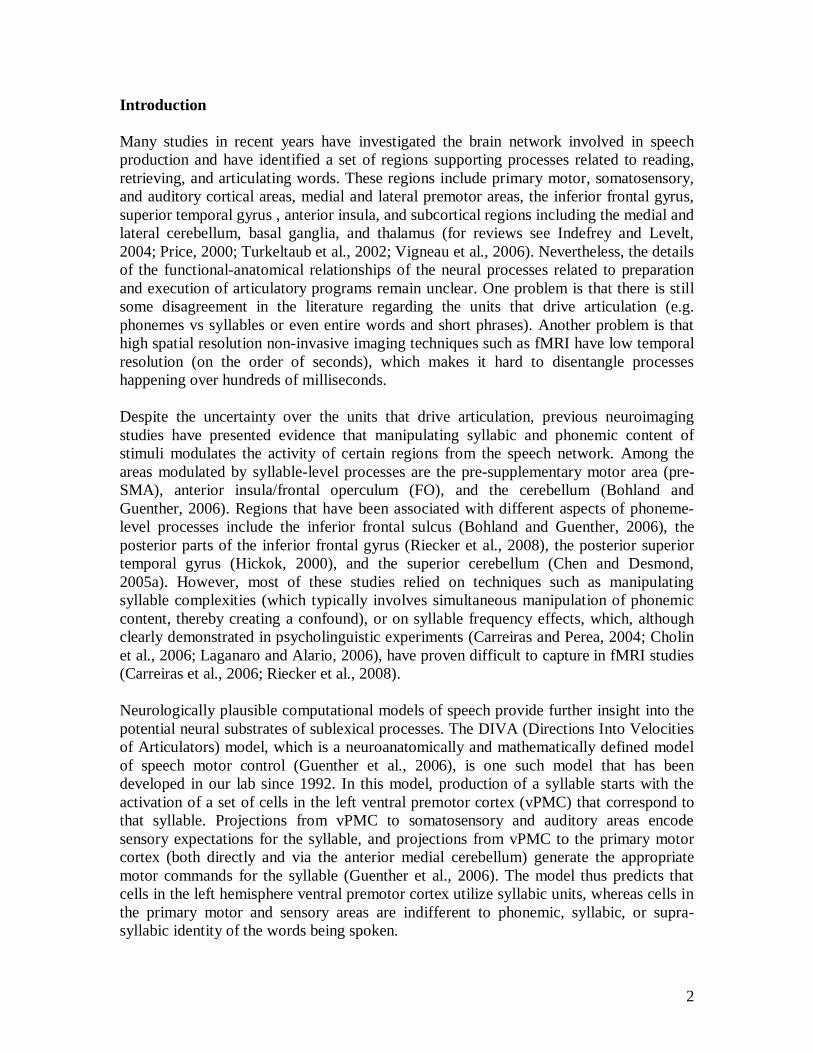
Introduction Many studies in recent years have investigated the brain network involved in speech production and have identified a set of regions supporting processes related to reading, retrieving, and articulating words. These regions include primary motor, somatosensory, and auditory cortical areas, medial and lateral premotor areas, the inferior frontal gyrus, superior temporal gyrus , anterior insula, and subcortical regions including the medial and lateral cerebellum, basal ganglia, and thalamus (for reviews see Indefrey and Levelt, 2004; Price, 2000; Turkeltaub et al., 2002; Vigneau et al., 2006). Nevertheless, the details of the functional-anatomical relationships of the neural processes related to preparation and execution of articulatory programs remain unclear. One problem is that there is still some disagreement in the literature regarding the units that drive articulation (e.g. phonemes vs syllables or even entire words and short phrases). Another problem is that high spatial resolution non-invasive imaging techniques such as fMRI have low temporal resolution (on the order of seconds), which makes it hard to disentangle processes happening over hundreds of milliseconds. Despite the uncertainty over the units that drive articulation, previous neuroimaging studies have presented evidence that manipulating syllabic and phonemic content of stimuli modulates the activity of certain regions from the speech network. Among the areas modulated by syllable-level processes are the pre-supplementary motor area (pre-SMA), anterior insula/frontal operculum (FO), and the cerebellum (Bohland and Guenther, 2006). Regions that have been associated with different aspects of phoneme-level processes include the inferior frontal sulcus (Bohland and Guenther, 2006), the posterior parts of the inferior frontal gyrus (Riecker et al., 2008), the posterior superior temporal gyrus (Hickok, 2000), and the superior cerebellum (Chen and Desmond, 2005a). However, most of these studies relied on techniques such as manipulating syllable complexities (which typically involves simultaneous manipulation of phonemic content, thereby creating a confound), or on syllable frequency effects, which, although clearly demonstrated in psycholinguistic experiments (Carreiras and Perea, 2004; Cholin et al., 2006; Laganaro and Alario, 2006), have proven difficult to capture in fMRI studies (Carreiras et al., 2006; Riecker et al., 2008). Neurologically plausible computational models of speech provide further insight into the potential neural substrates of sublexical processes. The DIVA (Directions Into Velocities of Articulators) model, which is a neuroanatomically and mathematically defined model of speech motor control (Guenther et al., 2006), is one such model that has been developed in our lab since 1992. In this model, production of a syllable starts with the activation of a set of cells in the left ventral premotor cortex (vPMC) that correspond to that syllable. Projections from vPMC to somatosensory and auditory areas encode sensory expectations for the syllable, and projections from vPMC to the primary motor cortex (both directly and via the anterior medial cerebellum) generate the appropriate motor commands for the syllable (Guenther et al., 2006). The model thus predicts that cells in the left hemisphere ventral premotor cortex utilize syllabic units, whereas cells in the primary motor and sensory areas are indifferent to phonemic, syllabic, or supra-syllabic identity of the words being spoken.

3
In the present study we took some of the more common speech units believed to drive articulation – phonemes, syllables, and supra-syllabic sequences – and looked within the speech network for regions that are particulalry tuned to implement processes related to those units. Psycholinguistic research has highlighted the role played by phoneme and syllable sized units in speech production (Houde and Jordan, 1998). Phonemes are often involved in slips of the tongue (e.g. uttering “heft lemisphere”, for “left hemisphere”; see the classic studies by (Fromkin, 1971; Garrett, 1975; Shattuck-Hufnagel, 1983). This suggests that phonemes are retrieved individually at some stage in the speech production process. Similarly, Houde and Jordan (1998) showed that when participants are presented with perturbed auditory feedback of their ongoing vowel pronunciation, they change the way they produce the vowel to compensate for the perturbation and this change can carry over to syllables other than the perturbed syllable. They interpreted their results to suggest that the phoneme has a distinct neural representation. Syllables have also been shown to be functional units of speech production in a number of studies (Laganaro and Alario, 2006; Levelt and Wheeldon, 1994). Nevertheless, it is still largely unclear how these sublexical processes are implemented at the neural level and combined to drive the final speech motor programs during articulation. In order to investigate the levels of phonological processing that the different brain regions of the speech production network subserve, we employed an imaging protocol that takes advantage of the observed decrease of hemodynamic response to repeated stimuli, a phenomenon known as fMRI repetition suppression (fMRI-RS), also known as fMRI adaptation, habituation, or repetition priming (Grill-Spector et al., 2006; Grill-Spector and Malach, 2001; Henson, 2003). Many studies have suggested that the reduction of signal following repetition is stimulus-specific and occurs in regions that are a subset of those regions that were most active during the initial stimulus presentation, providing evidence for the functional-anatomic selectivity of the fMRI signal attenuation (Buckner et al., 1998; Grill-Spector and Malach, 2001; Rice et al., 2007). Moreover, fMRI-RS signal attenuation has been shown to be related to the actual processing of the stimuli and not to effects such as reduced processing load resulting from familiarity with the stimulus (Xu et al., 2007). Finally, fMRI-RS effects are not confined to perceptual processes; previous studies have used successfully fMRI-RS paradigms to look at the functional organization of motor and speech processes (Buckner et al., 2000; Dehaene-Lambertz et al., 2006; Gabrieli et al., 1996; Gold et al., 2005; Majdandzic et al., 2009). In the present experiment we constructed blocks of stimuli (pseudowords) that differed in the repetition rate of phonemes, syllables, or entire pseudowords (supra-syllabic sequences). Pseudowords were used instead of words because of our focus on sublexical processes leading to articulation rather than lexical retrieval or semantic access. We hypothesized that if there are regions that are particularly tuned to one or another of the sublexical processes, then these areas should exhibit differential adaptation patterns depending on which sublexical stimulus features are being repeated. Additionally, we investigated representations at the supra-syllabic sequence level, defined here as whole pseudowords (with the implicit understanding that these representations relate to the formation of sequences of phonemes and/or syllables in real multi-syllabic words or short
4
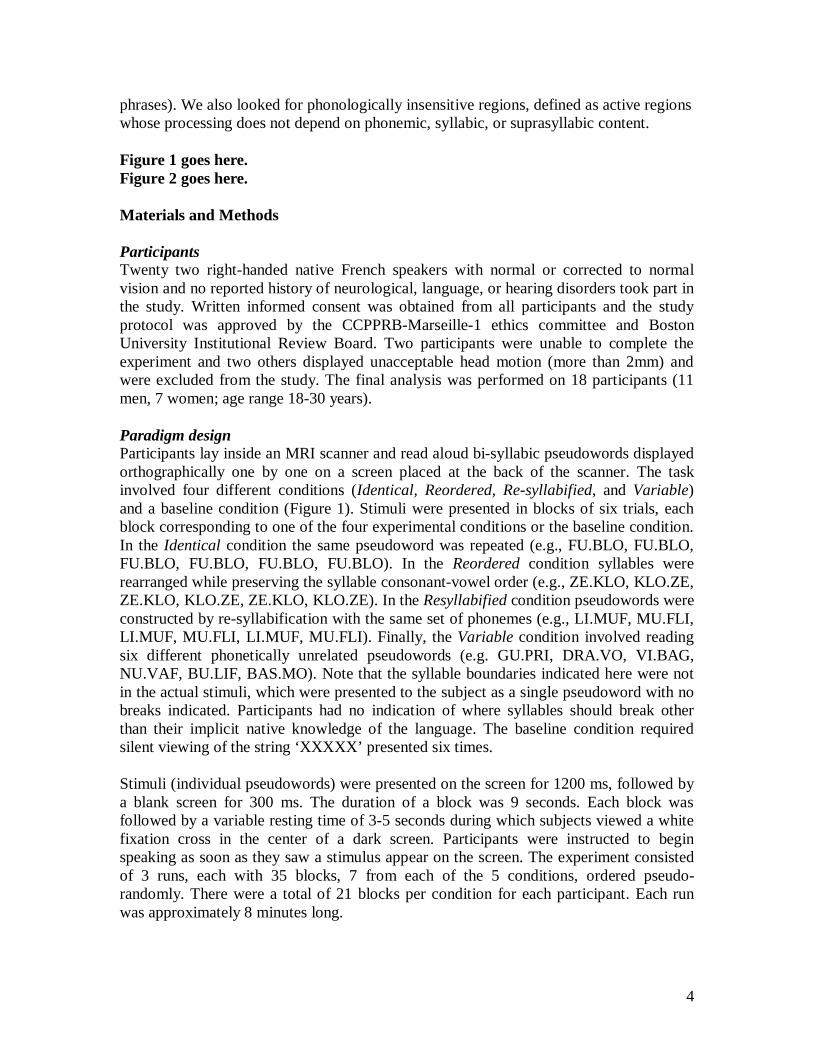
phrases). We also looked for phonologically insensitive regions, defined as active regions whose processing does not depend on phonemic, syllabic, or suprasyllabic content. Figure 1 goes here. Figure 2 goes here. Materials and Methods Participants Twenty two right-handed native French speakers with normal or corrected to normal vision and no reported history of neurological, language, or hearing disorders took part in the study. Written informed consent was obtained from all participants and the study protocol was approved by the CCPPRB-Marseille-1 ethics committee and Boston University Institutional Review Board. Two participants were unable to complete the experiment and two others displayed unacceptable head motion (more than 2mm) and were excluded from the study. The final analysis was performed on 18 participants (11 men, 7 women; age range 18-30 years). Paradigm design Participants lay inside an MRI scanner and read aloud bi-syllabic pseudowords displayed orthographically one by one on a screen placed at the back of the scanner. The task involved four different conditions (Identical, Reordered, Re-syllabified, and Variable) and a baseline condition (Figure 1). Stimuli were presented in blocks of six trials, each block corresponding to one of the four experimental conditions or the baseline condition. In the Identical condition the same pseudoword was repeated (e.g., FU.BLO, FU.BLO, FU.BLO, FU.BLO, FU.BLO, FU.BLO). In the Reordered condition syllables were rearranged while preserving the syllable consonant-vowel order (e.g., ZE.KLO, KLO.ZE, ZE.KLO, KLO.ZE, ZE.KLO, KLO.ZE). In the Resyllabified condition pseudowords were constructed by re-syllabification with the same set of phonemes (e.g., LI.MUF, MU.FLI, LI.MUF, MU.FLI, LI.MUF, MU.FLI). Finally, the Variable condition involved reading six different phonetically unrelated pseudowords (e.g. GU.PRI, DRA.VO, VI.BAG, NU.VAF, BU.LIF, BAS.MO). Note that the syllable boundaries indicated here were not in the actual stimuli, which were presented to the subject as a single pseudoword with no breaks indicated. Participants had no indication of where syllables should break other than their implicit native knowledge of the language. The baseline condition required silent viewing of the string ‘XXXXX’ presented six times. Stimuli (individual pseudowords) were presented on the screen for 1200 ms, followed by a blank screen for 300 ms. The duration of a block was 9 seconds. Each block was followed by a variable resting time of 3-5 seconds during which subjects viewed a white fixation cross in the center of a dark screen. Participants were instructed to begin speaking as soon as they saw a stimulus appear on the screen. The experiment consisted of 3 runs, each with 35 blocks, 7 from each of the 5 conditions, ordered pseudo-randomly. There were a total of 21 blocks per condition for each participant. Each run was approximately 8 minutes long.

5
Constraints on material selection (in particular using different consonants within each pseudoword, and following resyllabification rules) necessitated multiple presentations of some blocks to the participants. In the Variable condition, a given block was presented between one and four times. The same block was never used more than twice in the same run. In the other conditions (Identical, Reorder, and Resyllabify) a given block was presented at most twice and never in the same run (a complete list of the stimuli in each block is provided in the Supplementary Materials). Stimuli All stimuli were phonetically legal French bisyllabic pseudowords. Pseudowords were preferred to words because of our focus on sublexical processes rather than lexical access or semantic processes. Neither the pseudowords nor the syllables that composed them are listed as French words in the database Lexique (New et al., 2001). The syllables do exist in French, as they are present in other multi-syllabic words. Syllable frequency was calculated using log transformed token counts in occurrences per million based on the Lexique database. This frequency measure did not differ across the four conditions (F[3-188] = .98, p = .41). The pseudowords consisted of sequences of consonant (C) and vowel (V) phoneme combinations forming common syllabic frames (CV, CCV or CVC; e.g. ‘FU.BLO’). All pseudowords had only one legal breakpoint into syllables of the French language (e.g. in the Re-syllabified condition FU.BLO and LO.FUB are both legal but FUB.LO or LOF.UB are not legal syllabifications). The stimuli had the same number of phonemes. No phoneme or syllable appeared more than once within any pseudoword. A straightforward orthographic transcription was constructed for each item. There was a variable number of letters in these transcriptions (between 5 and 7); whereas most French phonemes can be transcribed with one letter, some are naturally transcribed with two letters. fMRI data acquisition Imaging was performed on a 3-Tesla MRI whole body scanner (Bruker Medspec). Participants lay supine on the scanner bed with foam padding applied between the participant’s head and the coil to help constrain head movement. Before entering the scanner, participants practiced reading the pseudowords with minimal articulatory movements and avoiding head motion. The pseudowords used for these practice sessions were not reused during the actual experiment. Inside the scanner, stimuli were projected centrally, white on a black background, at the back of the magnet bore. Participants viewed the projected stimuli through a head-coil mounted mirror placed comfortably in front of their eyes. A high resolution anatomical volume was acquired for each participant (T1 weighted MP-RAGE sequence, TR=11.9 ms, TE = 5.6 ms, flip angle = 30°, voxel size = 0.898 x 1 x 1.42 mm). Functional images were collected using 32 axial slices covering the whole brain (slice thickness = 3 mm; slice gap = 1 mm; field of view = 192 mm2; matrix size 64 x 64; TR 2133.3 ms; TE = 30 ms; flip angle = 79.5°). The slices were oriented parallel to a plane through the anterior and posterior commissures. The continuous sampling design was chosen over sparse sampling design due to the need to induce fMRI adaptation effects through rapid repetition of the presented stimuli. Voxel-wise data analysis

6
All fMRI data were preprocessed and analyzed using the SPM2 software package provided by the Wellcome Department of Imaging Neuroscience, University College London, UK (Friston et al., 1995). The first six scans of each run contained no stimulus information and were discarded to allow for signal stabilization. The remaining functional images were corrected for slice acquisition timing in reference to the middle temporal slice (interlaced acquisition). To correct for motion, a rigid body transformation was applied to each frame in order to realign images within and across runs. Images were realigned with respect to the first functional image of the run temporally closest to the anatomical image acquisition. After realignment, translation and rotation movement parameters were examined for each participant individually, and those participants who exhibited head movements of more than 2mm in any direction were discarded from further analysis (only two such participants were found). Subsequently, images were coregistered with the T1- weighted anatomical dataset (Collignon et al., 1995), and spatially normalized into standard stereotaxic space using the EPI template provided by the Montreal Neurological Institute (Evans et al., 1993; Mazziotta et al., 2001). Finally, all normalized images were spatially smoothed with a 12 mm full-width at half-maximum (FWHM) isotropic Gaussian kernel. This smoothing was applied only during the voxel-wise data analysis and not during the subsequent ROI analysis (see below). Group statistics were assessed using fixed and mixed effects procedures. In fixed-effect analysis, contrast-of-interest images were generated for each participant by comparing the relevant condition parameter estimates on a voxel-by-voxel basis. Five conditions were modeled: Identical, Reordered, Re-syllabified, Variable, and Baseline. Estimates for these analyses were obtained using a general linear model where conditions are treated as fixed effects. The first stimulus of each block was modeled separately from the rest of the block since the first presentation would induce the same response in all conditions. The response at each epoch was convolved with a canonical hemodynamic response function and data were high-pass filtered with a standard filter cutoff frequency of 128s. To avoid artifacts due to possible signal fluctuations, signal normalization was performed by acquiring the mean signal value for each volume from the preprocessed data and introducing these values to our model as an additional regressor for each session. Group effects on all 18 participants were then assessed by treating the participants as random effects and performing one-sample t-tests across the individual contrast images. Effects related to a particular analysis were considered significant if they passed a false discovery rate (FDR), PFDR, < .05. Each individual condition was contrasted with baseline to assess relative activation (Identical - baseline, Reordered - baseline, Re-syllabified - baseline, and Variable - baseline). Additionally, all speaking conditions were combined and contrasted against baseline to determine the average effect across all conditions (Collapsed - baseline). The contrast maps are shown in terms of effect size. The ‘Automated Anatomical Labeling’ (ALL) atlas (Tzourio-Mazoyer et al., 2002) was used to identify labels for activated peaks. The results were projected onto a cortical surface representation of the canonical SPM brain. The surface rendering was obtained using the FreeSurfer software (http://surfer.nmr.mgh.harvard.edu).

7
Region-wise data analysis In addition to the voxel-wise analysis, a region of interest (ROI) analysis was performed to improve statistical power and provide a more accurate mapping of function to anatomical region (Nieto-Castanon et al., 2003). Regions included in the analysis were chosen from among those typically active in speech production studies (Alario et al., 2006; Bohland and Guenther, 2006; Guenther et al., 2006; Indefrey and Levelt, 2004; Price, 2000; Riecker et al., 2008; Tourville et al., 2008; Turkeltaub et al., 2002). These regions included ventral parts of primary motor and somatosensory areas, medial premotor areas, ventral premotor cortex, the inferior frontal gyrus, superior temporal gyrus, anterior insular cortex, the cerebellum, and the basal ganglia. Functionally heterogenic regions such as the inferior frontal gyrus (IFG) that showed variable peak loci in the different speech production studies were subdivided into smaller regions in order to capture the potential differences in activations within the same region. The inclusion of the ventral portions of the primary motor and somatosensory regions is based on the evidence that the motor and sensory states of the articulators are represented mainly in the ventral portions of pre- and post-central gyri (see Guenther et al., 2006, Appendix A for a detailed review). The remaining regions were divided according to anatomical markers into anterior/posterior and superior/inferior portions (see Table 1 for a complete list of ROIs). Parcellation of cortical, subcortical, and cerebellar ROIs from structural MRI scans was performed using the Freesurfer software package. Subcortical ROIs were determined with the FreeSurfer subcortical training set (Fischl et al., 2002). Cortical and cerebellar ROI definitions were determined by training FreeSurfer cortical (Fischl et al., 2004) and subcortical (Fischl et al., 2002) classifiers based on a functional-neuroanatomical atlas tailored for speech studies (Tourville and Guenther, 2003). The cortical ROI boundaries are a modified version of the parcellation system defined by the Center for Morphometric Analysis (CMA) at Massachusetts General Hospital (Caviness et al., 1996). Following spatial realignment, functional data were subjected to a rigid body transform and co-registered with the structural data set. The BOLD response averaged across all voxels within each ROI mask was then extracted. Regional noise temporal correlations were removed by whitening a fit of the estimated noise spectrum within each ROI. Average regional responses for each event were modeled using a canonical hemodynamic response function and the same contrasts as described in the voxel-wise analysis were evaluated. The ROI tools were also used to test for lateralization in particular ROIs. The effect sizes estimated for each subject in the left and right hemisphere for a particular ROI were entered into a paired t-test. Lateralization was considered significant for p < 0.05. Results from the ROI analysis were also used to evaluate the activity patterns described below. Table 1 goes here. Across-condition activity patterns The stimuli and task were chosen to result in different patterns of adaptation across conditions depending on the primary phonological representation (if any) processed by a

8
particular brain region. To assess this quantitatively, we first constructed models of activity across the four conditions for each representation type (Figure 2). In regions where neurons are sensitive to phonemic identity independent of syllabic identity, we expect the first three speaking conditions (all of which utilize the same number of phonemes) to show the same amount of activity; the fourth condition, which contains many more phonemes than the first three conditions, should show less adaptation or, equivalently, higher activity (specifically, effects size) (pattern a, quantified as an expected pattern of [1 1 1 2]). Regions in which processing is dominated by syllable-level units will have equal activity in the first two conditions, higher activity in the third condition, and even higher activity in the fourth condition (pattern b, quantified as [1 1 2 3]). Regions processing supra-syllabic sequences should exhibit activity pattern c ([1 2 2 3]) since in condition one the same pseudoword is repeated, in conditions two and three two different pseudowords are being repeated, and in condition four, six different pseudowords are produced. Regions that are insensitive to any of the investigated phonological representations (phonemes, syllables, and supra-syllabic sequences) are not expected to show a significant difference across conditions (pattern d in Figure 2) since all four conditions were very similar in nature apart from the phonological variations we introduced at the phonemic and syllabic level. Thus the phonologically insensitive regions were expected to exhibit a pattern of activity across the four conditions of [1 1 1 1]. Note that the numbers 1 through 4 simply indicate the rank order of activity; thus [1 1 1 2] and [2 2 2 3] denote the same pattern of activity. One limitation of this design is that if a region processes both phonemic and syllabic units (a combination of patterns a and b), the current design will only allow us to identify the syllable-level processes. Similarly, if a region processes both suprasyllabic sequences and individual phonemes, our design will only allow us to identify the existence of supra-syllabic sequence level processes.. Finally, as a form of control, we constructed an activity pattern that represented the concept of “task difficulty” i.e. regions that are not associated with any particular phonological unit in our study. Although difficulty is a somewhat subjective concept, the current conditions lent themselves to a straightforward estimate of difficulty level as follows. Increasing the elements that repeated within a condition (phonemes, syllables, and pseudowords) was considered to decrease the difficulty of the condition. Thus the Identical condition was viewed as the simplest and the Variable as the most difficult. Similarly, the third condition is more difficult than the second due to the resyllabification requirement. This leads to predicted activity pattern e in Figure 2 for a region whose activity is sensitive to task difficulty but not to any one specific sublexical unit. The Difficulty pattern may also result from a combination of processes related to all units - phonemic, syllabic, and suprasyllabic – and thus a match to this pattern does not automatically imply that a region is not involved in phonological processes.
Model comparison framework: theory For any given set of a priori models {M1 … Mm}, where each model Mi can be characterized by a set of inter-related hypotheses {Hi1…Hin}, we define pij as the estimated p-value (false positive level under null hypothesis Hij) of a chosen statistical

9
test assessing the j-th hypothesis of the i-th model. For each model Mi we then define a simple measure of fit as:
ijji pmin
This measure represents the p-value of a standard conjunction test for multiple hypotheses. We then define the model-level p-value Pi from the expected distribution of i values under any alternative model:
ik
kiii Mprobm
P )|(1
1
This distribution is computed numerically using Monte Carlo simulations of the alternative models Mk (k≠i). For each simulation of an alternative model Mk the resulting value of the fit measure i is computed, and the conditional cumulative distribution function prob(∙) of the resulting i values is empirically estimated by accumulation over multiple simulations. The resulting model-level p-values Pi can be interpreted in the usual way as the false positive level of a test for each model under the null hypothesis of an alternative model.
Model comparison framework: application This model comparison framework was used to characterize each region of interest across-condition pattern of BOLD responses. Five models were used (phonologically-insensitive, phonemic, syllabic, supra-syllabic, and difficulty). Each model was characterized by six hypotheses, defining the presence and expected directionality of each pairwise contrast comparing the BOLD response between each pair of baseline conditions (among four baseline conditions). Individual hypothesis tests consisted of second-level (across-subjects) t-tests (n=18). The hypothesis-level p-values pij were defined as:
1) )1,min(2 pppij for any hypothesis Hij with expected pattern A=B
2) ppij for any hypothesis Hij with expected pattern A<B
3) ppij 1 for any hypothesis Hij with expected pattern A>B
where the value p represents the p-value of a one-sided t-test comparing the conditions A and B. Monte Carlo simulations for the empirical estimation of the expected distribution of model-fit values were then computed using Gaussian random noise with means defined by each model’s expected across-condition activity pattern. Noise means were scaled by a factor equal to the 95-th percentile of the observed between-condition BOLD differences across all regions. Noise variances were matched to the observed between-subject variance in BOLD responses averaged across all regions and conditions. Empirical conditional cumulative distributions for each model-level test were computed from a total of 5000 Monte Carlo simulations, and used to derive model-level p-values from the data model-fits. The resulting model-level p-values Pi were reported for each region. Only region/model pairs with p-values below .05 are considered significant.

10
Results Pseudoword production network Reading pseudowords compared to the baseline condition (Collapsed - baseline) activated a network of regions commonly seen in a number of previous neuroimaging studies of speech production (Guenther et al., 2006; Indefrey and Levelt, 2004; Price, 2000; Riecker et al., 2008; Tourville et al., 2008; Turkeltaub et al., 2002). The voxel-wise activity analysis (Figure 3 and Table 2) showed peak activations in bilateral pre- and post-central gyri, bilateral superior temporal gyrus (STg), the medial premotor cortex (near the border of SMA and pre-SMA), and left insula near the opercular portion of the inferior frontal gyrus. Subcortical activations included bilateral putamen and right pallidum. There was also cerebellar activity in Lobule VI bilaterally, in Crus I on the left and Crus II on the right. The location of activity was similar in each individual speaking condition compared to baseline, though relatively minor differences existed (see Table 2). The results of region-of-interest (ROI) analysis largely paralleled those of the voxel-wise analysis (Table 3). The Collapsed – baseline contrast showed bilateral activations in the ventral motor cortex (vMC) and ventral somatosensory cortex (vSC), the supplementary motor area (SMA), the ventral premotor cortex (vPMC), ventral portions of the inferior frontal opercularis (vIFo), the frontal operculum (FO), superior temporal gyrui and sulci, Heschl’s gyrus (Hg), the anterior medial cerebellum (amCB) and lateral cerebellum (splCB, including Crus I and Lobule VI), and the basal ganglia (putamen and pallidum). Lateralized activations were observed in right pre-SMA, right ventral inferior frontal triangularis (vIFt), left anterior insula (aINS), and left anterior supramarginal gyrus (aSMg). A few areas were active in one or more of the individual speaking conditions contrasted with baseline but not in the Collapsed – baseline contrast. These regions and the respective baseline contrasts in which they were active were as follows: left pre-SMA (Variable), left anterior inferior frontal sulcus (aIFs, Variable), left dIFo (Variable), right dIFo (Repeated) bilateral parietal operculum (PO, Repeated), right aINS (Repeated), and right aSMg (Repeated). The remaining regions included in our ROI analysis did not show significant activations in any of the baseline contrasts. These regions included bilateral posterior inferior frontal sulcus (pIFs), dorsal inferior frontal triangularis (dIFt), anterior lateral cerebellum (alCB), inferior posterior medial cerebellum (ipmCB), caudate (Caud), and thalamus (Tha) as well as right anterior inferior frontal sulcus (aIFs) and left ventral frontal triangularis (vIFt). Figure 3 goes here. Table 2 goes here. Table 3 goes here Across-condition activity comparisons The activity of ROIs that were significant in at least one of the speech vs. baseline contrasts was compared to the model patterns shown in Figure 2. Fourty eight regions

11
met this criterion (with ROIs that were bilaterally active counting twice in this count). Of these, eleven regions were found to significantly match at least one of the five predicted patterns (P < 0.05; Figures 4 and 5 show the observed activity pattern for each of these ROIs and the best matching predicted pattern). Regions exhibiting across-conditions activity similar to the phonemic predicted pattern were left lateralized and included SMA, pallidum, posterior STg (pSTg), and the superior lateral cerebellum. The syllabic pattern was matched only by the left ventral premotor cortex (vPMC). Activity related to supra-syllabic sequences was observed only in the right superior lateral cerebellum (splCB). Three regions showed activity unaffected by the phonological content of the stimuli (i.e., they exhibited the phonologically-insensitive pattern of activity): left vMC, left amCB, and right Hg. Activity patterns for the remaining thirty seven ROIs that did not significantly match any of the predicted patterns are provided in the Supplementary Materials. Figure 4 goes here. Figure 5 goes here. Discussion The results of the present study distinguish a number of speech regions preferentially engaged in processes related to phonemes, syllables, and supra-syllabic sequences during speech production. Additional regions engaged in processes that are insensitive to these phonological representations were also identified. The quantitative methods applied here rely on the effectiveness of fMRI repetition suppression (fMRI-RS) to produce stimulus specific signal attenuation in the regions that are engaged with processing the phonological units that are the focus of the current study. Previous fMRI-RS studies have demonstrated that signal attenuation effects are specific to the repeated stimuli and even the individual features within those stimuli (Buckner et al., 1998; Grill Spector et al., 2001; Rice 2007). Moreover, evidence from multiple previous studies shows that the fMRI-RS phenomenon is not restricted to repeated perceptual processing of identical stimuli but rather to repeated engagement of neural resources in processing specialized information, whether that is a perceptual analysis or a higher cognitive task such as word retrieval, semantic encoding, sentence processing, or motor planning (Buckner et al., 2000; Dehaene-Lambertz, 2006; Gabrieli et al., 1996; Gold et al, 2005; Majdandzic et al., 2009; Xu et al, 2007). We applied fMRI-RS in combination with a quanitative analysis of across condition activity pattern evaluation and definition of ROIs using an anatomical brain parcellation process tailored to speech studies. In this manner we were able to single out speech regions that are predominantly engaged in processes related to phonemes, syllables, and supra-syllabic sequences. However, the current methods do not allow us to probe regions that subserve multiple phonological processes in a complex fashion or a group or regions with different functions that fall within one ROI. Thus, our discussion focuses on those regions whose activity was dominated by processes related to one or another of the units that are the focus of our study without presuming that the rest of the speech regions are not involved in such processes.

12
SMA - basal ganglia circuit Regions matching the phonemic pattern included two areas involved in a medial premotor cortico-basal-ganglia-thalamo-cortical loop: the left SMA and the left globus pallidus (one of the output structures of the basal ganglia). While the SMA is consistently shown active in speech studies involving a variety of tasks, conclusive evidence of the organization of SMA in speech is still largely lacking. Based on what is known about this area, specifically that it is very strongly involved in motor control, we hypothesize that the SMA-BG loop is involved in the generation of phoneme-level motor programs (see also Guenther et al., 2006). More specifically, we hypothesize that the left SMA is involved in the initiation of the subsequent phoneme-level motor program with the help of the basal ganglia, which inhibits competing phonemic motor programs and disinhibits the upcoming phoneme in the utterance. Some evidence for this interpretation of the present results comes from previous motor and speech studies. On one hand, non-human electrophysiological studies indicate that the SMA plays an important role in the initiation of motor programs (Hoshi and Tanji, 2004; Shima and Tanji, 2000). Moreover, neuroimaging studies of speech have previously implicated SMA in the initiation of speech motor programs. When contrasting trials where a response has to be produced (Go trials) with those requiring no actual response (NoGo trials), the SMA is active for Go but not for NoGo trials in which speakers only prepare the utterance without overtly producing it (Alario et al., 2006; Bohland and Guenther, 2006). One controversy worth noting here is that in a mata-analysis of fMRI speech studies Indefrey and Levelt (2004) had identified the right and not the left SMA to be involved in phonetic encoding and articulation. One explaination for this controversy may be that their criterion for the areas involved in articulatory planning was less robust than for the other speech production categories due to the difficulty to identify regions involved in articulatory processes using their method of analysis. This is further evident from the fact that the phonetic encoding and articulation classification produced a number of unexpected regions for this category. We therefore believe that the Indefrey and Levelt (2004) meta analysis does not address definitively the question of what regions are involved in articulatory processes. While the present results do not argue against the involvement of right SMA in speech production (indeed the right SMA was active in both the voxel-wise and ROI-based analyses) they present evidence that left SMA is involved in phoneme-level articulatory processes. The right SMA did not match any of the activation patterns that we had constructed but it could be involved in articulation in a more complex mix of processes that our study design cannot detail. Thus we restrict our discussion to the left SMA-BG circuit. The basal ganglia on the other hand is believed to be involved in the inhibition of undesired movements (both sequential and general) while simultaneously removing inhibition focally from the currently desired movements (Mink, 1996). The latter theory also proposes that the movements themselves are generated by cortical and cerebellar areas. In speech, the basal ganglia have been previously hypothesized to be involved in aspects of cortical initiation of phonological representations (Booth et al., 2007). Anatomically, the globus pallidus receives fast excitatory input from the subthalamic neucleus (STN) which in turn receives direct projections from motor and premotor areas
13
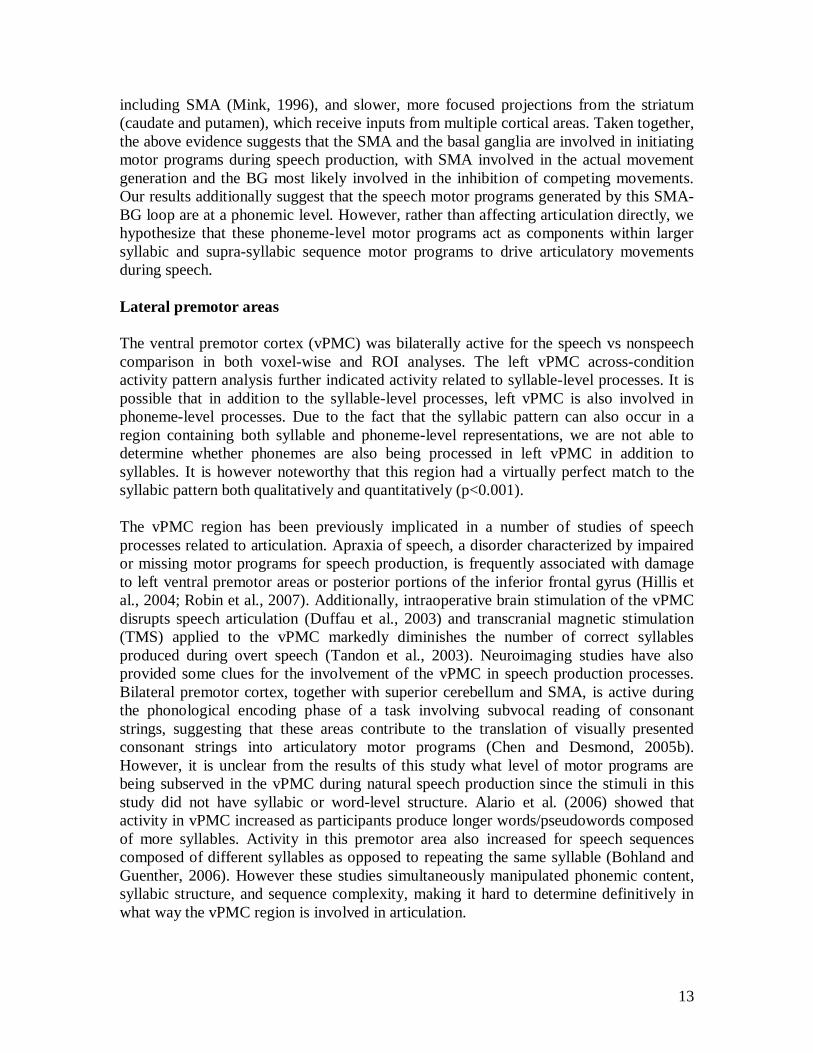
including SMA (Mink, 1996), and slower, more focused projections from the striatum (caudate and putamen), which receive inputs from multiple cortical areas. Taken together, the above evidence suggests that the SMA and the basal ganglia are involved in initiating motor programs during speech production, with SMA involved in the actual movement generation and the BG most likely involved in the inhibition of competing movements. Our results additionally suggest that the speech motor programs generated by this SMA-BG loop are at a phonemic level. However, rather than affecting articulation directly, we hypothesize that these phoneme-level motor programs act as components within larger syllabic and supra-syllabic sequence motor programs to drive articulatory movements during speech. Lateral premotor areas The ventral premotor cortex (vPMC) was bilaterally active for the speech vs nonspeech comparison in both voxel-wise and ROI analyses. The left vPMC across-condition activity pattern analysis further indicated activity related to syllable-level processes. It is possible that in addition to the syllable-level processes, left vPMC is also involved in phoneme-level processes. Due to the fact that the syllabic pattern can also occur in a region containing both syllable and phoneme-level representations, we are not able to determine whether phonemes are also being processed in left vPMC in addition to syllables. It is however noteworthy that this region had a virtually perfect match to the syllabic pattern both qualitatively and quantitatively (p<0.001). The vPMC region has been previously implicated in a number of studies of speech processes related to articulation. Apraxia of speech, a disorder characterized by impaired or missing motor programs for speech production, is frequently associated with damage to left ventral premotor areas or posterior portions of the inferior frontal gyrus (Hillis et al., 2004; Robin et al., 2007). Additionally, intraoperative brain stimulation of the vPMC disrupts speech articulation (Duffau et al., 2003) and transcranial magnetic stimulation (TMS) applied to the vPMC markedly diminishes the number of correct syllables produced during overt speech (Tandon et al., 2003). Neuroimaging studies have also provided some clues for the involvement of the vPMC in speech production processes. Bilateral premotor cortex, together with superior cerebellum and SMA, is active during the phonological encoding phase of a task involving subvocal reading of consonant strings, suggesting that these areas contribute to the translation of visually presented consonant strings into articulatory motor programs (Chen and Desmond, 2005b). However, it is unclear from the results of this study what level of motor programs are being subserved in the vPMC during natural speech production since the stimuli in this study did not have syllabic or word-level structure. Alario et al. (2006) showed that activity in vPMC increased as participants produce longer words/pseudowords composed of more syllables. Activity in this premotor area also increased for speech sequences composed of different syllables as opposed to repeating the same syllable (Bohland and Guenther, 2006). However these studies simultaneously manipulated phonemic content, syllabic structure, and sequence complexity, making it hard to determine definitively in what way the vPMC region is involved in articulation.

14
The present study extends these findings by providing evidence that the engagement of left vPMC in articulation involves syllable-level processes (although phoneme-level processes may also be mediated by this region). As previously mentioned during discussion of SMA, implicating left vPMC in syllable-level processes does not imply that the final stage articulatory movements are solely guided by this sublexical unit; instead it appears from our results that phoneme-level information from SMA and syllable-level information from ventral premotor cortex converge on primary motor cortical cells that are indifferent to phonemic content.. The involvement of left vPMC in syllable level processing was explicitly predicted by the DIVA model (Guenther et al., 2006), which posits that the left ventral premotor cortex contains a speech sound map whose cells represent syllabic motor programs. An important issue for future study is how the medial premotor circuit, the lateral premotor circuit, primary motor cortex, and the superior cerebellum (see Cerebellum section) interact to transform phonemic, syllabic, and sequence-level processes into the finely orchestrated movements of the lips, jaw, tongue, and other articulators that underlie speech. These interactions are likely responsible for the process of coarticulation, in which articulator movements corresponding to neighboring phonemes in a speech sequence are overlapped in order to achieve highly optimized articulator movements for frequently occurring phoneme strings. Based on the current results we hypothesize that the medial premotor circuit, in association with the BG, is involved in initiating motor sub-programs (corresponding to phonemes), whereas the lateral premotor areas are involved in “stitching” these subprograms into an optimized syllabic motor program, with the cerebellum involved in the refinement of the final movements. Stated in terms of the gestural view of speech production (Browman and Goldstein, 1989; Saltzman and Munhall, 1989), one might view the SMA representation as corresponding to phoneme-specific articulatory gestures such as lip protrusion during production of the vowel “oo”, whereas ventral premotor cortex is involved in generating the “gestural score” that specifies the timing and overlap of these individual gestures. Further investigation is needed to verify these interpretations. Cerebellum Superior portions of the cerebellar cortex (Crus I and Lobule VI) were active for speech compared to silent viewing of meaningless strings in our voxel-wise analysis and our ROI analysis. The activity pattern analysis further detailed the possible contributions of subregions of the cerebellum during overt speech. More specifically, phoneme-level activity was present in the left superior posterior lateral cerebellum (splCB) while right splCB showed activity related to the suprasyllabic sequence structure of either phonemes or syllables. These two regions were distinguished from a more anteromedial part of the cerebellum whose activity appeared unmodulated by phonemic or syllabic content. Activity in bilateral superior cerebellum has been previously shown to be modulated by phonemes as well as sequences of phonemes and syllables. Bohland and Guenther (2006) found bilateral superior cerebellum to be active for the production of sequences of syllables, with increased activity for sequences composed of syllables of more complex

15
structure (e.g. CCCV vs CV) and increased activity during overt articulation than during preparation alone (Bohland and Guenther, 2006). In a rhyming task of orthographically presented pairs of words and pseudowords, superior cerebellum appeared more active in the pseudoword rhyming condition compared to word rhyming, suggesting that more familiar sequences of phonemes pose less demand on the superior cerebellum during phonologic assembly (Fulbright et al., 1999). Chen and Desmond (2005a) found concomitant bilateral activity in Lobule VI/Crus I of the cerebellum and the ventral premotor cortex for a motoric rehearsal task involving sub-vocal reading of consonants. In a subsequent study they were able to show that the right superior cerebellum (together with SMA and bilateral precentral regions) was active specifically during the encoding phase of the task (Chen and Desmond, 2005b). The authors interpret their results to indicate that the superior cerebellum is involved in articulatory encoding, specifically, in the rapid conversion of visual to phonological code during letter reading. Our results support this hypothesis and further indicate that function in the superior cerebellum is hemisphere-specific, with left splCB being involved at the phoneme level codes while right splCB activity is influenced by the supra-syllabic context in which individual phonemes or syllables occur. It is possible that right splCB adjusts articulatory codes depending on the specific context in which phonemes and syllables occur, contributing in this way to the coarticulation mechanism. A role of the cerebellum in adjusting speech motor programs has been previously prpoposed by Booth et al. (2007) who, based on their fMRI and dynamic causal modeling results, propose that the cerebellum is involved in the amplification and refinement of speech movements. Temporal lobe Bilateral superior temporal gyrus was active for the speech vs non-speech comparison in both our voxel-wise and ROI analyses but only the left posterior superior temporal gyrus (pSTG) matched one of the investigated activity patterns, corresponding to phoneme-level processes. The pSTG region has been implicated in both speech perception and speech production. Since our participants were hearing their responses it is possible that activity in this region was affected by either perception (i.e. self-monitoring) or production processes or both. It has been previously suggested that pSTg is implicated in phonemic-level processes employed during speech production even when there is no verbal auditory input (Hickok, 2000). Furthermore, the left pSTG has been implicated in reproduction conduction aphasia, a disorder characterized by good auditory comprehension and fluent speech production but frequent phonemic errors in production during repetition, oral reading, spontaneous speech, and naming tasks (Damasio, 1992; Goodglass, 1992), with reproduction conduction aphasia reflecting a primary deficit in phonological encoding (Shallice and Warrington, 1977). Although the classic explanation for conduction aphasia is disconnection syndrome (due to arcuate fasciculus damage), more recent evidence has suggested that conduction aphasia is caused by cortical lesions in the pSTG area resulting in damage to the computational systems important for phonemic processes in speech (Hickok et al., 2000). Finally, the left lateralization of the phonemic pattern in pSTG is in line with studies showing left pSTG-focused activity during the phonological encoding stage of a picture naming task (Levelt et al., 1998) as
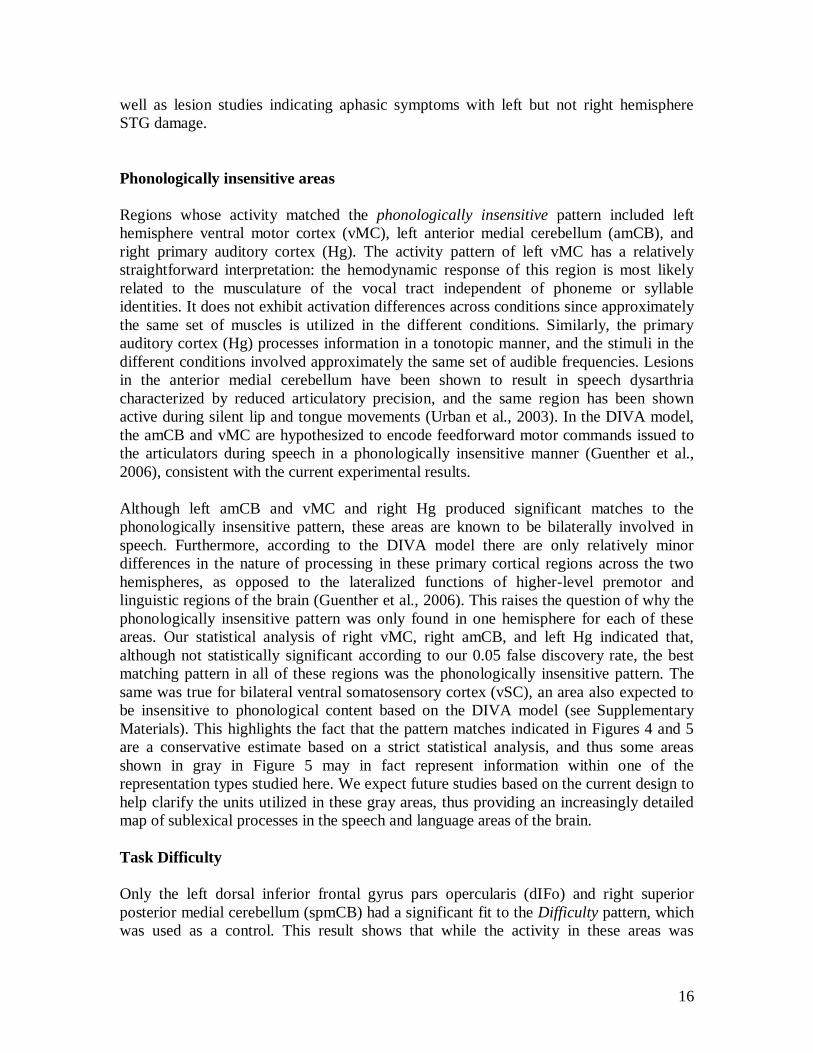
16
well as lesion studies indicating aphasic symptoms with left but not right hemisphere STG damage. Phonologically insensitive areas Regions whose activity matched the phonologically insensitive pattern included left hemisphere ventral motor cortex (vMC), left anterior medial cerebellum (amCB), and right primary auditory cortex (Hg). The activity pattern of left vMC has a relatively straightforward interpretation: the hemodynamic response of this region is most likely related to the musculature of the vocal tract independent of phoneme or syllable identities. It does not exhibit activation differences across conditions since approximately the same set of muscles is utilized in the different conditions. Similarly, the primary auditory cortex (Hg) processes information in a tonotopic manner, and the stimuli in the different conditions involved approximately the same set of audible frequencies. Lesions in the anterior medial cerebellum have been shown to result in speech dysarthria characterized by reduced articulatory precision, and the same region has been shown active during silent lip and tongue movements (Urban et al., 2003). In the DIVA model, the amCB and vMC are hypothesized to encode feedforward motor commands issued to the articulators during speech in a phonologically insensitive manner (Guenther et al., 2006), consistent with the current experimental results. Although left amCB and vMC and right Hg produced significant matches to the phonologically insensitive pattern, these areas are known to be bilaterally involved in speech. Furthermore, according to the DIVA model there are only relatively minor differences in the nature of processing in these primary cortical regions across the two hemispheres, as opposed to the lateralized functions of higher-level premotor and linguistic regions of the brain (Guenther et al., 2006). This raises the question of why the phonologically insensitive pattern was only found in one hemisphere for each of these areas. Our statistical analysis of right vMC, right amCB, and left Hg indicated that, although not statistically significant according to our 0.05 false discovery rate, the best matching pattern in all of these regions was the phonologically insensitive pattern. The same was true for bilateral ventral somatosensory cortex (vSC), an area also expected to be insensitive to phonological content based on the DIVA model (see Supplementary Materials). This highlights the fact that the pattern matches indicated in Figures 4 and 5 are a conservative estimate based on a strict statistical analysis, and thus some areas shown in gray in Figure 5 may in fact represent information within one of the representation types studied here. We expect future studies based on the current design to help clarify the units utilized in these gray areas, thus providing an increasingly detailed map of sublexical processes in the speech and language areas of the brain. Task Difficulty Only the left dorsal inferior frontal gyrus pars opercularis (dIFo) and right superior posterior medial cerebellum (spmCB) had a significant fit to the Difficulty pattern, which was used as a control. This result shows that while the activity in these areas was

17
somehow related to the sublexical variations in the stimuli, it is not specific to any one of these sublexical units per se but rather is more correlated with increased neural demands due to increasing task difficulty. Including a task difficulty control pattern was important as many of the same regions that are active in speech tasks, most notably left prefrontal cortical areas, are also active for a variety of cognitive control processes that are not related to speech per se, such as task switching, response conflict, task novelty, and working memory (for review see (Duncan and Owen, 2000). The task difficulty pattern may also result from a combination of processes related to all units - phonemic, syllabic, and suprasyllabic – and thus a match to this pattern does not automatically imply that a region is not involved in phonological processes. Regions with other activity patterns There were also a number of regions that showed significant activity for at least one of the baseline contrasts in the ROI analysis but which did not match any of the investigated patterns; these regions are shown in gray on Fig. 5. Some of these regions may be involved in aspects of the investigated units of speech that were not captured by our paradigm (e.g., syllable frame complexity, which did not vary in our study). Other regions may be involved in processes related to more than one of the investigated phonological units, thus showing no clear match to any one pattern of activity. For example, previous studies have shown that moving posteriorly from anterior IFG to posterior IFG to vPMC, the processes subserved by those regions change in a gradient manner from a mix of semantic and phonological ones, to increasingly restricted to pure phonological ones (Gold et al., 2005). This may explain why vPMC matched a predicted pattern while IFG did not despite the fact that we subdivided this region functionally into four regions shown to activate differentially in speech studies. Similarly, there is clear evidence in the literature that inferior parietal areas are part of the verbal working memory system and participate in translating sensory codes (such as letters or syllables) to motor codes (Hickok and Poeppel, 2007). However, the inferior parietal area has been shown to exhibit a more complex role in speech production involving a mix of processes across multiple language domains (Gold et al, 2005). This study showed that inferior parietal cortex is involved in all three tasks that they investigated (semantic, phonologicval, and letter) and adaptation effects in this area were significant in all three of them. Finally, some of the regions that were included in our ROI analyses because they have been identified as core speech regions in previous studies may subserve speech processes other than the sublexical ones studied here (e.g., lexical word retrieval). Conclusion This study aimed to determine the levels of processing (phonemic, syllabic, suprasyllabic, or phonologically insensitive) carried out by various cortical and subcortical regions involved in speech production using an fMRI repetition suppression paradigm designed to elicit different patterns of activation across experimental conditions depending on which (if any) sublexical representation is utilized in an area. The phonologically insensitive pattern was found in left primary motor cortex, right primary auditory cortex, and left anterior medial cerebellum, suggesting that processing in these
18
regions is not sensitive to phonemic, syllabic, or pseudoword (supra-syllabic) content of spoken utterances. In the left ventral premotor cortex, responses were sensitive to syllabic variations. This result supports the prediction made by the DIVA model of speech production (Guenther et al., 2006) that syllable-level motor programs are represented in left ventral premotor cortical areas. This interpretation is also in keeping with reports from the lesion literature of apraxia of speech with left ventral premotor cortex damage. Phonemic processes involved the largest number of areas, including the left posterior superior temporal gyrus, left SMA and pallidum, and the superior lateral cerebellum bilaterally. Finally, only the right superior lateral cerebellum appeared to represent information in a suprasyllabic form. Taken together, these findings suggest that the medial and lateral premotor regions of the left hemisphere process phonemes and syllables, respectively, and projections from these areas to primary motor cortex transform these sublexical representations into a set of motor commands to the speech articulators. Acknowledgements This work was supported by the National Institute on Deafness and other Communication Disorders (NIDCD grant R01 DC07683, Frank Guenther PI). Imaging was performed at the fMRI center of the Timone Hospital in Marseille (France), with support from the Centre National de la Recherche Scientifique (CNRS). The authors would like to thank Jason Bohland, Simon Overduin, and Muriel Roth for their assistance with this research.

19
References Alario, F. X., Chainay, H., Lehericy, S., and Cohen, L., 2006. The role of the
supplementary motor area (SMA) in word production. Brain Res 1076, 129-143. Bohland, J. W., and Guenther, F. H., 2006. An fMRI investigation of syllable sequence
production. Neuroimage 32, 821-841. Booth, J. R., Wood, L., Lu, D., Houk, J. C., and Bitan, T., 2007. The role of the basal
ganglia and cerebellum in language processing. Brain Research 1133, 136-144. Browman, C. P., and Goldstein, L., 1989. Articulatory gestures as phonologiecal units.
Phonology 6, 201-251. Buckner, R. L., Goodman, J., Burock, M., Rotte, M., Koutstaal, W., Schacter, D., Rosen,
B., and Dale, A. M., 1998. Functional-anatomic correlates of object priming in humans revealed by rapid presentation event-related fMRI. Neuron 20, 285-296.
Buckner, R. L., Koutstaal, W., Schacter, D. L., and Rosen, B. R., 2000. Functional MRI evidence for a role of frontal and inferior temporal cortex in amodal components of priming. Brain 2000, 620-640.
Carreiras, M., Michelli, A., and Price, C. J., 2006. Effects of word and syllable frequency on activation during lexical decision and reading aloud. Human Brain Mapping 27, 963-972.
Carreiras, M., and Perea, M., 2004. Naming pseudowords in Spanish:Effects of syllable frequency. Brain Lang 90, 393-400.
Caviness, V. S., Meyer, J., Makris, N., and Kennedy, D., 1996. MRI-based topographic parcellation of human neocortex: an anatomically specified method with estimate of reliability. J Cogn Neurosci 8, 566-587.
Chen, S. H., and Desmond, J. E., 2005a. Cerebrocerebellar networks during articulatory rehearsal and verbal working memory tasks. Neuroimage 24, 332-338.
Chen, S. H. A., and Desmond, J. E., 2005b. Temporal dynamics of cerebro-cerebellar network recruitment during a cognitive task. Neuropsychologia 43, 1227-1237.
Cholin, J., Levelt, W. J., and Schiller, N. O., 2006. Effects of syllable frequency in speech production. Cognition 99, 205-235.
Collignon, A., Maes, F., Delaere, D., Vandermeulen, D., Suetens, P., and Marchal, G., 1995. Automated multi-modality image registration based on information theory. In Proc. Information Processing in Medical Imaging., Y. Y. Bizais, C. Barillot, and R. Di Paola, eds. (Dordrecht, The Netherlands, Kluwer Academic Publishers), pp. 263-274.
Damasio, A. R., 1992. Aphasia. New Engl J Med 326, 531-539. Dehaene-Lambertz, G., Dehaene, S., Anton, J.-L., Campagne, A., Ciuciu, P., Dehaene,
G., Denghien, I., Jobert, A., LeBihan, D., Sigman, M., et al. 2006. Functional seggregation of cortical language areas by sentence repetition. Human Brain Mapping 27.
Duffau, H., Capelle, L., Denvil, D., Gatignol, P., Sichez, N., Lopez, M., Sichez, J.-P., and Effenterre, R. V., 2003. The role of dominant premotor cortex in language: a study using intraoperative functional mapping in awake patients. Neuroimage 20, 1903-1914.
Duncan, J., and Owen, A., 2000. Common regions of the human frontal lobe recruited by diverse cognitive demands. Trends in Neurosciences 23, 475-483.

20
Evans, A. C., Collins, D. L., Mills, S. R., Brown, E. D., Kelly, R. L., and Peters, T. M., 1993. 3D statistical neuroanatomical models from 305 MRI Volumes. Proceedings of the IEEE Nuclear Science Symposium on Medical Imaging 3, 1813-1817.
Fischl, B., Salat, D. H., Busa, E., Albert, M., Dieterich, M., Haselgrove, C., van der Kouwe, A., Killiany, R., Kennedy, D., Klaveness, S., et al., 2002. Whole brain segmentation: automated labeling of neuroanatomical structures in the human brain. Neuron 33, 341-355.
Fischl, B., van der Kouwe, A., Destrieux, C., Halgren, E., Segonne, F., Salat, D. H., Busa, E., Seidman, L. J., Goldstein, J., Kennedy, D., et al., 2004. Automatically parcellating the human cerebral cortex. Cereb Cortex 14, 11-22.
Friston, K. J., Frith, C. D., Frackowiak, R. S., and Turner, R., 1995. Characterizing dynamic brain responses with fMRI: a multivariate approach. Neuroimage 2, 166-172.
Fromkin, V. A., 1971. The non-anomalous of anomalous utternaces. Language 47, 27- 52.
Fulbright, R. K., Jenner, A. R., Mencl, W. E., Pugh, K. R., Shaywitz, B. A., Shaywitz, S. E., Frost, S. J., Skudlarski, P. R., Constable, T., Lacadie, C. M., et al., 1999. The cerebellum's role in reading: a functional MR imaging study. AJNR Am J Neuroradiol 20, 1925-1930.
Gabrieli, J. D. E., Desmond, J. E., Demb, J. B., Wagner, A. D., Stone, M. V., Vaidya, C. J., and Glover, G. H., 1996. Functional magnetic resonance imaging of semantic memory processes in the frontal lobes. Psychological Science 7, 278-283.
Garrett, M. F., 1975. The analysis of sentence production. In: Bower, G. (Ed.), Psychology of learning and motivation. New York: Academic Press. Gold, B. T., Balota, D. A., Kirchhoff, B. A., and Buckner, R. L., 2005. Common and
dissociable activation patterns associated with controlled semantic and phonological processing: evidence from fMRI adaptation. Cereb Cortex 15, 1438-1450.
Goodglass, H., 1992. Diagnosis of conduscion aphasia. In: Kohn, S.E. (Ed.), Conduction Aphasia. Lawrence Erlbaum Associates, Hillsdale, pp. 39-49.
Grill-Spector, K., Henson, R., and Martin, A., 2006. Repetition and the brain: neural models of stimulus specific effects. Trends Cogn Sci 10, 93-94.
Grill-Spector, K., and Malach, R., 2001. fMR-adaptation: a tool for studying the functional properties of human cortical neurons. Acta Psychol 107, 293-321.
Guenther, F. H., Ghosh, S. S., and Tourville, J. A., 2006. Neural modeling and imaging of the cortical interactions underlying syllable production. Brain Lang 96, 280-301.
Henson, R. N. A., 2003. Neuroimaging studies of priming. Progress in Neurobiology 70, 53-81.
Hickok, G., Erhard, P., Kassubek, J., Helms-Tillery, A., Naeve-Velguth, S., Strupp, J. P., Strick, P. L., and Ugurbil, K., 2000. A functional magnetic resonance imaging study of the role of left posterior superior temporal gyrus in speech production: implications for the explanation of conduction aphasia. Neuroscience Letters 287, 156-160.
Hickok, G., and Poeppel, D., 2007. The cortical organization of speech processing.

21
Nature Rerviews Neuroscience 8, 393-402. Hillis, A. E., Work, M., Barker, P. B., Jacobs, M. A., Breese, E. L., and Maurer, K.,
2004. Re-examining the brain regions crucial for orchestrating speech articulation. Brain 127, 1479-1487.
Hoshi, E., and Tanji, J., 2004. Differential roles of neuronal activity in the supplementary and presupplementary motor areas: from information retrieval to motor planning and execution. J Neurophysiol 92, 3482-3499.
Houde, J. F., and Jordan, M. I., 1998. Sensorimotor adaptation in speech production. Science 279, 1213-1216.
Indefrey, P., and Levelt, W. J., 2004. The spatial and temporal signatures of word production components. Cognition 92, 101-144.
Laganaro, M., and Alario, F. X., 2006. On the locus of the syllable frequency effect in language production. Journal of Memory and Language 55, 178-196.
Levelt, W. J., and Wheeldon, L. R., 1994. Do speakers have access to a mental syllabary? Cognition 50, 239-269.
Levelt, W. J. M., Praamstra, P., Meyer, A. S., Helenius, P., and Salmelin, R., 1998. An MEG study of picture naming. J Cog Neurosci 10, 553-567.
Majdandzic, J., Bekkering, H., van Schie, H. T., and Toni, I., 2009. Movement-specific repetition suppression in ventral and dorsal premotor cortex during action observation. Cerebral Cortex Advance Access.
Mazziotta, J., Toga, A., Evans, A., Fox, P., Lancaster, J., Zilles, K., Woods, R., Paus, T., Simpson, G., Pike, B., et al., 2001. A four-dimensional probabilistic atlas of the human brain. J Am Med Inform Assoc 8, 401-430.
Mink, J. W., 1996. The basal ganglia: focused selection and inhibition of competing motor programs. Prog Neurobiol 50, 381-425.
New, B., Pallier, C., Ferrand, L., and Matos, R., 2001. Une base de données lexicales du français contemporain sur internet: LEXIQUE. Psychologique 101, 447-462.
Nieto-Castanon, A., Ghosh, S. S., Tourville, J. A., and Guenther, F. H., 2003. Region of interest based analysis of functional imaging data. Neuroimage 19, 1303-1316.
Price, C. J., 2000. The anatomy of language: contributions from functional neuroimaging. J Anat 197, 335-359.
Rice, N. J., Valyear, K. F., Goodale, M. A., Milner, A. D., and Culham, J. C., 2007. Orientation sensitivity to graspable objects: an fMRI adaptation study. Neuroimage 36, T87-T93.
Riecker, A., Brendel, B., Ziegler, W., Erb, M., and Ackermann, H., 2008. The influence of syllable onset complexity and syllable frequency on speech motor control. Brain Lang In press.
Robin, D., Jacks, A., and Ramage, A. E., 2007. The neural substrates of apraxia of speech as uncovered by brain imaging: a critical review. In: Ingham, R.J. (Ed.), Neuroimaging in communication sciences and disorders. New York: Plural Publishing, pp, 129-154.
Saltzman, E. L., and Munhall, K. G., 1989. A dynamical approach to gestural patterning in speech production. Ecological Psychology 1, 333-382.
Shallice, T., and Warrington, E., 1977. Auditory-verbal short-term memory impairment and conduction aphasia. Brain Lang 4, 479-491.
Shattuck-Hufnagel, S., 1983. Sublexical units and suprasegmental structure in speech

22
production planning. In: MacNeilage, P.F. (Ed.), The production of speech. New York: Springer, pp. 109-136.
Shima, K., and Tanji, J., 2000. Neuronal activity in the supplementary and presupplementary motor areas for temporal organization of multiple movements. J Neurophysiol 84, 2148-2160.
Tandon, N., Narayana, S., Lancaster, J. L., Brown, S., Dodd, S., Vollmer, D. G., Ingham, R., Ingham, J., Liotti, M., and Fox, P., 2003. CNS resident award: Role of the lateral premotor cortex in articulation. Clinical Neurosurgery 50, 341-349.
Tourville, J.A. and Guenther, F.H., 2003. A cortical and cerebellar parcellation system for speech studies. Boston University Technical Report CAS/CNS-03-022. Boston, MA: Boston University.
Tourville, J. A., Reilly, K. J., and Guenther, F. H., 2008. Neural mechanisms underlying auditory feedback control of speech. Neuroimage 39, 1429-1443.
Turkeltaub, P. E., Eden, G. F., Jones, K. M., and Zeffiro, T. A., 2002. Meta-analysis of the functional neuroanatomy of single-word reading: method and validation. Neuroimage 16, 765-780.
Tzourio-Mazoyer, N., Landeau, B., Papathanassiou, D., Crivello, F., Etard, O., Delcroix, N., Mazoyer, B., and Joliot, M., 2002. Automated anatomical labeling of activations in SPM using a macroscopic anatomical parcellation of the MNI MRI single-subject brain. Neuroimage 15, 273-289.
Urban, P. P., Marx, J., Hunsche, S., Gawehn, J., Vucurevic, G., Wicht, S., Massinger, C., Stoeter, P., and Hopf, H. C., 2003. Cerebellar speech representation: lesion topography in dysarthria as derived from cerebellar ischemia and functional magnetic resonance imaging. Arch Neurol 60, 965-972.
Vigneau, M., Beaucousin, V., Hervé, P. Y., Duffau, H., Crivello, F., Houdé, O., Mazoyer, B., and Tzourio-Mazoyer, N., 2006. Meta-analyzing left hemisphere language areas: Phonology, semantics, and sentence processing. NeuroImage 30, 1414-1432.
Xu, Y., Turk-Browne, N. B., and Chun, M. M., 2007. Dissociating task performance from fMRI repetition attenuation in ventral visual cortex. Journal of Neuroscience 27, 5985-5981.

23
Table 1. Regions of interest (ROIs) included in the statistical analysis. ROI acronym ROI name Rolandic cortex vMC Ventral motor cortex vPMC Ventral premotor cortex SMA Supplementary motor area pre-SMA Pre-supplementary motor area vSC Ventral somatosensory cortex Frontal Cortex aIFs Anterior inferior frontal sulcus pIFs Posterior inferior frontal sulcus vIFt Ventral inferior frontal triangularis dIFt Dorsal inferior frontal triangularis vIFo Ventral inferior frontal opercularis dIFo Dorsal inferior frontal opercularis FO Frontal operculum Temporal Cortex aSTg Anterior superior temporal gyrus pSTg Posterior superior temporal gyrus adSTs Anterior dorsal superior temporal sulcus pdSTs Posterior dorsal superior temporal sulcus Hg Heschl's gyrus PP Planum porale PT Planum temporale PO Parietal operculum pCO Posterior central operculum Insular cortex aINS Anterior insula Parietal aSMg Anterior supramarginal gyrus Cerebellum amCB Anteror medial cerebellum spmCB Superior posterior medial cerebellum splCB Superior posterior lateral cerebellum alCB Anteror lateral cerebellum ipmCB Inferor posterior medial cerebellum Subcortical nuceli Caud Caudate Put Putamen Pal Pallidum Tha Thalamus
ROIs were selected based on consistent findings from previous speech production studies, the present results, and on the DIVA model predictions. The table provides the ROI abbreviated label and its expanded name.

24
Table 2. Peak responses for each individual speaking condition and the collapsed data all compared to baseline. Identical Reordered Re-syllabified Variable Collapsed
Peak voxel (MNI) Peak voxel (MNI) Peak voxel (MNI) Peak voxel MNI Peak voxel MNI Region x y z T x y z T x y z T x y z T x y z T
Rolandic cortex Left Cingulum Mid 0 8 44 6.53 Postcentral -46 -18 42 11.4 -46 -16 42 11.3 -42 -18 42 12.10 -42 -18 42 14.5 -44 -16 42 12.6 Postcentral -56 -14 26 8.42 -56 -14 24 8.55 -56 -14 24 8.71 -52 -12 50 10.2 -56 -14 24 8.9 Precentral -52 -8 32 8.88 -50 -8 32 9.32 -52 2 20 8.1 -50 -8 30 9.36 Supp Motor Area 0 -2 62 9.09 0 -2 62 11.79 -2 0 60 14.8 0 -2 62 12.3 Right Postcentral 48 -10 36 9.63 50 -10 36 10.4 48 -10 36 10.47 48 -10 36 10.8 48 -10 36 10.7 Postcentral 64 0 20 8.01 66 -2 22 8.25 66 2 22 8.58 Precentral 66 6 22 9.36 58 -2 42 9.76 54 0 40 9.02 50 -2 44 9.71 52 0 42 9.62 Supp Motor Area 2 -2 62 11.4 Frontal Cortex Left Frontal Inf Tri -36 20 10 4.45 -42 20 6 3.39 Right Frontal Inf Tri 44 38 26 3.33 Frontal Inf Oper 46 12 6 7.29 48 14 2 7.65 Temporal Cortex Left Temp Sup -52 2 0 10.1 -54 0 -2 8.5 -54 4 2 9.21 -54 2 -2 9.72 -54 2 0 9.66 Temp Sup -54 -32 20 6.74 -62 -12 6 7.97 -66 -10 4 7.67 -60 -8 0 7.88 -60 -8 2 8.3 Temp Sup -56 -40 22 5.74 -54 -40 20 4.95 -52 -42 20 3.82 -56 -40 20 5.57 Temp Sup -44 -34 10 6.66 -44 -38 10 5.26 -46 -38 8 4.54 -44 -34 8 6.05 Right Temp Sup 64 -2 2 8.58 50 -26 6 7.36 68 -4 0 8.29 66 -4 0 7.93 66 -2 0 8.14 Temp Sup 56 -30 6 8.19 66 -2 0 6.89 56 -28 6 4.23 54 -28 6 6.98 Temp Sup 66 -24 12 4.71 64 -22 14 6.5 Temp Sup 70 -18 -4 5.15 70 -16 -4 5.15 72 -18 6 4.04 70 -18 -4 5.04 Temp Pole Sup 58 6 -6 8.49 58 4 -4 6.75 58 6 -4 8.01 58 8 -4 7.17 58 4 -4 7.81 Parietal Cortex Left Parietal Sup -24 -66 50 3.16 -26 -68 54 5.12 -26 -66 52 3.78 Parietal Inf -48 -50 58 3.93 -40 -52 46 5.45 -26 -66 44 5.82 -50 -48 58 4.27 Supramarginal -50 -44 34 3.89 Right Supramarginal 64 -34 32 5.71 66 -32 44 3.23 66 -34 28 2.85 Insular cortex Left Insula -34 18 10 3.83 -32 2 10 6.22 -36 24 6 6.47 -38 20 8 4.93 Right Insula 46 12 6 7.29 50 12 -2 7.04 48 14 2 7.65 Cerebellum

25
Left Cereb L6 (splCB) -14 -64 -18 8.65 -20 -64 -26 7.91 -22 -64 -24 7.74 -22 -64 -22 8.49 -20 -64 -24 8.28
Cereb Crus I (splCB) -32 -70 -24 7.04 -28 -86 -18 8.51 -34 -82 -18 6.03
Right Cereb L6 (splCB) 20 -64 -22 9.28 18 -62 -22 9.13 16 -62 -20 9.06 20 -62 -22 10.2 18 -62 -22 9.67
Cereb Crus I (splCB) 42 -68 -26 4.77 42 -64 -28 6.56
Cereb Crus II 2 -78 -36 4.45 2 -80 -34 4.04 2 -80 -36 4.07 Subcortical nuceli Left Put -26 2 8 7.54 -32 2 10 -32 6 8 6.74 -22 2 6 6.32 Pallidum -24 -10 -2 6.51 -28 -18 0 5.01 -26 -16 0 4.35 -26 -16 0 5.08 Pallidum -18 -2 2 5.46 -18 0 6 7.47 Thalamus -14 -20 2 4.31 -16 -6 -6 Caudate -18 -12 20 3.36 Right Put 28 12 8 4.74 22 0 12 4.23 22 -2 12 4.75 Pallidum 22 -8 -2 6.83 22 -10 -4 4.73 22 -8 -4 4.67 20 -8 -4 4.24 20 -8 -4 5.77 Caudate 20 -6 8 6.05 20 -6 12 4.82 18 0 14 3.66 Visual areas Left Calcarine -8 -98 -6 5.21 -12 -98 -4 5.45 -12 -96 -4 9.45 -10 -98 -4 6.86 Occip Sup -20 -64 -24 8.73 Occip Mid -40 -84 -4 4.08 -42 -84 -2 5.44 -46 -74 -18 6.27 Occip Inf -48 -74 -14 6.2 Lingual -8 -96 -14 4.55 -8 -94 -16 4.76 -10 -94 -14 5.77 Right Occip Inf 28 -88 -4 5.59 -18 -94 -4 6.25 Occip Inf 26 -94 0 3.3 30 -86 -8 5.57 26 -90 -4 3.88 Occip Mid 42 -68 -26 4.77 30 -96 2 3.34 36 -94 4 3.42 Calcarine 14 -76 8 3.41
Peak responses are based on voxel-wise analysis (PFDR < .05). Peak locations are given in MNI coordinates and listed with the associated AAL atlas anatomical label.
26
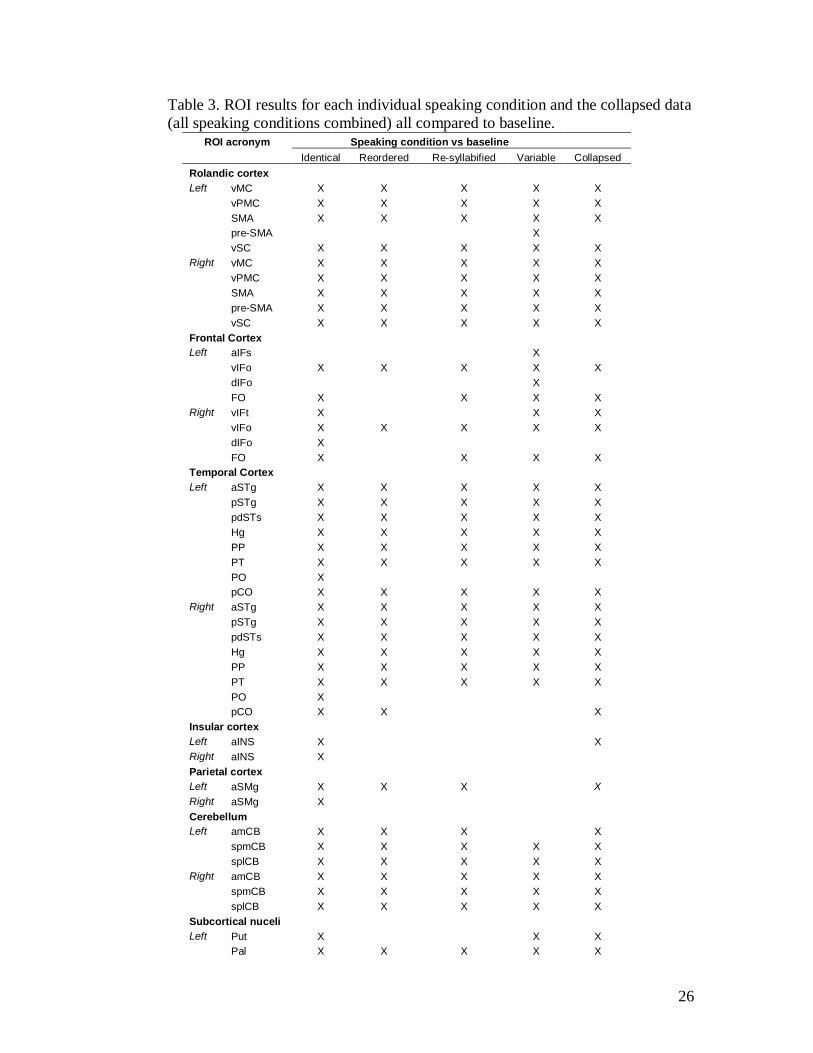
Table 3. ROI results for each individual speaking condition and the collapsed data (all speaking conditions combined) all compared to baseline.
ROI acronym Speaking condition vs baseline Identical Reordered Re-syllabified Variable Collapsed Rolandic cortex Left vMC X X X X X vPMC X X X X X SMA X X X X X pre-SMA X vSC X X X X X Right vMC X X X X X vPMC X X X X X SMA X X X X X pre-SMA X X X X X vSC X X X X X Frontal Cortex Left aIFs X vIFo X X X X X dIFo X FO X X X X Right vIFt X X X vIFo X X X X X dIFo X FO X X X X Temporal Cortex Left aSTg X X X X X pSTg X X X X X pdSTs X X X X X Hg X X X X X PP X X X X X PT X X X X X PO X pCO X X X X X Right aSTg X X X X X pSTg X X X X X pdSTs X X X X X Hg X X X X X PP X X X X X PT X X X X X PO X pCO X X X Insular cortex Left aINS X X Right aINS X Parietal cortex Left aSMg X X X X Right aSMg X Cerebellum Left amCB X X X X spmCB X X X X X splCB X X X X X Right amCB X X X X X spmCB X X X X X splCB X X X X X Subcortical nuceli Left Put X X X Pal X X X X X
27
Right Put X X Pal X X X X X
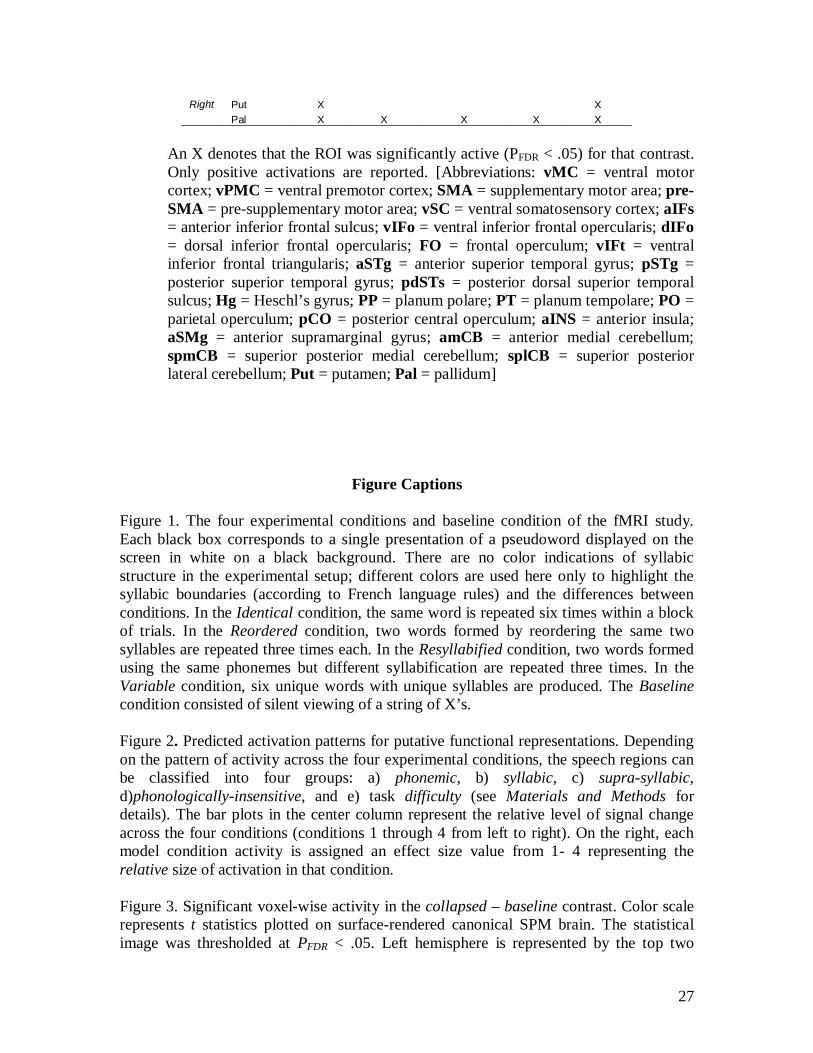
An X denotes that the ROI was significantly active (PFDR < .05) for that contrast. Only positive activations are reported. [Abbreviations: vMC = ventral motor cortex; vPMC = ventral premotor cortex; SMA = supplementary motor area; pre-SMA = pre-supplementary motor area; vSC = ventral somatosensory cortex; aIFs = anterior inferior frontal sulcus; vIFo = ventral inferior frontal opercularis; dIFo = dorsal inferior frontal opercularis; FO = frontal operculum; vIFt = ventral inferior frontal triangularis; aSTg = anterior superior temporal gyrus; pSTg = posterior superior temporal gyrus; pdSTs = posterior dorsal superior temporal sulcus; Hg = Heschl’s gyrus; PP = planum polare; PT = planum tempolare; PO = parietal operculum; pCO = posterior central operculum; aINS = anterior insula; aSMg = anterior supramarginal gyrus; amCB = anterior medial cerebellum; spmCB = superior posterior medial cerebellum; splCB = superior posterior lateral cerebellum; Put = putamen; Pal = pallidum]
Figure Captions Figure 1. The four experimental conditions and baseline condition of the fMRI study. Each black box corresponds to a single presentation of a pseudoword displayed on the screen in white on a black background. There are no color indications of syllabic structure in the experimental setup; different colors are used here only to highlight the syllabic boundaries (according to French language rules) and the differences between conditions. In the Identical condition, the same word is repeated six times within a block of trials. In the Reordered condition, two words formed by reordering the same two syllables are repeated three times each. In the Resyllabified condition, two words formed using the same phonemes but different syllabification are repeated three times. In the Variable condition, six unique words with unique syllables are produced. The Baseline condition consisted of silent viewing of a string of X’s. Figure 2. Predicted activation patterns for putative functional representations. Depending on the pattern of activity across the four experimental conditions, the speech regions can be classified into four groups: a) phonemic, b) syllabic, c) supra-syllabic, d)phonologically-insensitive, and e) task difficulty (see Materials and Methods for details). The bar plots in the center column represent the relative level of signal change across the four conditions (conditions 1 through 4 from left to right). On the right, each model condition activity is assigned an effect size value from 1- 4 representing the relative size of activation in that condition. Figure 3. Significant voxel-wise activity in the collapsed – baseline contrast. Color scale represents t statistics plotted on surface-rendered canonical SPM brain. The statistical image was thresholded at PFDR < .05. Left hemisphere is represented by the top two
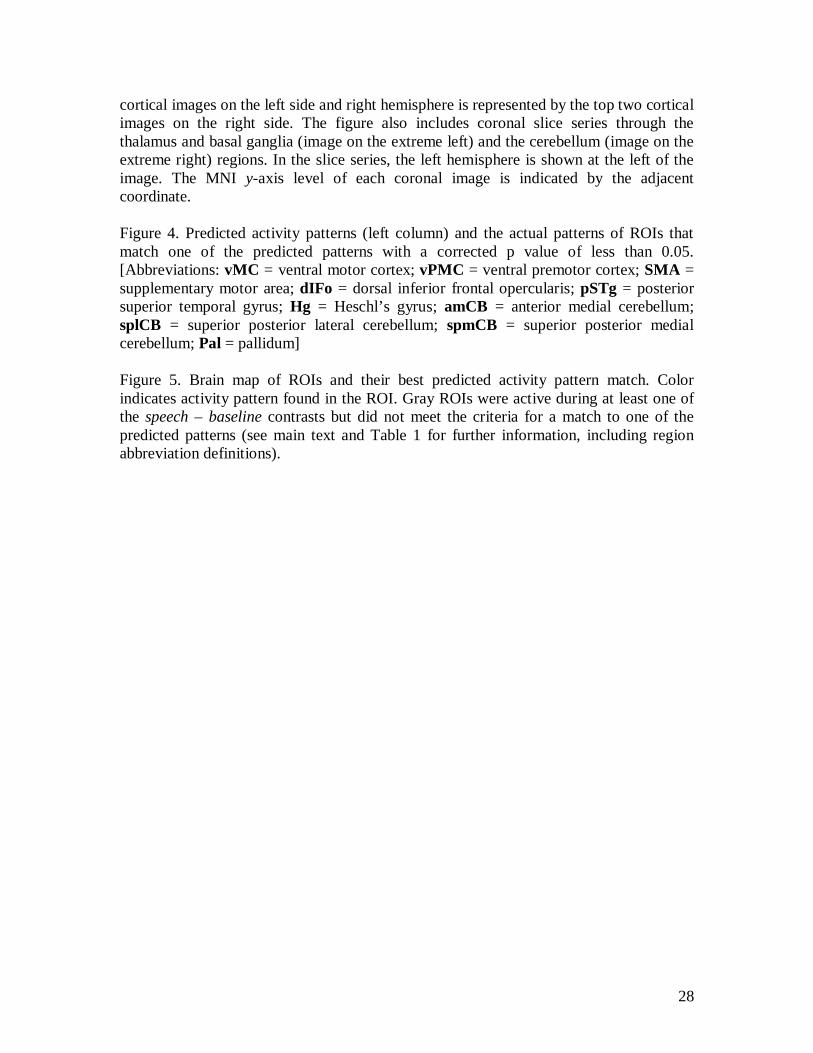
28
cortical images on the left side and right hemisphere is represented by the top two cortical images on the right side. The figure also includes coronal slice series through the thalamus and basal ganglia (image on the extreme left) and the cerebellum (image on the extreme right) regions. In the slice series, the left hemisphere is shown at the left of the image. The MNI y-axis level of each coronal image is indicated by the adjacent coordinate. Figure 4. Predicted activity patterns (left column) and the actual patterns of ROIs that match one of the predicted patterns with a corrected p value of less than 0.05. [Abbreviations: vMC = ventral motor cortex; vPMC = ventral premotor cortex; SMA = supplementary motor area; dIFo = dorsal inferior frontal opercularis; pSTg = posterior superior temporal gyrus; Hg = Heschl’s gyrus; amCB = anterior medial cerebellum; splCB = superior posterior lateral cerebellum; spmCB = superior posterior medial cerebellum; Pal = pallidum] Figure 5. Brain map of ROIs and their best predicted activity pattern match. Color indicates activity pattern found in the ROI. Gray ROIs were active during at least one of the speech – baseline contrasts but did not meet the criteria for a match to one of the predicted patterns (see main text and Table 1 for further information, including region abbreviation definitions).

29
FIG 1
FIG 2
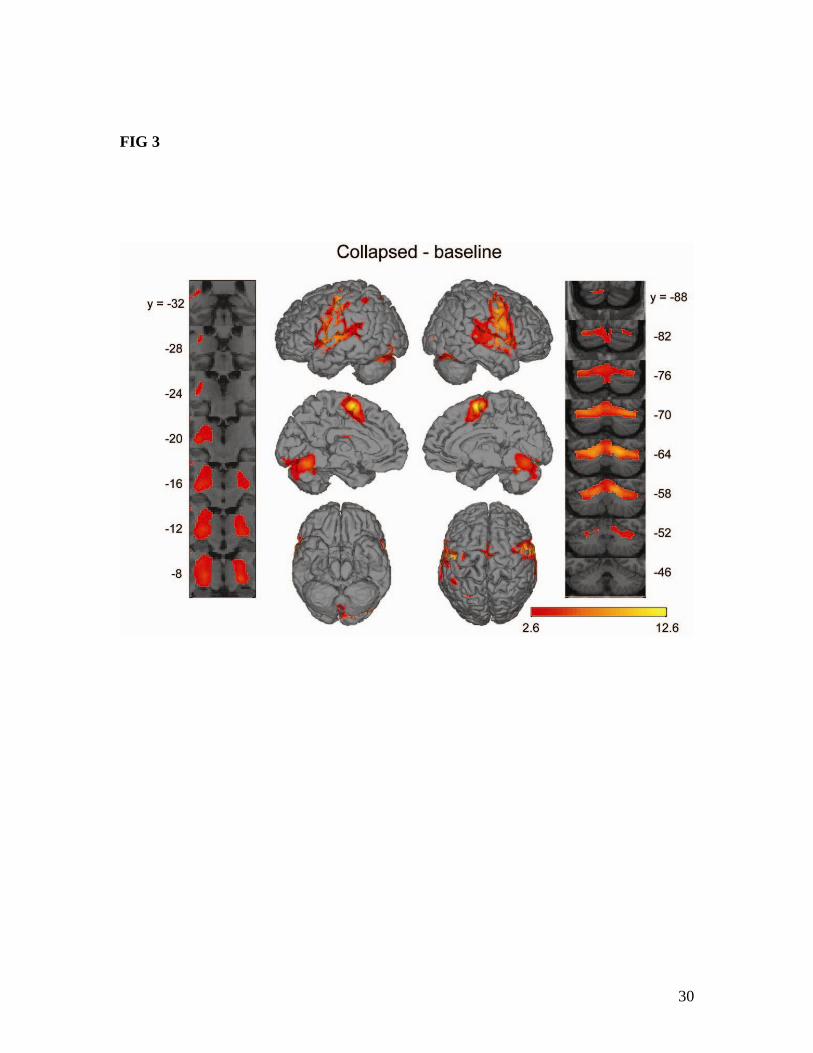
30
FIG 3

31
FIG 4

32
FIG 5