
Distinct microRNA Expression Profiles in Mouse Renal ... · PDF fileDistinct microRNA...
12
Distinct microRNA Expression Profiles in Mouse Renal Cortical Tissue after 177 Lu-octreotate Administration Emil Schu ¨ ler 1 *, Toshima Z. Parris 2 , Khalil Helou 2 , Eva Forssell-Aronsson 1,3 1 Department of Radiation Physics, Institute of Clinical Sciences, Sahlgrenska Cancer Center, Sahlgrenska Academy at the University of Gothenburg, Sahlgrenska University Hospital, Gothenburg, Sweden, 2 Department of Oncology, Institute of Clinical Sciences, Sahlgrenska Cancer Center, Sahlgrenska Academy at the University of Gothenburg, Sahlgrenska University Hospital, Gothenburg, Sweden, 3 Department of Medical Physics and Biomedical Engineering, Sahlgrenska University Hospital, Gothenburg, Sweden Abstract Aim: The aim of this study was to investigate the variation of the miRNA expression levels in normal renal cortical tissue after 177 Lu-octreotate administration, a radiopharmaceutical used for treatment of neuroendocrine cancers. Methods: Female BALB/c nude mice were i.v. injected with 1.3, 3.6, 14, 45, or 140 MBq 177 Lu-octreotate, while control animals received saline. The animals were killed at 24 h after injection and total RNA, including miRNA, was extracted from the renal cortical tissue and hybridized to the Mouse miRNA Oligo chip 4plex to identify differentially regulated miRNAs between exposed and control samples. Results: In total, 57 specific miRNAs were differentially regulated in the exposed renal cortical tissues with 1, 29, 21, 27, and 31 miRNAs identified per dose-level (0.13, 0.34, 1.3, 4.3, and 13 Gy, respectively). No miRNAs were commonly regulated at all dose levels. miR-194, miR-107, miR-3090, and miR-3077 were commonly regulated at 0.34, 1.3, 4.3, and 13 Gy. Strong effects on cellular mechanisms ranging from immune response to p53 signaling and cancer-related pathways were observed at the highest absorbed dose. Thirty-nine of the 57 differentially regulated miRNAs identified in the present study have previously been associated with response to ionizing radiation, indicating common radiation responsive pathways. Conclusion: In conclusion, the 177 Lu-octreotate associated miRNA signatures were generally dose-specific, thereby illustrating transcriptional regulation of radiation responsive miRNAs. Taken together, these results imply the importance of miRNAs in early immunological responses in the kidneys following 177 Lu-octreotate administration. Citation: Schu ¨ ler E, Parris TZ, Helou K, Forssell-Aronsson E (2014) Distinct microRNA Expression Profiles in Mouse Renal Cortical Tissue after 177 Lu-octreotate Administration. PLoS ONE 9(11): e112645. doi:10.1371/journal.pone.0112645 Editor: David Raul Francisco Carter, Oxford Brookes University, United Kingdom Received July 11, 2014; Accepted October 20, 2014; Published November 11, 2014 Copyright: ß 2014 Schu ¨ ler et al. This is an open-access article distributed under the terms of the Creative Commons Attribution License, which permits unrestricted use, distribution, and reproduction in any medium, provided the original author and source are credited. Data Availability: The authors confirm that all data underlying the findings are fully available without restriction. All relevant data are within the paper and its Supporting Information files. Funding: This study was supported by grants from the Swedish Research Council (grant no. 21073), the Swedish Cancer Society (grant no. 3427), BioCARE - a National Strategic Research Program at the University of Gothenburg, the King Gustav V Jubilee Clinic Cancer Research Foundation, the Sahlgrenska University Hospital Research Funds, the Assar Gabrielsson Cancer Research Foundation, Lions cancer foundation, and the Adlerbertska Research Foundation. The funders had no role in study design, data collection and analysis, decision to publish, or preparation of the manuscript. Competing Interests: The authors have declared that no competing interests exist. * Email: [email protected] Introduction Impaired renal function can occur following targeted radionu- clide therapy, with risk of nephropathy that may be induced up to 5 years after therapy [1]. Several studies indicate that toxic effects mainly occur in the kidney cortex, and specifically in the proximal tubules [2–6]. However, there is limited basic knowledge of how normal kidney tissue responds to ionizing radiation. Although it is widely accepted that response to stressors is mediated by regulation of cell cycle progression and maintenance via gene transcription/translation and epigenetic mechanisms, global cel- lular responses required for cell survival remain elusive [7]. It is therefore important to have a better understanding of which biological mechanisms play a pivotal role after ionizing radiation exposure in order to provide optimal tumor treatment and minimize normal tissue toxicity. The kidneys are a late responding organ. However, it is now realized that the ‘‘silent interval’’ between exposure and clinically manifested responses is far from silent. Also in late responding tissue, cytokine cascades are activated and remain active throughout the phase of damage expression. This early release of cytokines gives way for an active biological response mediated by various cell types, including inflammatory, stromal, endothelial and parenchymal cells. As such, data on the early response could very well lead to a better understanding of the biological response following exposure and possibly predict late induced injury [8–10]. Recently, the involvement of microRNAs (miRNAs) in response to ionizing radiation was explored [11]. miRNAs are small (18– 22 bp), highly conserved non-coding RNAs which bind primarily to the 39 UTR (untranslated region) of mRNAs and regulate gene expression by promoting mRNA destabilization and degradation as well as repression of translation [7,12]. Furthermore, miRNA- PLOS ONE | www.plosone.org 1 November 2014 | Volume 9 | Issue 11 | e112645
Transcript of Distinct microRNA Expression Profiles in Mouse Renal ... · PDF fileDistinct microRNA...
Distinct microRNA Expression Profiles in Mouse RenalCortical Tissue after 177Lu-octreotate AdministrationEmil Schuler1*, Toshima Z. Parris2, Khalil Helou2, Eva Forssell-Aronsson1,3
1 Department of Radiation Physics, Institute of Clinical Sciences, Sahlgrenska Cancer Center, Sahlgrenska Academy at the University of Gothenburg, Sahlgrenska University
Hospital, Gothenburg, Sweden, 2 Department of Oncology, Institute of Clinical Sciences, Sahlgrenska Cancer Center, Sahlgrenska Academy at the University of
Gothenburg, Sahlgrenska University Hospital, Gothenburg, Sweden, 3 Department of Medical Physics and Biomedical Engineering, Sahlgrenska University Hospital,
Gothenburg, Sweden
Abstract
Aim: The aim of this study was to investigate the variation of the miRNA expression levels in normal renal cortical tissueafter 177Lu-octreotate administration, a radiopharmaceutical used for treatment of neuroendocrine cancers.
Methods: Female BALB/c nude mice were i.v. injected with 1.3, 3.6, 14, 45, or 140 MBq 177Lu-octreotate, while controlanimals received saline. The animals were killed at 24 h after injection and total RNA, including miRNA, was extracted fromthe renal cortical tissue and hybridized to the Mouse miRNA Oligo chip 4plex to identify differentially regulated miRNAsbetween exposed and control samples.
Results: In total, 57 specific miRNAs were differentially regulated in the exposed renal cortical tissues with 1, 29, 21, 27, and31 miRNAs identified per dose-level (0.13, 0.34, 1.3, 4.3, and 13 Gy, respectively). No miRNAs were commonly regulated at alldose levels. miR-194, miR-107, miR-3090, and miR-3077 were commonly regulated at 0.34, 1.3, 4.3, and 13 Gy. Strong effectson cellular mechanisms ranging from immune response to p53 signaling and cancer-related pathways were observed at thehighest absorbed dose. Thirty-nine of the 57 differentially regulated miRNAs identified in the present study have previouslybeen associated with response to ionizing radiation, indicating common radiation responsive pathways.
Conclusion: In conclusion, the 177Lu-octreotate associated miRNA signatures were generally dose-specific, therebyillustrating transcriptional regulation of radiation responsive miRNAs. Taken together, these results imply the importance ofmiRNAs in early immunological responses in the kidneys following 177Lu-octreotate administration.
Citation: Schuler E, Parris TZ, Helou K, Forssell-Aronsson E (2014) Distinct microRNA Expression Profiles in Mouse Renal Cortical Tissue after 177Lu-octreotateAdministration. PLoS ONE 9(11): e112645. doi:10.1371/journal.pone.0112645
Editor: David Raul Francisco Carter, Oxford Brookes University, United Kingdom
Received July 11, 2014; Accepted October 20, 2014; Published November 11, 2014
Copyright: � 2014 Schuler et al. This is an open-access article distributed under the terms of the Creative Commons Attribution License, which permitsunrestricted use, distribution, and reproduction in any medium, provided the original author and source are credited.
Data Availability: The authors confirm that all data underlying the findings are fully available without restriction. All relevant data are within the paper and itsSupporting Information files.
Funding: This study was supported by grants from the Swedish Research Council (grant no. 21073), the Swedish Cancer Society (grant no. 3427), BioCARE - aNational Strategic Research Program at the University of Gothenburg, the King Gustav V Jubilee Clinic Cancer Research Foundation, the Sahlgrenska UniversityHospital Research Funds, the Assar Gabrielsson Cancer Research Foundation, Lions cancer foundation, and the Adlerbertska Research Foundation. The fundershad no role in study design, data collection and analysis, decision to publish, or preparation of the manuscript.
Competing Interests: The authors have declared that no competing interests exist.
* Email: [email protected]
Introduction
Impaired renal function can occur following targeted radionu-
clide therapy, with risk of nephropathy that may be induced up to
5 years after therapy [1]. Several studies indicate that toxic effects
mainly occur in the kidney cortex, and specifically in the proximal
tubules [2–6]. However, there is limited basic knowledge of how
normal kidney tissue responds to ionizing radiation. Although it is
widely accepted that response to stressors is mediated by
regulation of cell cycle progression and maintenance via gene
transcription/translation and epigenetic mechanisms, global cel-
lular responses required for cell survival remain elusive [7]. It is
therefore important to have a better understanding of which
biological mechanisms play a pivotal role after ionizing radiation
exposure in order to provide optimal tumor treatment and
minimize normal tissue toxicity.
The kidneys are a late responding organ. However, it is now
realized that the ‘‘silent interval’’ between exposure and clinically
manifested responses is far from silent. Also in late responding
tissue, cytokine cascades are activated and remain active
throughout the phase of damage expression. This early release
of cytokines gives way for an active biological response mediated
by various cell types, including inflammatory, stromal, endothelial
and parenchymal cells. As such, data on the early response could
very well lead to a better understanding of the biological response
following exposure and possibly predict late induced injury [8–10].
Recently, the involvement of microRNAs (miRNAs) in response to
ionizing radiation was explored [11]. miRNAs are small (18–
22 bp), highly conserved non-coding RNAs which bind primarily
to the 39 UTR (untranslated region) of mRNAs and regulate gene
expression by promoting mRNA destabilization and degradation
as well as repression of translation [7,12]. Furthermore, miRNA-
PLOS ONE | www.plosone.org 1 November 2014 | Volume 9 | Issue 11 | e112645
induced activation of gene expression and thereby enhanced
translation has also been proposed [13,14]. A single miRNA may
target multiple mRNAs and several miRNAs may be specific for
the same mRNA. The majority of human genes are regulated by
different miRNAs, and miRNA play an essential role in
fundamental cellular processes, e.g cell metabolism, cell differen-
tiation, apoptosis and cell signaling [15,16]. Furthermore,
miRNAs are involved in cancer differentiation and miRNA
expression signatures have been correlated to tumor state and
patient clinical outcome [17,18]. In addition, miRNAs play an
important role in the DNA damage response after physiological
and pathological stressors, for instance in the response to reactive
oxygen species and ionizing radiation [11,19–22].
Previous studies have shown that radionuclide administration
has a divergent effect on transcriptional regulation in different
normal tissues [23,24]. Already at very low absorbed doses, organ-
and dose-specific responses are seen after 131I administration [23].
This has also been shown after 211At administration with more
pronounced transcriptional responses at low versus high absorbed
dose [24,25]. Due to systemic regulation, these studies also
illustrate the importance of using in vivo studies to elucidate
biological responses to ionizing radiation. We have previously
shown dose-dependent transcriptional responses highly associated
with metabolism and stress-related processes in kidney tissue after177Lu-octreotate administration [26]. Although DNA damage is
considered to be a major molecular lesion following radiation
exposure, responses to DNA damage were not detected in kidney
tissue at the mRNA level. These studies further demonstrate the
complex responses seen after radionuclide administration. Fur-
thermore, kidney toxicity profiles after high absorbed dose
exposure of 177Lu-octreotate administration (90–150 MBq injected
activity) revealed morphological changes, elevated serum creati-
nine, and increased urea levels [4].
The aim of this study was to investigate the variation of the
miRNA expression levels and their influence on the expression of
miRNA target genes in normal renal cortical tissue after 177Lu-
octreotate administration.
Materials and Methods
Animals and radiopharmaceutical preparationThe radiopharmaceuticals, 177LuCl3 and DOTA-Tyr3-octreo-
tate, were purchased from I.D.B. Holland (Baarle-Nassau,
Netherlands). Radiolabeling of DOTA-Tyr3-octreotate with177LuCl3 was performed according to the manufacturer’s instruc-
tions. A fraction of peptide bound 177Lu of .99% was considered
adequate, as determined by instant thin layer chromatography.
The 177Lu-octreotate stock solution was diluted to the final activity
concentrations with saline solution.
The animal handling has previously been reported [26]. In
brief, all animals had access to food and water ad libitum. Female
BALB/c nude mice were divided into six groups containing three
animals each and i.v. injected with 1.3, 3.6, 14, 45, or 140 MBq of177Lu-octreotate through the tail vein. The control group was
mock-treated with an i.v. injection of saline solution. The animals
were killed by cardiac puncture under anesthesia (pentobarbital-
natrium, APL, Sweden) 24 h after injection. The kidneys were
removed, flash frozen in liquid nitrogen, and stored at 280uCuntil further molecular studies. The experimental protocol was
approved by the Ethical Committee on Animal Experiments in
Gothenburg, Sweden.
DosimetryThe activity concentration was measured in one of the kidneys
from each animal at the time of death using a gamma counter
(Wallac Oy, Finland). The cumulated activity was estimated from
the measured activity concentration together with data from a
previously published biodistribution study of 177Lu-octreotate in
BALB/c nude mice [27].
The absorbed dose to the kidneys was calculated according to
the Medical Internal Radiation Dose (MIRD) formalism [28]:
�DDKidney~~AAKidney
XniEiwi
.mKidney
where AKidney is the cumulated activity during the first 24 h after
injection, the product niEi is the average energy emitted by
electrons per decay, wi is the absorbed fraction (wi = 0.93 [29]),
and mKidney is the mass of the kidney investigated. Only the
electron contribution was included.
Total RNA extraction and miRNA analysisThe renal cortical tissue was dissected from the flash-frozen
kidneys and homogenized using the Mikro-Dismembrator S ball
mill (Sartorius Stedim Biotech, Aubagne Cedex, France). Total
RNA (including miRNA) was extracted using the miRNeasy Mini
Kit (Qiagen, Hilden, Germany) according to the manufacturer’s
instructions. The RNA 6000 Nano Kit and the Small RNA kit
were used with Agilent 2100 Bioanalyzer (Agilent Technologies,
Santa Clara, CA, USA) to assess the RNA integrity and the
presence of miRNA in the samples, respectively. RNA Integrity
Number (RIN) values above 6.0 were accepted for further analysis.
The RNA samples were processed at the TATAA Biocenter
(Gothenburg, Sweden). Labeling and hybridization were per-
formed using the miRCURY microRNA Hy5 Power labeling kit
(Exiqon A/S, Vedbaek, Denmark) and the Mouse miRNA oligo
chip 4plex containing approximately 1,300 miRNAs (Toray
Industries, Tokyo, Japan), according to the 3DGENE miRNA
label Hybridization 4plex v1 protocol from Toray Industries,
respectively. The chips were scanned with the Gene Scanner 3000
(Toray Industries, Tokyo, Japan) using standard settings for mouse
miRNA v.19. Background subtraction and global normalization
were performed using the Gene Scanner software.
Differentially regulated miRNAs were identified using two-
tailed t-test between control and test samples (GenEx, Multid
Analyses AB, Gothenburg, Sweden). miRNAs with p-values,0.05
and fold-change of .1.5 were considered significant. A target gene
analysis was performed using statistically significant miRNAs
together with previously published transcriptome data [26] with
the IPA software (Ingenuity Systems, Redwood City, USA).
Quantitative real-time PCR (QPCR)Four differentially expressed miRNAs (miR-15a-5p, miR-92a-
3p, miR-107, and miR-194-5p) were selected for verification by
QPCR. Another eight constitutive miRNAs (let-7d-5p, let-7f-5p,
miR-23a-3p, miR-26a-5p, miR-30a-3p, miR-3od-5p, miR-191-
5p, and miR-192-5p), which showed homogeneous expression in
the microarray analysis were used for normalization. The samples
were reversely transcribed using the Universal cDNA Synthesis
Kit II (Exiqon) according to the manufacturer’s protocol. The
correlation between the microarray and the QPCR results was
estimated by the Pearson correlation coefficient.
miRNA Regulation after 177Lu-octreotate Administration
PLOS ONE | www.plosone.org 2 November 2014 | Volume 9 | Issue 11 | e112645
Results
In this study, we used an in vivo mouse model to identify
differentially regulated miRNAs in renal cortical tissues following177Lu-octreotate administration. The absorbed dose to the kidneys
was determined to 0.13, 0.34, 1.3, 4.3, and 13 Gy 24 h after
injection of 1.3, 3.6, 14, 45, and 140 MBq of 177Lu-octreotate,
respectively. The absorbed dose estimated to infinity time would
correspond to 0.31, 0.85, 3.3, 11, and 32 Gy, respectively.
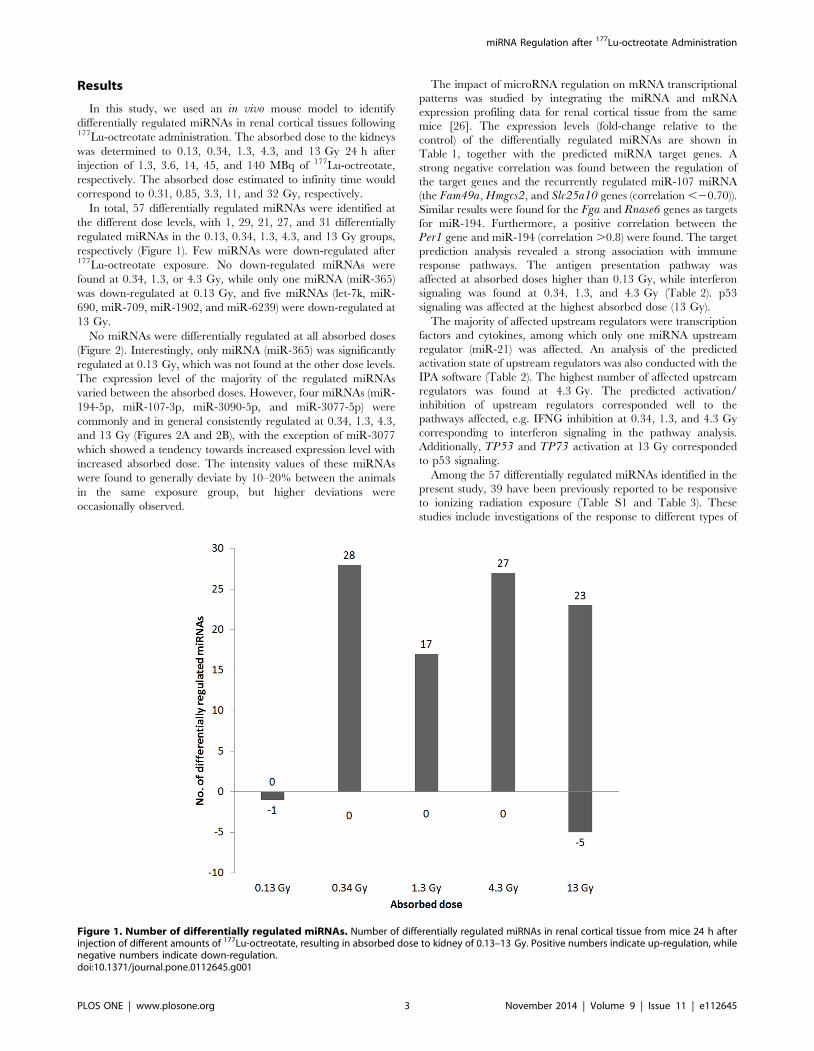
In total, 57 differentially regulated miRNAs were identified at
the different dose levels, with 1, 29, 21, 27, and 31 differentially
regulated miRNAs in the 0.13, 0.34, 1.3, 4.3, and 13 Gy groups,
respectively (Figure 1). Few miRNAs were down-regulated after177Lu-octreotate exposure. No down-regulated miRNAs were
found at 0.34, 1.3, or 4.3 Gy, while only one miRNA (miR-365)
was down-regulated at 0.13 Gy, and five miRNAs (let-7k, miR-
690, miR-709, miR-1902, and miR-6239) were down-regulated at
13 Gy.
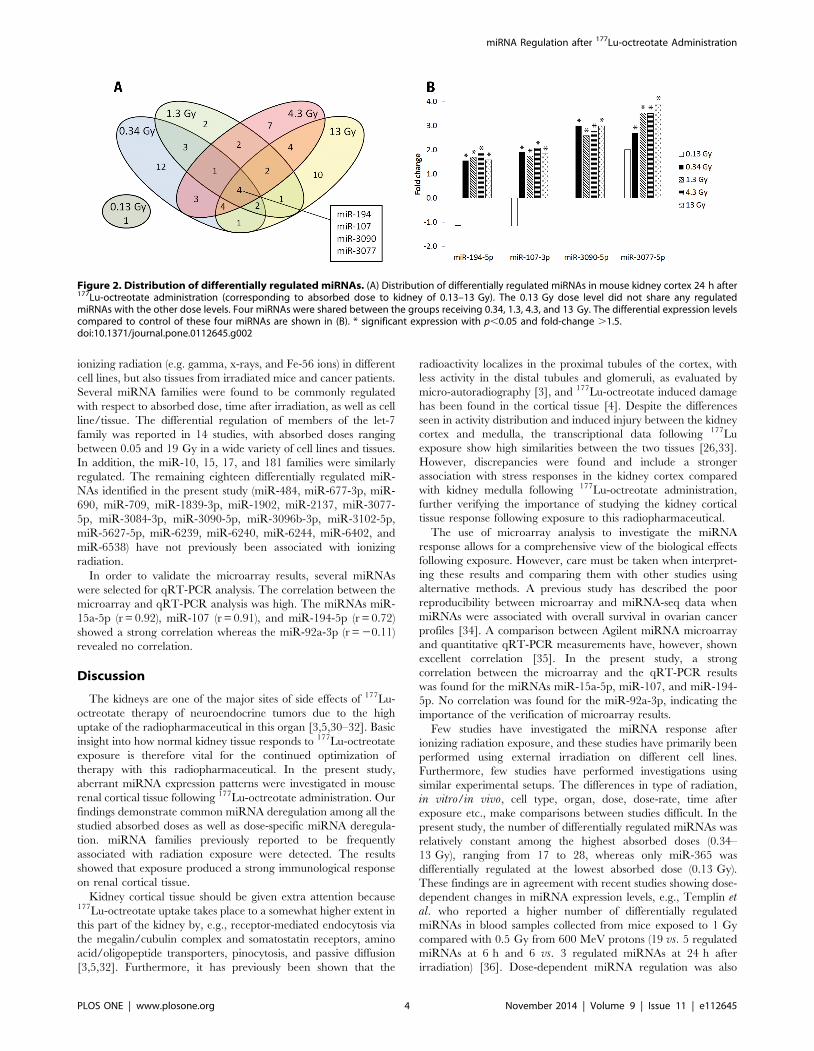
No miRNAs were differentially regulated at all absorbed doses
(Figure 2). Interestingly, only miRNA (miR-365) was significantly
regulated at 0.13 Gy, which was not found at the other dose levels.
The expression level of the majority of the regulated miRNAs
varied between the absorbed doses. However, four miRNAs (miR-
194-5p, miR-107-3p, miR-3090-5p, and miR-3077-5p) were
commonly and in general consistently regulated at 0.34, 1.3, 4.3,
and 13 Gy (Figures 2A and 2B), with the exception of miR-3077
which showed a tendency towards increased expression level with
increased absorbed dose. The intensity values of these miRNAs
were found to generally deviate by 10–20% between the animals
in the same exposure group, but higher deviations were
occasionally observed.
The impact of microRNA regulation on mRNA transcriptional
patterns was studied by integrating the miRNA and mRNA
expression profiling data for renal cortical tissue from the same
mice [26]. The expression levels (fold-change relative to the
control) of the differentially regulated miRNAs are shown in
Table 1, together with the predicted miRNA target genes. A
strong negative correlation was found between the regulation of
the target genes and the recurrently regulated miR-107 miRNA
(the Fam49a, Hmgcs2, and Slc25a10 genes (correlation ,20.70)).
Similar results were found for the Fga and Rnase6 genes as targets
for miR-194. Furthermore, a positive correlation between the
Per1 gene and miR-194 (correlation .0.8) were found. The target
prediction analysis revealed a strong association with immune
response pathways. The antigen presentation pathway was
affected at absorbed doses higher than 0.13 Gy, while interferon
signaling was found at 0.34, 1.3, and 4.3 Gy (Table 2). p53
signaling was affected at the highest absorbed dose (13 Gy).
The majority of affected upstream regulators were transcription
factors and cytokines, among which only one miRNA upstream
regulator (miR-21) was affected. An analysis of the predicted
activation state of upstream regulators was also conducted with the
IPA software (Table 2). The highest number of affected upstream
regulators was found at 4.3 Gy. The predicted activation/
inhibition of upstream regulators corresponded well to the
pathways affected, e.g. IFNG inhibition at 0.34, 1.3, and 4.3 Gy
corresponding to interferon signaling in the pathway analysis.
Additionally, TP53 and TP73 activation at 13 Gy corresponded
to p53 signaling.
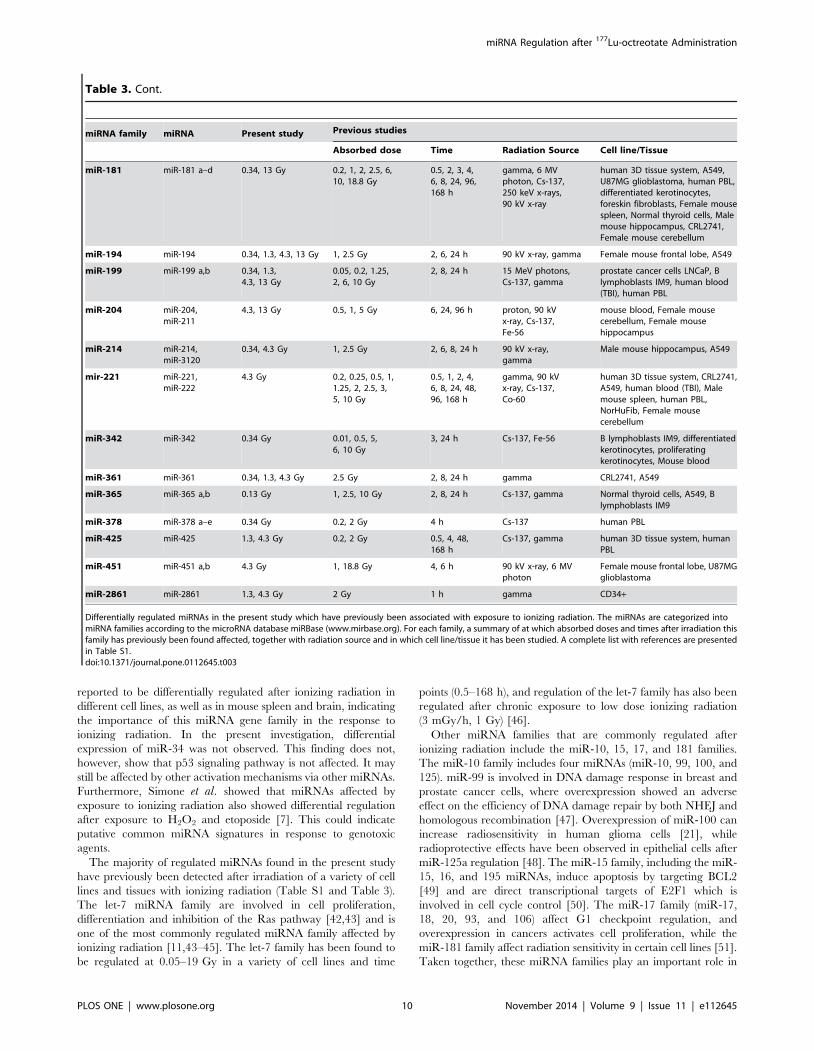
Among the 57 differentially regulated miRNAs identified in the
present study, 39 have been previously reported to be responsive
to ionizing radiation exposure (Table S1 and Table 3). These
studies include investigations of the response to different types of
Figure 1. Number of differentially regulated miRNAs. Number of differentially regulated miRNAs in renal cortical tissue from mice 24 h afterinjection of different amounts of 177Lu-octreotate, resulting in absorbed dose to kidney of 0.13–13 Gy. Positive numbers indicate up-regulation, whilenegative numbers indicate down-regulation.doi:10.1371/journal.pone.0112645.g001
miRNA Regulation after 177Lu-octreotate Administration
PLOS ONE | www.plosone.org 3 November 2014 | Volume 9 | Issue 11 | e112645
ionizing radiation (e.g. gamma, x-rays, and Fe-56 ions) in different
cell lines, but also tissues from irradiated mice and cancer patients.
Several miRNA families were found to be commonly regulated
with respect to absorbed dose, time after irradiation, as well as cell
line/tissue. The differential regulation of members of the let-7
family was reported in 14 studies, with absorbed doses ranging
between 0.05 and 19 Gy in a wide variety of cell lines and tissues.
In addition, the miR-10, 15, 17, and 181 families were similarly
regulated. The remaining eighteen differentially regulated miR-
NAs identified in the present study (miR-484, miR-677-3p, miR-
690, miR-709, miR-1839-3p, miR-1902, miR-2137, miR-3077-
5p, miR-3084-3p, miR-3090-5p, miR-3096b-3p, miR-3102-5p,
miR-5627-5p, miR-6239, miR-6240, miR-6244, miR-6402, and
miR-6538) have not previously been associated with ionizing
radiation.
In order to validate the microarray results, several miRNAs
were selected for qRT-PCR analysis. The correlation between the
microarray and qRT-PCR analysis was high. The miRNAs miR-
15a-5p (r = 0.92), miR-107 (r = 0.91), and miR-194-5p (r = 0.72)
showed a strong correlation whereas the miR-92a-3p (r = 20.11)
revealed no correlation.
Discussion
The kidneys are one of the major sites of side effects of 177Lu-
octreotate therapy of neuroendocrine tumors due to the high
uptake of the radiopharmaceutical in this organ [3,5,30–32]. Basic
insight into how normal kidney tissue responds to 177Lu-octreotate
exposure is therefore vital for the continued optimization of
therapy with this radiopharmaceutical. In the present study,
aberrant miRNA expression patterns were investigated in mouse
renal cortical tissue following 177Lu-octreotate administration. Our
findings demonstrate common miRNA deregulation among all the
studied absorbed doses as well as dose-specific miRNA deregula-
tion. miRNA families previously reported to be frequently
associated with radiation exposure were detected. The results
showed that exposure produced a strong immunological response
on renal cortical tissue.
Kidney cortical tissue should be given extra attention because177Lu-octreotate uptake takes place to a somewhat higher extent in
this part of the kidney by, e.g., receptor-mediated endocytosis via
the megalin/cubulin complex and somatostatin receptors, amino
acid/oligopeptide transporters, pinocytosis, and passive diffusion
[3,5,32]. Furthermore, it has previously been shown that the
radioactivity localizes in the proximal tubules of the cortex, with
less activity in the distal tubules and glomeruli, as evaluated by
micro-autoradiography [3], and 177Lu-octreotate induced damage
has been found in the cortical tissue [4]. Despite the differences
seen in activity distribution and induced injury between the kidney
cortex and medulla, the transcriptional data following 177Lu
exposure show high similarities between the two tissues [26,33].
However, discrepancies were found and include a stronger
association with stress responses in the kidney cortex compared
with kidney medulla following 177Lu-octreotate administration,
further verifying the importance of studying the kidney cortical
tissue response following exposure to this radiopharmaceutical.
The use of microarray analysis to investigate the miRNA
response allows for a comprehensive view of the biological effects
following exposure. However, care must be taken when interpret-
ing these results and comparing them with other studies using
alternative methods. A previous study has described the poor
reproducibility between microarray and miRNA-seq data when
miRNAs were associated with overall survival in ovarian cancer
profiles [34]. A comparison between Agilent miRNA microarray
and quantitative qRT-PCR measurements have, however, shown
excellent correlation [35]. In the present study, a strong
correlation between the microarray and the qRT-PCR results
was found for the miRNAs miR-15a-5p, miR-107, and miR-194-
5p. No correlation was found for the miR-92a-3p, indicating the
importance of the verification of microarray results.
Few studies have investigated the miRNA response after
ionizing radiation exposure, and these studies have primarily been
performed using external irradiation on different cell lines.
Furthermore, few studies have performed investigations using
similar experimental setups. The differences in type of radiation,
in vitro/in vivo, cell type, organ, dose, dose-rate, time after
exposure etc., make comparisons between studies difficult. In the
present study, the number of differentially regulated miRNAs was
relatively constant among the highest absorbed doses (0.34–
13 Gy), ranging from 17 to 28, whereas only miR-365 was
differentially regulated at the lowest absorbed dose (0.13 Gy).
These findings are in agreement with recent studies showing dose-
dependent changes in miRNA expression levels, e.g., Templin etal. who reported a higher number of differentially regulated
miRNAs in blood samples collected from mice exposed to 1 Gy
compared with 0.5 Gy from 600 MeV protons (19 vs. 5 regulated
miRNAs at 6 h and 6 vs. 3 regulated miRNAs at 24 h after
irradiation) [36]. Dose-dependent miRNA regulation was also
Figure 2. Distribution of differentially regulated miRNAs. (A) Distribution of differentially regulated miRNAs in mouse kidney cortex 24 h after177Lu-octreotate administration (corresponding to absorbed dose to kidney of 0.13–13 Gy). The 0.13 Gy dose level did not share any regulatedmiRNAs with the other dose levels. Four miRNAs were shared between the groups receiving 0.34, 1.3, 4.3, and 13 Gy. The differential expression levelscompared to control of these four miRNAs are shown in (B). * significant expression with p,0.05 and fold-change .1.5.doi:10.1371/journal.pone.0112645.g002
miRNA Regulation after 177Lu-octreotate Administration
PLOS ONE | www.plosone.org 4 November 2014 | Volume 9 | Issue 11 | e112645
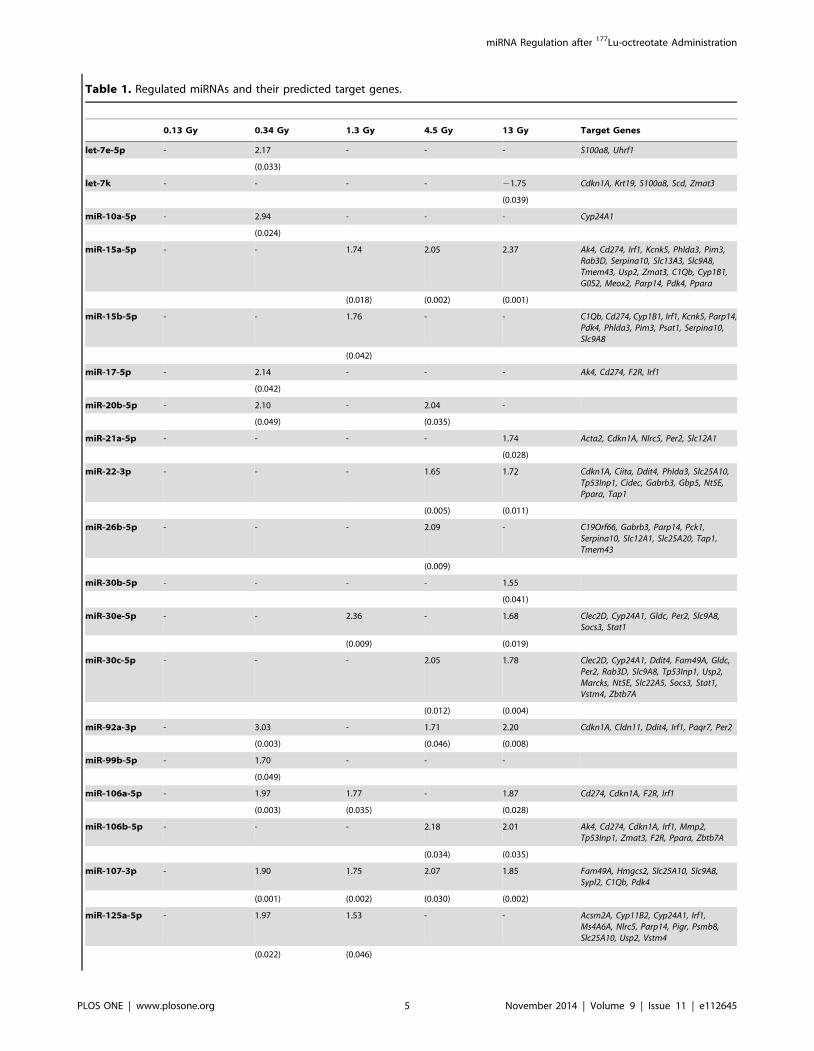
Table 1. Regulated miRNAs and their predicted target genes.
0.13 Gy 0.34 Gy 1.3 Gy 4.5 Gy 13 Gy Target Genes
let-7e-5p - 2.17 - - - S100a8, Uhrf1
(0.033)
let-7k - - - - 21.75 Cdkn1A, Krt19, S100a8, Scd, Zmat3
(0.039)
miR-10a-5p - 2.94 - - - Cyp24A1
(0.024)
miR-15a-5p - - 1.74 2.05 2.37 Ak4, Cd274, Irf1, Kcnk5, Phlda3, Pim3,Rab3D, Serpina10, Slc13A3, Slc9A8,Tmem43, Usp2, Zmat3, C1Qb, Cyp1B1,G0S2, Meox2, Parp14, Pdk4, Ppara
(0.018) (0.002) (0.001)
miR-15b-5p - - 1.76 - - C1Qb, Cd274, Cyp1B1, Irf1, Kcnk5, Parp14,Pdk4, Phlda3, Pim3, Psat1, Serpina10,Slc9A8
(0.042)
miR-17-5p - 2.14 - - - Ak4, Cd274, F2R, Irf1
(0.042)
miR-20b-5p - 2.10 - 2.04 -
(0.049) (0.035)
miR-21a-5p - - - - 1.74 Acta2, Cdkn1A, Nlrc5, Per2, Slc12A1
(0.028)
miR-22-3p - - - 1.65 1.72 Cdkn1A, Ciita, Ddit4, Phlda3, Slc25A10,Tp53Inp1, Cidec, Gabrb3, Gbp5, Nt5E,Ppara, Tap1
(0.005) (0.011)
miR-26b-5p - - - 2.09 - C19Orf66, Gabrb3, Parp14, Pck1,Serpina10, Slc12A1, Slc25A20, Tap1,Tmem43
(0.009)
miR-30b-5p - - - - 1.55
(0.041)
miR-30e-5p - - 2.36 - 1.68 Clec2D, Cyp24A1, Gldc, Per2, Slc9A8,Socs3, Stat1
(0.009) (0.019)
miR-30c-5p - - - 2.05 1.78 Clec2D, Cyp24A1, Ddit4, Fam49A, Gldc,Per2, Rab3D, Slc9A8, Tp53Inp1, Usp2,Marcks, Nt5E, Slc22A5, Socs3, Stat1,Vstm4, Zbtb7A
(0.012) (0.004)
miR-92a-3p - 3.03 - 1.71 2.20 Cdkn1A, Cldn11, Ddit4, Irf1, Paqr7, Per2
(0.003) (0.046) (0.008)
miR-99b-5p - 1.70 - - -
(0.049)
miR-106a-5p - 1.97 1.77 - 1.87 Cd274, Cdkn1A, F2R, Irf1
(0.003) (0.035) (0.028)
miR-106b-5p - - - 2.18 2.01 Ak4, Cd274, Cdkn1A, Irf1, Mmp2,Tp53Inp1, Zmat3, F2R, Ppara, Zbtb7A
(0.034) (0.035)
miR-107-3p - 1.90 1.75 2.07 1.85 Fam49A, Hmgcs2, Slc25A10, Slc9A8,Sypl2, C1Qb, Pdk4
(0.001) (0.002) (0.030) (0.002)
miR-125a-5p - 1.97 1.53 - - Acsm2A, Cyp11B2, Cyp24A1, Irf1,Ms4A6A, Nlrc5, Parp14, Pigr, Psmb8,Slc25A10, Usp2, Vstm4
(0.022) (0.046)
miRNA Regulation after 177Lu-octreotate Administration
PLOS ONE | www.plosone.org 5 November 2014 | Volume 9 | Issue 11 | e112645
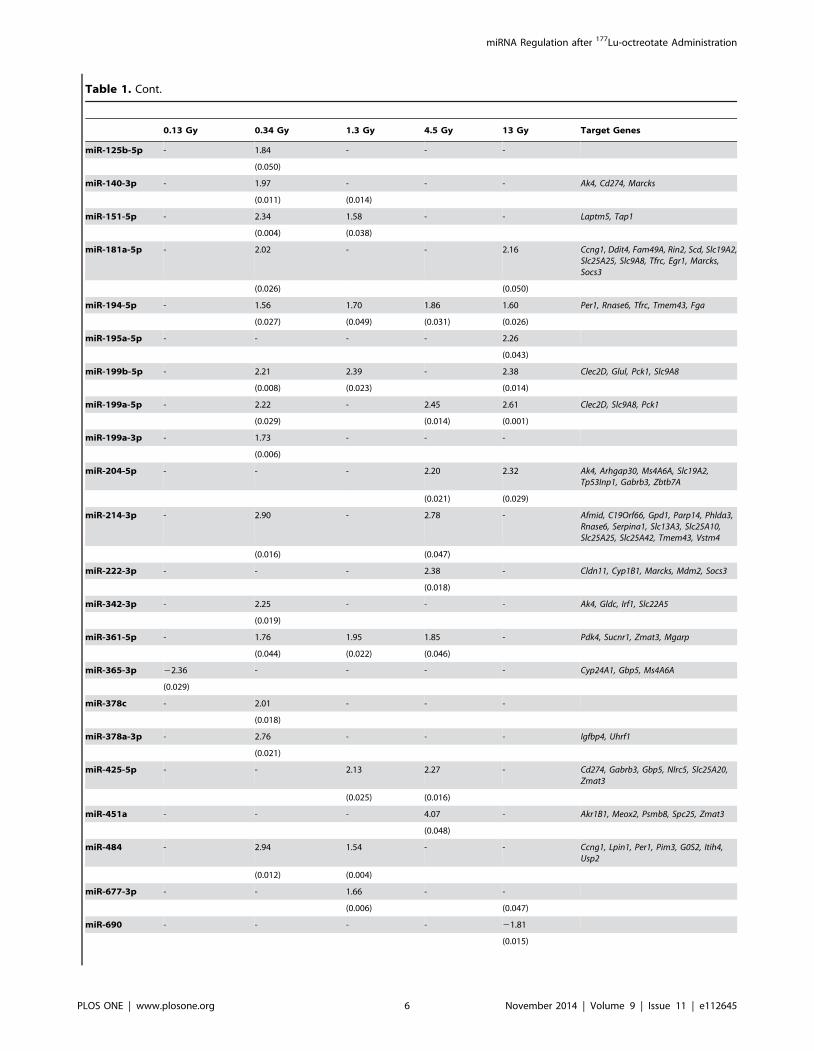
Table 1. Cont.
0.13 Gy 0.34 Gy 1.3 Gy 4.5 Gy 13 Gy Target Genes
miR-125b-5p - 1.84 - - -
(0.050)
miR-140-3p - 1.97 - - - Ak4, Cd274, Marcks
(0.011) (0.014)
miR-151-5p - 2.34 1.58 - - Laptm5, Tap1
(0.004) (0.038)
miR-181a-5p - 2.02 - - 2.16 Ccng1, Ddit4, Fam49A, Rin2, Scd, Slc19A2,Slc25A25, Slc9A8, Tfrc, Egr1, Marcks,Socs3
(0.026) (0.050)
miR-194-5p - 1.56 1.70 1.86 1.60 Per1, Rnase6, Tfrc, Tmem43, Fga
(0.027) (0.049) (0.031) (0.026)
miR-195a-5p - - - - 2.26
(0.043)
miR-199b-5p - 2.21 2.39 - 2.38 Clec2D, Glul, Pck1, Slc9A8
(0.008) (0.023) (0.014)
miR-199a-5p - 2.22 - 2.45 2.61 Clec2D, Slc9A8, Pck1
(0.029) (0.014) (0.001)
miR-199a-3p - 1.73 - - -
(0.006)
miR-204-5p - - - 2.20 2.32 Ak4, Arhgap30, Ms4A6A, Slc19A2,Tp53Inp1, Gabrb3, Zbtb7A
(0.021) (0.029)
miR-214-3p - 2.90 - 2.78 - Afmid, C19Orf66, Gpd1, Parp14, Phlda3,Rnase6, Serpina1, Slc13A3, Slc25A10,Slc25A25, Slc25A42, Tmem43, Vstm4
(0.016) (0.047)
miR-222-3p - - - 2.38 - Cldn11, Cyp1B1, Marcks, Mdm2, Socs3
(0.018)
miR-342-3p - 2.25 - - - Ak4, Gldc, Irf1, Slc22A5
(0.019)
miR-361-5p - 1.76 1.95 1.85 - Pdk4, Sucnr1, Zmat3, Mgarp
(0.044) (0.022) (0.046)
miR-365-3p 22.36 - - - - Cyp24A1, Gbp5, Ms4A6A
(0.029)
miR-378c - 2.01 - - -
(0.018)
miR-378a-3p - 2.76 - - - Igfbp4, Uhrf1
(0.021)
miR-425-5p - - 2.13 2.27 - Cd274, Gabrb3, Gbp5, Nlrc5, Slc25A20,Zmat3
(0.025) (0.016)
miR-451a - - - 4.07 - Akr1B1, Meox2, Psmb8, Spc25, Zmat3
(0.048)
miR-484 - 2.94 1.54 - - Ccng1, Lpin1, Per1, Pim3, G0S2, Itih4,Usp2
(0.012) (0.004)
miR-677-3p - - 1.66 - -
(0.006) (0.047)
miR-690 - - - - 21.81
(0.015)
miRNA Regulation after 177Lu-octreotate Administration
PLOS ONE | www.plosone.org 6 November 2014 | Volume 9 | Issue 11 | e112645
found in proliferating keratinocytes in vitro, where exposure to
10 mGy (137Cs) revealed fewer regulated miRNAs compared with
exposure to 6 Gy 3 h after irradiation (2 vs. 8 regulated miRNAs)
[37]. Furthermore, the lack of a dose-response in the number of
regulated transcripts at doses higher than 0.13 Gy could be
expected. This tendency has previously been shown at the
transcriptional level after radionuclide administration [23–
26,33]. An explanation could be that the biological response is
not facilitated by the number of miRNAs/transcripts regulated but
instead of which miRNAs/transcripts that are regulated. With
increased dose, an increased association towards stress response is
observed, with both increased association towards immune
response and inflammation [26], and we assume that if a dose-
response is seen, it is in either individually regulated miRNAs/
transcripts or more likely a panel of regulated miRNAs/
transcripts.
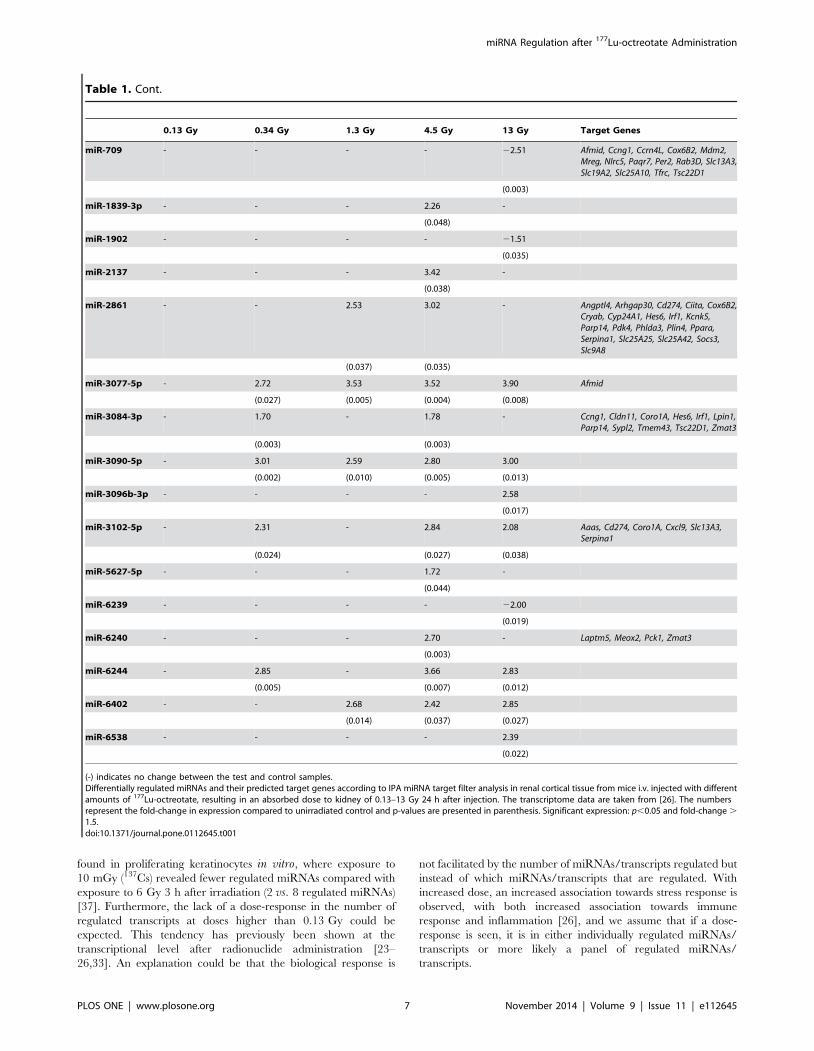
Table 1. Cont.
0.13 Gy 0.34 Gy 1.3 Gy 4.5 Gy 13 Gy Target Genes
miR-709 - - - - 22.51 Afmid, Ccng1, Ccrn4L, Cox6B2, Mdm2,Mreg, Nlrc5, Paqr7, Per2, Rab3D, Slc13A3,Slc19A2, Slc25A10, Tfrc, Tsc22D1
(0.003)
miR-1839-3p - - - 2.26 -
(0.048)
miR-1902 - - - - 21.51
(0.035)
miR-2137 - - - 3.42 -
(0.038)
miR-2861 - - 2.53 3.02 - Angptl4, Arhgap30, Cd274, Ciita, Cox6B2,Cryab, Cyp24A1, Hes6, Irf1, Kcnk5,Parp14, Pdk4, Phlda3, Plin4, Ppara,Serpina1, Slc25A25, Slc25A42, Socs3,Slc9A8
(0.037) (0.035)
miR-3077-5p - 2.72 3.53 3.52 3.90 Afmid
(0.027) (0.005) (0.004) (0.008)
miR-3084-3p - 1.70 - 1.78 - Ccng1, Cldn11, Coro1A, Hes6, Irf1, Lpin1,Parp14, Sypl2, Tmem43, Tsc22D1, Zmat3
(0.003) (0.003)
miR-3090-5p - 3.01 2.59 2.80 3.00
(0.002) (0.010) (0.005) (0.013)
miR-3096b-3p - - - - 2.58
(0.017)
miR-3102-5p - 2.31 - 2.84 2.08 Aaas, Cd274, Coro1A, Cxcl9, Slc13A3,Serpina1
(0.024) (0.027) (0.038)
miR-5627-5p - - - 1.72 -
(0.044)
miR-6239 - - - - 22.00
(0.019)
miR-6240 - - - 2.70 - Laptm5, Meox2, Pck1, Zmat3
(0.003)
miR-6244 - 2.85 - 3.66 2.83
(0.005) (0.007) (0.012)
miR-6402 - - 2.68 2.42 2.85
(0.014) (0.037) (0.027)
miR-6538 - - - - 2.39
(0.022)
(-) indicates no change between the test and control samples.Differentially regulated miRNAs and their predicted target genes according to IPA miRNA target filter analysis in renal cortical tissue from mice i.v. injected with differentamounts of 177Lu-octreotate, resulting in an absorbed dose to kidney of 0.13–13 Gy 24 h after injection. The transcriptome data are taken from [26]. The numbersrepresent the fold-change in expression compared to unirradiated control and p-values are presented in parenthesis. Significant expression: p,0.05 and fold-change .
1.5.doi:10.1371/journal.pone.0112645.t001
miRNA Regulation after 177Lu-octreotate Administration
PLOS ONE | www.plosone.org 7 November 2014 | Volume 9 | Issue 11 | e112645
The time aspect has also been proven to be an important model
parameter during miRNA expression analysis. Several studies
reported a time-dependent regulation of miRNAs, especially at
lower absorbed doses [36,38,39]. Weidhaas et al. found that in the
A549 lung cancer cell line, the majority of regulated miRNAs were
detected 2 h after gamma exposure (2.5 Gy) and most of these
returned to baseline levels 24 h after irradiation [38]. This
decrease in the number of regulated miRNAs with time may be
due to repair of radiation damage, where lower absorbed doses
induce less damage [25].
In the present investigation, the majority of differentially
regulated miRNAs were primarily up-regulated with only one
miRNA down-regulated at 0.13 Gy (miR-365) and five down-
regulated at 13 Gy (miR-709, miR-6239, miR-690, let-7k, and
miR-1902); no down-regulated miRNAs were found at the
intermediate dose levels (0.34–4.3 Gy). This finding is in contrast
to results by Templin et al., who found a higher number of down-
regulated miRNAs after proton irradiation [36]. Furthermore, we
were not able to identify any commonly regulated miRNAs at all
absorbed doses. However, four miRNAs (miR-194, miR-107,
miR-3090, and miR-3077) were commonly regulated at the
highest four absorbed doses. Previous reports concluded that
miRNA regulation is highly dependent on the irradiation
parameters, e.g. radiation dose and time-point, in addition to cell
type [36,37,40,41].
Previously, we have observed that changes in mRNA expression
in the kidney were evident after irradiation [26]. In the present
investigation, the identified miRNAs are tissue specific and
radiation induced. The majority of the identified radiation induced
miRNAs are not evolutionary conserved because radiation is not a
selection factor during evolution. Concerning the present study, an
association with stress-related responses, e.g. antigen presentation
pathway and interferon signaling, were found for the majority of
the dose levels investigated. Components of the p53 signaling
pathway were regulated at 13 Gy, predicting activation of
upstream regulators TP53 and TP73. A previous paper showed
that the miR-34 family, which is a direct transcriptional target of
p53, might induce cell cycle progression [42]. miR-34 has been
Table 2. Affected signaling pathways and upstream regulators.
Absorbed dose Top pathways Upstream regulator
Pathway p-value Gene Molecule type*Predicted activationstate
0.13 Gy VDR/RXR Activation 2.00E-02
0.34 Gy Antigen Presentation Pathway 1.12E-04 Stat3 transcription regulator Inhibited
Interferon Signaling 1.23E-04 Ifng cytokine Inhibited
Circadian Rhythm Signaling 5.50E-03 Tnf cytokine Inhibited
Coagulation System 6.17E-03 Tlr3 transmembrane receptor Inhibited
LXR/RXR Activation 6.17E-03
1.3 Gy Antigen Presentation Pathway 1.23E-04 mir-21 microRNA Activated
Interferon Signaling 1.38E-04 SocsS1 other Activated
JAK/Stat Signaling 1.66E-03 Ifng cytokine Inhibited
Prolactin Signaling 2.09E-03 Stat3 transcription regulator Inhibited
IL-22 Signaling 3.16E-03
4.3 Gy Antigen Presentation Pathway 1.51E-05 Ppara ligand-dependent nuclear receptor Activated
Interferon Signaling 1.74E-05 mir-21 microRNA Activated
Coagulation System 8.91E-04 Tp73 transcription regulator Activated
JAK/Stat Signaling 5.75E-03 Pparg ligand-dependent nuclear receptor Activated
Prolactin Signaling 7.41E-03 Tp53 transcription regulator Activated
Sparc other Activated
Socs1 other Activated
Ifng cytokine Inhibited
Stat1 transcription regulator Inhibited
Stat3 transcription regulator Inhibited
13 Gy Antigen Presentation Pathway 2.14E-04 Tp53 transcription regulator Activated
p53 Signaling 5.13E-04 Tp73 transcription regulator Activated
HER-2 Signaling in Breast Cancer 3.89E-03
Agranulocyte Adhesion andDiapedesis
5.01E-03
Bladder Cancer Signaling 5.50E-03
*according to IPA.Top five affected signaling pathways and predicted activation/inhibition of upstream regulators in renal cortical tissue from mice i.v. injected with different amounts of177Lu-octreotate, resulting in absorbed dose to the kidney of 0.13–13 Gy 24 h after injection. Pathways and upstream regulators which are associated with immuneresponse are highlighted in bold.doi:10.1371/journal.pone.0112645.t002
miRNA Regulation after 177Lu-octreotate Administration
PLOS ONE | www.plosone.org 8 November 2014 | Volume 9 | Issue 11 | e112645
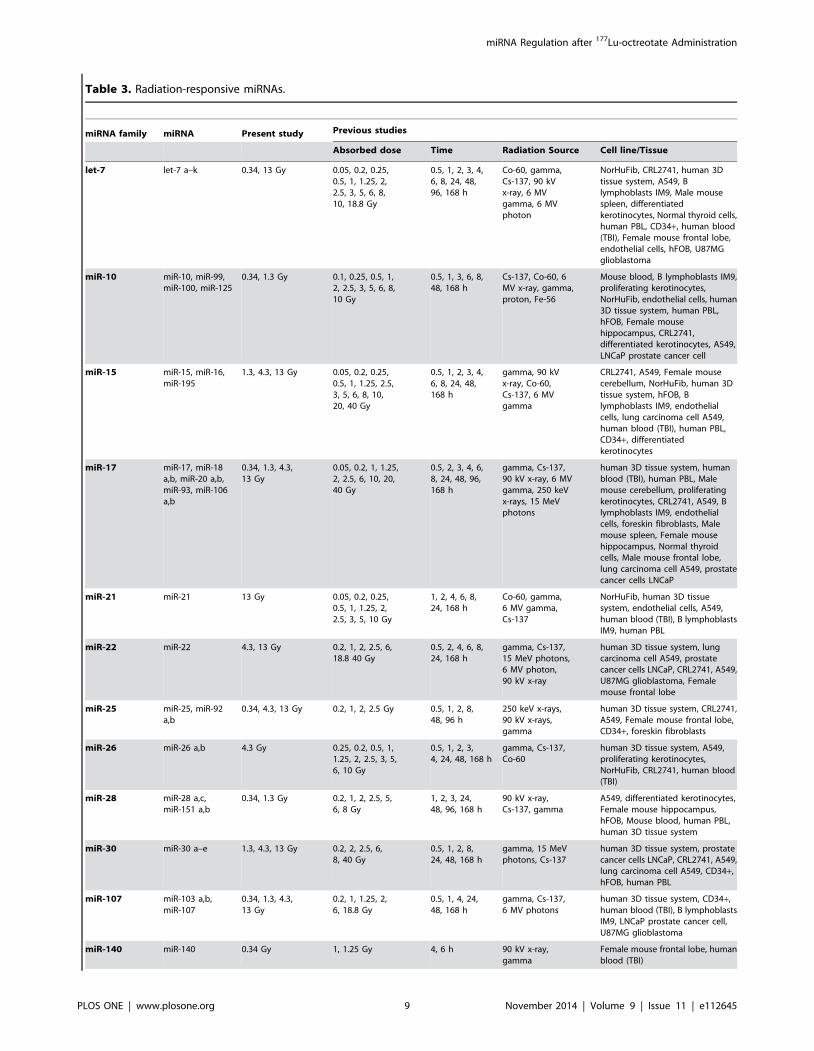
Table 3. Radiation-responsive miRNAs.
miRNA family miRNA Present study Previous studies
Absorbed dose Time Radiation Source Cell line/Tissue
let-7 let-7 a–k 0.34, 13 Gy 0.05, 0.2, 0.25,0.5, 1, 1.25, 2,2.5, 3, 5, 6, 8,10, 18.8 Gy
0.5, 1, 2, 3, 4,6, 8, 24, 48,96, 168 h
Co-60, gamma,Cs-137, 90 kVx-ray, 6 MVgamma, 6 MVphoton
NorHuFib, CRL2741, human 3Dtissue system, A549, Blymphoblasts IM9, Male mousespleen, differentiatedkerotinocytes, Normal thyroid cells,human PBL, CD34+, human blood(TBI), Female mouse frontal lobe,endothelial cells, hFOB, U87MGglioblastoma
miR-10 miR-10, miR-99,miR-100, miR-125
0.34, 1.3 Gy 0.1, 0.25, 0.5, 1,2, 2.5, 3, 5, 6, 8,10 Gy
0.5, 1, 3, 6, 8,48, 168 h
Cs-137, Co-60, 6MV x-ray, gamma,proton, Fe-56
Mouse blood, B lymphoblasts IM9,proliferating kerotinocytes,NorHuFib, endothelial cells, human3D tissue system, human PBL,hFOB, Female mousehippocampus, CRL2741,differentiated kerotinocytes, A549,LNCaP prostate cancer cell
miR-15 miR-15, miR-16,miR-195
1.3, 4.3, 13 Gy 0.05, 0.2, 0.25,0.5, 1, 1.25, 2.5,3, 5, 6, 8, 10,20, 40 Gy
0.5, 1, 2, 3, 4,6, 8, 24, 48,168 h
gamma, 90 kVx-ray, Co-60,Cs-137, 6 MVgamma
CRL2741, A549, Female mousecerebellum, NorHuFib, human 3Dtissue system, hFOB, Blymphoblasts IM9, endothelialcells, lung carcinoma cell A549,human blood (TBI), human PBL,CD34+, differentiatedkerotinocytes
miR-17 miR-17, miR-18a,b, miR-20 a,b,miR-93, miR-106a,b
0.34, 1.3, 4.3,13 Gy
0.05, 0.2, 1, 1.25,2, 2.5, 6, 10, 20,40 Gy
0.5, 2, 3, 4, 6,8, 24, 48, 96,168 h
gamma, Cs-137,90 kV x-ray, 6 MVgamma, 250 keVx-rays, 15 MeVphotons
human 3D tissue system, humanblood (TBI), human PBL, Malemouse cerebellum, proliferatingkerotinocytes, CRL2741, A549, Blymphoblasts IM9, endothelialcells, foreskin fibroblasts, Malemouse spleen, Female mousehippocampus, Normal thyroidcells, Male mouse frontal lobe,lung carcinoma cell A549, prostatecancer cells LNCaP
miR-21 miR-21 13 Gy 0.05, 0.2, 0.25,0.5, 1, 1.25, 2,2.5, 3, 5, 10 Gy
1, 2, 4, 6, 8,24, 168 h
Co-60, gamma,6 MV gamma,Cs-137
NorHuFib, human 3D tissuesystem, endothelial cells, A549,human blood (TBI), B lymphoblastsIM9, human PBL
miR-22 miR-22 4.3, 13 Gy 0.2, 1, 2, 2.5, 6,18.8 40 Gy
0.5, 2, 4, 6, 8,24, 168 h
gamma, Cs-137,15 MeV photons,6 MV photon,90 kV x-ray
human 3D tissue system, lungcarcinoma cell A549, prostatecancer cells LNCaP, CRL2741, A549,U87MG glioblastoma, Femalemouse frontal lobe
miR-25 miR-25, miR-92a,b
0.34, 4.3, 13 Gy 0.2, 1, 2, 2.5 Gy 0.5, 1, 2, 8,48, 96 h
250 keV x-rays,90 kV x-rays,gamma
human 3D tissue system, CRL2741,A549, Female mouse frontal lobe,CD34+, foreskin fibroblasts
miR-26 miR-26 a,b 4.3 Gy 0.25, 0.2, 0.5, 1,1.25, 2, 2.5, 3, 5,6, 10 Gy
0.5, 1, 2, 3,4, 24, 48, 168 h
gamma, Cs-137,Co-60
human 3D tissue system, A549,proliferating kerotinocytes,NorHuFib, CRL2741, human blood(TBI)
miR-28 miR-28 a,c,miR-151 a,b
0.34, 1.3 Gy 0.2, 1, 2, 2.5, 5,6, 8 Gy
1, 2, 3, 24,48, 96, 168 h
90 kV x-ray,Cs-137, gamma
A549, differentiated kerotinocytes,Female mouse hippocampus,hFOB, Mouse blood, human PBL,human 3D tissue system
miR-30 miR-30 a–e 1.3, 4.3, 13 Gy 0.2, 2, 2.5, 6,8, 40 Gy
0.5, 1, 2, 8,24, 48, 168 h
gamma, 15 MeVphotons, Cs-137
human 3D tissue system, prostatecancer cells LNCaP, CRL2741, A549,lung carcinoma cell A549, CD34+,hFOB, human PBL
miR-107 miR-103 a,b,miR-107
0.34, 1.3, 4.3,13 Gy
0.2, 1, 1.25, 2,6, 18.8 Gy
0.5, 1, 4, 24,48, 168 h
gamma, Cs-137,6 MV photons
human 3D tissue system, CD34+,human blood (TBI), B lymphoblastsIM9, LNCaP prostate cancer cell,U87MG glioblastoma
miR-140 miR-140 0.34 Gy 1, 1.25 Gy 4, 6 h 90 kV x-ray,gamma
Female mouse frontal lobe, humanblood (TBI)
miRNA Regulation after 177Lu-octreotate Administration
PLOS ONE | www.plosone.org 9 November 2014 | Volume 9 | Issue 11 | e112645
reported to be differentially regulated after ionizing radiation in
different cell lines, as well as in mouse spleen and brain, indicating
the importance of this miRNA gene family in the response to
ionizing radiation. In the present investigation, differential
expression of miR-34 was not observed. This finding does not,
however, show that p53 signaling pathway is not affected. It may
still be affected by other activation mechanisms via other miRNAs.
Furthermore, Simone et al. showed that miRNAs affected by
exposure to ionizing radiation also showed differential regulation
after exposure to H2O2 and etoposide [7]. This could indicate
putative common miRNA signatures in response to genotoxic
agents.
The majority of regulated miRNAs found in the present study
have previously been detected after irradiation of a variety of cell
lines and tissues with ionizing radiation (Table S1 and Table 3).
The let-7 miRNA family are involved in cell proliferation,
differentiation and inhibition of the Ras pathway [42,43] and is
one of the most commonly regulated miRNA family affected by
ionizing radiation [11,43–45]. The let-7 family has been found to
be regulated at 0.05–19 Gy in a variety of cell lines and time
points (0.5–168 h), and regulation of the let-7 family has also been
regulated after chronic exposure to low dose ionizing radiation
(3 mGy/h, 1 Gy) [46].
Other miRNA families that are commonly regulated after
ionizing radiation include the miR-10, 15, 17, and 181 families.
The miR-10 family includes four miRNAs (miR-10, 99, 100, and
125). miR-99 is involved in DNA damage response in breast and
prostate cancer cells, where overexpression showed an adverse
effect on the efficiency of DNA damage repair by both NHEJ and
homologous recombination [47]. Overexpression of miR-100 can
increase radiosensitivity in human glioma cells [21], while
radioprotective effects have been observed in epithelial cells after
miR-125a regulation [48]. The miR-15 family, including the miR-
15, 16, and 195 miRNAs, induce apoptosis by targeting BCL2
[49] and are direct transcriptional targets of E2F1 which is
involved in cell cycle control [50]. The miR-17 family (miR-17,
18, 20, 93, and 106) affect G1 checkpoint regulation, and
overexpression in cancers activates cell proliferation, while the
miR-181 family affect radiation sensitivity in certain cell lines [51].
Taken together, these miRNA families play an important role in
Table 3. Cont.
miRNA family miRNA Present study Previous studies
Absorbed dose Time Radiation Source Cell line/Tissue
miR-181 miR-181 a–d 0.34, 13 Gy 0.2, 1, 2, 2.5, 6,10, 18.8 Gy
0.5, 2, 3, 4,6, 8, 24, 96,168 h
gamma, 6 MVphoton, Cs-137,250 keV x-rays,90 kV x-ray
human 3D tissue system, A549,U87MG glioblastoma, human PBL,differentiated kerotinocytes,foreskin fibroblasts, Female mousespleen, Normal thyroid cells, Malemouse hippocampus, CRL2741,Female mouse cerebellum
miR-194 miR-194 0.34, 1.3, 4.3, 13 Gy 1, 2.5 Gy 2, 6, 24 h 90 kV x-ray, gamma Female mouse frontal lobe, A549
miR-199 miR-199 a,b 0.34, 1.3,4.3, 13 Gy
0.05, 0.2, 1.25,2, 6, 10 Gy
2, 8, 24 h 15 MeV photons,Cs-137, gamma
prostate cancer cells LNCaP, Blymphoblasts IM9, human blood(TBI), human PBL
miR-204 miR-204,miR-211
4.3, 13 Gy 0.5, 1, 5 Gy 6, 24, 96 h proton, 90 kVx-ray, Cs-137,Fe-56
mouse blood, Female mousecerebellum, Female mousehippocampus
miR-214 miR-214,miR-3120
0.34, 4.3 Gy 1, 2.5 Gy 2, 6, 8, 24 h 90 kV x-ray,gamma
Male mouse hippocampus, A549
mir-221 miR-221,miR-222
4.3 Gy 0.2, 0.25, 0.5, 1,1.25, 2, 2.5, 3,5, 10 Gy
0.5, 1, 2, 4,6, 8, 24, 48,96, 168 h
gamma, 90 kVx-ray, Cs-137,Co-60
human 3D tissue system, CRL2741,A549, human blood (TBI), Malemouse spleen, human PBL,NorHuFib, Female mousecerebellum
miR-342 miR-342 0.34 Gy 0.01, 0.5, 5,6, 10 Gy
3, 24 h Cs-137, Fe-56 B lymphoblasts IM9, differentiatedkerotinocytes, proliferatingkerotinocytes, Mouse blood
miR-361 miR-361 0.34, 1.3, 4.3 Gy 2.5 Gy 2, 8, 24 h gamma CRL2741, A549
miR-365 miR-365 a,b 0.13 Gy 1, 2.5, 10 Gy 2, 8, 24 h Cs-137, gamma Normal thyroid cells, A549, Blymphoblasts IM9
miR-378 miR-378 a–e 0.34 Gy 0.2, 2 Gy 4 h Cs-137 human PBL
miR-425 miR-425 1.3, 4.3 Gy 0.2, 2 Gy 0.5, 4, 48,168 h
Cs-137, gamma human 3D tissue system, humanPBL
miR-451 miR-451 a,b 4.3 Gy 1, 18.8 Gy 4, 6 h 90 kV x-ray, 6 MVphoton
Female mouse frontal lobe, U87MGglioblastoma
miR-2861 miR-2861 1.3, 4.3 Gy 2 Gy 1 h gamma CD34+
Differentially regulated miRNAs in the present study which have previously been associated with exposure to ionizing radiation. The miRNAs are categorized intomiRNA families according to the microRNA database miRBase (www.mirbase.org). For each family, a summary of at which absorbed doses and times after irradiation thisfamily has previously been found affected, together with radiation source and in which cell line/tissue it has been studied. A complete list with references are presentedin Table S1.doi:10.1371/journal.pone.0112645.t003
miRNA Regulation after 177Lu-octreotate Administration
PLOS ONE | www.plosone.org 10 November 2014 | Volume 9 | Issue 11 | e112645
cell stress responses, DNA repair, apoptosis and cell cycle control
and members of these families were found consistently differen-
tially regulated in the present study.
Eighteen miRNAs found in the present study have not
previously been associated with ionizing radiation, i.e. miR-484,
miR-677-3p, miR-690, miR-709, miR-1839-3p, miR-1902, miR-
2137, miR-3077-5p, miR-3084-3p, miR-3090-5p, miR-3096b-3p,
miR-3102-5p, miR-5627-5p, miR-6239, miR-6240, miR-6244,
miR-6402, and miR-6538. An explanation could be that these
miRNAs may be renal cortical tissue-specific. Two of the four
miRNAs (miR-3077 and miR-3090) which were commonly
regulated at the four highest absorbed doses were among these
18 miRNAs. To our knowledge no similar study has been
performed on kidney tissue. Thus, further studies are warranted
using larger sets of experimental assays to evaluate the role
ionizing radiation plays on the function of these miRNAs in
relation to tissue type, exposure conditions, time, and absorbed
dose.
Conclusion
In this study, distinct miRNA expression profiles were identified
in mouse renal cortical tissue after administration of 177Lu-
octreotate. The biological response observed revealed pronounced
effects on stress response pathways and p53 signaling at the highest
absorbed dose investigated (13 Gy). The miRNA signatures were
in general dose-specific. In some instances there was a correlation
between miRNA expression levels and the expression levels of
miRNA target genes. Furthermore, a number of miRNAs were
recurrently differentially expressed (miR-194-5p, miR-107-3p,
miR-3090-5p, and miR-3077-5p). However, more research is
needed to evaluate the role of these and other miRNAs in the
kidneys in response to radionuclide administration.
Supporting Information
Table S1 miRNAs responsive to ionizing radiation.
(PDF)
Acknowledgments
The authors thank Lilian Karlsson and Ann Wikstrom for their skilled
technical assistance.
Author Contributions
Conceived and designed the experiments: ES TZP KH EFA. Performed
the experiments: ES. Analyzed the data: ES TZP. Contributed reagents/
materials/analysis tools: ES TZP KH EFA. Wrote the paper: ES TZP KH
EFA.
References
1. Lambert B, Cybulla M, Weiner SM, Van De Wiele C, Ham H, et al. (2004)
Renal toxicity after radionuclide therapy. Radiat Res 161: 607–611.
2. De Jong M, Valkema R, Van Gameren A, Van Boven H, Bex A, et al. (2004)
Inhomogeneous localization of radioactivity in the human kidney after injection
of [(111)In-DTPA]octreotide. J Nucl Med 45: 1168–1171.
3. Melis M, Krenning EP, Bernard BF, Barone R, Visser TJ, et al. (2005)
Localisation and mechanism of renal retention of radiolabelled somatostatin
analogues. Eur J Nucl Med Mol Imaging 32: 1136–1143.
4. Svensson J, Molne J, Forssell-Aronsson E, Konijnenberg M, Bernhardt P (2012)
Nephrotoxicity profiles and threshold dose values for [(177)Lu]-DOTATATE in
nude mice. Nuclear medicine and biology 39: 756–762.
5. Vegt E, de Jong M, Wetzels JF, Masereeuw R, Melis M, et al. (2010) Renal
toxicity of radiolabeled peptides and antibody fragments: mechanisms, impact
on radionuclide therapy, and strategies for prevention. Journal of nuclear
medicine 51: 1049–1058.
6. Melis M, Krenning EP, Bernard BF, de Visser M, Rolleman E, et al. (2007)
Renal uptake and retention of radiolabeled somatostatin, bombesin, neuroten-
sin, minigastrin and CCK analogues: species and gender differences. Nucl Med
Biol 34: 633–641.
7. Simone NL, Soule BP, Ly D, Saleh AD, Savage JE, et al. (2009) Ionizing
radiation-induced oxidative stress alters miRNA expression. PLoS One 4: e6377.
8. Bentzen SM (2006) Preventing or reducing late side effects of radiation therapy:
radiobiology meets molecular pathology. Nature reviews Cancer 6: 702–713.
9. Rubin P, Johnston CJ, Williams JP, McDonald S, Finkelstein JN (1995) A
perpetual cascade of cytokines postirradiation leads to pulmonary fibrosis.
Int J Radiat Oncol Biol Phys 33: 99–109.
10. Williams J, Chen Y, Rubin P, Finkelstein J, Okunieff P (2003) The biological
basis of a comprehensive grading system for the adverse effects of cancer
treatment. Semin Radiat Oncol 13: 182–188.
11. Dickey JS, Zemp FJ, Martin OA, Kovalchuk O (2011) The role of miRNA in the
direct and indirect effects of ionizing radiation. Radiat Environ Biophys 50: 491–
499.
12. Osada H, Takahashi T (2007) MicroRNAs in biological processes and
carcinogenesis. Carcinogenesis 28: 2–12.
13. Orom UA, Nielsen FC, Lund AH (2008) MicroRNA-10a binds the 59UTR of
ribosomal protein mRNAs and enhances their translation. Mol Cell 30: 460–
471.
14. Place RF, Li LC, Pookot D, Noonan EJ, Dahiya R (2008) MicroRNA-373
induces expression of genes with complementary promoter sequences. Proc Natl
Acad Sci U S A 105: 1608–1613.
15. Friedman RC, Farh KK, Burge CB, Bartel DP (2009) Most mammalian
mRNAs are conserved targets of microRNAs. Genome Res 19: 92–105.
16. Shkumatava A, Stark A, Sive H, Bartel DP (2009) Coherent but overlapping
expression of microRNAs and their targets during vertebrate development.
Genes Dev 23: 466–481.
17. Croce CM (2009) Causes and consequences of microRNA dysregulation in
cancer. Nat Rev Genet 10: 704–714.
18. Ferracin M, Veronese A, Negrini M (2010) Micromarkers: miRNAs in cancer
diagnosis and prognosis. Expert Rev Mol Diagn 10: 297–308.
19. Mendell JT, Olson EN (2012) MicroRNAs in stress signaling and human disease.
Cell 148: 1172–1187.
20. Leung AK, Sharp PA (2010) MicroRNA functions in stress responses. Mol Cell
40: 205–215.
21. Metheetrairut C, Slack FJ (2013) MicroRNAs in the ionizing radiation response
and in radiotherapy. Curr Opin Genet Dev 23: 12–19.
22. Jacobs LA, Bewicke-Copley F, Poolman MG, Pink RC, Mulcahy LA, et al.
(2013) Meta-analysis using a novel database, miRStress, reveals miRNAs that
are frequently associated with the radiation and hypoxia stress-responses. PLoS
One 8: e80844.
23. Schuler E, Parris TZ, Rudqvist N, Helou K, Forssell-Aronsson E (2011) Effects
of internal low-dose irradiation from 131I on gene expression in normal tissues
in Balb/c mice. EJNMMI research 1: 1–14.
24. Langen B, Rudqvist N, Parris TZ, Schuler E, Helou K, et al. (2013)
Comparative analysis of transcriptional gene regulation indicates similar
physiologic response in mouse tissues at low absorbed doses from intravenously
administered 211At. J Nucl Med 54: 990–998.
25. Rudqvist N, Parris TZ, Schuler E, Helou K, Forssell-Aronsson E (2012)
Transcriptional response of BALB/c mouse thyroids following in vivo astatine-
211 exposure reveals distinct gene expression profiles. EJNMMI research 2: 1–
12.
26. Schuler E, Rudqvist N, Parris TZ, Langen B, Helou K, et al. (2014)
Transcriptional response of kidney tissue after (177)Lu-octreotate administration
in mice. Nucl Med Biol 41: 238–247.
27. Dalmo J, Rudqvist N, Spetz J, Laverman P, Nilsson O, et al. (2012)
Biodistribution of 177Lu-octreotate and 111In-minigastrin in female nude mice
transplanted with human medullary thyroid carcinoma GOT2. Oncology
reports 27: 174–181.
28. Loevinger R, Budinger TF, Watson EE (1988) MIRD primer for absorbed dose
calculations: Society of Nuclear Medicine.
29. Miller WH, Hartmann-Siantar C, Fisher D, Descalle MA, Daly T, et al. (2005)
Evaluation of beta-absorbed fractions in a mouse model for 90Y, 188Re, 166Ho,
149Pm, 64Cu, and 177Lu radionuclides. Cancer biotherapy & radiopharma-
ceuticals 20: 436–449.
30. Moncayo R (2005) Cubilin and megalin in radiation-induced renal injury with
labelled somatostatin analogues: are we just dealing with the kidney? Eur J Nucl
Med Mol Imaging 32: 1131–1135.
31. Barone R, Borson-Chazot F, Valkema R, Walrand S, Chauvin F, et al. (2005)
Patient-specific dosimetry in predicting renal toxicity with (90)Y-DOTATOC:
relevance of kidney volume and dose rate in finding a dose-effect relationship.
J Nucl Med 46 Suppl 1: 99S–106S.
32. Forssell-Aronsson E, Spetz J, Ahlman H (2013) Radionuclide Therapy via
SSTR: Future Aspects from Experimental Animal Studies. Neuroendocrinology
97: 86–98.
miRNA Regulation after 177Lu-octreotate Administration
PLOS ONE | www.plosone.org 11 November 2014 | Volume 9 | Issue 11 | e112645
33. Schuler E, Rudqvist N, Parris TZ, Langen B, Spetz J, et al. (2014) Time- and
dose rate-related effects of internal Lu exposure on gene expression in mousekidney tissue. Nucl Med Biol 41: 825–832.
34. Wan YW, Mach CM, Allen GI, Anderson ML, Liu Z (2014) On the
reproducibility of TCGA ovarian cancer microRNA profiles. PLoS One 9:e87782.
35. Ach RA, Wang H, Curry B (2008) Measuring microRNAs: comparisons ofmicroarray and quantitative PCR measurements, and of different total RNA
prep methods. BMC Biotechnol 8: 69.
36. Templin T, Young EF, Smilenov LB (2012) Proton radiation-induced miRNAsignatures in mouse blood: characterization and comparison with 56Fe-ion and
gamma radiation. Int J Radiat Biol 88: 531–539.37. Joly-Tonetti N, Vinuelas J, Gandrillon O, Lamartine J (2013) Differential
miRNA expression profiles in proliferating or differentiated keratinocytes inresponse to gamma irradiation. BMC Genomics 14: 184.
38. Weidhaas JB, Babar I, Nallur SM, Trang P, Roush S, et al. (2007) MicroRNAs
as potential agents to alter resistance to cytotoxic anticancer therapy. CancerRes 67: 11111–11116.
39. Templin T, Amundson SA, Brenner DJ, Smilenov LB (2011) Whole mouseblood microRNA as biomarkers for exposure to gamma-rays and (56)Fe ion.
Int J Radiat Biol 87: 653–662.
40. Chaudhry MA, Kreger B, Omaruddin RA (2010) Transcriptional modulation ofmicro-RNA in human cells differing in radiation sensitivity. Int J Radiat Biol 86:
569–583.41. Hu H, Gatti RA (2011) MicroRNAs: new players in the DNA damage response.
J Mol Cell Biol 3: 151–158.
42. He L, He X, Lim LP, de Stanchina E, Xuan Z, et al. (2007) A microRNA
component of the p53 tumour suppressor network. Nature 447: 1130–1134.
43. Bussing I, Slack FJ, Grosshans H (2008) let-7 microRNAs in development, stem
cells and cancer. Trends Mol Med 14: 400–409.
44. Johnson CD, Esquela-Kerscher A, Stefani G, Byrom M, Kelnar K, et al. (2007)
The let-7 microRNA represses cell proliferation pathways in human cells.
Cancer Res 67: 7713–7722.
45. Kasinski AL, Slack FJ (2010) Potential microRNA therapies targeting Ras,
NFkappaB and p53 signaling. Curr Opin Mol Ther 12: 147–157.
46. Chaudhry MA, Omaruddin RA, Kreger B, de Toledo SM, Azzam EI (2012)
Micro RNA responses to chronic or acute exposures to low dose ionizing
radiation. Mol Biol Rep 39: 7549–7558.
47. Mueller AC, Sun D, Dutta A (2013) The miR-99 family regulates the DNA
damage response through its target SNF2H. Oncogene 32: 1164–1172.
48. Wagner-Ecker M, Schwager C, Wirkner U, Abdollahi A, Huber PE (2010)
MicroRNA expression after ionizing radiation in human endothelial cells.
Radiat Oncol 5: 25.
49. Cimmino A, Calin GA, Fabbri M, Iorio MV, Ferracin M, et al. (2005) miR-15
and miR-16 induce apoptosis by targeting BCL2. Proc Natl Acad Sci U S A
102: 13944–13949.
50. Ofir M, Hacohen D, Ginsberg D (2011) MiR-15 and miR-16 are direct
transcriptional targets of E2F1 that limit E2F-induced proliferation by targeting
cyclin E. Mol Cancer Res 9: 440–447.
51. Chen J, Zhou H, Li Q, Qiu M, Li Z, et al. (2011) Epigenetic modification of
RhoE expression in gastric cancer cells. Oncol Rep 25: 173–180.
miRNA Regulation after 177Lu-octreotate Administration
PLOS ONE | www.plosone.org 12 November 2014 | Volume 9 | Issue 11 | e112645


![MicroRNA Expression Variability in Human Cervical Tissuesria.ua.pt/bitstream/10773/28633/1/Pereira et al. - 2010 - MicroRNA Expression...[15]. They found reduced expression of miR-143](https://static.fdocuments.in/doc/165x107/5f88fbeb4fa53d1db9542a31/microrna-expression-variability-in-human-cervical-et-al-2010-microrna-expression.jpg)


