Distinct-element analysis of an offshore wind turbine ...
17
Distinct-element analysis of an offshore wind turbine monopile under cyclic lateral load Nuo Duan PhD Lecturer, Institute of Foundation and Structure Technologies, Zhejiang Sci-Tech University, Hangzhou, Zhejiang, P. R. China; formerly Department of Civil, Environmental and Geomatic Engineering, University College London, London, UK (corresponding author: [email protected]) (Orcid:0000-0003-2585-9594) Yi Pik Cheng PhD Senior Lecturer, Department of Civil, Environmental and Geomatic Engineering, University College London, London, UK Xiaomin Xu PhD Research Associate, Department of Engineering, University of Cambridge, Cambridge, UK This paper presents a distinct-element method study of the dynamic behaviour of a rigid bored monopile for an offshore wind turbine foundation subject to force-controlled cyclic lateral loads. A two-dimensional model of a granular assembly was developed using the particle flow code. The model was consolidated under high gravity to simulate existing centrifuge model tests. The simulation results showed great similarity to the published experimental measurements in terms of the relationship between loading and the normalised lateral displacement. The dependency of the accumulated rotation, lateral deflection and stiffness on the two key loading characteristics, loading magnitude and direction, were analysed. Particle-scale information was employed to reveal the micromechanics of these dynamic behaviours. It was seen that relative particle displacement fields provided clear micro-scale evidence of the development of shear zones induced by the lateral cyclic loading of the pile. Meanwhile, local void densification was also observed through particle movements. Notation c u uniformity coefficient d l distance of measurement circle overlap (mm) d pd distance between the centre of pile and model boundary (mm) d pile pile diameter (mm) d pp distance between the centres of two adjacent pile clump particles (mm) d 10 10% particle diameter (mm) d 50 50% particle diameter (mm) d 60 60% particle diameter (mm) E p particle Young’s modulus (Pa) f 1 first natural frequency g gravitational acceleration (m/s 2 ) K 0 lateral stress coefficient k a1 soil–pile unloading stiffness at first cycle (N/m) k aN soil–pile unloading stiffness at Nth cycle (N/m) k b1 soil–pile loading stiffness at first cycle (N/m) k bN soil–pile loading stiffness at Nth cycle (N/m) k n particle normal stiffness (N/m) k s particle shear stiffness (N/m) L 1 distance of applied horizontal force from soil surface, eccentricity (mm) L 2 model pile penetration depth (mm) m d radius of measurement circle (mm) P lateral load (N) P max maximum applied forces in cyclic loading (N) P min minimum applied forces in cyclic loading (N) P R maximum bearing capacity from the static test (N) R radius of particle for pile (mm) Y max,N displacement at maximum horizontal load for the Nth cycle Y max,1 displacement at maximum horizontal load for the 1st cycle Y 1 displacement at maximum horizontal load for the 1st cycle Y 500 displacement at maximum horizontal load for the 500th cycle γ bulk unit weight (kN/m 3 ) μ friction coefficient of the particles ζ b , ζ c load characteristic parameters 1. Introduction The offshore wind farm industry is expanding rapidly in many countries. This is driven by the increasing demand for renewable, sustainable and green energy, as well as strong public support. For a typical wind turbine (e.g. 2 MW) in 2040 m water depth, the tower is commonly supported by a monopile foundation, which consists of a steel tube of 48m dia. The long-term performance of monopile foundations under wind and wave actions has therefore become increasingly important for the offshore wind turbine industry (Houlsby, 2016; Kirkwood and Haigh, 2013a). Centrifuge modelling and 1g physical modelling are effective alternatives to understand the influence of cyclic loads on monopile foundations. Forexample, Li et al. (2010) performed a centrifuge test on a 1/100 scale monopile in sand at 100g to model the behaviour of monopile foundations for offshore 1 Geotechnical Engineering Distinct-element analysis of an offshore wind turbine monopile under cyclic lateral load Duan, Cheng and Xu Proceedings of the Institution of Civil Engineers http://dx.doi.org/10.1680/jgeen.16.00171 Paper 1600171 Received 19/09/2016 Accepted 15/03/2017 Keywords: geotechnical engineering/granular materials/ offshore engineering ICE Publishing: All rights reserved Downloaded by [] on [24/04/17]. Copyright © ICE Publishing, all rights reserved.
Transcript of Distinct-element analysis of an offshore wind turbine ...

Distinct-element analysis of an offshore windturbine monopile under cyclic lateral loadNuo Duan PhDLecturer, Institute of Foundation and Structure Technologies,Zhejiang Sci-Tech University, Hangzhou, Zhejiang, P. R. China;formerly Department of Civil, Environmental and Geomatic Engineering,University College London, London, UK (corresponding author:[email protected]) (Orcid:0000-0003-2585-9594)
Yi Pik Cheng PhDSenior Lecturer, Department of Civil, Environmental and GeomaticEngineering, University College London, London, UK
Xiaomin Xu PhDResearch Associate, Department of Engineering, University of Cambridge,Cambridge, UK
This paper presents a distinct-element method study of the dynamic behaviour of a rigid bored monopile for anoffshore wind turbine foundation subject to force-controlled cyclic lateral loads. A two-dimensional model of agranular assembly was developed using the particle flow code. The model was consolidated under high gravity tosimulate existing centrifuge model tests. The simulation results showed great similarity to the published experimentalmeasurements in terms of the relationship between loading and the normalised lateral displacement. The dependencyof the accumulated rotation, lateral deflection and stiffness on the two key loading characteristics, loading magnitudeand direction, were analysed. Particle-scale information was employed to reveal the micromechanics of these dynamicbehaviours. It was seen that relative particle displacement fields provided clear micro-scale evidence of thedevelopment of shear zones induced by the lateral cyclic loading of the pile. Meanwhile, local void densification wasalso observed through particle movements.
Notationcu uniformity coefficientdl distance of measurement circle overlap (mm)dpd distance between the centre of pile and model
boundary (mm)dpile pile diameter (mm)dpp distance between the centres of two adjacent pile
clump particles (mm)d10 10% particle diameter (mm)d50 50% particle diameter (mm)d60 60% particle diameter (mm)Ep particle Young’s modulus (Pa)f1 first natural frequencyg gravitational acceleration (m/s2)K0 lateral stress coefficientka1 soil–pile unloading stiffness at first cycle (N/m)kaN soil–pile unloading stiffness at Nth cycle (N/m)kb1 soil–pile loading stiffness at first cycle (N/m)kbN soil–pile loading stiffness at Nth cycle (N/m)kn particle normal stiffness (N/m)ks particle shear stiffness (N/m)L1 distance of applied horizontal force from soil
surface, eccentricity (mm)L2 model pile penetration depth (mm)md radius of measurement circle (mm)P lateral load (N)Pmax maximum applied forces in cyclic loading (N)Pmin minimum applied forces in cyclic loading (N)PR maximum bearing capacity from the static test (N)R radius of particle for pile (mm)
Ymax,N displacement at maximum horizontal load for theNth cycle
Ymax,1 displacement at maximum horizontal load for the1st cycle
Y1 displacement at maximum horizontal load for the1st cycle
Y500 displacement at maximum horizontal load for the500th cycle
γ bulk unit weight (kN/m3)μ friction coefficient of the particlesζb, ζc load characteristic parameters
1. IntroductionThe offshore wind farm industry is expanding rapidly inmany countries. This is driven by the increasing demand forrenewable, sustainable and green energy, as well as strongpublic support. For a typical wind turbine (e.g. 2 MW) in20�40 m water depth, the tower is commonly supported by amonopile foundation, which consists of a steel tube of 4�8 mdia. The long-term performance of monopile foundationsunder wind and wave actions has therefore become increasinglyimportant for the offshore wind turbine industry (Houlsby,2016; Kirkwood and Haigh, 2013a).
Centrifuge modelling and 1g physical modelling are effectivealternatives to understand the influence of cyclic loads onmonopile foundations. For example, Li et al. (2010) performeda centrifuge test on a 1/100 scale monopile in sand at 100g tomodel the behaviour of monopile foundations for offshore
1
Geotechnical Engineering
Distinct-element analysis of an offshorewind turbine monopile under cycliclateral loadDuan, Cheng and Xu
Proceedings of the Institution of Civil Engineers
http://dx.doi.org/10.1680/jgeen.16.00171Paper 1600171Received 19/09/2016 Accepted 15/03/2017Keywords: geotechnical engineering/granular materials/offshore engineering
ICE Publishing: All rights reserved
Downloaded by [] on [24/04/17]. Copyright © ICE Publishing, all rights reserved.
wind turbines. The homogeneous dense sand specimen had arelative density of 97%. A logarithmic trend of the accumu-lated lateral displacement against the number of cycles, and anincrease in foundation stiffness with cycling, were revealed.The logarithmic trend was proposed earlier by Long andVanneste (1994) for full-scale slender pile tests and was alsoobserved in 1g tests by Peralta and Achmus (2010). Kirkwoodand Haigh (2013b) suggested the cyclic loading ratio of lateralloads applied to the monopile, ζc, which determined the direc-tion of the cyclic loading, could change the stiffness of the soilsurrounding the pile. A negative value of ζc could lead toincreasing pile head displacement and rotation because a rever-sal in the loading direction induced a reduction of locked instresses. Leblanc et al. (2010) performed a set of scaled mono-pile model tests subjected to cyclic lateral loads. The accumu-lation of pile rotation and change in the induced secantunloading stiffness of the system were observed, although thetests were conducted under 1g conditions. Also, the resultswere different from those of the centrifuge tests by Li et al.(2010). The accumulation of lateral displacement was assumedto follow a power law. Other model tests (such as Bhattacharyaet al., 2013; Guo et al., 2015; Yu et al., 2015) also showed anincrease in foundation stiffness. When this happens, the naturalfrequency of the whole system also increases as the Eigen fre-quency is proportional to the square root of stiffness.
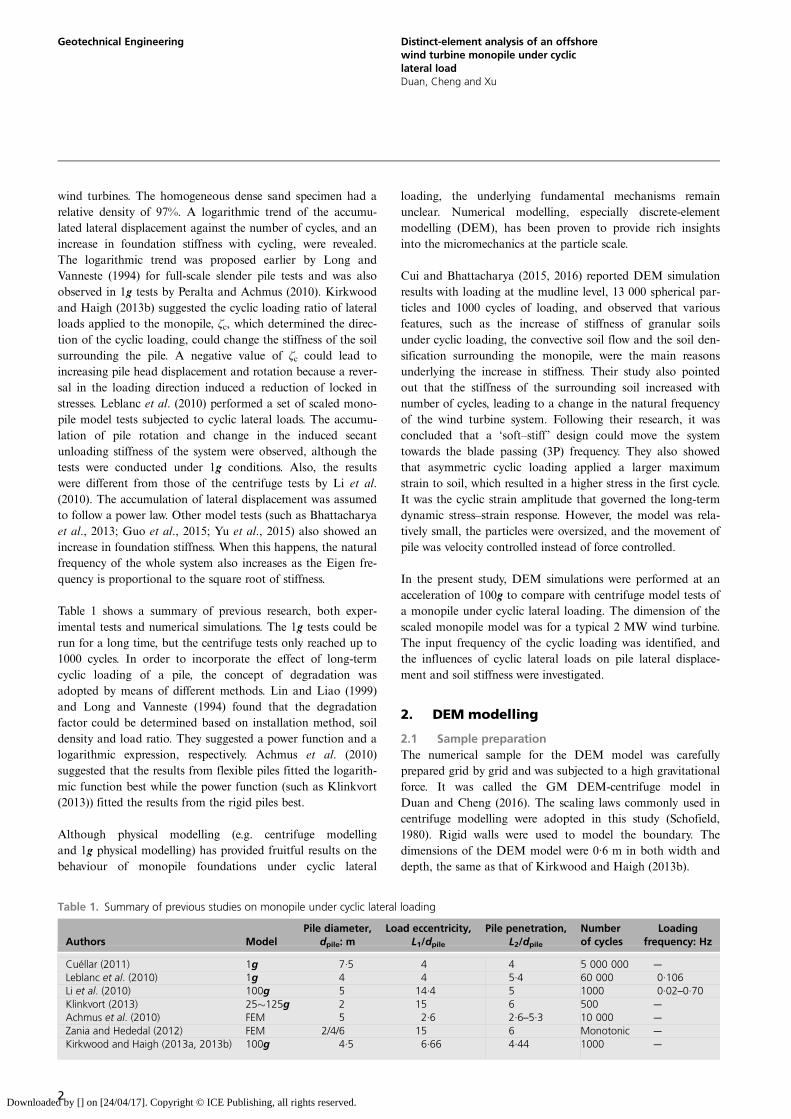
Table 1 shows a summary of previous research, both exper-imental tests and numerical simulations. The 1g tests could berun for a long time, but the centrifuge tests only reached up to1000 cycles. In order to incorporate the effect of long-termcyclic loading of a pile, the concept of degradation wasadopted by means of different methods. Lin and Liao (1999)and Long and Vanneste (1994) found that the degradationfactor could be determined based on installation method, soildensity and load ratio. They suggested a power function and alogarithmic expression, respectively. Achmus et al. (2010)suggested that the results from flexible piles fitted the logarith-mic function best while the power function (such as Klinkvort(2013)) fitted the results from the rigid piles best.
Although physical modelling (e.g. centrifuge modellingand 1g physical modelling) has provided fruitful results on thebehaviour of monopile foundations under cyclic lateral
loading, the underlying fundamental mechanisms remainunclear. Numerical modelling, especially discrete-elementmodelling (DEM), has been proven to provide rich insightsinto the micromechanics at the particle scale.
Cui and Bhattacharya (2015, 2016) reported DEM simulationresults with loading at the mudline level, 13 000 spherical par-ticles and 1000 cycles of loading, and observed that variousfeatures, such as the increase of stiffness of granular soilsunder cyclic loading, the convective soil flow and the soil den-sification surrounding the monopile, were the main reasonsunderlying the increase in stiffness. Their study also pointedout that the stiffness of the surrounding soil increased withnumber of cycles, leading to a change in the natural frequencyof the wind turbine system. Following their research, it wasconcluded that a ‘soft–stiff ’ design could move the systemtowards the blade passing (3P) frequency. They also showedthat asymmetric cyclic loading applied a larger maximumstrain to soil, which resulted in a higher stress in the first cycle.It was the cyclic strain amplitude that governed the long-termdynamic stress–strain response. However, the model was rela-tively small, the particles were oversized, and the movement ofpile was velocity controlled instead of force controlled.
In the present study, DEM simulations were performed at anacceleration of 100g to compare with centrifuge model tests ofa monopile under cyclic lateral loading. The dimension of thescaled monopile model was for a typical 2 MW wind turbine.The input frequency of the cyclic loading was identified, andthe influences of cyclic lateral loads on pile lateral displace-ment and soil stiffness were investigated.
2. DEM modelling
2.1 Sample preparationThe numerical sample for the DEM model was carefullyprepared grid by grid and was subjected to a high gravitationalforce. It was called the GM DEM-centrifuge model inDuan and Cheng (2016). The scaling laws commonly used incentrifuge modelling were adopted in this study (Schofield,1980). Rigid walls were used to model the boundary. Thedimensions of the DEM model were 0·6 m in both width anddepth, the same as that of Kirkwood and Haigh (2013b).
Table 1. Summary of previous studies on monopile under cyclic lateral loading
Authors ModelPile diameter,
dpile: mLoad eccentricity,
L1/dpile
Pile penetration,L2/dpile
Numberof cycles
Loadingfrequency: Hz
Cuéllar (2011) 1g 7·5 4 4 5 000 000 —
Leblanc et al. (2010) 1g 4 4 5·4 60 000 0·106Li et al. (2010) 100g 5 14·4 5 1000 0·02–0·70Klinkvort (2013) 25�125g 2 15 6 500 —
Achmus et al. (2010) FEM 5 2·6 2·6–5·3 10 000 —
Zania and Hededal (2012) FEM 2/4/6 15 6 Monotonic —
Kirkwood and Haigh (2013a, 2013b) 100g 4·5 6·66 4·44 1000 —
2
Geotechnical Engineering Distinct-element analysis of an offshorewind turbine monopile under cycliclateral loadDuan, Cheng and Xu
Downloaded by [] on [24/04/17]. Copyright © ICE Publishing, all rights reserved.

In the first stage during sample generation, sand particlesinside each grid were generated one by one, as illustrated inFigure 1. Approximately 280 particles were created in eachgrid, with an initial average porosity of 0·25, and the modelwas brought to the equilibrium state. After the bottom layer ofsoil was formed, all the internal walls between the grids weredeleted and the locations of the surface soil particles were tem-porarily fixed until the layer above was successfully formed.This process was repeated until all the particles in all 36 gridswere created, resulting in a total of 10 080 particles in thewhole model. In the second stage, a 100g gravity force in they direction was applied to the whole system, and the particleflow code (PFC) model was numerically cycled again to obtainthe equilibrium state. At this point the porosity had reachedthe final average value of 0·185. In the third stage, the sandparticles inside the pile zone were deleted and a series ofclumps was created to model the rigid monopile. The systemwas then cycled to an equilibrium state again with the pile inplace.
The sand particles were made of discs with a maximumdiameter of 7·05 mm, a minimum diameter of 4·5 mm, anaverage diameter d50 = 5·85 mm and uniformity coefficientcu = d60/d10 = 1·26 (see Figure 2). Table 2 shows the input par-ameters used in the DEM simulations; note the three-dimen-sional (3D) units presented in this paper were based on a unitdepth calculation.
Figure 3(a) presents the distribution of initial void ratio in theDEM model. The average void ratio line slightly decreaseswith soil depth, with a variation of 0·05. A uniformly distribu-ted void ratio, with a slightly lower value at the bottom, wasachieved using the proposed grid method (GM). Figure 3(b)compares the average lateral and vertical stress distributionswith depth. The value of lateral stress coefficient K0 is 0·65.
2.2 Pile installationThe pile used in this study was rigid. It was made of 4940small-sized particles with radius R of 1·125 mm, forming itsfour sides, as shown in Figure 4(a). The pile particles over-lapped each other, and the distance between the centres of two
(a) (b)
x
y
x
y
GM61
Loca
tion
1
md
Loca
tion
2
Loca
tion
3
Loca
tion
4
Loca
tion
5
Loca
tion
6GM66
GM11 GM16
Figure 1. Schematic view of the grid method (Duan and Cheng, 2016)
0
20
40
60
80
100
4 5 6 7 8
Perc
enta
ge p
assi
ng: %
Particle diameter: mm
d50 = 5·85 mmd60 /d10 = 1·26
Figure 2. Particle size distribution used in DEM modelling
Table 2. Input parameters for DEM simulations
Density of sand particles: kg/m3 2650Density of clump particles for pile: kg/m3 66·65Sand grain size, d50: mm 5·85Friction coefficient of soil and pile particles, μ 0·5Sand particle Young’s modulus, Ep: Pa 4�107
Contact normal stiffness of particles, kn: N/m 8�107
Particle stiffness ratio (ks/kn) 0·25Contact normal stiffness of walls, kn: N/m 6�1012
Initial average porosity 0·25Final average porosity (after adding gravity) 0·185Bulk unit weight, γ bulk: kN/m
3 2115·3
3
Geotechnical Engineering Distinct-element analysis of an offshorewind turbine monopile under cycliclateral loadDuan, Cheng and Xu
Downloaded by [] on [24/04/17]. Copyright © ICE Publishing, all rights reserved.

adjacent particles, dpp, was 0·2R. In order to satisfy the densityequivalence condition, the density of the clump particles wasscaled accordingly. A smooth pile surface was achieved due tothe small size and the short distance between particles used.
Figure 4 also shows a sketch for the model including thelocation and dimensions of the pile, and a snapshot of thesand particles at the final equilibrium state. The dimensions ofthe DEM model followed those of the experimental set-up incentrifuge modelling. The monopile in the DEM simulationshad a diameter dpile of 45 mm (�8d50) and a penetration depth
L2 of 200 mm (�34d50); the cyclic load was applied at aloading eccentricity L1 of 300 mm above the soil surface usinga sine function. The direction of the first cycle was left, andthe left side was treated as the passive side and the right sidewas the active side.
2.3 Lateral loading characteristicsThe applied cyclic lateral loading characteristics are commonlydescribed using two constants, ζb and ζc, as expressed below(Klinkvort, 2013; Leblanc et al., 2010; Long and Vanneste,1994; Rosquoet et al., 2007).
(a) (b)
0
10
20
30
40
50
0 0·1 0·2 0·3 0·4 0·5
Prot
otyp
e de
pth:
m
Average void ratio
0
10
20
30
40
50
0 200 400 600 800 1000
Prot
otyp
e de
pth:
m
Stress: kPa
K0 = 0·65
Lateral stress
Vertical stress
Figure 3. Soil condition at equilibrium before pile installation: (a) distribution of initial void ratio; (b) average vertical and lateral stress
x
y
Applied cyclic loading
(b)
Pile
L 1 =
300
mm
277·5 mm
dpile = 45 mm
Soil
L 2 =
200
mm
277·5 mm
dpp = 0·2R
dpp = 0·2R
(a)
d10 = 2·55 mm
d50 = 2·925 mm
d60= 2·95 mm
R = 1·125 mm
Figure 4. Schematic view of the PFC model: (a) close-up view of pile clumps; (b) a typical particle assembly at equilibrium before pileinstallation
4
Geotechnical Engineering Distinct-element analysis of an offshorewind turbine monopile under cycliclateral loadDuan, Cheng and Xu
Downloaded by [] on [24/04/17]. Copyright © ICE Publishing, all rights reserved.

1: ζ b ¼Pmax
PR
2: ζ c ¼Pmin
Pmax
where Pmax and Pmin are the maximum and minimum appliedcyclic load; PR is the maximum bearing capacity from thestatic test, which is defined as the load corresponding to asettlement that is equal to 10% of the pile diameter(PR= 1850 N in this study (Duan and Cheng, 2015)). ζb is anormalised force parameter that describes how close the cyclicmagnitudes are carried out to the static bearing capacity. Forinstance, when ζb = 1, the cycles are carried out at a magnitudereaching the static bearing capacity. On the other hand, ζcdescribes the direction of the cyclic loading, with ζc≥ 0 forone-way loading and ζc < 0 for two-way loading. When usingdimensional analysis to transform results from a model to aprototype scale, some knowledge of the relevant phenomena isnormally required to determine the governing parameters(Randolph, 1981). It is assumed here that there is no porepressure build-up during the quasi-static lateral loading of themonopile. Also the cyclic lateral loading characteristicsdescribed in this paper do not consider wind and wave
misalignments, even if they do not often act in the same direc-tion. As a result, this may lead to an overprediction of foun-dation tilting by the DEM simulations, following the findingsby Nikitas et al. (2016).
3. Comparison with centrifugetesting results
The long-term cyclic loading of wind turbine foundationscan change the surrounding soil’s stiffness, and hence theresonant frequency of the soil–pile system, which can lead tothe accumulation of irreversible deformations (Cui andBhattacharya, 2016). Offshore wind turbines are subjected tomultiple loads: wind, waves, rotational frequency (1P) andblade passing frequency (3P) loads. The loads on the foun-dation are a combination of cyclic and dynamic loads. Thewind will apply cyclic load, but the 1P and 3P will applydynamic loads. The wave loading can be mildly dynamic orseverely dynamic depending on the turbine size. The inter-actions of these loads could be complicated (Arany et al.,2016), but they are not considered in this paper. The typicalexcitation ranges are 1P (0·18�0·32 Hz) and 3P (0·5�1 Hz).So far, offshore wind turbines have been designed with the firstnatural frequency, f1 (0·32�0·5 Hz), which is between 1P and3P. In the wind industry sector this is referred to as a ‘soft–stiff ’ structure. However, it is possible to design a ‘soft–soft’structure with f1 below 1P, or a ‘stiff–stiff ’ structure with f1
1·0
1·2
1·4
1·6
1·8
0 100 200 300 400 500
Ym
ax,N
/Ym
ax,1
Ym
ax,N
/Ym
ax,1
Number of cycles
(a) (b)
(c)
T4-3
Hz_30Hz_40Hz_50E4-3
1·0
1·2
1·4
1·6
1·8
0 100 200 300 400 500
Number of cycles
T2-3
Hz_30Hz_40Hz_50E2-3
1
1·2
1·4
1·6
1·8
0 100 200 300 400 500
Ym
ax,N
/Ym
ax,1
Number of cycles
T3-1
Hz_30Hz_40Hz_50E3-1
Figure 5. Comparison of normalised lateral displacement (N=500 relative to N=1) between the centrifuge experimental and theGM-DEM model results at different loading frequencies when ζb= 0·36: (a) ζc = 0, (b); ζc = 0·5; (c) ζc =−0·5
5
Geotechnical Engineering Distinct-element analysis of an offshorewind turbine monopile under cycliclateral loadDuan, Cheng and Xu
Downloaded by [] on [24/04/17]. Copyright © ICE Publishing, all rights reserved.

above 3P. The choice of frequency range for f1 depends on thestiffness of the foundation. In general, less steel is required fora soft structure (Arshad and O’Kelly, 2013; Cuéllar, 2011; Cuiand Bhattacharya, 2015; Leblanc, 2009).
In this paper, only the impacts of the wave and wind loads wereconsidered. For example, the frequency of the wave was around0·1 Hz, and so the applied load frequency at 100g was 10 Hzdue to the scaling law. However, in centrifuge modelling, aslisted in Table 1, the typical applied loading frequency rangedfrom 0·02 Hz to 0·7 Hz at the 100g level, implying that a verylow prototype frequency range was modelled. It should be notedthat, in DEM modelling, the input loading frequency alsogreatly affects the simulation time. For example, a ten-cyclesimulation of this DEM model under 0·1 Hz requires a week(for 3·6 GHz, 32 G random access memory (Ram) capacity).Therefore, it is essential to find an appropriate loading frequencyto ensure a reasonable and efficient modelling.
Figure 5 shows the comparison between the DEM model andcentrifuge experimental results at three different loading fre-quencies (i.e. 30 Hz, 40 Hz and 50 Hz). The magnitude of ζbis fixed at 0·36, and the value of ζc is varied from −0·5 to 0·5.For each DEM modelling, the normalised lateral displacementYmax,N/Ymax,1 was extracted, and then compared with that of
the centrifuge modelling results from Klinkvort (2013). It canbe seen from the figures that the DEM simulation with 40 Hzloading frequency matched best with that of the centrifugeexperimental data. Therefore, the loading frequency of 40 Hzwas chosen for all the following DEM simulations inthis study.
Figure 6 presents another comparison between the DEMmodelling results and centrifuge modelling results at ζc =−0·5,with a loading frequency of 40 Hz. For small values of ζb(e.g. ζb = 0·08, as shown in Figure 6(a)), the DEM results givea lower prediction than those of the centrifuge modelling(E1-4). However, the differences between the DEM modellingand centrifuge modelling become much smaller when ζbranges from 0·18 to 0·36. The normalised accumulated lateraldisplacement obtained from both the DEM tests and the cen-trifuge experiments matches well, as shown in Figures 6(b)and 6(c). Hence, a larger ζb value results in a better compari-son between the two-dimensional (2D) simulation and the 3Dcentrifuge tests. It was found that the first ten cycles inducedthe most significant amount of normalised displacement. Thisphenomenon was seen both in the centrifuge model data andthe DEM simulation data. In total, 15 different cases withvarious loading characteristics were analysed, as listed inTables 3 and 4.
0·6
0·8
1·0
1·2
1·4
1·6
1·8
0 100 200 300 400 500
Ym
ax,N
/Ym
ax,1
0·6
0·8
1·0
1·2
1·4
1·6
1·8
Ym
ax,N
/Ym
ax,1
Number of cycles
(a)
0 100 200 300 400 500
Number of cycles
(b)
(c)
T1-4
Hz_40
E1-4
T1-2
Hz_40
E1-2
0·6
0·8
1.0
1·2
1·4
1·6
1·8
0 100 200 300 400 500
Ym
ax,N
/ Y
max
,1
Number of cycles
T3-1
Hz_40
E3-1
Figure 6. Comparison of the normalised lateral displacement (N=500 relative to N=1) between the centrifuge experimental results andthe GM-DEM model results when ζc =−0·5: (a) ζb = 0·08; (b) ζb = 0·18; (c) ζb = 0·36
6
Geotechnical Engineering Distinct-element analysis of an offshorewind turbine monopile under cycliclateral loadDuan, Cheng and Xu
Downloaded by [] on [24/04/17]. Copyright © ICE Publishing, all rights reserved.

4. Results and discussion
4.1 The effect of loading characteristicsTo highlight the influence of loading characteristics, Figures 7and 8 present a comparison of normalised lateral displacementfor different values of ζb and ζc, respectively. It can be seenfrom Figure 7 that, for both cases with ζc =−0·5 and ζc = 0,as ζb increases from 0·08 to 0·5, the normalised accumulateddisplacement increases. There is only a very limited increase ofthe normalised lateral displacement when the value of ζb
increases from 0·5 to 0·6. This is most likely due to the limit-ations in soil densification or a boundary effect. When ζb isabove 0·6, it is considered a very large loading amplitudewithin the normal service time.
Figures 8(a) and 8(b) shows all the simulations under the sameζb = 0·36 and ζb = 0·5, respectively. Both figures show verysimilar phenomena. The results show that when ζc is −0·5, thetwo-way loading results in the greatest pile head displacement,whereas when ζc is positive at 0·5, the one-way loading resultsin the smallest pile head displacement. This means that, forany two-way test with the same ζb, the displacement increaseswith the absolute value of ζc, and for any one-way loadingwith the same ζb, the displacement decreases with increasingζc. Hence, the loading direction ζc substantially controls themagnitude of pile head displacement. Both Figures 7 and 8present a phenomenon whereby the principle lateral displace-ment occurs in the first ten cycles, for all cases, and then tendsnot to vary afterwards. This characteristic was also observedby Chen et al. (2015).
Figure 9 summarises the influences of the two loading charac-teristics, ζc and ζb, on the normalised lateral displacement. Itcan be observed from Figure 9(a) that Ymax,N/Ymax,1 generallyincreases as ζb increases. This trend is in line with the pub-lished data from centrifuge modelling. The effect of ζc, onthe other hand, is more complex. Interestingly, both theDEM results and the centrifuge data show very similar trends,although with different transition points. In general, the DEMmodelling data obtained are comparable with those from thecentrifuge modelling.
4.2 Accumulated lateral displacements relatedto two-way loading
Figure 10 presents the first ten cycles of three cases of lateralforce–displacement curves of the monopile under differentdirections of cyclic lateral loads (ζc =−0·5, 0 and 0·5) for thesame amplitude (ζb = 0·38). The lateral displacements of thepile were measured at the pile head. In Figure 10(a) when ζc is
Table 3. Loading cases of centrifuge experimental tests (Klinkvort,2013)
Experiment ζb ζc
Diameter of pile:mm
E1-2 0·18 −0·46�−0·32 28E1-3 0·36 −0·46�−0·32 28E1-4 0·08 −0·46�−0·32 28E2-3 0·25�0·29 0·54 40E3-1 0·33�0·34 −0·5 40E4-3 0·15�0·36 0·05 40
Table 4. Loading cases of the DEM GM-centrifuge simulations
DEM ζb ζc Y1: mm Y500: mm
T1-2 0·18 −0·5 0·4393 0·6970T1-3 0·36 −0·37 0·9326 1·4648T1-4 0·08 −0·5 0·2095 0·2887T2-1 0·3 −0·8 0·7213 1·1719T2-2 0·3 −0·9 0·7166 1·1358T2-3 0·36 0·5 1·0215 1·4194T3-1 0·36 −0·5 0·9061 1·4448T4-3 0·36 0 0·9711 1·4802T5-1 0·3 0 0·8300 1·1800T5-2 0·4 0 1·0500 1·6700T5-3 0·5 0 1·3300 2·2600T5-4 0·6 0 1·5900 2·7400T6-2 0·5 −0·5 1·2400 2·1900T6-3 0·5 −0·37 1·2500 2·1700T6-4 0·5 0·5 1·4000 2·2000
(a) (b)
0·6
0·8
1·0
1·2
1·4
1·6
1·8
0 100 200 300 400 500
Ym
ax,N
/Ym
ax,1
0·6
0·8
1·0
1·2
1·4
1·6
1·8
Ym
ax,N
/Ym
ax,1
Number of cycles
0 100 200 300 400 500
Number of cycles
T5-1: ζb = 0·3T5-2: ζb = 0·4T5-3: ζb = 0·5T5-4: ζb = 0·6
T1-4:ζb = 0·08T1-2:ζb = 0·18T3-1:ζb = 0·36T6-2: ζb = 0·5
Figure 7. Effect of ζb on the normalised lateral displacement (N=500 relative to N=1): (a) ζc =−0·5; (b) ζc = 0
7
Geotechnical Engineering Distinct-element analysis of an offshorewind turbine monopile under cycliclateral loadDuan, Cheng and Xu
Downloaded by [] on [24/04/17]. Copyright © ICE Publishing, all rights reserved.

negative, implying a two-way loading test, larger accumulatedlateral displacements are seen compared to the one-way tests(see Figures 10(b) and 10(c)). In Figure 10, the unloading stiff-nesses in the first and the tenth cycle are marked with ka1 andka10, and their actual values are shown in Table 5. It is clearfrom Figure 10 and Table 5 that ka10 is always smaller than ka1in any of the three cases. This implies that the foundationmoves slightly more within each cycle (when unloading stiff-ness reduces) with an increasing number of cycles. The extentof this stiffness reduction becomes most significant in the one-way loading case (ka10/ka1 = 25% when ζc = 0·5), which ismainly controlled by the initially high unloading stiffness valuein the first cycle when ζc is positive.
In general, the loading and unloading in the first cycle exhibitsevident soil non-linearity, so the loading secant stiffnessreduces with increasing lateral displacement in the first cycle.
These loading stiffnesses are, however, an indication of thefoundation stiffness, and they are marked as kb1 and kb10in Figure 10. For the same applied loading amplitude(ζb = 0·38), Table 6 shows that the initial foundation stiffnesseskb1 of all the three cases are similar, ranging from 1·02 to 1·49.But the foundation stiffnesses after ten cycles kb10 increase inall three cases, with the greatest increase also in the one-wayloading case when ζc is positive (kb10/kb1 = 339%). Clearly, thesoil–pile interactions of all three cases induce a reduction inthe porosity of the soil (the soil densifies) with increasingnumber of cycles, hence the foundation stiffness increasesand the incremental accumulation of permanent displacementreduces, as was shown by Cui and Bhattacharya (2016).Accordingly, the natural frequency of the system increases asthe Eigen frequency is proportional to the square root of stiff-ness (Bhattacharya et al., 2013; Guo et al., 2015; Yu et al.,2015).
0·6
0·8
1·0
1·2
1·4
1·6
1·8
0 100 200 300 400 500
Ym
ax,N
/Ym
ax,1
0·6
0·8
1·0
1·2
1·4
1·6
1·8
Ym
ax,N
/Ym
ax,1
Number of cycles
T3-1: ζc = –0·5T1-3: ζc = –0·37T4-3: ζc = 0T2-3: ζc = 0·5
0 100 200 300 400 500
Number of cycles(a) (b)
T6-2: ζc = –0·5T6-3: ζc = –0·37T5-3: ζc = 0T6-4: ζc = 0·5
Figure 8. Effect of ζc on the normalised lateral displacement (N=500 relative to N=1): (a) ζb = 0·36; (b) ζb = 0·5
0
0·4
0·8
1·2
1·6
2·0
2·4
0 0·2 0·4
(a) (b)
0·6
Ym
ax,N
/Ym
ax,1
Ym
ax,N
/Ym
ax,1
0
0·4
0·8
1·2
1·6
2·0
2·4
–1·0 –0·5 0 0·5 1·0
ζb = 0·30 (DEM)ζb = 0·36 (DEM)ζb = 0·37 (DEM)ζb = 0·25~0·29 (Klinkvort, 2013)ζb = 0·15~0·36(Klinkvort, 2013)
ζc = –0·50 (DEM)ζc = –0·37 (DEM)ζc = –0·37 (DEM)ζc = –0·37 (DEM)ζc = –0·37 (Klinkvort, 2013)
ζb ζc
Figure 9. Effect of (a) ζb and (b) ζc on the normalised lateral displacement (N=500 relative to N=1)
8
Geotechnical Engineering Distinct-element analysis of an offshorewind turbine monopile under cycliclateral loadDuan, Cheng and Xu
Downloaded by [] on [24/04/17]. Copyright © ICE Publishing, all rights reserved.

Table 5 also shows that the unloading stiffness gradient ka1 isrelatively small when the loading direction is two-way(ζc =−0·5). As the number of loading cycles increases, there isa gradual accumulation of both the maximum loading displa-cement (cyclic maxima) and the minimum unloading displace-ment (cyclic minima). The unloading stiffness kaN continues toreduce slightly from its first cycle. However, these accumu-lations of displacement and changes in stiffness are not asdominant as those induced by the direction of loading, that is,
what happened in the first cycle. For example in test T3-1, thefirst unloading from 666 to −333 N created a recoil of0·79 mm and the final unloading created a recoil of 1·12 mmin the tenth cycle. It may be seen in Figure 10(b) that the firstreloading induced 0·4 mm lateral displacement from 0 to666 N and the final unloading created a recoil of 0·606 mm inthe tenth cycle. In Figure 10(c), the first reloading inducedonly 0·146 mm lateral displacement from 0 to 666 N and thefinal unloading created a recoil of 0·273 mm in the tenth cycle.
–400
–300
–200
–100
0
100
200
300
400
500
600
700
0 0·5 1·0 1·5Hor
izon
tal l
oad:
N
Displacement: mm
0
100
200
300
400
500
600
700
0 0·5 1·0 1·5H
oriz
onta
l loa
d: N
Displacement: mm
(a) (b)
ka1 ka10
kb1
kb10
ka1 ka10
kb1 kb10
300
400
500
600
700
0 0·5 1·0 1·5
Hor
izon
tal l
oad:
N
Displacement: mm
(c)
ka10
kb1 kb10
ka1
Figure 10. Pile head lateral load–displacement responses with ζb = 0·36 during the first ten cyclic lateral loadings: (a) T3-1, ζc =− 0·5(maximum displacement 1·404 mm); (b) T4-3, ζc = 0 (maximum displacement 1·384 mm); (c) T2-3, ζc = 0·5 (maximum displacement1·366 mm)
Table 5. Unloading stiffness ka1 and ka10 of selected model tests
DEM ζb ζc ka1 ka10 ka10/ka1: %
T3-1 0·36 −0·5 1·81 1·52 84T4-3 0·36 0 3·20 1·75 55T2-3 0·36 0·5 10·48 2·67 25
Table 6. Foundation stiffness kb1 and kb10 of selected model tests
DEM ζb ζc kb1 kb10 kb10/kb1: %
T3-1 0·36 −0·5 1·02 1·52 149T4-3 0·36 0 1·49 2·36 158T2-3 0·36 0·5 1·31 4·44 339
9
Geotechnical Engineering Distinct-element analysis of an offshorewind turbine monopile under cycliclateral loadDuan, Cheng and Xu
Downloaded by [] on [24/04/17]. Copyright © ICE Publishing, all rights reserved.

From Table 5, when ζc increases, both ka1 and kaN increase.Nonetheless, the values of kN/k1 decrease dramatically, whichmeans that the change of stiffness is more obvious as long asthe loading direction changes from two-way into one-way (ζcincreases).
4.3 Evolution of unloading secant stiffness ratioFurther comparisons of all cases of ka500/ka1 are shown inFigure 11. Figure 11(a) shows the impact of changes in ζb,whereas Figure 11(b) shows the impact of changes in ζc,and Klinkvort (2013) data are also shown in the figures forcomparison. In Figure 11(a), although Klinkvort (2013) showsthat ka500/ka1 increases as ζb increases, this increase is notthat obvious when all the DEM simulation cases are plottedtogether in the same figure. In Figure 11(a), when ζc is positive(= 0·5), the increase of ζb causes an enhancement of the stiff-ness ratio. However, when ζc = 0 with the loading characteristicstill one-way, the stiffness ratio decreases a little with anincrease of ζb. When ζc < 0 with the loading characteristictwo-way, the stiffness ratio fluctuates. The DEM data appearto be different from what was observed by Klinkvort (2013).The differences can be seen more clearly in Figure 11(b).When ζc < 0, the stiffness ratio generally drops with theincrease of ζc, which is consistent with Klinkvort (2013) exper-imental data. However, when ζc > 0, the changes of the stiffnessratio seem to be related more to the magnitude of loading, ζb.Figure 10 and Table 5 indicate that, in all cases, the unloadingstiffness reduces with the number of cycles, and it is believedthat the stiffness ka1 controls the stiffness ratio.
4.4 Particle-scale observationsParticle-scale information was extracted from the DEMsimulations, to explore the fundamental mechanisms of the
different behaviour of monopiles under various loadingcharacteristics.
4.4.1 Effect of ζbFigure 12 compares the accumulated particle displacementfields, with ζb ranging from 0·08 to 0·50 (ζc =−0·50). Inthese figures, positive displacements mean particles moving tothe right. For each case, the particle displacement fields atthe first cycle (see Figures 12(a)–12(d)), the 500th cycle (seeFigures 12(e)–12(h)) and the normalised particle displacement,namely, the 500th particle displacement divided by first(see Figures 12(i)–12(l)), are plotted. Note that the legendscale for the first two cases (case A: ζb = 0·08 and case B:ζb = 0·18, as described in Table 4) is ten times smaller than thatof the last two cases (case C: ζb = 0·36 and case D: ζb = 0·50, asdescribed in Table 4).
For all the four cases presented here, the soil influencing zonesare almost of the same conical shape near the pile head, witha relatively larger area on the passive side than on the active.The influence of ζb on the particle displacement field is evidentfrom these figures. In the first cycle, the magnitude of theminimum left model scale particle displacements at the pilehead of case A (see Figure 12(a)) and B (see Figure 12(b)) are0·079 mm and 0·123 mm, respectively. Taking the cut-offparticle displacement as 0·002 mm in these two cases, theirinfluencing zones on the passive side are at about 1·35dpile and3·35dpile. Meanwhile, the maximum right particle displace-ments at the toe of the pile are 0·022 mm and 0·054 mm,respectively. Very similar phenomena can also be observed inthe other two cases, case C and case D, where the minimumleft particle displacements at the pile head are 0·246 mm and0·337 mm, respectively.
0
0·5
1·0
1·5
2·0
0 0·2 0·4 0·6 0·8
KN
/K1
ζb
0
0·5
1·0
1·5
2·0
2·5
3·0
–1·0 –0·6 –0·2 0·2 0·6 1·0
KN
/K1
ζc
(a) (b)
ζb = 0·36 (DEM)
ζb = 0·3 (DEM)
ζb = 0·5 (DEM)
ζb = 0·15~0·36(Klinkvort, 2013)
ζb = 0·26~0·29(Klinkvort, 2013)
ζc = –0·50 (DEM)
ζc = –0·37 (DEM)
ζc = 0 (DEM)
ζc = 0·50 (DEM)
ζc = –0·46~–0·32(Klinkvort, 2013)
Figure 11. Effect of (a) ζb and (b) ζc on stiffness ratio (N=500 relative to N=1)
10
Geotechnical Engineering Distinct-element analysis of an offshorewind turbine monopile under cycliclateral loadDuan, Cheng and Xu
Downloaded by [] on [24/04/17]. Copyright © ICE Publishing, all rights reserved.

As the number of cycles increases, the cyclic loading effect isgradually accumulated. In the 500th cycle, the area of the influ-encing zones is almost doubled, compared to that of the first
cycle, as highlighted in Figures 12(e)–12(h). The minimum leftparticle displacements at the pile head are 0·089 mm, 0·215 mm,0·399 mm and 0·584 mm, for cases A, B, C and D, respectively.
X displacement
0·00036 × 10–5
3 × 10⁻⁵
2·5 × 10–5
2 × 10⁻⁵
1·5 × 10–5
1 × 10⁻⁵
5 × 10⁻⁶
0–5 × 10⁻⁶
–1 × 10⁻⁵
–1·5 × 10–5
–2 × 10⁻⁵
–2·5 × 10–5
–3 × 10⁻⁵
–6 × 10⁻⁵
–0·00012
0·00036 × 10–5
3 × 10⁻⁵
2·5 × 10–5
2 × 10⁻⁵
1·5 × 10–5
1 × 10⁻⁵
5 × 10⁻⁶
0–5 × 10⁻⁶
–1 × 10⁻⁵
–1·5 × 10–5
–2 × 10⁻⁵
–2·5 × 10–5
–3 × 10⁻⁵
–6 × 10⁻⁵
–0·00012
0·00036 × 10–5
3 × 10⁻⁵
2·5 × 10–5
2 × 10⁻⁵
1·5 × 10–5
1 × 10⁻⁵
5 × 10⁻⁶
0–5 × 10⁻⁶
–1 × 10⁻⁵
–1·5 × 10–5
–2 × 10⁻⁵
–2·5 × 10–5
–3 × 10⁻⁵
–6 × 10⁻⁵
–0·00012
0·00036 × 10–5
3 × 10⁻⁵
2·5 × 10–5
2 × 10⁻⁵
1·5 × 10–5
1 × 10⁻⁵
5 × 10⁻⁶
0–5 × 10⁻⁶
–1 × 10⁻⁵
–1·5 × 10–5
–2 × 10⁻⁵
–2·5 × 10–5
–3 × 10⁻⁵
–6 × 10⁻⁵
–0·00012
Cycle_001
X displacement
Cycle_001
0·0030·00060·00030·000250·00020·000150·00015 × 10–5
0–5 × 10⁻⁵
–0·0001–0·00015–0·0002–0·00025–0·0003–0·0006–0·0012
Cycle_001
X displacementX displacement
X displacementX displacement
0·0030·00060·00030·000250·00020·000150·00015 × 10–5
0–5 × 10⁻⁵
–0·0001–0·00015–0·0002–0·00025–0·0003–0·0006–0·0012
Cycle_1
Cycle_500 Cycle_500
ζb = 0·08, ζc = –0·50 ζb = 0·18, ζc = –0·50
ζb = 0·08, ζc = –0·50 ζb = 0·18, ζc = –0·50
ζb = 0·36, ζc = –0·50 ζb = 0·50, ζc = –0·50
(a) (b)
(c) (d)
(e) (f)
Figure 12. Effect of ζb on the accumulated particle horizontal displacement field (ζc =−0·50): (a) ζb = 0·08 (N=1);(b) ζb = 0·18 (N=1); (c) ζb = 0·36 (N=1); (d) ζb = 0·50 (N=1); (e) ζb = 0·08 (N=500); (f) ζb = 0·18 (N=500); (g) ζb = 0·36 (N=500); (h)ζb = 0·50 (N=500); (i) ζb = 0·08 (normalised); ( j) ζb = 0·18 (normalised); (k) ζb = 0·36 (normalised); (l) ζb = 0·50 (normalised) (continued onnext page)
11
Geotechnical Engineering Distinct-element analysis of an offshorewind turbine monopile under cycliclateral loadDuan, Cheng and Xu
Downloaded by [] on [24/04/17]. Copyright © ICE Publishing, all rights reserved.

This is further elaborated in Figures 12(i)–12(l), where the nor-malised particle displacements are plotted. The location of the‘zero’ value boundary for the first cycle is horizontal, but itchanges to a sloped curve to the passive side after 500 cycles.However, the location of this ‘zero’ particle displacement
boundary contour in contact with the pile remained nearly atthe same location. This has helped to identify the expansion ofthe zones of affected soil during the cyclic loading. This expan-sion is also due to the transfer of contact force from the pilemovement, which is a similar phenomenon to the spread of
X displacement
0·0030·00060·00030·000250·00020·000150·00015 × 10–5
0–5 × 10⁻⁵
–0·0001–0·00015–0·0002–0·00025–0·0003–0·0006–0·0012
0·0030·00060·00030·000250·00020·000150·00015 × 10–5
0–5 × 10⁻⁵
–0·0001–0·00015–0·0002–0·00025–0·0003–0·0006–0·0012
X displacement
Cycle_500 Cycle_500
NormX displacement
NormX displacement
NormX displacement
NormX displacement
543210
–1–2–3–4–5
543210
–1–2–3–4–5
543210
–1–2–3–4–5
543210
–1–2–3–4–5
ζb = 0·08, ζc = –0·50 ζb = 0·18, ζc = –0·50
ζb = 0·36, ζc = –0·50 ζb = 0·50, ζc = –0·50
ζb = 0·36, ζc = –0·50 ζb = 0·50, ζc = –0·50
(g) (h)
(i) ( j)
(k) (l)
Figure 12. Continued
12
Geotechnical Engineering Distinct-element analysis of an offshorewind turbine monopile under cycliclateral loadDuan, Cheng and Xu
Downloaded by [] on [24/04/17]. Copyright © ICE Publishing, all rights reserved.

stress fan (SOF) in the lower bound theory. Figure 13 showsthe distributions of the coordination number (defined as theaverage number of surrounding particles in contact with eachparticle near the pile) along the pile for the first and 500thcycles. The larger the coordination number, the denser the soil.No significant change of packing density is found in the firstcycle, in particular around the pile rotation centre, as can beseen in Figure 13(a). However, densification becomes obviousafter 500 cycles, and is the most significant when ζb = 0·50, asshown in Figure 13(b). Also, although more densificationappears near the soil surface, there is still densification aroundand below the pile rotation centre.
4.4.2 Effect of ζcFigure 14 shows the four cases with the same ζb (= 0·36), butζc varies from one-way loading to two-way loading from caseT1-4 to T6-2. Because of the same ζb, the distributions ofFigures 14(a)–14(d) are almost the same, and smaller ζc causeslarger displacement. This trend is also seen in Figure 11. Asmentioned above, negative ζc means that the cyclic loading istwo-way, and positive ζc means one-way loading. Comparingthe displacements in these figures, the two-way is obviouslylarger than the one-way.
After 500 cycles (see Figures 14(e)–14(h)), the area with displa-cements in the range from −0·05 to −0·1 mm is smaller thanthat in the range from −0·6 to −1·2 mm. This means that themovements of particles near the pile increase. From the areanear the pile tip in Figures 14(e)–14(h), it can be found thatthe phenomenon of SOF is shrinking during the cyclic test.However the trend is the opposite for the upper area near thepile. At the same time, when the value of ζc is small (i.e. nega-tive), the ‘zero’ value line inclines significantly. This change ismore obvious in Figures 14(i)–14(l) than in Figures 12(i)–12(l).Figure 15 shows that the degree of densification of soil around
the pile for one-way loading is generally less than that fortwo-way loading.
5. ConclusionsNumerical DEM simulations of a rigid monopile subject tolateral cyclic loading were performed to compare with data ofcentrifuge testings. The cyclic displacement accumulation wasmeasured up to 500 load cycles. These cyclic load testsincluded a range of load amplitudes that increased graduallythroughout the test. The low-level cyclic loads were chosen torepresent the normal working condition on a monopile, whilethe larger amplitudes represent extreme working conditions,such as storms and strong ocean currents. For the numericalsimulation, the frequency was also a very important factor,and 40 Hz was chosen for its good match with experimentalresults.
The main contributions of this paper are listed below.
& The first ten cycles had a strong influence onthe cyclic responses of a rigid monopile under cyclicloading;
& There was a close relationship between the accumulateddisplacement and the cyclic load ratio and amplitude. Theimpact of load amplitude was obvious. However, the cyclicload ratio was found to control the change ofdisplacement. This was revealed by having significantdifferences in the influence zones in the particledisplacement fields.
& The normalised lateral displacement decreased whenthe cyclic load ratio increased because one-way loadinginduced notably less displacement and densification onthe passive side than two-way loading. However,normalised lateral displacement increased with loadamplitude.
0
0·5
1·0
1·5
2·0
2·5
3·0
3·5
4·0
4·5
3·55 3·60 3·65 3·70 3·75 3·80
y/d p
ile
First cycle passive side coordinationnumber
T1-4: ζb = 0·08, ζc = –0·5T1-2: ζb = 0·18, ζc = –0·5T3-1: ζb = 0·36, ζc = –0·5T6-2: ζb = 0·50, ζc = –0·5
T1-4: ζb = 0·08, ζc = –0·5T1-2: ζb = 0·18, ζc = –0·5T3-1: ζb = 0·36, ζc = –0·5T6-2: ζb = 0·50, ζc = –0·5
0
0·5
1·0
1·5
2·0
2·5
3·0
3·5
4·0
4·5
3·55 3·60 3·65 3·70 3·75 3·80
y/d p
ile
500th cycle passive side coordinationnumber
(a) (b)
Figure 13. Effect of ζb on the average coordination number of particles on the passive side of the monopile (ζc =−0·50): (a) N=1;(b) N=500
13
Geotechnical Engineering Distinct-element analysis of an offshorewind turbine monopile under cycliclateral loadDuan, Cheng and Xu
Downloaded by [] on [24/04/17]. Copyright © ICE Publishing, all rights reserved.

& Under the same load amplitude, both the first cycle secantunloading stiffness ka1 and the tenth cycle secantunloading stiffness ka10 increased when the cyclic loadratio increased. Nonetheless, the value of the stiffness
ratio ka10/ka1 decreased dramatically. The change ofstiffness was more obvious with a larger cyclic load ratiobecause of the significantly different stiffness observed inthe first cycle.
X displacement
Cycle_001
X displacement
Cycle_001
0·0030·00060·00030·000250·00020·000150·00015 × 10–5
0–5 × 10⁻⁵
–0·0001–0·00015–0·0002–0·00025–0·0003–0·0006–0·0012
Cycle_001
X displacementX displacement
X displacementX displacement
0·0030·00060·00030·000250·00020·000150·00015 × 10–5
0–5 × 10⁻⁵
–0·0001–0·00015–0·0002–0·00025–0·0003–0·0006–0·0012
0·0030·00060·00030·000250·00020·000150·00015 × 10–5
0–5 × 10⁻⁵
–0·0001–0·00015–0·0002–0·00025–0·0003–0·0006–0·0012
0·0030·00060·00030·000250·00020·000150·00015 × 10–5
0–5 × 10⁻⁵
–0·0001–0·00015–0·0002–0·00025–0·0003–0·0006–0·0012
0·0030·00060·00030·000250·00020·000150·00015 × 10–5
0–5 × 10⁻⁵
–0·0001–0·00015–0·0002–0·00025–0·0003–0·0006–0·0012
0·0030·00060·00030·000250·00020·000150·00015 × 10–5
0–5 × 10⁻⁵
–0·0001–0·00015–0·0002–0·00025–0·0003–0·0006–0·0012
Cycle_1
Cycle_500 Cycle_500
ζb = 0·36, ζc = 0·50 ζb = 0·36, ζc = 0·00
ζb = 0·36, ζc = 0·50 ζb = 0·36, ζc = 0·00
ζb = 0·36, ζc = –0·37 ζb = 0·36, ζc = –0·50
(a) (b)
(c) (d)
(e) (f)
Figure 14. Effect of ζc on the accumulated particle horizontal displacement field (ζb = 0·36): (a) ζc = 0·50 (N=1); (b) ζc = 0·00 (N=1);(c) ζc =−0·37 (N=1); (d) ζc =−0·50 (N=1); (e) ζc = 0·50 (N=500); (f) ζc = 0·00 (N=500); (g) ζc =−0·37 (N=500); (h) ζc =−0·50 (N=500);(i) ζc = 0·50 (normalised); ( j) ζc = 0·00 (normalised); (k) ζc =−0·37 (normalised); (l) ζc =−0·50 (normalised) (continued on next page)
14
Geotechnical Engineering Distinct-element analysis of an offshorewind turbine monopile under cycliclateral loadDuan, Cheng and Xu
Downloaded by [] on [24/04/17]. Copyright © ICE Publishing, all rights reserved.

& The foundation stiffness increased when the cyclic numberincreased. This phenomenon was the same as that reportedby Cui and Bhattacharya (2016).
& The rotation centre of the rigid model pile remainedat approximately 0·853 times the pile buried
length during cyclic loading. An increase in theparticle coordination number was a goodmicromechanical indication of soil densification, andsoil densification was seen both above and below therotation centre.
X displacement
0·0030·00060·00030·000250·00020·000150·00015 × 10–5
0–5 × 10⁻⁵
–0·0001–0·00015–0·0002–0·00025–0·0003–0·0006–0·0012
0·0030·00060·00030·000250·00020·000150·00015 × 10–5
0–5 × 10⁻⁵
–0·0001–0·00015–0·0002–0·00025–0·0003–0·0006–0·0012
X displacement
Cycle_500 Cycle_500
NormX displacement
NormX displacement
NormX displacement
NormX displacement
543210
–1–2–3–4–5
543210
–1–2–3–4–5
543210
–1–2–3–4–5
543210
–1–2–3–4–5
ζb = 0·36, ζc = 0·50 ζb = 0·36, ζc = 0·00
ζb = 0·36, ζc = –0·37 ζb = 0·36, ζc = –0·50
ζb = 0·36, ζc = –0·37 ζb = 0·36, ζc = –0·50
(g) (h)
(i) ( j)
(k) (l)
Figure 14. Continued
15
Geotechnical Engineering Distinct-element analysis of an offshorewind turbine monopile under cycliclateral loadDuan, Cheng and Xu
Downloaded by [] on [24/04/17]. Copyright © ICE Publishing, all rights reserved.

REFERENCESAchmus M, Albiker J and Abdel-Rahman K (2010) Investigations
on the behavior of large diameter piles under cyclic lateralloading. In Frontiers in Offshore Geotechnics II (Gourvenec Sand White D (eds)). CRC Press, Boca Raton, FL, USA,pp. 471–476.
Arany L, Bhattacharya S, Macdonald JH and Hogan SJ (2016) Closedform solution of Eigen frequency of monopile supported offshorewind turbines in deeper waters incorporating stiffness ofsubstructure and SSI. Soil Dynamics and Earthquake Engineering83: 18–32, http://doi.org/10.1016/j.soildyn.2015.12.011.
Arshad M and O’Kelly BC (2013) Offshore wind-turbine structures: areview. Proceedings of the Institution of Civil Engineers – Energy166(4): 139–152, http://dx.doi.org/10.1680/ener.12.00019.
Bhattacharya S, Nikitas N, Garnseyc J et al. (2013) Observeddynamic soil-structure interaction in scale testing ofoffshore wind turbine foundations. Soil Dynamics andEarthquake Engineering 54: 47–60, http://doi.org/10.1016/j.soildyn.2013.07.012.
Chen RP, Sun YX, Zhu B and Guo WD (2015) Lateral cyclic pile–soilinteraction studies on a rigid model monopile. Proceedings of theInstitution of Civil Engineers – Geotechnical Engineering 168(2):120–130, http://dx.doi.org/10.1680/geng.14.00028.
Cuéllar P (2011) Pile Foundations for Offshore Wind Turbines:Numerical and Experimental Investigations on the Behaviourunder Short-Term and Long-Term Cyclic Loading. University ofTechnology Berlin, Berlin, Germany.
Cui L and Bhattacharya S (2015) Dynamic soil–structureinteraction around a monopile supporting a wind turbine.In Geomechanics from Micro to Macro (Soga K, Kumar K,Biscontin G and Kuo M (eds)). CRC Press, London, UK, vol. 1,pp. 335–340.
Cui L and Bhattacharya S (2016) Soil–monopile interactions foroffshore wind turbines. Proceedings of the Institution of CivilEngineers – Engineering and Computational Mechanics 169(4):171–182, http://dx.doi.org/10.1680/jencm.16.00006.
Duan N and Cheng YP (2015) Mechanical characteristics of monopilefoundation in sand for offshore wind turbine. Proceedings of the5rd International Workshop of Young Doctors in Geomechanics,Paris, France, pp. 155–161.
Duan N and Cheng YP (2016) A modified method of generatingspecimens for 2D DEM centrifuge model. Proceedings ofGEO-CHICAGO 2016: Sustainable Materials and ResourceConservation, Chicago, IL, USA (Farid A and De A, Reddy KR,Yesiller N, Zekkos D (eds)). American Society of Civil Engineers,Reston, VA, USA, pp. 610–620.
Guo Z, Yu LQ, Wang LZ, Bhattacharya S and Nikitas G (2015) Model testson the long-term dynamic performance of offshore wind turbinesfounded on monopiles in sand. Journal of Offshore Mechanics andArctic Engineering 137(4): 041902.
Houlsby GT (2016) Interactions in offshore foundation design.Géotechnique 66(10): 791–825.
Kirkwood P and Haigh S (2013a) Centrifuge testing of monopiles foroffshore wind turbines. In Proceedings of the 23rd InternationalOffshore and Polar Engineering Conference (ISOPE), Anchorage,AK, USA (Chung JS, Langen I, Kokkinus T and Wang AM (eds)).International Society of Offshore and Polar Engineers, Cupertino,CA, USA, pp. 126–130.
Kirkwood PB and Haigh SK (2013b) Centrifuge testing of monopilessubject to cyclic lateral loading. In Proceedings of 8th InternationalConference on Physical Modelling in Geotechnics (ICPMG2014),Perth, Australia (Gaudin C and White D (eds)). CRC Press,London, UK, vol. 2, pp. 827–832.
Klinkvort RT (2013) Centrifuge Modelling of Drained Lateral Pile – SoilResponse: Application for Offshore Wind Turbine SupportStructures. Technical University of Denmark, Kongens Lyngby,Denmark.
Leblanc C (2009) Design of Offshore Wind Turbine Support Structures:Selected Topics in the Field of Geotechnical Engineering.PhD thesis, Department of Civil Engineering, Aalborg University,Aalborg, Denmark.
Leblanc C, Houlsby GT and Byrne BW (2010) Response of stiff piles insand to long-term cyclic lateral loading. Géotechnique 60(2):79–90.
Li Z, Haigh SK and Bolton MD (2010) Centrifuge modelling of mono-pileunder cyclic lateral loads. In Proceedings of 7th InternationalConference on Physical Modelling in Geotechnics, Zurich,Switzerland (Springman S, Laue J and Seward L (eds)).CRC Press, Taylor & Francis Group, Boca Raton, FL, USA,vol. 2, pp. 965–970.
0
0·5
1·0
1·5
2·0
2·5
3·0
3·5
4·0
4·5
3·55 3·60 3·65 3·70 3·75 3·80
y/d p
ile
First cycle passive side coordinationnumber
T2-3: ζb = 0·36, ζc = 0·5
T4-3: ζb = 0·36, ζc = 0·0
T1-3: ζb = 0·36, ζc = –0·37
T3-1: ζb = 0·36, ζc = –0·5
T2-3: ζb = 0·36, ζc = 0·5
T4-3: ζb = 0·36, ζc = 0·0
T1-3: ζb = 0·36, ζc = –0·37
T3-1: ζb = 0·36, ζc = –0·5
0
0·5
1·0
1·5
2·0
2·5
3·0
3·5
4·0
4·5
3·55 3·60 3·65 3·70 3·75 3·80
y/d p
ile
500th cycle passive side coordinationnumber
(a) (b)
Figure 15. Effect of ζc on the average coordination number of particles on the passive side of the monopile (ζb = 0·36): (a) N=1;(b) N=500
16
Geotechnical Engineering Distinct-element analysis of an offshorewind turbine monopile under cycliclateral loadDuan, Cheng and Xu
Downloaded by [] on [24/04/17]. Copyright © ICE Publishing, all rights reserved.

Lin S and Liao J (1999) Permanent strains of piles in sand due to cycliclateral loads. Journal of Geotechnical and GeoenvironmentalEngineering 125(9): 798–802.
Long J and Vanneste G (1994) Effects of cyclic lateral loads on pilesin sand. Journal of Geotechnical Engineering 120(1): 225–244.
Nikitas G, Vimalan NJ and Bhattacharya S (2016) An innovativecyclic loading device to study long term performance of offshorewind turbines. Soil Dynamics and Earthquake Engineering 82:154–160, http://doi.org/10.1016/j.soildyn.2015.12.008.
Peralta P and Achmus M (2010) An experimental investigation of pilesin sand subjected to lateral cyclic loads. In Proceedings of 7thInternational Conference on Physical Modelling in Geotechnics,Zurich, Switzerland (Springman S, Laue J and Seward L (eds)).CRC Press, Boca Raton, FL, USA, vol. 1, pp. 985–990.
Randolph MF (1981) The response of flexible piles to lateral loading.Géotechnique 31(2): 247–259.
Rosquoet F, Thorel L, Garnier J and Canepa Y (2007) Lateral cyclicloading of sand-installed piles. Soils and Foundations 47(5): 821–832.
Schofield AN (1980) Cambridge geotechnical centrifuge operations.Géotechnique 30(3): 227–268.
Yu LQ, Wang LZ, Guo Z et al. (2015) Long-term dynamic behavior ofmonopile supported offshore wind turbines in sand. Theoreticaland Applied Mechanics Letters 5(2): 80–84.
Zania V and Hededal O (2012) Friction effects on lateral loadingbehavior of rigid piles. In Proceedings GeoCongress 2012(Hryciw RD, Athanasopoulos-Zekkos and Yesiller N (eds)).American Society of Civil Engineers, Reston, VA, USA,pp. 366–375.
How can you contribute?
To discuss this paper, please email up to 500 words to theeditor at [email protected]. Your contribution will beforwarded to the author(s) for a reply and, if consideredappropriate by the editorial board, it will be published asdiscussion in a future issue of the journal.
Proceedings journals rely entirely on contributions from thecivil engineering profession (and allied disciplines).Information about how to submit your paper onlineis available at www.icevirtuallibrary.com/page/authors,where you will also find detailed author guidelines.
17
Geotechnical Engineering Distinct-element analysis of an offshorewind turbine monopile under cycliclateral loadDuan, Cheng and Xu
Downloaded by [] on [24/04/17]. Copyright © ICE Publishing, all rights reserved.