Distance to Facility and Healthcare Utilization in ...
18
Distance to Facility and Healthcare Utilization in Tanzania: Unbiased and Consistent Estimation using Perturbed Location Data by Ryoko Sato, Mahesh Karra, Bilikisu Elewonibi, Michael Mhande, Sia Msuya, Iqbal Shah, David Canning Abstract Although access to health facilities is a major contributor to healthcare utilization, the accurate measurement of distance effects is difficult using Demographic and Health Surveys (DHS) since household location data is perturbed to protect respondents ’ confidentiality. We show the attenuation bias due to perturbation by using a survey of 3,950 women we conducted in Arusha, Tanzania where we can estimate distance effects both with accurate, and perturbed, data. Unbiased and consistent estimation using perturbed data is possible by numerical integration over all possible true locations, weighted by the probability the household is at that location. We show that for our Arusha sample this method produces estimates centered on those found with the true data. We then apply our method to DHS data showing that our estimates using numerical integration produce larger effects than those found by naive regressions using perturbed data. However, the magnitude of the difference is not large. Introduction Access to the health facility is considered as one of the important factors affecting health behaviors (for example, see: Rahaman et al, 1982; Muller et al, 1998; Stock et al, 1983; Buor 2003; Feikin et al, 2009; Alegana et al, 2012, Kumar et al, 2014). Wong and Benova (2017) conducted a meta-analysis on the relationship between physical access to health facilities and the utilization of skilled care for childbirth in sub-Saharan Africa. They found that the increased distance to maternity care had an inverse association with utilization. The accurate information of the access to health facilities, however, is often difficult to obtain. One way to capture the access to health facilities is to reply on the self-reported data on the distance and travel time to health facilities. However, the information based on the self- reported data is prone to biases induced by respondents if they do not have concrete ideas on geographical space and time. Furthermore, these errors might be correlated with outcome variables (Gibson and McKenzie, 2007). Lack of information on mode of transport which should be accompanied with the travel time also prevents any meaningful interpretation of the self- reported travel time. More objective and rigorous way to measure the access to health facilities is to calculate the minimum distance from respondents’ house location to health facilities using GPS coordinates. However, it is challenging to obtain the accurate information on the distance to health facilities from each respondent’s house location because it is common that surveys perturb the
Transcript of Distance to Facility and Healthcare Utilization in ...
Distance to Facility and Healthcare Utilization in Tanzania:
Unbiased and Consistent Estimation using Perturbed Location Data
by Ryoko Sato, Mahesh Karra, Bilikisu Elewonibi, Michael Mhande, Sia Msuya, Iqbal Shah,
David Canning
Abstract
Although access to health facilities is a major contributor to healthcare utilization, the accurate
measurement of distance effects is difficult using Demographic and Health Surveys (DHS) since
household location data is perturbed to protect respondents’ confidentiality. We show the
attenuation bias due to perturbation by using a survey of 3,950 women we conducted in Arusha,
Tanzania where we can estimate distance effects both with accurate, and perturbed, data.
Unbiased and consistent estimation using perturbed data is possible by numerical integration
over all possible true locations, weighted by the probability the household is at that location.
We show that for our Arusha sample this method produces estimates centered on those found
with the true data. We then apply our method to DHS data showing that our estimates using
numerical integration produce larger effects than those found by naive regressions using
perturbed data. However, the magnitude of the difference is not large.
Introduction
Access to the health facility is considered as one of the important factors affecting health
behaviors (for example, see: Rahaman et al, 1982; Muller et al, 1998; Stock et al, 1983; Buor
2003; Feikin et al, 2009; Alegana et al, 2012, Kumar et al, 2014). Wong and Benova (2017)
conducted a meta-analysis on the relationship between physical access to health facilities and
the utilization of skilled care for childbirth in sub-Saharan Africa. They found that the increased
distance to maternity care had an inverse association with utilization.
The accurate information of the access to health facilities, however, is often difficult to obtain.
One way to capture the access to health facilities is to reply on the self-reported data on the
distance and travel time to health facilities. However, the information based on the self-
reported data is prone to biases induced by respondents if they do not have concrete ideas on
geographical space and time. Furthermore, these errors might be correlated with outcome
variables (Gibson and McKenzie, 2007). Lack of information on mode of transport which should
be accompanied with the travel time also prevents any meaningful interpretation of the self-
reported travel time.
More objective and rigorous way to measure the access to health facilities is to calculate the
minimum distance from respondents’ house location to health facilities using GPS coordinates.
However, it is challenging to obtain the accurate information on the distance to health facilities
from each respondent’s house location because it is common that surveys perturb the
household location to protect respondents’ confidentiality. One of the well-known examples is
Demographic and Health Survey (DHS). DHS is the nationally-representative household survey
which collect detailed information on health behaviors and outcomes among respondents and
their children. DHS also collects GPS coordinates of each respondent. However, as Burgert et al
(2013) and Perez-Heydrich et al (2013) explain, these locations are randomly displaced. In particular,
the location data is perturbed randomly as follows; (1) A random angle between 0 and 360 degrees
for the displacement of each location is chosen; (2) A random distance according to the urban
and rural parameters is chosen; urban locations are displaced 0-2 kilometers while rural locations are
displaced 0-5 kilometers with 1% of them displaced 0-10 kilometers; (3) Combining the step (1) and
(2) to create a new latitude and longitude for the cluster; and (4) The new perturbed location is
checked to make sure it falls within designated administrative boundaries. If it does not, (1) and
(2) are repeated till it falls within boundaries.
Due to the utilization of the perturbed location data, the effect of the distance on outcomes in
interest might be attenuated and thus biased. For example, Kadobera et al (2012) finds that the
infant mortality is higher by 1.17 per 1,000 infants among those who reside more than 5 km
away from the nearest health facility, using the Tanzania DHS data. However, because their
estimation is based on the perturbed location data, the true effect of the distance might not be
the same as this effect found in the study.
This paper aims to evaluate the extent to which the measurement error in respondents’ location induced by the random displacement biases the estimation of the effect of the access
to health facilities, as a form of minimum distance from respondents’ location to the nearest
health facilities. In particular, we use the unique dataset which contains the accurate GPS
coordinates of respondents to measure the true effect of distance on health behaviors, and
compare it with the biased effect using the perturbed location that we intentionally created by
following the same procedure that DHS adopted.
To compare the true and biased estimator, we first show that the measurement error in
respondents’ location causes the attenuation bias in the estimation of the effect of distance
from respondents’ location to health facilities on outcomes. Using a survey of 3,950 women we
conducted in Arusha, Tanzania in which we have the accurate information on respondents’ location, we calculate the true effect of the distance to the nearest health facilities on the
likelihood of childbirths assisted by doctor. Using the true distance, we find that there is
significant and negative correlation between the distance to the nearest health facility and the
child delivery assisted by doctor. We then perturb the respondents’ location, following the
same procedure as DHS does to estimate the biased effect of distance. We find that the
perturbed location data biases the effect of distance on outcomes toward zero; it creates the
attenuation bias.
Next, we employ a method developed by Karra and Canning (2018) to correct the measurement
error of the distance to health facilities to derive the unbiased estimator of the distance. Karra
and Canning (2018) show that we can obtain the unbiased estimator by using the expected
value of the true minimum distance. We can construct the expected value by numerical
integration over all possible true locations, weighted by the probability the household is at that
location. We find that this numerical integration corrects the attenuation bias of the distance
effect using perturbed location data and the unbiased estimator of the distance effect is
derived from this method.
Finally, we apply the method of correcting the measurement error to the analysis using
Tanzania DHS data. We repeat the similar exercise of the numerical integration to estimate the
unbiased estimator of the effect of the distance on various variables related to health behaviors
and outcomes. Overall, we find the negative and significant effect of the distance to health
facilities on various health behaviors and outcomes. We also find that the magnitude of the
unbiased estimator using the numerical integration is often larger than that of the biased
estimator. However, the difference between the biased estimator using the perturbed GPS
coordinates and the unbiased and corrected estimator is not substantial.
This paper is the first to apply the method proposed by Karra and Canning (2018) to the actual
data to get the unbiased estimator.
Data
We use three different datasets. The first dataset we use is the household survey from Arusha
region in Tanzania which contains the accurate GPS coordinates of respondents. This data is
from a large study called Willows Impact Evaluation (WIE) project implemented by a NGO:
Willows International. The purpose of the WIE is to evaluate the effect of a community-based
program on contraceptive prevalence over time. The study is on-going and has been in
implementation in 4 countries: Ghana, Tanzania, Pakistan, and Turkey. This paper utilizes the
baseline survey conducted in Tanzania. The implementation site of WIE in Tanzania is urban
areas of Arusha region, the northern part of Tanzania. WIE project has collected the baseline
data from 3,950 women at childbearing age. The data contains detailed information around
women’s reproductive health such as the utilization of the modern family planning as well as
health facility utilization for antenatal care, child delivery, and postnatal care. It also contains
the accurate location (GPS coordinates) of each respondent’s household. The questionnaire of
the household survey from Arusha region under WIE is adopted from the questionnaire from
Tanzania DHS.
The second dataset is the Tanzania health facility census data (2016), provided by Ministry of
Health in Tanzania. This health facility census data contains the accurate GPS coordinates of all
the health facilities existent in Tanzania in 2016. To validate the completeness of the health
facility census, we compare the list of health facilities in census data and the list in health
facility survey that WIE project implemented. Health facility survey under WIE project collected
the information on various information on quality as well as GPS coordinates from all 39 health
facilities that women in the baseline survey utilized for the family planning services. The health
facility census consists of more health facilities than facilities from the WIE project. This is
because the health facility survey from WIE project only includes health facilities which provide
family planning services. We validate the completeness of the census data by comparing the list
of health facilities in the health facility survey from WIE project and the list of health facilities
from the health facility census data. We confirm that the census data contains almost all the
facilities (94.9%) collected in the health facility survey under WIE project.
Using the household survey data from Arusha and the health facility census data, we calculate
the accurate minimum distance from respondents’ house to the nearest health facility as the
GPS coordinates for respondents from the household survey in Arusha and all the health
facilities are available from these 2 datasets.
The third dataset is Tanzania DHS data (2015). The Tanzania DHS data is nationally-
representative household survey conducted in 2015 and 2016, collecting data from 13,266
women, and it contains the detailed information on health behaviors and outcomes among
women and their children. The GPS coordinates of each respondent is available but the location
data is perturbed. To create the random displacement of location, the combination of the
random angle (between 0 to 360 degrees) and the random distance (0-2 kilometers for urban
locations and 0-5 kilometers for rural locations) are chosen simultaneously.
To use the numerical integration to calculate the unbiased estimator of the distance effect, the
information on population density in each of all the possible locations is necessary because the
population density affects the probability that an individual resides at a particular location. We
use the population density data for Tanzania in 2015. The data is from WorldPop and the data
contains the information on the number of persons per grid square (100m x 100m) for the
entire areas in Tanzania.
To do the numerical integration, we need to define all the possible locations. The smaller grid
cell we use, the more precise estimate of the distance effect we can get. At the same time, the
smaller grid requires more intensive calculation for the numerical integration. In our analysis,
we use both 100m x 100m grid and 500m x 500m grid for the Arusha data, while we use 500m x
500m grid for the analysis using Tanzania DHS sample.
Methods
We use the household survey from Arusha to validate the method proposed by Karra and
Canning (2018). We first evaluate the effect of the actual distance to the nearest health facility
on health behaviors, using the accurate GPS coordinates of respondents’ location and of health
facilities. In this analysis, we focus on childbirths assisted by doctor as a main outcome. We
estimate the distance effect using the following regression specification; 𝑦�̂� = 𝛼 + 𝛽1 log(1 + 𝐷𝑖𝑠𝑡𝑖) + 𝜀𝑖 (1)
where 𝑦𝑖 is a dummy variable which takes 1 if a woman i delivers a baby assisted by a doctor; log (1 + 𝐷𝑖𝑠𝑡𝑖) is the logarithm of the distance from a woman i’s house to the nearest health facility. We
use (1 + 𝐷𝑖𝑠𝑡𝑖) to avoid the logarithm taking negative value if the distance is less than 1. We use the
predicted 𝑦𝑖, 𝑦�̂�, with the random error with mean 0 and standard deviation derived from the equation
(1) with the actual 𝑦𝑖, and simulate the equation (1) 1,000 times to obtain the distribution of 𝛽1̂.
After we estimate the true effect of distance on childbirths assisted by doctor, we then add the
random error to the respondents’ location in our Arusha study. We follow the procedure
adapted by DHS to perturb the coordinates. In particular, we randomly displace the coordinates
by a random angle that is uniformly distributed over 0 to 360 degrees and by a random distance
that is uniformly chosen between 0 and certain kilometers (2,5, and 10 kilometers) at this angle.
For the simulation, we use 10 kilometers to perturb the location data. Following the same
procedure as described above and using the regression (1) with the predicted 𝑦𝑖, we compare
the distance effect of distance using this perturbed data with the distance effect with the
accurate data.
Now, assume that the actual GPS coordinates on respondent’s location in the survey from
Arusha is not available as is the case for DHS. Then, we employ the method suggested by Karra
and Canning (2018) to get the unbiased estimator of the distance effect by the numerical
integration. In particular, we take each possible location for the respondent and calculate the
minimum distance from these possible locations to the nearest health facility. Then we
calculate the expected minimum distance based on the probability that each location is the true
location given the observed location with error. This expected minimum distance is the
unbiased estimator for the distance.
Mathematically, the expected minimum distance is calculated by the following formula;
𝐸[𝑔(𝑥1, 𝑥2|𝑚𝑖1, 𝑚𝑖2)] ≈ ∑ ∑ 𝑔(𝑥𝑗1, 𝑥𝑘2)𝑆−1𝑘=0𝑆−1𝑗=0 𝑝((𝑚𝑖1,𝑚𝑖2)|(𝑥𝑗1,𝑥𝑘2))∗𝑝(𝑋)∑ ∑ 𝑝((𝑚𝑖1,𝑚𝑖2)|(𝑥𝑗1,𝑥𝑘2))∗𝑝(𝑋)𝑆−1𝑘=0𝑆−1𝑗=0 (2)
where 𝑔(𝑥1, 𝑥2|𝑚𝑖1, 𝑚𝑖2) is the minimum true distance, provided the perturbed data; 𝑔(𝑥𝑗1, 𝑥𝑘2) is the minimum distance for each perturbed location; 𝑝 ((𝑚𝑖1, 𝑚𝑖2)|(𝑥𝑗1, 𝑥𝑘2)) is
the probability that the true location of (𝑥𝑗1, 𝑥𝑘2) is (𝑚𝑖1, 𝑚𝑖2); 𝑝(𝑋) is the population density
for each possible location.
Using this numerical integration, we evaluate the unbiased distance effect and compare it with
the true effect using the actual data as well as the biased effect with perturbed data.
After we confirm to obtain the unbiased estimator of the distance using the data from Arusha,
we then estimate the effect of distance on various health behaviors, using DHS data in Tanzania
(2015/16). We compare the biased estimator of the distance which uses the perturbed GPS
coordinates with the unbiased estimator which we obtain through the numerical integration.
There are two complications with DHS data which can affect the result of the numerical
integration. One is that if the perturbed location is outside of the administrative boundaries, zone in
the case of Tanzania, then the random angle and distance are drawn again until the new
perturbed location falls within the boundaries. The another complication is that 1% of rural
locations are randomly displaced 0-10 kilometers, instead of 0-5 kilometers.
These two complications affect the result of numerical integration because it affects the
conditional probability of the data values given the observed perturbed data. First, when the
created random error moves the household location outside of the region, international border,
or out to the sea, the random error is re-drawn to make sure that the household is located
within the region. This re-assignment of the random error changes the probability that each
location is the true location given the observed location with error especially if she is close to
the border of the zone. To assure that the unbiased estimator is derived by employing the
method proposed by Karra and Canning (2018), we remove respondents whose location is
within close distance from zonal border to avoid the complication due to this caveat. We simply
drop all the locations that are within 20 kilometers from all the zonal boundaries to make sure
that the repeated draw of the perturbed location will not happen. If the true locations are more
than 20 kilometers away from any zonal boundary, then the perturbation of the location will
never relocate it outside of the boundary, assuming that the maximum distance of the
perturbation is 10 kilometers. In Tanzania DHS 2015/16, there are 608 clusters with GPS
coordinates. After we drop the clusters that are within 20 kilometers from the zonal boundaries,
the number of clusters decreases to 299 (Figure 1).
Second, for 1 % of rural locations randomly displaced 0-10 kilometers, we simply ignore this
case. Because the number of clusters is only about 299, not many locations are affected by this
further displacement.
Results
Comparison of True, Biased, and Unbiased Distance Effect, using Arusha Data
First, using the household survey in Arusha and health facility census data, we compare three
distance effects on childbirths assisted by medical doctor, true distance effect with accurate
location, biased effect with perturbed location, and fixed unbiased effect employing numerical
integration method.
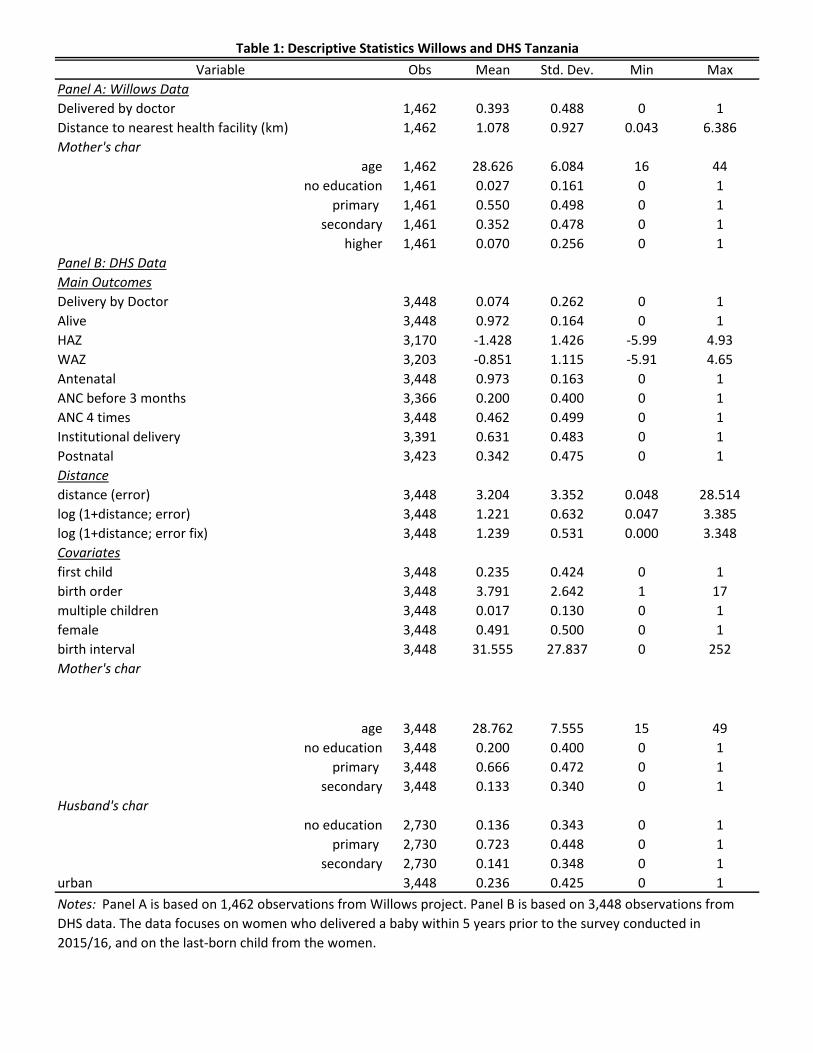
Table 1 (Panel A) presents the descriptive statistics for Arusha data. On average, 39.3 percent of
women delivered a child assisted by a medical doctor. The average true distance to the nearest
health facility is 1.1km. On average, mothers are 28.6 years old. The highest education
attainment is primary school for more than half of women (55%), while 35.2 and 5 percent
completed secondary education and higher education than secondary, respectively.
Figure 2 compares the biased distance effect with the true distance effect. It shows the result of
the simulation (1,000 times) of the distance effect on child delivery assisted by doctor, where
we add random error ranging from 2km, 5km, to 10km to the true location Arusha data and
compare it with the true distance effect. The true distance effect on the likelihood of one
delivering a child assisted by a doctor is -0.116 (shown as a straight vertical line). When we
artificially add the random error to the actual location of each respondent, the effect of the
distance is biased downward and attenuated. The distribution of the simulated coefficient of
distance shifts towards zero as we increase the degree of errors from 2km, 5km and to 10km. If
the random error is 10km, the magnitude of the coefficients becomes almost one-fifths of the
actual coefficient from -0.116 to -0.024.
As a next step, we correct the bias adopting the methods proposed by Karra and Canning
(2018) to estimate the unbiased distance effect on child delivery assisted by doctor. Karra and
Canning (2018) find that, once they substitute the biased distance using perturbed location
with the expected minimum distance, the coefficient gets closer to the true coefficient
(unbiased distance effect). We find the similar result when we apply this method to our data.
Figure 3 compares the true distance effect using the actual location data, biased distance effect
using the perturbed location data, and the unbiased distance effect employing the numerical
integration. Panel A uses 100m grid for all the possible location, while Panel B uses 500m grid.
While the biased distance effect using the perturbed location data is consistently close to zero
than the true distance effect, the unbiased estimator using the expected minimum distance
successfully brings back the effect toward the true distance effect. The result using 500m grid is
consistent with the one using 100m grid. Appendix 1 shows the consistent result with Figure 3,
while it includes the covariates in the regression specification for the estimation.
Table 2 (Panel a) compares the mean of distance effect – true, biased, and unbiased. As
confirmed visually in Figure 3, the distance effect using the perturbed location data is biased
downward toward zero, from -0.116 to -0.024. Once we correct the error using the numerical
integration, the distance effect goes back to the true effect, -0.116 using 100m grid. Note
however that the standard deviation for the unbiased estimator gets much larger than the true
effect using the accurate location data, from 0.034 to 0.086. Using 500m grid, the unbiased
estimator is still close to the true effect, but not as close as the one using 100m grid, -0.100.
Panel B shows the distance effect while including the covariates in the regression specification.
The results are consistent with and without covariates.
Comparison of Biased and Unbiased Distance Effect, using Tanzania DHS Data
In this section, we compare the biased distance effect using the perturbed location data with
the unbiased effect employing the numerical integration using Tanzania DHS data (2015/16).
Table 1 Panel B shows that the descriptive statistics. The sample is restricted to women who
delivered a baby within the last 5 years prior to the survey and to women’s most recent births
within the past 5 years. On average, 7.4 percent of respondents delivered their children
assisted by doctors. This figure is much lower than the one found in Arusha sample, 39.4
percent. In addition to child delivery assisted by doctors, we also evaluate the effect of distance
on various health outcomes such as mortality, height for age, and weight for age, as well as
behaviors around health service utilization such as antenatal care, institutional delivery, and
postnatal care. On average, 97.2 percent of children are alive. The average height for age and
weight for age is -1.4 and -0.85 respectively. On average, 97.3 percent of respondents visited
antenatal care at least once, while 20 percent of them came for the antenatal care during the
first trimester, and 46.2 percent of them visited for antenatal care at least 4 times. About 63
percent of respondents delivered a baby at health facility and 34.2 percent visited health facility
for a postnatal care.
The average distance to the nearest health facility is 3.2 km, which is much longer than the
distance found in Arusha sample project, 1.1km. Note that this distance using DHS data
contains the measurement error because GPS coordinates of respondents in DHS are perturbed.
Once we correct the measurement error, the average distance to the nearest health facility
gets slightly further away; 3.5 km (table not shown). Mother is on average 28.8 years old. Much
higher proportion of women have lower attainment of the education in Tanzania DHS data than
Arusha data; 20 percent of women have no education, 66.6 percentage of women have primary
education, and 13.3 percent of them have secondary or higher educational attainment. While
all the respondents in Arusha sample is from urban areas, 23.6 percent of DHS sample is from
urban areas.
Figure 4 shows the unbiased distance effect on various health behaviors/outcomes and its
comparison with the biased effect using perturbed location data. Although the unbiased
estimator consistently shifts the distance effect away from zero for most of the variables, the
difference between biased and unbiased estimator is not large.
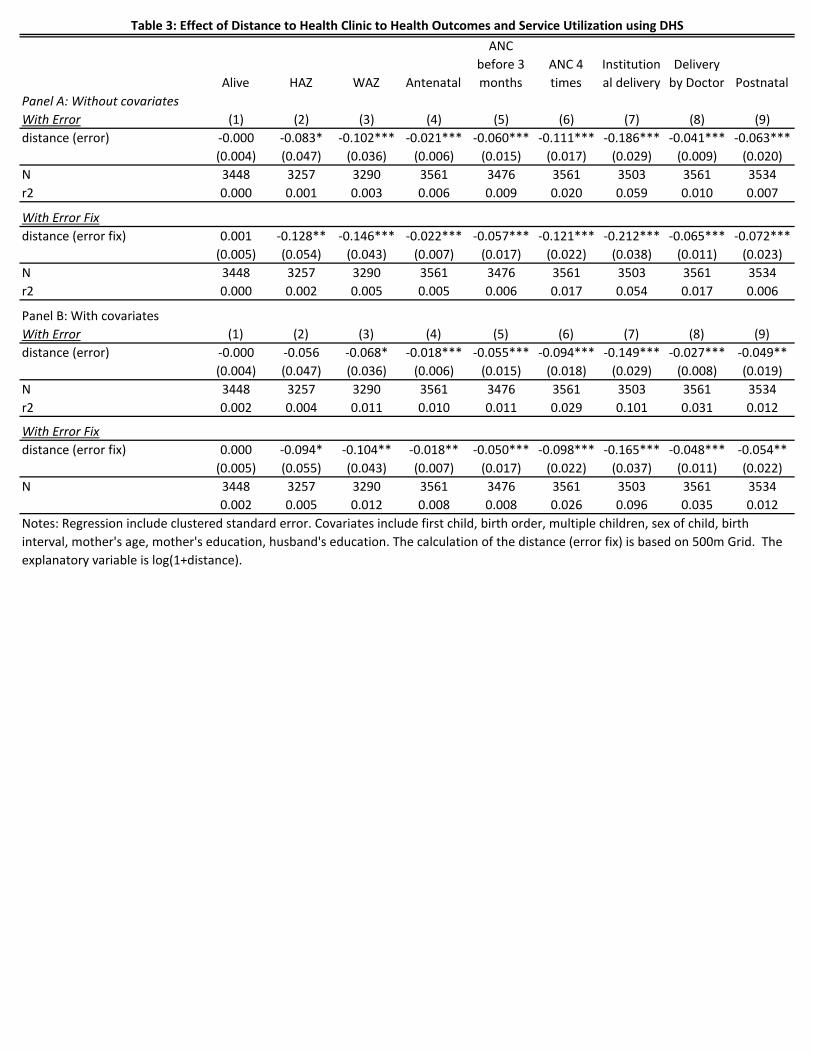
Table 3 shows the results from the regression analysis. We find that unbiased and consistent
estimator gives the increased magnitude of the effect of distance on any outcome variables. For
example, using the perturbed data, the effect of increased distance to the nearest health
facility on the likelihood that one delivers a baby by a doctor is reduced by 18.6 (Table 3 Panel A
column 1). On the other hand, once we correct the bias, we find that the estimate increases to
21.2 percentage points (Panel B column 2). We find the similar trend for all other outcome
variables. Overall, the measurement error causes the attenuation bias towards zero. However,
we find that the magnitude of such biases is relatively small.
Conclusions
Access to health facilities is considered a major contributor to healthcare utilization. However,
the accurate measurement of distance effect is difficult using Demographic and Health Surveys
(DHS) since household location is perturbed to protect respondents’ confidentiality.

This study estimates and compares the distance effect both with accurate, and perturbed, data
using a household survey of 3,950 women conducted in Arusha, Tanzania. Unbiased and
consistent estimation using perturbed data is possible by numerical integration over all possible
true locations, weighted by the probability the household is at that location. We directly adapt
the method to correct the measurement error from Karra and Canning (2018) to show that for
our Arusha sample this method produces the estimate of the distance effect centered on those
found with the true data, thus unbiased estimator.
We then apply our method to DHS data showing that our estimates using numerical integration
produce larger effects than those found by naive regressions using perturbed data. However,
our finding suggests that the difference between the biased and unbiased estimator of distance
effect using DHS data is not substantial.
References
Rahaman M, Aziz KMS, Munshi MH, Patwari Y, Rahman M: A diarrhea clinic in rural Bangladesh:
influence of distance, age, and sex on attendance and diarrheal mortality. Am J Public Health.
1982, 72 (10): 1124-1128. 10.2105/AJPH.72.10.1124.
Müller I, Smith T, Mellor S, Rare L, Genton B: The effect of distance from home on attendance
at a small rural health centre in Papua New Guinea. Int J Epidemiol. 1998, 27: 878-884.
10.1093/ije/27.5.878.
Stock R: Distance and the utilization of health facilities in rural Nigeria. Soc Sci Med. 1983, 17
(9): 563-570. 10.1016/0277-9536(83)90298-8.
Buor D: Analysing the primacy of distance in the utilization of health services in Ahafo-Ano
South district Ghana. Int J Health Plann Manage. 2003, 18: 293-311. 10.1002/hpm.729
Alegana VA, Wright JA, Pentrina U, Noor AM, Snow RW, Atkinson PA: Spatial modelling of
healthcare utilisation for treatment of fever in Namibia. Int J Health Geogr. 2012, 11: 6-
10.1186/1476-072X-11-6.
Gething PW, Noor AM, Zurovac D, Atkinson PM, Hay SI, Nixon MS, Snow RW: Empirical
modelling of government health service use by children with fevers in Kenya. Acta Tropica.
2004, 91 (3): 227-237. 10.1016/j.actatropica.2004.05.002.
Okwaraji YB, Cousens S, Berhane Y, Mulholland K, Edmond K: Effect of geographical access to
health facilities on child mortality in rural Ethiopia: a community based cross sectional study.
PLoS ONE. 2012, 7 (3): e33564-10.1371/journal.pone.0033564.
Feikin, D.R., Nguyen, L.M., Adazu, K., Ombok, M., Audi, A., Slutsker, L. and Lindblade, K.A., 2009. The
impact of distance of residence from a peripheral health facility on pediatric health utilisation in rural
western Kenya. Tropical Medicine & International Health, 14(1), pp.54-61.
Kadobera, D., Sartorius, B., Masanja, H., Mathew, A., & Waiswa, P. (2012). The effect of distance to
formal health facility on childhood mortality in rural Tanzania, 2005–2007. Global Health Action, 5,
10.3402/gha.v5i0.19099. http://doi.org/10.3402/gha.v5i0.19099
Burgert, C. R., Colston, J., Roy, T., & Zachary, B. (2013). Geographic Displacement Procedure and
Georeferenced Data Release Policy for the Demographic and Health Surveys (DHS Spatial Analysis
Reports No. 7). Calverton, MD: ICF International.
Karra, M and Canning, D. (2018) Consistent Estimation with Deliberate Measurement Error to Protect
Subject Confidentiality: An Application to Perturbed Location Data, working paper
Wong, Kerry L M et al. “A look back on how far to walk: Systematic review and meta-analysis of
physical access to skilled care for childbirth in Sub-Saharan Africa” PloS one vol. 12,9 e0184432.
14 Sep. 2017, doi:10.1371/journal.pone.0184432
Santosh Kumar, Emily A. Dansereau & Christopher J. L. Murray (2014) Does distance matter for
institutional delivery in rural India?, Applied Economics, 46:33, 4091-4103, DOI:
10.1080/00036846.2014.950836
John Gibson, David McKenzie; Using Global Positioning Systems in Household Surveys for Better
Economics and Better Policy, The World Bank Research Observer, Volume 22, Issue 2, 1 October
2007, Pages 217–241, https://doi.org/10.1093/wbro/lkm009
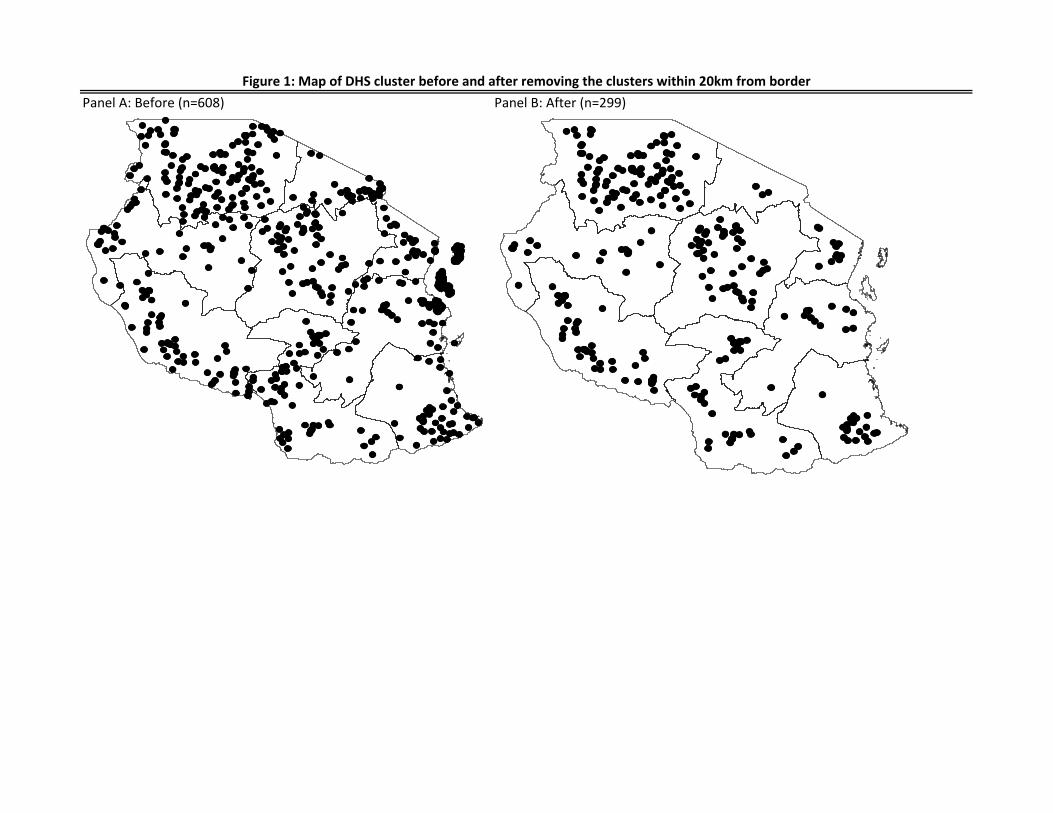
Panel A: Before (n=608) Panel B: After (n=299)
Figure 1: Map of DHS cluster before and after removing the clusters within 20km from border
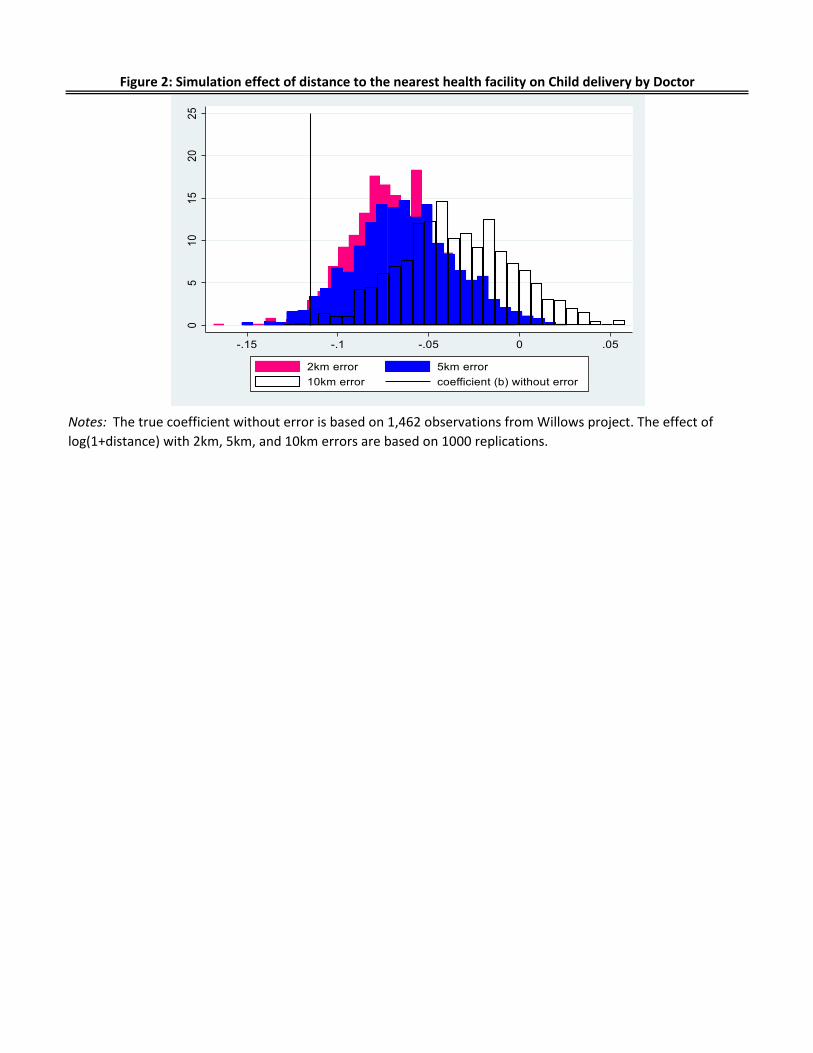
Figure 2: Simulation effect of distance to the nearest health facility on Child delivery by Doctor
Notes: The true coefficient without error is based on 1,462 observations from Willows project. The effect of
log(1+distance) with 2km, 5km, and 10km errors are based on 1000 replications.
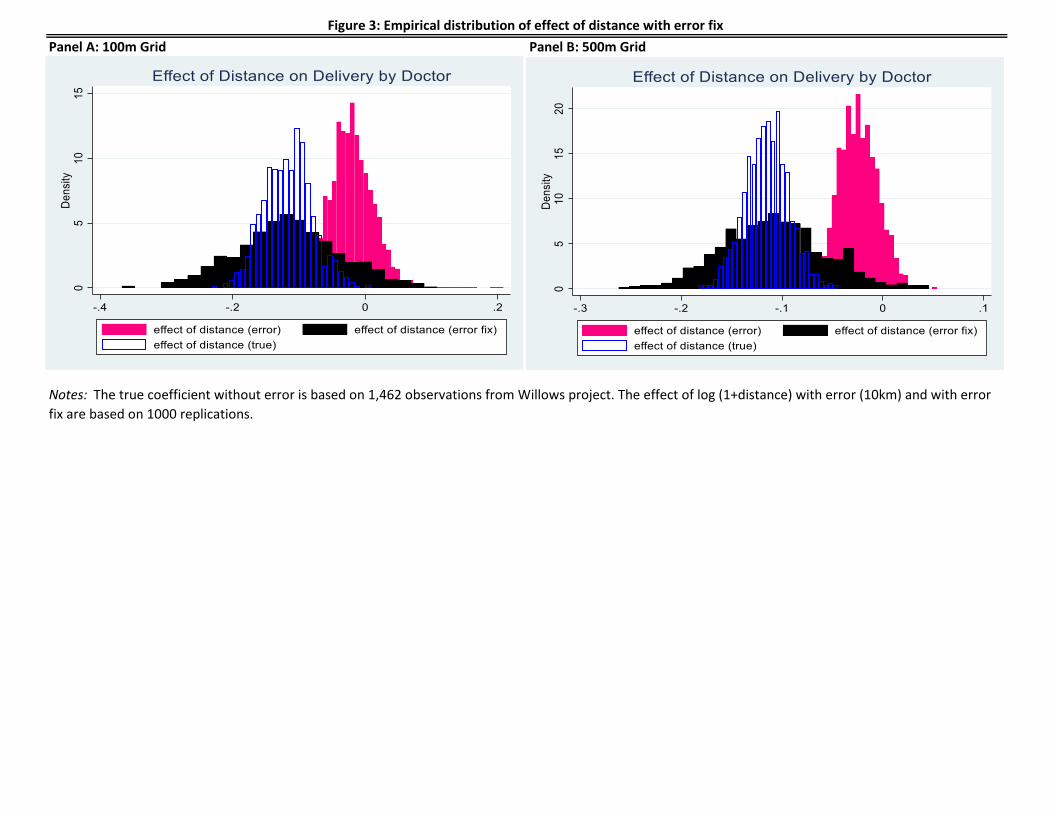
Panel A: 100m Grid Panel B: 500m Grid
Notes: The true coefficient without error is based on 1,462 observations from Willows project. The effect of log (1+distance) with error (10km) and with error
fix are based on 1000 replications.
Figure 3: Empirical distribution of effect of distance with error fix
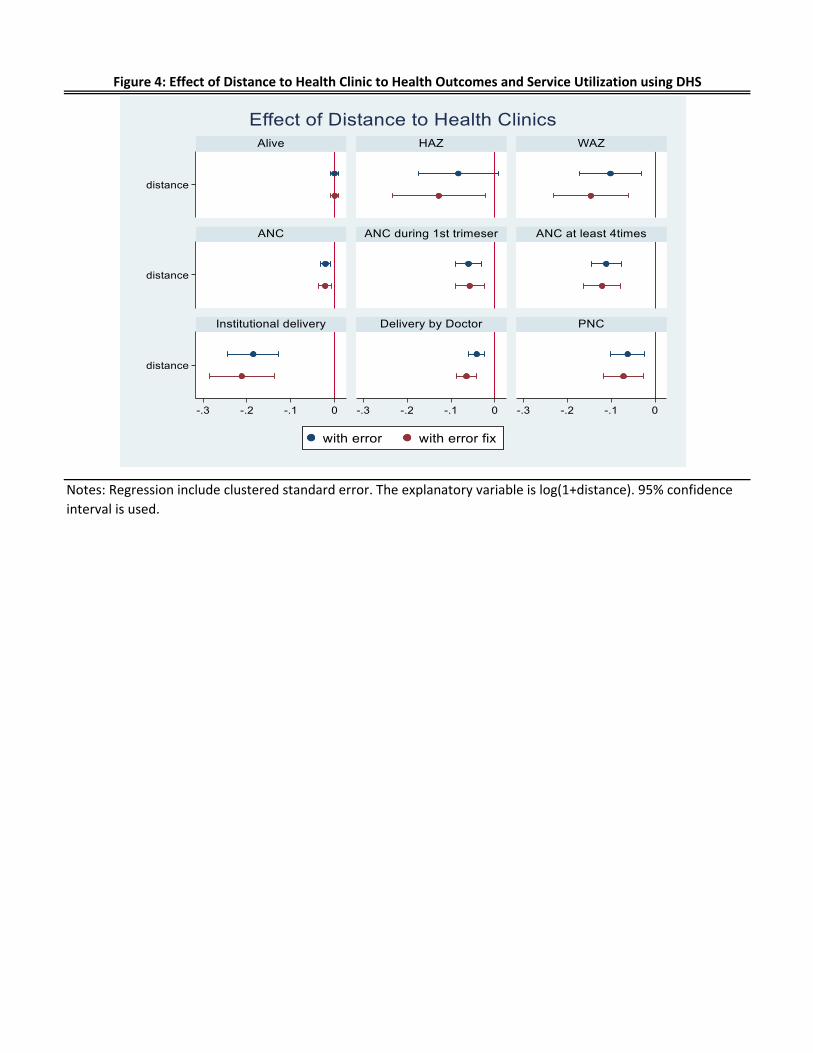
Figure 4: Effect of Distance to Health Clinic to Health Outcomes and Service Utilization using DHS
Notes: Regression include clustered standard error. The explanatory variable is log(1+distance). 95% confidence
interval is used.
Variable Obs Mean Std. Dev. Min Max
Panel A: Willows Data
Delivered by doctor 1,462 0.393 0.488 0 1
Distance to nearest health facility (km) 1,462 1.078 0.927 0.043 6.386
Mother's char
age 1,462 28.626 6.084 16 44
no education 1,461 0.027 0.161 0 1
primary 1,461 0.550 0.498 0 1
secondary 1,461 0.352 0.478 0 1
higher 1,461 0.070 0.256 0 1
Panel B: DHS Data
Main Outcomes
Delivery by Doctor 3,448 0.074 0.262 0 1
Alive 3,448 0.972 0.164 0 1
HAZ 3,170 -1.428 1.426 -5.99 4.93
WAZ 3,203 -0.851 1.115 -5.91 4.65
Antenatal 3,448 0.973 0.163 0 1
ANC before 3 months 3,366 0.200 0.400 0 1
ANC 4 times 3,448 0.462 0.499 0 1
Institutional delivery 3,391 0.631 0.483 0 1
Postnatal 3,423 0.342 0.475 0 1
Distance
distance (error) 3,448 3.204 3.352 0.048 28.514
log (1+distance; error) 3,448 1.221 0.632 0.047 3.385
log (1+distance; error fix) 3,448 1.239 0.531 0.000 3.348
Covariates
first child 3,448 0.235 0.424 0 1
birth order 3,448 3.791 2.642 1 17
multiple children 3,448 0.017 0.130 0 1
female 3,448 0.491 0.500 0 1
birth interval 3,448 31.555 27.837 0 252
Mother's char
age 3,448 28.762 7.555 15 49
no education 3,448 0.200 0.400 0 1
primary 3,448 0.666 0.472 0 1
secondary 3,448 0.133 0.340 0 1
Husband's char
no education 2,730 0.136 0.343 0 1
primary 2,730 0.723 0.448 0 1
secondary 2,730 0.141 0.348 0 1
urban 3,448 0.236 0.425 0 1
Table 1: Descriptive Statistics Willows and DHS Tanzania
Notes: Panel A is based on 1,462 observations from Willows project. Panel B is based on 3,448 observations from
DHS data. The data focuses on women who delivered a baby within 5 years prior to the survey conducted in
2015/16, and on the last-born child from the women.

Variable Mean Std. Dev.
(1) (2) (3) (4)
(a) Without covariates
Coefficient of log distance (True) -0.116 0.034 -0.182 -0.045
Coefficient of log distance (error) -0.024 0.032 -0.086 0.037
Coefficient of log distance (error fix) -100m Grid -0.116 0.086 -0.279 0.047
Coefficient of log distance (error fix) -500m Grid -0.100 0.081 -0.258 0.055
(b) With covariates
Coefficient of log distance (True) -0.105 0.035 -0.174 -0.037
Coefficient of log distance (error) -0.021 0.034 -0.087 0.045
Coefficient of log distance (error fix) - 100m Grid -0.103 0.081 -0.263 0.057
Coefficient of log distance (error fix) - 500m Grid -0.091 0.082 -0.252 0.067
Table 2: Effect of Distance on Delivery by Dcotor using Willows data
[95% Confidence interval]
Notes: Estimation is based on 1,000 replications. The number of observations is 1,462. The explanatory variable is
log(1+distance). Covariates include mother's age and mother's education.
Alive HAZ WAZ Antenatal
ANC
before 3
months
ANC 4
times
Institution
al delivery
Delivery
by Doctor Postnatal
Panel A: Without covariates
With Error (1) (2) (3) (4) (5) (6) (7) (8) (9)
distance (error) -0.000 -0.083* -0.102*** -0.021*** -0.060*** -0.111*** -0.186*** -0.041*** -0.063***
(0.004) (0.047) (0.036) (0.006) (0.015) (0.017) (0.029) (0.009) (0.020)
N 3448 3257 3290 3561 3476 3561 3503 3561 3534
r2 0.000 0.001 0.003 0.006 0.009 0.020 0.059 0.010 0.007
With Error Fix
distance (error fix) 0.001 -0.128** -0.146*** -0.022*** -0.057*** -0.121*** -0.212*** -0.065*** -0.072***
(0.005) (0.054) (0.043) (0.007) (0.017) (0.022) (0.038) (0.011) (0.023)
N 3448 3257 3290 3561 3476 3561 3503 3561 3534
r2 0.000 0.002 0.005 0.005 0.006 0.017 0.054 0.017 0.006
Panel B: With covariates
With Error (1) (2) (3) (4) (5) (6) (7) (8) (9)
distance (error) -0.000 -0.056 -0.068* -0.018*** -0.055*** -0.094*** -0.149*** -0.027*** -0.049**
(0.004) (0.047) (0.036) (0.006) (0.015) (0.018) (0.029) (0.008) (0.019)
N 3448 3257 3290 3561 3476 3561 3503 3561 3534
r2 0.002 0.004 0.011 0.010 0.011 0.029 0.101 0.031 0.012
With Error Fix
distance (error fix) 0.000 -0.094* -0.104** -0.018** -0.050*** -0.098*** -0.165*** -0.048*** -0.054**
(0.005) (0.055) (0.043) (0.007) (0.017) (0.022) (0.037) (0.011) (0.022)
N 3448 3257 3290 3561 3476 3561 3503 3561 3534
0.002 0.005 0.012 0.008 0.008 0.026 0.096 0.035 0.012
Table 3: Effect of Distance to Health Clinic to Health Outcomes and Service Utilization using DHS
Notes: Regression include clustered standard error. Covariates include first child, birth order, multiple children, sex of child, birth
interval, mother's age, mother's education, husband's education. The calculation of the distance (error fix) is based on 500m Grid. The
explanatory variable is log(1+distance).

Panel A: 100m Grid Panel B: 500m Grid
Appendix 1: Empirical distribution of effect of distance with error fix
Notes: The true coefficient without error is based on 1,462 observations from Willows project. The effect of log (1+distance) with error (10km) and with error
fix are based on 1000 replications. Covariates include mother's age and mother's education.