
Dissociative Photoionization of Nitrogen- Containing...
16
Dissociative Photoionization of Nitrogen- Containing Polycyclic Aromatic Hydrocarbons Jordy Bouwman
Transcript of Dissociative Photoionization of Nitrogen- Containing...

Dissociative Photoionization of Nitrogen-Containing Polycyclic Aromatic Hydrocarbons
Jordy Bouwman

Institute for Molecules and Materials / FELIX Laboratory
• Titan’s atmosphere
• Active N & C chemistry
• Evidence for aromatics
Motivation
• Interstellar medium
• PAH mid-IR emission bands
• 6.2 mm band shift by N-inclusion
Waite, J. H. et al. Science 316, 870-875, 2007
Mattioda et al. J. Phys. Chem. A 107, 1486, 2003

Institute for Molecules and Materials / FELIX Laboratory
• i-PEPICO: imaging Photoelectron Photoion
Coincidence Spectrometer
• VUV beamline of Swiss Light
Source (5-21 eV)
• High E resolution electron imaging;
Threshold electrons
• Slow extraction of ions; kinetics of
slow dissociations
iPEPICO Experiments
Bodi et al. Rev. Sci. Instrum. 80, 034101, 2009 Quinoline Isoquinoline
Institute for Molecules and Materials / FELIX Laboratory
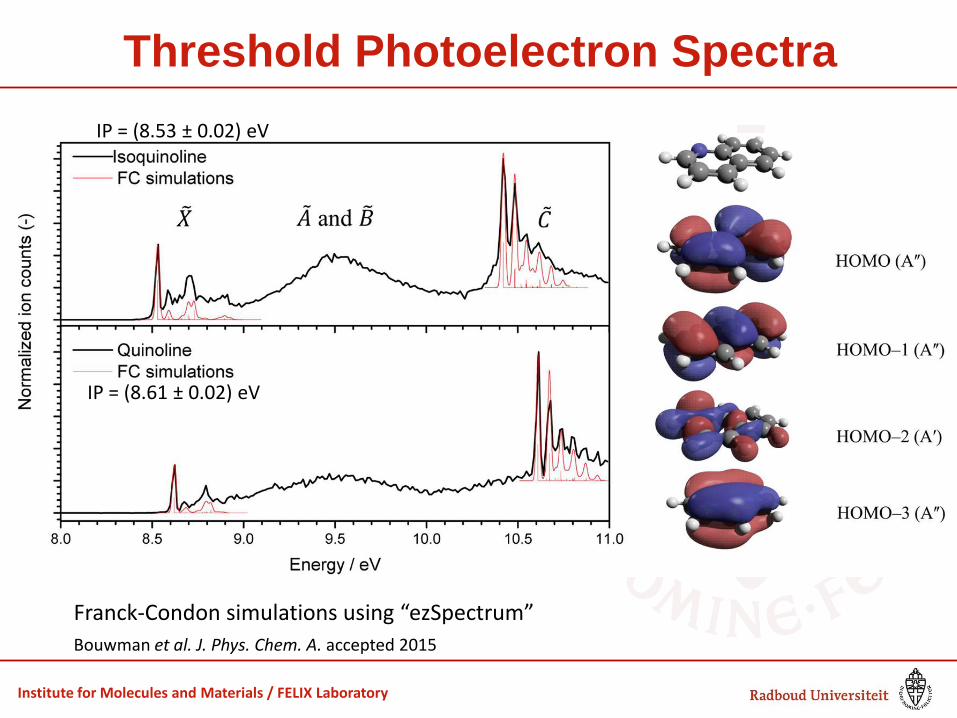
Threshold Photoelectron Spectra
70 dissociation mechanism,25 the impact parameter of the reverse71 reaction based on the observed kinetic energy release72 distributions,26 or can be used to obtain accurate barriers for73 the reverse, association reaction.27 Therefore, they can also be74 of use to better understand PAH formation reactions.75 Here, we present a study of the dissociative photoionization76 of the smallest PANH isomers quinoline (Q) and isoquinoline77 (IQ). High-resolution threshold photoelectron spectra are78 measured and the parent and fragment ion abundances that79 result from photodissociation are recorded as a function of the80 internal energy of the parent ion. The potential energy surface81 that leads to the detected fragments is mapped through82 quantum chemical computations. Rice−Ramsperger−Kassel−83 Marcus (RRKM) simulations are subsequently employed to84 further model the dissociation kinetics.
2. EXPERIMENTAL SECTION
85 The experiments have been performed on the iPEPICO86 instrument at the X04DB Vacuum Ultraviolet (VUV) beamline87 of the Swiss Light Source. A detailed description of the88 beamline and of the iPEPICO instrument can be found89 elsewhere,28,29 and the apparatus will only be described briefly90 here.91 Quinoline and isoquinoline (C9H7N, ≥98% and ≥97%,
s1 92 respectively, Scheme 1) were purchased from Sigma−Aldrich
93 and used without further purification. The sample was94 introduced into the ionization chamber through a 6 mm95 outer diameter Teflon tube at room temperature. Here, the96 effusive sample beam was intersected with the monochromatic97 radiation of the VUV beamline. The photon energy was
98scanned between 8 and 15 eV with step sizes ranging from99∼0.01 to 0.1 eV.100Photoelectrons and -ions are extracted using a continuous101120 V cm−1 electric field. Electrons are velocity map imaged102onto a delay-line RoentDek imaging detector, and their arrival103time also provides thestart signal for the coincident photoions’104time-of-flight (TOF) analysis. Thephotoions are space focused105at a nonimaging MCP detector and mass analyzed. Owing to106the low extraction field and long extraction region, cations have107a long residence time in the first acceleration region. If a108dissociation is not prompt, but takes place in this region,109typically within a few microseconds, the resulting broad and110asymmetric daughter ion TOF peak shapes reflect the111dissociation rate constant. This way, dissociation rates can be112measured in the 103−107 s−1 range and the modeled rates are113then fitted to the experimental data using the ion optics114parameters.30Thus, thekinetic shift is taken into account in the115model and accurate dissociation barrier heights are derived.116Threshold electrons are imaged onto a small area in the117center of the imaging detector with a kinetic energy resolution118better than 1 meV. Energetic (“hot”) electrons with zero lateral119velocity component are also imaged in the center spot on the120detector, and their contribution needs to be subtracted from121the threshold electron signal in the center. A small ring area122around thecenter spot31,32 isdefined to correct for hot electron123contributions and to obtain threshold electron counts and124TPEPICO mass spectra. The former can be used to plot125threshold photoelectron spectra (TPES). From the latter, the126fragment and parent ion peaks are integrated and their127fractional abundances are plotted in the breakdown diagram.
3. COMPUTATIONAL METHODS
128DFT calculations wereperformed using theGaussian09 suiteof129programs.33 The vibrational frequencies and rotational130constants of the neutral are used to calculate the internal131energy distribution, which is assumed to be shifted to the ion132manifold by the photon energy minus the ionization energy.133The density of states of the dissociating ion as well as the134number of states (sum of states) of the transition state are135needed to calculate dissociation rateconstants. Potential energy
Scheme 1. Structures of the C9H7N Isomers Quinoline(Left) and Isoquinoline (Right)
Figure 1. Threshold photoelectron spectra (in black) of quinoline (bottom) and isoquinoline (top) displayed together with Franck−Condonsimulated spectra (red). The molecular orbitals of interest are shown on the right-hand side below the quinoline structure.
The Journal of Physical Chemistry A Article
DOI: 10.1021/jp5121993J. Phys. Chem. A XXXX, XXX, XXX−XXX
B
Franck-Condon simulations using “ezSpectrum”
Bouwman et al. J. Phys. Chem. A. accepted 2015
IP = (8.53 ± 0.02) eV
IP = (8.61 ± 0.02) eV

Institute for Molecules and Materials / FELIX Laboratory
HCN-loss H-loss
Mass Spectra
Bouwman et al. J. Phys. Chem. A. accepted 2015

Institute for Molecules and Materials / FELIX Laboratory
HCN-loss H-loss
Bouwman et al. J. Phys. Chem. A. accepted 2015
Breakdown Diagram

Institute for Molecules and Materials / FELIX Laboratory
• RRKM model fit:
Appearance Energies
Sztaray et al. J. Mass Spectrom. 45, 1233, 2010
Channel Quinoline Isoquinoline
HCN-loss 11.9 11.6
H-Loss 12.0 12.1
Energies in eV
HCN-loss H-loss HCN-loss H-loss
Bouwman et al. J. Phys. Chem. A. accepted 2015

Institute for Molecules and Materials / FELIX Laboratory
Hydrogen Loss Channel
Energies calculated using CBS-QB3
4
3
5
6
7
8
2
1
3
5
6
7
8
4
Bouwman et al. J. Phys. Chem. A. accepted 2015

Institute for Molecules and Materials / FELIX Laboratory
C9H7N+ Potential Energy Surface
Bouwman et al. J. Phys. Chem. A. accepted 2015
Benzocyclobutadiene
B3LYP 6-311++G** Energies: CBS-QB3
Phenylacetylene
+ HCN
+ HCN
Institute for Molecules and Materials / FELIX Laboratory

Institute for Molecules and Materials / FELIX Laboratory
• RRKM model fit:
Appearance Energies
Sztaray et al. J. Mass Spectrom. 45, 1233, 2010
Channel Quinoline Isoquinoline
HCN-loss 11.9 11.6
H-Loss 12.0 12.1
Energies in eV
HCN-loss H-loss HCN-loss H-loss
Bouwman et al. J. Phys. Chem. A. accepted 2015

Institute for Molecules and Materials / FELIX Laboratory
• RRKM model fit:
• Appearance energies
Appearance Energies
Sztaray et al. J. Mass Spectrom. 45, 1233, 2010
Channel Quinoline Isoquinoline
HCN-loss 11.9 11.6
H-Loss 12.0 12.1
Energies in eV
HCN-loss H-loss HCN-loss H-loss
Bouwman et al. J. Phys. Chem. A. accepted 2015
Energies in eV

Institute for Molecules and Materials / FELIX Laboratory
• Main dissociation pathway <15 eV is HCN-loss (~60%)
• Appearance energies (AE in eV) for HCN and H-loss:
• C2H2 loss from naphthalene (AE = 12.26 eV)
• Reverse: Large barrier for the addition of HCN to PA•+ / BCB•+
• No unambiguous identification of product species (PA•+ / BCB•+)
Conclusions
West et al. J. Phys. Chem. A 118, 7824-7831, 2014
Hamid et al. Chem. Phys. Lett. 543, 23-27, 2012

Institute for Molecules and Materials / FELIX Laboratory
• Structural determination using IRMPD @ FELIX
• Isomer specific detection of photodissociation products
• Isomer specific detection of ion-neutral reaction products
Outlook: Structural Information

Institute for Molecules and Materials / FELIX Laboratory
Acknowledgement
Veni
Andras Bodi
Patrick Hemberger
Funding: MSD and FELIX:
Collaborations:
Jos Oomens

Institute for Molecules and Materials / FELIX Laboratory


