Dissipation of wave energy and turbulence in a …airsea.ucsd.edu/Website/papers/Mel3.pdfDissipation...
18
Dissipation of wave energy and turbulence in a shallow coral reef lagoon Zhi-Cheng Huang, 1,2 Luc Lenain, 1 W. Kendall Melville, 1 Jason H. Middleton, 3 Benjamin Reineman, 1 Nicholas Statom, 1 and Ryan M. McCabe 4 Received 6 April 2011; revised 14 November 2011; accepted 3 January 2012; published 10 March 2012. [1] Simultaneous in situ measurements of waves, currents and turbulence are presented to describe dissipation rates of wave energy and turbulent kinetic energy in the windward coral reef-lagoon system at Lady Elliot Island (LEI), Australia. The dissipation of wave energy in the lagoon is tidally modulated and strongly correlates with frictional dissipation due to the presence of the extremely rough bottom boundary. The observed turbulent kinetic energy (TKE) dissipation rate, ɛ, in this wave-dominated lagoon is much larger than recently reported values for unidirectional flows over natural fringing coral reefs. The correlation between the wave dissipation and ɛ is examined. The average rate of dissipation induced by the rough turbulent flow was estimated directly from the observed ɛ coupled with both a depth-integrated approach and with a bottom boundary layer scaling. Rates of TKE dissipation estimated using the two approaches approximate well, within a factor of 1.5 to 2.4, to the surface-wave energy dissipation rate. The wave dissipation and friction factor in the lagoon can be described by a spectral wave-frictional model with a bottom roughness length scale that is approximately constant across the lagoon. We also present estimates of dissipation induced by the canopy drag force of the coral heads. The dissipation in this case is enhanced and becomes more significant for the total energy dissipation when the water depth in the lagoon is comparable to the height of the coral heads. Citation: Huang, Z.-C., L. Lenain, W. K. Melville, J. H. Middleton, B. Reineman, N. Statom, and R. M. McCabe (2012), Dissipation of wave energy and turbulence in a shallow coral reef lagoon, J. Geophys. Res., 117, C03015, doi:10.1029/2011JC007202. 1. Introduction [2] Coral reefs are prominent features of shallow water in tropical and subtropical nearshore regions. Energy dissipation over coral reefs plays an important role in reef morphology, marine organism distribution, island shoreline stability and, in particular, nutrient uptake, which is important for sus- taining coral reef communities. Nutrient uptake is positively correlated with bottom shear stress and water velocity under unidirectional [Baird and Atkinson, 1997; Baird et al., 2004; Bilger and Atkinson, 1992] and oscillatory wave-induced flows [Falter et al., 2004]. However, wave-induced flows often generate higher bed shear stresses than comparable uni- directional flows [Nielsen, 1992] and therefore can increase mass transfer and the dispersion of nutrients in coral reef communities [Reidenbach et al., 2009, 2006b]. The coupling of flow velocity with bottom roughness and bed shear stress leads to thinning of the diffusive boundary layers surround- ing biota, resulting in the maximum nutrient uptake being proportional to ɛ 1/4 , where ɛ is the turbulent dissipation rate [Falter et al., 2004; Hearn et al., 2001]. Consequently, quantification of energy dissipation rates is important for monitoring and modeling coral reef communities. [3] The geometrical structure of coral reefs produces hydrodynamic environments distinct from those of beach systems. A steep transition from relatively deep to shallow water between the fore reef and outer reef flat leads to wave transformation involving shoaling, refraction, diffraction, and wave-breaking dissipation accompanied by an enhance- ment of frictional dissipation [Lugo-Fernández et al., 1998b; Monismith, 2007; Young, 1989]. Wave transformation and attenuation have been studied primarily in the steep transition zone to the outer reef flat in laboratory models of fringing reefs [e.g., Gourlay, 1994, 1996a; Gourlay and Colleter, 2005; Massel and Gourlay, 2000] or over natural fringing and barrier reefs [e.g., Hardy and Young, 1996; Lowe et al., 2005b; Lugo-Fernández et al., 1998a, 1998b; Young, 1989]. Few studies of wave processes across the reef rim into a 1 Scripps Institution of Oceanography, University of California, San Diego, La Jolla, California, USA. 2 Now at Graduate Institute of Hydrological and Oceanic Sciences, National Central University, Taoyuan, Taiwan. 3 School of Aviation, University of New South Wales, Sydney, New South Wales, Australia. 4 School of Oceanography, University of Washington, Seattle, Washington, USA. Copyright 2012 by the American Geophysical Union. 0148-0227/12/2011JC007202 JOURNAL OF GEOPHYSICAL RESEARCH, VOL. 117, C03015, doi:10.1029/2011JC007202, 2012 C03015 1 of 18
-
Upload
vuongkhanh -
Category
Documents
-
view
229 -
download
2
Transcript of Dissipation of wave energy and turbulence in a …airsea.ucsd.edu/Website/papers/Mel3.pdfDissipation...
Dissipation of wave energy and turbulence in a shallowcoral reef lagoon
Zhi-Cheng Huang,1,2 Luc Lenain,1 W. Kendall Melville,1 Jason H. Middleton,3
Benjamin Reineman,1 Nicholas Statom,1 and Ryan M. McCabe4
Received 6 April 2011; revised 14 November 2011; accepted 3 January 2012; published 10 March 2012.
[1] Simultaneous in situ measurements of waves, currents and turbulence are presented todescribe dissipation rates of wave energy and turbulent kinetic energy in the windwardcoral reef-lagoon system at Lady Elliot Island (LEI), Australia. The dissipation of waveenergy in the lagoon is tidally modulated and strongly correlates with frictional dissipationdue to the presence of the extremely rough bottom boundary. The observed turbulentkinetic energy (TKE) dissipation rate, ɛ, in this wave-dominated lagoon is much larger thanrecently reported values for unidirectional flows over natural fringing coral reefs. Thecorrelation between the wave dissipation and ɛ is examined. The average rate of dissipationinduced by the rough turbulent flow was estimated directly from the observed ɛ coupledwith both a depth-integrated approach and with a bottom boundary layer scaling. Ratesof TKE dissipation estimated using the two approaches approximate well, within a factor of1.5 to 2.4, to the surface-wave energy dissipation rate. The wave dissipation and frictionfactor in the lagoon can be described by a spectral wave-frictional model with a bottomroughness length scale that is approximately constant across the lagoon. We also presentestimates of dissipation induced by the canopy drag force of the coral heads. Thedissipation in this case is enhanced and becomes more significant for the total energydissipation when the water depth in the lagoon is comparable to the height of the coralheads.
Citation: Huang, Z.-C., L. Lenain, W. K. Melville, J. H. Middleton, B. Reineman, N. Statom, and R. M. McCabe (2012),Dissipation of wave energy and turbulence in a shallow coral reef lagoon, J. Geophys. Res., 117, C03015,doi:10.1029/2011JC007202.
1. Introduction
[2] Coral reefs are prominent features of shallow water intropical and subtropical nearshore regions. Energy dissipationover coral reefs plays an important role in reef morphology,marine organism distribution, island shoreline stability and,in particular, nutrient uptake, which is important for sus-taining coral reef communities. Nutrient uptake is positivelycorrelated with bottom shear stress and water velocity underunidirectional [Baird and Atkinson, 1997; Baird et al., 2004;Bilger and Atkinson, 1992] and oscillatory wave-inducedflows [Falter et al., 2004]. However, wave-induced flowsoften generate higher bed shear stresses than comparable uni-directional flows [Nielsen, 1992] and therefore can increase
mass transfer and the dispersion of nutrients in coral reefcommunities [Reidenbach et al., 2009, 2006b]. The couplingof flow velocity with bottom roughness and bed shear stressleads to thinning of the diffusive boundary layers surround-ing biota, resulting in the maximum nutrient uptake beingproportional to ɛ1/4, where ɛ is the turbulent dissipation rate[Falter et al., 2004; Hearn et al., 2001]. Consequently,quantification of energy dissipation rates is important formonitoring and modeling coral reef communities.[3] The geometrical structure of coral reefs produces
hydrodynamic environments distinct from those of beachsystems. A steep transition from relatively deep to shallowwater between the fore reef and outer reef flat leads to wavetransformation involving shoaling, refraction, diffraction,and wave-breaking dissipation accompanied by an enhance-ment of frictional dissipation [Lugo-Fernández et al., 1998b;Monismith, 2007; Young, 1989]. Wave transformation andattenuation have been studied primarily in the steep transitionzone to the outer reef flat in laboratory models of fringingreefs [e.g., Gourlay, 1994, 1996a; Gourlay and Colleter,2005; Massel and Gourlay, 2000] or over natural fringingand barrier reefs [e.g., Hardy and Young, 1996; Lowe et al.,2005b; Lugo-Fernández et al., 1998a, 1998b; Young, 1989].Few studies of wave processes across the reef rim into a
1Scripps Institution of Oceanography, University of California, SanDiego, La Jolla, California, USA.
2Now at Graduate Institute of Hydrological and Oceanic Sciences,National Central University, Taoyuan, Taiwan.
3School of Aviation, University of New South Wales, Sydney, NewSouth Wales, Australia.
4School of Oceanography, University of Washington, Seattle,Washington, USA.
Copyright 2012 by the American Geophysical Union.0148-0227/12/2011JC007202
JOURNAL OF GEOPHYSICAL RESEARCH, VOL. 117, C03015, doi:10.1029/2011JC007202, 2012
C03015 1 of 18
lagoon currently exist. The wave energy decay results inspatial gradients in radiation stress [Longuet-Higgins andStewart, 1964], which is balanced by an across-shore pres-sure gradient and consequently induces wave setup [Gourlay,1996a, 1996b; Jago et al., 2007;Massel and Gourlay, 2000]which leads to wave-driven currents and circulation on thereef flat and further into the lagoon behind [Hearn, 1999;Lowe et al., 2009a, 2009b; Symonds et al., 1995].[4] Depth-limited wave breaking has been considered a
substantial source of energy dissipation at the seaward reefedge [Gourlay, 1994; Lowe et al., 2005b; Massel andGourlay, 2000; Young, 1989]. By analogy to the criticalwave breaking parameter on beaches [Thornton and Guza,1983], the ratio of wave height to water depth on the reefflat is a primary determinant of the occurrence of depth-limited wave breaking [Gourlay, 1994; Hardy and Young,1996]. The energy dissipation caused by wave breaking onmild beaches was parameterized empirically by Thorntonand Guza [1983] and Battjes and Janssen [1978]. Theseformulae have been successfully included in numericalmodels to simulate the variation of wave height, wave setup[Massel and Gourlay, 2000] and wave-induced circulation[Lowe et al., 2009b] over coral reefs.[5] On reef flats with rough bottoms in shallow water,
frictional dissipation has been considered a primary com-ponent of the total dissipation [Falter et al., 2004; Loweet al., 2007, 2005b; Nelson, 1996]. Rough reef bottomsurfaces comprised of limestone and benthic organisms ofcoral colonies perturb the flow, generate turbulent shearstress and dissipate wave energy in the rough turbulentboundary layer [Monismith, 2007; Nielsen, 1992; Tennekesand Lumley, 1972]. Recently, Reidenbach et al. [2006a]measured boundary layer turbulence for unidirectionalflows over a fringing coral reef in the Red Sea. They showedthat turbulent boundary layer theory could be applied toflows over the rough bottom of those coral reefs, in whichthe corals occupied a small fraction of the water column.Few studies have estimated the turbulence dissipation overwave-dominated coal reefs; however,Reidenbach et al. [2009]showed that a wavy turbulent flow may increase the disper-sion of nutrients, gametes and larvae in coral communities.[6] It is difficult to measure the near-bed turbulence to
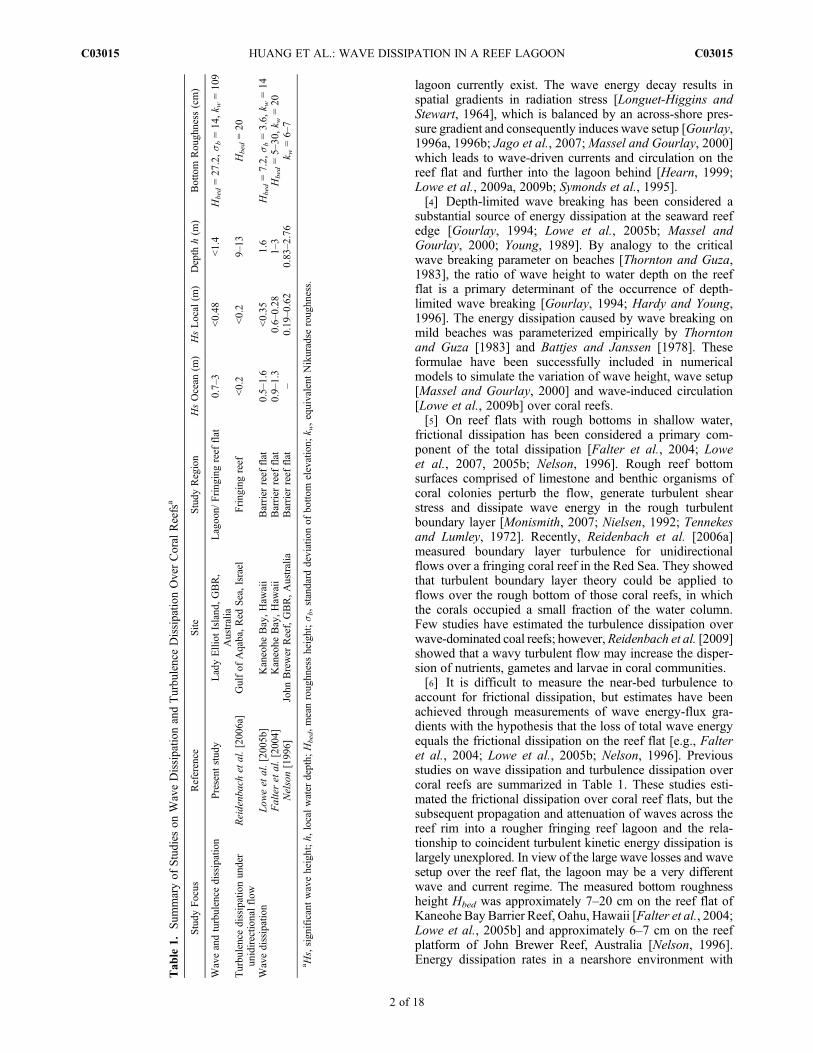
account for frictional dissipation, but estimates have beenachieved through measurements of wave energy-flux gra-dients with the hypothesis that the loss of total wave energyequals the frictional dissipation on the reef flat [e.g., Falteret al., 2004; Lowe et al., 2005b; Nelson, 1996]. Previousstudies on wave dissipation and turbulence dissipation overcoral reefs are summarized in Table 1. These studies esti-mated the frictional dissipation over coral reef flats, but thesubsequent propagation and attenuation of waves across thereef rim into a rougher fringing reef lagoon and the rela-tionship to coincident turbulent kinetic energy dissipation islargely unexplored. In view of the large wave losses and wavesetup over the reef flat, the lagoon may be a very differentwave and current regime. The measured bottom roughnessheight Hbed was approximately 7–20 cm on the reef flat ofKaneohe Bay Barrier Reef, Oahu, Hawaii [Falter et al., 2004;Lowe et al., 2005b] and approximately 6–7 cm on the reefplatform of John Brewer Reef, Australia [Nelson, 1996].Energy dissipation rates in a nearshore environment with
Tab
le1.
Sum
maryof
Studies
onWaveDissipatio
nandTurbu
lenceDissipatio
nOverCoral
Reefsa
Study
Focus
Reference
Site
Study
Region
HsOcean
(m)
HsLocal
(m)
Depth
h(m
)Bottom
Rou
ghness
(cm)
Waveandturbulence
dissipation
Present
stud
yLadyElliot
Island
,GBR,
Australia
Lagoo
n/Fring
ingreef
flat
0.7–
3<0.48
<1.4
Hbed
=27
.2,s b
=14
,k w
=10
9
Turbu
lencedissipationun
der
unidirectio
nalflow
Reidenb
achet
al.[200
6a]
Gulfof
Aqaba,Red
Sea,Israel
Fring
ingreef
<0.2
<0.2
9–13
Hbed
=20
Wavedissipation
Low
eet
al.[200
5b]
Kaneohe
Bay,Haw
aii
Barrier
reef
flat
0.5–
1.6
<0.35
1.6
Hbed
=7.2,
s b=3.6,
k w=14
Falteret
al.[200
4]Kaneohe
Bay,Haw
aii
Barrier
reef
flat
0.9–
1.3
0.6–0.28
1–3
Hbed
=5–
30,k w
=20
Nelson[199
6]John
Brewer
Reef,GBR,Australia
Barrier
reef
flat
–0.19
–0.62
0.83
–2.76
k w=6–
7
a Hs,sign
ificantwaveheight;h,
localwater
depth;
Hbed,meanroug
hnessheight;s b,standard
deviationof
botto
melevation;
k w,equivalent
Nikuradse
roug
hness.
HUANG ET AL.: WAVE DISSIPATION IN A REEF LAGOON C03015C03015
2 of 18
shallower water depth and greater bottom roughness arelargely unexplored.[7] This paper presents field measurements of dissipation
rates in the windward reef-lagoon system at Lady ElliotIsland (LEI), Great Barrier Reef (GBR), off the coast ofQueensland, Australia. Wave energy dissipation rates weremeasured and parameterized, and turbulence dissipation rateswere measured using turbulence inertial subrange techniqueswith acoustic Doppler velocimetry (ADV) data. The possibleequivalence of energy dissipation rates measured by theseindependent techniques was tested. Results are comparedwith linear wave and boundary layer theories and a bottomfriction model. For very shallow depths, where the coralheights are comparable to the water depth, the canopy dragdissipation is also evaluated and discussed.
2. Field Experiments
2.1. Study Site
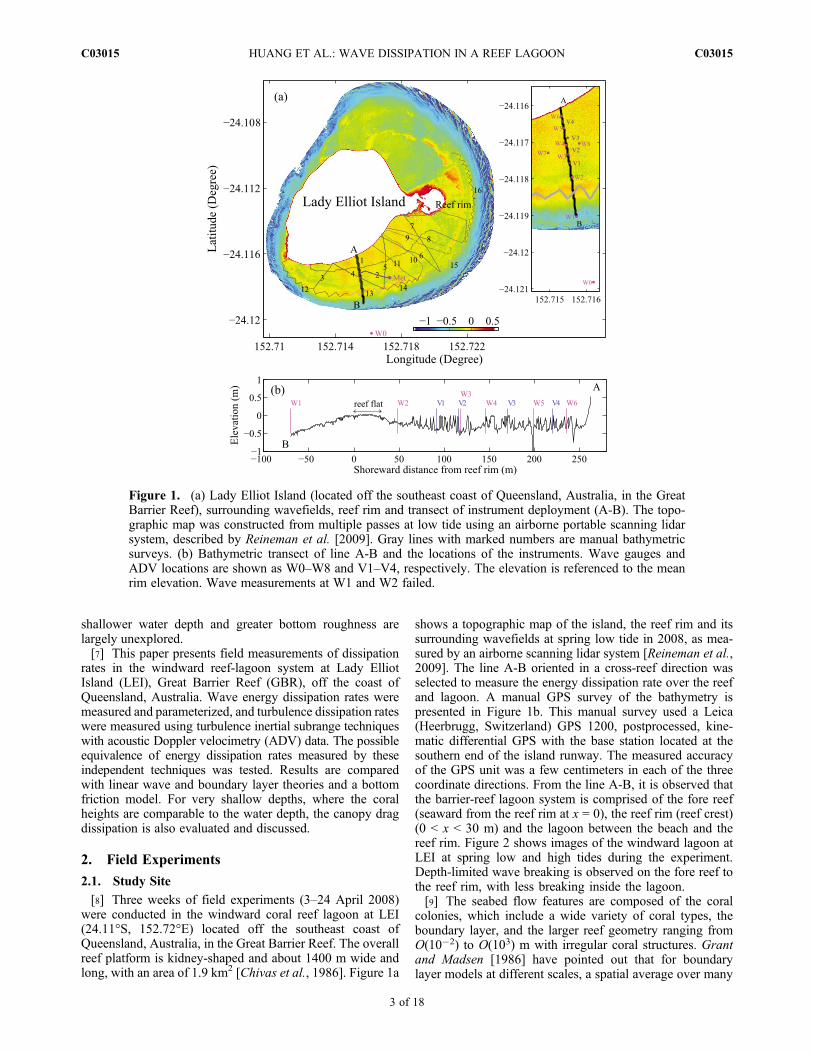
[8] Three weeks of field experiments (3–24 April 2008)were conducted in the windward coral reef lagoon at LEI(24.11°S, 152.72°E) located off the southeast coast ofQueensland, Australia, in the Great Barrier Reef. The overallreef platform is kidney-shaped and about 1400 m wide andlong, with an area of 1.9 km2 [Chivas et al., 1986]. Figure 1a
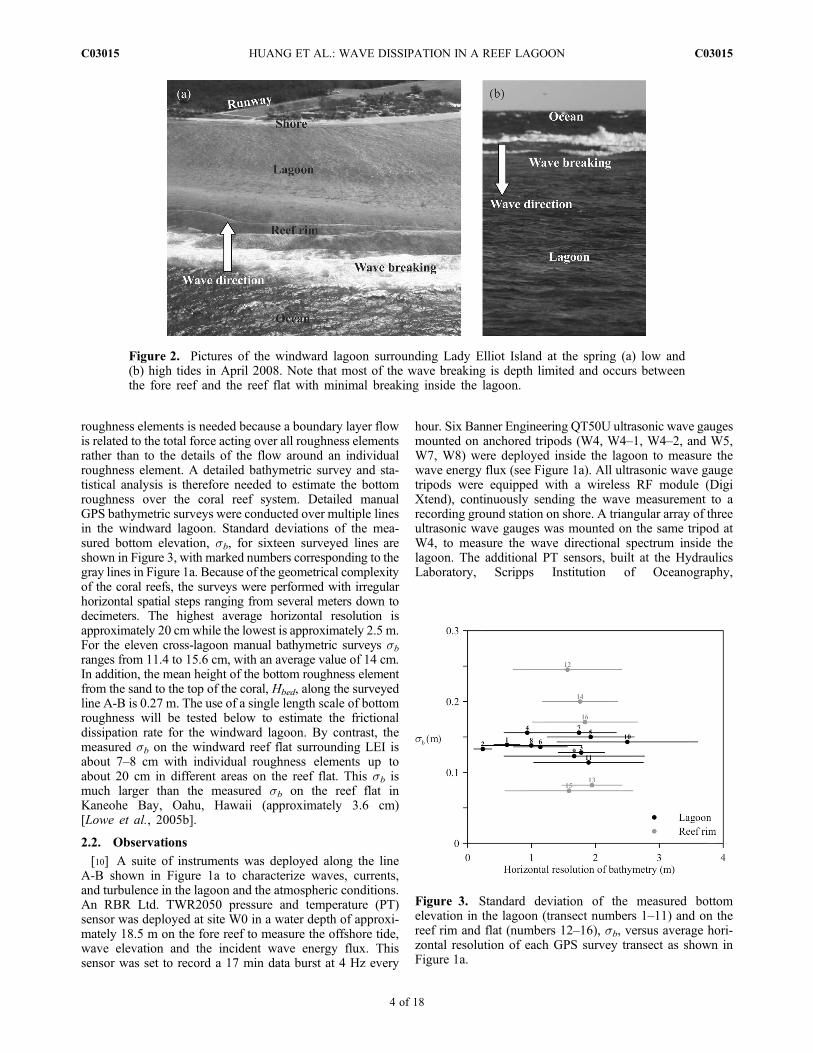
shows a topographic map of the island, the reef rim and itssurrounding wavefields at spring low tide in 2008, as mea-sured by an airborne scanning lidar system [Reineman et al.,2009]. The line A-B oriented in a cross-reef direction wasselected to measure the energy dissipation rate over the reefand lagoon. A manual GPS survey of the bathymetry ispresented in Figure 1b. This manual survey used a Leica(Heerbrugg, Switzerland) GPS 1200, postprocessed, kine-matic differential GPS with the base station located at thesouthern end of the island runway. The measured accuracyof the GPS unit was a few centimeters in each of the threecoordinate directions. From the line A-B, it is observed thatthe barrier-reef lagoon system is comprised of the fore reef(seaward from the reef rim at x = 0), the reef rim (reef crest)(0 < x < 30 m) and the lagoon between the beach and thereef rim. Figure 2 shows images of the windward lagoon atLEI at spring low and high tides during the experiment.Depth-limited wave breaking is observed on the fore reef tothe reef rim, with less breaking inside the lagoon.[9] The seabed flow features are composed of the coral
colonies, which include a wide variety of coral types, theboundary layer, and the larger reef geometry ranging fromO(10�2) to O(103) m with irregular coral structures. Grantand Madsen [1986] have pointed out that for boundarylayer models at different scales, a spatial average over many
Figure 1. (a) Lady Elliot Island (located off the southeast coast of Queensland, Australia, in the GreatBarrier Reef), surrounding wavefields, reef rim and transect of instrument deployment (A-B). The topo-graphic map was constructed from multiple passes at low tide using an airborne portable scanning lidarsystem, described by Reineman et al. [2009]. Gray lines with marked numbers are manual bathymetricsurveys. (b) Bathymetric transect of line A-B and the locations of the instruments. Wave gauges andADV locations are shown as W0–W8 and V1–V4, respectively. The elevation is referenced to the meanrim elevation. Wave measurements at W1 and W2 failed.
HUANG ET AL.: WAVE DISSIPATION IN A REEF LAGOON C03015C03015
3 of 18
roughness elements is needed because a boundary layer flowis related to the total force acting over all roughness elementsrather than to the details of the flow around an individualroughness element. A detailed bathymetric survey and sta-tistical analysis is therefore needed to estimate the bottomroughness over the coral reef system. Detailed manualGPS bathymetric surveys were conducted over multiple linesin the windward lagoon. Standard deviations of the mea-sured bottom elevation, sb, for sixteen surveyed lines areshown in Figure 3, with marked numbers corresponding to thegray lines in Figure 1a. Because of the geometrical complexityof the coral reefs, the surveys were performed with irregularhorizontal spatial steps ranging from several meters down todecimeters. The highest average horizontal resolution isapproximately 20 cmwhile the lowest is approximately 2.5 m.For the eleven cross-lagoon manual bathymetric surveys sbranges from 11.4 to 15.6 cm, with an average value of 14 cm.In addition, the mean height of the bottom roughness elementfrom the sand to the top of the coral, Hbed, along the surveyedline A-B is 0.27 m. The use of a single length scale of bottomroughness will be tested below to estimate the frictionaldissipation rate for the windward lagoon. By contrast, themeasured sb on the windward reef flat surrounding LEI isabout 7–8 cm with individual roughness elements up toabout 20 cm in different areas on the reef flat. This sb ismuch larger than the measured sb on the reef flat inKaneohe Bay, Oahu, Hawaii (approximately 3.6 cm)[Lowe et al., 2005b].
2.2. Observations
[10] A suite of instruments was deployed along the lineA-B shown in Figure 1a to characterize waves, currents,and turbulence in the lagoon and the atmospheric conditions.An RBR Ltd. TWR2050 pressure and temperature (PT)sensor was deployed at site W0 in a water depth of approxi-mately 18.5 m on the fore reef to measure the offshore tide,wave elevation and the incident wave energy flux. Thissensor was set to record a 17 min data burst at 4 Hz every
hour. Six Banner Engineering QT50U ultrasonic wave gaugesmounted on anchored tripods (W4, W4–1, W4–2, and W5,W7, W8) were deployed inside the lagoon to measure thewave energy flux (see Figure 1a). All ultrasonic wave gaugetripods were equipped with a wireless RF module (DigiXtend), continuously sending the wave measurement to arecording ground station on shore. A triangular array of threeultrasonic wave gauges was mounted on the same tripod atW4, to measure the wave directional spectrum inside thelagoon. The additional PT sensors, built at the HydraulicsLaboratory, Scripps Institution of Oceanography,
Figure 2. Pictures of the windward lagoon surrounding Lady Elliot Island at the spring (a) low and(b) high tides in April 2008. Note that most of the wave breaking is depth limited and occurs betweenthe fore reef and the reef flat with minimal breaking inside the lagoon.
Figure 3. Standard deviation of the measured bottomelevation in the lagoon (transect numbers 1–11) and on thereef rim and flat (numbers 12–16), sb, versus average hori-zontal resolution of each GPS survey transect as shown inFigure 1a.
HUANG ET AL.: WAVE DISSIPATION IN A REEF LAGOON C03015C03015
4 of 18
continuously sampled at 4 Hz while the wave gauges were setto record at 5 Hz for a 20–55 min burst every hour, at W3 andW6. Three 6 MHz Nortek Vector ADVs (V1, V2 and V4,oriented downward) and one 16 MHz Sontek Micro ADV(V3, oriented upward) were deployed in the lagoon to con-tinuously sample the near-bed flow velocities at 32 Hz(Nortek Vectors) and 25 Hz and at 0.13 (V1), 0.13 (V2),0.32 (V3) and 0.12 m (V4) above the sandy bottom,respectively.[11] An eddy covariance system (denoted as Met in
Figure 1a) was deployed to acquire meteorological and air-water flux measurements. The system includes an ultrasonicanemometer (Campbell CSAT3) measuring wind speed anddirection, an open-path infrared gas analyzer to measurewater vapor and CO2 (Licor LI7500), a relative humidity andtemperature sensor (HMP45C), shortwave and longwave netradiometers (Kipp & Zonen CNR1), and pH and oxidation-reduction-potential probes (Campbell CSIM11 and CS511,respectively), both compensated for temperature variationsin the lagoon. All meteorological instruments were sampledcontinuously at 20 Hz, and then averaged to produce 30-minsamples (Figure 4). A discussion of some of these data andthe LEI lagoon heat budget is contained by McCabe et al.[2010]. The eddy covariance system was initially locatedon the beach at the end of the runway on the southern part ofthe island, without radiation measurements. A lagoon-basedtower was constructed later just inside the southern lagoonreef flat where we relocated the meteorological package for
the remainder of the experiment. A summary of the locationsand settings of the deployed instruments is listed in Table 2.
3. Wave Transformation
[12] The measured sea surface elevations were analyzed toevaluate the significant wave height, Hs, which is defined as[Young, 1999]
Hs ¼ 4
ZSð f Þdf
� �1=2; ð1Þ
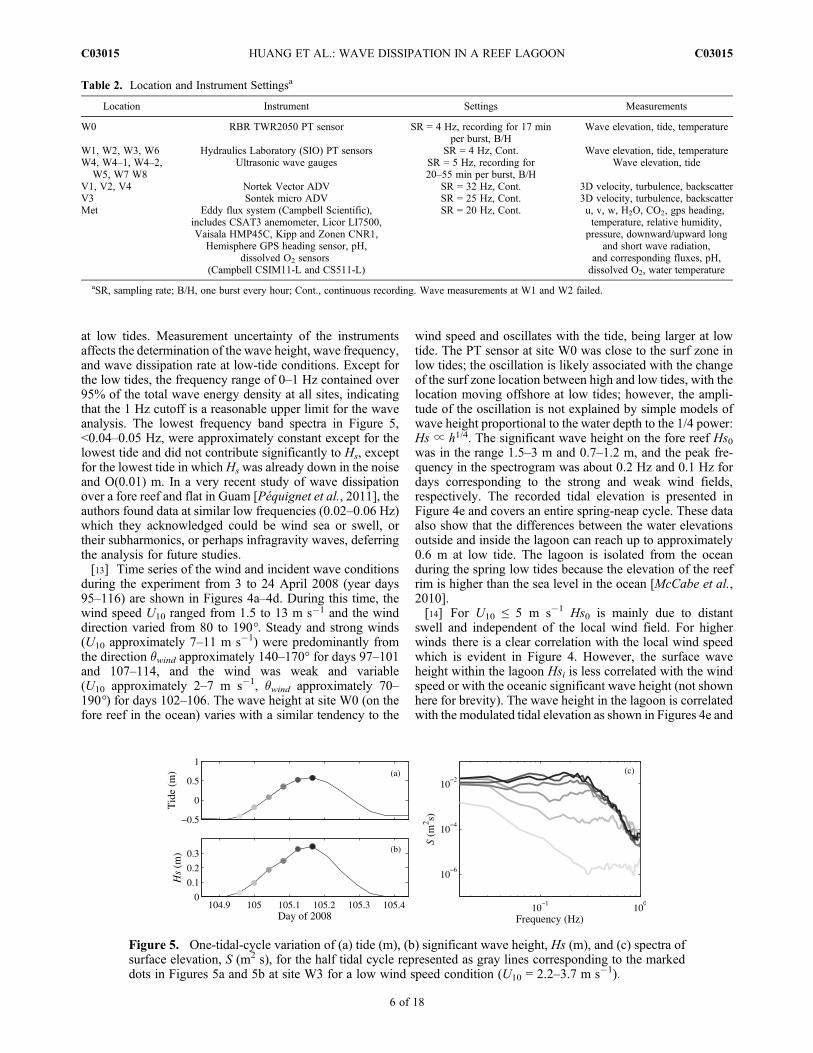
where S( f ) is the spectral density of the surface displace-ment and f is the frequency in Hz. Approximately 15-minrecords containing 4352 samples (wave gauges) and 3584samples (PT sensors) in each hourly burst were split into 33and 27 blocks, respectively, using 50% overlap to calculatethe individual spectra with Hanning windows after meanremoval and linear detrending. Ensemble-averaged spectrafor each hourly burst were computed from averaging thespectra with 66 and 54 degrees of freedom. Figure 5 showsthe variation of the spectra at site W3 for one tidal cycleduring low wind conditions. Surface wave energy in the0–0.8 Hz frequency band increases as the tide rises. At lowtides, the PT sensors showed significant noise at higher fre-quencies, so only spectral energies up to 1 Hz were consid-ered for the wave analysis. Wave gauge spectra also show abackground noise level of S( f ) of approximately 10�6 (m2 s)
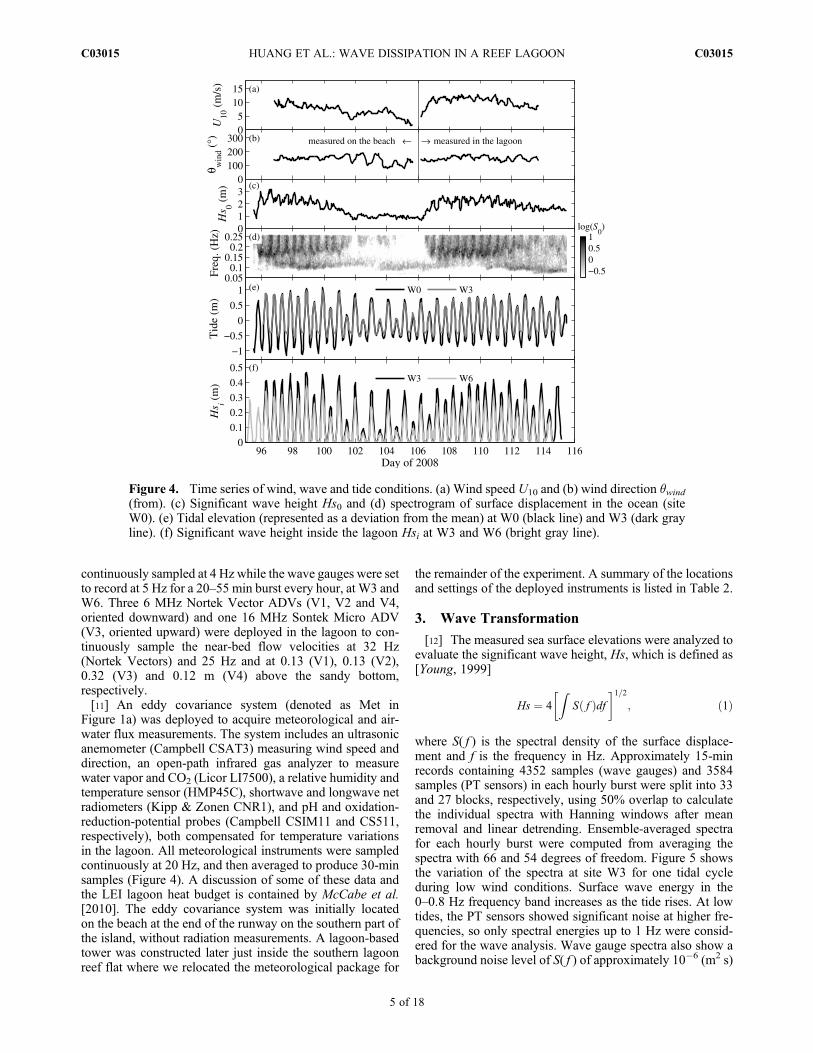
Figure 4. Time series of wind, wave and tide conditions. (a) Wind speed U10 and (b) wind direction qwind(from). (c) Significant wave height Hs0 and (d) spectrogram of surface displacement in the ocean (siteW0). (e) Tidal elevation (represented as a deviation from the mean) at W0 (black line) and W3 (dark grayline). (f) Significant wave height inside the lagoon Hsi at W3 and W6 (bright gray line).
HUANG ET AL.: WAVE DISSIPATION IN A REEF LAGOON C03015C03015
5 of 18
at low tides. Measurement uncertainty of the instrumentsaffects the determination of the wave height, wave frequency,and wave dissipation rate at low-tide conditions. Except forthe low tides, the frequency range of 0–1 Hz contained over95% of the total wave energy density at all sites, indicatingthat the 1 Hz cutoff is a reasonable upper limit for the waveanalysis. The lowest frequency band spectra in Figure 5,<0.04–0.05 Hz, were approximately constant except for thelowest tide and did not contribute significantly to Hs, exceptfor the lowest tide in which Hs was already down in the noiseand O(0.01) m. In a very recent study of wave dissipationover a fore reef and flat in Guam [Péquignet et al., 2011], theauthors found data at similar low frequencies (0.02–0.06 Hz)which they acknowledged could be wind sea or swell, ortheir subharmonics, or perhaps infragravity waves, deferringthe analysis for future studies.[13] Time series of the wind and incident wave conditions
during the experiment from 3 to 24 April 2008 (year days95–116) are shown in Figures 4a–4d. During this time, thewind speed U10 ranged from 1.5 to 13 m s�1 and the winddirection varied from 80 to 190°. Steady and strong winds(U10 approximately 7–11 m s�1) were predominantly fromthe direction qwind approximately 140–170° for days 97–101and 107–114, and the wind was weak and variable(U10 approximately 2–7 m s�1, qwind approximately 70–190°) for days 102–106. The wave height at site W0 (on thefore reef in the ocean) varies with a similar tendency to the
wind speed and oscillates with the tide, being larger at lowtide. The PT sensor at site W0 was close to the surf zone inlow tides; the oscillation is likely associated with the changeof the surf zone location between high and low tides, with thelocation moving offshore at low tides; however, the ampli-tude of the oscillation is not explained by simple models ofwave height proportional to the water depth to the 1/4 power:Hs ∝ h1/4. The significant wave height on the fore reef Hs0was in the range 1.5–3 m and 0.7–1.2 m, and the peak fre-quency in the spectrogram was about 0.2 Hz and 0.1 Hz fordays corresponding to the strong and weak wind fields,respectively. The recorded tidal elevation is presented inFigure 4e and covers an entire spring-neap cycle. These dataalso show that the differences between the water elevationsoutside and inside the lagoon can reach up to approximately0.6 m at low tide. The lagoon is isolated from the oceanduring the spring low tides because the elevation of the reefrim is higher than the sea level in the ocean [McCabe et al.,2010].[14] For U10 ≤ 5 m s�1 Hs0 is mainly due to distant
swell and independent of the local wind field. For higherwinds there is a clear correlation with the local wind speedwhich is evident in Figure 4. However, the surface waveheight within the lagoon Hsi is less correlated with the windspeed or with the oceanic significant wave height (not shownhere for brevity). The wave height in the lagoon is correlatedwith the modulated tidal elevation as shown in Figures 4e and
Figure 5. One-tidal-cycle variation of (a) tide (m), (b) significant wave height, Hs (m), and (c) spectra ofsurface elevation, S (m2 s), for the half tidal cycle represented as gray lines corresponding to the markeddots in Figures 5a and 5b at site W3 for a low wind speed condition (U10 = 2.2–3.7 m s�1).
Table 2. Location and Instrument Settingsa
Location Instrument Settings Measurements
W0 RBR TWR2050 PT sensor SR = 4 Hz, recording for 17 minper burst, B/H
Wave elevation, tide, temperature
W1, W2, W3, W6 Hydraulics Laboratory (SIO) PT sensors SR = 4 Hz, Cont. Wave elevation, tide, temperatureW4, W4–1, W4–2,
W5, W7 W8Ultrasonic wave gauges SR = 5 Hz, recording for
20–55 min per burst, B/HWave elevation, tide
V1, V2, V4 Nortek Vector ADV SR = 32 Hz, Cont. 3D velocity, turbulence, backscatterV3 Sontek micro ADV SR = 25 Hz, Cont. 3D velocity, turbulence, backscatterMet Eddy flux system (Campbell Scientific),
includes CSAT3 anemometer, Licor LI7500,Vaisala HMP45C, Kipp and Zonen CNR1,
Hemisphere GPS heading sensor, pH,dissolved O2 sensors
(Campbell CSIM11-L and CS511-L)
SR = 20 Hz, Cont. u, v, w, H2O, CO2, gps heading,temperature, relative humidity,
pressure, downward/upward longand short wave radiation,
and corresponding fluxes, pH,dissolved O2, water temperature
aSR, sampling rate; B/H, one burst every hour; Cont., continuous recording. Wave measurements at W1 and W2 failed.
HUANG ET AL.: WAVE DISSIPATION IN A REEF LAGOON C03015C03015
6 of 18
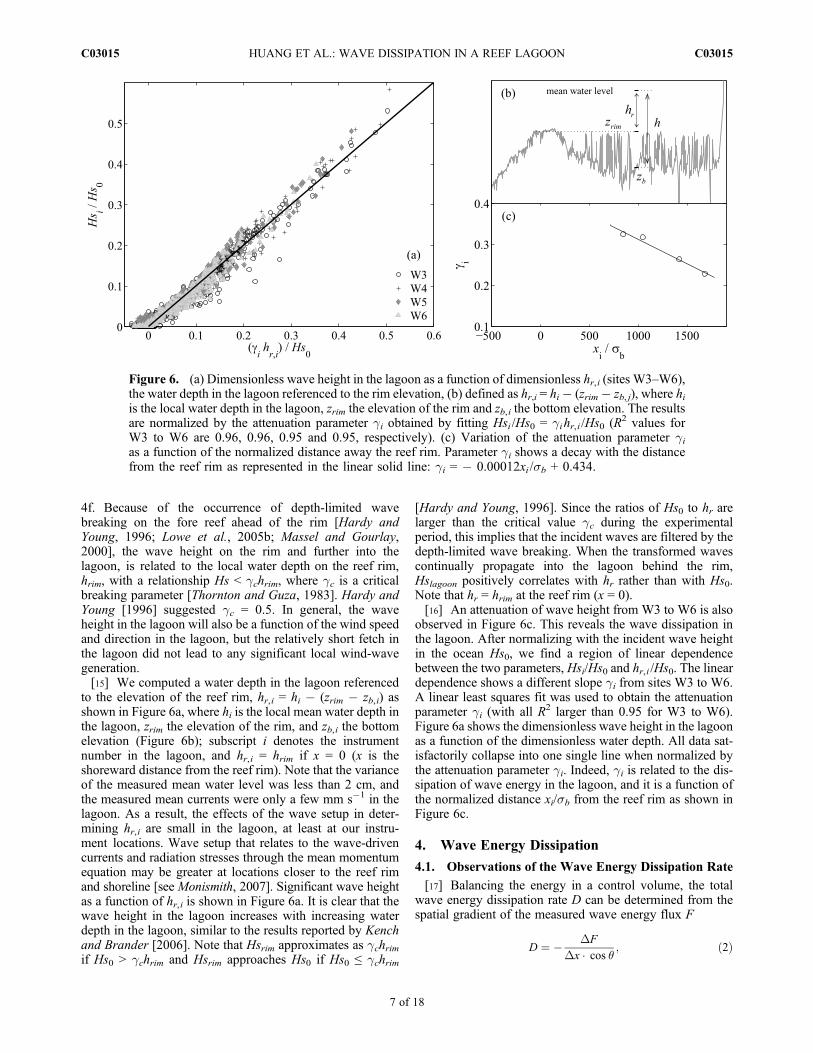
4f. Because of the occurrence of depth-limited wavebreaking on the fore reef ahead of the rim [Hardy andYoung, 1996; Lowe et al., 2005b; Massel and Gourlay,2000], the wave height on the rim and further into thelagoon, is related to the local water depth on the reef rim,hrim, with a relationship Hs < gchrim, where gc is a criticalbreaking parameter [Thornton and Guza, 1983]. Hardy andYoung [1996] suggested gc = 0.5. In general, the waveheight in the lagoon will also be a function of the wind speedand direction in the lagoon, but the relatively short fetch inthe lagoon did not lead to any significant local wind-wavegeneration.[15] We computed a water depth in the lagoon referenced
to the elevation of the reef rim, hr,i = hi � (zrim � zb,i) asshown in Figure 6a, where hi is the local mean water depth inthe lagoon, zrim the elevation of the rim, and zb,i the bottomelevation (Figure 6b); subscript i denotes the instrumentnumber in the lagoon, and hr,i = hrim if x = 0 (x is theshoreward distance from the reef rim). Note that the varianceof the measured mean water level was less than 2 cm, andthe measured mean currents were only a few mm s�1 in thelagoon. As a result, the effects of the wave setup in deter-mining hr,i are small in the lagoon, at least at our instru-ment locations. Wave setup that relates to the wave-drivencurrents and radiation stresses through the mean momentumequation may be greater at locations closer to the reef rimand shoreline [see Monismith, 2007]. Significant wave heightas a function of hr,i is shown in Figure 6a. It is clear that thewave height in the lagoon increases with increasing waterdepth in the lagoon, similar to the results reported by Kenchand Brander [2006]. Note that Hsrim approximates as gchrimif Hs0 > gchrim and Hsrim approaches Hs0 if Hs0 ≤ gchrim
[Hardy and Young, 1996]. Since the ratios of Hs0 to hr arelarger than the critical value gc during the experimentalperiod, this implies that the incident waves are filtered by thedepth-limited wave breaking. When the transformed wavescontinually propagate into the lagoon behind the rim,Hslagoon positively correlates with hr rather than with Hs0.Note that hr = hrim at the reef rim (x = 0).[16] An attenuation of wave height from W3 to W6 is also
observed in Figure 6c. This reveals the wave dissipation inthe lagoon. After normalizing with the incident wave heightin the ocean Hs0, we find a region of linear dependencebetween the two parameters, Hsi/Hs0 and hr,i /Hs0. The lineardependence shows a different slope gi from sites W3 to W6.A linear least squares fit was used to obtain the attenuationparameter gi (with all R2 larger than 0.95 for W3 to W6).Figure 6a shows the dimensionless wave height in the lagoonas a function of the dimensionless water depth. All data sat-isfactorily collapse into one single line when normalized bythe attenuation parameter gi. Indeed, gi is related to the dis-sipation of wave energy in the lagoon, and it is a function ofthe normalized distance xi/sb from the reef rim as shown inFigure 6c.
4. Wave Energy Dissipation
4.1. Observations of the Wave Energy Dissipation Rate
[17] Balancing the energy in a control volume, the totalwave energy dissipation rate D can be determined from thespatial gradient of the measured wave energy flux F
D ¼ � DF
Dx � cos q ; ð2Þ
Figure 6. (a) Dimensionless wave height in the lagoon as a function of dimensionless hr,i (sites W3–W6),the water depth in the lagoon referenced to the rim elevation, (b) defined as hr,i = hi� (zrim� zb, j), where hiis the local water depth in the lagoon, zrim the elevation of the rim and zb,i the bottom elevation. The resultsare normalized by the attenuation parameter gi obtained by fitting Hsi /Hs0 = gihr,i /Hs0 (R2 values forW3 to W6 are 0.96, 0.96, 0.95 and 0.95, respectively). (c) Variation of the attenuation parameter gias a function of the normalized distance away the reef rim. Parameter gi shows a decay with the distancefrom the reef rim as represented in the linear solid line: gi = � 0.00012xi /sb + 0.434.
HUANG ET AL.: WAVE DISSIPATION IN A REEF LAGOON C03015C03015
7 of 18
where Dx is the distance between two adjacent sites and qis the angle of the wave propagation direction intersectingthe line connecting the two sites. The wave energy flux isdefined as
F ¼ ECg; ð3Þ
where E is the total wave energy density per unit area andCg is the wave group velocity. Total wave energy densitycan be computed from the depth-integrated kinetic andpotential energies, or can be well approximated by equi-partition as twice the potential energy density. For wavespectra in the field, the total wave energy is expressed as anintegral of the spectral density of the surface displacement
E ¼ 2rgZ
Sð f Þdf ; ð4Þ
where r is the water density and g is gravity. For wavespectra, the group velocity is determined using a spectralweighted group velocity [Drazen et al., 2008]
Cg ¼
ZCgnSð f ÞdfZSð f Þdf
; ð5Þ
where Cgn is the characteristic group velocity of the nthcomponent of the waves
Cgn ¼ ∂w∂k
����n
¼ 1
2wn
wn2 þ gkn2h 1� tanh2ðknhÞ
� �kn
" #; ð6Þ
with wn the nth component of the radian frequency, knthe nth component of the wavenumber, and h the local waterdepth. The total wave energy dissipation rate may be com-puted using equations (2)–(6).[18] To compute the wave energy dissipation rate, the
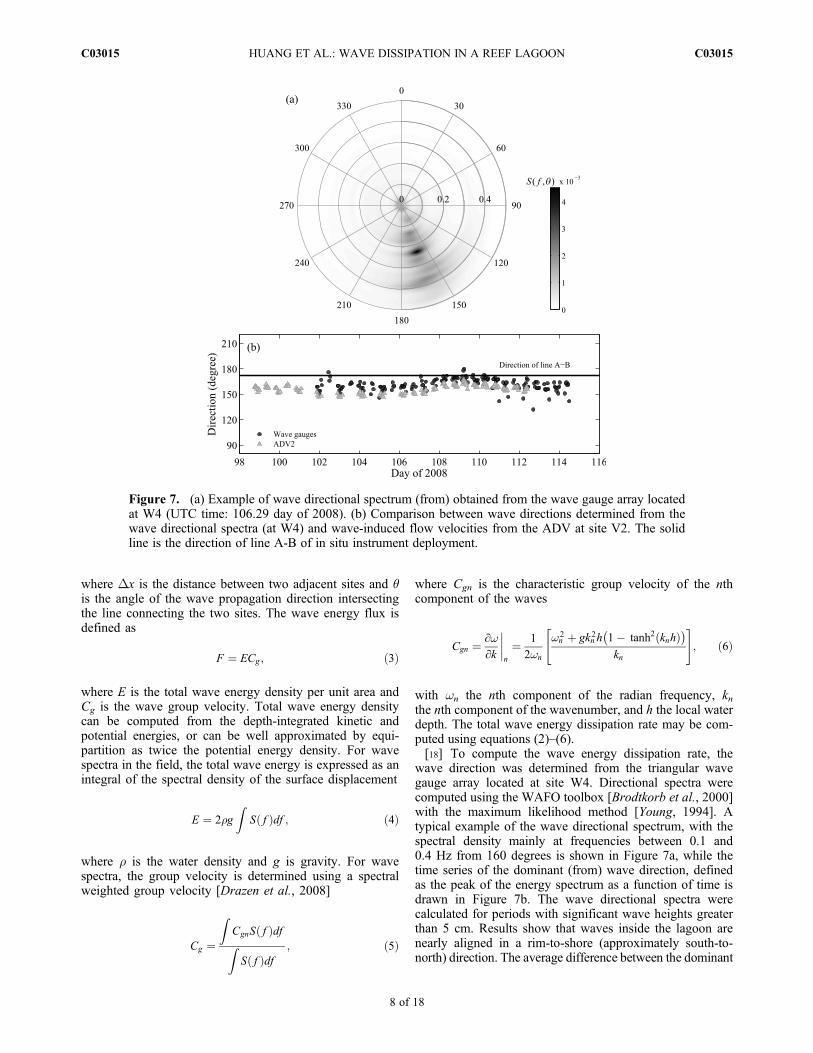
wave direction was determined from the triangular wavegauge array located at site W4. Directional spectra werecomputed using the WAFO toolbox [Brodtkorb et al., 2000]with the maximum likelihood method [Young, 1994]. Atypical example of the wave directional spectrum, with thespectral density mainly at frequencies between 0.1 and0.4 Hz from 160 degrees is shown in Figure 7a, while thetime series of the dominant (from) wave direction, definedas the peak of the energy spectrum as a function of time isdrawn in Figure 7b. The wave directional spectra werecalculated for periods with significant wave heights greaterthan 5 cm. Results show that waves inside the lagoon arenearly aligned in a rim-to-shore (approximately south-to-north) direction. The average difference between the dominant
Figure 7. (a) Example of wave directional spectrum (from) obtained from the wave gauge array locatedat W4 (UTC time: 106.29 day of 2008). (b) Comparison between wave directions determined from thewave directional spectra (at W4) and wave-induced flow velocities from the ADV at site V2. The solidline is the direction of line A-B of in situ instrument deployment.
HUANG ET AL.: WAVE DISSIPATION IN A REEF LAGOON C03015C03015
8 of 18
wave direction and the line A-B is 10.8° with a standarddeviation of 7°. The values verify that approximately 98%of the wave energy flux is along the direction of the array.It should be noted that the array was designed to be alignedwith the dominant wavefield, but the methods employedhere can be generalized for more complex wavefields andbathymetry.[19] In addition to the wave directional spectrum observed
by the wave gauge array, ADV measured velocities can alsoprovide wave direction by calculating the principal axis ofthe wave-induced eastward and northward flow [Emery andThomson, 2001]. For determining the wave directions,velocities were bandpass filtered with cutoff frequencies of0.05 and 0.8 Hz using an FFT algorithm after mean removaland linear detrending. The principal axis of the wave-induced velocities at the site V2 is included in Figure 7b, andsimilar results are obtained for the other ADVs deployed inthe lagoon. This confirms that wave direction in the wind-ward lagoon is from 150 to 160° and verifies the alignmentbetween the array of in situ instruments and the predominantwave propagation direction. Due to the limited fetch of thelagoon and the wind conditions, wind-generated waves inthe lagoon make a negligible contribution to the waveenergy budget.[20] The measured energy fluxes at sites in the ocean and
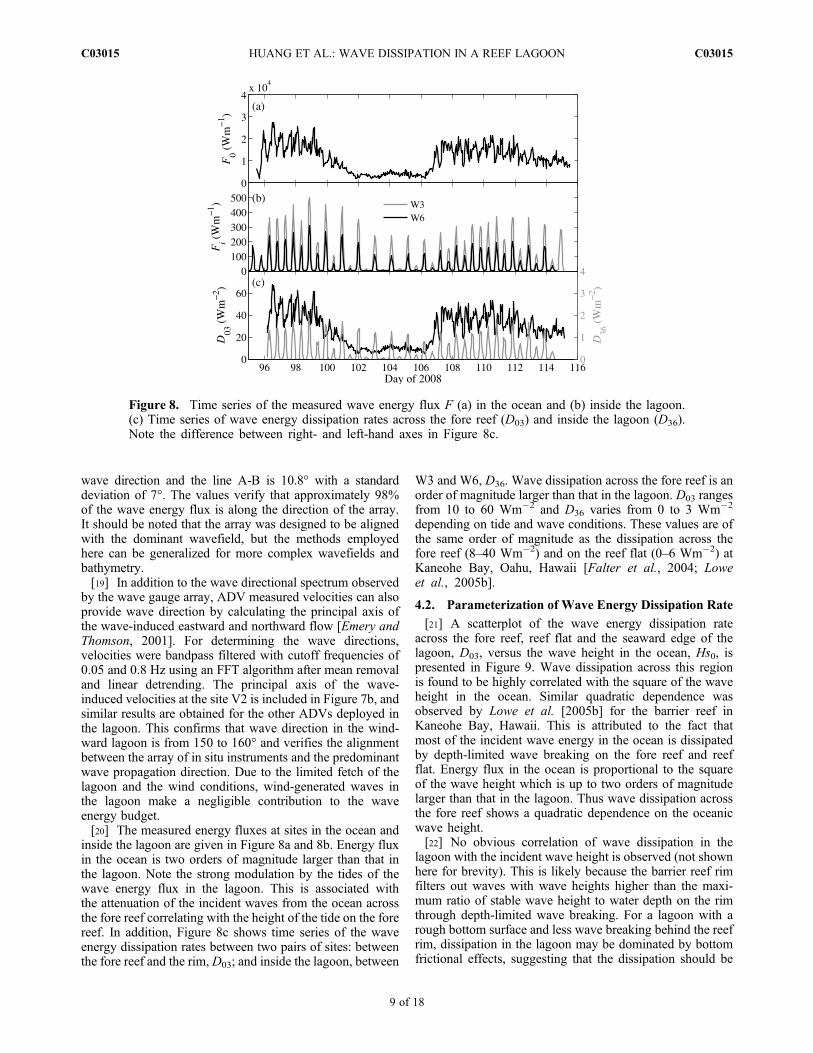
inside the lagoon are given in Figure 8a and 8b. Energy fluxin the ocean is two orders of magnitude larger than that inthe lagoon. Note the strong modulation by the tides of thewave energy flux in the lagoon. This is associated withthe attenuation of the incident waves from the ocean acrossthe fore reef correlating with the height of the tide on the forereef. In addition, Figure 8c shows time series of the waveenergy dissipation rates between two pairs of sites: betweenthe fore reef and the rim, D03; and inside the lagoon, between
W3 and W6, D36. Wave dissipation across the fore reef is anorder of magnitude larger than that in the lagoon. D03 rangesfrom 10 to 60 Wm�2 and D36 varies from 0 to 3 Wm�2
depending on tide and wave conditions. These values are ofthe same order of magnitude as the dissipation across thefore reef (8–40 Wm�2) and on the reef flat (0–6 Wm�2) atKaneohe Bay, Oahu, Hawaii [Falter et al., 2004; Loweet al., 2005b].
4.2. Parameterization of Wave Energy Dissipation Rate
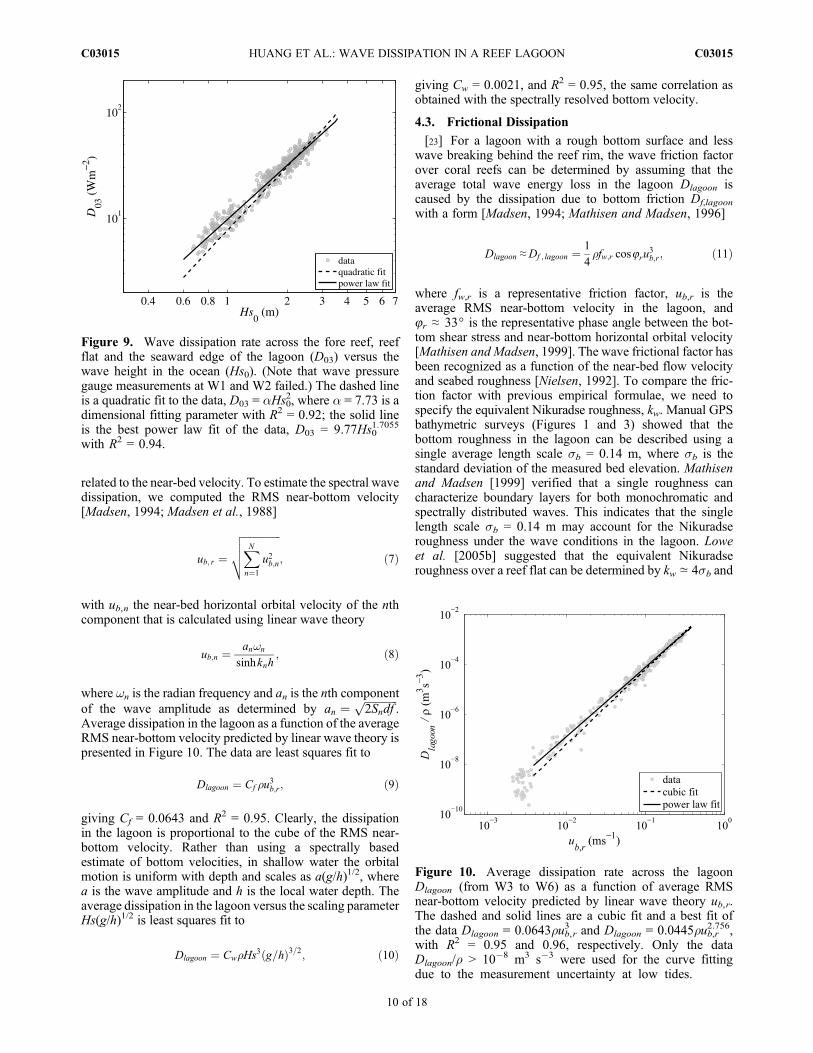
[21] A scatterplot of the wave energy dissipation rateacross the fore reef, reef flat and the seaward edge of thelagoon, D03, versus the wave height in the ocean, Hs0, ispresented in Figure 9. Wave dissipation across this regionis found to be highly correlated with the square of the waveheight in the ocean. Similar quadratic dependence wasobserved by Lowe et al. [2005b] for the barrier reef inKaneohe Bay, Hawaii. This is attributed to the fact thatmost of the incident wave energy in the ocean is dissipatedby depth-limited wave breaking on the fore reef and reefflat. Energy flux in the ocean is proportional to the squareof the wave height which is up to two orders of magnitudelarger than that in the lagoon. Thus wave dissipation acrossthe fore reef shows a quadratic dependence on the oceanicwave height.[22] No obvious correlation of wave dissipation in the
lagoon with the incident wave height is observed (not shownhere for brevity). This is likely because the barrier reef rimfilters out waves with wave heights higher than the maxi-mum ratio of stable wave height to water depth on the rimthrough depth-limited wave breaking. For a lagoon with arough bottom surface and less wave breaking behind the reefrim, dissipation in the lagoon may be dominated by bottomfrictional effects, suggesting that the dissipation should be
Figure 8. Time series of the measured wave energy flux F (a) in the ocean and (b) inside the lagoon.(c) Time series of wave energy dissipation rates across the fore reef (D03) and inside the lagoon (D36).Note the difference between right- and left-hand axes in Figure 8c.
HUANG ET AL.: WAVE DISSIPATION IN A REEF LAGOON C03015C03015
9 of 18
related to the near-bed velocity. To estimate the spectral wavedissipation, we computed the RMS near-bottom velocity[Madsen, 1994; Madsen et al., 1988]
ub; r ¼ffiffiffiffiffiffiffiffiffiffiffiffiffiffiffiXNn¼1
u2b;n
vuut ; ð7Þ
with ub,n the near-bed horizontal orbital velocity of the nthcomponent that is calculated using linear wave theory
ub;n ¼ anwn
sinhknh; ð8Þ
where wn is the radian frequency and an is the nth componentof the wave amplitude as determined by an ¼
ffiffiffiffiffiffiffiffiffiffiffiffi2Sndf
p.
Average dissipation in the lagoon as a function of the averageRMS near-bottom velocity predicted by linear wave theory ispresented in Figure 10. The data are least squares fit to
Dlagoon ¼ Cf ru3b;r; ð9Þ
giving Cf = 0.0643 and R2 = 0.95. Clearly, the dissipationin the lagoon is proportional to the cube of the RMS near-bottom velocity. Rather than using a spectrally basedestimate of bottom velocities, in shallow water the orbitalmotion is uniform with depth and scales as a(g/h)1/2, wherea is the wave amplitude and h is the local water depth. Theaverage dissipation in the lagoon versus the scaling parameterHs(g/h)1/2 is least squares fit to
Dlagoon ¼ CwrHs3 g=hð Þ3=2; ð10Þ
giving Cw = 0.0021, and R2 = 0.95, the same correlation asobtained with the spectrally resolved bottom velocity.
4.3. Frictional Dissipation
[23] For a lagoon with a rough bottom surface and lesswave breaking behind the reef rim, the wave friction factorover coral reefs can be determined by assuming that theaverage total wave energy loss in the lagoon Dlagoon iscaused by the dissipation due to bottom friction Df,lagoon
with a form [Madsen, 1994; Mathisen and Madsen, 1996]
Dlagoon ≈Df ; lagoon ¼ 1
4rfw;r cos8ru
3b;r; ð11Þ
where fw,r is a representative friction factor, ub,r is theaverage RMS near-bottom velocity in the lagoon, and8r ≈ 33° is the representative phase angle between the bot-tom shear stress and near-bottom horizontal orbital velocity[Mathisen and Madsen, 1999]. The wave frictional factor hasbeen recognized as a function of the near-bed flow velocityand seabed roughness [Nielsen, 1992]. To compare the fric-tion factor with previous empirical formulae, we need tospecify the equivalent Nikuradse roughness, kw. Manual GPSbathymetric surveys (Figures 1 and 3) showed that thebottom roughness in the lagoon can be described using asingle average length scale sb = 0.14 m, where sb is thestandard deviation of the measured bed elevation. Mathisenand Madsen [1999] verified that a single roughness cancharacterize boundary layers for both monochromatic andspectrally distributed waves. This indicates that the singlelength scale sb = 0.14 m may account for the Nikuradseroughness under the wave conditions in the lagoon. Loweet al. [2005b] suggested that the equivalent Nikuradseroughness over a reef flat can be determined by kw ≃ 4sb and
Figure 10. Average dissipation rate across the lagoonDlagoon (from W3 to W6) as a function of average RMSnear-bottom velocity predicted by linear wave theory ub,r.The dashed and solid lines are a cubic fit and a best fit ofthe data Dlagoon = 0.0643rub,r
3 and Dlagoon = 0.0445rub,r2.756,
with R2 = 0.95 and 0.96, respectively. Only the dataDlagoon/r > 10�8 m3 s�3 were used for the curve fittingdue to the measurement uncertainty at low tides.
Figure 9. Wave dissipation rate across the fore reef, reefflat and the seaward edge of the lagoon (D03) versus thewave height in the ocean (Hs0). (Note that wave pressuregauge measurements at W1 and W2 failed.) The dashed lineis a quadratic fit to the data, D03 = aHs0
2, where a = 7.73 is adimensional fitting parameter with R2 = 0.92; the solid lineis the best power law fit of the data, D03 = 9.77Hs0
1.7055
with R2 = 0.94.
HUANG ET AL.: WAVE DISSIPATION IN A REEF LAGOON C03015C03015
10 of 18
Madsen [1994] reported kw ≃ 4Hbed for rough rippled bedforms, where Hbed is the height of the bottom roughness.In our case, Hbed is defined as the mean height of theroughness elements. The measured value of Hbed is 0.272 m,which is close to 2sb.[24] A commonly used empirical formula to estimate the
wave friction factor was proposed by Swart [1974] with theform
fw;r ¼ exp c1ub;rkwwr
� c2
þ c3
� �; ð12Þ
where c1�3 are constants and wr is the representative (kineticenergy weighted) radian frequency
wr ¼PNn¼1
wnu2b;n
PNn¼1
u2b;n
: ð13Þ
Nielsen [1992] suggested c1 = 5.5, c2 = �0.2 and c3 = �6.3for monochromatic waves; Madsen [1994] and Mathisenand Madsen [1999] extended the monochromatic frictionformulas to spectral wave conditions with c1 = 7.02,c2 = �0.078 and c3 = �8.82. The analyzed friction factor,fwr, not shown here, agrees much better using equation (12)with Madsen’s coefficients rather than Nielsen’s. In fact,Nielsen’s coefficients were obtained by fitting laboratorydata measured in monochromatic turbulent flows for0.5 � 1 < ub/(kww). However, Madsen’s coefficients can beapplied to a range of 0.2 < ub,r/(kwwr) < 102 for wave
spectra, which is much closer to the rougher bottom andspectral wave conditions in the LEI lagoon.[25] The energy dissipation rate due to bottom friction for
waves in the presence of currents was generalized byMadsen et al. [1988] and Madsen [1994] by defining rep-resentative parameters using weighted averages of discretecomponents. From our ADV current measurements, theeffects induced by mean currents are negligible compared towave orbital velocities inside the lagoon. Accordingly, themodel for spectral waves in the absence of a current wasused to estimate the frictional dissipation rate [Mathisen andMadsen, 1999]
Df ;n ¼ 1
4rfe;nub; ru2b;n; ð14Þ
where fe,n is an energy dissipation factor defined as fe;n ¼ffiffiffiffiffiffiffifw;r
p ffiffiffiffiffiffiffifw;n
pcos8n, where fw,n is the friction factor of the nth
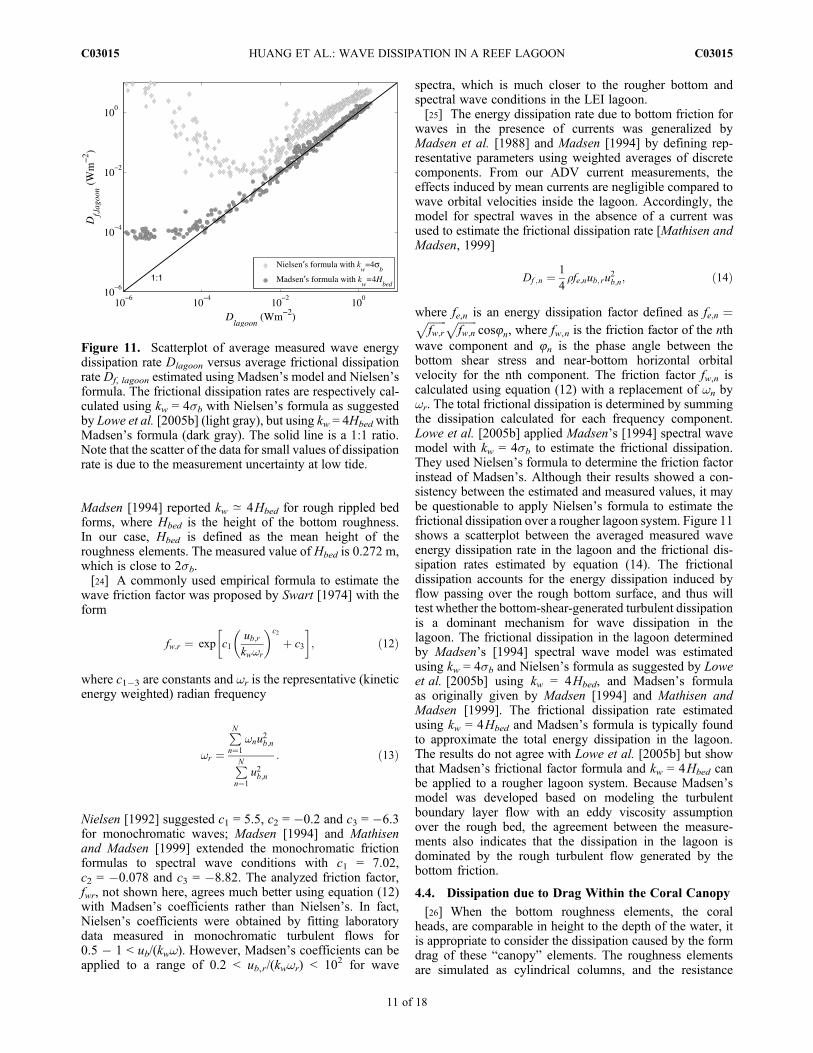
wave component and 8n is the phase angle between thebottom shear stress and near-bottom horizontal orbitalvelocity for the nth component. The friction factor fw,n iscalculated using equation (12) with a replacement of wn bywr. The total frictional dissipation is determined by summingthe dissipation calculated for each frequency component.Lowe et al. [2005b] applied Madsen’s [1994] spectral wavemodel with kw = 4sb to estimate the frictional dissipation.They used Nielsen’s formula to determine the friction factorinstead of Madsen’s. Although their results showed a con-sistency between the estimated and measured values, it maybe questionable to apply Nielsen’s formula to estimate thefrictional dissipation over a rougher lagoon system. Figure 11shows a scatterplot between the averaged measured waveenergy dissipation rate in the lagoon and the frictional dis-sipation rates estimated by equation (14). The frictionaldissipation accounts for the energy dissipation induced byflow passing over the rough bottom surface, and thus willtest whether the bottom-shear-generated turbulent dissipationis a dominant mechanism for wave dissipation in thelagoon. The frictional dissipation in the lagoon determinedby Madsen’s [1994] spectral wave model was estimatedusing kw = 4sb and Nielsen’s formula as suggested by Loweet al. [2005b] using kw = 4Hbed, and Madsen’s formulaas originally given by Madsen [1994] and Mathisen andMadsen [1999]. The frictional dissipation rate estimatedusing kw = 4Hbed and Madsen’s formula is typically foundto approximate the total energy dissipation in the lagoon.The results do not agree with Lowe et al. [2005b] but showthat Madsen’s frictional factor formula and kw = 4Hbed canbe applied to a rougher lagoon system. Because Madsen’smodel was developed based on modeling the turbulentboundary layer flow with an eddy viscosity assumptionover the rough bed, the agreement between the measure-ments also indicates that the dissipation in the lagoon isdominated by the rough turbulent flow generated by thebottom friction.
4.4. Dissipation due to Drag Within the Coral Canopy
[26] When the bottom roughness elements, the coralheads, are comparable in height to the depth of the water, itis appropriate to consider the dissipation caused by the formdrag of these “canopy” elements. The roughness elementsare simulated as cylindrical columns, and the resistance
Figure 11. Scatterplot of average measured wave energydissipation rate Dlagoon versus average frictional dissipationrate Df, lagoon estimated using Madsen’s model and Nielsen’sformula. The frictional dissipation rates are respectively cal-culated using kw = 4sb with Nielsen’s formula as suggestedby Lowe et al. [2005b] (light gray), but using kw = 4HbedwithMadsen’s formula (dark gray). The solid line is a 1:1 ratio.Note that the scatter of the data for small values of dissipationrate is due to the measurement uncertainty at low tide.
HUANG ET AL.: WAVE DISSIPATION IN A REEF LAGOON C03015C03015
11 of 18
force fd for flow-passing cylindrical columns [Lowe et al.,2005a] is written as
fd ¼ Cdlf
2hc 1� lp
� � ~U 2; ð15Þ
where Cd is an empirical drag coefficient O(1) due to thespatially averaged in-canopy flow Ũ [Coceal and Belcher,2004], where hc is the canopy element height, and lf andlp are parameters defined as [Britter and Hanna, 2003]
lf ¼ Af =AT ;lp ¼ Ap=AT :
ð16Þ
Here Af is the frontal area of canopy elements, Ap is the planarea of canopy elements and AT is the underlying surfacearea of canopies, i.e., AT is the total area that the elementsoccupy divided by the number of canopy elements. ConsiderN irregular individual canopy elements aligned in onedirection in the lagoon, representative parameters of Af, Ap
and AT are written as
Af ¼ 1
N
XNn¼1
Af ;n; ð17Þ
Ap ¼ 1
N
XNn¼1
Ap;n; ð18Þ
AT ¼ ðdc;r þ Sc;rÞxcN
; ð19Þ
with
dc;r ¼ 1
N
XNn¼1
dc;n; ð20Þ
Sc;r ¼ 1
N
XNn¼1
Sc;n; ð21Þ
where Af,n = hc,ndc,n, Ap,n = (pdc,n2 /4), dc,n is the diameter
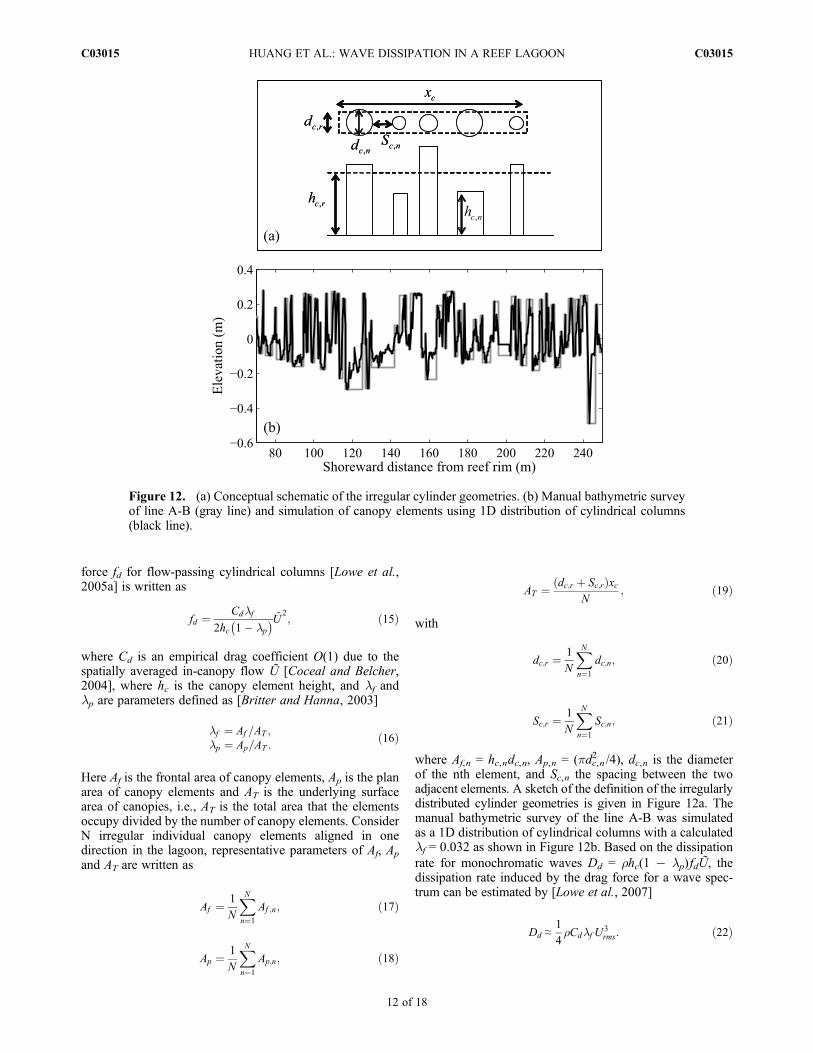
of the nth element, and Sc,n the spacing between the twoadjacent elements. A sketch of the definition of the irregularlydistributed cylinder geometries is given in Figure 12a. Themanual bathymetric survey of the line A-B was simulatedas a 1D distribution of cylindrical columns with a calculatedlf = 0.032 as shown in Figure 12b. Based on the dissipationrate for monochromatic waves Dd = rhc(1 � lp) fdŨ, thedissipation rate induced by the drag force for a wave spec-trum can be estimated by [Lowe et al., 2007]
Dd ≈1
4rCdlf U
3rms: ð22Þ
Figure 12. (a) Conceptual schematic of the irregular cylinder geometries. (b) Manual bathymetric surveyof line A-B (gray line) and simulation of canopy elements using 1D distribution of cylindrical columns(black line).
HUANG ET AL.: WAVE DISSIPATION IN A REEF LAGOON C03015C03015
12 of 18
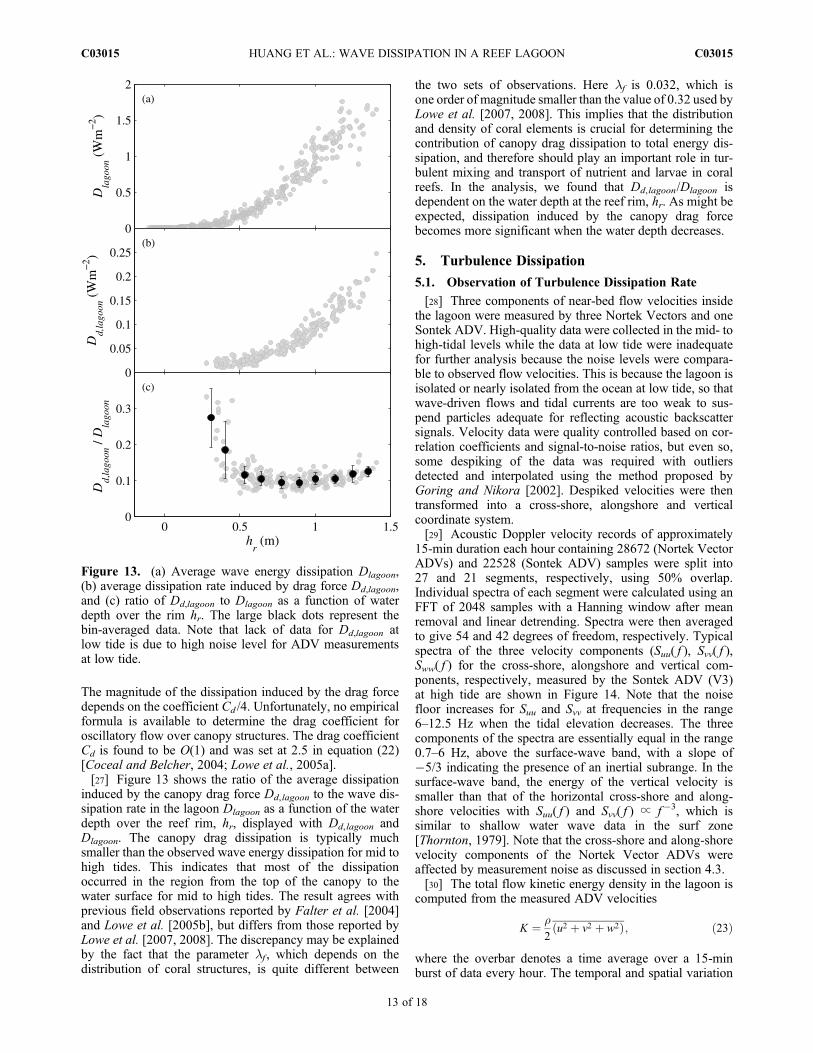
The magnitude of the dissipation induced by the drag forcedepends on the coefficient Cd /4. Unfortunately, no empiricalformula is available to determine the drag coefficient foroscillatory flow over canopy structures. The drag coefficientCd is found to be O(1) and was set at 2.5 in equation (22)[Coceal and Belcher, 2004; Lowe et al., 2005a].[27] Figure 13 shows the ratio of the average dissipation
induced by the canopy drag force Dd,lagoon to the wave dis-sipation rate in the lagoon Dlagoon as a function of the waterdepth over the reef rim, hr, displayed with Dd,lagoon andDlagoon. The canopy drag dissipation is typically muchsmaller than the observed wave energy dissipation for mid tohigh tides. This indicates that most of the dissipationoccurred in the region from the top of the canopy to thewater surface for mid to high tides. The result agrees withprevious field observations reported by Falter et al. [2004]and Lowe et al. [2005b], but differs from those reported byLowe et al. [2007, 2008]. The discrepancy may be explainedby the fact that the parameter lf , which depends on thedistribution of coral structures, is quite different between
the two sets of observations. Here lf is 0.032, which isone order of magnitude smaller than the value of 0.32 used byLowe et al. [2007, 2008]. This implies that the distributionand density of coral elements is crucial for determining thecontribution of canopy drag dissipation to total energy dis-sipation, and therefore should play an important role in tur-bulent mixing and transport of nutrient and larvae in coralreefs. In the analysis, we found that Dd,lagoon/Dlagoon isdependent on the water depth at the reef rim, hr. As might beexpected, dissipation induced by the canopy drag forcebecomes more significant when the water depth decreases.
5. Turbulence Dissipation
5.1. Observation of Turbulence Dissipation Rate
[28] Three components of near-bed flow velocities insidethe lagoon were measured by three Nortek Vectors and oneSontek ADV. High-quality data were collected in the mid- tohigh-tidal levels while the data at low tide were inadequatefor further analysis because the noise levels were compara-ble to observed flow velocities. This is because the lagoon isisolated or nearly isolated from the ocean at low tide, so thatwave-driven flows and tidal currents are too weak to sus-pend particles adequate for reflecting acoustic backscattersignals. Velocity data were quality controlled based on cor-relation coefficients and signal-to-noise ratios, but even so,some despiking of the data was required with outliersdetected and interpolated using the method proposed byGoring and Nikora [2002]. Despiked velocities were thentransformed into a cross-shore, alongshore and verticalcoordinate system.[29] Acoustic Doppler velocity records of approximately
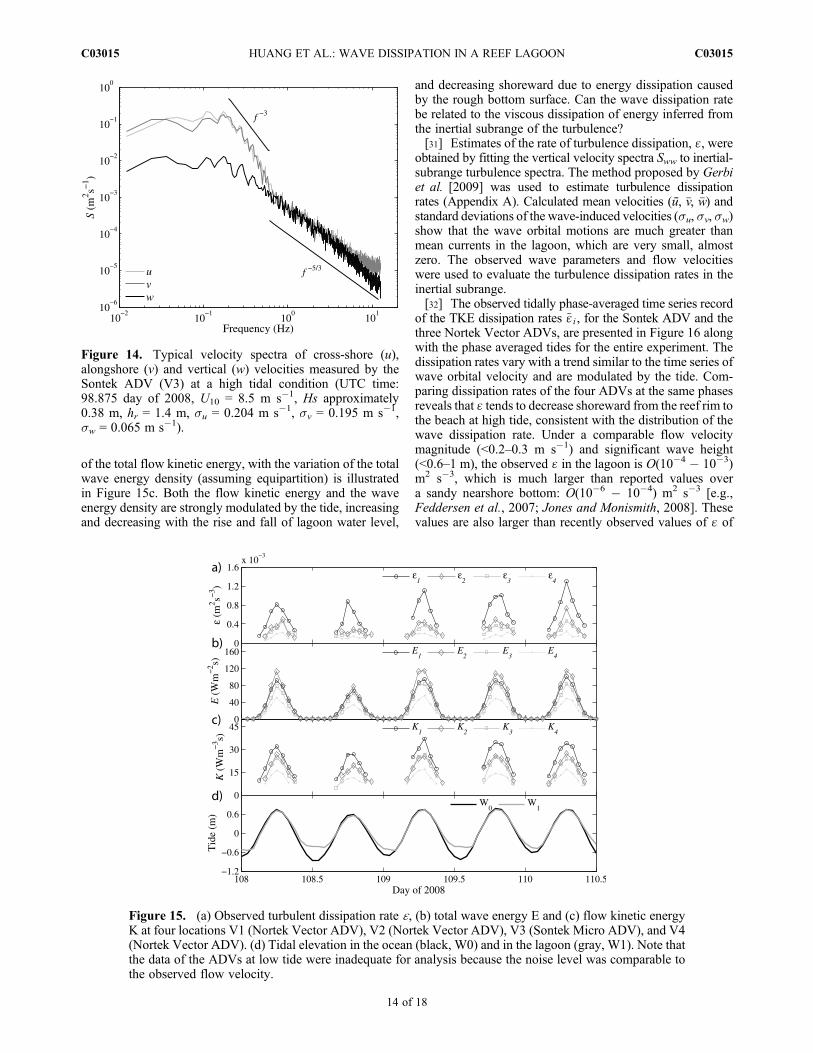
15-min duration each hour containing 28672 (Nortek VectorADVs) and 22528 (Sontek ADV) samples were split into27 and 21 segments, respectively, using 50% overlap.Individual spectra of each segment were calculated using anFFT of 2048 samples with a Hanning window after meanremoval and linear detrending. Spectra were then averagedto give 54 and 42 degrees of freedom, respectively. Typicalspectra of the three velocity components (Suu( f ), Svv( f ),Sww( f ) for the cross-shore, alongshore and vertical com-ponents, respectively, measured by the Sontek ADV (V3)at high tide are shown in Figure 14. Note that the noisefloor increases for Suu and Svv at frequencies in the range6–12.5 Hz when the tidal elevation decreases. The threecomponents of the spectra are essentially equal in the range0.7–6 Hz, above the surface-wave band, with a slope of�5/3 indicating the presence of an inertial subrange. In thesurface-wave band, the energy of the vertical velocity issmaller than that of the horizontal cross-shore and along-shore velocities with Suu( f ) and Svv( f ) ∝ f�3, which issimilar to shallow water wave data in the surf zone[Thornton, 1979]. Note that the cross-shore and along-shorevelocity components of the Nortek Vector ADVs wereaffected by measurement noise as discussed in section 4.3.[30] The total flow kinetic energy density in the lagoon is
computed from the measured ADV velocities
K ¼ r2
u2 þ v2 þ w2ð Þ; ð23Þ
where the overbar denotes a time average over a 15-minburst of data every hour. The temporal and spatial variation
Figure 13. (a) Average wave energy dissipation Dlagoon,(b) average dissipation rate induced by drag force Dd,lagoon,and (c) ratio of Dd,lagoon to Dlagoon as a function of waterdepth over the rim hr. The large black dots represent thebin-averaged data. Note that lack of data for Dd,lagoon atlow tide is due to high noise level for ADV measurementsat low tide.
HUANG ET AL.: WAVE DISSIPATION IN A REEF LAGOON C03015C03015
13 of 18
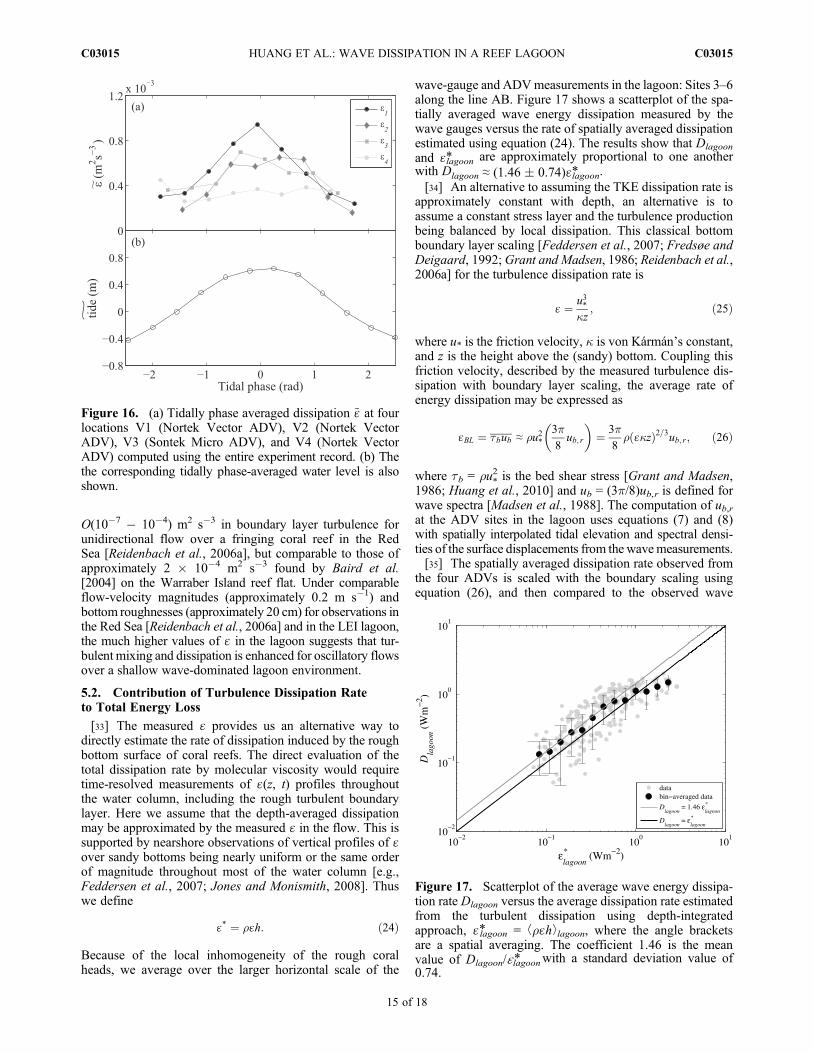
of the total flow kinetic energy, with the variation of the totalwave energy density (assuming equipartition) is illustratedin Figure 15c. Both the flow kinetic energy and the waveenergy density are strongly modulated by the tide, increasingand decreasing with the rise and fall of lagoon water level,
and decreasing shoreward due to energy dissipation causedby the rough bottom surface. Can the wave dissipation ratebe related to the viscous dissipation of energy inferred fromthe inertial subrange of the turbulence?[31] Estimates of the rate of turbulence dissipation, ɛ, were
obtained by fitting the vertical velocity spectra Sww to inertial-subrange turbulence spectra. The method proposed by Gerbiet al. [2009] was used to estimate turbulence dissipationrates (Appendix A). Calculated mean velocities (ū, �v, �w) andstandard deviations of the wave-induced velocities (su, sv, sw)show that the wave orbital motions are much greater thanmean currents in the lagoon, which are very small, almostzero. The observed wave parameters and flow velocitieswere used to evaluate the turbulence dissipation rates in theinertial subrange.[32] The observed tidally phase-averaged time series record
of the TKE dissipation rates ~ɛi , for the Sontek ADV and thethree Nortek Vector ADVs, are presented in Figure 16 alongwith the phase averaged tides for the entire experiment. Thedissipation rates vary with a trend similar to the time series ofwave orbital velocity and are modulated by the tide. Com-paring dissipation rates of the four ADVs at the same phasesreveals that ɛ tends to decrease shoreward from the reef rim tothe beach at high tide, consistent with the distribution of thewave dissipation rate. Under a comparable flow velocitymagnitude (<0.2–0.3 m s�1) and significant wave height(<0.6–1 m), the observed ɛ in the lagoon is O(10�4 � 10�3)m2 s�3, which is much larger than reported values overa sandy nearshore bottom: O(10�6 � 10�4) m2 s�3 [e.g.,Feddersen et al., 2007; Jones and Monismith, 2008]. Thesevalues are also larger than recently observed values of ɛ of
Figure 14. Typical velocity spectra of cross-shore (u),alongshore (v) and vertical (w) velocities measured by theSontek ADV (V3) at a high tidal condition (UTC time:98.875 day of 2008, U10 = 8.5 m s�1, Hs approximately0.38 m, hr = 1.4 m, su = 0.204 m s�1, sv = 0.195 m s�1,sw = 0.065 m s�1).
Figure 15. (a) Observed turbulent dissipation rate ɛ, (b) total wave energy E and (c) flow kinetic energyK at four locations V1 (Nortek Vector ADV), V2 (Nortek Vector ADV), V3 (Sontek Micro ADV), and V4(Nortek Vector ADV). (d) Tidal elevation in the ocean (black, W0) and in the lagoon (gray, W1). Note thatthe data of the ADVs at low tide were inadequate for analysis because the noise level was comparable tothe observed flow velocity.
HUANG ET AL.: WAVE DISSIPATION IN A REEF LAGOON C03015C03015
14 of 18
O(10�7 � 10�4) m2 s�3 in boundary layer turbulence forunidirectional flow over a fringing coral reef in the RedSea [Reidenbach et al., 2006a], but comparable to those ofapproximately 2 � 10�4 m2 s�3 found by Baird et al.[2004] on the Warraber Island reef flat. Under comparableflow-velocity magnitudes (approximately 0.2 m s�1) andbottom roughnesses (approximately 20 cm) for observations inthe Red Sea [Reidenbach et al., 2006a] and in the LEI lagoon,the much higher values of ɛ in the lagoon suggests that tur-bulent mixing and dissipation is enhanced for oscillatory flowsover a shallow wave-dominated lagoon environment.
5.2. Contribution of Turbulence Dissipation Rateto Total Energy Loss
[33] The measured ɛ provides us an alternative way todirectly estimate the rate of dissipation induced by the roughbottom surface of coral reefs. The direct evaluation of thetotal dissipation rate by molecular viscosity would requiretime-resolved measurements of ɛ(z, t) profiles throughoutthe water column, including the rough turbulent boundarylayer. Here we assume that the depth-averaged dissipationmay be approximated by the measured ɛ in the flow. This issupported by nearshore observations of vertical profiles of ɛover sandy bottoms being nearly uniform or the same orderof magnitude throughout most of the water column [e.g.,Feddersen et al., 2007; Jones and Monismith, 2008]. Thuswe define
ɛ∗ ¼ rɛh: ð24Þ
Because of the local inhomogeneity of the rough coralheads, we average over the larger horizontal scale of the
wave-gauge and ADVmeasurements in the lagoon: Sites 3–6along the line AB. Figure 17 shows a scatterplot of the spa-tially averaged wave energy dissipation measured by thewave gauges versus the rate of spatially averaged dissipationestimated using equation (24). The results show that Dlagoon
and ɛlagoon* are approximately proportional to one anotherwith Dlagoon ≈ (1.46 � 0.74)ɛlagoon* .[34] An alternative to assuming the TKE dissipation rate is
approximately constant with depth, an alternative is toassume a constant stress layer and the turbulence productionbeing balanced by local dissipation. This classical bottomboundary layer scaling [Feddersen et al., 2007; Fredsøe andDeigaard, 1992; Grant and Madsen, 1986; Reidenbach et al.,2006a] for the turbulence dissipation rate is
ɛ ¼ u3∗kz
; ð25Þ
where u* is the friction velocity, k is von Kármán’s constant,and z is the height above the (sandy) bottom. Coupling thisfriction velocity, described by the measured turbulence dis-sipation with boundary layer scaling, the average rate ofenergy dissipation may be expressed as
ɛBL ¼ tbub ≈ ru2∗3p8ub; r
� ¼ 3p
8r ɛkzð Þ2=3ub; r; ð26Þ
where tb = ru*2 is the bed shear stress [Grant and Madsen,
1986; Huang et al., 2010] and ub = (3p/8)ub,r is defined forwave spectra [Madsen et al., 1988]. The computation of ub,rat the ADV sites in the lagoon uses equations (7) and (8)with spatially interpolated tidal elevation and spectral densi-ties of the surface displacements from the wavemeasurements.[35] The spatially averaged dissipation rate observed from
the four ADVs is scaled with the boundary scaling usingequation (26), and then compared to the observed wave
Figure 16. (a) Tidally phase averaged dissipation ~ɛ at fourlocations V1 (Nortek Vector ADV), V2 (Nortek VectorADV), V3 (Sontek Micro ADV), and V4 (Nortek VectorADV) computed using the entire experiment record. (b) Thethe corresponding tidally phase-averaged water level is alsoshown.
Figure 17. Scatterplot of the average wave energy dissipa-tion rate Dlagoon versus the average dissipation rate estimatedfrom the turbulent dissipation using depth-integratedapproach, ɛ∗lagoon = ⟨rɛh⟩lagoon, where the angle bracketsare a spatial averaging. The coefficient 1.46 is the meanvalue of Dlagoon/ɛlagoon* with a standard deviation value of0.74.
HUANG ET AL.: WAVE DISSIPATION IN A REEF LAGOON C03015C03015
15 of 18

energy dissipation rate Dlagoon in Figure 18. The resultsindicate that in this case the boundary layer scaling isapplicable to the oscillatory wave-driven lagoon system withDlagoon = (2.37 � 1.2)ɛBL,lagoon. The boundary layer scalingagrees with the eddy viscosity assumption that was used todevelop a model [e.g.,Madsen, 1994;Mathisen and Madsen,1999] to account for frictional dissipation discussed inSection 4.3. It is found that the dissipation rates estimatedfrom the two independent methods are approximately pro-portional to one another with ɛlagoon* ≈ 1.62ɛBL,lagoon.
6. Summary and Conclusions
[36] We have presented field measurements of wave andTKE dissipation rates over a shallow coral reef lagoon withlarge bottom roughness. In situ measurements of waves,currents and turbulence were achieved using wave gaugeand ADV techniques, while the topography and bathymetryof the reef and lagoon was measured both manually and withairborne lidar. With these independent techniques, wequantified the dissipation of surface wave energy and thedissipation of TKE resulting from the wave orbital motionover the coral reef and lagoon.[37] Results show that the wind-generated waves in the
open ocean break on the fore reef and reef flat, with theresulting wave height in the lagoon being a function ofthe depth of the water over the reef rim, hr, and a parameter gthat accounts for wave attenuation across the lagoon anddecays with the distance from the reef rim.[38] The measured wave dissipation rate is 10–60 Wm�2
across the fore reef and reef flat, and 0–3 Wm�2 in thelagoon. The wave energy dissipation rate in the lagooncorrelates strongly with the cube of the RMS of the near-bottom velocity, ub,r. This suggests that wave dissipation inthe lagoon is strongly correlated with the frictional stressinduced by the rough bottom boundary. The friction coeffi-cient Cf of the cubic dependence between Dlagoon and ub, r
is slightly larger than previous estimates made at other coralreefs sites. We showed that the frictional dissipation rate inthe LEI windward lagoon can be well described with a singlebottom roughness length scale sb, and that the spectral wavefrictional model proposed byMadsen et al. [1988] appears toadequately estimate the frictional dissipation rate when theequivalent Nikuradse roughness kw is described as 4Hbed
(approximately 8sb).[39] The dissipation induced by the drag forces in the
lagoon was also estimated by simulating the bottom rough-ness as cylindrical column elements, as in canopy-flowmodels. We have shown that the in-canopy drag dissipationis much smaller than the observed wave energy dissipationduring mid to high tides. This in turn indicates that the dis-sipation in the region from the top of the canopy (i.e., thecoral heads) to the water surface contributes most of thewave energy dissipation during those times. In addition, wefound that the ratio of in-canopy drag dissipation to totalenergy dissipation rate increases when the water depth in thelagoon decreases. Dissipation induced by in-canopy dragforce is enhanced and becomes more significant for the totalwave energy dissipation, accounting for up to 30% when thewater depth decreases to a level comparable to the bottomroughness.[40] Estimates of the dissipation of turbulent kinetic
energy ɛ were obtained using the method proposed by Gerbiet al. [2009] by fitting the vertical velocity spectra to theinertial-subrange turbulence spectra. Under comparable flowvelocities, the observed ɛ in the lagoon is much larger thanthat reported in the literature for sandy beaches and, in par-ticular, is larger than that for unidirectional flows over afringing coral reef as recently measured by Reidenbach et al.[2006a]. This suggests that the turbulent mixing is enhancedfor oscillatory flows over a shallow wave-dominated lagoonenvironment of large bottom roughness.[41] The direct evaluation of dissipation rates in shear
flows relies on the detailed measurements of profiles ofturbulence dissipation rates over the entire water columnincluding the bottom boundary layer. This was not donehere, nevertheless, we used both a bottom boundary layerscaling and a depth-independent approach to estimate theaverage rate of energy dissipation from the observed TKEdissipation at fixed distances of 0.12–0.32 m from the sandybottom of the lagoon. It is found that both methods giveaverage rates of turbulence dissipation that are proportionalto the average surface-wave energy dissipation rate, andcomparable to the wave-dissipation rate within factors of2.37 and 1.42, respectively. This and the low current mea-surements in the lagoon, suggest that the wave energy dis-sipated in the lagoon is transformed to turbulent kineticenergy and dissipated, with little contributing to currents.[42] Our estimates of the rate of energy dissipation due to
turbulence were restricted to the point velocity measurementsusing ADVs. For future studies, other velocity measure-ment techniques such as a DopBeam [Veron and Melville,1999] that can measure profiles of velocities and turbu-lence dissipation rates may provide a better understanding ofthe vertical and horizontal structures of turbulence propertiesover the coral reefs. This conclusion is compatible with thesame conclusion reached by Feddersen [2011], suggestingthe need for more measurements of turbulence profiles in thesurf zone of sandy beaches, a region which has been much
Figure 18. Scatterplot of the average wave energy dissi-pation rate Dlagoon versus the average dissipation rate esti-mated from the turbulent dissipation using law-of-the wallscaling ɛBL,lagoon. The coefficient 2.37 is the mean value ofDlagoon/ɛBL,lagoon with a standard deviation of 1.2.
HUANG ET AL.: WAVE DISSIPATION IN A REEF LAGOON C03015C03015
16 of 18
more frequently studied than coral reef lagoons. In addition,quantifying the bottom roughness in lagoons relies on theavailability of more detailed topographic and bathymetricsurveys of the coral. Here visible and acoustic imagingtechniques may be useful to determine the morphology of thecorals and higher resolution measurements of the bottomroughness. This will in turn promote the development ofthree dimensional numerical models that couple the wave-field, turbulence, and mixing in reef-lagoon systems.
Appendix A: Estimation of TurbulenceDissipation Rate
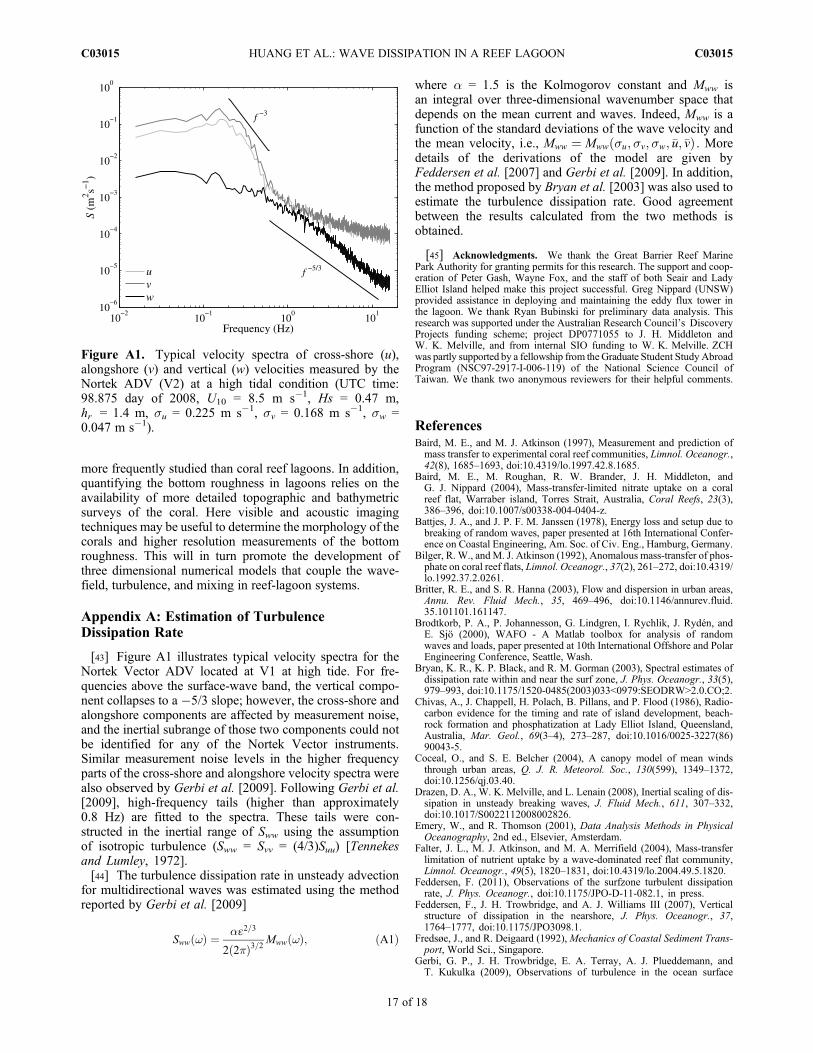
[43] Figure A1 illustrates typical velocity spectra for theNortek Vector ADV located at V1 at high tide. For fre-quencies above the surface-wave band, the vertical compo-nent collapses to a �5/3 slope; however, the cross-shore andalongshore components are affected by measurement noise,and the inertial subrange of those two components could notbe identified for any of the Nortek Vector instruments.Similar measurement noise levels in the higher frequencyparts of the cross-shore and alongshore velocity spectra werealso observed by Gerbi et al. [2009]. Following Gerbi et al.[2009], high-frequency tails (higher than approximately0.8 Hz) are fitted to the spectra. These tails were con-structed in the inertial range of Sww using the assumptionof isotropic turbulence (Sww = Svv = (4/3)Suu) [Tennekesand Lumley, 1972].[44] The turbulence dissipation rate in unsteady advection
for multidirectional waves was estimated using the methodreported by Gerbi et al. [2009]
SwwðwÞ ¼ aɛ2=3
2ð2pÞ3=2MwwðwÞ; ðA1Þ
where a = 1.5 is the Kolmogorov constant and Mww isan integral over three-dimensional wavenumber space thatdepends on the mean current and waves. Indeed, Mww is afunction of the standard deviations of the wave velocity andthe mean velocity, i.e., Mww ¼ Mwwðsu;sv;sw; �u;�vÞ . Moredetails of the derivations of the model are given byFeddersen et al. [2007] and Gerbi et al. [2009]. In addition,the method proposed by Bryan et al. [2003] was also used toestimate the turbulence dissipation rate. Good agreementbetween the results calculated from the two methods isobtained.
[45] Acknowledgments. We thank the Great Barrier Reef MarinePark Authority for granting permits for this research. The support and coop-eration of Peter Gash, Wayne Fox, and the staff of both Seair and LadyElliot Island helped make this project successful. Greg Nippard (UNSW)provided assistance in deploying and maintaining the eddy flux tower inthe lagoon. We thank Ryan Bubinski for preliminary data analysis. Thisresearch was supported under the Australian Research Council’s DiscoveryProjects funding scheme; project DP0771055 to J. H. Middleton andW. K. Melville, and from internal SIO funding to W. K. Melville. ZCHwas partly supported by a fellowship from theGraduate Student Study AbroadProgram (NSC97-2917-I-006-119) of the National Science Council ofTaiwan. We thank two anonymous reviewers for their helpful comments.
ReferencesBaird, M. E., and M. J. Atkinson (1997), Measurement and prediction ofmass transfer to experimental coral reef communities, Limnol. Oceanogr.,42(8), 1685–1693, doi:10.4319/lo.1997.42.8.1685.
Baird, M. E., M. Roughan, R. W. Brander, J. H. Middleton, andG. J. Nippard (2004), Mass-transfer-limited nitrate uptake on a coralreef flat, Warraber island, Torres Strait, Australia, Coral Reefs, 23(3),386–396, doi:10.1007/s00338-004-0404-z.
Battjes, J. A., and J. P. F. M. Janssen (1978), Energy loss and setup due tobreaking of random waves, paper presented at 16th International Confer-ence on Coastal Engineering, Am. Soc. of Civ. Eng., Hamburg, Germany.
Bilger, R. W., and M. J. Atkinson (1992), Anomalous mass-transfer of phos-phate on coral reef flats, Limnol. Oceanogr., 37(2), 261–272, doi:10.4319/lo.1992.37.2.0261.
Britter, R. E., and S. R. Hanna (2003), Flow and dispersion in urban areas,Annu. Rev. Fluid Mech., 35, 469–496, doi:10.1146/annurev.fluid.35.101101.161147.
Brodtkorb, P. A., P. Johannesson, G. Lindgren, I. Rychlik, J. Rydén, andE. Sjö (2000), WAFO - A Matlab toolbox for analysis of randomwaves and loads, paper presented at 10th International Offshore and PolarEngineering Conference, Seattle, Wash.
Bryan, K. R., K. P. Black, and R. M. Gorman (2003), Spectral estimates ofdissipation rate within and near the surf zone, J. Phys. Oceanogr., 33(5),979–993, doi:10.1175/1520-0485(2003)033<0979:SEODRW>2.0.CO;2.
Chivas, A., J. Chappell, H. Polach, B. Pillans, and P. Flood (1986), Radio-carbon evidence for the timing and rate of island development, beach-rock formation and phosphatization at Lady Elliot Island, Queensland,Australia, Mar. Geol., 69(3–4), 273–287, doi:10.1016/0025-3227(86)90043-5.
Coceal, O., and S. E. Belcher (2004), A canopy model of mean windsthrough urban areas, Q. J. R. Meteorol. Soc., 130(599), 1349–1372,doi:10.1256/qj.03.40.
Drazen, D. A., W. K. Melville, and L. Lenain (2008), Inertial scaling of dis-sipation in unsteady breaking waves, J. Fluid Mech., 611, 307–332,doi:10.1017/S0022112008002826.
Emery, W., and R. Thomson (2001), Data Analysis Methods in PhysicalOceanography, 2nd ed., Elsevier, Amsterdam.
Falter, J. L., M. J. Atkinson, and M. A. Merrifield (2004), Mass-transferlimitation of nutrient uptake by a wave-dominated reef flat community,Limnol. Oceanogr., 49(5), 1820–1831, doi:10.4319/lo.2004.49.5.1820.
Feddersen, F. (2011), Observations of the surfzone turbulent dissipationrate, J. Phys. Oceanogr., doi:10.1175/JPO-D-11-082.1, in press.
Feddersen, F., J. H. Trowbridge, and A. J. Williams III (2007), Verticalstructure of dissipation in the nearshore, J. Phys. Oceanogr., 37,1764–1777, doi:10.1175/JPO3098.1.
Fredsøe, J., and R. Deigaard (1992),Mechanics of Coastal Sediment Trans-port, World Sci., Singapore.
Gerbi, G. P., J. H. Trowbridge, E. A. Terray, A. J. Plueddemann, andT. Kukulka (2009), Observations of turbulence in the ocean surface
Figure A1. Typical velocity spectra of cross-shore (u),alongshore (v) and vertical (w) velocities measured by theNortek ADV (V2) at a high tidal condition (UTC time:98.875 day of 2008, U10 = 8.5 m s�1, Hs = 0.47 m,hr = 1.4 m, su = 0.225 m s�1, sv = 0.168 m s�1, sw =0.047 m s�1).
HUANG ET AL.: WAVE DISSIPATION IN A REEF LAGOON C03015C03015
17 of 18
boundary layer: Energetics and transport, J. Phys. Oceanogr., 39(5),1077–1096, doi:10.1175/2008JPO4044.1.
Goring, D. G., and V. I. Nikora (2002), Despiking acoustic Doppler velo-cimeter data, J. Hydraul. Eng., 128(1), 117–126, doi:10.1061/(ASCE)0733-9429(2002)128:1(117).
Gourlay, M. R. (1994), Wave transformation on a coral-reef, Coastal Eng.,23(1–2), 17–42, doi:10.1016/0378-3839(94)90013-2.
Gourlay, M. R. (1996a), Wave set-up on coral reefs. Part 2. Set-up on reefswith various profiles, Coastal Eng., 28(1–4), 17–55, doi:10.1016/0378-3839(96)00009-9.
Gourlay, M. R. (1996b), Wave set-up on coral reefs. Part 1. Set-up andwave-generated flow on an idealized two dimensional horizontal reef,Coastal Eng., 27(3–4), 161–193, doi:10.1016/0378-3839(96)00008-7.
Gourlay, M. R., and G. Colleter (2005), Wave-generated flow on coralreefs—An analysis for two-dimensional horizontal reef-tops with steepfaces, Coastal Eng., 52(4), 353–387, doi:10.1016/j.coastaleng.2004.11.007.
Grant, W. D., and O. S. Madsen (1986), The continental-shelf bottomboundary layer, Annu. Rev. Fluid Mech., 18, 265–305, doi:10.1146/annurev.fl.18.010186.001405.
Hardy, T. A., and I. R. Young (1996), Field study of wave attenuationon an offshore coral reef, J. Geophys. Res., 101(C6), 14,311–14,326,doi:10.1029/96JC00202.
Hearn, C. J. (1999), Wave-breaking hydrodynamics within coral reefsystems and the effect of changing relative sea level, J. Geophys. Res.,104(C12), 30,007–30,019, doi:10.1029/1999JC900262.
Hearn, C. J., M. J. Atkinson, and J. L. Falter (2001), A physical derivationof nutrient-uptake rates in coral reefs: Effects of roughness and waves,Coral Reefs, 20, 347–356, doi:10.1007/s00338-001-0185-6.
Huang, Z. C., H. H. Hwung, S. C. Hsiao, and K. A. Chang (2010), Labora-tory observation of boundary layer flow under spilling breakers in a surfzone using particle image velocimetry, Coastal Eng., 57, 343–357,doi:10.1016/j.coastaleng.2009.11.004.
Jago, O. K., P. S. Kench, and R. W. Brander (2007), Field observations ofwave-driven water-level gradients across a coral reef flat, J. Geophys.Res., 112, C06027, doi:10.1029/2006JC003740.
Jones, N. L., and S. G. Monismith (2008), The influence of whitecappingwaves on the vertical structure of turbulence in a shallow estuarineembayment, J. Phys. Oceanogr., 38(7), 1563–1580, doi:10.1175/2007JPO3766.1.
Kench, P. S., and R. W. Brander (2006), Wave processes on coral reef flats:Implications for reef geomorphology using Australian case studies,J. Coastal Res., 221, 209–223, doi:10.2112/05A-0016.1.
Longuet-Higgins, M. S., and R. W. Stewart (1964), Radition stress in waterwaves: A physical discussion, with applications, Deep Sea Res., 11,529–562.
Lowe, R. J., J. R. Koseff, and S. G. Monismith (2005a), Oscillatory flowthrough submerged canopies: 1. Velocity structure, J. Geophys. Res.,110, C10016, doi:10.1029/2004JC002788.
Lowe, R. J., J. L. Falter, M. D. Bandet, G. Pawlak, M. J. Atkinson, S. G.Monismith, and J. R. Koseff (2005b), Spectral wave dissipation over abarrier reef, J. Geophys. Res., 110, C04001, doi:10.1029/2004JC002711.
Lowe, R. J., J. L. Falter, J. R. Koseff, S. G. Monismith, and M. J. Atkinson(2007), Spectral wave flow attenuation within submerged canopies:Implications for wave energy dissipation, J. Geophys. Res., 112,C05018, doi:10.1029/2006JC003605.
Lowe, R. J., U. Shavit, J. L. Falter, J. R. Koseff, and S. G. Monismith(2008), Modeling flow in coral communities with and without waves:A synthesis of porous media and canopy flow approaches, Limnol. Ocea-nogr., 53(6), 2668–2680, doi:10.4319/lo.2008.53.6.2668.
Lowe, R. J., J. L. Falter, S. G. Monismith, and M. J. Atkinson (2009a),Wave-driven circulation of a coastal reef-lagoon system, J. Phys.Oceanogr., 39(4), 873–893, doi:10.1175/2008JPO3958.1.
Lowe, R. J., J. L. Falter, S. G. Monismith, and M. J. Atkinson (2009b),A numerical study of circulation in a coastal reef-lagoon system,J. Geophys. Res., 114, C06022, doi:10.1029/2008JC005081.
Lugo-Fernández, A., H. H. Roberts, and W. J. Wiseman (1998a), Tideeffects on wave attenuation and wave set-up on a Caribbean coral reef,Estuarine Coastal Shelf Sci., 47(4), 385–393, doi:10.1006/ecss.1998.0365.
Lugo-Fernández, A., H. H. Roberts, and J. N. Suhayda (1998b), Wavetransformations across a Caribbean fringing-barrier Coral Reef, Cont.Shelf Res., 18(10), 1099–1124, doi:10.1016/S0278-4343(97)00020-4.
Madsen, O. S. (1994), Spectral wave-current bottom boundary layer flows,paper presented at 24th International Conference on Coastal Engineering,Am. Soc. of Civ. Eng., Kobe, Japan.
Madsen, O. S., Y. K. Poon, and H. Graber (1988), Spectral wave attenua-tion by bottom friction: Theory, paper presented at 21st International
Conference on Coastal Engineering, Am. Soc. of Civ. Eng., Torremolinos,Spain.
Massel, S. R., and M. R. Gourlay (2000), On the modeling of wave break-ing and set-up on coral reefs, Coastal Eng., 39(1), 1–27, doi:10.1016/S0378-3839(99)00052-6.
Mathisen, P. P., and O. S. Madsen (1996), Waves and currents over a fixedrippled bed: 1. Bottom roughness experienced by waves in the presenceand absence of currents, J. Geophys. Res., 101(C7), 16,533–16,542,doi:10.1029/96JC00954.
Mathisen, P. P., and O. S. Madsen (1999), Waves and currents over a fixedrippled bed: 3. Bottom and apparent roughness for spectral waves andcurrents, J. Geophys. Res., 104(C8), 18,447–18,461, doi:10.1029/1999JC900114.
McCabe, R. M., P. Estrade, J. H. Middleton, W. K. Melville, M. Roughan,and L. Lenain (2010), Temperature variability in a shallow, tidally iso-lated coral reef lagoon, J. Geophys. Res., 115, C12011, doi:10.1029/2009JC006023.
Monismith, S. G. (2007), Hydrodynamics of coral reefs, Annu. Rev. FluidMech., 39, 37–55, doi:10.1146/annurev.fluid.38.050304.092125.
Nelson, R. C. (1996), Hydraulic roughness of coral reef platforms, Appl.Ocean Res., 18(5), 265–274, doi:10.1016/S0141-1187(97)00006-0.
Nielsen, P. (1992),Coastal Bottom Boundary Layers and Sediment Transport,World Sci., Singapore.
Péquignet, A.-C., J. M. Becker, M. A. Merrifield, and S. J. Boc (2011), Thedissipation of wind wave energy across a fringing reef at Ipan, Guam,Coral Reefs, 30, 71–82, doi:10.1007/s00338-011-0719-5.
Reidenbach, M. A., S. G. Monismith, J. R. Koseff, G. Yahel, and A. Genin(2006a), Boundary layer turbulence and flow structure over a fringingcoral reef, Limnol. Oceanogr., 51(5), 1956–1968, doi:10.4319/lo.2006.51.5.1956.
Reidenbach, M. A., J. R. Koseff, S. G. Monismith, J. V. Steinbuck, andA. Genin (2006b), The effects of waves and morphology on masstransfer within branched reef corals, Limnol. Oceanogr., 51(2),1134–1141, doi:10.4319/lo.2006.51.2.1134.
Reidenbach, M. A., J. R. Koseff, and M. A. R. Koehl (2009), Hydrody-namic forces on larvae affect their settlement on coral reefs in turbulent,wave-driven flow, Limnol. Oceanogr., 54(1), 318–330, doi:10.4319/lo.2009.54.1.0318.
Reineman, B. D., L. Lenain, D. Castel, and W. K. Melville (2009), A por-table airborne scanning lidar system for ocean and coastal applications,J. Atmos. Oceanic Technol., 26(12), 2626–2641, doi:10.1175/2009JTECHO703.1.
Swart, D. H. (1974), Offshore Sediment Transport and Equilibrium BeachProfiles, Delft Hydraul. Lab., Delft, Netherlands.
Symonds, G., K. P. Black, and I. R. Young (1995), Wave-driven flow overshallow reefs, J. Geophys. Res., 100(C2), 2639–2648, doi:10.1029/94JC02736.
Tennekes, L., and J. L. Lumley (1972), A First Course in Turbulence, MITPress, Cambridge, Mass.
Thornton, E. B. (1979), Energetics of breaking waves within the surf zone,J. Geophys. Res., 84(C8), 4931–4938, doi:10.1029/JC084iC08p04931.
Thornton, E. B., and R. T. Guza (1983), Transformation of wave height dis-tribution, J. Geophys. Res., 88, 5925–5938, doi:10.1029/JC088iC10p05925.
Veron, F., and W. K. Melville (1999), Pulse-to-pulse coherent Dopplermeasurements of waves and turbulence, J. Atmos. Oceanic Technol.,16(11), 1580–1597, doi:10.1175/1520-0426(1999)016<1580:PTPCDM>2.0.CO;2.
Young, I. R. (1989), Wave transformation over coral reefs, J. Geophys.Res., 94(C7), 9779–9789, doi:10.1029/JC094iC07p09779.
Young, I. R. (1994), On the measurement of directional wave spectra, Appl.Ocean Res., 16(5), 283–294, doi:10.1016/0141-1187(94)90017-5.
Young, I. R. (1999), Wind Generated Ocean Waves, 288 pp., Elsevier Sci.,Amsterdam.
Z.-C. Huang, Graduate Institute of Hydrological and Oceanic Sciences,National Central University, Taoyuan 32001, Taiwan.L. Lenain, W. K. Melville, B. Reineman, and N. Statom, Scripps
Institution of Oceanography, University of California, San Diego, La Jolla,CA 92093-0213, USA. ([email protected])R. M. McCabe, School of Oceanography, University of Washington,
Seattle, WA 98195, USA.J. H. Middleton, School of Aviation, University of New South Wales,
Sydney, NSW 2052, Australia.
HUANG ET AL.: WAVE DISSIPATION IN A REEF LAGOON C03015C03015
18 of 18