
Dissertation Report Master in Electrical Engineering · Dissertation Report Master in Electrical...
96
Dissertation Report Master in Electrical Engineering High Efficient Cogeneration Potential GABRIEL NAPOLEON PESANTEZ PALACIOS Leiria, September 2017
Transcript of Dissertation Report Master in Electrical Engineering · Dissertation Report Master in Electrical...
Dissertation Report
Master in Electrical Engineering
High Efficient Cogeneration Potential
GABRIEL NAPOLEON PESANTEZ PALACIOS
Leiria, September 2017

This page was intentionally left blank
Dissertation Report
Master in Electrical Engineering
High Efficient Cogeneration Potential
GABRIEL NAPOLEON PESANTEZ PALACIOS
Dissertation/Report developed under the supervision of Doctor Luís Neves,
professor at the School of Technology and Management of the Polytechnic Institute of
Leiria and co-supervision of Engineer Rodrigo Sempértegui, professor at the Faculty of
Engineering of the University of Cuenca.
Leiria, September 2017

ii
This page was intentionally left blank

iii
Dedication
I dedicate my dissertation work to my family. A special feeling of gratitude to my loving
parents, Jaime and Fanny whose words of encouragement and push for tenacity ring in
my ears

iv
This page was intentionally left blank

v
Acknowledgements
I would like to thank to SENECYT, University of Cuenca and Polytechnic Institute of
Leiria, for the support which allowed the development of the work here described.
I wish to thank my tutors who were more than generous with their expertise and precious
time. A special thanks to Dr. Luis Neves, dissertation supervisor, for his countless hours
of reflecting, reading, encouraging, and most of all patience throughout the entire
process.

vi
This page was intentionally left blank

vii
Resumo
Devido aos problemas atuais que surgem nas áreas ambiental, energética e económica,
é necessário um aumento na eficiência no uso de combustível fóssil para reduzir a
dependência dos hidrocarbonetos e melhorar a qualidade de vida. A cogeração é uma
opçao que visa alcançar esse objetivo, através do uso dos gases de escape e energia
térmica dos sistemas de refrigeração de equipamentos térmicos, para fornecimento de
energia térmica a outros processos, produzindo assim várias formas de energia final de
forma combinada, habitualmente energia mecânica ou elétrica, e térmica.
O principal objetivo deste trabalho é avaliar o potencial de cogeração no setor industrial
do Equador. Neste quadro, é apresentada uma breve introdução sobre o
desenvolvimento da cogeração nas últimas décadas, e também uma classificação da
cogeração de acordo com a sequência usada na produção de eletricidade e calor, e de
acordo com o tipo de motor primário. O conceito de trigeração é analisado brevemente.
É também apresentado um resumo dos estudos realizados como base para o trabalho,
bem como a situação atual do mercado de eletricidade no Equador, sendo igualmente
analisados os dados de consumo de energia publicados pelo INEC em 2011.
Com base nos fatores apresentados na bibliografia consultada, foi calculado o potencial
de cogeração, nas atuais condições do mercado de eletricidade no Equador, usando-se
as necessidades elétricas das indústrias como base para o cálculo. A análise económica
foi realizada usando quatro tipos de equipamento e considerando os efeitos da altitude
acima do nível do mar como um fator particularmente importante. Finalmente, foram
analisadas duas indústrias específicas, um caso na indústria do papel e outro da
indústria alimentar, como estudo de casos para avaliar a implementação da cogeração.
Palavras-chave: Cogeração, Uso Eficiente de Energia na Indústria

viii
This page was intentionally left blank
ix
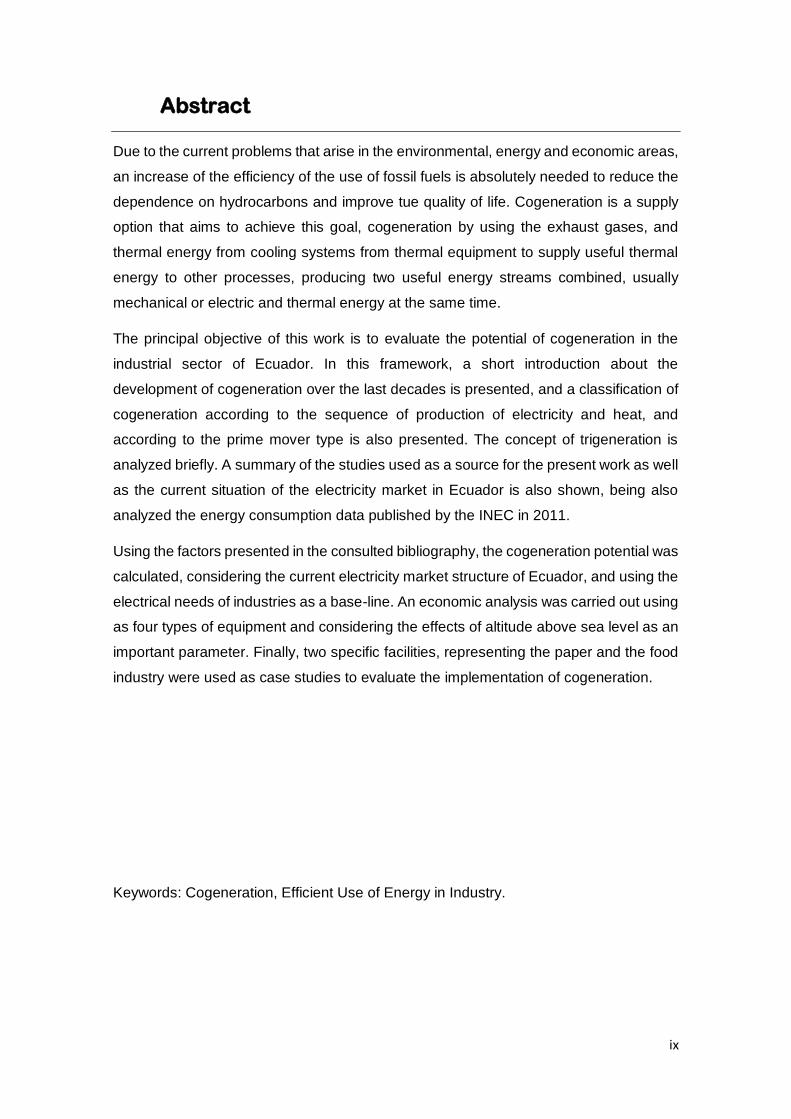
Abstract
Due to the current problems that arise in the environmental, energy and economic areas,
an increase of the efficiency of the use of fossil fuels is absolutely needed to reduce the
dependence on hydrocarbons and improve tue quality of life. Cogeneration is a supply
option that aims to achieve this goal, cogeneration by using the exhaust gases, and
thermal energy from cooling systems from thermal equipment to supply useful thermal
energy to other processes, producing two useful energy streams combined, usually
mechanical or electric and thermal energy at the same time.
The principal objective of this work is to evaluate the potential of cogeneration in the
industrial sector of Ecuador. In this framework, a short introduction about the
development of cogeneration over the last decades is presented, and a classification of
cogeneration according to the sequence of production of electricity and heat, and
according to the prime mover type is also presented. The concept of trigeneration is
analyzed briefly. A summary of the studies used as a source for the present work as well
as the current situation of the electricity market in Ecuador is also shown, being also
analyzed the energy consumption data published by the INEC in 2011.
Using the factors presented in the consulted bibliography, the cogeneration potential was
calculated, considering the current electricity market structure of Ecuador, and using the
electrical needs of industries as a base-line. An economic analysis was carried out using
as four types of equipment and considering the effects of altitude above sea level as an
important parameter. Finally, two specific facilities, representing the paper and the food
industry were used as case studies to evaluate the implementation of cogeneration.
Keywords: Cogeneration, Efficient Use of Energy in Industry.

x
This page was intentionally left blank

xi
Table of Contents
1. INTRODUCTION ...............................................................................................................1
2. STATE OF THE ART ........................................................................................................3
2.1 Brief history of Cogeneration .............................................................................................3
2.2 Concepts ..............................................................................................................................3
2.2.1 Classification of Cogeneration .............................................................................................4
2.1.1 Prime Movers ......................................................................................................................6
2.3. Trigeneration ......................................................................................................................9
2.3.1 Absorption Chillers ............................................................................................................10
2.3.2 Adsorption Chillers ............................................................................................................10
2.4 Cogeneration Potential at a Country Level ....................................................................11
2.4.1 United States of America. ..................................................................................................11
2.4.2 Portugal .............................................................................................................................15
2.4.3 Spain ..................................................................................................................................18
2.4.4 Germany ............................................................................................................................22
2.2.5 Comparison of the Presented Methodologies. ..................................................................28
2.3 Development of Cogeneration ........................................................................................28
2.4 Market Characteristics......................................................................................................30
3. METHODOLOGY ............................................................................................................31
3.1 Objectives ..........................................................................................................................31
3.2 Ecuador Energy Outlook. .................................................................................................31
3.3 Concepts and Data Requirements .................................................................................33
3.4 Demand Estimation. .........................................................................................................34
3.5. Thermal and Electric energy production estimation ....................................................37
3.5.1 General Issues ...................................................................................................................37
3.5.2 Limitations due to Topographic .........................................................................................39
3.6 Technical Potential ...........................................................................................................40

xii
3.7 Economic Analysis ............................................................................................................43
3.8 Efficiency Analysis ............................................................................................................48
4. CASE STUDY ..................................................................................................................51
4.1 Introduction ........................................................................................................................51
4.2. Industry A ..........................................................................................................................51
4.2.1 Demand Estimation. ..........................................................................................................52
4.2.2 Economic Analysis .............................................................................................................53
4.2.3 Efficiency Analysis .............................................................................................................55
4.3. Industry B ..........................................................................................................................56
4.3.1 Demand Estimation. ..........................................................................................................57
4.3.2 Potential Analysis ..............................................................................................................57
4.3.3 Efficiency Analysis .............................................................................................................60
5. CONCLUSIONS...............................................................................................................61
APPENDIX I .............................................................................................................................65
APPENDIX II ............................................................................................................................66
APPENDIX III ...........................................................................................................................67
APPENDIX IV...........................................................................................................................69
APPENDIX V ............................................................................................................................72
REFERENCES ........................................................................................................................75

xiii
List of Figures
Figure 1. 1 Traditional System compared with a Cogeneration System ......................... 1
Figure 1. 2 Current and project CHP capacities under and accelerated CHP scenario,
2015 and 2030 .................................................................................................................. 2
Figure 2. 1 Classic System to Produce Electrical Energy ............................................... 4
Figure 2. 2 Classification of Cogeneration Systems According to sequence production
of Electricity and heat ....................................................................................................... 5
Figure 2. 3 Basic schema of Steam Turbine .................................................................... 6
Figure 2. 4 Condensing Steam Turbine ........................................................................... 7
Figure 2. 5 Back Pressure Steam Turbine ....................................................................... 7
Figure 2. 6 Basic Schematic of Gas Turbine………………………………………………..8
Figure 2. 7 Basic Schematic of Internal Combustion Engine .......................................... 9
Figure 2. 8 Combined Cooling, Heat and Power ............................................................. 9
Figure 2. 9 Abortion Chiller Cycle .................................................................................. 10
Figure 2. 10 Flowchart for determining district heating cogeneration potential ............ 26
Figure 2. 11 Annual and cumulated installed owner of cogeneration in Spain ............. 29
Figure 3. 1 Comparison of Supply and Demand of Oil Products .................................. 32
Figure 3. 2 Economic sectors’ energy consumption by energy sources ....................... 32
Figure 3. 3 Structure of Electricity supply ...................................................................... 33
Figure 3. 4 Division of Business according to Principal Activity .................................... 34
Figure 3. 5 Sub-sector of manufacturing business ........................................................ 35
Figure 3. 6 Heat requirement in the year (MWh) ........................................................... 37
Figure 3. 7 Electrical Requirement in the year (MWh) ................................................... 37
Figure 3. 8 Heat Requirement only considered 50% of Diesel oil (MWh) ..................... 41
Figure 3. 9 Price of kWh generated for diesel engine ................................................... 44
Figure 3. 10 Price of kWh generated for gas engine (350kW -950kW)......................... 45
Figure 3. 11 Price of kWh generated for gas engine ..................................................... 46
Figure 3. 12 Price of kWh generated for gas Turbine .................................................... 47
Figure 4. 1 Cogeneration System proposed .................................................................. 51
Appendix Figure. 1 Basic System .................................................................................. 69
Appendix Figure. 2 Recovery Boiler scheme ................................................................. 72

xiv
This page was intentionally left blank
xv
List of Tables
Table 2. 1 Industrial CHP Market ................................................................................... 12
Table 2. 2 Commercial CHP Target Market ................................................................... 12
Table 2. 3 WHP CHP Target Markets ............................................................................ 14
Table 2. 4 Proportion of the consumption of heat that can be supplied through a source
of residential heat ........................................................................................................... 17
Table 2. 5 Structure of the Demand Centre’s ............................................................... 19
Table 2. 6 Classification of indirect and direct categories ............................................. 19
Table 2. 7 Uses of the tertiary sector and classification direct and indirect demand .... 21
Table 2. 8 2012 Cogeneration Act surcharge rates ....................................................... 23
Table 2. 9 CHP considered ............................................................................................ 24
Table 2. 10 Characteristics of CHPP Types of Plants ................................................... 25
Table 2. 11 Town Categories ......................................................................................... 27
Table 2. 12 Comparative Table ...................................................................................... 29
Table 3. 1 Energy Import (kBOE) ................................................................................... 31
Table 3. 2 Individual categories of ISIC ......................................................................... 33
Table 3. 3 Percentage to Heat used for Cogeneration .................................................. 38
Table 3. 4 Ratios Considered for each subsector.......................................................... 39
Table 3. 5 Percentage of Industries in the different region to the country .................... 39
Table 3. 6 Potential to Cogeneration considering 100% of diesel ................................. 41
Table 3. 7 Potential to Cogeneration considering 50% of diesel ................................... 42
Table 3. 8 Characteristics of equipment to analysis ...................................................... 43
Table 3. 9 Economic Analysis diesel engine ................................................................. 44
Table 3. 10 Economic Analysis for gas engine (350kW-950kW) .................................. 45
Table 3. 11 Economic Analysis for gas engine .............................................................. 46
Table 3. 12 Economic Analysis for gas turbine .............................................................. 48
Table 3. 13 Energy Efficiency indicators ........................................................................ 49
Table 4. 1 Engine Characteristics .................................................................................. 53
Table 4. 2 Energy consumed and produced by cogeneration ....................................... 54
Table 4. 3 Economic parameters ................................................................................... 55
Table 4. 4 Operative cost caused for energy consumption ........................................... 55
Table 4. 5 Efficiency energy Dates ................................................................................ 55
Table 4. 6 Engine Characteristics .................................................................................. 58
Table 4. 7 Energy consumed and produced by cogeneration ....................................... 59
Table 4. 8 Economic parameters ................................................................................... 59
Table 4. 9 Efficiency energy Dates ................................................................................ 60

xvi
Table 5. 1 Technical Cogeneration Potential ................................................................. 61
Table 5. 2 Example of Percentage of PES with right to additional payment ................. 62
Table 5. 3 Economic Indicators for the example case ................................................... 62

xvii
List of Acronyms
BHPP Block Heat and Power Plant
BOE Barrel of Oil Equivalent
CCHP Combined Cooling, Heat and Power
CHP Combined Heat and Power
CHPP Combined Heat and Power Plant
CTS Commerce, Trade, Services
DGEG Portuguese Directorate Energy Association
EU European Union
FLO Full Load Operation
G&S Gas & Steam
GT Gas Turbine
ICE Internal Combustion Engine
IDEA International District Energy Association
IEA International Energy Agency
INEC National Institute of Statistics and Census
IRR Internal Rate of Return
ISIC International Standard Industrial
Classification of all Economic Activities
LHV Lower Heating Value
LPG Liquid Petroleum Gas
MNI Manufacturer´s News Inc High Tech
Database
NG Natural Gas
NPV Net Present Value
ORC Organic Rankine Cycle
P/H Power-to-Heat
PES Primary Energy Saved
PURPA Public Utility Regulatory Act
RES Renewable Energy Source
ST Steam Turbine
USA United States of America
WHP Waste Heat to Power

xviii
This page was intentionally left blank
1
1. INTRODUCTION
Generally, thermal energy is locally generated in industry from fossil fuels while
electricity is obtained from the electric power grid. However, a significant part of electric
energy is generated in thermal power plants which waste a large part of the input energy
through exhaust gases and cooling systems. The waste of energy can be partly reduced
by taking advantage of the heat in exhaust gases and cooling water of the prime movers
to produce useful energy. This can be a way to raise the global efficiency of the system,
reducing cost, pollution and other problems.
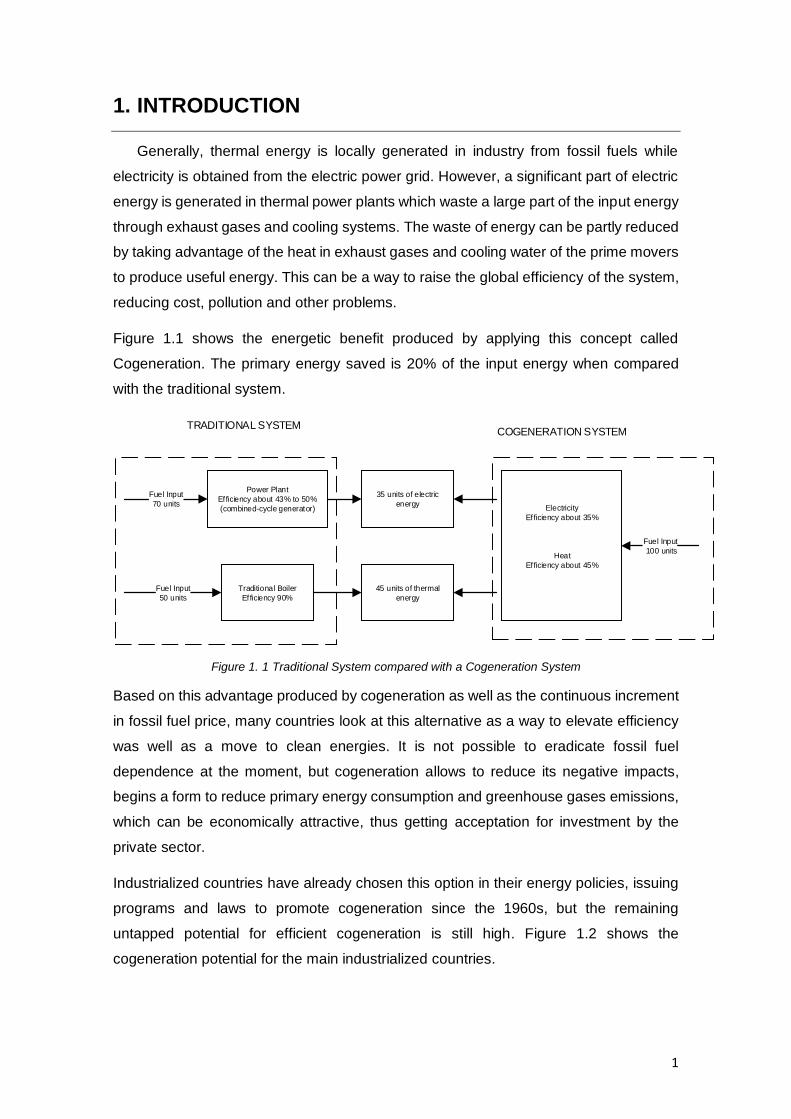
Figure 1.1 shows the energetic benefit produced by applying this concept called
Cogeneration. The primary energy saved is 20% of the input energy when compared
with the traditional system.
Power Plant
Efficiency about 43% to 50%
(combined-cycle generator)
Traditional Boiler
Efficiency 90%
Fuel Input
70 units
Fuel Input
50 units
Electricity
Efficiency about 35%
Heat
Efficiency about 45%
45 units of thermal
energy
35 units of electric
energy
Fuel Input
100 units
TRADITIONAL SYSTEMCOGENERATION SYSTEM
Figure 1. 1 Traditional System compared with a Cogeneration System
Based on this advantage produced by cogeneration as well as the continuous increment
in fossil fuel price, many countries look at this alternative as a way to elevate efficiency
was well as a move to clean energies. It is not possible to eradicate fossil fuel
dependence at the moment, but cogeneration allows to reduce its negative impacts,
begins a form to reduce primary energy consumption and greenhouse gases emissions,
which can be economically attractive, thus getting acceptation for investment by the
private sector.
Industrialized countries have already chosen this option in their energy policies, issuing
programs and laws to promote cogeneration since the 1960s, but the remaining
untapped potential for efficient cogeneration is still high. Figure 1.2 shows the
cogeneration potential for the main industrialized countries.

2
Figure 1. 2 Current and project CHP capacities under and accelerated CHP scenario, 2015 and 2030 (IEA, 2008, p. 21)
In this dissertation, the cogeneration potential of Ecuador is evaluated as an alternative
way to promote a reduction in fossil fuel consumption and its related problems,
increasing industrial efficiency. An economic analysis is also performed with the purpose
of evaluating possible investment.
The document is organized in 5 chapters. Chapter one presents a brief introduction.
Chapter two gives a first approach about cogeneration, dealing with topics such as
definitions, classifications according to sequence, general prime movers, and finally
different studies developed in other countries.
In chapter three, a review of the available information about the economic sector is
carried out. Some considerations about the industrial sector are taken. Furthermore,
thermal and electrical needs are established, and the procedure to evaluate
cogeneration potential is presented. Finally, an economic analysis is carried out to
evaluate the feasibility of cogeneration.
Chapter four presents an individual analysis for two industries in the country. The first
industry manufactures paper products, and the second industry produces milk and
natural juice products.
Conclusions obtained from this work are presented in chapter five, including a future
work discussion.

3
2. STATE OF THE ART
2.1 Brief history of Cogeneration
Cogeneration started to be used more than 100 years ago, at first in Europe and
from them expanding to the USA.
In the 1900s, the electric grid was small, unreliable and expensive, leading to the use of
local electricity generation.
In this situation, cogeneration was an economic and practical form to fix the problem.
Some industries applicated this solution, and as an example, in the USA in 1900,
cogeneration produced around half of the electric energy needed for industrial, when
steam for the in industrial facilities, such as petroleum refineries, pulp and paper mills or
chemical plants (Joseph A. Orlando, 1991, p. 2), industries where still today cogeneration
is a natural option, proving good rentability.
The construction of a better and interconnected electric grid, is a reliable source of cheap
electric energy, reduced the economic interest in cogeneration.
However, the petroleum crisis in the 1970s and 1980s, leading to a huge increment in
the price of the fuel, let to a new interest in alternative forms to produce energy, and to
generally increase efficiency, with a main purpose of ending or reducing the petroleum
dependence of the USA and several other countries, namely in Europe.
The legislation needed for the introduction or expansion of cogeneration in some
countries, considered significant differences when compared with traditional generation
entities. In the USA, the Public Utility Regulatory Act (PURPA) introduced some benefits,
eliminated constraints to the grid access for cogeneration and renaveble based
independent producers, a move followed by several European Countries. Later, the
European Union prepared and started a Directive to promot the development of high
efficiency cogeneration and clarifying the benefits to the potential investors (Joel
Bluestein and Marie Lihn, n.d., p. 481).
2.2 Concepts
Consumption of thermal, mechanical and electrical energy is a common issue in
almost every industry. At the same time, the traditional process to produce electricity
from any fossil fuel combustion has important problems (Neil Petchers, 2003).
4
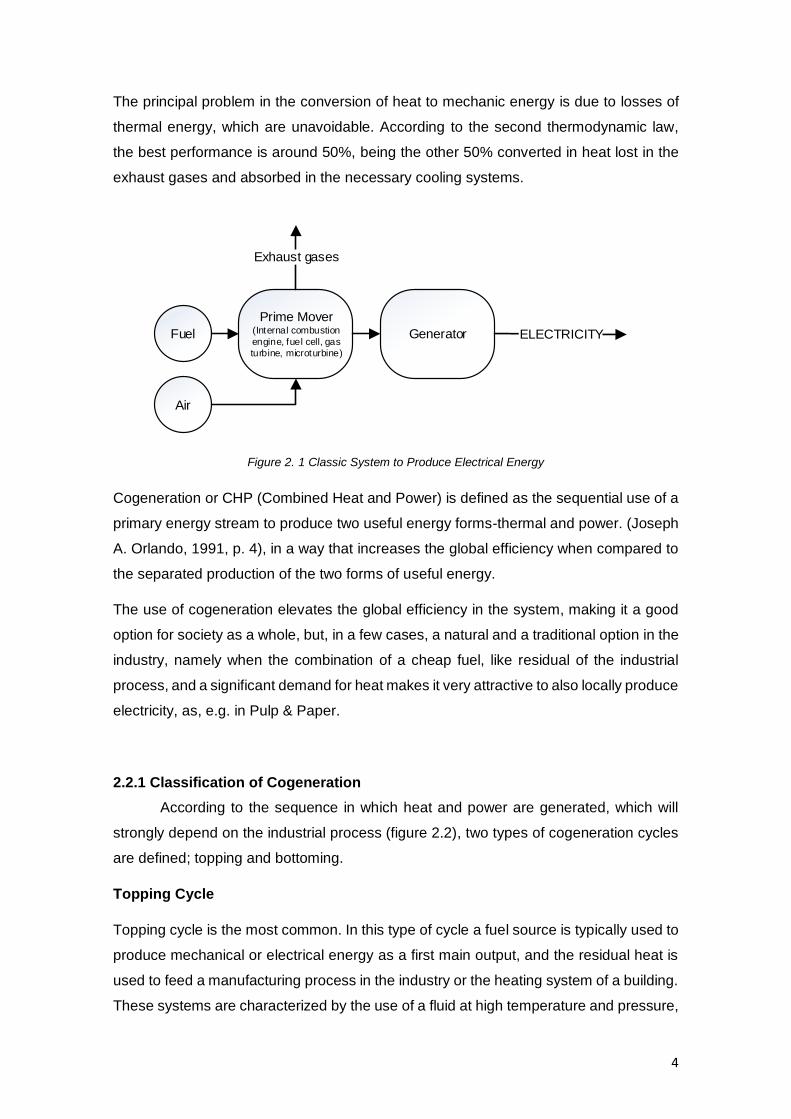
The principal problem in the conversion of heat to mechanic energy is due to losses of
thermal energy, which are unavoidable. According to the second thermodynamic law,
the best performance is around 50%, being the other 50% converted in heat lost in the
exhaust gases and absorbed in the necessary cooling systems.
Fuel
Prime Mover (Internal combustion
engine, fuel cell, gas
turbine, microturbine)
Generator ELECTRICITY
Air
Exhaust gases
Figure 2. 1 Classic System to Produce Electrical Energy
Cogeneration or CHP (Combined Heat and Power) is defined as the sequential use of a
primary energy stream to produce two useful energy forms-thermal and power. (Joseph
A. Orlando, 1991, p. 4), in a way that increases the global efficiency when compared to
the separated production of the two forms of useful energy.
The use of cogeneration elevates the global efficiency in the system, making it a good
option for society as a whole, but, in a few cases, a natural and a traditional option in the
industry, namely when the combination of a cheap fuel, like residual of the industrial
process, and a significant demand for heat makes it very attractive to also locally produce
electricity, as, e.g. in Pulp & Paper.
2.2.1 Classification of Cogeneration
According to the sequence in which heat and power are generated, which will
strongly depend on the industrial process (figure 2.2), two types of cogeneration cycles
are defined; topping and bottoming.
Topping Cycle
Topping cycle is the most common. In this type of cycle a fuel source is typically used to
produce mechanical or electrical energy as a first main output, and the residual heat is
used to feed a manufacturing process in the industry or the heating system of a building.
These systems are characterized by the use of a fluid at high temperature and pressure,

5
as a means for energy transfer, being more effective when the end use processes have
lower requirements for temperature and pressure. (Javier Miranda, 2010)
For industrial processes that have temperature requirements from 250 ºC to 600 ºC, the
use of topping cycle is common, e.g. in the pulp & paper, beer, food, sugar, petroleum,
textile and other industries.
The first element of the process, are the prime movers, typically one of the following
technologies:
- Gas Turbine
- Steam Turbine
- Internal Combustion engine
- Combined Gas Turbine and Steam turbine (Combined cycle).
TOPPING CYCLE
INDUSTRY PROCCES
BOTTOMING CYCLE
FUEL
HE
AT
WA
TE
R
EX
HA
US
T
GA
SE
S
ELE
CT
RIC
AL
EN
ER
GY
ELECTRICAL ENERGY
PRODUCT
ST
EA
M
HE
AT
WA
TE
R
ELECTRICAL ENERGY
Figure 2. 2 Classification of Cogeneration Systems According to sequence production of Electricity and
heat
Bottoming Cycle
As the opposite to topping cycle, in the bottoming cycle, the primary energy is used in
the industrial process and the exhaust heat is recycled to produce electrical or
mechanical energy in a second step. (Neil Petchers, 2003)
The bottoming cycle has been common use in cement, steel, glass, chemical, mining
and other industries that have residual heat from around 250ºC to 1200ºC.
6
2.1.1 Prime Movers
This subsection describes the main technologies used for prime movers
Steam Turbine
BOILER
STEAM TURBINE GENERATORSUPER HEATSTEAM
CONDENSING
EXHAUST STEAM
CONDENSING STEAM
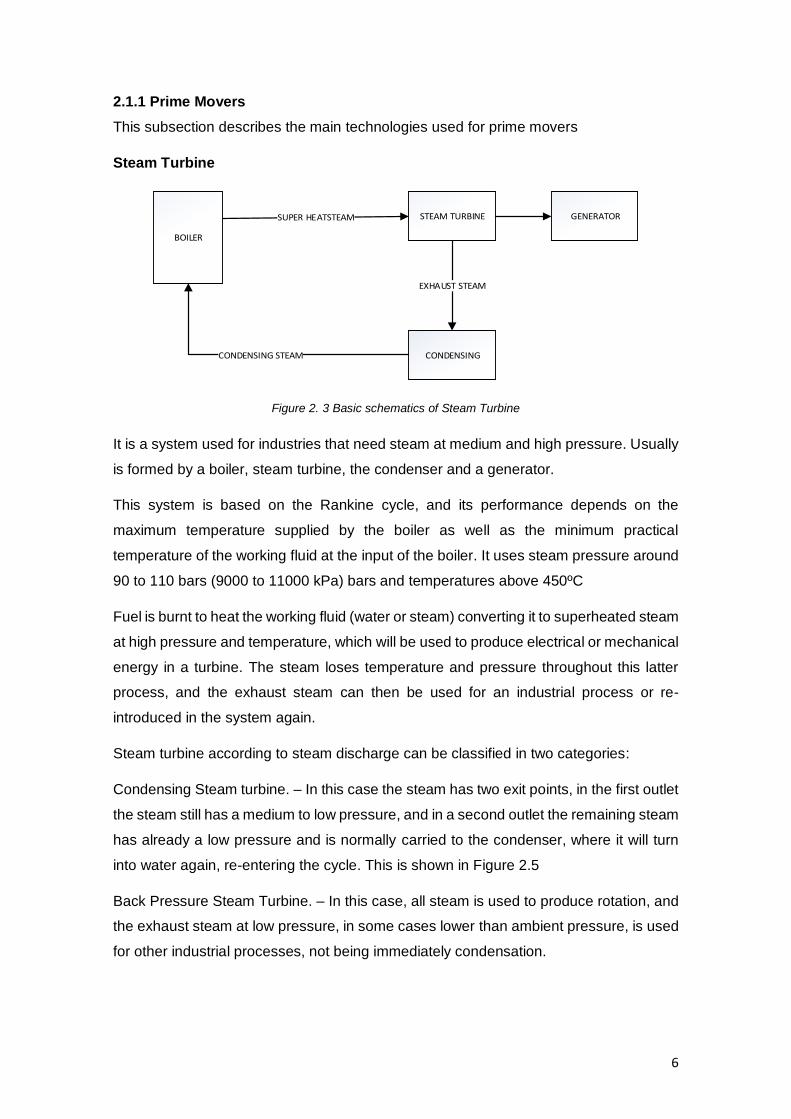
Figure 2. 3 Basic schematics of Steam Turbine
It is a system used for industries that need steam at medium and high pressure. Usually
is formed by a boiler, steam turbine, the condenser and a generator.
This system is based on the Rankine cycle, and its performance depends on the
maximum temperature supplied by the boiler as well as the minimum practical
temperature of the working fluid at the input of the boiler. It uses steam pressure around
90 to 110 bars (9000 to 11000 kPa) bars and temperatures above 450ºC
Fuel is burnt to heat the working fluid (water or steam) converting it to superheated steam
at high pressure and temperature, which will be used to produce electrical or mechanical
energy in a turbine. The steam loses temperature and pressure throughout this latter
process, and the exhaust steam can then be used for an industrial process or re-
introduced in the system again.
Steam turbine according to steam discharge can be classified in two categories:
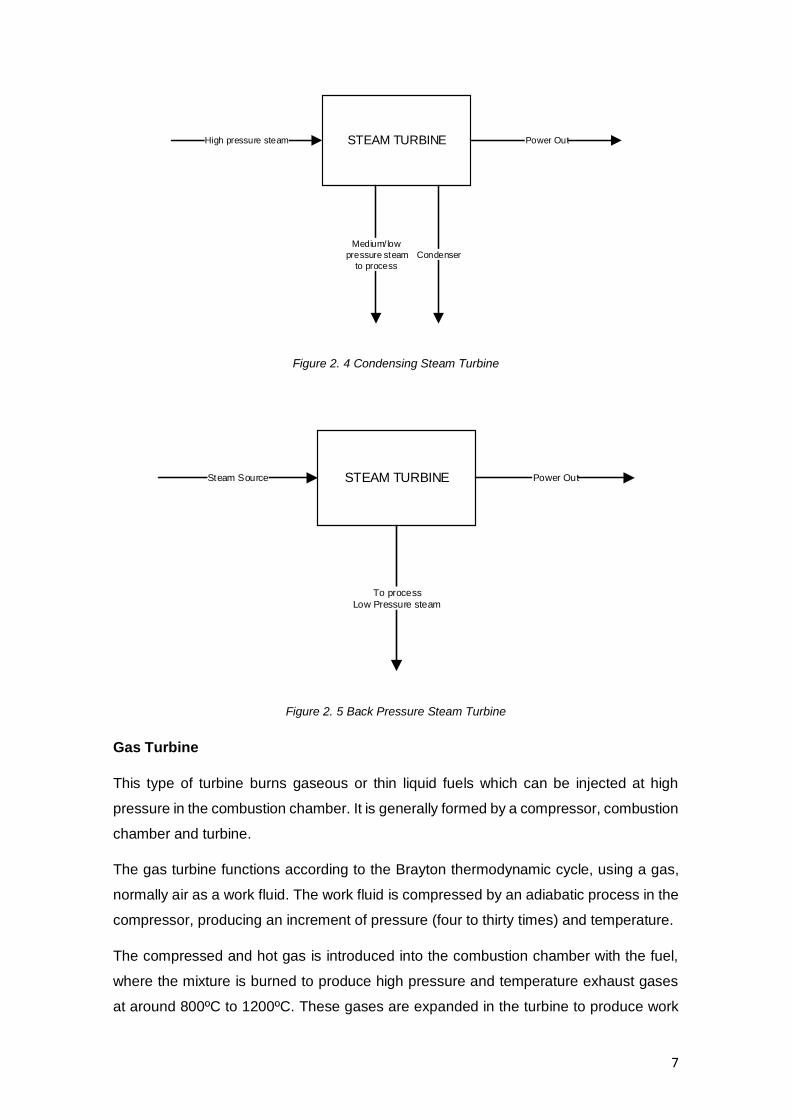
Condensing Steam turbine. – In this case the steam has two exit points, in the first outlet
the steam still has a medium to low pressure, and in a second outlet the remaining steam
has already a low pressure and is normally carried to the condenser, where it will turn
into water again, re-entering the cycle. This is shown in Figure 2.5
Back Pressure Steam Turbine. – In this case, all steam is used to produce rotation, and
the exhaust steam at low pressure, in some cases lower than ambient pressure, is used
for other industrial processes, not being immediately condensation.
7
STEAM TURBINEHigh pressure steam Power Out
Condenser
Medium/low
pressure steam
to process
Figure 2. 4 Condensing Steam Turbine
STEAM TURBINESteam Source Power Out
To process
Low Pressure steam
Figure 2. 5 Back Pressure Steam Turbine
Gas Turbine
This type of turbine burns gaseous or thin liquid fuels which can be injected at high
pressure in the combustion chamber. It is generally formed by a compressor, combustion
chamber and turbine.
The gas turbine functions according to the Brayton thermodynamic cycle, using a gas,
normally air as a work fluid. The work fluid is compressed by an adiabatic process in the
compressor, producing an increment of pressure (four to thirty times) and temperature.
The compressed and hot gas is introduced into the combustion chamber with the fuel,
where the mixture is burned to produce high pressure and temperature exhaust gases
at around 800ºC to 1200ºC. These gases are expanded in the turbine to produce work

8
that moves the compressor and an electric generator or mechanical parts (Javier
Miranda, 2010, p. 31). Exhaust can then be used in other steps on the system or as an
input to another system, e.g. a recovery boiler to produce steam.
COMPRESSOR TURBINE
COMBUSTION CHAMBER
HEAR RECOVERY
Air
Compressor Air Work Fluid
Exhaust Gases
Exhaust Gases
To generate electric or mechanical energy
Fuel
Figure 2. 6 Basic Schematic of Gas Turbine
Internal Combustion Engine
Internal combustion engines (ICE) used for power generation can be based on the Otto
thermodynamic cycle (similar to the engines of gasoline powered cars) or on the Diesel
thermodynamic cycles. The main difference of both is the ignition process, which in the
former is caused by a spark produced electrically, and in the second results from the
compression of the fuel. The ICE is capable of taking faster load changes than other
technologies.
Compared to the above described thermodynamic cycles based on turbines, ICEs have
a lower power-to-size ratio, being more limited in power ratings and increased
maintenance costs. However, they present better efficiencies, namely the big, low speed,
diesel engines derived from marine applications (Joseph A. Orlando, 1991).
As in other prime movers, the high temperature exhaust gases can be used by a recovery
boiler to produce steam, eventually with additional fuel burning.
Hot water can be also produced through the use of a heat exchanger, both in the exhaust,
or using the engine cooling fluid (radiator).

9
INTERNAL COMBUSTION ENGINE
SECOND PROCESS
RECOVERY BOILER
GENERATOR OF ELECTRIC OR MECHANICAL
ENERGY
Fuel and Air
Exhaust Gas
Steam or Hot Water
Fuel
Figure 2. 7 Basic Schematic of Internal Combustion Engine
2.3. Trigeneration
The traditional system to produce cooling energy is formed by a compressor
driven by an electrical motor in a configuration known as a heat pump. Although such a
device has a very high efficiency, it needs electricity that is probably generated in thermal
power plants with low efficiency. As an alternative, there are technologies that can use
the residual heat for this purpose, namely the absorption and adsorption chillers.
Generally, this technology present interesting alternative in industrial sector with
important consumption of energy for cooling needs.
Using an absorption or adsorption chiller to convert part of the heat produced in a
cogeneration plant into cooling energy makes what is called as a trigeneration system.
The first part of this system produces mechanical energy, typically converted into
electrical power. Secondly, the residual heat is used to produce steam or other useful
form heat as for heating buildings. A third part uses the unused residual heat to produce
cooling energy.
Figure 2. 8 Combined Cooling, Heat and Power
10
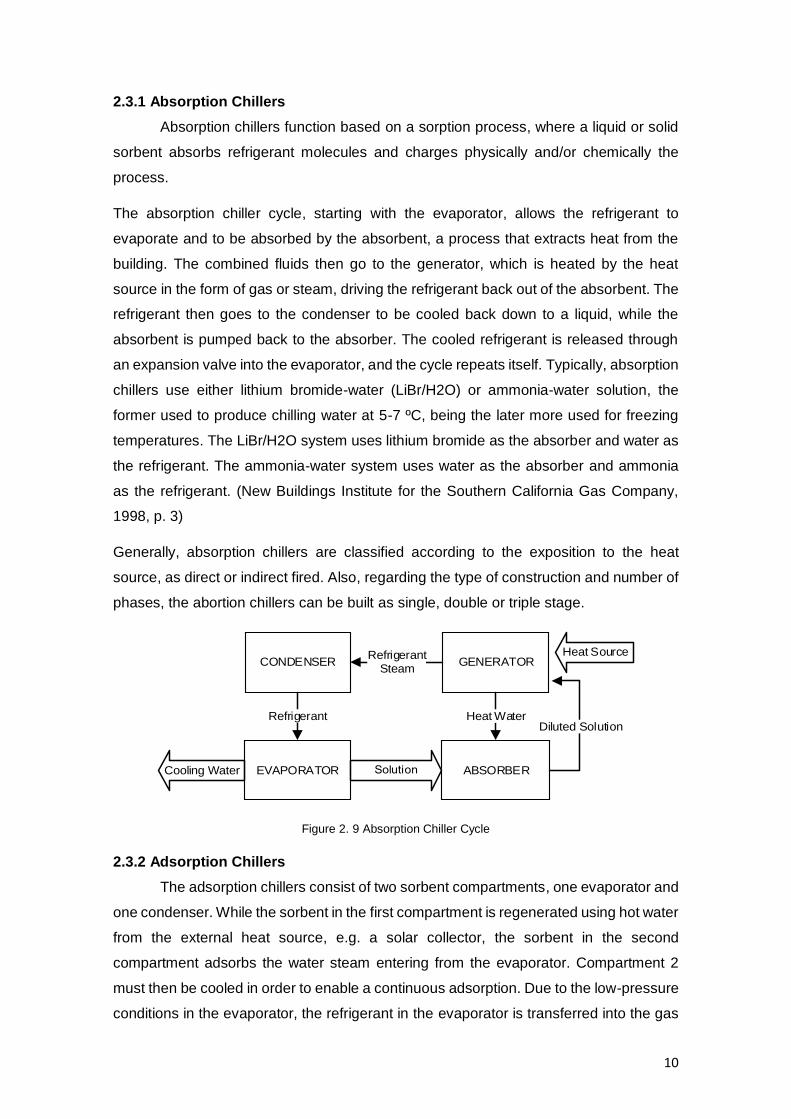
2.3.1 Absorption Chillers
Absorption chillers function based on a sorption process, where a liquid or solid
sorbent absorbs refrigerant molecules and charges physically and/or chemically the
process.
The absorption chiller cycle, starting with the evaporator, allows the refrigerant to
evaporate and to be absorbed by the absorbent, a process that extracts heat from the
building. The combined fluids then go to the generator, which is heated by the heat
source in the form of gas or steam, driving the refrigerant back out of the absorbent. The
refrigerant then goes to the condenser to be cooled back down to a liquid, while the
absorbent is pumped back to the absorber. The cooled refrigerant is released through
an expansion valve into the evaporator, and the cycle repeats itself. Typically, absorption
chillers use either lithium bromide-water (LiBr/H2O) or ammonia-water solution, the
former used to produce chilling water at 5-7 ºC, being the later more used for freezing
temperatures. The LiBr/H2O system uses lithium bromide as the absorber and water as
the refrigerant. The ammonia-water system uses water as the absorber and ammonia
as the refrigerant. (New Buildings Institute for the Southern California Gas Company,
1998, p. 3)
Generally, absorption chillers are classified according to the exposition to the heat
source, as direct or indirect fired. Also, regarding the type of construction and number of
phases, the abortion chillers can be built as single, double or triple stage.
CONDENSER GENERATOR
EVAPORATOR ABSORBER
Heat Source
Diluted SolutionHeat Water
Refrigerant Steam
Refrigerant
Cooling Water
Figure 2. 9 Absorption Chiller Cycle
2.3.2 Adsorption Chillers
The adsorption chillers consist of two sorbent compartments, one evaporator and
one condenser. While the sorbent in the first compartment is regenerated using hot water
from the external heat source, e.g. a solar collector, the sorbent in the second
compartment adsorbs the water steam entering from the evaporator. Compartment 2
must then be cooled in order to enable a continuous adsorption. Due to the low-pressure
conditions in the evaporator, the refrigerant in the evaporator is transferred into the gas
11
phase by taking up the evaporation heat from the chilled water loop and thereby
producing the useful "cold". If the sorption material in the adsorption compartment is
saturated with water steam to a certain degree, the chambers are switched over in their
function. The simple mechanical construction of adsorption chillers and their expected
robustness is an advantage. A disadvantage is a comparatively large volume and weight.
Furthermore, due to the small number of produced items, the price of adsorption chillers
is currently still high.
2.4 Cogeneration Potential at a Country Level
This section presents different methodologies used in different countries to
estimate the potential for cogeneration at a national level
Several countries have developed studies for estimating the potential for CHP as an
autonomous initiative or as result of obligations imposed by pluri-national agreements
and structures (e.g. E.U.). In the particular case of the European Union, a recent
legislation mandated the member countries to assess the potential for high efficiency
cogeneration according to specific rules.
The following cases describes the approaches used by different countries.
- USA
- Portugal
- Spain
- Germany
2.4.1 United States of America.
According to the study: “Combined Heat and Power Technical Potential in the United
States” realized in 2016, three different types of CHP applications were included in the
evaluation of technical potential (Anne Hampson et al., 2016), namely:
- Traditional Topping Cycle CHP (including cooling)
- Waste Heat to Power (WHP) CHP
- District Energy including CHP
The document only considered sites with a CHP Technical Potential of 50kW and higher.
For all cases, the document makes the determination of the technical market potential,
including the following steps:
12
- Identification of the target market where CHP provides a reasonable adjustment
to the electric and thermal needs of the user.
- Quantification of the number and size distribution of target candidate facilities in
each target application, that meet the electric and thermal load requirement for
CHP.
- Estimation of the CHP potential in terms of MW electric capacity. The CHP
potential is derived from the thermal and electric load for each site. The total CHP
potential for each target market is then calculated by the amount of CHP potential
in each size category.
- Subtraction of the existing CHP from the identified sites to determine the
remaining technical potential.
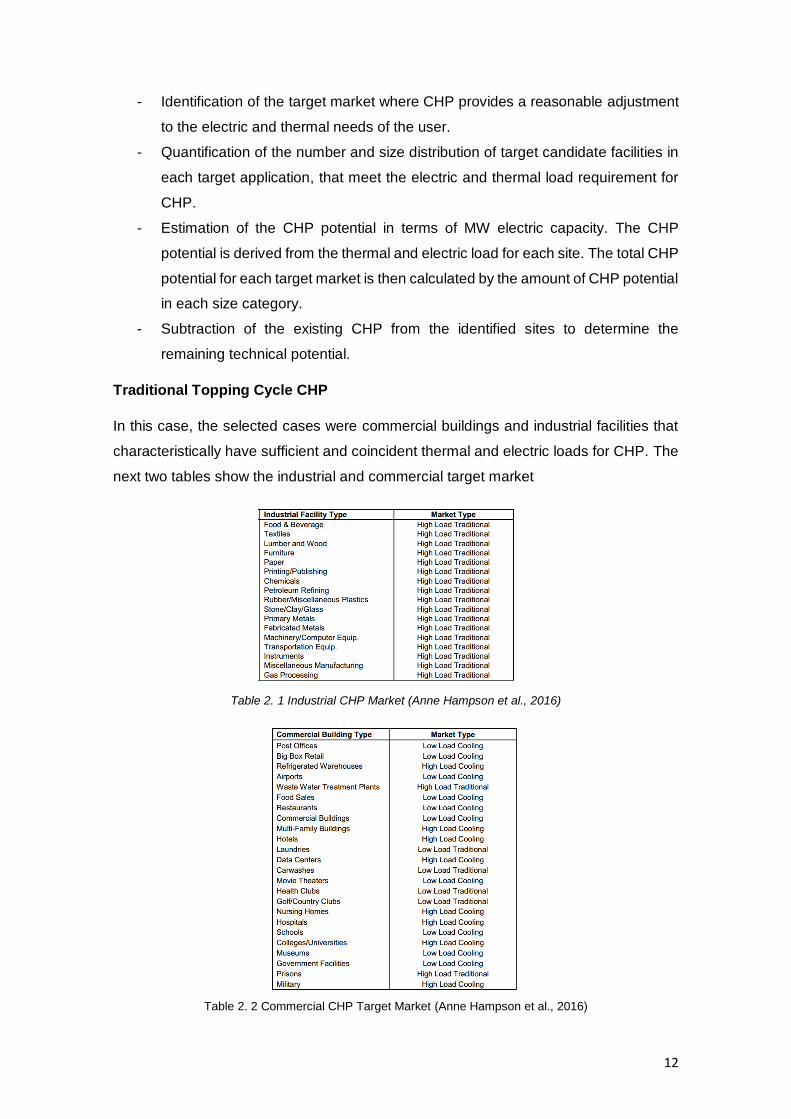
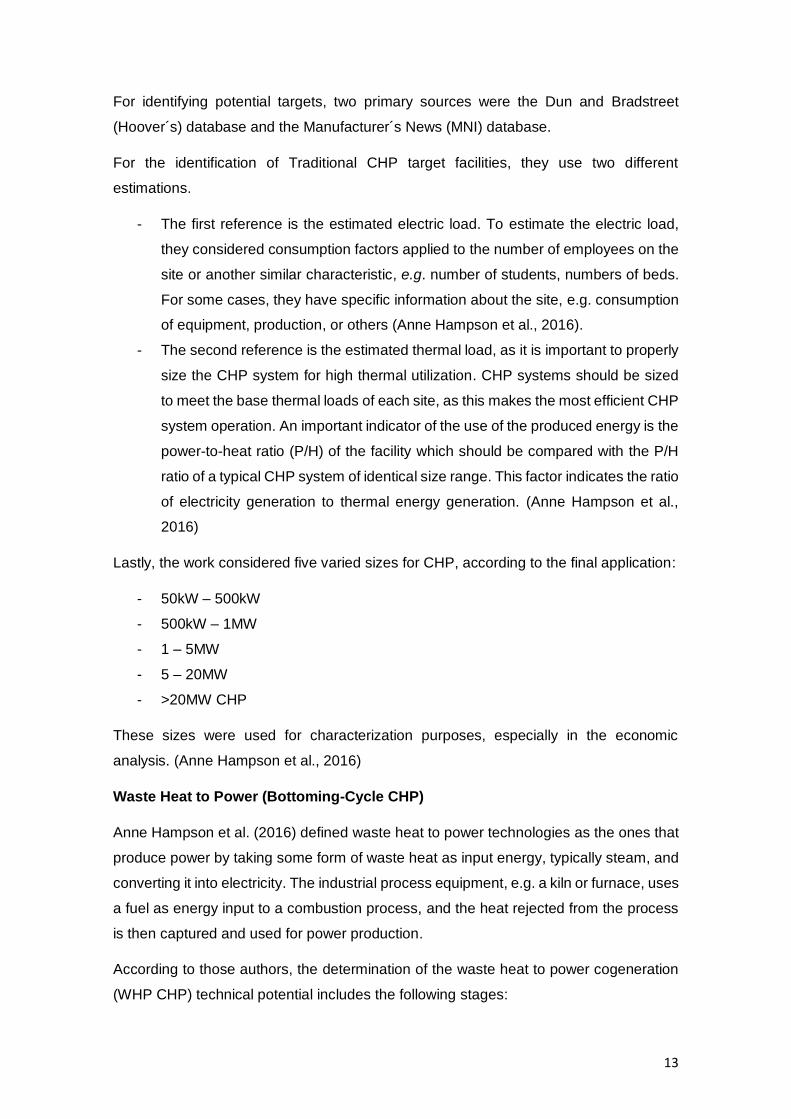
Traditional Topping Cycle CHP
In this case, the selected cases were commercial buildings and industrial facilities that
characteristically have sufficient and coincident thermal and electric loads for CHP. The
next two tables show the industrial and commercial target market
Table 2. 1 Industrial CHP Market (Anne Hampson et al., 2016)
Table 2. 2 Commercial CHP Target Market (Anne Hampson et al., 2016)
13
For identifying potential targets, two primary sources were the Dun and Bradstreet
(Hoover´s) database and the Manufacturer´s News (MNI) database.
For the identification of Traditional CHP target facilities, they use two different
estimations.
- The first reference is the estimated electric load. To estimate the electric load,
they considered consumption factors applied to the number of employees on the
site or another similar characteristic, e.g. number of students, numbers of beds.
For some cases, they have specific information about the site, e.g. consumption
of equipment, production, or others (Anne Hampson et al., 2016).
- The second reference is the estimated thermal load, as it is important to properly
size the CHP system for high thermal utilization. CHP systems should be sized
to meet the base thermal loads of each site, as this makes the most efficient CHP
system operation. An important indicator of the use of the produced energy is the
power-to-heat ratio (P/H) of the facility which should be compared with the P/H
ratio of a typical CHP system of identical size range. This factor indicates the ratio
of electricity generation to thermal energy generation. (Anne Hampson et al.,
2016)
Lastly, the work considered five varied sizes for CHP, according to the final application:
- 50kW – 500kW
- 500kW – 1MW
- 1 – 5MW
- 5 – 20MW
- >20MW CHP
These sizes were used for characterization purposes, especially in the economic
analysis. (Anne Hampson et al., 2016)
Waste Heat to Power (Bottoming-Cycle CHP)
Anne Hampson et al. (2016) defined waste heat to power technologies as the ones that
produce power by taking some form of waste heat as input energy, typically steam, and
converting it into electricity. The industrial process equipment, e.g. a kiln or furnace, uses
a fuel as energy input to a combustion process, and the heat rejected from the process
is then captured and used for power production.
According to those authors, the determination of the waste heat to power cogeneration
(WHP CHP) technical potential includes the following stages:

14
- Identification of target markets with available waste heat flow and where WHP
CHP provides a reasonable fit to the electric needs of the user.
- Quantification of the number and size distribution of target markets.
- Estimation of WHP CHP potential in terms of MW electric capacity, derived from
the waste heat quality and electric load for each site.
WHP CHP systems require a constant and ample supply of waste heat, because WHP
CHP systems will typically run for most hours of a year. Typically, heavy industrial
processes such as cement production, advanced oil extraction and refining, or paper,
production, have the waste heat stream necessary to drive a WHP CHP system (Anne
Hampson et al., 2016).
Table 2. 3 WHP CHP Target Markets (Anne Hampson et al., 2016)
The methodology to estimate the WHP CHP system size used the temperature of the
stack gas emissions minus an assumed minimum temperature of 122ºC. This difference
was then multiplied by the average specific heat for combustion of 0.26 BTU/lb (60.476
kJ/kg). The result was the energy content of the stack gas emissions (Anne Hampson et
al., 2016).
Technical Potential for District Energy
Other market included in the analysis performed in the USA as a target market for CHP
is district energy. It is a system that produces and delivers steam, hot water and/or chilled
water, through dedicated underground piping networks, to heat or cool buildings in a

15
given area. Typical settings ideal for district energy are downtown urban areas, college
campuses, military bases, airports, or hospital campuses. (Anne Hampson et al., 2016)
For this study, a dataset of existing district energy systems compiled by the International
District Energy Association (IDEA) was used to identify district energy loops operating in
the U.S. that have CHP and those that do not.
This system is unique from other energy markets because multiple legal entities are
recipients of energy generated on the system. This may create a complex scenario on
how trade the energy generated inside (Anne Hampson et al., 2016).
2.4.2 Portugal
The Portuguese Study used mainly public data or existing data supplied by the
Portuguese Directorate General for Energy and Geology (DGEG), (ISR-UC and INESC
Coimbra, 2016) namely:
- National energy Balance
- Consumption of electricity and of the main fuels by council area
- Survey on the consumption of energy in the domestic sector 2010.
- Statistics on construction and housing and censuses (National Statistics
Institute).
Due to limitations in data, some simplifications were assumed in order to estimate
consumption as accurately as possible.
The study looked for compliance with the Annex VII of Directive 2012/27/EU, aiming to
identify:
- Heating and cooling demands, including
o Municipalities and urban area with a plot ratio of at least 0.3
o Industrial zones with a total annual heating and cooling consumption of
more than 20GWh.
- Existing and planned district heating and cooling infrastructures.
- Potential heating and cooling supply points, including
o Electricity generation installations with a total annual electricity production
of more than 20GWh.
o Waste incineration plants.
o Existing and planned cogeneration installations and district heating
installations.

16
As part of this effort, the following hypotheses were therefore formulated in order to
estimate residential consumption at the smallest possible administrative level:
- The application of the average consumption by dwelling and the number of
dwellings in each civil parish.
- The application of statistics on consumption or sales by council area for all energy
sources, with the exception of biomass.
- The application of the above and an estimation of the total consumption for space
heating using statistics on heating systems procession by civil parish.
- Complementing the above statistics with estimations on cooling energy by using
statistics on air conditioning possession.
For the case of the sectors of agriculture and fishing, industry and services, the mapping
was made based on the administrative and geographic boundaries of the Portuguese
municipalities, due to limitations in the data. (ISR-UC and INESC Coimbra, 2016)
The Annex VII of Directive 2012/27/EU also requires the mapping of industrial zones with
a total annual heating and cooling consumption of more that 20GWh but the lack of data
regarding the location and consumption of industrial areas prevented this determination.
For the case of the manufacturing industry, only the subsectors with greater cogeneration
potential were considered, the selection being made based on the amount of heat
consumed, and the typical share of heat that can be replaced, namely:
- Food, drink and tobacco
- Textiles
- Paper and paper products
- Chemical and plastics
- Wood and wooden articles
- Rubber
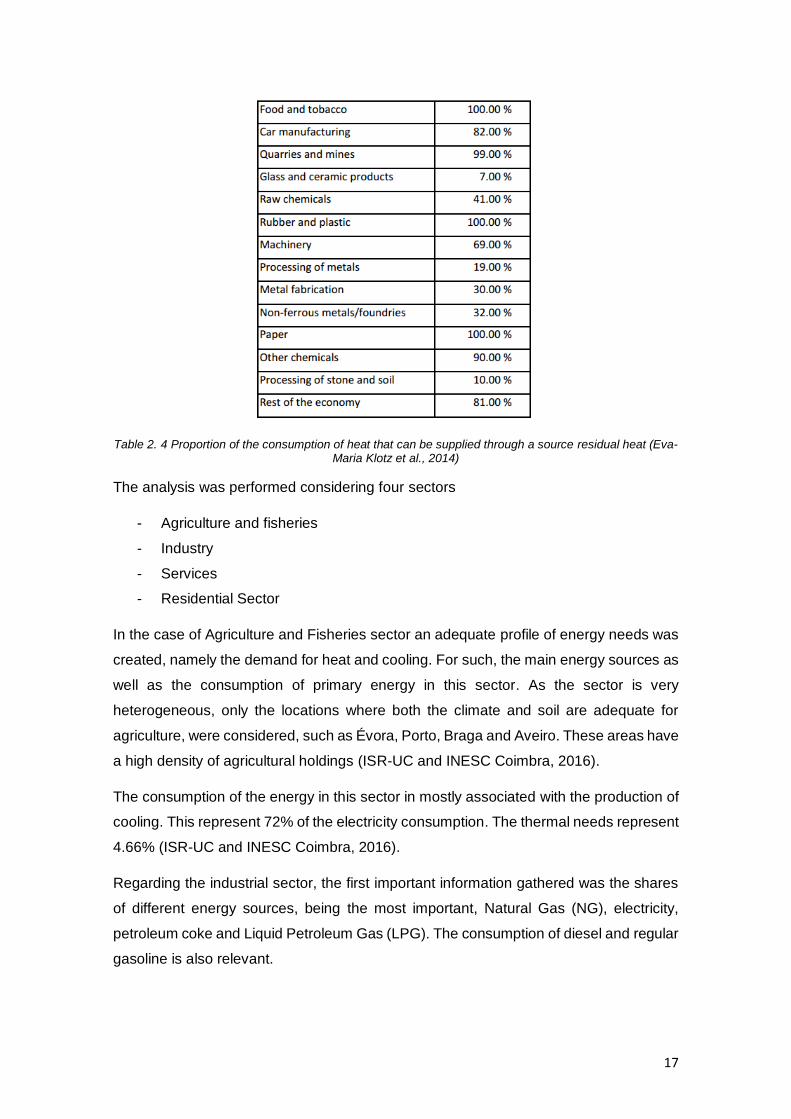
ISR-UC and INESC Coimbra (2016) used reference data from Eva-Maria Klotz et al.,
(2014), the consumption of heat at temperatures under 300ºC, which are considered as
replaceable by a source of residual heat, are distributed by the different sub-sectors of
the manufacturing industry.
In the case of the services buildings, the use of cogeneration was considered in the sub-
sectors where this option already meaningful, and whose total consumption accounts to
around 40% of the consumption of electricity and thermal energy in buildings(INESC
Coimbra, ISR-UC, 2016).
17
Table 2. 4 Proportion of the consumption of heat that can be supplied through a source residual heat (Eva-Maria Klotz et al., 2014)
The analysis was performed considering four sectors
- Agriculture and fisheries
- Industry
- Services
- Residential Sector
In the case of Agriculture and Fisheries sector an adequate profile of energy needs was
created, namely the demand for heat and cooling. For such, the main energy sources as
well as the consumption of primary energy in this sector. As the sector is very
heterogeneous, only the locations where both the climate and soil are adequate for
agriculture, were considered, such as Évora, Porto, Braga and Aveiro. These areas have
a high density of agricultural holdings (ISR-UC and INESC Coimbra, 2016).
The consumption of the energy in this sector in mostly associated with the production of
cooling. This represent 72% of the electricity consumption. The thermal needs represent
4.66% (ISR-UC and INESC Coimbra, 2016).
Regarding the industrial sector, the first important information gathered was the shares
of different energy sources, being the most important, Natural Gas (NG), electricity,
petroleum coke and Liquid Petroleum Gas (LPG). The consumption of diesel and regular
gasoline is also relevant.
18
As for the case of agriculture, an attempt was made to identify areas with a consumption
of 20GWh or more. In this sector the heating needs account for 67.1% of the energy
consumption of the sector, and the cooling needs are around 4% of the electricity
consumption (ISR-UC and INESC Coimbra, 2016).
The service sector is very heterogeneous, ranging from small commercial units to large
shopping centers, large hospitals and also including office blocks, schools, sporting
facilities, hotels, etc. The wide variation in terms of size and number of hours of use,
makes the determination of the typical thermal needs by subsector, extremely difficult,
not forgetting that, in general, terms this sector is influenced by the climate zone, purpose
of the building and large population centers. The principal energy source are diesel, NG,
electricity and regular gasoline. The use of fuel and PLG is low (ISR-UC and INESC
Coimbra, 2016).
The heat and cooling needs represent 21.8% and 17.7% respectable, of the total energy
consumption of the sector (ISR-UC and INESC Coimbra, 2016).
In the case of residential sector, Portugal has a very low consumption, namely regarding
the consumption fror heat and for space cooling. The main energy sources in this sector
are electricity, LPG, solar thermal, gas, fuel and Biomass.
2.4.3 Spain
Spanish government ordered a “Full Assessment of the potential use of High-
Efficient Cogeneration and Efficient District Heating and Cooling Systems”, also in
compliance with the Annex VII of Directive 2012/27/EU (Ministry of Industry, Energy and
Tourism of Spain, 2016).
As a first step to localize demand for energy, a database was created using as main
source of information for each of the country´s municipalities, the Land Registry of Spain,
completed with other sources for more singular centers. In parallel, a second database
was prepared, including a set of consumer centres with high thermal demands that
require different treatment (Ministry of Industry, Energy and Tourism of Spain, 2016), as
represented in Table 2.5
On a second step, for facilitating analysis of the energy demand, consumers were
separated in two major categories, as represented in Table 2.6, and described below:
- Direct Demand Centre’s: This include demand centers with particularly relevant
consumption that require individual treatment. In industrial level, they include all

19
the installations that have thermal demands essentially due to productive
processes and not to heating and cooling systems.
- Indirect Demand Centre´s: this refers to those points of the tertiary and industrial
sector not included in the previous section.
Typology Information
Hospital and healthcare centres
Number of Beds
Geographical coordinates
Area
Buildings belonging to the Central Government
Final energy savings
Geographical coordinates
Area
Prisons
Final energy savings
Number of prisoners
Geographical coordinates
Airports
Annual traffic
Altitude
Geographical coordinates
CNAE (National Classification of Economic
Activities) code
Major Industries
Annual CO2 emissions
Cogeneration plant availability
Characteristics of the cogeneration plant
Availability of natural gas
Shopping Malls.
Final energy savings
Area
Geographical coordinates
CNAE (National Classification of Economic
Activities) code
Table 2. 5 Structure of the Demand Centre’s (Ministry of Industry, Energy and Tourism of Spain, 2016)
INDIRECT CATEGORY DIRECT CATEGORY
Demand - Residential Sector
- Indirect Tertiary Sector
Offices Health Sports Shows Leisure and hospitality industry Cultural
- Indirect Industrial Sector
Demand - Tertiary Sector
Hospitals Prisons Institutional buildings Airports Shopping malls
- Industrial Sector
Table 2. 6 Classification of indirect and direct categories (Ministry of Industry, Energy and Tourism of
Spain, 2016)
Additionally, supplementary classifications were made in accordance with climate
variation, establishing three different climatic zones:
- North Atlantic
- Continental
- Mediterranean
20
This additional classification affects the residential and tertiary sector but not the
industrial sector.
To characterize the thermal demand of each of the three defined sectors.
Residential Sector.
Regarding this sector, the Spanish study establishes that the energy demand is
characterized as being very sensitive to the climatic zone where it is located, due to the
heavy influence this has on the overall consumption of dwellings. Another factor is the
type of dwelling mainly regarding the thermal insulation and the surfaces in contact with
the outside.
The characterization of the residential sector in Spain used the SECH-SPAHOUSEC
project (Ministry of Industry, Energy and Tourism of Spain, 2016).
The energy consumption is there divided between:
- Type of dwelling
o One-dwelling building
o Block
- Climate Zone
o North Atlantic
o Continental
o Mediterranean
- Breakdown of energy consumption by household
o Heating
o Hot Water
o Cooling
o Lighting + electricity
o Others (kitchen)
Terciary Sector
This sector is still characterized by a thermal demand highly depending on atmospheric
conditions.
There are centers with a relevant volume of energy consumption that require individual
treatment. Consequently, the following have been considered as direct demand centers
(Ministry of Industry, Energy and Tourism of Spain, 2016):
- Hospitals and health centers
- Buildings belonging to the Central Government (including prisons)
21
- Airports
- Shopping Malls
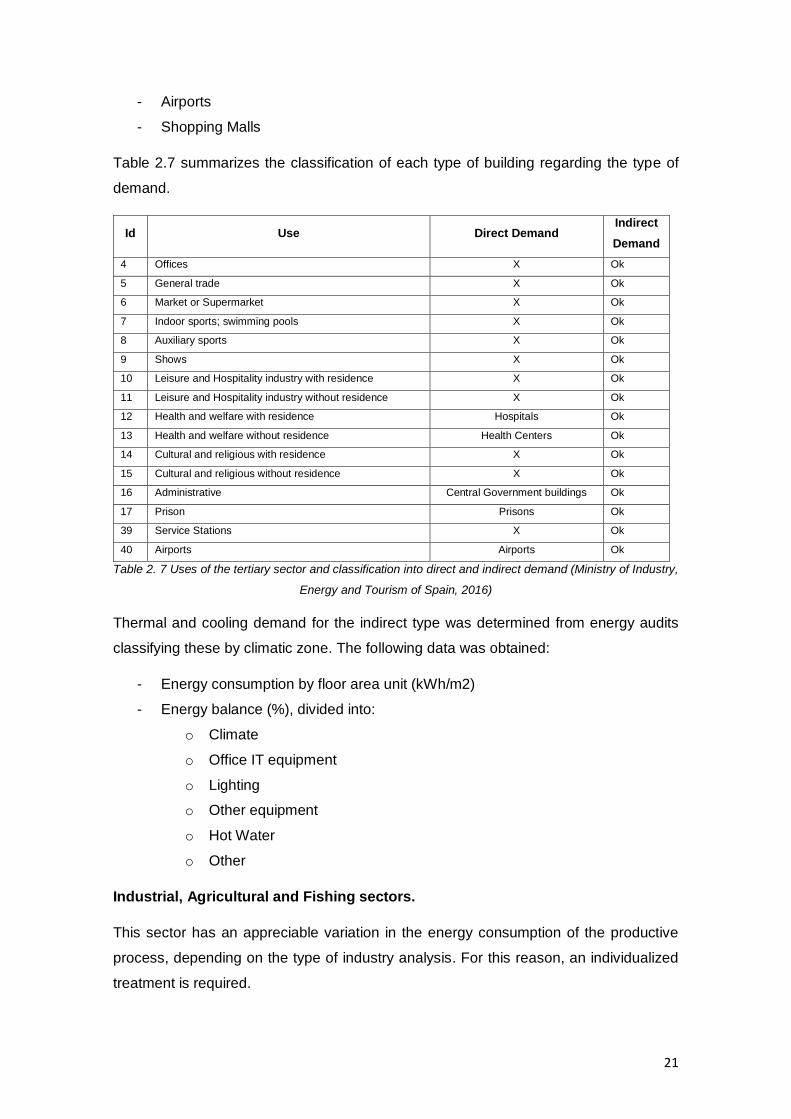
Table 2.7 summarizes the classification of each type of building regarding the type of
demand.
Id Use Direct Demand Indirect
Demand
4 Offices X Ok
5 General trade X Ok
6 Market or Supermarket X Ok
7 Indoor sports; swimming pools X Ok
8 Auxiliary sports X Ok
9 Shows X Ok
10 Leisure and Hospitality industry with residence X Ok
11 Leisure and Hospitality industry without residence X Ok
12 Health and welfare with residence Hospitals Ok
13 Health and welfare without residence Health Centers Ok
14 Cultural and religious with residence X Ok
15 Cultural and religious without residence X Ok
16 Administrative Central Government buildings Ok
17 Prison Prisons Ok
39 Service Stations X Ok
40 Airports Airports Ok
Table 2. 7 Uses of the tertiary sector and classification into direct and indirect demand (Ministry of Industry,
Energy and Tourism of Spain, 2016)
Thermal and cooling demand for the indirect type was determined from energy audits
classifying these by climatic zone. The following data was obtained:
- Energy consumption by floor area unit (kWh/m2)
- Energy balance (%), divided into:
o Climate
o Office IT equipment
o Lighting
o Other equipment
o Hot Water
o Other
Industrial, Agricultural and Fishing sectors.
This sector has an appreciable variation in the energy consumption of the productive
process, depending on the type of industry analysis. For this reason, an individualized
treatment is required.
22
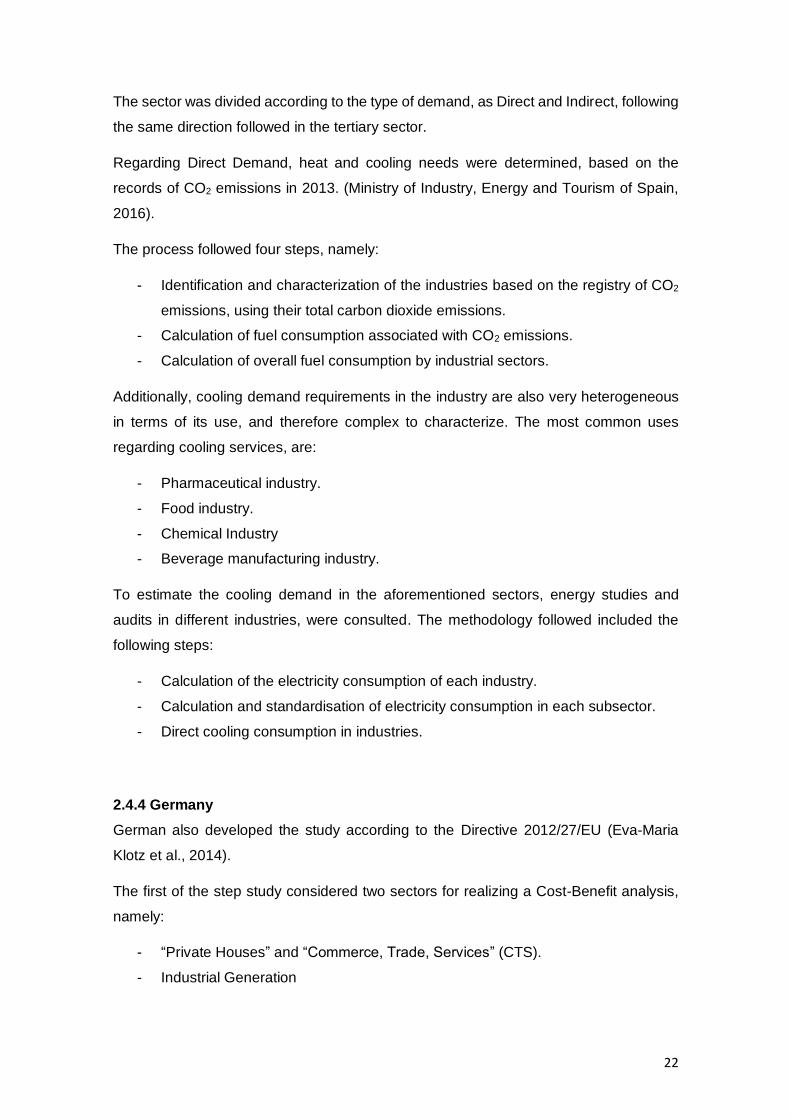
The sector was divided according to the type of demand, as Direct and Indirect, following
the same direction followed in the tertiary sector.
Regarding Direct Demand, heat and cooling needs were determined, based on the
records of CO2 emissions in 2013. (Ministry of Industry, Energy and Tourism of Spain,
2016).
The process followed four steps, namely:
- Identification and characterization of the industries based on the registry of CO2
emissions, using their total carbon dioxide emissions.
- Calculation of fuel consumption associated with CO2 emissions.
- Calculation of overall fuel consumption by industrial sectors.
Additionally, cooling demand requirements in the industry are also very heterogeneous
in terms of its use, and therefore complex to characterize. The most common uses
regarding cooling services, are:
- Pharmaceutical industry.
- Food industry.
- Chemical Industry
- Beverage manufacturing industry.
To estimate the cooling demand in the aforementioned sectors, energy studies and
audits in different industries, were consulted. The methodology followed included the
following steps:
- Calculation of the electricity consumption of each industry.
- Calculation and standardisation of electricity consumption in each subsector.
- Direct cooling consumption in industries.
2.4.4 Germany
German also developed the study according to the Directive 2012/27/EU (Eva-Maria
Klotz et al., 2014).
The first of the step study considered two sectors for realizing a Cost-Benefit analysis,
namely:
- “Private Houses” and “Commerce, Trade, Services” (CTS).
- Industrial Generation

23
A Second step considered for both cases, the energy prices reference prognosis
conditions 2014 - 2050. It is assuming that the law is the same in the period 2014 - 2050.
A third step considered uniform assumptions for calculation in both sectors, namely
- The applicable prices for varied sizes of cogeneration equipment were based of
the 2012 Cogeneration act, and can be found in Table 2.8.
- Finally, the calculation was based on 14 typical CHPP and their capacity
parameters, costs and revenue, as seen in Table 2.9.
Plants entitled to a surcharge
By Capacity Cogeneration euro charge
Payment Period
Small CHPP up to and
including 50k𝑊𝑒𝑙 5.41 cents/kWh
10 years or 30000 hours’ full load operation (FLO); fixed payment possible for plants < 2kW
Small plants >50k𝑊𝑒𝑙 50-250k𝑊𝑒𝑙 4.00 cents/kWh
30000h FLO >250k𝑊𝑒𝑙 2.40 cents/kWh
New high-efficiency plants
<50k𝑊𝑒𝑙 5.41 cents/kWh 30000h FLO (for plants in emissions trading, the surcharge rises as of 1 January 2013 by 0.3 cents/kWh)
50-250k𝑊𝑒𝑙 4.00 cents/kWh
250k𝑊𝑒𝑙 – 2M𝑊𝑒𝑙 2.40 cents/kWh
>2M𝑊𝑒𝑙 1.80 cents/kWh
Modernised/ retrofitted high- efficiency plants
(>2M𝑊𝑒𝑙)
As for new high efficiency plants
As for new high-efficiency plants
Max. 30000h FLO
(plants <50k𝑊𝑒𝑙: max. 10 years or 30000h FLO)
Table 2. 8 2012 Cogeneration Act surcharge rates (Eva-Maria Klotz et al., 2014)
Private Households and CTS
This analysis considered individual properties in the private household and the CTS
sector to compare the economic viability of various heat supply options, based on the
net present value of typical applications (Eva-Maria Klotz et al., 2014).
The assumptions made, included:
- Heat pumps are considered only in new buildings.
- In the residential sector, four single-houses, and eight apartment blocks, was
selected as a standard sample.
- Centralized building heating systems (Block Heat and Power Plant (BHPP)) are
not considered for private households in apartment blocks.
- In the CTS sector, the economic viability of BHPP depends enormously on the
specific building and the perspective taken.
- For the case of BHPP five parameters were calculated:
o A cogeneration Index, qualifying the solution (power production/heat
production).
o Electrical efficiency rating.
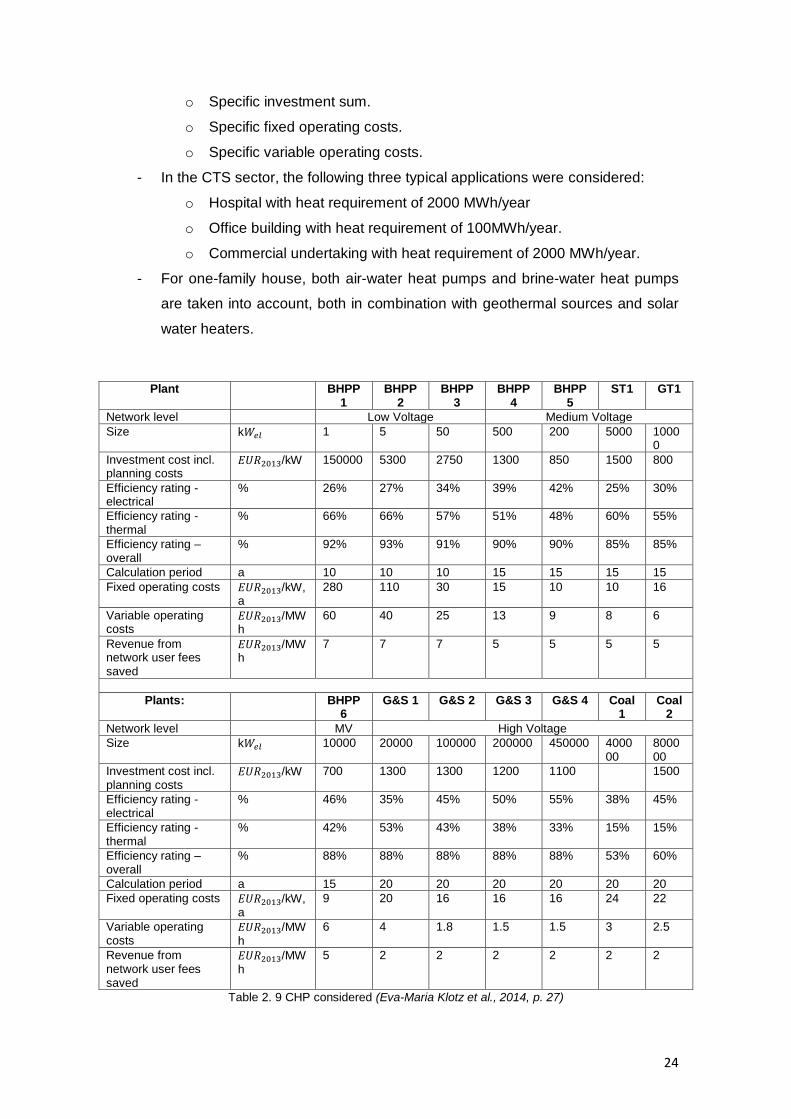
24
o Specific investment sum.
o Specific fixed operating costs.
o Specific variable operating costs.
- In the CTS sector, the following three typical applications were considered:
o Hospital with heat requirement of 2000 MWh/year
o Office building with heat requirement of 100MWh/year.
o Commercial undertaking with heat requirement of 2000 MWh/year.
- For one-family house, both air-water heat pumps and brine-water heat pumps
are taken into account, both in combination with geothermal sources and solar
water heaters.
Plant BHPP 1
BHPP 2
BHPP 3
BHPP 4
BHPP 5
ST1 GT1
Network level Low Voltage Medium Voltage
Size k𝑊𝑒𝑙 1 5 50 500 200 5000 10000
Investment cost incl. planning costs
𝐸𝑈𝑅2013/kW 150000 5300 2750 1300 850 1500 800
Efficiency rating - electrical
% 26% 27% 34% 39% 42% 25% 30%
Efficiency rating - thermal
% 66% 66% 57% 51% 48% 60% 55%
Efficiency rating – overall
% 92% 93% 91% 90% 90% 85% 85%
Calculation period a 10 10 10 15 15 15 15
Fixed operating costs 𝐸𝑈𝑅2013/kW, a
280 110 30 15 10 10 16
Variable operating costs
𝐸𝑈𝑅2013/MWh
60 40 25 13 9 8 6
Revenue from network user fees saved
𝐸𝑈𝑅2013/MWh
7 7 7 5 5 5 5
Plants: BHPP 6
G&S 1 G&S 2 G&S 3 G&S 4 Coal 1
Coal 2
Network level MV High Voltage
Size k𝑊𝑒𝑙 10000 20000 100000 200000 450000 400000
800000
Investment cost incl. planning costs
𝐸𝑈𝑅2013/kW 700 1300 1300 1200 1100 1500
Efficiency rating - electrical
% 46% 35% 45% 50% 55% 38% 45%
Efficiency rating - thermal
% 42% 53% 43% 38% 33% 15% 15%
Efficiency rating – overall
% 88% 88% 88% 88% 88% 53% 60%
Calculation period a 15 20 20 20 20 20 20
Fixed operating costs 𝐸𝑈𝑅2013/kW, a
9 20 16 16 16 24 22
Variable operating costs
𝐸𝑈𝑅2013/MWh
6 4 1.8 1.5 1.5 3 2.5
Revenue from network user fees saved
𝐸𝑈𝑅2013/MWh
5 2 2 2 2 2 2
Table 2. 9 CHP considered (Eva-Maria Klotz et al., 2014, p. 27)
25
Preliminary conclusions showed that
- For BHPP applications, large apartment block are large preferable to small
residential buildings.
- In the CTS, the economic viability of BHPP depends enormously on the specific
building.
Industrial Cogeneration
For industrial case in order to determine the economic viability of private generation in a
CHPP, the electricity production costs were compared to the costs of purchasing
electricity from third parties, which depend on the quantity purchased, the voltage level
and the energy intensity, as well as the negotiating skills of the individual undertaking,
which may vary within very wide margins. (Eva-Maria Klotz et al., 2014).
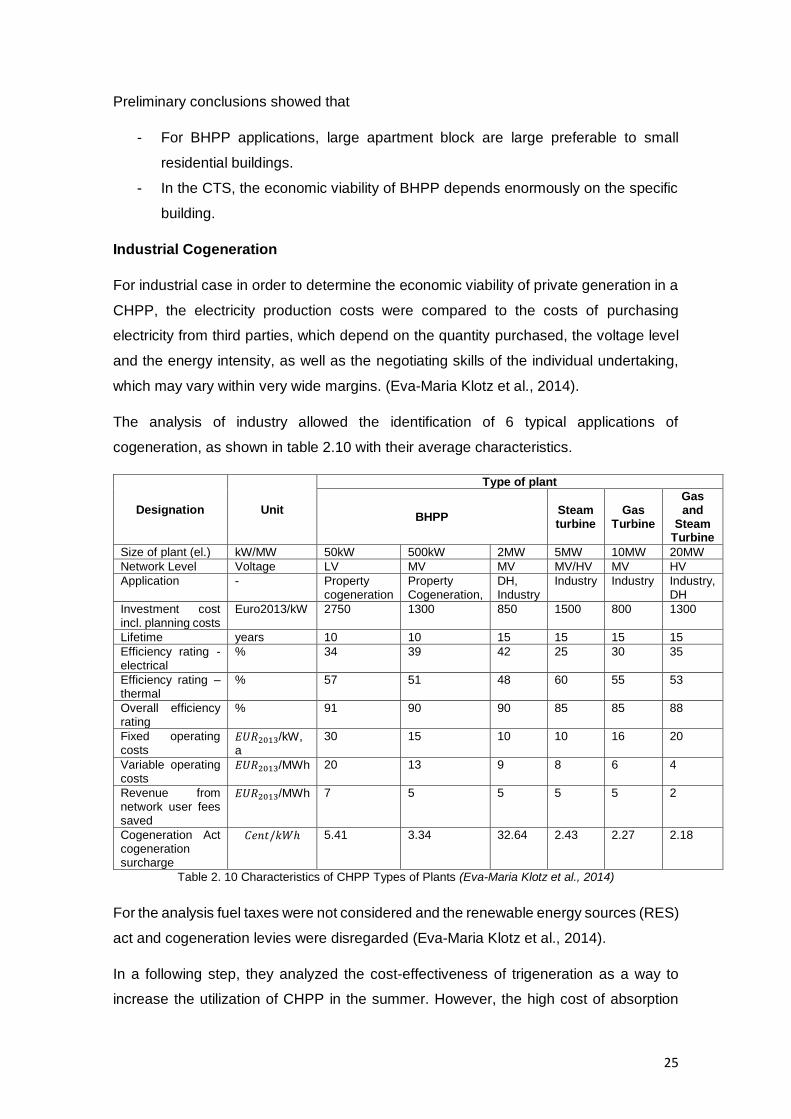
The analysis of industry allowed the identification of 6 typical applications of
cogeneration, as shown in table 2.10 with their average characteristics.
Designation Unit
Type of plant
BHPP Steam turbine
Gas Turbine
Gas and
Steam Turbine
Size of plant (el.) kW/MW 50kW 500kW 2MW 5MW 10MW 20MW
Network Level Voltage LV MV MV MV/HV MV HV
Application - Property cogeneration
Property Cogeneration,
DH, Industry
Industry Industry Industry, DH
Investment cost incl. planning costs
Euro2013/kW 2750 1300 850 1500 800 1300
Lifetime years 10 10 15 15 15 15
Efficiency rating - electrical
% 34 39 42 25 30 35
Efficiency rating – thermal
% 57 51 48 60 55 53
Overall efficiency rating
% 91 90 90 85 85 88
Fixed operating costs
𝐸𝑈𝑅2013/kW, a
30 15 10 10 16 20
Variable operating costs
𝐸𝑈𝑅2013/MWh 20 13 9 8 6 4
Revenue from network user fees saved
𝐸𝑈𝑅2013/MWh 7 5 5 5 5 2
Cogeneration Act cogeneration surcharge
𝐶𝑒𝑛𝑡/𝑘𝑊ℎ 5.41 3.34 32.64 2.43 2.27 2.18
Table 2. 10 Characteristics of CHPP Types of Plants (Eva-Maria Klotz et al., 2014)
For the analysis fuel taxes were not considered and the renewable energy sources (RES)
act and cogeneration levies were disregarded (Eva-Maria Klotz et al., 2014).
In a following step, they analyzed the cost-effectiveness of trigeneration as a way to
increase the utilization of CHPP in the summer. However, the high cost of absorption
26
chiller compared with conventional compression chiller, makes this option only viable in
very specific situations, namely in the chemical industry or food industry.
The economic viability of Organic Rankine Cycle (ORC) plants was also assessed. This
thermodynamic cycle uses organic substances with a low boiling point as its working
thermofluid. The use of this fluid allows the use of heat sources between 90ºC and
450ºC, ORC use heat sources, namely ground heat, waste heat from use of biomass,
industrial waste heat, etc. (Eva-Maria Klotz et al., 2014).
Analysis of the Potential
In the case of Private Households and CTS, 41 representative model towns were used,
extrapolating the results for comparable towns (Eva-Maria Klotz et al., 2014). A
distinction was made when determining potential between:
- The potential of settlement cogeneration (urban heating)
- The potential of property cogeneration.
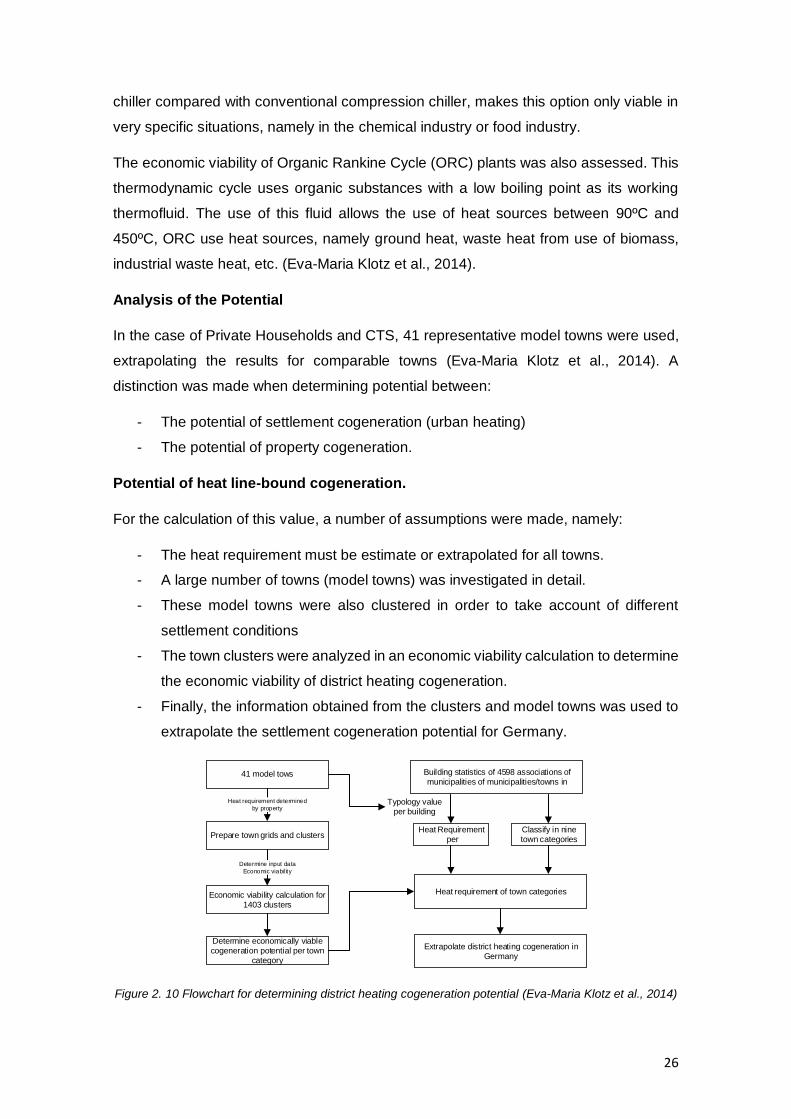
Potential of heat line-bound cogeneration.
For the calculation of this value, a number of assumptions were made, namely:
- The heat requirement must be estimate or extrapolated for all towns.
- A large number of towns (model towns) was investigated in detail.
- These model towns were also clustered in order to take account of different
settlement conditions
- The town clusters were analyzed in an economic viability calculation to determine
the economic viability of district heating cogeneration.
- Finally, the information obtained from the clusters and model towns was used to
extrapolate the settlement cogeneration potential for Germany.
41 model tows
Determine economically viable cogeneration potential per town
category
Prepare town grids and clusters
Economic viability calculation for 1403 clusters
Heat requirement determined
by property
Determine input data
Economic viability
Building statistics of 4598 associations of municipalities of municipalities/towns in
Heat Requirement per
Classify in nine town categories
Heat requirement of town categories
Extrapolate district heating cogeneration in Germany
Typology value per building
Figure 2. 10 Flowchart for determining district heating cogeneration potential (Eva-Maria Klotz et al., 2014)

27
In base of the number of inhabitants for km2 of settlement area, nine categories were
defined as shown in Table 2.11.
Category Town Categories Number Old Federal States:
I Municipalities with more than 350 000 inhabitants 14
II Municipalities with 150 001 to 350 000 inhabitants 30
III Municipalities with 80 001 to 150 000 inhabitants 48
IV Municipalities with 50 001 to 80 000 inhabitants 79
V Municipalities with 20 000 to 50 000 inhabitants 476
VI Municipalities with 20 000 to 80 000 inhabitants in the periphery of a city. 22
Total Old Federal States: 669
New Federal States:
VII Municipalities with more than 80 000 inhabitants 14
VIII Municipalities with 20 000 to 80 000 inhabitants 97
Total new federal states: 111
Total in Germany: 780
Other:
Municipalities with fewer than 20 000 inhabitants 3818
Table 2. 11 Town Categories (Eva-Maria Klotz et al., 2014, p. 58)
The study of economic viability has been performed for each of the 1403 existing clusters
in accordance with the following conditions:
- The distribution costs are divided in practice between the energy supply
companies and customers, such that the customers pay an additional connection
cost.
- Competitive distribution heat price is not differentiated by region for this
investigation, in the case of buildings that have an annual heat requirement of
20-400GWh/y, but in the smaller buildings, the initial investment is bigger than in
large buildings, in this the price of fuel are more relevant.
- Specific production cost depends primary on the CHPP used but also on
insurance and administrative costs, distribution costs, costs of crowding out
natural gas
Potential Cogeneration.
Based on the results of the model cost-benefit analysis is determinate the settlement
cogeneration potential analysis.
The approach used the following operations, carried out to calculate a national potential
(Eva-Maria Klotz et al., 2014), namely:
- The numerical data for economic viability testing of a property cogeneration
solution, were formed and prepared based on town clustering and the results of
the district heating cogeneration potential.
- Eight types of building/applications were considered.

28
- A full cost comparison based on the results of the cost-benefit analysis, order to
determine the lowest heat requirement for each type of building.
- An economic viability test was carried out for each building.
- The size of the CHPP was calculated to obtain the cogeneration index, and the
quantities of cogenerated heat and power were than determined for each
property.
- The results were used to determine the potential of nine town categories.
Potential of Industrial Cogeneration, including use of waste heat.
This potential was determined for two cases. First a possible reference development was
outlined (baseline scenario) and then a policy-driving variation was considered.
The baseline scenario essentially assumed that the basic conditions that apply at the
date of the reported work will continue to apply.
According to (Eva-Maria Klotz et al., 2014) the potential is determined from:
- An analysis of heat requirement up to 300ºC of the individual branches in 2012
which could theoretically be satisfied by cogeneration heat.
- An estimate of its development in the following decades.
- Assumptions on the technology used and their specific power as well as from the
heat production conditions of the resultant cogenerated power production.
2.2.5 Comparison of the Presented Methodologies.
The four, methodologies reviewed in the previous sections followed different strategies,
although aiming essentially the same output. Their differences come in part from the use
of data sets of different natures, but a summary of their advantages and disadvantages
is presented in Table 2.12.
2.3 Development of Cogeneration
During the last 25 years cogeneration experimented an important development
worldwide, mainly due to the growing price of petroleum and numerous incentives
promoted by the governments. These factors make cogeneration economically attractive
for private investments.
Cogeneration contributes with a significant share of the global electric energy. An
example of this are the USA represents around 8% of the total generated energy (Anne
Hampson et al., 2016).

29
Spain had a considerable increase in cogeneration between 1993 and 2002, mainly due
to economic incentives for cogeneration in the UE, and the high price of fossil fuels
(Ministry of Industry, Energy and Tourism of Spain, 2016).
Considering the continuous increase in fuel prices, and the requirement to elevate
general efficiency in the industry to reduce greenhouse emissions: cogeneration will be
and interesting option in the future
Figure 2. 11 Annual and cumulated installed power of cogeneration in Spain (Ministry of Industry, Energy and Tourism of Spain, 2016)
COUNTRY STRENGTHS WEAKNESSES
USA Considered three different markets for CHP, allowing to a gathering of more exhaustive information
Requires a considerable database to evaluate potential.
PORTUGAL Agriculture and fishing industries were considered as an isolated sector.
The cogeneration potential is restricted by the European directive definitions. The total reliance on external information limits the accuracy of the study.
SPAIN A detailed work to obtain information was carried out
The cogeneration potential is restricted by the European directive definitions. The detail level in the study requires high resources and time of development.
GERMANY The use of economic indicators to evaluate cogeneration produce realistic results.
The cogeneration potential is restricted by the European directive definitions. Significant requirements regarding historic data.
Table 2. 12 Comparative Table
30
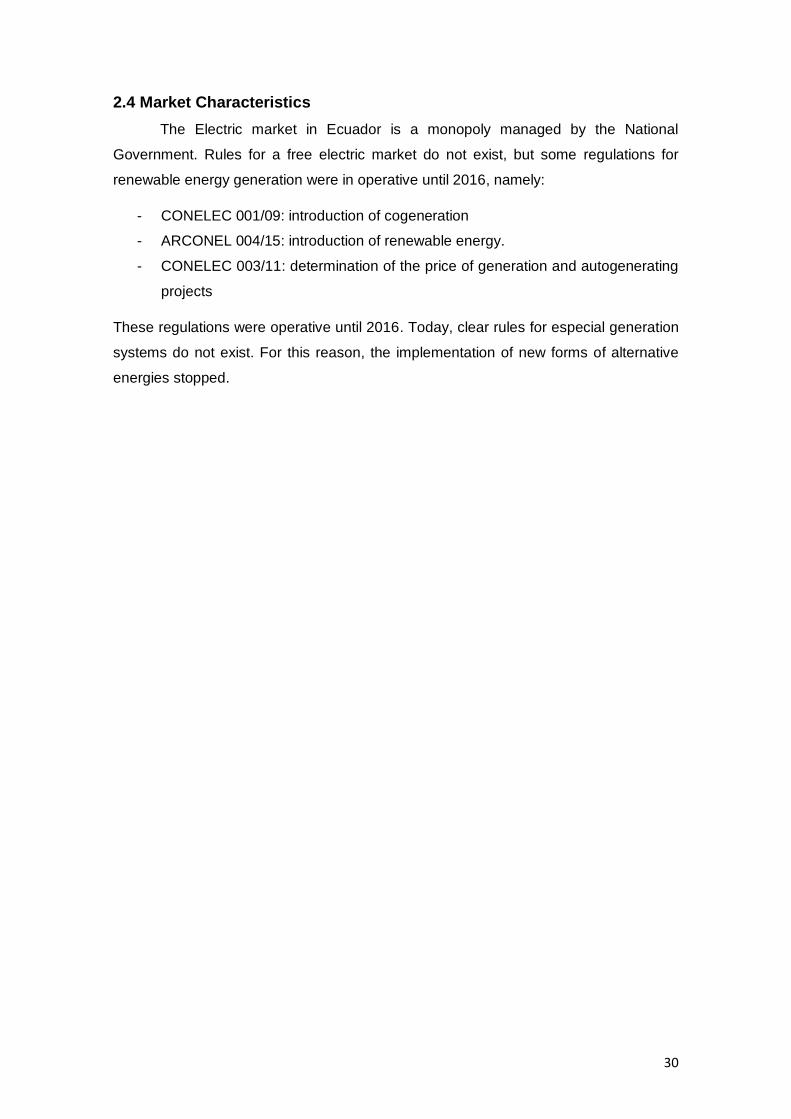
2.4 Market Characteristics
The Electric market in Ecuador is a monopoly managed by the National
Government. Rules for a free electric market do not exist, but some regulations for
renewable energy generation were in operative until 2016, namely:
- CONELEC 001/09: introduction of cogeneration
- ARCONEL 004/15: introduction of renewable energy.
- CONELEC 003/11: determination of the price of generation and autogenerating
projects
These regulations were operative until 2016. Today, clear rules for especial generation
systems do not exist. For this reason, the implementation of new forms of alternative
energies stopped.
31
3. METHODOLOGY
3.1 Objectives
The main objective of this chapter is to determine the cogeneration potential in
the industrial sector. A technical and economic characterization is made, considering
there are no regulations or laws available that will allow preferential market prices.
3.2 Ecuador Energy Outlook.
Ecuador is located in northeast South America. Its economy mainly depends on
oil exploitation, followed by the services sector. There is also a small contribution from
its industrial sector, focused primarily on meeting the basic needs of the population.
Although oil exploitation remains Ecuador’s main economic activity, the country lacks the
necessary industrial infrastructures needed to elaborate products from this raw material.
Additional oil refineries have not been built accordingly, to meet the needs of the country,
and so as the difference between the internal consumption of fuel and production
increases, the government is forced to import the growing difference.
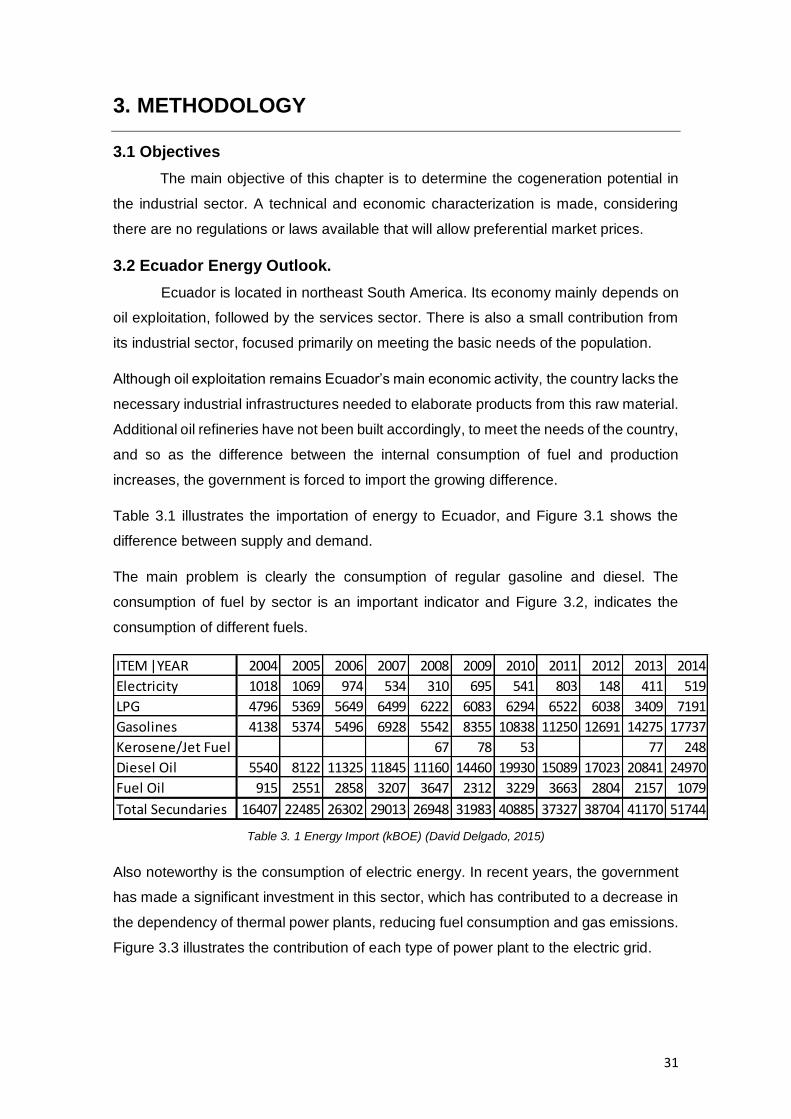
Table 3.1 illustrates the importation of energy to Ecuador, and Figure 3.1 shows the
difference between supply and demand.
The main problem is clearly the consumption of regular gasoline and diesel. The
consumption of fuel by sector is an important indicator and Figure 3.2, indicates the
consumption of different fuels.
ITEM |YEAR 2004 2005 2006 2007 2008 2009 2010 2011 2012 2013 2014
Electricity 1018 1069 974 534 310 695 541 803 148 411 519
LPG 4796 5369 5649 6499 6222 6083 6294 6522 6038 3409 7191
Gasolines 4138 5374 5496 6928 5542 8355 10838 11250 12691 14275 17737
Kerosene/Jet Fuel 67 78 53 77 248
Diesel Oil 5540 8122 11325 11845 11160 14460 19930 15089 17023 20841 24970
Fuel Oil 915 2551 2858 3207 3647 2312 3229 3663 2804 2157 1079
Total Secundaries 16407 22485 26302 29013 26948 31983 40885 37327 38704 41170 51744
Table 3. 1 Energy Import (kBOE) (David Delgado, 2015)
Also noteworthy is the consumption of electric energy. In recent years, the government
has made a significant investment in this sector, which has contributed to a decrease in
the dependency of thermal power plants, reducing fuel consumption and gas emissions.
Figure 3.3 illustrates the contribution of each type of power plant to the electric grid.
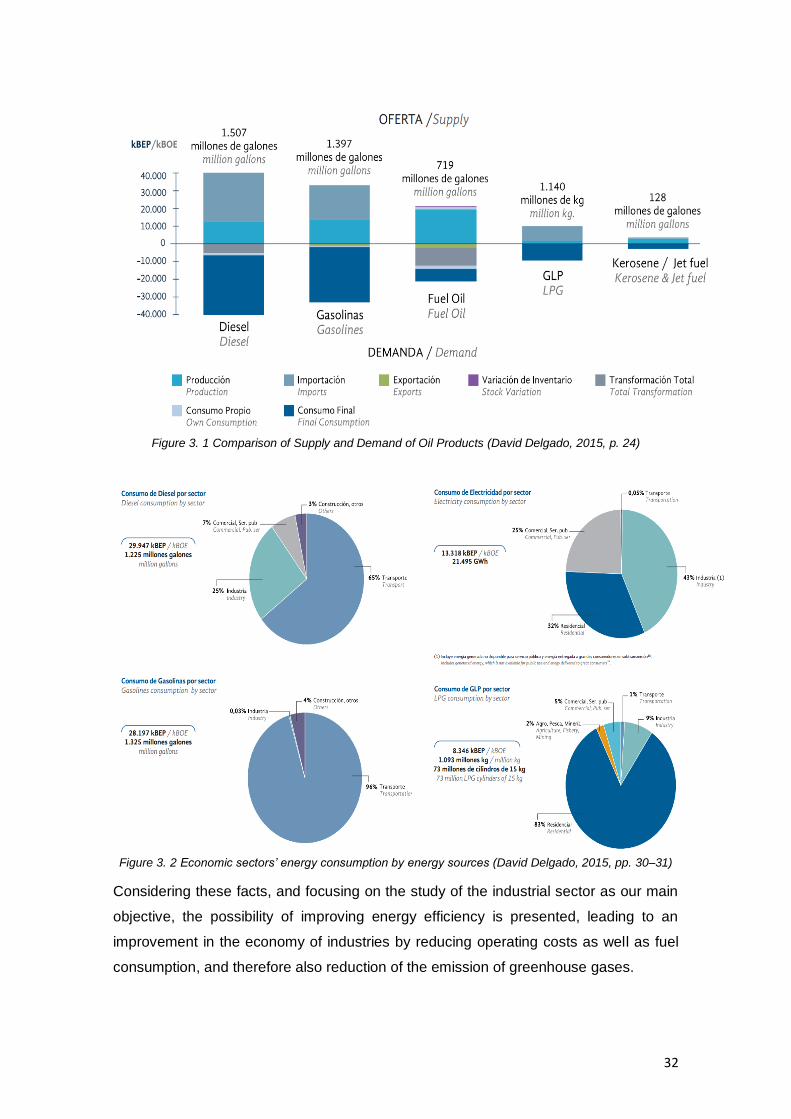
32
Figure 3. 1 Comparison of Supply and Demand of Oil Products (David Delgado, 2015, p. 24)
Figure 3. 2 Economic sectors’ energy consumption by energy sources (David Delgado, 2015, pp. 30–31)
Considering these facts, and focusing on the study of the industrial sector as our main
objective, the possibility of improving energy efficiency is presented, leading to an
improvement in the economy of industries by reducing operating costs as well as fuel
consumption, and therefore also reduction of the emission of greenhouse gases.

33
Figure 3. 3 Structure of Electricity supply (David Delgado, 2015, p. 69)
3.3 Concepts and Data Requirements
The “National Institute of Statistics and Census” (INEC) 2011 database was used
as a starting point for this chapter. The database is provided in the “International
Standard Industrial Classification of all Economy Activities” (ISIC) Rev. 4 format of the
UN, which is used to catalog and divide economic activities. ISIC ranks in 21 sections
according to the economic activity of the industry which is shown in Table 3.2.
SECTION DIVISIONS DESCRIPTION
A 01-09 Agriculture, forestry and fishing
B 05-09 Mining and quarrying
C 10-33 Manufacturing
D 35 Electricity, gas, steam and air conditioning supply
E 36-39 Water supply; sewerage, waste management and remediation activities
F 41-43 Construction
G 45-47 Wholesale and retail trade; repair of motor vehicles and motorcycles
H 49-53 Transportation and storage
I 55-56 Accommodation and food service activities
J 58-63 Information and communication
K 64-66 Financial and insurance activities
L 68 Real estate activities
M 69-75 Professional, scientific and technical activities
N 77-82 Administrative and support service activities
O 84 Public Administration and defense; compulsory social security
P 85 Education
Q 86-88 Human health and social work activities
R 90-93 Art, entertainment and recreation
S 94-96 Other service activities
T 97-98 Activities of households as employers; undifferentiated goods-and services-
producing activities of households for own use
U 99 Activities of extraterritorial organizations and bodies
Table 3. 2 Individual categories of ISIC (United Nations, 2008, p. 43)
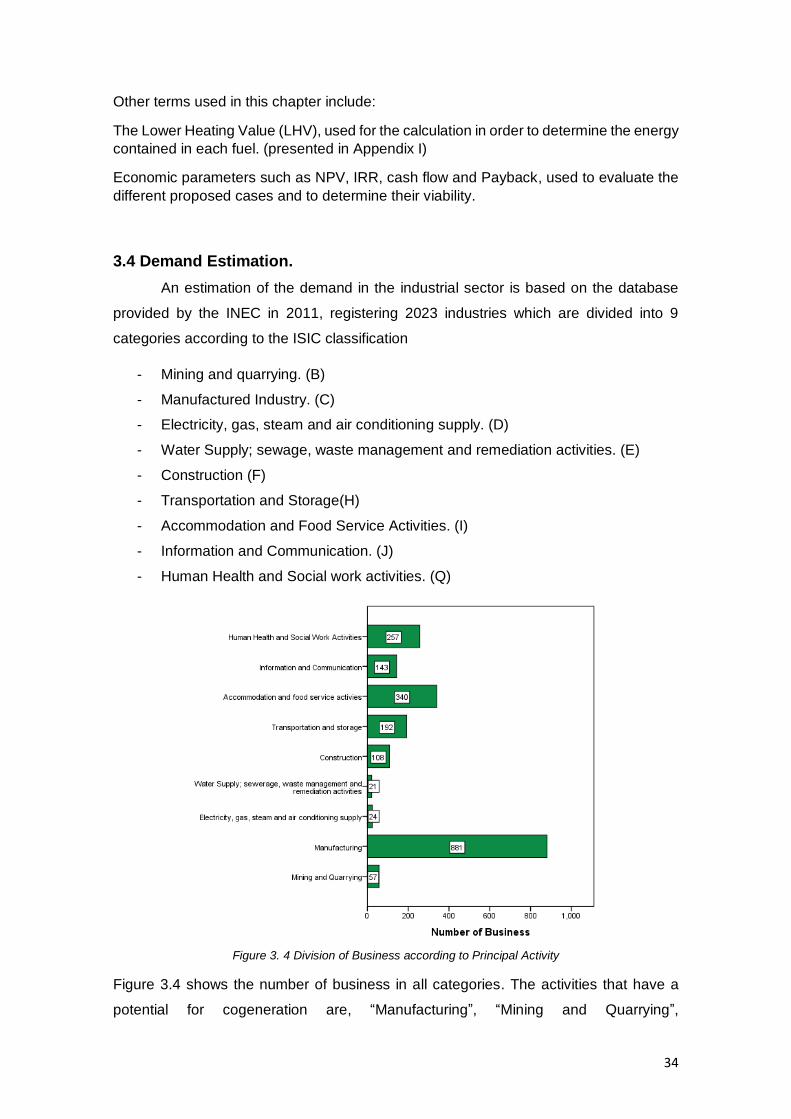
34
Other terms used in this chapter include:
The Lower Heating Value (LHV), used for the calculation in order to determine the energy
contained in each fuel. (presented in Appendix I)
Economic parameters such as NPV, IRR, cash flow and Payback, used to evaluate the
different proposed cases and to determine their viability.
3.4 Demand Estimation.
An estimation of the demand in the industrial sector is based on the database
provided by the INEC in 2011, registering 2023 industries which are divided into 9
categories according to the ISIC classification
- Mining and quarrying. (B)
- Manufactured Industry. (C)
- Electricity, gas, steam and air conditioning supply. (D)
- Water Supply; sewage, waste management and remediation activities. (E)
- Construction (F)
- Transportation and Storage(H)
- Accommodation and Food Service Activities. (I)
- Information and Communication. (J)
- Human Health and Social work activities. (Q)
Figure 3. 4 Division of Business according to Principal Activity
Figure 3.4 shows the number of business in all categories. The activities that have a
potential for cogeneration are, “Manufacturing”, “Mining and Quarrying”,
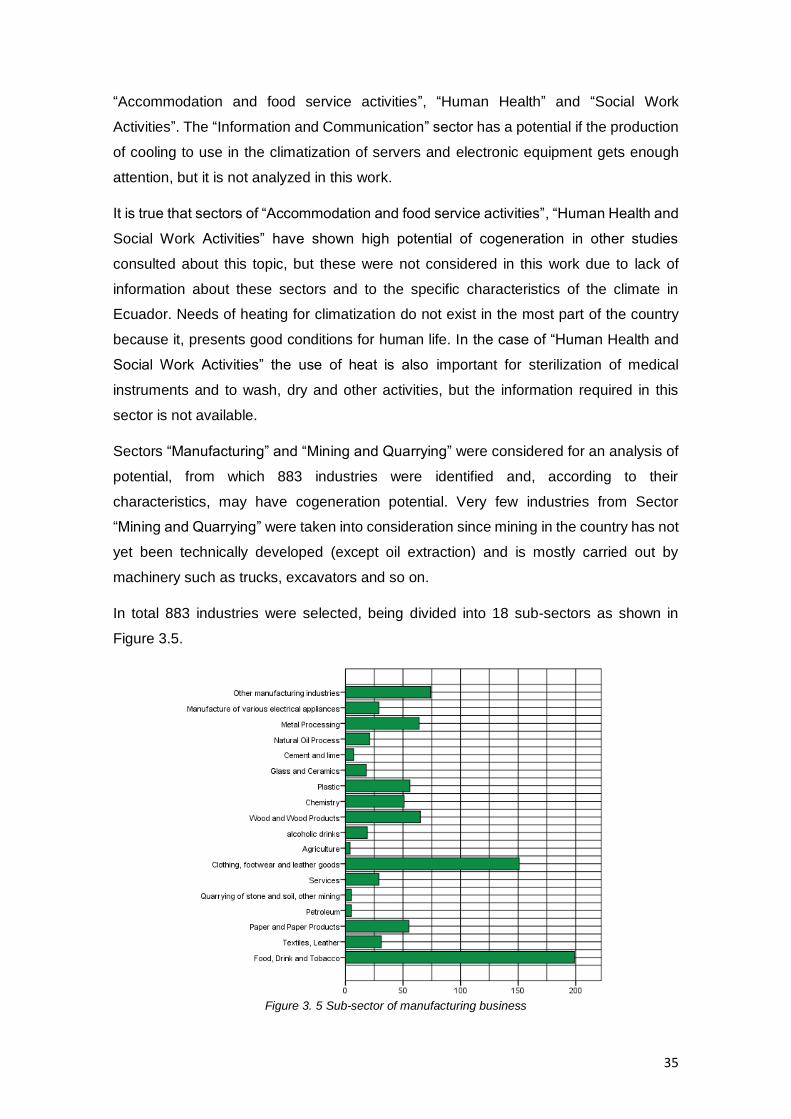
35
“Accommodation and food service activities”, “Human Health” and “Social Work
Activities”. The “Information and Communication” sector has a potential if the production
of cooling to use in the climatization of servers and electronic equipment gets enough
attention, but it is not analyzed in this work.
It is true that sectors of “Accommodation and food service activities”, “Human Health and
Social Work Activities” have shown high potential of cogeneration in other studies
consulted about this topic, but these were not considered in this work due to lack of
information about these sectors and to the specific characteristics of the climate in
Ecuador. Needs of heating for climatization do not exist in the most part of the country
because it, presents good conditions for human life. In the case of “Human Health and
Social Work Activities” the use of heat is also important for sterilization of medical
instruments and to wash, dry and other activities, but the information required in this
sector is not available.
Sectors “Manufacturing” and “Mining and Quarrying” were considered for an analysis of
potential, from which 883 industries were identified and, according to their
characteristics, may have cogeneration potential. Very few industries from Sector
“Mining and Quarrying” were taken into consideration since mining in the country has not
yet been technically developed (except oil extraction) and is mostly carried out by
machinery such as trucks, excavators and so on.
In total 883 industries were selected, being divided into 18 sub-sectors as shown in
Figure 3.5.
Figure 3. 5 Sub-sector of manufacturing business
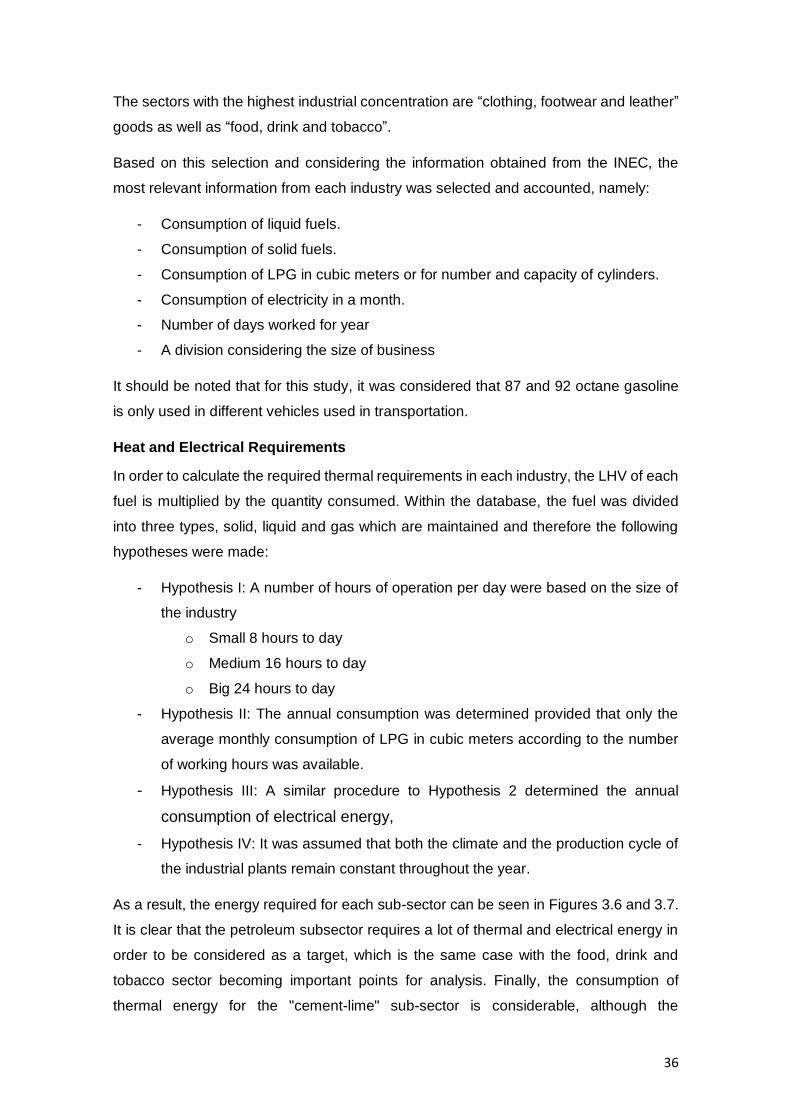
36
The sectors with the highest industrial concentration are “clothing, footwear and leather”
goods as well as “food, drink and tobacco”.
Based on this selection and considering the information obtained from the INEC, the
most relevant information from each industry was selected and accounted, namely:
- Consumption of liquid fuels.
- Consumption of solid fuels.
- Consumption of LPG in cubic meters or for number and capacity of cylinders.
- Consumption of electricity in a month.
- Number of days worked for year
- A division considering the size of business
It should be noted that for this study, it was considered that 87 and 92 octane gasoline
is only used in different vehicles used in transportation.
Heat and Electrical Requirements
In order to calculate the required thermal requirements in each industry, the LHV of each
fuel is multiplied by the quantity consumed. Within the database, the fuel was divided
into three types, solid, liquid and gas which are maintained and therefore the following
hypotheses were made:
- Hypothesis I: A number of hours of operation per day were based on the size of
the industry
o Small 8 hours to day
o Medium 16 hours to day
o Big 24 hours to day
- Hypothesis II: The annual consumption was determined provided that only the
average monthly consumption of LPG in cubic meters according to the number
of working hours was available.
- Hypothesis III: A similar procedure to Hypothesis 2 determined the annual
consumption of electrical energy,
- Hypothesis IV: It was assumed that both the climate and the production cycle of
the industrial plants remain constant throughout the year.
As a result, the energy required for each sub-sector can be seen in Figures 3.6 and 3.7.
It is clear that the petroleum subsector requires a lot of thermal and electrical energy in
order to be considered as a target, which is the same case with the food, drink and
tobacco sector becoming important points for analysis. Finally, the consumption of
thermal energy for the "cement-lime" sub-sector is considerable, although the
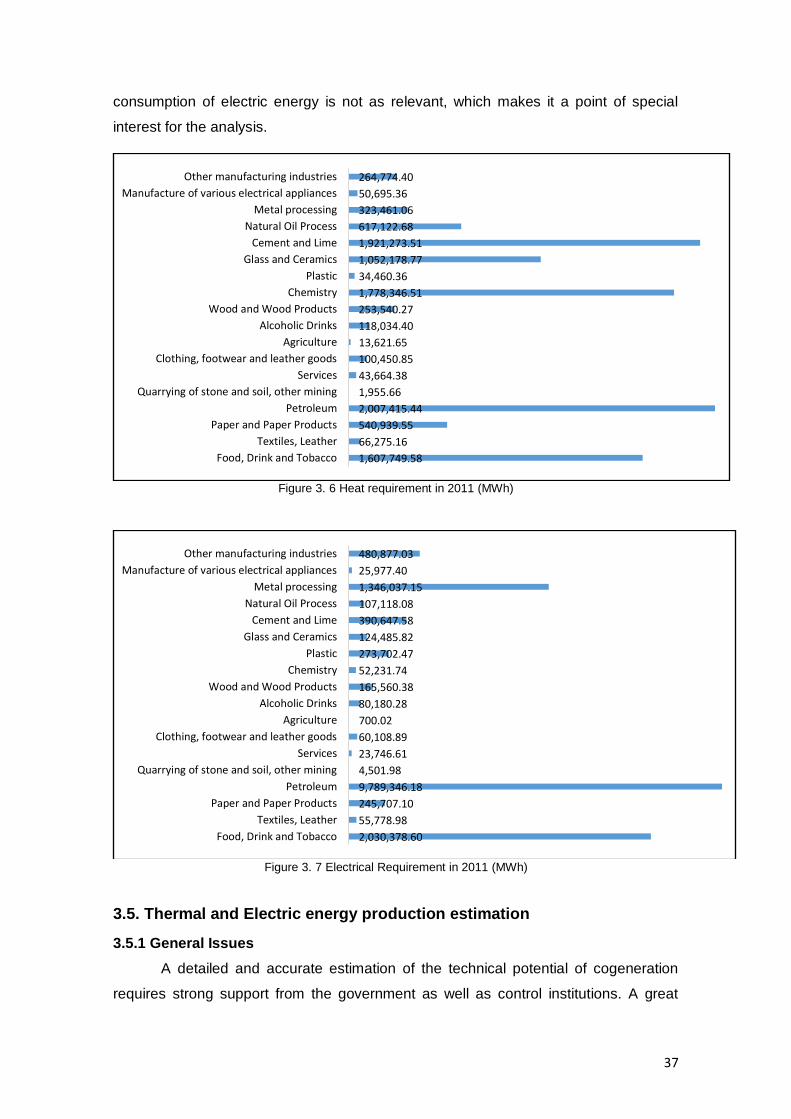
37
consumption of electric energy is not as relevant, which makes it a point of special
interest for the analysis.
Figure 3. 6 Heat requirement in 2011 (MWh)
Figure 3. 7 Electrical Requirement in 2011 (MWh)
3.5. Thermal and Electric energy production estimation
3.5.1 General Issues
A detailed and accurate estimation of the technical potential of cogeneration
requires strong support from the government as well as control institutions. A great
1,607,749.58
66,275.16
540,939.55
2,007,415.44
1,955.66
43,664.38
100,450.85
13,621.65
118,034.40
253,540.27
1,778,346.51
34,460.36
1,052,178.77
1,921,273.51
617,122.68
323,461.06
50,695.36
264,774.40
Food, Drink and Tobacco
Textiles, Leather
Paper and Paper Products
Petroleum
Quarrying of stone and soil, other mining
Services
Clothing, footwear and leather goods
Agriculture
Alcoholic Drinks
Wood and Wood Products
Chemistry
Plastic
Glass and Ceramics
Cement and Lime
Natural Oil Process
Metal processing
Manufacture of various electrical appliances
Other manufacturing industries
2,030,378.60
55,778.98
245,707.10
9,789,346.18
4,501.98
23,746.61
60,108.89
700.02
80,180.28
165,560.38
52,231.74
273,702.47
124,485.82
390,647.58
107,118.08
1,346,037.15
25,977.40
480,877.03
Food, Drink and Tobacco
Textiles, Leather
Paper and Paper Products
Petroleum
Quarrying of stone and soil, other mining
Services
Clothing, footwear and leather goods
Agriculture
Alcoholic Drinks
Wood and Wood Products
Chemistry
Plastic
Glass and Ceramics
Cement and Lime
Natural Oil Process
Metal processing
Manufacture of various electrical appliances
Other manufacturing industries

38
amount of time and financial support in order to cover the logistics necessary to obtain
the data is also unavoidable.
Contrarily to situations in other countries, cogeneration in Ecuador has yet to be
developed, so there is no reference database to solidify an accurate study.
Based on this situation, it has become necessary to research all existing literature on the
topic. A study conducted in Germany in 2014 (Eva-Maria Klotz et al., 2014, p. 92) proved
to be helpful in determining the quantity of useful thermal energy (<300 ° C) for each
sub-sector.
#Sub-sector <300ºC
1 Food, Drink and Tobacco 100.00%
2 Textiles, Leather 40.00%
3 Paper and Paper Products 100.00%
4 Petroleum 40.00%
5 Quarrying of stone and soil, other mining 98.00%
6 Services 0.00%
7 Clothing, footwear and leather goods 40.00%
8 Agriculture 4.66%
9 Alcoholic Drinks 40.00%
10 Wood and Wood Products 40.00%
11 Chemistry 40.00%
12 Plastic 100.00%
13 Glass and Ceramics 7.00%
14 Cement and Lime 90.00%
15 Natural Oil Process 40.00%
16 Metal processing 17.00%
17 Manufacture of various electrical appliances 66.00%
18 Other manufacturing industries 50.00%
Table 3. 3 Percentage to Heat used for Cogeneration (Eva-Maria Klotz et al., 2014), (ISR-UC and INESC Coimbra, 2016)
This is shown in table 3.3 which illustrates the different values and, according to the
German study and the fact that the classification is unequal, it was considered that sub-
sectors # 2,7,9,10,15 have a percentage equal to sub-sector # 11. A 0% is considered
for sub-sector # 6, due to the fact that this type of sub-sector concentrates more on
providing different services of a different nature. Only 4.66% can be considered for Sub-
sector #8 Finally, in the case of sub-sector # 18, only 50% is considered due to the fact
that the development of the industry in the country is inferior to that in Germany.
In order to obtain the electrical energy of cogeneration, the following equation is used
which relates thermal and electrical energy of cogeneration:
𝑅 =𝐻𝐶𝐻𝑃
𝐸𝐶𝐻𝑃
However, due to a similar lack of information, as previously mentioned in Point 3.5, it is
necessary to resort to further investigation. A study carried out in the USA in 2016 was

39
reviewed, notably in Appendix B, where a database chart can be used to determine the
electricity from cogeneration (Anne Hampson et al., 2016, sec. Appendix B). A selection
of different ratios for each sub-sector was established
# Sub-sectorRATIO HEAT/
POWER
1 Food, Drink and Tobaco 2.00
2 Textiles, Leather 1.50
3 Paper and Paper Products 3.50
4 Petroleum 3.93
5 Quarrying of stone and soil, other mining 2.00
6 Services 0.00
7 Clothing, footwear and leather goods 2.50
8 Agriculture 1.51
9 Alcoholic Drinks 2.50
10 Wood and Wood Products 1.88
11 Chemistry 1.88
12 Plastic 1.88
13 Glass and Ceramics 1.74
14 Cement and Lime 2.50
15 Natural Oil Process 1.51
16 Metal processing 2.50
17 Manufacture of various electrical appliances 2.50
18 Other manufacturing industries 2.50
Table 3. 4 Ratios Considered for each subsector
3.5.2 Limitations due to Topographic
By observing the national topography, it is possible to see that urban centers are
localized 2500m above the sea level and in consequence, industrial parks exist mainly
at this altitude.
Generally, the machines present problems with high altitudes, presenting power loss and
other problems caused for the change in the air pressure.
For this reason, starting from the division realized by INEC for 4 topographic areas it is
possible to obtain the percentage of industries that can be affected.
Region Manufacturing Industries
Andean 65.60%
Coast 33.78%
Amazon 0.63%
Galapagos 0.00%
Table 3. 5 Percentage of Industries in the different region to the country
Table 3.7 shows that 65% of industry is affected by altitude problems. For this reason,
and based on different documents about the topic, two particular references were
followed to understand the influence of altitude on the technical specifications of engines
and turbines.
In the case of an ICE, and according to selected technical specifications of VTA28-G5
(Cummins, 1997):

40
- Engines may be operated at 1220m without power loss.
- For operation at higher altitude a power loss of 4% per 300m must be considered.
- Taking in consideration the average altitude of most industries, a power loss of
17% was assumed.
For the case of gas turbines, the reference were the technical specifications of Capstone
Model C30 (Capstone Turbine Corporation, 2006), which established the following
relation:
𝑃𝑜𝑤𝑒𝑟 𝑙𝑜𝑠𝑠 = 1 − 𝐴𝑚𝑏𝑖𝑒𝑛𝑡 𝑃𝑟𝑒𝑠𝑠𝑢𝑟𝑒(2500𝑚)
𝐴𝑚𝑏𝑖𝑒𝑛𝑡 𝑃𝑟𝑒𝑠𝑠𝑢𝑟𝑒 𝑠𝑠𝑒𝑎 𝑙𝑒𝑣𝑒𝑙= 1 −
74.671 𝑘𝑃𝑎
101.325 𝑘𝑃𝑎= 0.264
According to the ambient pressure power ratio established as reference, the power loss
was assumed as 26% for 2500m above the sea level.
Problems caused by altitude are reflected in the economic part the analysis because of
implying higher requirements for power of engines and turbines needed to cover the
existing demands, but have no implications on the existing potential for cogeneration.
3.6 Technical Potential
Considering the fact that there is no established regulation for cogeneration, the
study was carried out with the intention of covering the basic consumption of electrical
energy in the industry, setting aside its thermal needs to be covered partly for the majority
of the cases.
Based on the electrical and thermal requirements previously determined, it was decided
for this study to only consider the industries that have an electrical consumption of 50kW
or more and a thermal consumption of 60kW or more. This is due to the fact that in order
to implement a cogeneration system in industries with lower consumption, the cost
increases and presents difficulties.
Based on the aforementioned facts, as well as the data in tables 3.3 and 3.4, two
possible scenarios may be considered based on the diesel consumption considered for
the production of heat. This is due to the lack of information on diesel consumption in the
industry which can be used both to produce heat and to operate vehicles.
First scenario
For this scenario, 100% of diesel oil consumption in the industry was assumed to be
used for industrial heat generation. Results of this consideration is shown in Figure 3.6.

41
Now with values calculates and corresponding parameters establish in Tables 3.3 and
3.4 is possible calculate potential of cogeneration according to process establish before.
SUBSECTOR MWter MWelect
Food, Drink and Tobacco 94.724 47.362
Textiles, Leather 4.764 3.176
Paper and Paper Products 68.041 19.440
Petroleum 95.252 24.237
Quarrying of stone and soil, other mining 0.775 0.388
Services - -
Clothing, footwear and leather goods 4.936 1.974
Agriculture - -
Alcoholic Drinks 9.691 3.876
Wood and Wood Products - -
Chemistry 5.258 2.797
Plastic 4.352 2.315
Glass and Ceramics 16.011 9.202
Cement and Lime 0.478 0.191
Natural Oil Process 34.878 23.098
Metal processing 2.606 1.042
Manufacture of various electrical appliances - -
Other manufacturing industries 3.432 1.373
TOTAL 345.197 140.471
Table 3.6 Potential of Cogeneration considering 100% of diesel
It is possible to show that potential in some sub-sectors was zero, this is caused for
hypothesis considered before.
Second scenario
For this scenario 50% of diesel oil consumption in the industry was assumed to be used
for industrial heat generation. Results of this consideration is shown in Figure 3.8.
Figure 3. 8 Heat Requirement only considered 50% of Diesel oil (MWh)
1,030,878.47
51,760.06
525,787.25
1,519,075.14
977.83
21,946.44
63,088.79
7,818.19
66,714.58
240,687.26
1,720,516.03
25,210.38
924,226.06
1,906,964.00
596,758.67
257,074.47
40,224.75
247,840.24
Food, Drink and Tobacco
Textiles, Leather
Paper and Paper Products
Petroleum
Quarrying of stone and soil, other mining
Services
Clothing, footwear and leather goods
Agriculture
Alcoholic Drinks
Wood and Wood Products
Chemistry
Plastic
Glass and Ceramics
Cement and Lime
Natural Oil Process
Metal processing
Manufacture of various electrical appliances
Other manufacturing industries

42
SUBSECTOR MWter MWelect
Food, Drink and Tobacco 69.813 34.907
Textiles, Leather 3.396 2.264
Paper and Paper Products 65.948 18.842
Petroleum 72.139 18.356
Quarrying of stone and soil, other mining 0.388 0.194
Services - -
Clothing, footwear and leather goods 3.065 1.226
Agriculture - -
Alcoholic Drinks 5.168 2.067
Wood and Wood Products - -
Chemistry 4.029 2.143
Plastic 2.921 1.554
Glass and Ceramics 14.209 8.166
Cement and Lime 0.239 0.096
Natural Oil Process 33.388 22.111
Metal processing 1.979 0.792
Manufacture of various electrical appliances - -
Other manufacturing industries 2.800 1.120
TOTAL 279.483 113.837
Table 3. 7 Potential of Cogeneration considering 50% of diesel
The results obtained after applying the proposed methodology are presented in Tables
3.5 and 3.6. The first column presents the estimation for the potential thermal power,
which technically could be installed in each industrial sector, and the second column
represents the equivalent electric power potential.
As presented in tables 3.5 and 3.6, the principal sub-sectors with cogeneration potential
are “Food, Drink and Tobacco”, “Paper and Paper Products”, “Petroleum” and “Natural
Oil Process”, representing a good match with the main industrial activities in the country.
For the cases of “Textile, Leathers”, “Cement and Lime” and other important sub-sectors,
the potential is low mainly due to the assumption of electric self-consumption, not
considering the possibility of selling surplus generation.
It is possible to observe in Figures 3.6 and 3.7 that the thermal energy needs are high
when compared with the electric needs. Considering this, and the problem caused by
the lack of a law to sell electric energy, important limitations for cogeneration potential
are produced.
For the case of “Quarrying of stone and soil, other mining” the potential is low because
in the country the mining activity is underdeveloped.
Finally, the uncertainly regarding the use of diesel represent, are around 19%.

43
3.7 Economic Analysis
The objective of this point is calculating the economic viability of implementing a
cogeneration.
In the first place it is necessary to consider two independent economic calculations for
different cases, namely:
- Industries that are at sea level, where there are no implications of altitude.
- Industries approximately at 2500m above sea level, where the power loss
according to exposed in 3.5.2.
Four types of plants were assumed for the calculation the characteristics of these being
shown in Table 3.8.
ITEM Diesel Engine GAS ENGINE (or
industrial fuel used)GAS ENGINE GAS TURBINE
50kW-250kW 300kW-950kW 1MW or more 3MW or more
Network level Voltage LV LV-MV LV-MV MV-HV
Application - Property
cogenerationProperty cogeneration Property cogeneration Property cogeneration
Investment costs incl. $ /
kW 720.00$ 1,760.00$ 1,440.00$ 1,200.00$
Lifetime years 10 15 15 15 Efficiency rating - electrical
% 34% 40% 41% 30%
Efficiency rating - thermal % 46% 46% 46% 50%
Overall efficiency rating % 80% 86% 86% 80%
O&M cost $/ kW-year 119.00$ 178.00$ 137.00$ 106.00$
Price of Fuel $/kWh 43.60$ 20,800.00$ 20.80$ 20.80$ Heat Rate Considered
kJ/kWh 10,588.24 9,000.00 8,845.21 12,000.00
Table 3. 8 Characteristics of equipment to analysis
In all cases, the prices for kW installed and O&M costs were obtained with the program
Retscreen Expert as the principal source of information.
In this situation is considered that the price for electric energy generated is the same that
the price when consuming, according to “Pliego Tarifario para las Empresas Eléctricas”
(ARCONEL, 2016, pp. 3–16):
- 08h00 to 18h00 0.093 $/kWh consumed
- 18h00 to 22h00 0.107 $/kWh consumed
- 08h00 to 18h00 0.075 $/kWh consumed
Furthermore, the selected discount rate was taken from “Average interest rates by
instrument” considered for a fixed time deposit, published by Central Bank of Ecuador
for 2017 (Banco Central del Ecuador, 2017). The Methodology presented in the
Appendix III calculate the costs for each individual case.

44
Diesel Engine
A 100kW engine with characteristics:
- Medium level Voltage (13.8-22kV)
- Working 2800 to 7000 hours
- Diesel oil as main fuel.
Figure 3. 9 Price of kWh generated for diesel engine
Hours Cash flow ($) NPV ($) IRR (%) Payback
(years)
3500 (3,586.47)$ (99,747.65)$ ---- xxxx
4500 (21.18)$ (72,163.84)$ ---- xxxx
5500 2,506.12$ (52,610.78)$ -19.67% xxxx
6500 3,081.41$ (48,159.87)$ -17.16% xxxx
3500 (9,119.97)$ (142,558.99)$ ---- xxxx
4500 (7,337.98)$ (128,772.14)$ ---- xxxx
5500 (6,417.52)$ (121,650.81)$ ---- xxxx
6500 (7,117.23)$ (127,064.26)$ ---- xxxx
Sea
Leve
l25
00m
abov
e se
a
Table 3. 9 Economic Analysis diesel engine
The results for this scenario are shown in Figure 3.9 and Table 3.9, all with bad results,
especially for the unit placed 2500m above sea level.
In an investment perspective, these are not inspiring results, all economic indicators
being negative and with a price of kWh generated around 0.10 USD, which is similar or
greater that the price of kWh bought to the electric grid.
$0.0100
$0.0300
$0.0500
$0.0700
$0.0900
$0.1100
$0.1300
$0.1500
2000 3000 4000 5000 6000 7000 8000
Hours per year
Sea Level
2500 m above sea
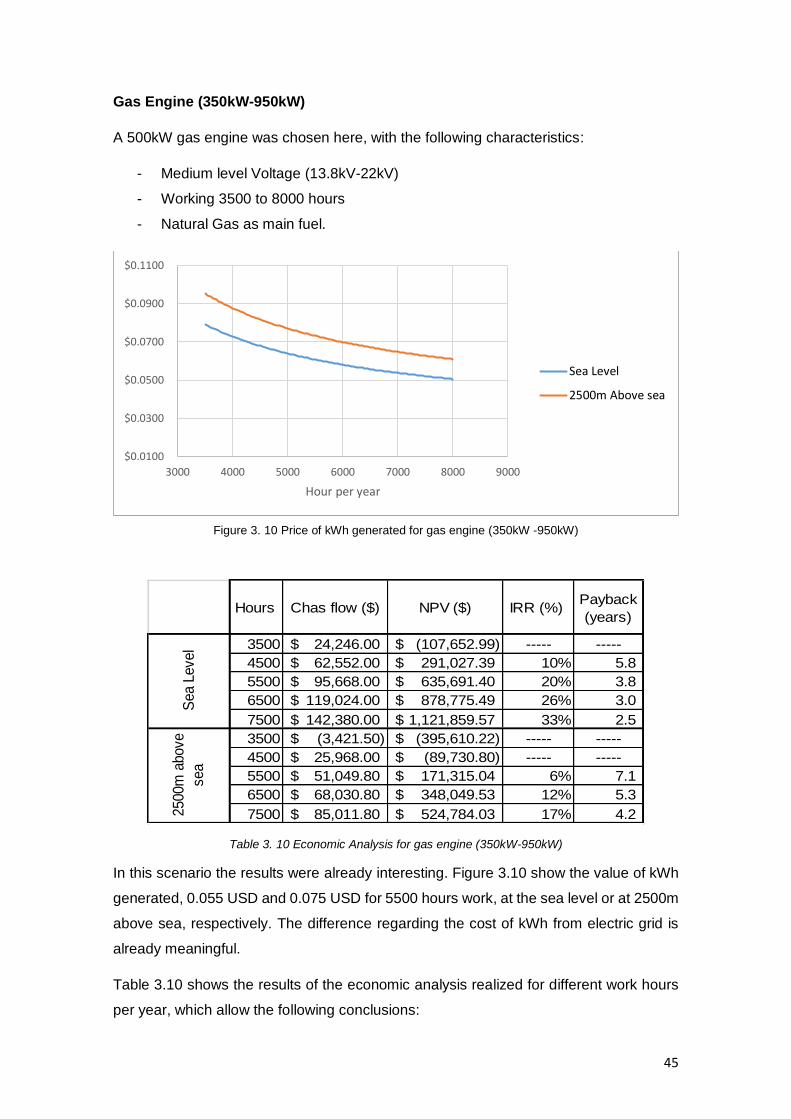
45
Gas Engine (350kW-950kW)
A 500kW gas engine was chosen here, with the following characteristics:
- Medium level Voltage (13.8kV-22kV)
- Working 3500 to 8000 hours
- Natural Gas as main fuel.
Figure 3. 10 Price of kWh generated for gas engine (350kW -950kW)
Hours Chas flow ($) NPV ($) IRR (%) Payback
(years)
3500 24,246.00$ (107,652.99)$ ----- -----
4500 62,552.00$ 291,027.39$ 10% 5.8
5500 95,668.00$ 635,691.40$ 20% 3.8
6500 119,024.00$ 878,775.49$ 26% 3.0
7500 142,380.00$ 1,121,859.57$ 33% 2.5
3500 (3,421.50)$ (395,610.22)$ ----- -----
4500 25,968.00$ (89,730.80)$ ----- -----
5500 51,049.80$ 171,315.04$ 6% 7.1
6500 68,030.80$ 348,049.53$ 12% 5.3
7500 85,011.80$ 524,784.03$ 17% 4.2
Sea L
evel
2500m
above
sea
Table 3. 10 Economic Analysis for gas engine (350kW-950kW)
In this scenario the results were already interesting. Figure 3.10 show the value of kWh
generated, 0.055 USD and 0.075 USD for 5500 hours work, at the sea level or at 2500m
above sea, respectively. The difference regarding the cost of kWh from electric grid is
already meaningful.
Table 3.10 shows the results of the economic analysis realized for different work hours
per year, which allow the following conclusions:
$0.0100
$0.0300
$0.0500
$0.0700
$0.0900
$0.1100
3000 4000 5000 6000 7000 8000 9000
Hour per year
Sea Level
2500m Above sea

46
- Sea Level. Results are positive if the system runs more than 4500 hours per year.
A minimum IRR of 10% and results are even better if the working time exceeds
this value. The payback is inferior to 4 years.
- 2500m Above sea. - Results are less interesting and the equipment that functions
in this situation must work for 5500 hours a year to obtain a positive economic
indicator. This situation is possible only for industries that work around 16 hours
a day, but the economic indicators are not excellent.
Gas Engine (1MW)
A 1MW gas engine with the following characteristics:
- High Voltage (greater than or equal to 138 kV)
- Run time from 4500 to 8760 hours
- Natural Gas as main fuel.
Figure 3. 11 Price of kWh generated for gas engine
Hours Cash flow ($) NPV ($) IRR (%) Payback
(years)
4500 168,293.37$ 1,031,560.16$ 16% 4.28
5500 235,011.89$ 1,725,951.83$ 26% 3.1
6500 282,210.42$ 2,217,183.66$ 32% 2.6
7500 329,408.94$ 2,708,415.48$ 39% 2.2
8760 388,879.09$ 3,327,367.58$ 47% 1.9
4500 95,125.37$ 270,043.79$ 5% 7.57
5500 145,775.49$ 797,199.10$ 13% 4.9
6500 180,224.02$ 1,155,731.74$ 18% 4.0
7500 214,672.54$ 1,514,264.39$ 23% 3.4
8760 258,077.69$ 1,966,015.52$ 29% 2.8
Sea
Lev
el25
00m
abo
ve
sea
Table 3. 11 Economic Analysis for gas engine
$0.0100
$0.0300
$0.0500
$0.0700
$0.0900
5000 6000 7000 8000 9000
Hours per Year
Sea Level
2500m Above sea

47
For this scenario the results were excellent. Figure 3.11 shows the value of kWh
generated, of 0.048 USD and 0.065 USD for 7000 hours runtime, according to the
altitude. The difference regarding the cost of kWh from electric grid is significant.
Table 3.11 shows the economic analysis performed for different work hours per year.
Again, results are interesting and the following conclusions can be drawn:
- Sea Level. – Positive results are guaranteed for runtimes above 5500 hours per
year. The IRR gets to 26%, payback is inferior to 3.5 years.
- 2500m Above sea. - For this situation, the results are less interesting. The
equipment that functions in this situation must work for 5500 hours per year to
obtain a positive economic indicator.
Gas Turbine
A 3MW gas Turbine was chosen with the characteristics shown in Table 3.8 and
assuming the following conditions:
- High Voltage (greater than or equal to 138 kV)
- Run time from 6000 to 8760 hours
- Natural Gas as main fuel.
Figure 3. 12 Price of kWh generated for gas Turbine
$0.0100
$0.0300
$0.0500
$0.0700
$0.0900
5500 6500 7500 8500 9500
Hours per Year
Sea Level
2500m above sea
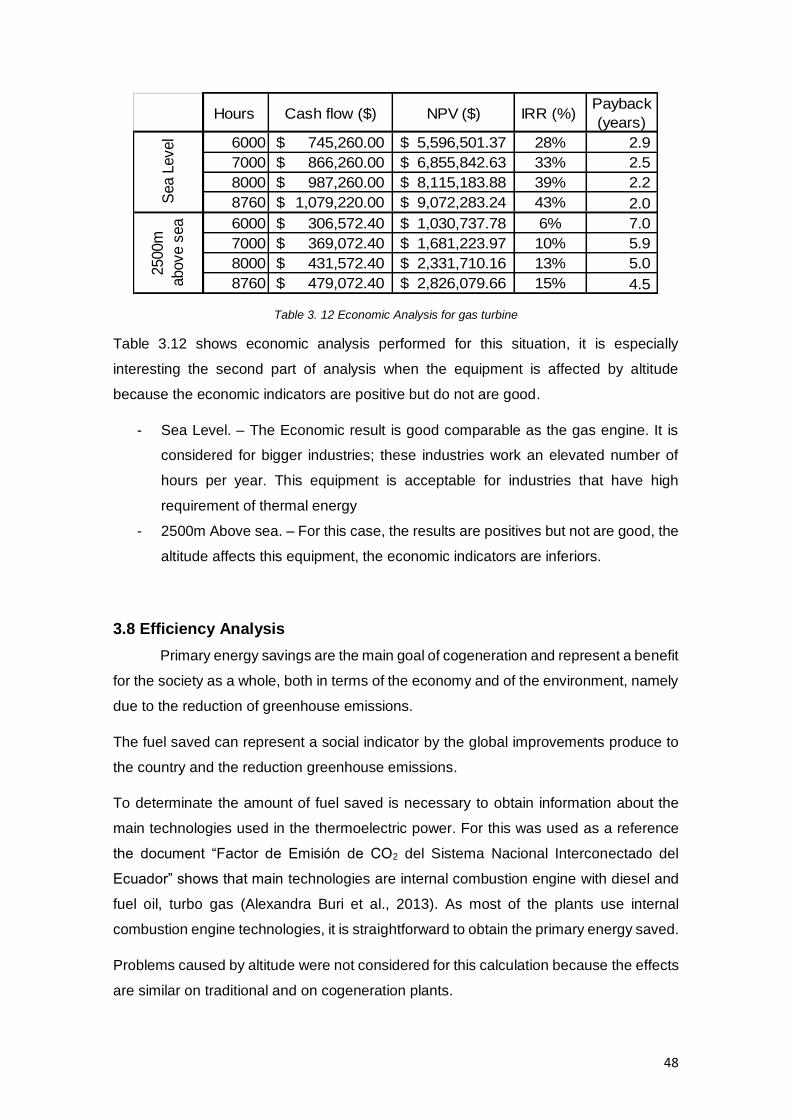
48
Hours Cash flow ($) NPV ($) IRR (%) Payback
(years)
6000 745,260.00$ 5,596,501.37$ 28% 2.9
7000 866,260.00$ 6,855,842.63$ 33% 2.5
8000 987,260.00$ 8,115,183.88$ 39% 2.2
8760 1,079,220.00$ 9,072,283.24$ 43% 2.0
6000 306,572.40$ 1,030,737.78$ 6% 7.0
7000 369,072.40$ 1,681,223.97$ 10% 5.9
8000 431,572.40$ 2,331,710.16$ 13% 5.0
8760 479,072.40$ 2,826,079.66$ 15% 4.5
Sea L
evel
2500m
above s
ea
Table 3. 12 Economic Analysis for gas turbine
Table 3.12 shows economic analysis performed for this situation, it is especially
interesting the second part of analysis when the equipment is affected by altitude
because the economic indicators are positive but do not are good.
- Sea Level. – The Economic result is good comparable as the gas engine. It is
considered for bigger industries; these industries work an elevated number of
hours per year. This equipment is acceptable for industries that have high
requirement of thermal energy
- 2500m Above sea. – For this case, the results are positives but not are good, the
altitude affects this equipment, the economic indicators are inferiors.
3.8 Efficiency Analysis
Primary energy savings are the main goal of cogeneration and represent a benefit
for the society as a whole, both in terms of the economy and of the environment, namely
due to the reduction of greenhouse emissions.
The fuel saved can represent a social indicator by the global improvements produce to
the country and the reduction greenhouse emissions.
To determinate the amount of fuel saved is necessary to obtain information about the
main technologies used in the thermoelectric power. For this was used as a reference
the document “Factor de Emisión de CO2 del Sistema Nacional Interconectado del
Ecuador” shows that main technologies are internal combustion engine with diesel and
fuel oil, turbo gas (Alexandra Buri et al., 2013). As most of the plants use internal
combustion engine technologies, it is straightforward to obtain the primary energy saved.
Problems caused by altitude were not considered for this calculation because the effects
are similar on traditional and on cogeneration plants.

49
HoursPOWER
(Kw)
Total
Efficiency PES
Fuel Saved
(kWh)Fuel Type Fuel Saved Unit
4,500 100 80.00% 28.55% 528,752.73 Diesel 13,723.94 gal
5,500 500 85.60% 27.52% 2,610,976.39 Natural Gas 266,955.84 m3
7,500 1,000 86.30% 27.35% 6,937,137.60 Natural Gas 709,278.48 m3
8,000 3,000 80.00% 16.80% 16,152,804.61 Natural Gas 1,651,522.20 m3
Table 3. 13 Energy Efficiency indicators
Table 3.13 shown the primary energy saving (PES) due to cogeneration when compared
to separated production of electricity and heat. The calculation are presented in appendix
II and use data determined in subsection 3.6.1

50
This page was intentionally left blank
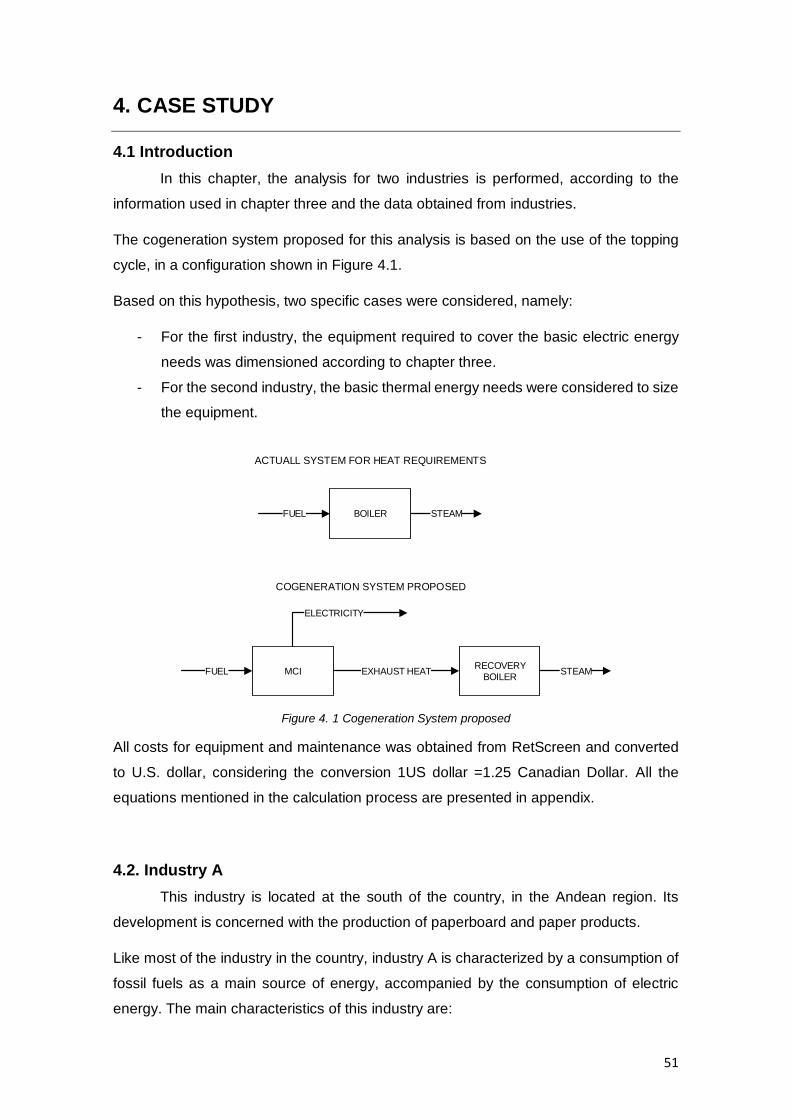
51
4. CASE STUDY
4.1 Introduction
In this chapter, the analysis for two industries is performed, according to the
information used in chapter three and the data obtained from industries.
The cogeneration system proposed for this analysis is based on the use of the topping
cycle, in a configuration shown in Figure 4.1.
Based on this hypothesis, two specific cases were considered, namely:
- For the first industry, the equipment required to cover the basic electric energy
needs was dimensioned according to chapter three.
- For the second industry, the basic thermal energy needs were considered to size
the equipment.
BOILERFUEL STEAM
ACTUALL SYSTEM FOR HEAT REQUIREMENTS
MCI FUEL EXHAUST HEAT
ELECTRICITY
RECOVERY BOILER
STEAM
COGENERATION SYSTEM PROPOSED
Figure 4. 1 Cogeneration System proposed
All costs for equipment and maintenance was obtained from RetScreen and converted
to U.S. dollar, considering the conversion 1US dollar =1.25 Canadian Dollar. All the
equations mentioned in the calculation process are presented in appendix.
4.2. Industry A
This industry is located at the south of the country, in the Andean region. Its
development is concerned with the production of paperboard and paper products.
Like most of the industry in the country, industry A is characterized by a consumption of
fossil fuels as a main source of energy, accompanied by the consumption of electric
energy. The main characteristics of this industry are:
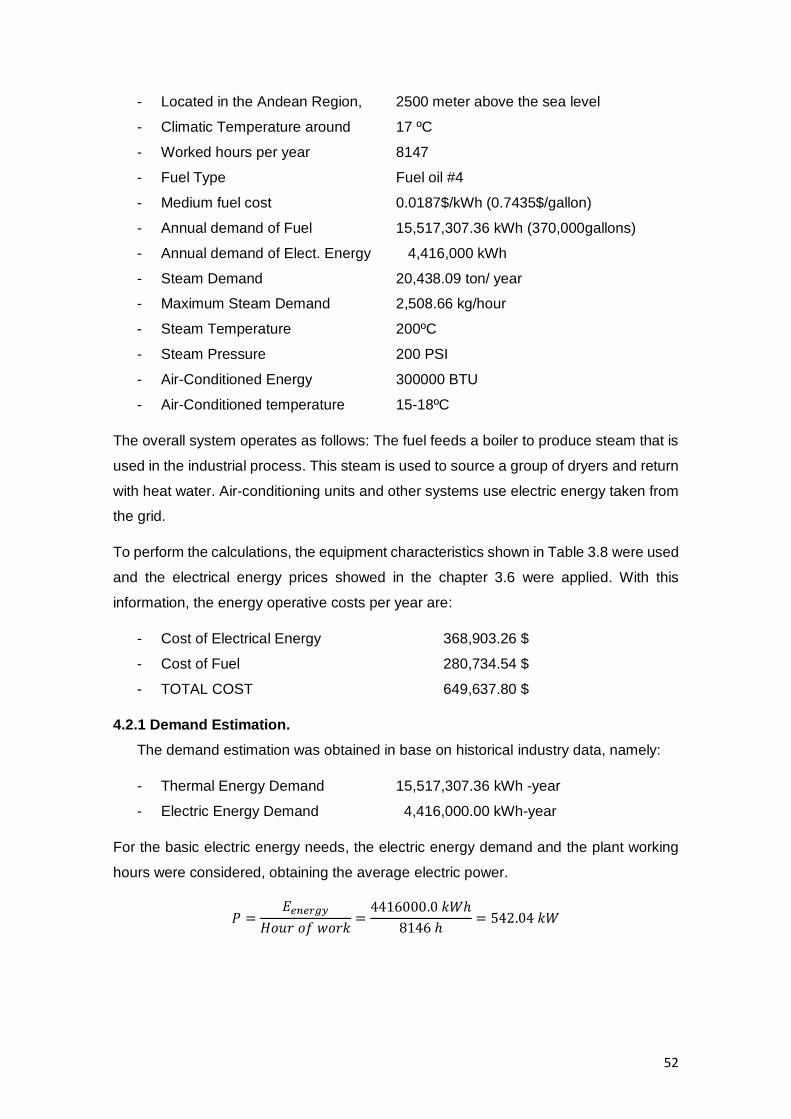
52
- Located in the Andean Region, 2500 meter above the sea level
- Climatic Temperature around 17 ºC
- Worked hours per year 8147
- Fuel Type Fuel oil #4
- Medium fuel cost 0.0187$/kWh (0.7435$/gallon)
- Annual demand of Fuel 15,517,307.36 kWh (370,000gallons)
- Annual demand of Elect. Energy 4,416,000 kWh
- Steam Demand 20,438.09 ton/ year
- Maximum Steam Demand 2,508.66 kg/hour
- Steam Temperature 200ºC
- Steam Pressure 200 PSI
- Air-Conditioned Energy 300000 BTU
- Air-Conditioned temperature 15-18ºC
The overall system operates as follows: The fuel feeds a boiler to produce steam that is
used in the industrial process. This steam is used to source a group of dryers and return
with heat water. Air-conditioning units and other systems use electric energy taken from
the grid.
To perform the calculations, the equipment characteristics shown in Table 3.8 were used
and the electrical energy prices showed in the chapter 3.6 were applied. With this
information, the energy operative costs per year are:
- Cost of Electrical Energy 368,903.26 $
- Cost of Fuel 280,734.54 $
- TOTAL COST 649,637.80 $
4.2.1 Demand Estimation.
The demand estimation was obtained in base on historical industry data, namely:
- Thermal Energy Demand 15,517,307.36 kWh -year
- Electric Energy Demand 4,416,000.00 kWh-year
For the basic electric energy needs, the electric energy demand and the plant working
hours were considered, obtaining the average electric power.
𝑃 =𝐸𝑒𝑛𝑒𝑟𝑔𝑦
𝐻𝑜𝑢𝑟 𝑜𝑓 𝑤𝑜𝑟𝑘=
4416000.0 𝑘𝑊ℎ
8146 ℎ= 542.04 𝑘𝑊

53
This value is approximately the mean consumption per hour, but a lower power
requirement is possible at night and weekends. Nonetheless, the interruption of the
production process in the plant is not convenient. For this reason, and, as a normative
or law does not exist to regulate the production of cogenerated electricity, only the base
electric demand is covered.
The thermal energy recovered from the engine will cover a part of the mean steam
demand, which is 0.697kg/s. The remaining steam demand will be covered by the
existent boiler.
4.2.2 Economic Analysis
The analysis was performed considering the investment capital and O&M costs for the
engine and the recovery boiler, implying the following operations:
- Calculate the fuel consumption for the engine.
- Calculate the thermal energy saved by the recovery boiler and its price.
- Calculate the cost per generated kWh.
- Determinate Net Present Value (NPV), if greater than zero, calculate the Internal
Return Rate (IRR) and the payback.
A 17% power loss caused by altitude was considered.
The general engine characteristics are presented in table 4.1:
Voltage Medium Voltage (22kV)
Power 500 kW
Aspiration Turbocharged and after-cooled
Exhaust gas flow at set rated load 96 m3/s
Exhaust gas flow at set rated load 1.89 kg/s
Exhaust gas temperature 634 ºC
Maximum exhaust back pressure 10.1 kPa
Electrical Efficiency 40.7%
Thermal Efficiency 45.6%
Lifetime 15 years
Heat Rate (HR) 9000 kJ/kWh
Table 4. 1 Engine Characteristics
Usually, the exhaust flow is measured in m3/s, and an air density of 1.184 kg/m3 was
used to calculate the mass of the exhaust gas.
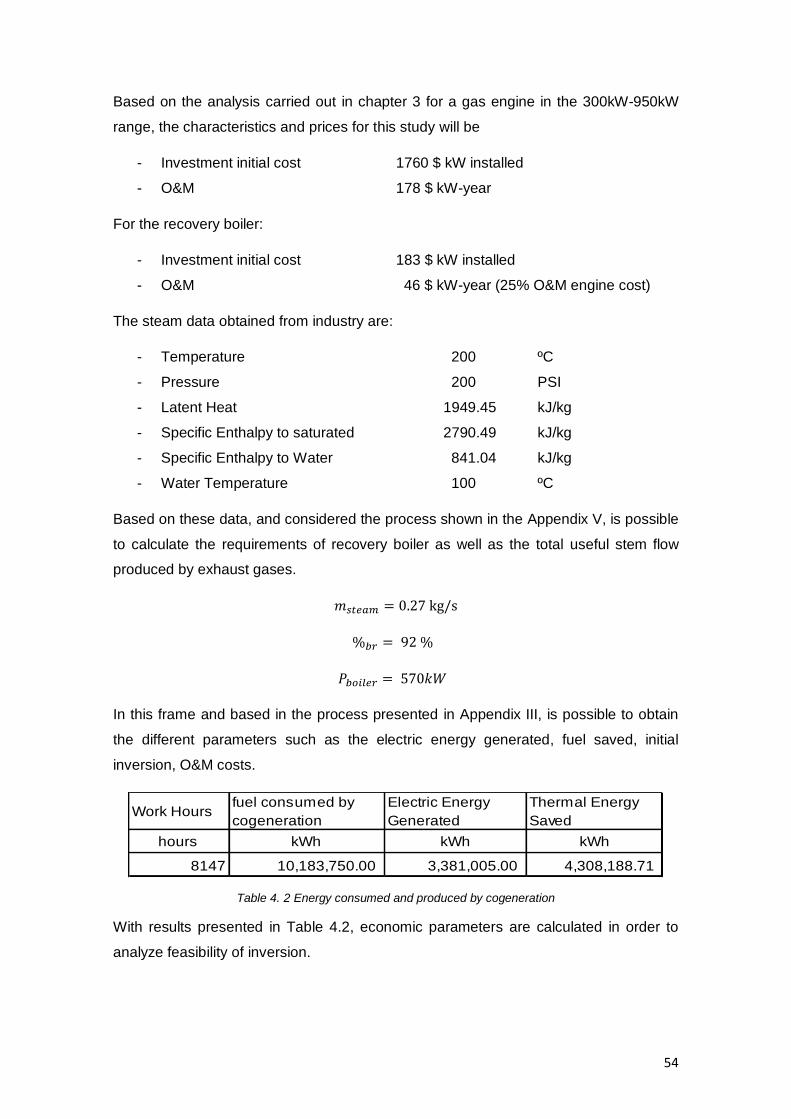
54
Based on the analysis carried out in chapter 3 for a gas engine in the 300kW-950kW
range, the characteristics and prices for this study will be
- Investment initial cost 1760 $ kW installed
- O&M 178 $ kW-year
For the recovery boiler:
- Investment initial cost 183 $ kW installed
- O&M 46 $ kW-year (25% O&M engine cost)
The steam data obtained from industry are:
- Temperature 200 ºC
- Pressure 200 PSI
- Latent Heat 1949.45 kJ/kg
- Specific Enthalpy to saturated 2790.49 kJ/kg
- Specific Enthalpy to Water 841.04 kJ/kg
- Water Temperature 100 ºC
Based on these data, and considered the process shown in the Appendix V, is possible
to calculate the requirements of recovery boiler as well as the total useful stem flow
produced by exhaust gases.
𝑚𝑠𝑡𝑒𝑎𝑚 = 0.27 kg/s
%𝑏𝑟 = 92 %
𝑃𝑏𝑜𝑖𝑙𝑒𝑟 = 570𝑘𝑊
In this frame and based in the process presented in Appendix III, is possible to obtain
the different parameters such as the electric energy generated, fuel saved, initial
inversion, O&M costs.
Work Hoursfuel consumed by
cogeneration
Electric Energy
Generated
Thermal Energy
Saved
hours kWh kWh kWh
8147 10,183,750.00 3,381,005.00 4,308,188.71
Table 4. 2 Energy consumed and produced by cogeneration
With results presented in Table 4.2, economic parameters are calculated in order to
analyze feasibility of inversion.
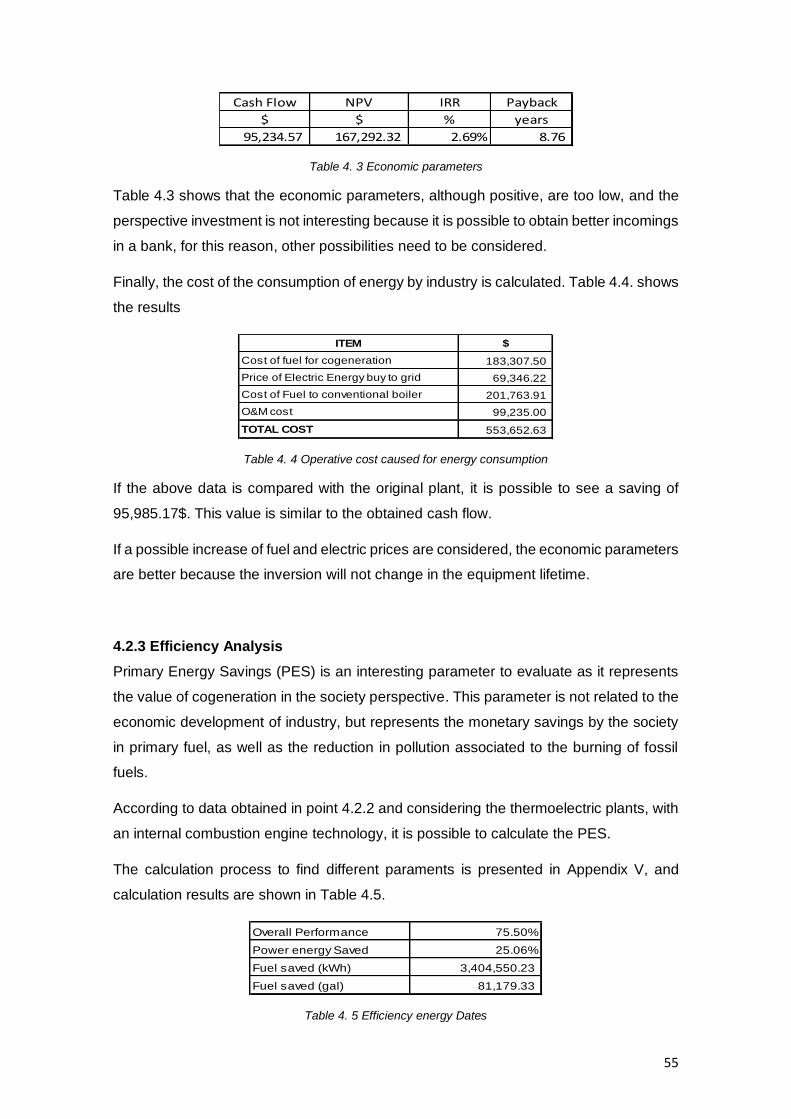
55
Cash Flow NPV IRR Payback
$ $ % years
95,234.57 167,292.32 2.69% 8.76
Table 4. 3 Economic parameters
Table 4.3 shows that the economic parameters, although positive, are too low, and the
perspective investment is not interesting because it is possible to obtain better incomings
in a bank, for this reason, other possibilities need to be considered.
Finally, the cost of the consumption of energy by industry is calculated. Table 4.4. shows
the results
ITEM $
Cost of fuel for cogeneration 183,307.50
Price of Electric Energy buy to grid 69,346.22
Cost of Fuel to conventional boiler 201,763.91
O&M cost 99,235.00
TOTAL COST 553,652.63
Table 4. 4 Operative cost caused for energy consumption
If the above data is compared with the original plant, it is possible to see a saving of
95,985.17$. This value is similar to the obtained cash flow.
If a possible increase of fuel and electric prices are considered, the economic parameters
are better because the inversion will not change in the equipment lifetime.
4.2.3 Efficiency Analysis
Primary Energy Savings (PES) is an interesting parameter to evaluate as it represents
the value of cogeneration in the society perspective. This parameter is not related to the
economic development of industry, but represents the monetary savings by the society
in primary fuel, as well as the reduction in pollution associated to the burning of fossil
fuels.
According to data obtained in point 4.2.2 and considering the thermoelectric plants, with
an internal combustion engine technology, it is possible to calculate the PES.
The calculation process to find different paraments is presented in Appendix V, and
calculation results are shown in Table 4.5.
Overall Performance 75.50%
Power energy Saved 25.06%
Fuel saved (kWh) 3,404,550.23
Fuel saved (gal) 81,179.33
Table 4. 5 Efficiency energy Dates
56
The quantity of fuel saved is interesting because in function of this, it is possible to
determine the amount of reduced greenhouse gases.
4.3. Industry B
This industry is located at the south of the country, in the Andean region. Its
development is concerned with the production of milk products and natural juice.
The operation of this plant is similar to industry A. The fuel feeds a boiler to produce
steam that is used in the industrial process. This steam is used to feed a group of dryers.
To cope with cooling needs, industry B uses a compressor chiller that uses electric
energy taken from the grid.
In this system, steam generation only works 16 hours per day, and the cooling systems
work 24 hours per day
The main characteristics of this facility are:
- Localized in the Andean Region, 2500 meter above the sea level.
- Climatic Temperature around 17 ºC
- Worked hours per year 8700 (but steam only use for 5840 hour)
- Fuel used Diesel
- Fuel cost 0.044$/kWh (1.67$/gallon)
- Annual demand of Fuel 1,810,482.86 kWh (48,000 gallons)
- Annual Demand of Elect. Energy 6,090,000.00 kWh
- Average Elec. Power required 700 kW
- Steam Demand 2,250.00 ton/ year
- Maximum Steam Demand 385.27 kg/hour
- Steam Temperature 140ºC
- Steam Pressure 87 PSI
To perform the calculations, the equipment characteristics shown in Table 3.8 are used,
along with the electrical energy prices showed in the chapter 3.6. With this information,
the energy operative costs per year were determined as:
- Cost of Electrical Energy 539,574.20 $
- Cost of Fuel 80,507.33 $
- TOTAL COST 620,081.33 $
57
4.3.1 Demand Estimation.
The demand estimation was obtained using historical industry data, namely:
- Thermal Energy Demand 1,810,482.96 kWh-year
- Electric Energy Demand 6,090,000.00 kWh-year
- Medium Electric Power 700 kW
It is clear in this case that the thermal needs are less than the energy needs. This is
reasonable because the principal energy needs are focused in cooling systems.
The thermal energy recovered from the engine will cover a part of the average steam
demand, 0.10kg/s. The remaining steam demand will be covered by the existent boiler.
4.3.2 Potential Analysis
The equipment is dimensioned in function of the basic thermal needs without
considering the electric needs, because it is necessary to exploit all of the exhaust gases
in order to elevate the system efficiency.
Based on this consideration, the following steps are established,
- Calculate the power of equipment in base of the quantity of exhaust gases that
can be used in the industrial process.
- Consider the prices of inversion, O&M, for the engine and recovery boiler.
- Calculate the energy consumption of fuel used for the engine.
- Calculate the thermal energy saved by the recovery boiler and his price.
- Calculate the cost of not bought electric energy.
- Calculate the cost of the generated kWh.
- Determinate NPV, if greater than zero, calculate IRR and the payback.
According to the above steps, it is necessary to know the steam characteristics, which
are:
- Temperature 140 ºC
- Pressure 87 PSI
- Latent Heat 2009 kJ/kg
- Specific Enthalpy to saturated 2009 kJ/kg
- Specific Enthalpy to Water 670,501 kJ/kg
- Water Temperature 100 ºC
Now, considering steam characteristics and the equations 13 and 14 presented in
Appendix IV, it is possible to obtain

58
𝑚𝑔 =𝑚𝑠𝑡𝑒𝑎𝑚 ∗ (ℎ𝑎3 − ℎ𝑎2)
(ℎ𝑔(𝑇𝑔1))− ℎ𝑔(𝑇𝑔2))
) (
kg
s)
𝑚𝑔 = 0.8 (kg
s)
𝑚𝑔 = 34.5 (𝑚3
s)
The maximum flow of exhaust gases is around 34.5 (m3/s) at a temperature around of
474ºC.
Based on this information, a 100kW engine which operates with diesel oil was selected.
A 17% power loss caused by the altitude effect was considered.
General characteristics of engine are:
Voltage Nominal Voltage (22kV)
Power 100 kW
Aspiration Turbocharged and after-cooled
Exhaust gas flow at set rated load 28.94 m3/s
Exhaust gas flow at set rated load 0.57 kg/s
Exhaust gas temperature 474 ºC
Maximum exhaust back pressure 10.1 kPa
Electrical Efficiency 34.00 %
Thermal Efficiency 46,00 %
Lifetime 10
Heat Rate (HR) 10,588.24 kJ/kWh
Table 4. 6 Engine Characteristics
Based on the analysis carried out in chapter 3 for a diesel engine in the 50kW-250kW
range, the characteristics and prices applied for this study were:
- Investment initial cost 720 $ kW installed
- O&M 119 $ kW-year
For the recovery boiler:
- Investment initial cost 183 $ kW installed
- O&M 46 $ kW-year (25% O&M engine cost)
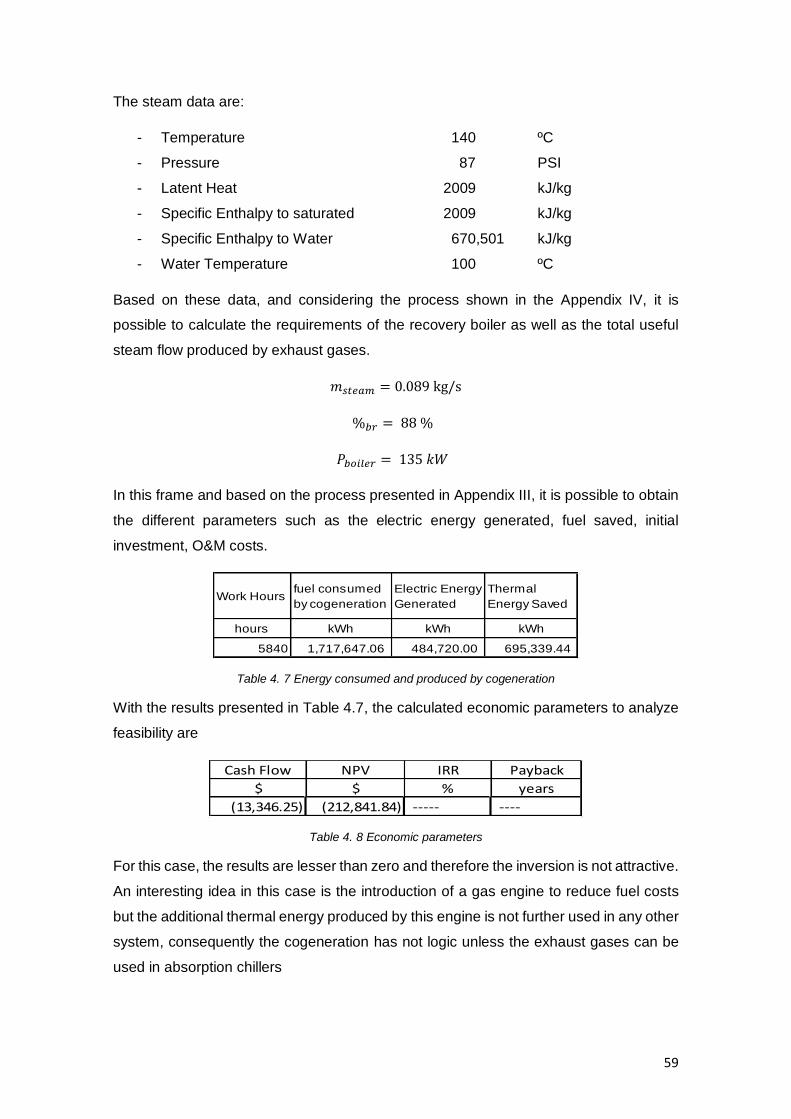
59
The steam data are:
- Temperature 140 ºC
- Pressure 87 PSI
- Latent Heat 2009 kJ/kg
- Specific Enthalpy to saturated 2009 kJ/kg
- Specific Enthalpy to Water 670,501 kJ/kg
- Water Temperature 100 ºC
Based on these data, and considering the process shown in the Appendix IV, it is
possible to calculate the requirements of the recovery boiler as well as the total useful
steam flow produced by exhaust gases.
𝑚𝑠𝑡𝑒𝑎𝑚 = 0.089 kg/s
%𝑏𝑟 = 88 %
𝑃𝑏𝑜𝑖𝑙𝑒𝑟 = 135 𝑘𝑊
In this frame and based on the process presented in Appendix III, it is possible to obtain
the different parameters such as the electric energy generated, fuel saved, initial
investment, O&M costs.
Work Hoursfuel consumed
by cogeneration
Electric Energy
Generated
Thermal
Energy Saved
hours kWh kWh kWh
5840 1,717,647.06 484,720.00 695,339.44
Table 4. 7 Energy consumed and produced by cogeneration
With the results presented in Table 4.7, the calculated economic parameters to analyze
feasibility are
Cash Flow NPV IRR Payback
$ $ % years
(13,346.25) (212,841.84) ----- ----
Table 4. 8 Economic parameters
For this case, the results are lesser than zero and therefore the inversion is not attractive.
An interesting idea in this case is the introduction of a gas engine to reduce fuel costs
but the additional thermal energy produced by this engine is not further used in any other
system, consequently the cogeneration has not logic unless the exhaust gases can be
used in absorption chillers

60
4.3.3 Efficiency Analysis
According to data obtained in point 4.2.2 and considering thermoelectric plants existing
with an internal combustion engine technology, it is possible to calculate the PES.
The calculation process to find different paraments is presented in Appendix IV, and the
calculation results are shown in Table 4.9.
Overall Performance 68.70%
Power energy Saved 15.97%
Fuel saved (kWh) 315,747.90
Fuel saved (gal) 8,371.19
Table 4. 9 Efficiency energy data
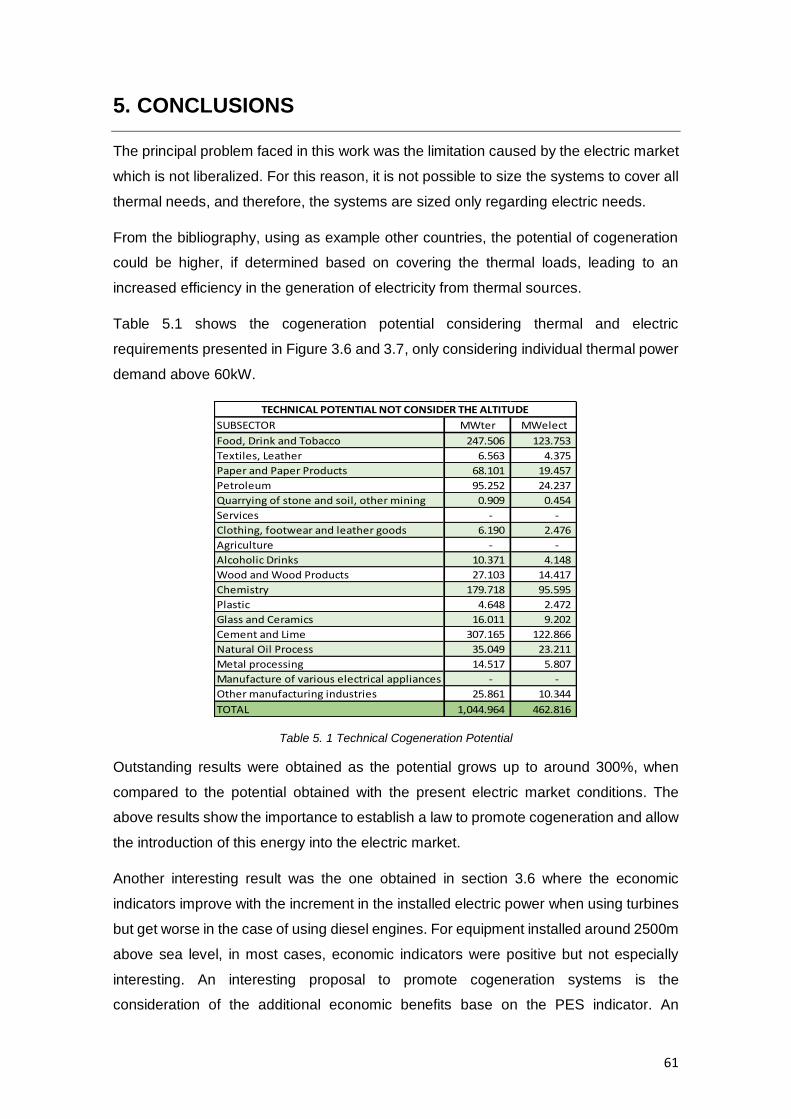
61
5. CONCLUSIONS
The principal problem faced in this work was the limitation caused by the electric market
which is not liberalized. For this reason, it is not possible to size the systems to cover all
thermal needs, and therefore, the systems are sized only regarding electric needs.
From the bibliography, using as example other countries, the potential of cogeneration
could be higher, if determined based on covering the thermal loads, leading to an
increased efficiency in the generation of electricity from thermal sources.
Table 5.1 shows the cogeneration potential considering thermal and electric
requirements presented in Figure 3.6 and 3.7, only considering individual thermal power
demand above 60kW.
SUBSECTOR MWter MWelect
Food, Drink and Tobacco 247.506 123.753
Textiles, Leather 6.563 4.375
Paper and Paper Products 68.101 19.457
Petroleum 95.252 24.237
Quarrying of stone and soil, other mining 0.909 0.454
Services - -
Clothing, footwear and leather goods 6.190 2.476
Agriculture - -
Alcoholic Drinks 10.371 4.148
Wood and Wood Products 27.103 14.417
Chemistry 179.718 95.595
Plastic 4.648 2.472
Glass and Ceramics 16.011 9.202
Cement and Lime 307.165 122.866
Natural Oil Process 35.049 23.211
Metal processing 14.517 5.807
Manufacture of various electrical appliances - -
Other manufacturing industries 25.861 10.344
TOTAL 1,044.964 462.816
TECHNICAL POTENTIAL NOT CONSIDER THE ALTITUDE
Table 5. 1 Technical Cogeneration Potential
Outstanding results were obtained as the potential grows up to around 300%, when
compared to the potential obtained with the present electric market conditions. The
above results show the importance to establish a law to promote cogeneration and allow
the introduction of this energy into the electric market.
Another interesting result was the one obtained in section 3.6 where the economic
indicators improve with the increment in the installed electric power when using turbines
but get worse in the case of using diesel engines. For equipment installed around 2500m
above sea level, in most cases, economic indicators were positive but not especially
interesting. An interesting proposal to promote cogeneration systems is the
consideration of the additional economic benefits base on the PES indicator. An
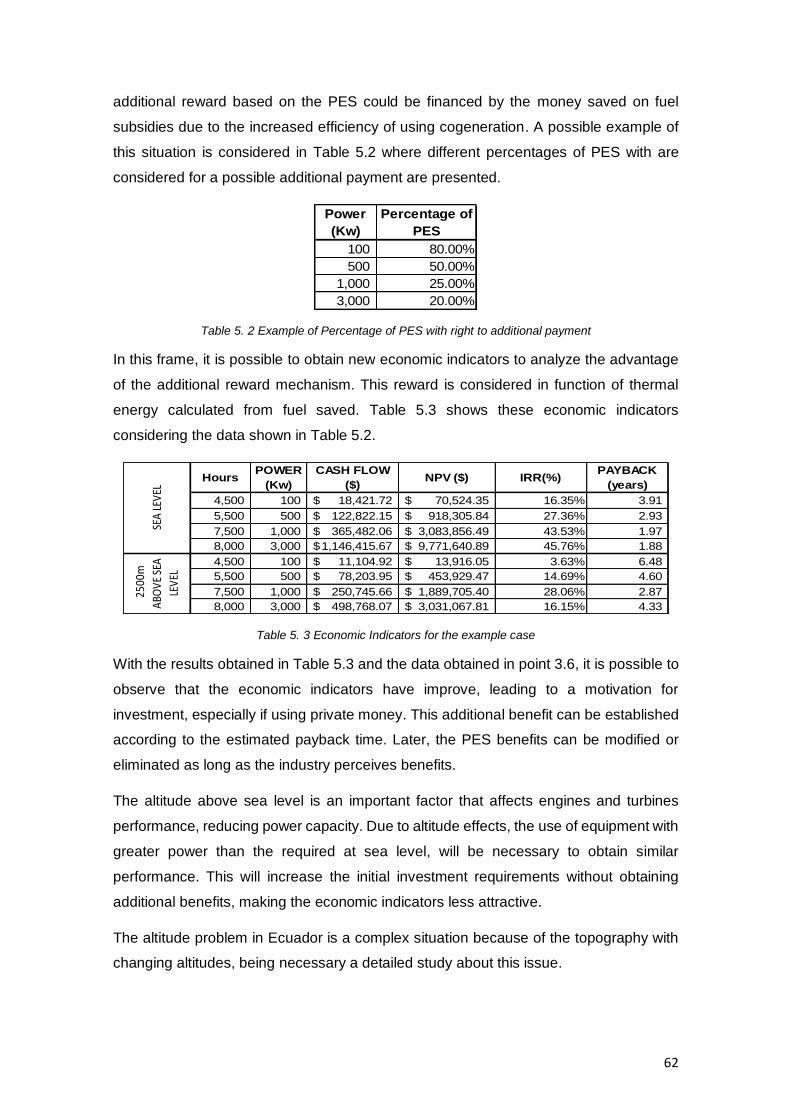
62
additional reward based on the PES could be financed by the money saved on fuel
subsidies due to the increased efficiency of using cogeneration. A possible example of
this situation is considered in Table 5.2 where different percentages of PES with are
considered for a possible additional payment are presented.
Power
(Kw)
Percentage of
PES
100 80.00%
500 50.00%
1,000 25.00%
3,000 20.00%
Table 5. 2 Example of Percentage of PES with right to additional payment
In this frame, it is possible to obtain new economic indicators to analyze the advantage
of the additional reward mechanism. This reward is considered in function of thermal
energy calculated from fuel saved. Table 5.3 shows these economic indicators
considering the data shown in Table 5.2.
HoursPOWER
(Kw)
CASH FLOW
($)NPV ($) IRR(%)
PAYBACK
(years)
4,500 100 18,421.72$ 70,524.35$ 16.35% 3.91
5,500 500 122,822.15$ 918,305.84$ 27.36% 2.93
7,500 1,000 365,482.06$ 3,083,856.49$ 43.53% 1.97
8,000 3,000 1,146,415.67$ 9,771,640.89$ 45.76% 1.88
4,500 100 11,104.92$ 13,916.05$ 3.63% 6.48
5,500 500 78,203.95$ 453,929.47$ 14.69% 4.60
7,500 1,000 250,745.66$ 1,889,705.40$ 28.06% 2.87
8,000 3,000 498,768.07$ 3,031,067.81$ 16.15% 4.33
SEA
LEV
EL
2500
m
ABO
VE
SEA
LEV
EL
Table 5. 3 Economic Indicators for the example case
With the results obtained in Table 5.3 and the data obtained in point 3.6, it is possible to
observe that the economic indicators have improve, leading to a motivation for
investment, especially if using private money. This additional benefit can be established
according to the estimated payback time. Later, the PES benefits can be modified or
eliminated as long as the industry perceives benefits.
The altitude above sea level is an important factor that affects engines and turbines
performance, reducing power capacity. Due to altitude effects, the use of equipment with
greater power than the required at sea level, will be necessary to obtain similar
performance. This will increase the initial investment requirements without obtaining
additional benefits, making the economic indicators less attractive.
The altitude problem in Ecuador is a complex situation because of the topography with
changing altitudes, being necessary a detailed study about this issue.

63
Currently, the use of diesel in medium and small industries is subsidized by the
government. A change in this combustible for the industrial sector can produce additional
benefits for both industry and government. An interesting scenario will be the change of
diesel by natural gas or fuel oil #4 because the price is half and therefore operative costs
are reduced.

64
This page was intentionally left blank
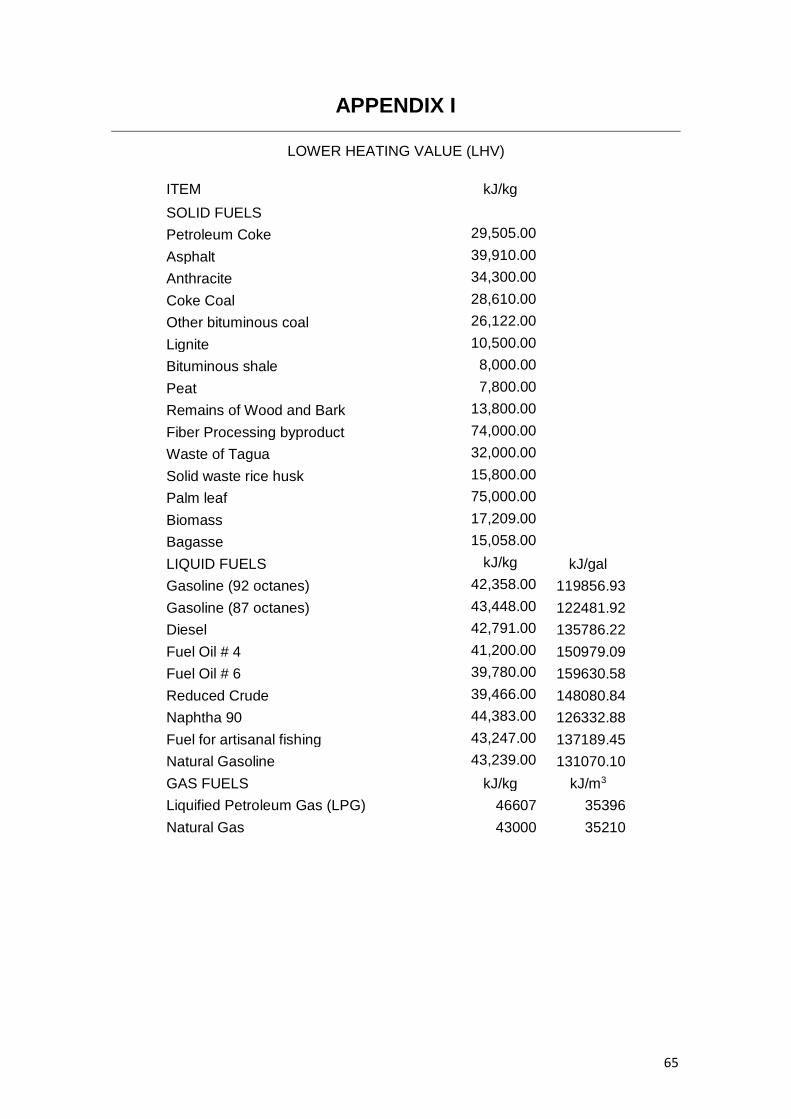
65
APPENDIX I
LOWER HEATING VALUE (LHV)
ITEM kJ/kg
SOLID FUELS
Petroleum Coke 29,505.00
Asphalt 39,910.00
Anthracite 34,300.00
Coke Coal 28,610.00
Other bituminous coal 26,122.00
Lignite 10,500.00
Bituminous shale 8,000.00
Peat 7,800.00
Remains of Wood and Bark 13,800.00
Fiber Processing byproduct 74,000.00
Waste of Tagua 32,000.00
Solid waste rice husk 15,800.00
Palm leaf 75,000.00
Biomass 17,209.00
Bagasse 15,058.00
LIQUID FUELS kJ/kg kJ/gal
Gasoline (92 octanes) 42,358.00 119856.93
Gasoline (87 octanes) 43,448.00 122481.92
Diesel 42,791.00 135786.22
Fuel Oil # 4 41,200.00 150979.09
Fuel Oil # 6 39,780.00 159630.58
Reduced Crude 39,466.00 148080.84
Naphtha 90 44,383.00 126332.88
Fuel for artisanal fishing 43,247.00 137189.45
Natural Gasoline 43,239.00 131070.10
GAS FUELS kJ/kg kJ/m3
Liquified Petroleum Gas (LPG) 46607 35396
Natural Gas 43000 35210

66
APPENDIX II
FUEL PRICES
ITEM $/kg $/gal $/tonelada $/m3 $/kWh
97 octanes gasoline 1.972$
89 octanes gasoline 1.878$
Diesel 1.677$ 0.044$
Fuel Oil #4 2.843$ 0.759$ 284.343$ 0.019$
Fuel Oil #6 1.072$ 0.025$
Crudo Reducido 0.431$ 0.011$
Asfalto 0.304$ 0.037$
Petroleum Liquid Gas (PLG) 0.831$ 0.631$ 0.064$
Natural Gas 300.000$ 0.205$ 0.021$

67
APPENDIX III
METHODOLOGY USED TO CALCULATE COST
Considering the price of inversion, cost of fuel and cost of O&M:
𝑖 = 𝑃 ∗ 𝑝𝑖 (1)
𝑂&𝑀 = 𝑃 ∗ 𝑜𝑚𝑐 (2)
𝑓 =𝑃 ∗ ℎ
%𝑒𝑙∗ 𝑝𝑓 (3)
Where
𝑖 Initial Inversion ($). 𝑂&𝑀 Operating and Maintaining cost for year ($-year).
𝑓 Cost of fuel used in the year ($). 𝑝𝑓 Price of fuel (kWh)
𝑃 Power of Engine (kW).
𝑝𝑖 Price for kW installed ($/kW). 𝑜𝑚𝑐 Operating and maintenance cost by kW ($/kW-year).
𝐻𝑅 Heat Rate (kJ/kWh). ℎ hours of function in the year Calculate thermal energy saved and the price of this by
𝐻𝐶𝐻𝑃 =𝑃 ∗ ℎ
%𝑒𝑙∗ %𝑡ℎ (4)
𝑓𝑠𝑎𝑣𝑒𝑑 = 𝐻𝐶𝐻𝑃 ∗ 𝑝𝑓 (5)
Where
𝐻𝐶𝐻𝑃 Thermal Energy saved by year (kWh). 𝑓𝑠𝑎𝑣𝑒𝑑 Price of fuel saved ($).
%𝑡ℎ Thermal efficiency (%). %𝑒𝑙 Electrical efficiency (%).
Calculate the cost of kWh generated by year:
𝐸𝐶𝐻𝑃 = 𝑃 ∗ ℎ
(6)
𝐶𝑘𝑊ℎ =𝑂&𝑀 + 𝑓 − 𝑓𝑠𝑎𝑣𝑒𝑑
𝐸𝐶𝐻𝑃 (7)
Where
𝐶𝑘𝑊ℎ Cost by kWh generated ($/kWh)
𝐸𝐶𝐻𝑃 Electrical Energy Produced in the year (kWh). 𝑡 Lifetime to project (years).

68
Considering the above procedure, it is possible to obtain cash flow and economic
indicators such as Net Present Value (NPV), Internal Rate of Return (IRR), and payback
𝑄𝑛 = 𝐸𝐶𝐻𝑃 ∗ 𝑝𝑘𝑊ℎ + 𝑓𝑠𝑎𝑣𝑒𝑑 − 𝑂&𝑀 − 𝑓 (8)
𝑁𝑃𝑉 = −𝑖 + ∑𝑄𝑛
(1 + 𝑟)𝑛
𝑡
𝑛=1
(9)
Where
𝑝𝑘𝑊ℎ price of kWh according to prices presented in the point 3.6 ($/kWh)
𝑄𝑛 cash flow
𝑟 discount rate
In the equation (9) if
- NVP > 0 the project is profitable.
- NVP < 0 the project is not profitable.
- NVP = 0 is necessary view other indicators.
The economic parameter IRR is possible to determinate when NPV=0.

69
APPENDIX IV
PRIMARY ENERGY SAVINGS
To determine the primary energy saved by cogeneration, it was considered a
system as shown in the next Figure.
Engine Recovery BoilerExhaust gas Hchp
Exhaust gas
Echp
Fcc
Auxiliary BoilerFno-chp Hno-chp
Steam
Appendix Figure. 1 Basic System
This system considers the following:
- Auxiliary boiler consumes 5% of total fuel used by engine or turbine. This energy
is used for the fluid to reach industrial characteristics.
- Recovery boiler uses exhaust gases from engine to recover thermal energy.
- 𝐻𝑐ℎ𝑝 and 𝐻𝑛𝑜−𝑐ℎ𝑝 are thermal energy from cogeneration and no-cogeneration
respectively.
Now based in the European Directive 27/2012/UE, the next process it was considered
to determinate different parameters to evaluate efficiency of the system, compared with
a traditional process where electricity and thermal energy is produced separately.
Total thermal energy consumed by the system is given by:
𝐻 = 𝐻𝑐ℎ𝑝 + 𝐻𝑛𝑜−𝑐ℎ𝑝
(10)
Fuel used to produce this heat is:
𝐹𝑐𝑐 = 𝐹𝑐ℎ𝑝 + 𝐹𝑛𝑜−𝑐ℎ𝑝
(11)
Now, the overall performance of system is given by
𝜂 =𝐸𝑐ℎ𝑝 + 𝐻𝑐ℎ𝑝
𝐹𝑐𝑐 (12)
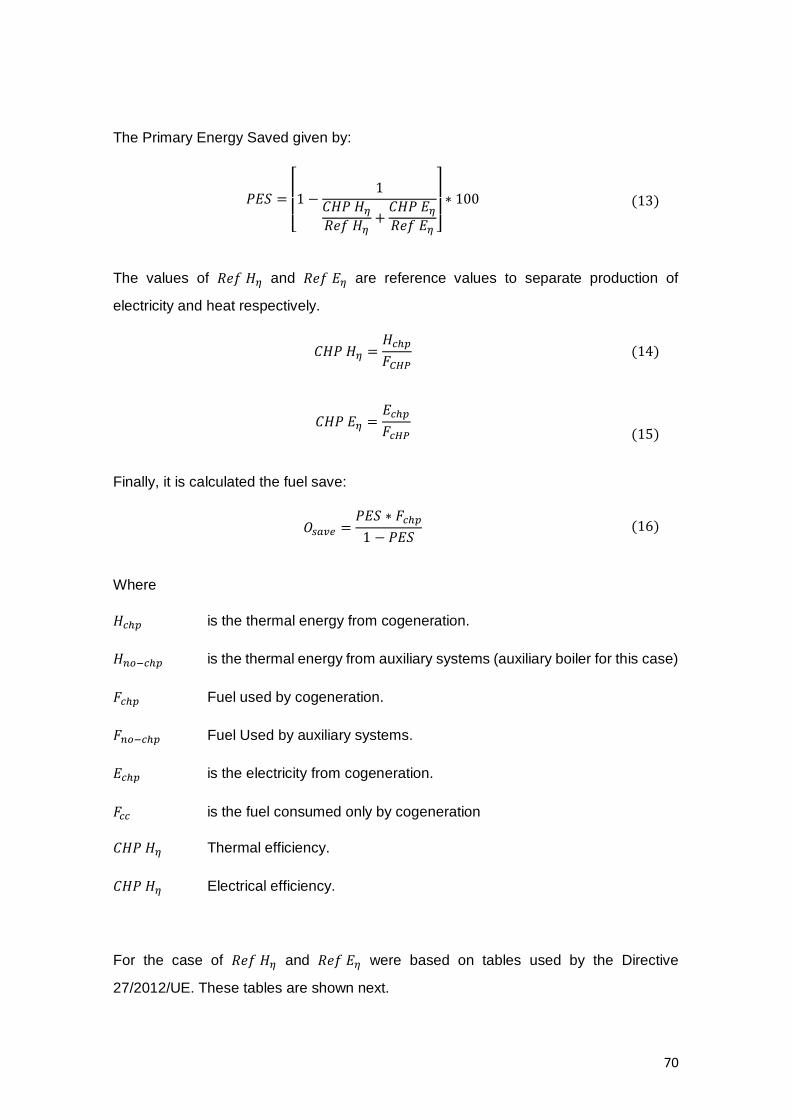
70
The Primary Energy Saved given by:
𝑃𝐸𝑆 =
[
1 −1
𝐶𝐻𝑃 𝐻𝜂
𝑅𝑒𝑓 𝐻𝜂+
𝐶𝐻𝑃 𝐸𝜂
𝑅𝑒𝑓 𝐸𝜂 ]
∗ 100
(13)
The values of 𝑅𝑒𝑓 𝐻𝜂 and 𝑅𝑒𝑓 𝐸𝜂 are reference values to separate production of
electricity and heat respectively.
𝐶𝐻𝑃 𝐻𝜂 =𝐻𝑐ℎ𝑝
𝐹𝐶𝐻𝑃
(14)
𝐶𝐻𝑃 𝐸𝜂 =𝐸𝑐ℎ𝑝
𝐹𝑐𝐻𝑃
(15)
Finally, it is calculated the fuel save:
𝑂𝑠𝑎𝑣𝑒 =𝑃𝐸𝑆 ∗ 𝐹𝑐ℎ𝑝
1 − 𝑃𝐸𝑆
(16)
Where
𝐻𝑐ℎ𝑝 is the thermal energy from cogeneration.
𝐻𝑛𝑜−𝑐ℎ𝑝 is the thermal energy from auxiliary systems (auxiliary boiler for this case)
𝐹𝑐ℎ𝑝 Fuel used by cogeneration.
𝐹𝑛𝑜−𝑐ℎ𝑝 Fuel Used by auxiliary systems.
𝐸𝑐ℎ𝑝 is the electricity from cogeneration.
𝐹𝑐𝑐 is the fuel consumed only by cogeneration
𝐶𝐻𝑃 𝐻𝜂 Thermal efficiency.
𝐶𝐻𝑃 𝐻𝜂 Electrical efficiency.
For the case of 𝑅𝑒𝑓 𝐻𝜂 and 𝑅𝑒𝑓 𝐸𝜂 were based on tables used by the Directive
27/2012/UE. These tables are shown next.

71
For the 𝑅𝑒𝑓 𝐸𝜂 case, the following efficiencies are considered
TYPE OF FUEL USED
Liquid fuel 44.2%
LPG 44.2%
Natural Gas 52.5%
Appendix Table. 1 Reference value for separate production of electricity. (IDAE and Ministerio de
Industria, Tourism and Trade of Spain, 2008, p. 33)
To obtain the final value of 𝑅𝑒𝑓 𝐸𝜂 it is necessary to correct the value considering losses
caused by transmission.
Voltage Level Self-consumption
250 kV 0.985
135 kV 0.965
50-100 kV 0.945
5-22 kV 0.925
<0.4kV 0.860
Appendix Table. 2 Correction factor by tension level. (IDAE and Ministerio de Industria, Tourism and Trade of Spain, 2008, p. 34)
For the 𝑅𝑒𝑓 𝐻𝜂 case is considered the efficiency
ITEM Heat
Steam/ water
Direct Use of exhaust
gas
LIQUID FUELS Liquid Fuel 89% 81%
GAS FUELS
Liquified Petroleum Gas
(LPG) 89% 81%
Natural Gas 90% 82%
Appendix Table. 3 Reference value for separate production of heat. (IDAE and Ministerio de Industria, Tourism and Trade of Spain, 2008, p. 35)
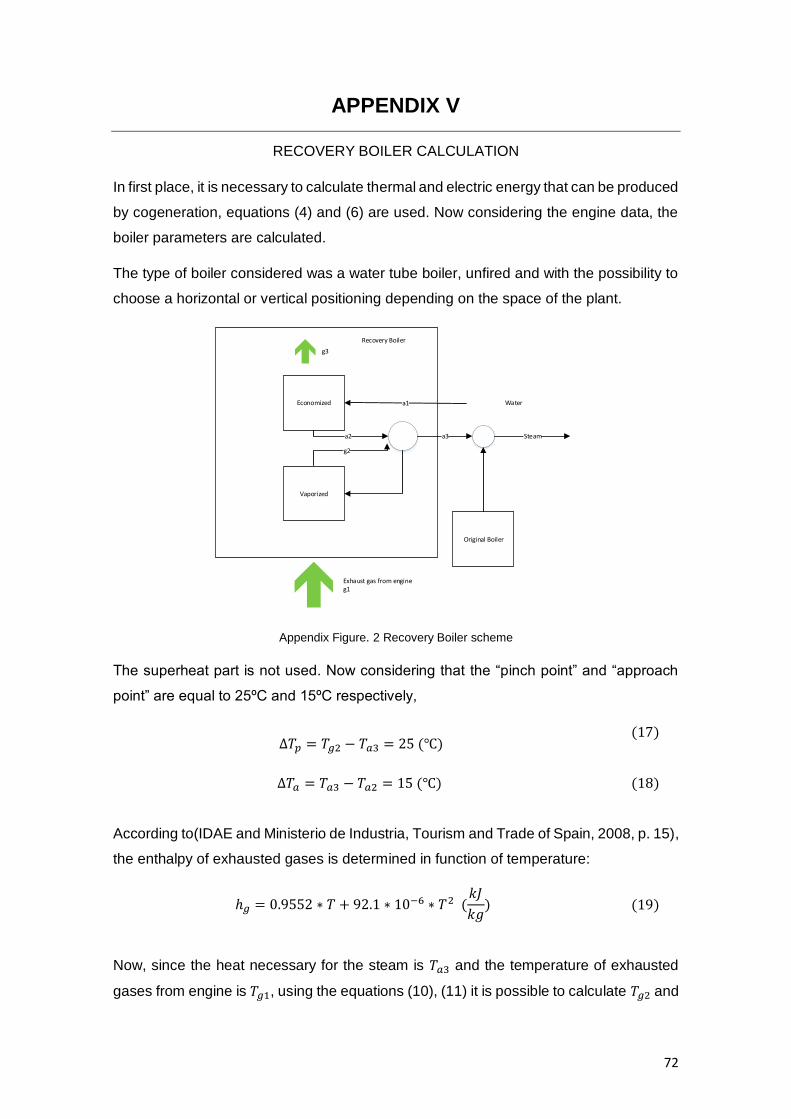
72
APPENDIX V
RECOVERY BOILER CALCULATION
In first place, it is necessary to calculate thermal and electric energy that can be produced
by cogeneration, equations (4) and (6) are used. Now considering the engine data, the
boiler parameters are calculated.
The type of boiler considered was a water tube boiler, unfired and with the possibility to
choose a horizontal or vertical positioning depending on the space of the plant.
Vaporized
Economized
calderin
a1
a2
g2
a3calder
in
Original Boiler
Exhaust gas from engineg1
g3
Steam
Recovery Boiler
Water
Appendix Figure. 2 Recovery Boiler scheme
The superheat part is not used. Now considering that the “pinch point” and “approach
point” are equal to 25ºC and 15ºC respectively,
∆𝑇𝑝 = 𝑇𝑔2 − 𝑇𝑎3 = 25 (℃) (17)
∆𝑇𝑎 = 𝑇𝑎3 − 𝑇𝑎2 = 15 (℃)
(18)
According to(IDAE and Ministerio de Industria, Tourism and Trade of Spain, 2008, p. 15),
the enthalpy of exhausted gases is determined in function of temperature:
ℎ𝑔 = 0.9552 ∗ 𝑇 + 92.1 ∗ 10−6 ∗ 𝑇2 (𝑘𝐽
𝑘𝑔)
(19)
Now, since the heat necessary for the steam is 𝑇𝑎3 and the temperature of exhausted
gases from engine is 𝑇𝑔1, using the equations (10), (11) it is possible to calculate 𝑇𝑔2 and
73
𝑇𝑎2 using tables of temperature and pressure of water, and using equation 19 is possible
to obtain ℎ𝑎1, ℎ𝑎2 and ℎ𝑎3 based on the steam characteristics.
According to the following equations, it is possible to obtain the thermal energy transfer,
from exhaust gases to water, and the mass of steam from the recovery boiler.
𝑞𝑣𝑎𝑝̇ = 𝑚𝑔 (ℎ𝑔(𝑇𝑔1))− ℎ𝑔(𝑇𝑔2))
) (kJ
s) (20)
𝑚𝑠𝑡𝑒𝑎𝑚 =𝑞𝑣𝑎𝑝
ℎ𝑎3 − ℎ𝑎2 (
kg
s)
(21)
Finally, is necessary to determinate the power that the steam brings into the system, the
efficiency of boiler and the energy fuel saved.
𝑃𝑠𝑡𝑒𝑎𝑚 = 𝑚𝑠𝑡𝑒𝑎𝑚(ℎ𝑎3 − ℎ𝑎1) (𝑘𝐽
𝑠) (22)
%𝑏𝑟 = 𝑃𝑠𝑡𝑒𝑎𝑚
𝑃 ∗%𝑡ℎ
%𝑒𝑙
(%)
(23)
The boiler power is given by
𝑃𝑏𝑜𝑖𝑙𝑒𝑟 = 𝑃 ∗%𝑡ℎ
%𝑒𝑙 (𝑘𝑊)
(24)
When
ℎ Enthalpy (kJ/kg).
𝑞𝑣𝑎𝑝̇ Energy transfer to exhaust gas to water (kW).
𝑚𝑠𝑡𝑒𝑎𝑚 Steam Production by boiler recovery (kg/s).
𝑃𝑠𝑡𝑒𝑎𝑚 Power steam from boiler recover (kW).
%𝑏𝑟 Efficiency of recovery boiler (%).
%𝑏𝑜𝑖𝑙𝑒𝑟 Efficiency of original boiler (%).
𝑞𝑣𝑎𝑝̇ Temperature transfer to exhaust gas to water (kJ/s).

74
This page was intentionally left blank
75
REFERENCES
Alexandra Buri, Liliana Sánchez, Andrés Cepeda, Patricio Cañizares, Lenin Haro,
Verónica Cárdenas, Wilson Calvopiña, 2013. Factor de Emisión de CO2 del
Sistema Nacional Interconectado del Ecuador. Ministerio del Ambiente--
Ministerio de Electricidad y Energía Renovable ----Corporación Centro Nacional
de Energía ---Consejo Nacional de Electricidad.
Anne Hampson, Rick Tidball, Michael Fucci, Rachel Weston, 2016. Combined Heat
and Power (CHP) Technical Potential in the United States.
ARCONEL, 2016. Pliego Tarifario para las Empresas Eléctricas. Sector Público de
Energía Eléctrica. Periodo: Enero Diciembre de 2017.
Banco Central del Ecuador, 2017. Tasas de Interés Julio-2017 [WWW Document].
Tasas Interés Julio-2017. URL
https://contenido.bce.fin.ec/documentos/Estadisticas/SectorMonFin/TasasIntere
s/TasasVigentes072017.htm (accessed 9.30.17).
Capstone Turbine Corporation, 2006. Technical Reference Capstone Model C30
Performance.
Cummins, 1997. VTA28-G5 Generator Dive.
David Delgado, 2015. Balance Energético Nacional 2015.
Eva-Maria Klotz, Marcus Koepp, Frank Peter, Nils Thamling, Marco Marco Wünsch,
Inka Ziegenhagen, Dr. Bernd Eikmeier, Max Fette, Karen Janssen, Prof. Dr.
Eberhard Jochem, Dr. Felix Reitze, Michael Schön, Dr. Felipe Toro, Markus
Gailfuss, 2014. Potential Analysis and cost-benefit analysis for cogeneration
applications and review of the Cogeneration Act in 2014.
IDAE, Ministerio de Industria, Tourism and Trade of Spain, 2008. Guía Técnica para la
Medida y Determinación del Calor Ùtil, la electricidad y del ahorro de energía
primaria de Cogeneracion de Alta Eficiencia.
IEA, 2008. Combined Heat and Power. Evaluating the benefits of greater global
investment.
ISR-UC, INESC Coimbra, 2016. Study on the Potential for High-Efficiency
Cogeneration in Portugal.
Javier Miranda, 2010. Potencial de Cogeneración en México y su Posible Desarrollo.
Universidad Nacional Autónoma de México, México D.F.
Joel Bluestein, Marie Lihn, n.d. Historical Impact and Future Trends in Industrial
Cogeneration.
Joseph A. Orlando, 1991. Cogeneration Planner’s Handbook. Fairmont Press, Inc.,
USA.

76
Ministry of Industry, Energy and Tourism of Spain, 2016. Full Assessment of the
Potential Use of High-Efficiency Cogeneration and Efficient District HEating and
Cooling Systems.
Neil Petchers, 2003. Combined Heating, cooling and power handbook: technologies
and applications. The Fairmont Press, INC.
New Buildings Institute for the Southern California Gas Company, 1998. Absorption
Chillers.
United Nations, 2008. International Standard Industrial Classification of All Economic
Activities (ISIC), Rev. 4.