DISSERTATION MANAGING THROUGH MEASUREMENT: OCCUPATIONAL ...
218
DISSERTATION MANAGING THROUGH MEASUREMENT: OCCUPATIONAL HEALTH AND SAFETY IN THE CONSTRUCTION INDUSTRY Submitted by Natalie V. Schwatka Department of Environmental and Radiological Health Sciences In partial fulfillment of the requirements For the Degree of Doctor of Philosophy Colorado State University Fort Collins, Colorado Spring 2014 Doctoral Committee: Advisor: John Rosecrance David Gilkey William Brazile Kimberly Henry
Transcript of DISSERTATION MANAGING THROUGH MEASUREMENT: OCCUPATIONAL ...

DISSERTATION
MANAGING THROUGH MEASUREMENT: OCCUPATIONAL HEALTH AND SAFETY IN THE
CONSTRUCTION INDUSTRY
Submitted by
Natalie V. Schwatka
Department of Environmental and Radiological Health Sciences
In partial fulfillment of the requirements
For the Degree of Doctor of Philosophy
Colorado State University
Fort Collins, Colorado
Spring 2014
Doctoral Committee:
Advisor: John Rosecrance David Gilkey William Brazile Kimberly Henry

Copyright by Natalie Virginia Schwatka 2014
All Rights Reserved

ABSTRACT
MANAGING THROUGH MEASUREMENT: OCCUPATIONAL HEALTH AND SAFETY IN THE
CONSTRUCTION INDUSTRY
The purpose of my dissertation was to describe five original research activities designed
to characterize and enhance the health and safety of U.S. construction workers. The sequence
of research activities illustrates my focus on occupational health and safety (OHS)
measurement methods (i.e., lagging and leading measures), as well as an interest in translating
this research into practical methods for industry stakeholders. First, I investigated a vulnerable
sub-population of construction workers, the aging workforce, via a literature review and analysis
of workers’ compensation (WC) data. Through the results of these studies, I found that aging
workers may have a different OHS experience than younger workers (e.g., greater lost work
time costs), but the frequency and cost of injuries and illnesses was high regardless of worker
age. Furthermore, in the cost regression models, the age of the claimant only accounted for a
small amount of variance, which suggests that other factors influence the cost of a WC claim
(e.g., organizational factors such as safety climate). Second, I investigated safety climate
measurement methods, and translated prior safety climate research into an intervention for
construction site supervisors. I demonstrated that safety climate could be measured via worker
perceptions of top management, supervisor, and co-workers’ response to safety on the job.
Furthermore, a supervisor workshop focused on safety climate concepts could improve the
safety participation behaviors of supervisors, and their crewmembers. Taken together, my
findings demonstrate that both lagging and leading measures are valuable indicators of safety
performance. Lagging measures such as WC data may serve as motivators for contractors to
make decisions regarding safety. Leading measures such as safety climate and safety
behaviors may also be useful, because we can use them to identify hazards and their
associated risks before they result in serious negative outcomes. Since it was beyond the
ii

scope of my dissertation to measure both lagging and leading measures simultaneously, it is
important for future research to evaluate the predictive validity of these measures of OHS.
iii

ACKNOWLEDGEMENTS
The entirety of my gratitude for my colleagues and family cannot be expressed
adequately within this document. I would first like to thank Dr. John Rosecrance, my advisor of
five years, for his support, encouragement, and time spent developing me as a scholar. I am
grateful for the numerous opportunities he has given me to take my education outside of the
classroom.
I would also like to thank Dr. William Brazile, Dr. Lesley Butler, Dr. Maggie Clark, Dr.
David Gilkey, and Dr. Kimberly Henry for their advice and insight. I would like to especially
thank Dr. Lesley Butler and Dr. Kimberly Henry for their study design and data analysis help. A
special thanks to Dr. James Grosch, Steven Hecker, Rob Paulsen, Kate Johnesee, Janalee
Thompson, and Krista Hoffmeister for their help in designing and carrying out study five’s
activities.
Regrettably, I cannot name all those who have helped make my dissertation possible.
Many of these individuals come from the National Institute for Occupational Safety and Health’s
Mountain and Plains Education and Research Center and the Center for Construction Research
and Training. I am grateful for the financial and scholarly support I received from these
organizations. I am also grateful for all of the companies that participated in this dissertation’s
studies. Each of them took the time out of their workdays to help me plan and carryout many
aspects of the research projects. Without their support, this dissertation would not have been
possible.
My gratitude also extends to my family. I am thankful for my Father and Mother who
continue to invest much time, love, and support in my development as a person and as a
scholar. Lastly, and certainly not least, I would like to thank my husband and best friend,
Chase. I am grateful for his love, support and understanding throughout my entire time in
graduate school.
iv

TABLE OF CONTENTS
ABSTRACT ................................................................................................................................. ii ACKNOWLEDGEMENTS .......................................................................................................... iv LIST OF TABLES ....................................................................................................................... ix LIST OF FIGURES ..................................................................................................................... x DEFINITION OF TERMS AND ACRONYMS ............................................................................. xi PART I ....................................................................................................................................... 1 Dissertation Review ................................................................................................................... 1
Chapter 1 ............................................................................................................................... 2 Introduction ............................................................................................................................ 2
1.1. Dissertation overview................................................................................................ 2 1.2. Aims of dissertation .................................................................................................. 3 1.3. History and future of OHS ......................................................................................... 5 1.4. Structure of the United States (US) construction industry ......................................... 7 1.5. Characterization of injuries, illness and fatalities in the construction industry ............ 9
1.5.1. Impact of the aging workforce .............................................................................................. 10 1.6. Safety performance measurement ...........................................................................11
1.6.1. Lagging measures ............................................................................................................ 12 1.6.2. Leading measures ............................................................................................................ 13
1.6.2.1. Safety climate measures ........................................................................................... 13 1.7. OHS interventions ...................................................................................................16
1.7.1. Leader focused interventions ........................................................................................... 17 1.8. Dissertation significance ..........................................................................................18 1.9. Dissertation hypotheses and research questions .....................................................19
Chapter 2 ..............................................................................................................................20 Methods ................................................................................................................................20
2.1. Study participants and data collection procedures ...................................................22 2.2. Variables studied .....................................................................................................23 2.3. Statistical analyses ..................................................................................................25
Chapter 3 ..............................................................................................................................28 Results ..................................................................................................................................28
3.1. Results: Study 1 ......................................................................................................29 3.2. Results: Study 2 ......................................................................................................29 3.3. Results: Study 3 ......................................................................................................31 3.4. Results: Study 4 ......................................................................................................32 3.5. Results: Study 5 ......................................................................................................33
Chapter 4 ..............................................................................................................................35 Discussion .............................................................................................................................35
4.1. Dissertation strengths and limitations ......................................................................41 4.2. Recommendations for future research .....................................................................42 4.3. Conclusions .............................................................................................................43
References ............................................................................................................................44 PART II .....................................................................................................................................50 Aging workforce and injury in the construction industry .............................................................50
Chapter 1 ..............................................................................................................................51 Introduction ...........................................................................................................................51 Chapter 2 ..............................................................................................................................53 Methods ................................................................................................................................53
v

Chapter 3 ..............................................................................................................................55 Results ..................................................................................................................................55
3.1. An aging US workforce ...............................................................................................55 3.1.1. An aging workforce in the US construction industry ............................................................ 56 3.1.2. Susceptibility to injury among an aging workforce ............................................................... 57
3.2. Age-related injury in the construction industry ............................................................57 3.2.1. Causes of injuries in the construction industry .................................................................... 66 3.2.2. Types of injuries in the construction industry ....................................................................... 68 3.2.3. Injury-related costs in the construction industry ................................................................... 69
Chapter 4 ..............................................................................................................................71 Discussion .............................................................................................................................71
4.1. Promotion of work ability ............................................................................................71 4.2. Recommendations for future research ........................................................................72
References ............................................................................................................................76 PART III ....................................................................................................................................81 Age in relation to workers’ compensation costs in the construction industry ..............................81
Chapter 1 ..............................................................................................................................82 Introduction ...........................................................................................................................82 Chapter 2 ..............................................................................................................................84 Methods ................................................................................................................................84
2.1. Workers’ Compensation Database .............................................................................84 2.2. Statistical Analyses.....................................................................................................85
Chapter 3 ..............................................................................................................................87 Results ..................................................................................................................................87 Chapter 4 ..............................................................................................................................98 Discussion .............................................................................................................................98
4.1. Strengths and Limitations ........................................................................................ 101 4.2. Conclusions .............................................................................................................. 102
References .......................................................................................................................... 104 PART IV .................................................................................................................................. 107 From management to co-workers: The impact of safety climate perceptions on safety behaviors in the construction industry...................................................................................................... 107
Chapter 1 ............................................................................................................................ 108 Introduction ......................................................................................................................... 108
1.1. Safety climate: Perceptions of top management, supervisors and co-workers ....... 109 1.1.1. Perceptions of management ........................................................................................... 110 1.1.2. Perceptions of co-workers .............................................................................................. 111
1.2. Present study ........................................................................................................ 113 Chapter 2 ............................................................................................................................ 116 Methods .............................................................................................................................. 116
2.1. Participants & Procedure ....................................................................................... 116 2.2. Measures............................................................................................................... 117
2.2.1. Safety climate ................................................................................................................. 117 2.2.2. Safety behaviors ............................................................................................................. 118
2.3. Analyses ................................................................................................................ 118 Chapter 3 ............................................................................................................................ 120 Results ................................................................................................................................ 120
3.1. Confirmatory factor analysis .................................................................................. 120 3.2. Structural equation modeling ................................................................................. 121
Chapter 4 ............................................................................................................................ 125 Discussion ........................................................................................................................... 125
4.1. Future directions & Limitations ............................................................................... 127
vi

4.1.1. Relationships to be addressed ....................................................................................... 127 4.1.2. Safety climate interventions ............................................................................................ 128
4.2. Limitations ............................................................................................................. 129 4.3. Conclusions ........................................................................................................... 129
References .......................................................................................................................... 130 Appendix 4.I ........................................................................................................................ 134 Safety behavior and safety climate survey questions .......................................................... 134 Appendix 4.II ....................................................................................................................... 139 Safety climate and safety behavior: Confirmatory factor analysis results ............................. 139
PART V ................................................................................................................................... 140 Construction supervisors' safety performance: The impact of safety climate perceptions and safety climate knowledge on safety behaviors ..................................................................... 140 Chapter 1 ............................................................................................................................ 141 Introduction ......................................................................................................................... 141
1.1. Safety behaviors and the factors that influence them ............................................. 141 1.1.1. Types of safety behaviors ............................................................................................... 141 1.1.2. Safety climate perceptions.............................................................................................. 142 1.1.3. Safety climate knowledge ................................................................................................. 143
Chapter 2 ............................................................................................................................ 145 Methods .............................................................................................................................. 145
2.1. Participants ............................................................................................................ 145 2.2. Measures............................................................................................................... 145 2.3. Statistical analyses ................................................................................................ 146
Chapter 3 ............................................................................................................................ 147 Results ................................................................................................................................ 147 Chapter 4 ............................................................................................................................ 149 Discussion ........................................................................................................................... 149
4.1. Limitations ............................................................................................................. 152 4.2. Conclusion ............................................................................................................. 152
Appendix 5.I ........................................................................................................................ 156 Safety climate knowledge questions.................................................................................... 156
PART VI .................................................................................................................................. 158 Safety climate and safety leadership training for construction supervisors .......................... 158 Chapter 1 ............................................................................................................................ 159 Introduction ......................................................................................................................... 159
1.1. Leader-focused safety climate intervention strategies .............................................. 160 1.2. Present study ........................................................................................................... 162
Chapter 2 ............................................................................................................................ 164 Methods .............................................................................................................................. 164
2.1. Study design & participants ................................................................................... 164 2.2. Intervention components ....................................................................................... 166
2.2.1. Workshop ........................................................................................................................ 166 2.2.2. Progress checks ............................................................................................................. 167
2.3. Intervention evaluation ........................................................................................... 168 2.3.1. Process evaluation ......................................................................................................... 168 2.3.2. Outcome evaluation ........................................................................................................ 168 2.3.3. Statistical analysis .......................................................................................................... 170
2.3.3.2. Data preparation ...................................................................................................... 170 2.3.3.3. Latent growth modeling ........................................................................................... 174
Chapter 3 ............................................................................................................................ 177 Results ................................................................................................................................ 177
3.1. Process evaluation ................................................................................................ 177
vii

Chapter 4 ............................................................................................................................ 187 Discussion ........................................................................................................................... 187
4.1. Future directions ...................................................................................................... 189 4.2. Strengths and limitations ....................................................................................... 191 4.3. Conclusions ........................................................................................................... 192
Appendix 6.I. ....................................................................................................................... 199 Progress check guide .......................................................................................................... 199 Appendix 6.II ....................................................................................................................... 203 Workshop and progress check organization and content .................................................... 203 Appendix 6.III. ..................................................................................................................... 204 Workshop reaction and training transfer behaviors survey questions .................................. 204
viii
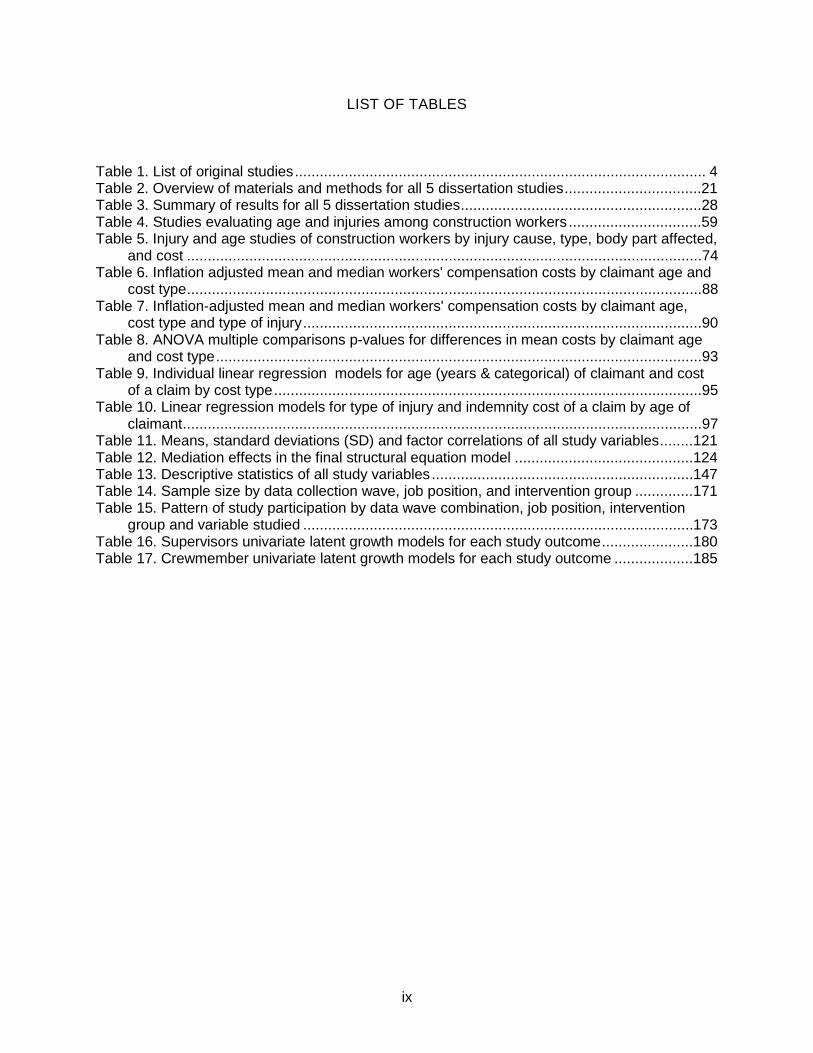
LIST OF TABLES Table 1. List of original studies ................................................................................................... 4 Table 2. Overview of materials and methods for all 5 dissertation studies .................................21 Table 3. Summary of results for all 5 dissertation studies ..........................................................28 Table 4. Studies evaluating age and injuries among construction workers ................................59 Table 5. Injury and age studies of construction workers by injury cause, type, body part affected,
and cost ............................................................................................................................74 Table 6. Inflation adjusted mean and median workers' compensation costs by claimant age and
cost type ............................................................................................................................88 Table 7. Inflation-adjusted mean and median workers' compensation costs by claimant age,
cost type and type of injury ................................................................................................90 Table 8. ANOVA multiple comparisons p-values for differences in mean costs by claimant age
and cost type .....................................................................................................................93 Table 9. Individual linear regression models for age (years & categorical) of claimant and cost
of a claim by cost type .......................................................................................................95 Table 10. Linear regression models for type of injury and indemnity cost of a claim by age of
claimant .............................................................................................................................97 Table 11. Means, standard deviations (SD) and factor correlations of all study variables ........ 121 Table 12. Mediation effects in the final structural equation model ........................................... 124 Table 13. Descriptive statistics of all study variables ............................................................... 147 Table 14. Sample size by data collection wave, job position, and intervention group .............. 171 Table 15. Pattern of study participation by data wave combination, job position, intervention
group and variable studied .............................................................................................. 173 Table 16. Supervisors univariate latent growth models for each study outcome ...................... 180 Table 17. Crewmember univariate latent growth models for each study outcome ................... 185
ix
LIST OF FIGURES
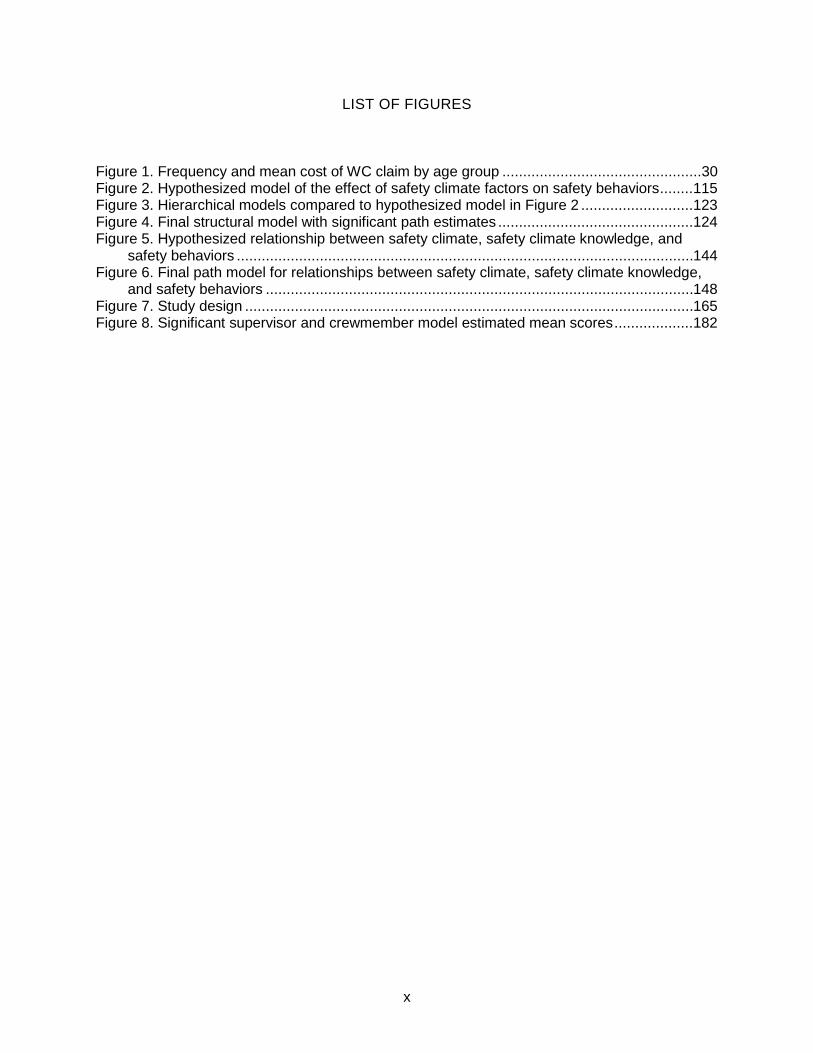
Figure 1. Frequency and mean cost of WC claim by age group ................................................30 Figure 2. Hypothesized model of the effect of safety climate factors on safety behaviors ........ 115 Figure 3. Hierarchical models compared to hypothesized model in Figure 2 ........................... 123 Figure 4. Final structural model with significant path estimates ............................................... 124 Figure 5. Hypothesized relationship between safety climate, safety climate knowledge, and
safety behaviors .............................................................................................................. 144 Figure 6. Final path model for relationships between safety climate, safety climate knowledge,
and safety behaviors ....................................................................................................... 148 Figure 7. Study design ............................................................................................................ 165 Figure 8. Significant supervisor and crewmember model estimated mean scores ................... 182
x

DEFINITION OF TERMS AND ACRONYMS Term Definition ANOVA Analysis of variance
BLS Bureau of labor statistics
CPI Consumer price index
CPWR Center for construction research and training
CSC Co-worker safety climate
EMR Experience modification rate
FTE Full time equivalent
HSUP Supervisor safety climate
HTM Top management safety climate
Lagging indicator An after-the-fact measure of OHS performance (e.g., workers’ compensation data)
Leading indicator A proactive measure of OHS performance (e.g., safety climate)
LGM Latent growth modeling
MSD Musculoskeletal disorder
NEISS-Work National electronic injury surveillance - Work
NIOSH National institute for occupational safety and health
NORA National Occupational Research Agenda
OHS Occupational health and safety
OHS Act Occupational Health and Safety Act of 1970
OSHA Occupational Safety and Health Administration
Safety behaviors Activities at work designed to 1) comply with company safety rules, and 2) support safety in the work environment
Safety climate Shared worker perceptions among the members of a social unit, of policies, procedures, and practices related to safety in the organization
Safety culture Deeply held but often unspoken safety-related beliefs, attitudes, and values that interact with an organization’s systems, practices, people, and leadership to establish norms about how things are done in the organization
SC Safety compliance behaviors (i.e., comply with company safety rules)
SCK Safety climate knowledge
SD Standard deviation
xi
SOII Survey of occupational injuries and illnesses
SP Safety participation behaviors (i.e., support safety in the work environment)
SSTL Safety specific transformational leadership (i.e., a style of leadership that involves stimulating, motivating, and active caring for workers safety and well-being)
TTB Training transfer behaviors
US United States
WC Workers’ compensation
WSR Workshop reaction
xii

PART I
Dissertation Review
1
Chapter 1
Introduction
1.1. Dissertation overview
Though the construction industry has improved its safety performance over the past
couple of decades, the industry continues to be one of the most dangerous. Industry
stakeholders have relied on lagging or after-the-fact measures of surveillance (e.g., workers’
compensation (WC) data) to identify injury, illness, and fatality prevention strategies. These
measures offer a “results” perspective on safety performance, and only offer a limited approach
to prevention efforts. Using leading measures of surveillance, on the other hand, allow for the
prediction of hazards and their associated risks before they result in poor safety outcomes
(Hale, 2009). Worker safety climate perceptions are an example of a leading indicator. They
represent the shared worker perceptions among the members of a social unit, of policies,
procedures, and practices related to safety in the organization. The purpose of my dissertation
is to highlight novel research activities designed to characterize and enhance the occupational
health and safety (OHS) of construction workers.
The approach of my dissertation was to utilize both lagging and leading indicators of
OHS to characterize and enhance the OHS experience of construction workers. This was
accomplished by carrying out a sequence of five studies, starting with lagging and leading
indicators, and ending with a method to proactively manage OHS. In my first two studies, I
investigated the influence of a construction workers’ age on injury susceptibility and injury costs
(e.g., medical and lost-work time) via a literature review and an analysis of WC data. Through
the results of my studies, I found that aging workers may have a different OHS experience than
younger workers (e.g., greater lost work time costs), but the frequency and cost of injuries and
illnesses is high regardless of worker age. Furthermore, the methods use by the authors in the
review studies were limited to lagging, after-the-fact measures, and were poor sources of
2

surveillance to be used to identify proactive OHS interventions. Thus, in my third, fourth, and
fifth studies I expanded upon a leading indicator of OHS performance, safety climate, to identify
ways to improve the OHS of all construction workers. I investigated safety climate
measurement methods, and I translated prior safety climate research into an intervention to help
construction site supervisors (e.g., foremen and superintendents) proactively influence the OHS
of their crewmembers on job sites.
My dissertation is structured such that the introductory chapter synthesizes all doctoral
research activities, and is followed by one original review article and four original research
studies (see Table 1). The specific aims of my dissertation are as follows:
1.2. Aims of dissertation
1. To characterize the OHS experience of construction workers in the United States by
measuring both lagging and leading indicators of safety performance.
2. To expand the concept of safety climate, a leading indicator of safety performance, by
evaluating its measurement methods and translating previous research findings into a
practical OHS intervention for the construction industry.
3

Table 1. List of original studies
Study Location in dissertation Article Study purpose Specifi
c aim 1 –
“Literature review”
PART II Schwatka, N.V., Butler, L.M., & Rosecrance, J. C. (2012). An aging workforce and injury in the construction industry. Epidemiologic Reviews 34(1), 156-167.
To summarize published literature on the aging workforce
1
2 – “WC data analysis”
PART III Schwatka, N.V., Butler, L.M., & Rosecrance, J. C. (2012). Age in relation to worker compensation costs in the construction industry. American Journal of Industrial Medicine 56(3), 356-366.
Investigate the association between worker age and injury type and workers’ compensation claim cost
1
3 – “Co-worker response to
safety”
PART IV Schwatka, N. V. & Rosecrance, J. C. (Under review). From management to co-workers: The impact of safety climate perceptions on safety behaviors. Safety science.
Evaluate a model of safety climate that is untested in the United States, which focuses on top management, supervisors, AND co-workers’ response to safety and how each influences personal safety behaviors
1 & 2
4 – “Safety climate
knowledge”
PART V Schwatka, N. V., Henry, K. & Rosecrance, J. C. (Under Review). Construction supervisors’ safety performance: The impact of safety climate perceptions and safety climate knowledge on safety behaviors. Journal of construction engineering and management.
Determine if supervisors’ safety climate knowledge mediates the relationship between supervisors’ safety climate perceptions and supervisor’s safety behaviors
1 & 2
5 – “Supervisor
intervention”
PART VI Schwatka, N. V., Grosch, J., Henry, K., & Rosecrance, J. (In preparation). Safety climate and safety leadership training for construction supervisors. Journal of Occupational Health Psychology.
Develop and evaluate a intervention targeted towards supervisors’ safety leadership, but with intended effects on supervisors and their crewmembers
2
4

1.3. History and future of OHS
Towards the end of the 18th century and throughout the 19th century, a great industrial
revolution swept the modern world up in a storm of advancement in living standards,
international trade, innovations, and manufacturing processes. Innovations such as James
Watt’s steam engine and Frank and Lillian Gilbreth’s motion study showed that society was
progressing towards a more technological society (Konz & Johnson, 2008). Despite these
impressive advancements, their effect on worker health and safety was unchecked. Abrams
(2001) noted that understanding the history of OHS requires understanding the context between
labor and capital. “Historically, the commitment to economic advancement through technology
has made us blind to the toll on community and worker health” (Levy, Wegman, Baron, &
Sokas, 2006 pg. 24).
Many notable events drew attention to hazardous working conditions, and towards the
late 19th century, social reformers worked together to improve working conditions. In 1907, a
coal mine explosion killed 362 people in Monogah, West Virginia leading to the U.S. Bureau of
Mines (MMWR, 1999). In 1906, Upton Sinclair’s book, The Jungle, depicted working conditions
in the meatpacking industry. It raised much awareness to the plight of the immigrant-working
class, but only resulted in new meat inspection laws. Interestingly, Upton Sinclair hoped his
undercover research would raise the public’s awareness of the working conditions specifically.
To his dismay he said, “I had been made a celebrity not because the public cared anything
about the sufferings of workers, but simply because the public did not want to eat tubercular
beef” (Abrams, 2001). In 1911, as a result of poor fire standards and work practices, the
Triangle Factory Fire killed 146 workers leading to many new labor laws and fire safety
measures (ILR School, Cornell University,, 2011). Many more events like these helped to push
society towards measures to protect the rights of workers to have a healthy and safe work
environment.
5

In the early 20th century, most US states adopted no fault workers’ compensation (WC)
laws, which requires companies to compensate worker’s injuries, illnesses and fatalities.
Compensation includes full medical coverage, partial wage replacement coverage, disability,
and death benefits. With the advent of the Occupational Safety and Health Act (OSH Act) of
1970, “safe and healthful working conditions for working men and women” were ensured for all
workers in the US. The Act made provisions for standards that all companies should meet,
penalties for failing to meet the standards, recordkeeping requirements, inspections, and
responsibilities of employers and employees (OSHA, 1996). Since the Act was passed, there is
now a greater understanding of job site hazards and the methods to control them. This is due to
effort from all industry stakeholders to identify and control hazards. This includes the research
efforts of the National Institute for Occupational Safety and Health, which was created by the
OSH Act of 1970 (Howard, Stafford, Branche, T, & Froetschet, 2010). Society’s attention to
OHS Act and subsequent governmental efforts to regulate OHS, has led to a decrease in
worker fatalities and injuries (MMWR, 1999).
While workers now operate in a safer environment than previous generations, much
work remains to be done. In the construction industry specifically, workers have a greater
chance of sustaining an injury during the course of their working career, as compared to other
industries like the service or healthcare sector (Kachan et al., 2012). When injured, many
workers often fail to report injuries to their employer because they believe that reporting is
unnecessary, it is a natural part of their job, and/or negative consequences will follow (Moore,
Cigularov, Sampson, Rosecrance, & Chen, 2013). The authors of one study bluntly titled their
article, “Safety, incentives, and the reporting of work-related injuries among union carpenters:
“You’re pretty much screwed if you get hurt at work” (Lipscomb, Nolan, & Patterson, 2013).
Underreporting also occurs at the contractor level, as contractors may fail to report injuries to
the Occupational Safety and Health Administration (OSHA) (Probst, Brubaker, & Barsotti, 2008).
Compared to white collar workers, construction workers have an increased odds of developing
6
many chronic diseases, such as back problems (Dong, Wang, Daw, & Ringen, 2011). The
injuries that construction workers sustain cost society millions of dollars per year in direct
medical costs and indirect costs associated with lost work time and disability (Schwatka, Butler,
& Rosecrance, 2012). While the OSH Act of 1970 made provisions for job site inspections to
insure compliance with government regulations, only 4% of construction establishments were
inspected in 2010 (CPWR, 2013). The future of OHS in the construction industry may require
surveillance and prevention efforts that proactively address hazards and their risks before they
escalate to cause serious outcomes (e.g., injury).
1.4. Structure of the United States (US) construction industry
Businesses in the construction industry are classified based on the type of work they do
and the types of job sites they work on. Contractors can be general contractors, specialty-trade
contractors, or construction managers, and sometimes contractors can be a combination of the
three. General contractors are responsible for all aspects of the construction project. Specialty-
trade contractors are responsible for a specific aspect of construction work, such as masonry or
piping. Construction managers manage the completion of the job, but do not perform any of the
actual work (Abrams, 2001). Job sites can vary broadly based on whether or not they are
residential, commercial, or heavy civil construction job sites. Residential home building involves
constructing single-family and multi-family residential buildings. Commercial construction
involves the construction of business for commerce. Heavy civil construction involves
engineering projects (e.g., highways or dams) (US Census Bureau, 2013). Any of these
construction projects can be new builds or renovations.
The “nature of the construction industry” is often cited as a major challenge to managing
and controlling OHS (Loushine, Hoonakker, Carayon, & Smith, 2006). Namely, multi-employer
worksites and industry instability are major factors that influence OHS. Job sites consist of
project owners/customers, general contractors, sub-contractors, unions, and tradesmen. Within
one contractor, there is a hierarchy composed of top management and engineers/designers and
7

those that actually work on the job sites (i.e., superintendents, foremen, journeymen and
apprentices). All involved in a project must deal with a supply chain as well (Carty, 1995).
Additionally, sites may be union, non-union, or mixed. Workers who belong to a union have ties
to both their union brotherhood as well as their contractors. The construction industry is
unstable because contractors move between job sites very frequently. Workers move between
job sites and contractors as project contracts arise, and thus many have many employers in a
short period of time.
The construction process itself leads to OHS management challenges as well. A
construction project begins with competitive bidding. Within each contractor and sub-contractor,
project estimators put together the project bid, and effectively set the stage for the project. They
analyze the cost, risk, and quantity of work. Bidding focuses on these “bottom line” issues, but
many contractors are moving towards a pre-qualification or partnership bidding process. This
means that many owners/general contractors prefer to work with sub-contractors with proven
records, and with sub-contractors they have worked with in the past (Carty, 1995). Regardless
of a sub-contractor’s track record, contractors are still always under pressure to finish on time
and within budget. This is because construction projects commonly encounter project setbacks
and delays (e.g., weather), design changes, and construction quality issues (ILR School, Cornell
University,, 2011; Loushine et al., 2006). Once the project begins, the operations department
oversees the project’s progression. Depending on the construction firm’s size, this department
can oversee many projects across cities, regions, and countries. At the site-level, the project
staff is responsible for the day-to-day operations of the site. They must interact with their own
workers as well as with other contractors to coordinate work. Depending on the contractor,
each of these departments (estimating, operations and site-level management) can be fully
integrated or disjointed. It is especially important for the estimating department to understand
job-site level working conditions. If OHS costs can be anticipated at the bidding level, they can
be properly accounted for before any issues arise. Additionally, sub-contractors move in and
8

out of the job site as needed. This means that many contractors, with their own methods of
managing OHS interact on the same job site. The general contractors will have their own OHS
standard for the job site (Xinyu & Hinze, 2006), but its effectiveness is susceptible to each sub-
contractor’s culture of safety (Lingard, Cooke, & Blismas, 2010). Thus, even if a sub-contractor
has a good OHS management system, their workers will be susceptible to other sub-
contractor’s OHS practices.
1.5. Characterization of injuries, illness and fatalities in the construction industry
According to the North American Industrial Classification System, the construction
industry is considered part of the “goods producing” super sector group (Bureau of Labor
Statistics, 2014). The goods producing classification includes industries dealing with natural
resources (agriculture, forestry, fishing, and hunting, mining, quarrying, and oil and gas
extraction), manufacturing, and construction. The construction industry is similar to these
industries in that it is a high hazard industry. While the service-providing super sector group
also has serious hazards, the incident rate of injuries requiring days away from work in the
goods producing super sector is higher (119.7 versus 97.7 per 10,000 full time employees (FTE)
in 2012) (Bureau of Labor Statistics, 2013b).
Within the goods producing super sector, the construction industry is one of the most
hazardous. Compared to the sector average (119.7 per 10,000 FTEs), the incident rate of non-
fatal injuries and illness resulting from days away from work was much higher (143.4) in the
construction industry in 2012 (Bureau of Labor Statistics, 2013b). Both the construction and
agriculture, forestry, fishing, and hunting sub-sectors had a higher incident rate of workers with
31 days or more away from work compared to the manufacturing sub-sector, 46 versus 30 per
10,000 FTEs, respectively (Bureau of Labor Statistics, 2013d). The construction industry
accounted for 44% of all fatalities in the goods producing super sector in 2012, but the fatal
injury incident rate was highest among the agricultural, forestry, fishing, and hunting industry
(9.5 versus 21.2 per 100,000 FTEs, respectively).
9

OSHA identified the hazards that most commonly result in injury or fatality in the
construction industry, and labeled them the “focus four hazards.” These hazards are falls,
caught-in or-between, struck-by, and electrocution (OSHA, n.d.). Fatal and non-fatal injuries
involving days away from work in 2012 were most commonly caused by these hazards. Non-
fatal injuries were most commonly caused by contact with objects (caught-in or-between and
struck-by hazards) (48 per 10,000 FTEs). Falls to a lower level (17 per 10,000 FTEs),
overexertion in lifting/lowering (15 per 10,000 FTEs), falls on the same level (12 per 10,000
FTEs), and exposure to harmful substances or environments (e.g., electrocutions) (5 per 10,000
FTEs) were the next most common causes of non-fatal injuries (Bureau of Labor Statistics,
2013b). The most common injuries from these exposures were sprains, strains, and tears (44
per 10,000 FTEs), fractures (17 per 10,000 FTEs), cuts (17 per 10,000 FTEs), and bruises and
contusions (9 per 10,000 FTEs) (Bureau of Labor Statistics, 2013c). Fatal injuries were most
commonly caused by transportation accidents (38%), falls, slips, and trips (36%), and contact
with objects and equipment (17%) (Bureau of Labor Statistics, 2013a).
1.5.1. Impact of the aging workforce
Specific sub-populations, such as small contractors, Latinos, and aging workers may be
more susceptible to poor OHS outcomes. The majority (80%) of all construction contractors are
small employers (1-9 employees) (Center for Construction Research and Training, 2013). Small
businesses may the lack resources needed to manage OHS, and researchers found some
evidence that they experience more injuries and illnesses than larger firms (Center for
Construction Research and Training, 2013; Dong et al., 2011; Lowery et al., 1998; Schwatka et
al., 2012). Latino construction workers are particularly susceptible to injury and death (Dong,
Men, & Ringen, 2010; Dong & Platner, 2004; US Census Bureau, 2013). This population of
workers experience a language barrier, legal citizenship issues, literacy issues, poor training,
and may continue work despite hazards for fear of losing their job (Brunette, 2004; Carty, 1995;
Loushine et al., 2006; Roelofs, Sprague-Martinez, Brunette, & Azaroff, 2011). Latino
10

construction workers may be more likely to be injured, but may be less likely to be compensated
for their injury than their non-Latino counterparts (Dong, Ringen, Men, & Fujimoto, 2007).
Lastly, the construction industry’s aging workforce may also be more susceptible to injury and
death. Workers experience many physical and mental changes as they get older, such as
changes in cardiac output and muscle mass (Fitzgerald, Tanaka, Tran, & Seals, 1997; Thomas,
2010). There is some evidence that older construction workers experience more serious
injuries than younger construction workers (Arndt et al., 2005), and may retire early from such
injuries (Welch, Haile, Boden, & Hunting, 2010). This trend is especially important to
understand, because the average age of a construction worker is increasing and the demand for
construction labor may exceed the labor pool in the coming decade (Center for Construction
Research and Training, 2013; Goodrum, 2004).
1.6. Safety performance measurement
Surveillance is an important component of OHS hazard prevention that can be used to
understand OHS trends. The goal of surveillance is to identify new prevention opportunities,
define the magnitude and distribution of problems, track trends, set priorities, and disseminate
the results to facilitate decisions that improve OHS (Levy et al., 2006). Surveillance can occur
at three levels: hazard, exposure, and outcome (Thacker, Stroup, Parrish, & Anderson, 1996).
These levels correspond to the three levels of injury and illness prevention: primary, secondary,
and tertiary. Understanding potential hazards before they harm workers represents a primary
prevention effort. Determining what workers are exposed to offers a chance to catch injuries,
illnesses and fatality risk before its effects become too advanced (i.e., secondary prevention).
Lastly, quantifying outcomes from exposures (e.g., sprain) can lead to tertiary prevention efforts
that seek to mitigate complications and disability. There are a number of different government
and industry surveillance sources, such as WC and OSHA logs. These sources are somewhat
easier to track overtime as companies must report their injuries, illnesses and fatalities to OSHA
and their WC carrier. These measures, however, are fraught with underreporting (Boden, 2013)
11

and can only account for injuries, illnesses, and fatalities after they occurred. Surveillance
measures (i.e., leading measures) that capture the qualities of the work environment that lead to
these negative outcomes may be more useful. Leading measures can act as a means of
primary and secondary prevention efforts.
1.6.1. Lagging measures
Surveillance measures such as WC data and OSHA logs are lagging indicators of OHS.
This means that they measure OHS outcomes (e.g., death) rather than hazards (e.g., poor
scaffolding). WC data are generated from a worker’s first report of injury form, which is given to
the company’s WC provider and an injury claim is generated. Throughout the life of the claim,
costs related to medical, lost-work time, disability and death benefits are paid to the employee
and their families. With each injury claim that a company files, their experience modification
rate (EMR) increases. WC providers use the EMR to estimate a company’s past and future
claim costs, so that providers can charge companies an appropriate insurance premium. More
claims result in higher premiums, and an increased EMR can stay on a company’s record for
three years (Hoonakker et al., 2005). Employers with more than 10 employees must maintain
and report their OSHA logs yearly. All injuries and illnesses resulting in more than first aid care,
restricted duty, days away from work, loss of consciousness, chronic diseases, and death must
be reported on the log. OSHA logs help the government conduct OHS surveillance, and help
companies compare their trends with others in their industry. There are other national data sets
that one can utilize for surveillance, such as the National Electronic Injury Surveillance System
that originates from emergency room visits. There are some benefits to using these sources of
data, such as easy access to a large amount of data and cost effectiveness because it has
already been collected.
However, both of these systems are susceptible to underreporting and cannot account
for the root cause(s) of injuries, illnesses, and fatalities. Workers may not report their injury to
their employer for fear of employer retribution, lack of recognition of occupational injuries by
12
physicians, employers or workers, administrative barriers or because alternative medical
providers might have been used (Bonauto, Silverstein, Kalat, & Connon, 2003). Conversely,
companies may not report all injuries, illnesses, and fatalities. Company underreporting can
benefit companies by keeping their injury, illness, and fatality rates and EMRs low. This
reduces the amount of money they have to spend on WC premiums, and helps to keep OSHA
inspectors at an arms length. In the construction industry specifically, many project contracts
require contractors to have OSHA rates and EMRs below a certain level. Thus, low OHSA log
rates and EMR’s can help contractors win project bids. Underreporting ultimately means that an
accurate monitoring of OHS trends cannot be made with these types of data. Furthermore,
these data cannot account for contributing factors such as lifestyle factors (e.g., smoking),
exposure to specific job-site hazards, or the way OHS is managed by the company (Dembe,
Erickson, & Delbos, 2004).
1.6.2. Leading measures
1.6.2.1. Safety climate measures
Safety climate perceptions are example of a leading measure of OHS. The
measurement of safety climate has a three-decade long history of scholarship. It entered the
academic literature in 1980 when Dov Zohar (1980) developed and tested a safety climate
perception survey in the manufacturing industry. He followed other organizational climate
researchers who argued that a company’s total organizational climate is an area of research
rather than a holistic measure of general company climate (Schneider, 1975). Thus, when
describing organizational climate one must specify what kind of climate they are focusing on
(e.g., climate for creativity, ethics, safety, etc.). He argued that safety climate perceptions
develop from observations of one’s work environment. Such observations lead to perceptions
and eventually behavior-outcome expectancies. Thus, safety climate perceptions “[serve] as a
frame of reference for guiding appropriate…behaviors” (Zohar, 1980 pg. 96). Since 1980,
numerous researchers have studied safety climate in a variety of industries, and have found it to
13

be a meaningful and predictive measure of OHS. Multiple researchers found through their
meta-analyses that significant relationships between safety climate and increased safety
knowledge and motivation, positive safety behaviors, health and well-being and decreased
accidents/injuries (Christian, Bradley, Wallace, & Burke, 2009; Clarke, 2010; Nahrgang,
Morgeson, & Hofmann, 2007). In the construction industry specifically, researchers have found
evidence of safety climate’s ability to predict safety behaviors (Pousette, Larsson, & Törner,
2008) and influence on the severity (Gillen, Baltz, Gassel, Kirsch, & Vaccaro, 2002) and
reporting of injuries (Probst et al., 2008).
Safety climate measurements tap into workers’ perceptions of safety on the job, not their
affective reaction to safety on the job. They ask workers to be “observers and rapporteurs of
shared perceptual phenomenon” (Kines et al., 2011). The development of a shared safety
climate among organizational members originates with company leadership. At its core, safety
climate reflects perceptions of the priority of safety over competing organizational goals. This
inference is based on the enacted policies rather than the espoused policies. The consistency
of enacted policies may differ by group or department due to supervisory discretion. A climate
for safety ultimately forms from shared worker perceptions of these enacted policies. One of the
key mechanisms that drive these shared perceptions is company leadership (Zohar, 2011).
Perceptions of leadership are not based on a single observation of leadership actions, but rather
an observed pattern of events that are interpreted in psychologically meaningful ways (Rentsch,
1990). When leadership consistently prioritizes safety, for better or for worse, workers
collectively perceive the true priority of safety. As Lewin said in 1939, “leaders create climate”
(Lewin, Lippitt, & White, 1939). Perhaps that is why management priority and commitment to
safety has been consistently cited as a key dimension of safety climate (Flin, Mearns, O'Connor,
& Bryden, 2000; Guldenmund, 2000) and leadership style has been found to be a key
antecedent (e.g., Barling, Loughlin, & Kelloway, 2002; Kelloway, Mullen, & Francis, 2006;
Mullen, Kelloway, & Teed, 2011).
14

Safety climate perceptions are measured via worker perception surveys. Safety climate
cannot be directly measured like a person’s weight, because it is an “unobservable” or “latent”
construct. Its value must be triangulated by multiple perception-based questions. While some
researcher’s safety climate questions represent a global safety climate factor, a lot of safety
climate questions can be grouped based on specific sub-dimensions of safety climate. These
dimensions include management commitment, safety system, risk, work pressure, and safety
communication. Management commitment to safety, however, is the most common dimension
measured (Flin et al., 2000).
1.6.2.1.1. Top management, supervisors, and co-workers response to safety
Zohar (2000) argues that management commitment to safety should reflect both top
management and supervisors commitment to safety. He calls this a multi-level model of safety
climate because safety climate perceptions can be distinguished by organization and work
group levels (Zohar, 2000). Zohar et al. (2005) found that group-level safety climate fully
mediates the relationship between organizational safety climate and observed safety behaviors.
Group differences develop from supervisory discretion in applying organizational policies. In
work settings where work is less routinized, supervisors have more discretionary power (Zohar,
2011). Unlike the manufacturing industry, supervisors and crews in construction are most likely
working away from the main office on various job sites with a host of variable working
conditions. Supervisors must routinely implement company policies for their crews in varying
situations. Zohar (2011) states that worker perceptions of top management should refer to
policies (e.g., the financial aspect of safety and reducing production in favor of safety) whereas
perceptions of supervisors should refer to practices (e.g., monitoring and rewarding and
willingness to interrupt production in favor of safety).
In addition to perceptions of top management and supervisors, Melia et al. (2008) and
Brondino et al. (2012) argued that perceptions of co-workers also play a critical role in safety
climate measurement. Chiaburu et al.’s (2008) meta-analysis found that, even after accounting
15

for the influence of leaders, co-workers predicted perceptions, attitudes, and behavior outcomes
of co-workers. While co-workers do not hold any formal power, the way they respond to safety
may influence safety outcomes just as much as their top management or supervisor’s response
to safety. Melia et al. (2008) and Brondino et al. (2012) both found support for this effect.
Namely, both levels of managements’ responses to safety predicted co-worker response to
safety, and co-workers’ responses to safety predicted safety behaviors. The role of co-workers
in the construction industry may be especially important because construction workers work on
job sites away from the contractor’s main office with their crewmembers. Only Melia et al (2008)
tested this model in the construction industry, but it was in Spain and Hong Kong. Thus, this
extend model of safety climate has yet to be tested in the US construction industry.
1.7. OHS interventions
The practice of OHS is evolving and research is needed to develop and test
interventions that can help reduce the burden of poor safety performance. Historically, micro-
level determinants of accidents (i.e., human error) invoked a need to control the hazards around
the worker by putting up various “defenses” (e.g., personal protective equipment, safety and
health training, etc.). Recently, researchers acknowledged the need to incorporate macro-level
factors (i.e., organizational level) (Khanzode, Maiti, & Ray, 2012; Reason, 1997). In the
construction industry, specifically, researchers have advocated the use of systems models that
seek to understand the work system factors that create hazards and shape worker behaviors
(Mitropoulos & Abdelhamid, 2005). The United Kingdom’s Health and Safety Executive’s
analysis of construction accidents is a testament to this fact. There are multitude of factors that
lead to construction industry accidents, but originating factors, like safety climate and company
leadership, ultimately influence and shape safety and health performance (Haslam et al., 2005;
Health Safety Executive, 2003).
16
1.7.1. Leader focused interventions
Relatively little intervention research aimed at improving an organization’s safety climate
is available, and those that do exist have focused on leadership. The style of leadership that
management can employ ranges from passivity to proactivity (i.e., transactional to
transformational). Passive leaders exhibit a poor concern for employee welfare, and will only
address safety if standards are not met or in some instances will refuse their safety leadership
role. Proactive leaders care for employee welfare and actively engage and inspire their
employees to be safe (Bass, 1990; Zohar, 2003). Active leaders who display transformational
qualities are more likely to have a positive influence on safety (Kelloway & Barling, 2010).
Safety-specific transformational leadership theory focuses on four characteristics. First, they
are role models that convey their personal value for safety. Second, they inspire employees to
go beyond their own needs to be safe for the sake of the group by motivating them to achieve
high safety levels. Third, they challenge workers to confront long held views about safety and to
enhance the way they deal with safety. Lastly, they convey an active interest and real concern
in worker’s safety that goes beyond company or government requirements (Barling et al., 2002).
There are several advantages of focusing an OHS intervention on supervisors’
leadership (Kelloway & Barling, 2010; Zohar, 2002). First, relatively few individuals within the
company need to be trained to see positive safety outcomes, saving a company’s valuable
resources (e.g., time and money). This is because the intervention is implemented at the front-
line leadership level (e.g., foremen), but positive changes are also expected at the crew level
(i.e., journeyman, apprentice, etc.). Second, involving front-line leadership in crew safety takes
the burden off of safety managers, who cannot be with crews during the entire workday.
Furthermore, training leadership to be attuned to crew safety offers a chance for immediate
feedback and learning. Through this, crews will learn that safety is an integral aspect of work
performance that is expected of them. Third, leadership training that focuses specifically on
safety may be advantageous because leaders may not exhibit positive leadership qualities in all
17

areas of work (e.g., production, but not safety) (Mullen & Kelloway, 2009). Due to the link
between leadership, safety climate, and other organizational outcomes, construction companies
can use the leader-focused intervention to enhance their existing health and safety efforts
(Christian et al., 2009; Clarke, 2010; Kelloway & Barling, 2010). Ultimately, the program could
become a fixture in a company’s health and safety management system.
1.8. Dissertation significance
My dissertation addresses several novel aspects of OHS identified by the National
Occupational Research Agenda (NORA) research goals (NORA Construction Sector Council,
2008). First, in Strategic Goal 12.0, the NORA Construction Sector Council called for the
reduction of “injuries and illnesses among groups of construction workers through improved
understanding of why some groups of workers experience disproportionate risks in construction
work.” The National Research Council and Institute of Medicine (2009) also called for an
investigation of how aging impacts OHS. A minimal amount of research has investigated aging
trends among a large cohort of workers in the construction trade that report on the nature and
costs of work-related injuries. The first two studies in this dissertation represented the first
comprehensive effort to identify aging related trends in the construction industry.
Second, my dissertation addresses the NORA strategic goal 8.0, “to increase
understanding of factors that comprise both positive and negative safety and health cultures;
and, expand the availability and use of interventions at the policy, organizational, and individual
level to maintain safe work practices 100% of the time in the construction industry.” Specifically,
my third and fourth studies address the research goal 8.2.4, “Validate measurement methods
that consistently identify the positive and negative aspects of construction safety and health
culture.” I investigate novel models of safety climate in the US construction industry, and seek
to understand how safety climate impacts aspects of OHS knowledge and behaviors. In my fifth
study, I address research goal 8.3.1., “Identify and evaluate interventions for improving
18

construction safety and health cultures.” In my fifth study, I translate previous safety climate
research into a proactive method to improve OHS in the construction industry.
1.9. Dissertation hypotheses and research questions
Study 1
1.1. What are the injury and illness trends of older construction workers in the
previously published literature?
Study 2
2.1. The positive association between age and WC cost would differ by cost type
(e.g., total, medical, and indemnity costs).
2.2. The relationship between injury type and cost would vary by age.
Study 3
3.1. There are direct relationships between all safety climate factors and safety
behavior factors.
3.2. There are indirect relationships between all safety climate factors and safety
behavior factors.
Study 4
4.1. There are direct relationships between safety climate, safety climate knowledge,
and safety behaviors.
4.2. The relationship between safety climate and safety behaviors is partially
mediated by safety climate knowledge.
Study 5
5.1. An intervention composed of a workshop plus progress checks results in positive
safety outcomes.
5.2. The addition of progress checks enhances the treatment effect.
19

Chapter 2
Methods
Since my dissertation represents five separate studies, the methods for each study vary.
In my first study, I reviewed research published between 1998 – June 2011 that specifically
addressed the construction industry’s aging workforce. In my second study, I utilized a large
database of WC claims from the Colorado construction industry to describe how the age of a
worker impacts injury type and cost (direct and indirect). In my third study, I evaluated the role
that top management, supervisors, and co-workers play in safety climate perceptions, and how
each of them influences safety behaviors on the job. In my fourth study, I investigated
construction supervisor’s safety climate knowledge, and how it mediates the relationship
between their safety climate perceptions and their safety behaviors. Lastly, in my fifth study, I
developed and evaluated a safety climate intervention aimed at site-supervisors and their
crews. See Appendix 6.I. for details on the intervention. See Table 2 for an overview of the
methods used in each study. The specific methods of each study are described below.
20

Table 2. Overview of materials and methods for all 5 dissertation studies
Study Study participants Study design Predictors Outcomes Primary statistical method
1 – “Literature
review”
Construction workers Review of literature (N=21 articles)
2 – “WC data analysis”
Colorado construction workers who filed a WC claim from 1998-2008 (N = 107,065)
Cross-sectional •Age •Injury type
•WC claim cost: •Total cost ($) •Medical cost ($) •Indemnity cost ($)
ANOVA; Linear regression
3 – “Co-worker response to
safety”
Baseline data from study 5 - Construction workers (supervisors and crewmembers) from 3 medium sized contractors in the US PNW (N=300)
Cross-sectional •Top management safety climate •Supervisor safety climate •Co-worker safety climate
•Supervisor safety climate •Co-worker safety climate •Safety participation behaviors •Safety compliance behaviors
Structural equation modeling
4 – “Safety climate
knowledge”
Baseline data from study 5 - Construction workers (supervisors only) from 3 medium sized contractors in the US PNW (N=91)
Cross-sectional •Safety climate •Supervisor safety climate knowledge
•Supervisor safety climate knowledge •Safety participation behaviors •Safety compliance behaviors
Path analysis
5 – “Supervisor
intervention”
Construction workers (supervisors and crewmembers) from 3 medium sized contractors in the US PNW (N = 205-350)
Intervention: •Pre-post repeated measures •Quasi-control group
•• Workshop + Progress checks •• Workshop only
•Top management safety climate •Supervisor safety climate •Co-worker safety climate •Safety participation behaviors •Safety compliance behaviors •Supervisor safety climate knowledge •Supervisor training transfer behaviors •Supervisor reaction to workshop
Latent growth modeling
21

2.1. Study participants and data collection procedures
In my first study, I reviewed all previously published articles discussing OHS in relation
to the industry’s aging workforce. The articles must have mentioned the construction industry
and older workers, and at least one of the following topics: injury cause, injury type, or injury
cost. Only 21 articles from 1998 – June 2011 fit the study criteria. These studies represented
construction workers from the US, Sweden, The Netherlands, Canada, and Germany. While
some researchers looked at construction workers in general (e.g., state level WC claims), others
focused on specific trades (e.g., roofers and carpenters) or construction workers with specific
characteristics (e.g., Department of Energy workers or workers who filed for disability).
In my second study I conducted a cross-sectional analysis of 107,065 WC claims filed by
Colorado construction workers from June 30, 1998 to June 30, 2008. The claims were
extracted from Pinnacol Assurance’s database of claims. Pinnacol Assurance is Colorado’s
insurer of last resort, which means they must insure any company who wishes to buy WC
insurance from them. However, the majority of Colorado contractors (80%) use Pinnacol
Assurance as their WC carrier (Actuarial from Pinnacol Assurance, oral communication, 2010).
Although the dataset represented claims not workers, approximately 14,000 contractors and
124,000 construction workers were represented in the dataset per year (Statistics of U.S.
Businesses, 1998-2008). The Colorado State University Institutional Review Board (IRB)
deemed this study exempt from IRB since the dataset represented claims, not individuals.
My third, fourth, and fifth studies were representative of a cohort of construction workers
from three medium sized contractors (60-400 employees) in the US Pacific North West. The
construction workers were unionized sheet metal workers, plumbers, and pipefitters. All of the
contractor’s supervisors (i.e., foremen, superintendents, project managers) and crewmembers
(i.e., pre-apprentices, apprentices, journeymen) were asked to fill out questionnaires. I used
surveys to ask supervisors questions relating to safety climate, safety climate knowledge, safety
behaviors, training transfer behaviors, and workshop reaction questions. Crewmembers were
22

asked questions relating to safety climate and safety behaviors. The surveys were handed out
during normal working hours during breaks or pre-scheduled meetings such as toolbox talks or
safety meetings. All workers were told that it would take 15-20 minutes to complete the survey,
their participation was voluntary, and that their surveys would be anonymous and maintained at
Colorado State University. I distributed and collected the majority of the surveys, but when I
could not be present the surveys were collected, sealed in an envelope, and handed to me.
Both supervisors and crewmembers were surveyed before and after the intervention
described in study five, and their surveys were tracked via a unique identifier code that the
worker wrote on the top of their survey (i.e., 2 digits of day of birth, last 2 digits of phone
number, last 2 digits of social security number). The third and fourth studies were based on the
baseline data of study five, which was collected in December 2012. The fifth study, the
intervention study, was based on multiple waves of data starting in December 2012. The
number of waves of data collection varied depending on the worker’s position (supervisor or
crewmember) and the variable measured. For example, supervisor’s safety climate knowledge
was assessed on five occasions (baseline 1, baseline 2, immediate-post test, 3-month follow-
up, and 6-month follow-up). However, for crewmembers, all variables were assessed on three
occasions (baseline 1, 3-month follow-up, and 6-month follow-up). See Figure 7 in Part VI for
detailed description of the study design. The Colorado State University IRB approved all study
methods.
2.2. Variables studied
In my second study, the claimant’s injury type and age at the time of injury were the
explanatory variables of interest. Pinnacol Assurance entered the injury type into their WC
claim database by following the National Council on Compensation Insurance standard coding
scheme. I collapsed injury type into a smaller number of categories, because 60% of all claims
represented three injuries (i.e., strains, contusions, and lacerations). All other types of injuries
were categorized as “other.” Claimant age was treated as a continuous variable as well as a
23
categorical variable (i.e., 18-24, 25-34, 35-44, 45-54, 55-64, and 65+). Three outcome variables
were studied: medical cost ($), indemnity costs ($), and total cost ($). Medical cost represented
all healthcare related expenses (e.g., physician visits and prescriptions). Indemnity costs
represented wage-replacement, disability, impairment, and death benefits. Total costs
represented the combined medical and indemnity costs as well as other costs such as legal
fees. All costs were inflation-adjusted to 2010 dollars.
In my third study, supervisors and crewmember’s combined responses to safety climate
and safety behavior variables were assessed. The safety climate variable was split into three
factors: top management safety climate, supervisor safety climate, and co-worker safety
climate. Top management safety climate was represented by three sub-factors: top
management safety commitment (4 items), top management safety empowerment (3 items),
and top management safety justice (3 items). Supervisor safety climate was represented by
three sub-factors: supervisor safety commitment (5 items), supervisor safety empowerment (4
items), and supervisor safety justice (3 items). Co-worker safety climate represented co-
worker’s commitment to safety (6 items). The safety climate factors were adapted from the
Nordic Safety Climate Questionnaire (NOSACQ-50) (Kines et al., 2011). The safety behavior
variable was split into two factors: safety compliance (3 items) and safety participation (3 items).
The safety behavior factors were adapted from Neal et al.’s (2000) measure of safety behaviors.
All variables were scored on a 0-5 Likert scale, never to always. See Appendix 4.I for a list of all
safety climate and safety behavior questions.
In my fourth study, supervisor’s responses to safety climate, safety climate knowledge,
and safety behavior variables were assessed. The same safety climate and safety behavior
variables in the third study were used in this study. However, safety climate was represented as
a global safety climate factor (i.e., all questions averaged to obtain one score). Safety climate
knowledge was assessed via a knowledge test developed by the researchers (10 items). The
questions represented a combination of multiple choice and open-ended questions that
24

assessed supervisor’s knowledge of safety climate and safety leadership concepts. Two
members of the research team graded the open-ended questions, and the total points for each
question was based on the average of their scores. There was a total possible score of 14
points. See Appendix 5.I for a list of all safety climate knowledge questions.
In my fifth study, supervisors and crewmembers were asked the same questions as in
studies three and four. Additionally, supervisors were asked workshop reaction questions to
gauge their reaction to the workshop’s content and delivery (7 items). Supervisors were also
asked questions related to training transfer behaviors (5 items). Training transfer behaviors
represented actions that they had undertook to transfer what they learned in the workshop to
their job site (e.g., discussing workshop with supervisor), and were adapted from Al Eisa el al.
(2009) and Machin et al. (2004). See Appendix 6.II for a list of all workshop reaction and
training transfer behavior questions.
2.3. Statistical analyses
In my second study, the univariate relationship between age and claim cost was
assessed via Pearson correlations, analysis of variance (ANOVA) and linear regression. The
relationship between age, injury type, and claim cost was assessed via multivariate linear
regression. SAS version 9.2 was used for all analyses.
In my third and fifth studies, Mplus version 7.0 (L. K. Muthen & Muthen, 2012) was used
to analyze the variables within a latent variable framework. This means that each of the
variables (e.g., top management safety commitment) were “latent” or “unobservable,” and had
to be measured with multiple questions (i.e., “observable variables”). The pattern with which
each question loaded onto its hypothesized latent variable represented its measurement
structure, and provided the evidence needed to average multiple questions to get a variable
score. When there are multiple latent variables being assessed, this type of analysis can help
to provide construct validity to a questionnaire by providing convergent and discriminate validity
25

evidence. Furthermore, unlike ordinary least squares methods like multiple regression, this type
of analysis allows for measurement error (Brown, 2011).
In my third study, the factor structure (i.e., measurement model) of all study variables
was tested via confirmatory factor analysis (CFA). A CFA is used to confirm a hypothesized
latent structure of all questions. Once adequate model fit of the measurement model was
obtained via CFA, relationships between variables were determined via structural equation
modeling (SEM). SEM is a multi-equation method that can test the relationship between
multiple independent and dependent variables while accounting for the latent structure of the
variables. All analyses were completed in Mplus version 7.0 (L. K. Muthen & Muthen, 2012).
In my fourth study, Mplus version 7.0 (L. K. Muthen & Muthen, 2012) was used to
analyze the study variables via path analysis. A SEM procedure would have been preferred,
but a sample size restriction hindered the model identification (i.e., too small of a sample size for
the number of parameters needed to be estimated). Thus, the measurement model could not
be included in this analysis. Instead, all variables represented mean variable scores generated
in SPSS version 21. Justification for averaging questions was made by calculating the internal
consistency reliabilities (Chronbach’s alpha) of all study variables. A high Chronbach’s alpha (>
0.70) indicates good variable reliability, which means that all of the questions hypothesized to
measure the same variable produced similar scores.
In my fifth study, a latent growth modeling (LGM) approach was used to determine within
and between individual changes over time on all study variables. Furthermore, differences
between intervention groups (workshop plus progress checks versus workshop only) were
assessed in the models. Like in my fourth study, mean variable scores were used for all LGMs,
and thus it could not account for measurement model of the variables. LGM is similar to a multi-
level model of change; however, the intercept and slope are treated as latent variables and
scores on the variables at each wave of data collection are treated as the observed variables.
26

In my third and fifth studies, various model fit indices were used to determine how well
the hypothesized model of variable relationships fit the data. These fit indices included: chi-
square model test statistic, RMSEA, CFI, TLI, SRMR, and Akaike AIC. A low RMSEA and
SRMR (< 0.08), and a high CFI and TIL (> 0.95) are indicative of a good fitting model. A chi-
square test statistic indicates a good fitting hypothesized model when the statistic value is low, p
> 0.05 and/or the ratio of the chi-square test statistic over the degrees of freedom is < 2.0.
When comparing nested models (e.g., adding or removing paths between variables) to find the
best model fit, the chi-square difference test was used. A failure to reject the chi-square test
indicates that the more restrictive (null) model with fewer paths estimated is favored more than
the less restrictive model (alternative) with more paths estimated (Kline, 2011). When
comparing non-nested models (e.g., adding and removing variables), Akaike AIC values were
compared. Lower AIC values were favored.
27

Chapter 3
Results
The results of all five studies will be presented separately since they represent five
separate original studies. See Table 3 for the main findings of each of the five studies.
Table 3. Summary of results for all 5 dissertation studies
Study Main findings 1 –
“Literature Review”
• Of the 22 identified articles most focused on musculoskeletal disorders, and the severity of older workers injuries compared to younger workers.
• Many studies were limited to the study of one trade or one specific injury type.
2 – “WC data analysis”
• WC claims cost an average of $8,432 (SD = $37,637) per claim.
• The average cost of a claim increased significantly with increasing claimant age.
• Older claimants had significantly more costs associated with lost work time, disability/impairment, and death than younger claimants.
3 – “Co-worker response to
safety”
• Safety climate can be measured by asking workers about their perceptions of the safety response of top management, supervisors, and co-workers.
• Co-worker's safety response mediated the relationship between both top management and supervisor safety response and safety behaviors.
4 – “Safety climate
knowledge”
• Among supervisors, knowledge of safety climate did not mediate the relationship between safety climate perceptions and safety behaviors (safety compliance and safety participation).
• However, supervisor's safety climate perceptions were significantly associated with both types of safety behaviors.
5 – “Supervisor intervention
”
• The interventions’ workshop was implemented with great fidelity, but there was poor participation in the progress checks after the workshop.
• Regardless of the type of intervention the workers participated in (workshop plus progress checks or workshops alone), supervisor safety climate knowledge increased significantly as did their personal safety participation behaviors.
• Despite not being directly involved in the intervention, crewmembers also significantly increased their safety participation behaviors post intervention.
28

3.1. Results: Study 1
Articles were identified by a PubMed database search and via the author’s prior
knowledge of their existence or were listed in the reference section of the previously identified
articles found in the database search. Six of the 22 articles were based on studies outside of
the United States. See Table 4 in Part II Chapter 3 for highlights of the most relevant findings.
Of the 22 articles, the most common study focus was on musculoskeletal disorders.
Other less commonly discussed injury characteristics included falls, slips, and trips, fractures,
and illnesses (e.g., hearing loss). The articles also discussed increased costs associated with
medical issues, lost work time, and disability among older construction workers, compared to
younger construction workers.
While the researcher’s articles suggest that older construction workers do have a
different injury and illness experience than younger workers, the results, however, were limited
to specific injury types and construction populations (e.g., union carpenters). Furthermore,
Crawford et al. (2010) noted that there is a serious gap in the literature regarding interventions
for older workers. Some researchers suggest utilizing ergonomic principles to fit the job to the
worker (Choi, 2009).
3.2. Results: Study 2
I found that, generally, as the age of the claimant increased, so did the cost of the WC
claim. However, few of the claims represented older workers (see Figure 1). Workers over the
age of 45 filed approximately 20% of the claims. The total cost of all claims was $931,234,994,
and the average cost of a claim was $8,432 (SD = $37,637). An equal amount was spent on
medical costs and indemnity costs (approximately $400 million each). However, only a fraction
of the claims (23%) had both medical and indemnity costs. Older workers over the age of 65
filed more of the medical plus indemnity claims than workers aged 18-24 (χ2 = 91.68, p <
0.0001).
29

Figure 1. Frequency and mean cost of WC claim by age group
Medical costs were greatest amongst workers aged 35-44, 45-54, 55-64, and 65+ years,
but indemnity costs were greatest amongst workers aged 45-54, 55-64, and 65+ (see Table 8 in
Part III, Chapter 3). My linear regression analyses also indicated that claim cost increased with
age. There was a 3.51% increase in the indemnity cost of a claim with each year increase in
age, and a 1.11% increase in the medical cost of a claim (see Table 9 in Part III, Chapter 3).
This supports hypothesis 2.1. by demonstrating that claimant age has a greater effect on
indemnity costs than medical costs.
The most common injuries among all claims were strains, contusions, and lacerations
(65% of all claims). The mean total cost of a claim was greatest among strain types of injuries
(M = $10,917, SD = $30,795). My simple linear regression analyses with type of injury
predicting indemnity claim cost revealed that strains were more costly than the other types of
injuries. Contusions were 46% less costly than strains, and lacerations were 53% less costly
than strains. The average indemnity cost of a strain injury increased with increasing age group.
When the age of the claimant was added to the linear regression model predicting indemnity
0
5,000
10,000
15,000
20,000
25,000
30,000
35,000
40,000
18-24 25-34 35-44 45-54 55-64 65+$0
$2,000
$4,000
$6,000
$8,000
$10,000
$12,000
$14,000
$16,000
Freq
uenc
y of
cla
im fi
ling
(#)
Age group
Mea
n co
st ($
) Total Cost ($) Indemnity Cost ($) Medical Cost ($) Frequency (#)
30

cost, the indemnity cost of strains and contusions both increased with increasing age group (see
Table 10 in Part III, Chapter 3). For example, the indemnity cost of a strain injury among
workers over the age of 65 was 261% greater than the cost of a strain injury among workers
aged 18-24. The indemnity cost of laceration injuries, however, was relatively similar among all
age groups. In all regression models, only a small percent of the variance was explained by the
age of the claimant (< 2.0%). This supports hypothesis 2.2. by demonstrating that the claim
cost of various injuries depends on the age of the claimant.
3.3. Results: Study 3
The first step in this study was to test the relationship between the safety climate
questions asked in the survey (34 questions), and how each of them related to their
hypothesized safety climate latent factors (see Appendix 4.I for a description of the factors).
This was accomplished by running a series of CFAs. First, the hypothesized relationships
between the questions and the latent factors were estimated, but the resulting model fit was
poor. To improve the fit of the model, questions that performed poorly (low or insignificant factor
loadings) were removed (5 questions), a correlated error term between two questions with
similar wording was added, and one question was allowed to load onto two factors (i.e.,
supervisor safety commitment and supervisor safety empowerment). After doing this, model fit
improved. This means that the questions were adequately represented by the hypothesized
safety climate and safety behavior latent variables. Furthermore, each identified variable was
significantly correlated with each other, but distinct enough from each other to warrant
investigations into how they may affect each other. See Appendix 4.II for all question factor
loading estimates, standard errors and significance levels as well as all factor reliability
estimates. Note that only questions identified by the CFA as significant were utilized in all
subsequent analyses involving these variables (i.e., in studies four and five). This analysis
provided the necessary justification to move onto an analysis that tested the relationship
between the variables.
31

First, the hypothesized relationships in were estimated via SEM (see Figure 2 in Part
IV). Namely, all three safety climate variables (top management, supervisor, and co-worker)
were estimated to directly influence both types of safety behaviors (safety compliance and
safety participation) (see Figure 2 in Part IV, Chapter 1). These hypothesized direct
relationships fit the data well, but alternative models were estimated to determine if mediation
was at play. Ultimately, a partial mediation model fit the data best (see Figure 4 in Part IV,
Chapter 3). My mediation model suggests that perceptions of top management and
supervisor’s response to safety influence safety compliance and safety participation behaviors
through perceptions of co-worker’s response to safety. In other words, construction workers
must perceive that their co-workers value safety in order for both levels of management to
influence safety behaviors on the job. These findings partially support hypothesis 3.1., because
top management and supervisor safety climate did not have a direct relationship with both types
of safety behaviors. They fully support hypothesis 3.2. by demonstrating that there were indirect
relationships between the study variables.
3.4. Results: Study 4
The relationship between supervisor safety climate perceptions, safety climate
knowledge, and both types of safety behaviors was assessed via path analysis (see Figure 5 in
Part V, Chapter 1). The reliabilities of each variable was calculated and found to be of adequate
significance (α < 0.70). Thus, all questions hypothesized to measure each variable were
averaged, and the average scores for each variable were analyzed in the path analysis.
My results indicated that safety climate knowledge was not related to any of the other
study variables. The direct paths to and from safety climate knowledge were non-significant,
and the indirect paths from safety climate to safety compliance and safety participation were
also non-significant. However, safety climate had a significant direct relationship with safety
compliance and a marginally significant direct relationship with safety participation. These
results partially support hypothesis 4.1., but fail to support hypothesis 4.2. See
32

Figure 6 in Part V, Chapter 3 for the results of the path analysis.
3.5. Results: Study 5
A process evaluation of the intervention’s implementation demonstrated that the
intervention reached the majority of the supervisors in each participating company, and that the
majority of the supervisors continued to work for their respective contractor at 3 and 6 months
follow-up. However, the intervention components (i.e., workshop and progress checks) had
differing implementation fidelity. Namely, all workshops occurred as planned and with the
majority of each contractor’s supervisors, but the progress checks did not occur at both
scheduled time points for all supervisors in the workshop plus progress check intervention
group.
Many supervisors found the workshop content and design relevant to their job,
sufficiently challenging, engaging, and many would recommend the training to others in their
industry. At 3 and 6 months post intervention, the majority of the supervisors indicated that they
were discussing the training with their supervisor and co-workers, using what they learned on
the job, found it to be useful, and felt that it helped to improve their job performance.
My outcome evaluation of the intervention via LGM showed that there were similar
results among supervisors and their crewmembers. Supervisors’ and crewmembers’ surveys at
each wave of data collection were matched via a unique identifier written on top of the survey.
This resulted in a total of 608 unique construction crewmembers (i.e., pre-apprentices,
apprentices, and journeymen) and 107 unique construction supervisors (i.e., foremen,
superintendents, project managers, project engineers). Since the number of waves of data
available for the LGM varied based on position (i.e., crewmember or supervisor) and the
variable studied, multiple separate LGMs were run. Supervisors’ safety climate knowledge
significantly increased from baseline to follow-up, but the largest gain in knowledge was
immediately after the workshop (see Table 16 in Part VI, Chapter 3). Supervisors’ safety
participation behaviors increased from baseline to follow-up (see Table 16 in Part VI, Chapter
33
3), as did the safety participation behaviors of their crewmembers (see Table 17 in Part VI,
Chapter 3). However, both supervisors and crewmembers’ safety climate perceptions and
safety compliance behaviors did not significantly change overtime. Thus, partial support was
found for hypothesis 5.1. The addition of the intervention group covariate into each LGM model
did not improve the fit of the model, which fails to support hypothesis 5.2. Thus, supervisors who
participated in an intervention with a workshop and progress checks experienced the same
outcomes as supervisors who participated in the workshop alone. The same result was found
for their crewmembers too.
34

Chapter 4
Discussion
The purpose of my dissertation was to highlight five original research activities that
sought to characterize and enhance the health and safety of construction workers. My
dissertation began with an investigation of a vulnerable sub-population of construction workers,
the aging workforce. It ended with an investigation of safety climate measurement and
enhancement methods, which can influence the OHS of all construction workers. The
sequence of research activities highlights my particular interest in OHS measurement methods,
as well as an interest in translating this research into practical methods for industry stakeholders
to use. The combined results from each of my studies suggest two things. First, the hazards of
the construction industry result in a significant amount of costs, direct and indirect, regardless of
worker age. Second, it is important for all members of a construction organization (top
management, supervisors, and crewmembers) to consistently value and prioritize safety. When
this becomes rote, contractors may have a workforce that carries out their daily work in a safe
manner. My dissertation findings suggest that focusing on safety climate as an indicator of OHS
may improve the OHS of construction job sites. However, future research should test the
predictive validity of safety climate and safety behavior measures and the supervisor
intervention in study five against lagging outcomes like WC data.
Successful management of OHS depends on the ability to accurately measure OHS
trends. As the saying goes, “What gets measured gets managed.” Hale (2009) notes that
safety performance measures are used for three reasons: 1) Monitoring how safe a work
environment is, 2) If the work environment is unsafe, making decisions on when and where to
act, and 3) Motivating decision makers to take action. My second study showed that WC data
could be a good source of motivation for industry stakeholders to take action. Yet, I could not
use the WC data to identify when and where to act, because it only spoke to injuries and their
35

costs. Injuries could come from a multitude of sources and root causes (Haslam et al., 2005).
My findings in studies three, four, and five demonstrate that safety climate measures may be
valid representations of how individuals in a company respond to safety policies and
procedures. Furthermore, my studies indicate that safety climate is associated with worker’s
safety behaviors on the job. Thus, safety climate measures may be used to account for not only
what value or priority individuals at all company levels place on safety, but also how well safety
policies and procedures are being used in practice. Such efforts are representative of leading
measures of OHS, and can help companies monitor work environments and act to improve
OHS before injuries occur and a WC claim is filed.
The usefulness as well as limits of lagging indicators of OHS was demonstrated in my
first and second studies. In my first study, all of the reviewed articles used a variety of lagging
measures of OHS trends among aging construction workers. The researchers used national
datasets such as OSHA logs, and self-report surveys to gauge musculoskeletal pain. I
expanded this research by examining a large database of WC claims to determine the impact of
age on injury and their associated costs. Unfortunately, in both my first and second study, I
could not investigate how the quantity and quality of OHS policies, procedures, and practices
affected the OHS experience of younger and older construction workers. However, my results
in study two do an especially good job of showing the monetary cost of construction OHS
hazards. When a construction worker filed a claim for an injury or illness, their claim cost just
over $8,000 on average, and about half of that cost came from the lost work wages, disability or
impairment compensation, or death benefits. This estimate is likely an understatement for a
number of reasons. A significant amount of underreporting is prevalent in these lagging
measures, and not all construction workers are covered by WC insurance (Boden, 2013; Leigh,
Marcin, & Miller, 2004). Also, it cannot account for other costs like productivity loss, quality of
life, and household productivity loss (e.g. Lipscomb, Dement, & Behlman, 2003; Waehrer, Dong,
Miller, Men, & Haile, 2007). Thus, the cost of injuries and illnesses is likely to be significantly
36

greater than estimated. While the use of lagging measures has its limits, it does provide some
preliminary justification needed to focus attention on OHS hazards.
In my third, fourth, and fifth studies, I found support for prior research that demonstrates
a leading measure of OHS, safety climate, is positively associated with another leading
measure, worker’s safety related behaviors on the job (Christian et al., 2009). I measured
safety climate by asking workers questions about “who” performs what safety actions (top
management, supervisors, and co-workers) rather than “what” safety actions (e.g., safety
training) are performed. This method of safety climate measurement is similar to Zohar’s
(Zohar, 2000; Zohar & Luria, 2005) typical safety climate measure that discusses top
management and supervisors, and Melia et al. (2008) and Brondino et al.’s (2012) extension of
Zohar’s model to include perceptions of co-workers as well. The combined evidence suggests
that the more workers feel like these individuals value safety, the more likely workers are to
behave safely. Furthermore, my third study indicates that in order for perceptions of both levels
of management commitment to safety to influence worker’s safety behaviors, it may be
important for workers to perceive that their co-workers value safety. Practically speaking, a
commitment to safety should be built among individuals at all company levels. This could be
done during safety meetings or toolbox talks. However, causal claims between perceptions of
co-workers and safety outcomes cannot be made based on the results of this study and Melia et
al. (2008) and Brondino et al.’s (2012) studies. Only Zohar (2005) measured safety behaviors
after measuring safety climate perceptions of top management and supervisors.
Given the relationship between workers’ safety climate perceptions and worker safety
behaviors, I investigated OHS enhancement methods that leveraged safety climate research in
studies four and five. In both studies I postulated that if supervisors understand safety climate
concepts, they would be more likely to perform more safety behaviors themselves.
Furthermore, via principles of safety climate and safety leadership, this effect would be
translated into positive outcomes (safety climate and safety behaviors) for crewmembers as well
37

(Mullen & Kelloway, 2011; Zohar & Luria, 2010). I found some mixed results to these questions
in studies four and five. Study four, a cross sectional study of supervisors only, I found that
supervisor safety climate knowledge was not related to supervisor safety behaviors. However,
after supervisors participated in a workshop focused on safety climate concepts in my fifth
study, their safety climate knowledge and safety behaviors improved.
The disparity in findings between studies four and five may be due to the validity of the
safety climate knowledge measure. Prior research links knowledge to behavior (Borman, Illgen,
& Klimoski, 2003; Christian et al., 2009; Neal et al., 2000). Thus, findings in study four might be
due to the validity of the safety climate knowledge measure rather than a null relationship
between safety climate knowledge and safety behaviors. This notion is strengthened by my
findings in study five, which demonstrates that safety participation behaviors significantly
increased post-workshop. Interestingly, safety climate knowledge in study five also increased.
The increase in knowledge could not have been due to grader bias, because graders were
blinded to when the questions were answered. Potentially, supervisors may have remembered
seeing the questions previously, and after having had time to think about it they changed their
answer. Unfortunately, studies four and five cannot be directly compared, because in study five
I did not investigate whether or not the increase in safety climate knowledge immediately post
intervention predicted safety participation behaviors at follow-up.
Beyond influencing worker safety behaviors, I also postulated in study five that
supervisors who participate in the intervention would be more equipped to influence
crewmember safety climate perceptions. Contrary to this hypothesis, I did not find any
significant changes in safety climate perceptions. My findings are similar to the only previous
leader focused OHS intervention in the construction industry that measured safety climate
(Kines et al., 2010). While Kines et al.’s (2010) study had a different focus, safety-specific
communication only, neither my fifth study nor their study significantly changed safety climate
perceptions related to supervisors. My findings in this dissertation may have been due to high
38

baseline safety climate perceptions. Also, Kines et al. (2010) noted that the lack of change may
be indicative of the time needed to change safety climate perceptions. Since safety climate
perceptions develop overtime as supervisors demonstrate their value of safety to their workers,
it may be that the short term positive changes in safety participation behaviors observed in my
fifth study may lead to more positive safety climate perceptions down the line. Such questions
could have been answered if I had measured safety climate at more time intervals post
intervention (e.g., 1 year post intervention).
Although not reported on in my dissertation, the age of the construction worker was
significantly, but poorly correlated with some of safety climate and safety behaviors variables.
Pearson correlations between these variables were calculated within each wave of data
collected in my fifth study (i.e., baseline 1, baseline 2, 3-month follow-up, and 6-month follow-
up). The relationships between the age of the worker and safety climate and safety behaviors
were inconsistent between data collection waves. Age had a significant positive correlation with
perceptions of co-worker safety climate in only three of the four waves, but an insignificant
correlation with both top management and supervisor safety climate at all waves of data
collection. Only a small amount of safety climate research in the construction industry has
studied these relationships, and those that have found a significant positive relationship
between age and safety climate perceptions in Asian construction samples (Fang, Chen, &
Wong, 2006; Siu, Phillips, & Leung, 2003). Within the safety climate construction industry
literature, it is more common to focus on variables related to an organization (e.g., leadership
style of supervisor) rather than demographic or personal factors. Cooper et al. (2004) notes that
differences in safety climate perceptions by work departments, work activity or other situational
conditions is more important than personal variables. Indeed Cooper et al. (2004) notes that,
Safety climate measures…try to capture people’s perceptions about how safety is operationalized in their organization…[not] how the prevailing safety climate affects them as individuals who have longer work experience, as older or younger workers, or as accident or non-accident victims (pg., 508).
39

The only consistent relationship observed between all waves of data in my fifth study
was a small positive correlation between age and safety participation behaviors (r = 0.10 - 0.27,
p < 0.05). This finding is interesting, because safety participation behaviors are contextual
aspects of safety performance. They represent efforts to go above and beyond what’s required
in one’s job description (e.g., wear safety glasses at all times) to actively promote the safety
program. This may reflect older construction worker’s experiences on the job (e.g., witnessing
prior injury and death as a result of poor safety practices). It may also reflect the leadership
roles that many older construction workers are in. They may feel responsible for their
crewmembers, and may put in extra effort to ensure their safety.
Though my first two dissertation studies addressed a need to specifically focus on the
aging workforce, I transitioned towards more proactive OHS concepts. This was because the
frequency and the cost of the WC claims were high regardless of claimant age. Furthermore,
only a very small percent of the variance was explained by age in the cost regression models (<
2%) in study two. Thus, there are many other factors besides age that influence WC costs.
Many of which may include organizational factors, like safety climate, return to work practices,
and ergonomics practices. Thus, I sought to investigate safety climate perceptions as a means
to measure and manage OHS. My results suggest that all construction workers could benefit
from working with individuals that value safety. Furthermore, supervisors who learn about
safety climate concepts may be able to create an environment where workers are voluntarily
engaging in, promoting and putting in extra effort for safety. This could be especially useful in
terms of any OHS effort that a company undertakes, because it could create valuable employee
participation needed to make the effort successful. The ultimate test will be whether or not
these leading indicators and the supervisor intervention can translate into a reduction in injuries,
illness, and their associated costs.
40

4.1. Dissertation strengths and limitations
My dissertation has a number of strengths. First, my first study was the only paper at
the time of its writing to comprehensively review all prior research pertaining to the construction
industry’s aging workforce. Second, in my second study I was able to analyze a large database
of WC claims that was representative of approximately 80% of Colorado construction
policyholders. My third, fourth, and fifth studies represented novel approaches to safety climate
measurement and intervention efforts. In my fifth study I utilized participatory action research to
develop and implement the study’s intervention. Such efforts helped to ensure the
intervention’s content was understandable and applicable to construction supervisors. The
majority of supervisors (> 90%) who worked for all three participating contractors attended the
workshops. Lastly, the results of my fifth study were based on a pre-post, quasi control group
design that evaluated all study outcomes within a LGM framework.
My dissertation findings, however, may not be generalizable to other construction
populations. In my second study, the WC claims were only representative of Colorado
construction workers. In my third, fourth, and fifth studies, the participants came from three
unionized medium-sized mechanical contractors (e.g., plumbing and sheet metal work) in the
US Pacific Northwest. My study findings have yet to be tested among different construction
environments such as different trades, non-union workers, small contractors, and other
geographical regions.
Other limitations include study design, non-randomization, and an inability to account for
the nested nature of the data. In my second study, denominator data were not available, and so
claim-filing rates by age group could not be calculated. My second, third, and fourth studies
were cross-sectional in nature, and thus causal claims cannot be made with their findings. In
study five, I measured outcomes on multiple occasions before and after the intervention, thus
some degree of causal implications can be made. However, the contractors were not randomly
chosen to participate and randomly assigned to the two intervention groups. None of my
41

studies were designed to evaluate either lagging or leading indicators simultaneously. Thus,
associations between WC and safety climate, for example, could not be made. All variables
within each of my studies came from the same sources, and thus common method bias may
have influenced the results. Finally, none of my studies were able to account for the multi-level
nature of the construction industry.
4.2. Recommendations for future research
An apparent limitation of my dissertation was the inability to measure both lagging and
leading measures of OHS performance simultaneously. Future research should investigate the
correspondence between the safety climate measure in this study, safety behaviors, and other
lagging outcomes (e.g., WC data). This would strengthen the evidence for using leading
indicators as measures of OHS surveillance and prevention efforts (Amick et al., 2000; eg.
Wurzelbacher & Jin, 2011). The intervention in my fifth study should also be tested to
determine if it could influence other leading and lagging measures. For example, Amick et al.
(2000) found that several organizational practices (i.e., people oriented culture, safety climate,
ergonomic practices, and disability management) predicted return to work success 6 months
after carpal tunnel surgery. Thus, the intervention may influence the use of and effectiveness of
return to work programs. Given my second studies findings, this may be especially important
for older workers who are injured on the job.
Future research should also investigate the relationships in my third, fourth, and fifth
studies in a variety of construction settings. This includes different trades, non-union companies
and job sites, sizes of contractors (i.e., number of employees), and among vulnerable
populations such as Latino workers. Furthermore, future research should test the multi-level
effect on the study outcomes, which can include work group, contractor, general contractor, job
site, and union affiliation. Lingard et al. (2010), for example, found a correspondence between
the general contractor’s top management and supervisor safety climate and their sub-
contractor’s top management and supervisor safety climate in an Australian construction
42

sample. It may be possible for a general contractor to utilize study five’s intervention to improve
not only their supervisor’s safety leadership skills, but also the supervisor leadership skills of
their sub-contractors. Given common practice of contractors working with other familiar
contractors, this approach may have a significant impact on the OHS of construction job sites.
4.3. Conclusions
The purpose of my dissertation was to highlight novel research activities designed to
characterize and enhance occupational health and safety (OHS) in the United States (US)
construction industry. My dissertation accomplished this by addressing three specific aims. In
my first, second, third, and fourth studies I addressed specific aim one by using lagging and
leading indicators of OHS performance to characterize the OHS experience of construction
workers. In my third, fourth, and fifth studies I addressed specific aim two by expanding the
concept of safety climate, a leading indicator of OHS, and by developing and evaluating a
supervisor intervention focused on safety climate concepts.
The combined results of my studies suggest that OHS should be evaluated in the
construction industry with both lagging (WC data) and leading (safety climate and safety
behaviors) indicators of safety performance. Furthermore, an intervention based on leading
indicator concepts (safety climate principles) may influence other leading indicators (safety
behaviors). Individually, these measures can be valuable measures of safety performance.
Lagging measures such as workers’ compensation data may be good sources of motivation for
contractors to make decisions regarding safety. Leading measures such as safety climate and
safety behaviors may also be useful, because they can identify hazards and their associated
risks before they result in serious negative outcomes. Since I could not measure both types of
measures simultaneously in my dissertation, it is important for future research to evaluate the
predictive validity of this dissertation’s leading measures of OHS. Additionally, if the intervention
in my fifth study is found to influence lagging outcomes, the validity of the intervention will be
strengthened and contractors may be more motivated to adopt the intervention.
43

References Abrams, H. K. (2001). A Short History of Occupational Health. Journal of Public Health Policy,
22(1), 34–80.
Al-Eisa, A. S., Furayyan, M. A., & Alhemoud, A. M. (2009). An empirical examination of the effects of self-efficacy, supervisor support and motivation to learn on transfer intention. Management Decision, 47(8), 1221–1244. doi:10.1108/00251740910984514
Amick, B. C., III, Habeck, R. V., Hunt, A., Fossel, A. H., Chapin, A., Keller, R. B., & Katz, J. N. (2000). Measuring the Impact of Organizational Behaviors on Work Disability Prevention and Management - Springer. Journal of Occupational Rehabilitation, 10(1), 21–38. doi:10.1023/A:1009437728024
Arndt, V., Rothenbacher, D., Daniel, U., Zschenderlein, B., Schuberth, S., & Brenner, H. (2005). Construction work and risk of occupational disability: A ten year follow up of 14 474 male workers. Occup Environ Med, 62(8), 559–566. doi:10.1136/oem.2004.018135
Barling, J., Loughlin, C., & Kelloway, E. K. (2002). Development and test of a model linking safety-specific transformational leadership and occupational safety. Journal of Applied Psychology, 87, 488–496.
Bass, B. (1990). From transactional to transformational leadership: Learning to share the vision. Organizational Dynamics, 18(3), 19–31.
Boden, L. (2013). Measuring underreporting by comparing workers' compensation and bureau of labor statistics injury data. Presented at the American Public Health Association 141st Annual Meeting, Boston. Retrieved from https://apha.confex.com/apha/141am/webprogramadapt/Paper288600.html
Bonauto, D., Silverstein, B., Kalat, J., & Connon, C. (2003). Workers compensation claims in the food processing industry, Washington state: 1994 to 1999 (64 ed.). Olympia: Safety and Health Assessment and Research for Prevention Program.
Borman, W. C., Illgen, D. R., & Klimoski, R. J. (2003). Industrial and organizational psychology. In I. B. Weiner (Ed.), Handbook of psychology (Vol. 12). Hoboken: John Wiley & Sons, Inc.
Brondino, M., Silva, S. A., & Pasini, M. (2012). Multilevel approach to organizational and group safety climate and safety performance: Co-workers as the missing link. Safety Science, 50(9), 1847–1856. doi:10.1016/j.ssci.2012.04.010
Brown, T. A. (2011). Confirmatory factor analysis for applied research. New York: The Guildford Press.
Brunette, M. J. (2004). Construction safety research in the United States: targeting the Hispanic workforce. Injury Prevention, 10(4), 244–248. doi:10.1136/ip.2004.005389
Bureau of Labor Statistics. (2013a, August 22). Table 2. Fatal occupational injuries by industry and selected event or exposure, 2012. Bls.Gov. Retrieved January 3, 2014, from http://www.bls.gov/news.release/cfoi.t02.htm
Bureau of Labor Statistics. (2013b, November 26). Table 1. Number, median days away from work, and incidence rate for nonfatal occupational injuries and illnesses involving days away from work by ownership, industry, musculoskeletal disorders, and event or exposure. Bls.Gov. Retrieved January 3, 2014, from http://www.bls.gov/news.release/osh2.t01.htm
44

Bureau of Labor Statistics. (2013c, December 26). Table 2. Number, median days away from work, and incidence rate for nonfatal occupational injuries and illnesses involving days away from work by ownership, industry, and nature of injury, 2012. Bls.Gov. Retrieved January 3, 2014, from http://www.bls.gov/news.release/osh2.t02.htm
Bureau of Labor Statistics. (2013d, December 26). Table 12. Incidence rates for nonfatal occupational injuries and illnesses involving days away from work per 10,000 full-time workers and median days away from work by industry sector and days away from work groups, private industry, 2012. Bls.Gov. Retrieved January 4, 2014, from http://www.bls.gov/news.release/osh2.t12.htm
Bureau of Labor Statistics. (2014, February 20). Industries by supersector and NAICS code. Bls.Gov. Retrieved February 21, 2014, from http://www.bls.gov/iag/tgs/iag_index_naics.htm
Carty, G. J. (1995). Construction. Journal of Construction Engineering & Management, 121(3), 319–328. doi:10.1061/(ASCE)0733-9364(1995)121:3(319)
Center for Construction Research and Training. (2013). The Construction Chart Book: The U.S. construction industry and its workers (5 ed.). Silver Spring: CPWR.
Chiaburu, D. S., & Harrison, D. A. (2008). Do peers make the place? Conceptual synthesis and meta-analysis of coworker effects on perceptions, attitudes, OCBs, and performance. Journal of Applied Psychology, 93(5), 1082–1103. doi:10.1037/0021-9010.93.5.1082
Choi, S. D. (2009). Safety and ergonomic considerations for an aging workforce in the US construction industry. Work, 33(3), 307–315. doi:10.3233/WOR-2009-0878
Christian, M. S., Bradley, J. C., Wallace, J. C., & Burke, M. J. (2009). Workplace safety: A meta-analysis of the roles of person and situation factors. Journal of Applied Psychology, 94(5), 1103–1127. doi:10.1037/a0016172
Clarke, S. (2010). An integrative model of safety climate: Linking psychological climate and work attitudes to individual safety outcomes using meta-analysis. Journal of Occupational and Organizational Psychology, 83(3), 553–578. doi:10.1348/096317909X452122
Cooper, M. D., & Phillips, R. A. (2004). Exploratory analysis of the safety climate and safety-behavior relationship. Journal of Safety Research, 35, 497–512.
Crawford, J. O., Graveling, R. A., Cowie, H. A., & Dixon, K. (2010). The health safety and health promotion needs of older workers. Occupational Medicine, 60(3), 184–192. doi:10.1093/occmed/kqq028
Dembe, A. E., Erickson, J. B., & Delbos, R. (2004). Predictors of work-related injuries and illnesses: National survey findings. Journal of Occupational and Environmental Medicine, 1(8), 542–550.
Dong, X. S., Men, Y., & Ringen, K. (2010). Work-related injuries among Hispanic construction workers—Evidence from the Medical Expenditure Panel Survey. American Journal of Industrial Medicine, 53(6), 561–569. doi:10.1002/ajim.20799
Dong, X. W., Ringen, K., Men, Y. R., & Fujimoto, A. (2007). Medical costs and sources of payment for work-related injuries among Hispanic construction workers. J Occup Environ Med, 49(12), 1367–1375. doi:10.1097/JOM.0b013e31815796a8
Dong, X., & Platner, J. W. (2004). Occupational fatalities of hispanic construction workers from 1992-2000. American Journal of Industrial Medicine, 45(1), 45–54.
Dong, X., Wang, X., Daw, C., & Ringen, K. (2011). Chronic diseases and functional limitations among older construction workers in the United States: A 10 year follow-up study. J Occup
45

Environ Med, 53(4), 372–380.
Fang, D., Chen, Y., & Wong, L. (2006). Safety climate in construction industry: A case study in Hong Kong. Journal of Construction Engineering & Management, 132(6), 573–584. doi:10.1061/�ASCE�0733-9364�2006�132:6�573
Fitzgerald, M. D., Tanaka, H., Tran, Z. V., & Seals, D. R. (1997). Age-related declines in maximal aerobic capacity in regularly exercising vs. sedentary women: a meta-analysis. Journal of Applied Physiology, 83(1), 160–165.
Flin, R., Mearns, K., O'Connor, P., & Bryden, R. (2000). Measuring safety climate: identifying the common features. Safety Science, 34, 177–192.
Gillen, M., Baltz, D., Gassel, M., Kirsch, L., & Vaccaro, D. (2002). Perceived safety climate, job demands, and co-workers' support among union and nonunion injured construction workers. Journal of Safety Research, 33, 33–51.
Goodrum, P. M. (2004). Hispanic and Non-Hispanic Wage Differentials: Implications for United States Construction Industry. Journal of Construction Engineering & Management, 130(4), 552–559.
Guldenmund, F. (2000). The nature of safety culture: a review of theory and practice. Safety Science, 34, 215–257.
Hale, A. (2009). Why safety performance indicators. Safety Science, 47(4), 479–480.
Haslam, R. A., Hide, S. A., Gibb, A. G., Gyi, D. E., Pavitt, T., Atkinson, S., & Duff, A. R. (2005). Contributing factors in construction accidents. Appl Ergon, 36(4), 401–415. doi:10.1016/j.apergo.2004.12.002
Health Safety Executive. (2003, August 21). Causal factors in construction accidents. Retrieved September 13, 2012, from http://www.hse.gov.uk/research/rrpdf/rr156.pdf
Hoonakker, P., Loushine, T., Carayon, P., Kallman, J., Kapp, A., & Smith, M. J. (2005). The effect of safety initiatives on safety performance: A longitudinal study. Appl Ergon, 36(4), 461–469. doi:10.1016/j.apergo.2004.07.006
Howard, J., Stafford, P., Branche, C., T, B., & Froetschet, J. (2010). Twenty years of NIOSH construction research. J Safety Res, 41(3), 187–188.
ILR School, Cornell University. (2011, January 4). The 1911 Triangle Factory Fire. Ilr.Cornell.Edu. Retrieved January 4, 2014, from http://www.ilr.cornell.edu/trianglefire/legacy/index.html
Kachan, D., Fleming, L. E., LeBlanc, W. G., Goodman, E., Arheart, K. L., Caban-Martinez, A. J., et al. (2012). Worker populations at risk for work-related injuries across the life course. American Journal of Industrial Medicine, 55(4), 361–366. doi:10.1002/ajim.21994
Kelloway, E. K., & Barling, J. (2010). Leadership development as an intervention in occupational health psychology. Work and Stress, 24(3), 260–279.
Kelloway, E. K., Mullen, J., & Francis, L. (2006). Divergent effects of transformational and passive leadership on employee safety. Journal of Occupational Health Psychology, 11(1), 76–86. doi:10.1037/1076-8998.11.1.76
Khanzode, V. V., Maiti, J., & Ray, P. K. (2012). Occupational injury and accident research: A comprehensive review. Safety Science, 50, 1355–1367.
Kines, P., Andersen, L. P. S., Spangenberg, S., Mikkelsen, K. L., Dyreborg, J., & Zohar, D. (2010). Improving construction site safety through leader-based verbal safety
46

communication. Journal of Safety Research, 41(5), 399–406. doi:10.1016/j.jsr.2010.06.005
Kines, P., Lappalainen, J., Mikkelsen, K. L., Olsen, E., Pousette, A., Tharaldsen, J., et al. (2011). Nordic Safety Climate Questionnaire (NOSACQ-50): A new tool for diagnosing occupational safety climate. International Journal of Industrial Ergonomics, 41(6), 634–646. doi:10.1016/j.ergon.2011.08.004
Kline, R. B. (2011). Principles and practice of structural equation modeling. New York: The Guildford Press.
Konz, S., & Johnson, S. (2008). Work design: Occupational ergonomics (7 ed.). Scottsdale: Holcomb Hathaway, Publishers.
Leigh, J. P., Marcin, J. P., & Miller, T. R. (2004). An estimate of the US government's undercount of nonfatal occupational injuries. Journal of Occupational and Environmental Medicine, 46(1), 10–18.
Levy, B. S., Wegman, D. H., Baron, R. M., & Sokas, R. K. (Eds.). (2006). Occupational and environmental health: Recognizing and preventing disease and injury (5 ed.). Philadelphia: Lippincott Williams & Wilkins.
Lewin, K., Lippitt, R., & White, R. (1939). Patterns of aggressive behaviour in experimentally created “social climates.” Journal of Social Psychology, 10, 271–299.
Lingard, H. C., Cooke, T., & Blismas, N. (2010). Safety climate in conditions of construction subcontracting: a multi‐level analysis. Construction Management and Economics, 28(8), 813–825. doi:10.1080/01446190903480035
Lipscomb, H. J., Dement, J., & Behlman, R. (2003). Direct costs and patterns of injuries among residential carpenters, 1995-2000. J Occup Environ Med, 45(8), 875–880.
Lipscomb, H. J., Nolan, J., & Patterson, D. (2013). Safety, incentives, and the reporting of work-related injuries among union carpenters: “You're pretty much screwed if you get hurt at work.” Ajim, 56(4), 389–399.
Loushine, T. W., Hoonakker, P. L. T., Carayon, P., & Smith, M. J. (2006). Quality and safety management in construction. Total Quality Management, 17(9), 1171–1212.
Lowery, J. T., Borgerding, J. A., Zhen, B., Glazner, J. E., Bondy, J., & Kreiss, K. (1998). Risk factors for injury among construction workers at Denver International Airport. American Journal of Industrial Medicine, 34(2), 113–120. doi:10.1002/(SICI)1097-0274(199808)34:2<113::AID-AJIM3>3.0.CO;2-Y
Machin, M. A., & Fogarty, G. J. (2004). Assessing the antecedents of transfer intentions in a training context. International Journal of Training and Development, 8(3), 222–236. doi:10.1111/j.1360-3736.2004.00210.x
Meliá, J. L., Mearns, K., Silva, S. A., & Lima, M. L. (2008). Safety climate responses and the perceived risk of accidents in the construction industry. Safety Science, 46, 949–958. doi:10.1016/j.ssci.2007.11.004
Mitropoulos, P., & Abdelhamid, T. S. (2005). Systems Model of Construction Accident Causation. Journal of Construction Engineering and Management-Asce, 131(7), 1–11. doi:10.1061/�ASCE�0733-9364�2005�131:7�816
MMWR. (1999). Achievements in public health, 1900-1999: Improvements in workplace safety -- United States 1900-1999, 48(22), 461–469. Retrieved from http://www.cdc.gov/mmwr/preview/mmwrhtml/mm4822a1.htm
47

Moore, J. F., Cigularov, K. P., Sampson, J. M., Rosecrance, J. C., & Chen, P. Y. (2013). Construction workers' reasons for not reporting work-related injuries: An exploratory study. International Journal of Occupational Safety and Ergonomics, 19(1), 97–105.
Mullen, J. E., & Kelloway, E. K. (2009). Safety leadership: A longitudinal study of the effects of transformational leadership on safety outcomes. Journal of Occupational and Organizational Psychology, 82(2), 253–272. doi:10.1348/096317908x325313
Mullen, J., & Kelloway, E. K. (2011). Occupational health and safety leadership. In J. C. Quick & L. E. Tetrick (Eds.), Handbook of Occupational Health Psychology (2nd ed., pp. 357–372). Washington, DC: APA.
Mullen, J., Kelloway, E. K., & Teed, M. (2011). Inconsistent style of leadership as a predictor of safety behavior. Work and Stress, 25(1), 41–54.
Muthen, L. K., & Muthen, B. O. (2012). Mplus User's Guide (7 ed.). Los Angles, CA: Muthen & Muthen.
Nahrgang, J. D., Morgeson, F. P., & Hofmann, D. A. (2007). Predicting safety performance: A meta-analysis of safety and organizational constructs. Presented at the 22nd Annual Conference of the Society for Industrial and Organizational Psychology, New York.
National Research Council and Institute of Medicine of the National Academies. (2009). Construction Research at NIOSH. Washington D. C.: The National Academies Press.
Neal, A., Griffin, M. A., & Hart, P. M. (2000). The impact of organizational climate on safety and individual behaviour. Safety Science, 34, 99–109.
NORA Construction Sector Council. (2008). National Occupational Research Agenda - National Construction Agenda. Cdc.Gov. Retrieved September 2, 2012, from http://www.cdc.gov/niosh/nora/comment/agendas/construction/pdfs/ConstOct2008.pdf
OSHA. (1996, May 4). OSH Act, OSHA standards, inspections, citations and penalties. Osha.Gov. Retrieved January 4, 2014, from https://www.osha.gov/doc/outreachtraining/htmlfiles/introsha.html
OSHA. (n.d.). Focus four hazards. Osha.Gov. Retrieved January 4, 2014, from https://www.osha.gov/dte/outreach/construction/focus_four/
Pousette, A., Larsson, S., & Törner, M. (2008). Safety climate cross-validation, strength and prediction of safety behaviour. Safety Science, 46(3), 398–404. doi:10.1016/j.ssci.2007.06.016
Probst, T., Brubaker, T., & Barsotti, A. (2008). Organizational injury rate underreporting: The moderating effect of organizational safety climate. Journal of Applied Psychology, 93, 1147–1154.
Reason, J. (1997). Managing the risks of organizational accidents. Aldershot: Ashgate Publishing Ltd.
Rentsch, J. R. (1990). Climate and culture: Interaction and qualitative differences in organizational meanings. Journal of Applied Psychology, 75, 668–681.
Roelofs, C., Sprague-Martinez, L., Brunette, M., & Azaroff, L. (2011). A qualitative investigation of Hispanic construction worker perspectives on factors impacting worksite safety and risk. Environmental Health, 10, 84–84. doi:10.1186/1476-069X-10-84
Schneider, B. (1975). Organizational climates: An essay. Personnel Psychology, 28(4), 447–479. doi:10.1111/j.1744-6570.1975.tb01386.x
48

Schwatka, N. V., Butler, L. M., & Rosecrance, J. C. (2012). Age in relation to worker compensation costs in the construction industry. American Journal of Industrial Medicine, 56(3), 356–366. doi:10.1002/ajim.22093
Siu, O.-L., Phillips, D. R., & Leung, T.-W. (2003). Age differences in safety attitudes and safety performance in Hong Kong construction workers. Journal of Safety Research, 34(2), 199–205.
Thacker, S. B., Stroup, D. F., Parrish, R. G., & Anderson, H. A. (1996). Surveillance in environmental public health: issues, systems, and sources. American Journal of Public ealth, 86(5), 633–638. doi:10.2105/AJPH.86.5.633
Thomas, D. R. (2010). Sarcopenia. Clin Geriatr Med, 26(2), 331–346.
US Census Bureau. (2013, May 13). 2012 NAICS definitions. Census.Gov. Retrieved January 4, 2014, from http://www.census.gov/eos/www/naics/2012NAICS/2012_Definition_File.pdf
Waehrer, G. M., Dong, X. S., Miller, T., Men, Y., & Haile, E. (2007). Occupational injury costs and alternative employment in construction trades. J Occup Environ Med, 49(11), 1218–1227. doi:10.1097/JOM.0b013e318156ed24
Welch, L. S., Haile, E., Boden, L. I., & Hunting, K. L. (2010). Impact of musculoskeletal and medical conditions on disability retirement-a longitudinal study among construction roofers. American Journal of Industrial Medicine, 53(6), 552–560. doi:10.1002/ajim.20794
Wurzelbacher, S., & Jin, Y. (2011). A framework for evaluating OSH program effectiveness using leading and trailing metrics. Journal of Safety Research, 42(3), 199–207. doi:10.1016/j.jsr.2011.04.001
Xinyu, H., & Hinze, J. (2006). Owners role in construction safety. Journal of Construction Engineering & Management, 132(2), 164–173. doi:10.1061/(asce)0733-9364(2006)132:2(164)
Zohar, D. (1980). Safety climate in industrial organizations: Theoretical and applied implications. Journal of Applied Psychology, 65, 96–102.
Zohar, D. (2000). A group-level model of safety climate: Testing the effect of group climate on micro-accidents in manufacturing jobs. Journal of Applied Psychology, 85, 587–596.
Zohar, D. (2002). Modifying supervisory practices to improve submit safety: A leadership-based intervention model. Journal of Applied Psychology, 87(1), 156–163.
Zohar, D. (2003). The influence of leadership and climate. In D. A. Hofmann & L. E. Tetrick (Eds.), Health and safety in organizations (pp. 201–230). San Francisco, CA: Jossey-Bass.
Zohar, D. (2011). Safety climate: Conceptual and measurement issues. In J. C. Quick & L. E. Tetrick (Eds.), Handbook of Occupational Health Psychology (2nd ed.). Washington DC: APA.
Zohar, D., & Luria, G. (2005). A multilevel model of safety climate: Cross-level relationships between organization and group-level climates. Journal of Applied Psychology, 90, 616–628.
Zohar, D., & Luria, G. (2010). Group Leaders as Gatekeepers: Testing Safety Climate Variations across Levels of Analysis. Appl Psychol: an Int Rev, 59(4), 647–673. doi:10.1111/j.1464-0597.2010.00421.x
49

PART II
Aging workforce and injury in the construction industry
50

Chapter 1
Introduction
The relatively large birth cohort between 1946 and 1964 combined with the recent
economic recession during the first decade of the 21st century have led to an increase in the
proportion of older workers in the United States (US) workplace. For example, a reversal of the
20th century trend towards earlier retirement has been observed as a growing number of
employees are planning for longer working careers (Shuford & Restrepo, 2005; Silverstein,
2008). As workers continue to delay retirement, understanding the health and safety needs of
an older-aged workforce will become increasingly important in the near future.
Why is there a need to address injuries among older workers in the construction
industry? First, construction is a physically demanding industry (Choi, 2009). Second, injuries
and illnesses among construction workers are among the most costly across all industries
(Waehrer, Dong, Miller, Haile, & Men, 2007). Third, construction workers experience increasing
chronic health conditions over time, compared to white-collar workers (X. Dong, Wang, Daw, &
Ringen, 2011). Lastly, workers from about age 50 and older have been considered to be at
increased risk of injury, compared to younger workers. This hypothesis was based on the
notion that reduced physical capabilities associated with older age in areas such as strength,
balance, and processing speed would increase risk of injury (Maertens, Putter, Chen, Diehl, &
Huang, In press). In fact, this is not the case. Analyses of workers’ compensation claims data
indicate that older workers typically have a lower frequency of workplace injuries, but higher
injury-related costs, compared to younger workers (Shuford & Restrepo, 2005).
The goal of this review is to summarize the published epidemiologic literature that
examined the cause and type of injuries and related costs with respect to age for the
construction industry. Evaluating injury trends among older workers among the construction
industry is a strategic goal for the following agencies: the National Institute of Occupational
51

Safety and Health (NIOSH), the NIOSH National Occupational Research Agenda (NORA) and
the Center for Construction Research and Training (CPWR). There is a knowledge gap in the
field of occupational injury especially in terms of characterizing the type and cause of
construction worker injuries among older workers. These data are needed to design targeted
interventions aimed at preventing work-related injuries among older construction workers in
order to keep them employed, as well as to reduce injury costs (Kisner & Fosbroke, 1994;
Schoenfisch, Lipscomb, Shishlov, & Myers, 2010).
52

Chapter 2
Methods A PubMed search was conducted that included combinations of the following terms:
older workers, construction, construction industry, injury, and age to identify original research
articles published from 1998 through June 2011 among US populations. We did not include
articles that were published prior to 1998, because there was a major shift that occurred in the
early to mid 1990’s that included the development of a national construction safety and health
research agenda that makes studies conducted prior to this time less representative of the
present-day construction industry environment (Howard, Stafford, Branche, T., & Froetschet,
2010). When construction, injury and age were searched together, one hundred and ninety-one
papers were identified but only ten were used (Forde, Punnett, & Wegman, 2005; Jackson &
Loomis, 2002; Janicak, 2008; H. Lipscomb, Leiming, & Dement, 2003; Lowery et al., 1998;
Welch, Haile, Boden, & Hunting, 2008; Welch, Haile, Boden, & Hunting, 2010). When
construction industry and older workers were searched together, twenty-two papers were
identified and only eight were used (John M. Dement, Ringen, Welch, Bingham, & Quinn, 2009;
Jackson & Loomis, 2002; Janicak, 2008; Shishlov, Schoenfisch, Myers, & Lipscomb, 2011).
Articles were excluded if they did not pertain to the construction industry, older workers and
included at least one of the following topics: injury cause, injury type or injury cost. Once the
first author (NVS) completed the search, the second author (LMB) conducted the same search
to ensure that no relevant papers were missed. We identified an additional nine relevant
articles that were either seminal papers in the field based on the authors’ knowledge, or were
articles included in the reference list of one of the articles identified by the PubMed search (J. M.
Dement, Ringen, Welch, Bingham, & Quinn, 2005; X. Dong et al., 2011; Friedman & Forst,
2009; G. LeMasters, Bhattacharya, Borton, & Mayfield, 2006; G. K. LeMasters et al., 1998;
Schoenfisch et al., 2010; Waehrer et al., 2007), some of which were studies based outside of
53

the US (Arndt et al., 2005; Colantonio, McVittie, Lewko, & Yin, 2009; de Zwart, Frings-Dresen, &
van Duivenbooden, 1999; Hoonakker & van Duivenbooden, 2010; Kemmlert & Lundholm, 2001;
Suarthana, Moons, Heederik, & Meijer, 2007).
54

Chapter 3
Results
3.1. An aging US workforce
The proportion of US workers who are 55 years and older will increase as the
participation rate of workers 16 to 24 years of age declines within the next decade. The
participation rate of US workers 55 years and older has increased from 31.3 percent in 1998 to
39.4 percent in 2008, and is estimated to reach 43.5 percent by 2018 (Toossi, 2009). According
to analyses of data from the Health and Retirement Study, possible reasons for the increase in
retirement age include decreases in Social Security benefits, diminishing value of private
pension portfolios, and increasing health and longevity (Cahill, Giandrea, & Quinn, 2005).
Prior to the mid-1980’s there were incentives to retire early. Retirement was a planned
phase of life in the early 1900’s that was encouraged by the government and private sectors.
The Social Security Act of 1935 legislated a social insurance program that provided income for
retired workers over the age of 65. Then in 1961, the retirement age requirement was lowered
to 62 years. In addition, corporate pension plans designed to supplement Social Security
benefits only needed to provide income until around age 70.2, the average life expectancy in
1961 (Ezzati, Friedman, Kulkarni, & Murray, 2008; Hedge, Borman, & Lammlein, 2006). As of
2008, the average life expectancy in the US has reached 78.4 years ("The world bank: World
development indicators,"). Overall, the legislative and corporate climate until recently has
encouraged retirement as early as 55 years of age (Wiatrowski, 2001).
Within the past few decades, a typical retirement age has become less defined.
Legislative changes, such as the Age Discrimination in Employment Act of 1986 and the
Pension Protection Act of 2006 have enabled workers to delay retirement without penalties. In
addition, delaying retirement has in some cases become an economic necessity. Defined
contribution retirement plans have become more popular than defined-benefit plans for some,
55
while Social Security may be the only means of retirement for others (Weller, 2005). Thus,
workers are encouraged to stay on the job longer in order to maximize retirement benefits
(Toossi, 2009).
3.1.1. An aging workforce in the US construction industry
The US non-profit Center for Construction Research and Training (CPWR) reported a 70
percent increase in the number of paid construction workers from 1977 to 2002 (Center for
Construction Research and Training, 2008). The number of jobs in the construction industry is
expected to continue to grow by 19% from 2008 to 2018, compared to a projected 11% for all
industries combined (U.S. Bureau of Labor Statistics, 2010). The growth of the construction
industry is expected to be hindered in the future by a shortage of skilled workers (Goodrum,
1999). Thus, keeping skilled workers employed in the industry for as long as possible is a high
priority in the US (Welch et al., 2010).
The increasing average age of the construction industry workforce is consistent with the
national trend observed for all industries, where the median age of the workforce has steadily
increased from 39.4 years in 2000 to 42 years in 2010. In the construction industry, the median
worker age was 37.9 years in 2000 and 40.4 years in 2010 (U.S. Bureau of Labor Statistics,
2000-2010). As described above, increases in the average workforce age may be explained in
part by the decreasing rates of younger workers entering the workforce, as well as changes in
the financial resources of older workers.
Chronic disease and functinal impairment cause serious limitations for construction
workers as they age (G. LeMasters et al., 2006; Welch et al., 2008). Dong et al. (2011)
analyized data from a 10-year follow-up study (1998-2008) of older construction workers and
found a persistent disparity in health status between construction and white-collar workers as
they age. For example, the risk was higher for older construction workers, compared to white-
colar workers for back problems (OR=1.54, 95% CI=1.10, 2.14) and functional limitations, such
as not being able to reach/extend arms up (OR=2.18, CI=1.40, 3.39) or to lift/carry ten or more
56

pounds (OR=1.67, 95% CI=1.03, 2.72). The disparity reported for musculoskeletal diseases by
Dong et al. (2011) is likey related to the physically demanding tasks required in the construction
trades (Choi, 2009; Hoonakker & van Duivenbooden, 2010).
3.1.2. Susceptibility to injury among an aging workforce
Benjamin, et al. (2008) contend that older workers may not be able to reduce work hours
or switch to less physically demanding work without risking the loss or reduction in pension and
or health benefits. Thus, older workers may find themselves in a difficult financial situation
when making a decision whether to remain in the workforce. If they continue working for
financial reasons, they may be unable to perform the same tasks as well, or as safely as their
younger counterparts.
The aging process involves many physical changes that can make construction work
tasks more difficult for older workers. For example, physically demanding work may be difficult
due to decreased cardiac output and reduced tolerance to physical activity (Fitzgerald, Tanaka,
Tran, & Seals, 1997). Older workers are also susceptible to loosing muscle mass and
subsequent decreases in strength (Thomas, 2010, p. 335). Bone density decreases with age
resulting in a greater propensity for fractures (Sattelmair, Pertman, & Forman, 2009). Older
adults are also more susceptible to chronic inflammatory disorders, which are associated with
arthritis and other conditions that can limit joint range of motion and function (Spector et al.,
1997; Strandberg & Tilvis, 2000). Body composition and weight also tend to change with age in
a way that predisposes workers to diabetes, hypertension, and reduced flexibility and mobility
(Houston, Nicklas, & Zizza, 2009). Overall, the aging process can involve significant physical
changes that challenge a worker’s ability to perform physically demanding tasks, such as those
in construction, without incurring injury.
3.2. Age-related injury in the construction industry
Due to the nature of the trade, most construction workers experience a physically
demanding work environment on a daily basis. The industry is characterized by stressful
57

environmental conditions (e.g., harsh weather) (Nguyen, Kneppers, Garcia de Soto, & Ibbs,
2010), long work hours (Haslam et al., 2005), irregular work periods (Forde & Buchholz, 2004;
Goldenhar, Hecker, Moir, & Rosecrance, 2003), unpredictable workplaces and non-continuous
employment (Ringen & Stafford, 1996). The physical demands of the job involve exposure to
heavy lifting and materials handling, use of vibrating tools, awkward postures, prolonged static
positions, and working while injured or in pain (Rosecrance, 2004). These demands can
eventually result in injury, missed work, and disability (G. LeMasters et al., 2006; Merlino,
Rosecrance, Anton, & Cook, 2003; Rosecrance, Cook, & Zimmerman, 1996). Additionally, most
construction tasks involve a combination of multiple physical exposures further increasing the
probability of injury and disability (Choi, 2009). Therefore, one method to reduce the burden of
injury among construction workers is to identify susceptible populations, such as older workers,
and characterize the their injuries in terms of cause, type and severity (i.e. cost) in order to
appropriately focus on the best available prevention strategies.
In Table 4 the most relevant studies related to the cause, type and/or cost of injuries in
the construction industry, with respect to age are shown. In summary, the findings from these
studies indicate that injuries are less frequent but more severe among older construction
workers, thus requiring older workers to take a longer to recover compared to injuries that occur
among younger workers (Choi, 2009; Hoonakker & van Duivenbooden, 2010; 2010). These
injury characteristics among older workers translate into higher compensation costs, due in part
to longer lost work time and disability.
58
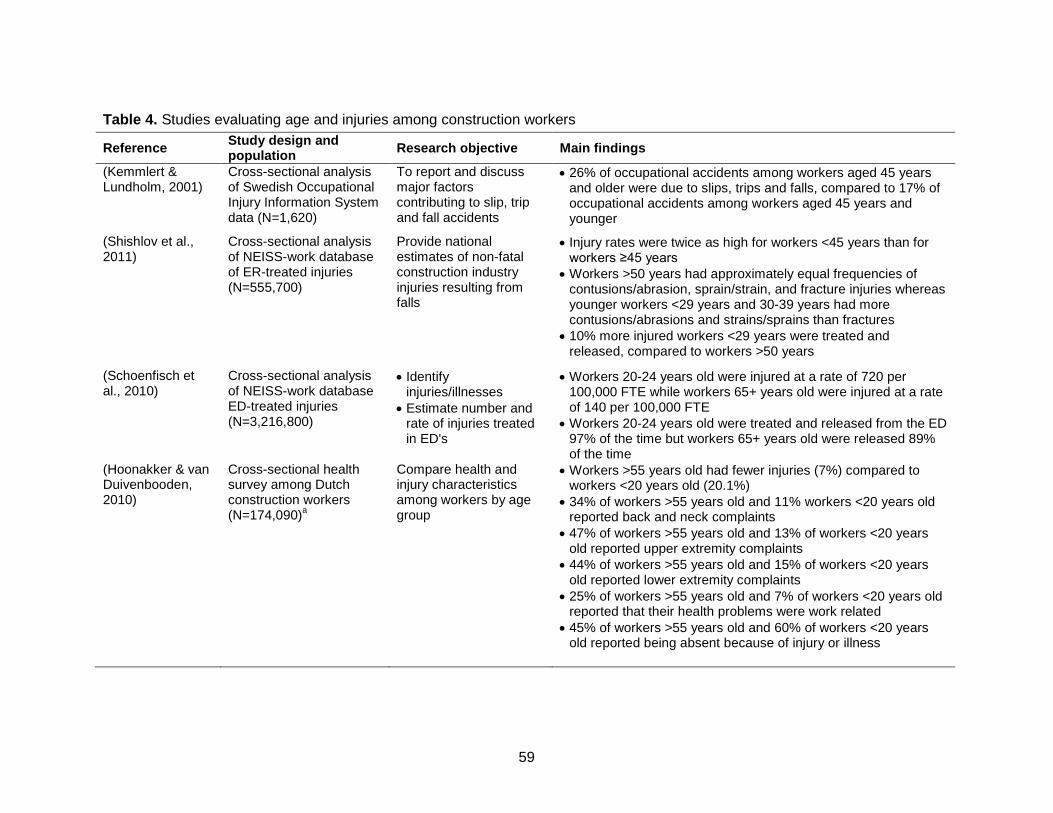
Table 4. Studies evaluating age and injuries among construction workers
Reference Study design and population Research objective Main findings
(Kemmlert & Lundholm, 2001)
Cross-sectional analysis of Swedish Occupational Injury Information System data (N=1,620)
To report and discuss major factors contributing to slip, trip and fall accidents
• 26% of occupational accidents among workers aged 45 years and older were due to slips, trips and falls, compared to 17% of occupational accidents among workers aged 45 years and younger
(Shishlov et al., 2011)
Cross-sectional analysis of NEISS-work database of ER-treated injuries (N=555,700)
Provide national estimates of non-fatal construction industry injuries resulting from falls
• Injury rates were twice as high for workers <45 years than for workers ≥45 years
• Workers >50 years had approximately equal frequencies of contusions/abrasion, sprain/strain, and fracture injuries whereas younger workers <29 years and 30-39 years had more contusions/abrasions and strains/sprains than fractures
• 10% more injured workers <29 years were treated and released, compared to workers >50 years
(Schoenfisch et al., 2010)
Cross-sectional analysis of NEISS-work database ED-treated injuries (N=3,216,800)
• Identify injuries/illnesses
• Estimate number and rate of injuries treated in ED's
• Workers 20-24 years old were injured at a rate of 720 per 100,000 FTE while workers 65+ years old were injured at a rate of 140 per 100,000 FTE
• Workers 20-24 years old were treated and released from the ED 97% of the time but workers 65+ years old were released 89% of the time
(Hoonakker & van Duivenbooden, 2010)
Cross-sectional health survey among Dutch construction workers (N=174,090)a
Compare health and injury characteristics among workers by age group
• Workers >55 years old had fewer injuries (7%) compared to workers <20 years old (20.1%)
• 34% of workers >55 years old and 11% workers <20 years old reported back and neck complaints
• 47% of workers >55 years old and 13% of workers <20 years old reported upper extremity complaints
• 44% of workers >55 years old and 15% of workers <20 years old reported lower extremity complaints
• 25% of workers >55 years old and 7% of workers <20 years old reported that their health problems were work related
• 45% of workers >55 years old and 60% of workers <20 years old reported being absent because of injury or illness
59

Table 4. Continued Reference Study design and
population Research objective Main findings
(Welch et al., 2008)
Cross sectional study of roofers aged 45-59 (N=979)
Investigate the prevalence of medical and MSD conditions among working roofers and examine its relationship with age, physical functioning and work limitations
• 54% of workers reported at least one MSD conditions and 42% reported at least one medical condition. Lower back/sciatica was the most reported type of MSD condition
• 50% of subjects with a reported MSD condition were estimated to be younger than 45 when the problem began
• 31% reported missing work due to MSD condition two years prior to interview
• The most common medical conditions were cancer (55%), heart problems (53%), diabetes (33%), burns (38%) and lower back/sciatica problems (35%)
• Increased age was associated with reduced physical functioning, regardless of MSD or medical condition
(Colantonio et al., 2009)
Cross-sectional study of concussion/intracranial injury that resulted in days off work from the Ontario Workplace Safety and Insurance Board database (N=218)
Examine work-related traumatic brain injuries (TBI) and the associated demographic and injury-related factors
• Workers 25-34 years old experienced the most TBIs (27.5%) and workers 55-64 years old experience the least amount of TBIs (9.7%)
• Workers 35-64 years old experienced TBIs by falls more often and workers 17-34 years old experienced TBIs by being struck by/against more often
• Compared to all other construction trades, trade helpers/laborers experienced the most TBIs. Trade helpers/laborers aged 17-24 years old were especially susceptible to TBIs.
(Friedman & Forst, 2009)
Cross-sectional study of injuries in the construction industry using the Illinois Workers’ Compensation Commission claims database (N=19,734)
Describe characteristics of injured construction workers filing claims
• Workers 16-24 incurred a mean cost of $17,558 whereas workers 55-64 years old incurred a mean cost of $53,125; compensation decreased among workers >65 years old where mean costs were $31,618
• A $520 increase in total cost for every 10 year increase in age was observed
(Suarthana et al., 2007)
Cross-sectional study of Dutch natural stone and construction workers with potentially high quartz dust exposure (N=1,291)
To develop a simple diagnostic model to estimate the probability of individual workers having pneumoconiosis
• Workers aged >40 years were at 3.3 times the risk of pneumoconiosis, compared to workers ≤40 years of age
60

Table 4. Continued Reference Study design and
population Research objective Main findings
(Waehrer et al., 2007)
Cross-sectional study of fatal and non-fatal injuries in the US construction industry using self-reported data from the BLS survey and the National Census database of fatal occupational injuries
Determine the costs of injuries and illnesses in the construction industry
• Workers 25-44 years old were injured the most frequently and incurred the greatest amount of costs
• Frequency and cost of injury declined with age after 44 years old except for medical costs. Workers ≥65 years old incurred a mean of $5,831 and workers ≤24 years old incurred a mean of $2,903 medical costs
(G. LeMasters et al., 2006)
Cross-sectional analysis of self-reported health data among retired union construction workers and retirees from non-construction unions (e.g., Communication Workers of America and American Federation of Teachers) (N=780)
Determine if retired construction workers have poor self-reported quality of life and higher levels of self-reported physical functioning than more sedentary occupations.
• 42% of construction workers reported poor health • Male construction workers were five times more likely to report
poor health, compared to non-construction workers • 19% construction workers reporting being in severe pain vs. 3%
of non-construction workers
(H. Lipscomb et al., 2003)
Cross-sectional study of injuries among carpenters using Washington state workers’ compensation claims data (N=16,215)
Describe the leading cause of morbidity and mortality due to falls
• Compared to workers ≥45 years old, workers <30 years old were less likely to fall on the same level (RR=0.73, CI=0.58, 0.93)
• Compared to workers ≥45 years old, workers <30 years old were less likely to have a fall from the same level that resulted in paid lost time (RR=0.48, CI=0.32, 0.72)
• Workers 45-54 years old claims due to falls from a same level cost a mean of $21,621 whereas workers <30 years old cost a mean of $4,638. Mean cost for workers >55 years old declined to a mean of $15,468
• Workers >55 years old had a mean cost of $21,071 for a fall from elevation where as workers <30 years old had a mean cost of $9,034 for a fall from elevation
61

Table 4. Continued Reference Study design and
population Research objective • Main findings
(de Zwart et al., 1999)
Cross-sectional study of self-reported health of Dutch construction workers (N=44,486)
Identify age-related work and health issues that can be included in a questionnaire of older construction workers health
• Compared to younger workers (16-30 years), older workers (45-64 years) experienced more complaints about their neck (PR=3.44, CI=2.77, 4.28), upper extremities (PR=2.56, CI=2.23-2.94), back (PR=1.75, CI=1.57, 1.96) and lower extremities (PR=1.73, CI=1.53, 1.96)
(G. K. LeMasters et al., 1998)
Cross-sectional study of self-reported health among union carpenters in Ohio (N=522)
Determine prevalence and risk factors for work related MSDs
• Age and job duration were strongly correlated • Age was a statistically significant predictor of MSD’s shoulders,
hands and wrists when age was substituted for job duration in the multivariable model
• When job duration was added to the model, the association with age was attenuated and lost statistical significance
(Lowery et al., 1998)
Cross-sectional study of injury at a DIA construction site using workers compensation claims data (N=4,634)
Determine the risk factors for injury
• The rate of injury (20.5 per 100 workers) among older workers (>60 years) was higher than younger workers (15-19 years) rate of injury (6.6 per 100 workers)
• The rate of lost work time injury (3.8 per 100 workers) among older workers (>60 years) was higher than younger workers (15-19) rate of injury (0.9 per 100 workers)
(John M. Dement et al., 2009)
Prospective cohort study of building trade workers from nuclear weapons facilities followed from 1998-2004 (N=8,976)
Investigate the mortality among construction and trade workers who work at nuclear weapons facilities who may be exposed to serious hazards.
As a function of length of employment in construction trades, there was an increase in risk of mesothelioma and asbestosis • Workers who started work when <30 years of age had an
increased risk for mesothelioma (SMR=6.59) and asbestosis (SMR=53.35)
62

Table 4. Continued Reference Study design and
population Research objective Main findings
(Arndt et al., 2005)
Prospective cohort study of male construction workers given medical exams at baseline and the subsequent recipients of disability pension at a 10 year follow-up (N=14,474)
Study the disability risk of construction workers
• Workers 60-64 years old experienced occupational disability at a rate of 8551 per 100,000 person years whereas workers 25-39 years old experienced a rate of 134 per 100,000 person years
• Compared to other non-construction blue collar workers, workers 55-59 years old had a SIR of 2.42 (CI=1.79,3.21) for incidents that caused disability and a SIR of 1.61 (CI=1.47,1.75) for MSDs that caused disability
• Compared to other non-construction blue collar workers, workers who had worked for ≥30 years had a SIR of 2.54 (CI=1.93,3.3) for incidents that caused disability and an SIR of 1.72 (CI=1.59,1.87) for MSDs that caused disability
(Welch et al., 2010)
Prospective cohort of roofers in the United States (N=979)
Describe the characteristics of roofers who left the trade within one year of a baseline interview and the subset who left due to a health condition
Characteristics of roofers who left the trade due to health reasons: • Older (OR=1.18, CI=1.09, 1.27) • Had lower physical functioning (OR=0.91, CI=0.88, 0.94) • More diagnosed MSD conditions (OR=7.92, CI=0.98, 64.29) • More diagnosed medical conditions (OR=6.83, CI=0.80,
58.09) • More MSD and medical conditions combined (OR=4.63,
CI=0.55, 39.15) • More likely to have missed work in the 2 years prior to
baseline (OR=1.97, CI=0.95, 4.10) • Moderate economic impact was most common among
younger workers (OR=0.87, CI=0.80, 0.95), poor physical functioning (OR=0.93, CI=0.89, 0.97), any missed work (OR=2.8, CI=1.15, 6.81) and former roofers who left for health-related reasons (OR=19.04, CI=4.96, 73.06)
63

Table 4. Continued Reference Study design and
population Research objective Main findings
(X. Dong et al., 2011)
10-year follow-up study (1998-2008) of male workers (N=7,200) that utilized the Health and Retirement Study
To examine the health status of older construction workers in the US and how occupation and the aging process affect health in workers’ later years
• Construction trades vs. white-collar workers at follow-up had increases in: • Arthritis (OR=1.93, CI=1.39, 2.67) • Chronic lung disease (OR=1.93, CI=1.17, 3.20) • Stroke (OR=1.67, CI=1.14, 2.44) • Back problem (OR=1.54, CI=1.10, 2.14) • Fair/poor physical health (OR=1.74, CI=1.23, 2.46) • Fair/poor hearing (OR=1.74, CI=1.23, 2.46) • Functional limitations of reach/extended arms up (OR=2.18,
CI=1.40, 2.39) and lift/carry 10lbs (OR=1.67, CI=1.03, 2.72) • Health problem limits work (OR=2.05, CI=1.47, 2.87) • Injury at work (OR=3.12, CI=1.10, 8.87)
• Construction trades had an increased risk of stroke (OR=1.69, CI=1.13, 2.53) compared to other blue-collar workers at the time of follow-up
At follow-up, the rate of full-time work among construction workers was greater than the rate of all workers combined but many of the construction workers had switched to non-construction industries
(Jackson & Loomis, 2002)
Cross-sectional study of North Carolina Medical Examiner records of construction work related deaths (N=535)
To describe fatal occupational injuries within the construction industry and to identify risk factors
• Crude death rate was highest among workers aged 65-74 and lowest among workers aged 18-24, 31.8 and 18.3 per 100,000 person years, respectively
64

Table 4. Continued Reference Study design and
population Research objective Main findings
(Janicak, 2008) Cross-sectional study of construction electrocution fatalities using the BLS Census of Fatal Occupational Injuries (N=492)
Identify differences in the proportion of fatalities by type of electrocution and to identify differences in proportions of fatalities by age of the worker
• Among workers over the age of 65, 56% electrocution fatalities were due to contact with electrical wiring, transformers or other electrical components and 22% were due to contact with overhead power lines
• More than 50% of deaths among younger workers (ages 16-19, 20-24, 25-34) were due to contact with overhead power lines
• Significantly greater proportions of deaths from electrocutions were observed among younger workers aged 16-19 (PMR=144.72, M-H X2=4.74, p<.05), compared to older workers aged 64 years and older (PMR=75.69, M-H X2=45.75, p<.5)
(J. M. Dement et al., 2005)
Cross-sectional study of Department of Energy (DOE) construction workers (N=3,510)
Determine hearing loss among older construction workers who are exposed to high-noise levels
• 92.7% of workers over the age of 65 had hearing loss • Compared to the control group (<80 dBA exposures), DOE
workers with more than 33 years of trade work had a greater odds of material hearing impairment (OR=2.2, CI=1.5, 3.2)
Abbreviations: Bureau of Labor Statistics, BLS; confidence interval, CI; Denver International Airport, DIA; Department of Energy DOE; Emergency room, ER; Full time equivalents, FTE; Musculoskeletal disorder, MSD; National Electronic Injury Surveillance System, NEISS; Odds ratio, OR; Prevalence ratio, PR; Proportionate Mortality Ratios, PMR; Rate ratio, RR; Standardized incidence ratios, SIR; Standardized mortality ratios, SMR; Traumatic brain injury, TBI; United States, US. aAn estimated study size based on information provided in the publication.
65

3.2.1. Causes of injuries in the construction industry
Injuries due to falls are a major concern for the construction industry. Falls are the most
common cause of fatal injury and are ranked among the top three most common causes of non-
fatal injuries (e.g., Center for Construction Research and Training, 2008; J. M. Dement &
Lipscomb, 1999; Friedman & Forst, 2009). However, the data regarding frequency of fall-
related injuries among older workers are inconsistent.
Kemmlert and Lundholm (2001) reported that the proportions of slip, trip and fall
incidents were greater among male workers aged 45 years and older, compared to workers less
than 45 years of age. The study consisted of 1,620 reports of slip, trip and fall incidents from
the Swedish Occupational Injury Information System and included construction work as well as
electrical, agricultural, metal machine work, building metal work, and material handling work
(Kemmlert & Lundholm, 2001). Coantonio, McVittie, and Lewko (2009) analyzed workers’
compensation data from Ontario, Canada and found that 76% of the traumatic brain injury
claims of construction workers aged 55-64 were from falls, compared to 45% of claims from
workers aged 17-24. In contrast, Shishlov, et al. (2011) reported a two-fold decrease in the fall-
injury rate among workers 55 years and older [45/10,000 full-time equivalents (FTE)], compared
to workers less than 20 years of age (114/10,000 FTE). The study by Shishlov, et al. used data
from the National Electronic Injury Surveillance System collected by NIOSH to obtain US
hospital emergency department data for construction-related injuries (N=555,700). Possible
reasons for the inconsistent results between the Kemmlert (2001), Colantonio (2009) and
Shishlov (2011) studies may be due in part to differences in record keeping practices between
the two countries, occupations included in the study, or that the focus was on severe injuries
(e.g. those requiring an emergency department visit) in the US study, but not in the Swedish
study.
Injuries due to falls are categorized in terms of fall location (e.g. same or different level)
and contributing factor (e.g. ladder, scaffold, snow, grease). Falls from elevations have been
66

cited as the most frequent types of falls in the construction industry as a whole. However,
among older workers in the carpentry trade, falls from the same level have been found to be
most frequent (H. Lipscomb et al., 2003). In a study using self-reported data from injured
carpentry workers (N=4,429), the contributing factors to falls from the same level were found to
be tripping over debris, difficult work terrain (rocky, muddy, uneven), the slope of the lot, lack of
backfill around the foundation, and difficult access and/or egress from the building (H. J.
Lipscomb, Dement, Li, Nolan, & Patterson, 2003). Studies involving construction-related falls
treated in the emergency department indicated that older workers were more likely to be
hospitalized due to falls, indicating a greater severity of injury among older workers (Layne &
Pollack, 2004; Schoenfisch et al., 2010; Shishlov et al., 2011).
Motor vehicle incidents occur infrequently (Friedman & Forst, 2009; Glazner, Bondy,
Lezotte, Lipscomb, & Guarini, 2005), but result in some of the most severe injuries among
construction workers (Glazner et al., 2005; Schoenfisch et al., 2010) and are the second leading
cause of occupationally related deaths in the construction industry (Center for Construction
Research and Training, 2008). Using the National Traumatic Occupational Fatalities
Surveillance System (1980-1992), Ore and Fosbroke (1997) found that the motor vehicle
incident fatality rate for the construction industry was 2.4 per 100,000 workers across all ages
but increased to 6.9 for workers over the age of 65. Possible contributing factors in motor
vehicle incidents among older workers include age-related degradation in vision, reaction time,
cognitive function, muscle strength, and range of motion (NIOSH, 2005; Pratt, 2003). The little
knowledge we have on older construction worker’s motor vehicle incidents is based on national
sources of data. Such data cannot account for exposure (i.e. hours driving), thus caution should
be used when interpreting findings from national data. There is a major gap in our knowledge of
motor vehicle incidents among older construction workers and factors that affect their abilities to
drive should be considered in the development of injury prevention strategies for workers in the
construction industry.
67

3.2.2. Types of injuries in the construction industry
Musculoskeletal disorders (MSDs) are of particular concern for construction workers.
Older workers experience a significant burden of musculoskeletal disorder conditions and
continue to work with pain and limitations (Welch et al., 2008). de Zwart et al. (1999) utilized the
Dutch Periodic Occupational Health Survey (1983-1993) to determine the prevalence of age-
related health issues among older construction workers (45-64), compared to younger
construction workers (16-30). They found an increased prevalence ratio of complaints related to
the upper and lower extremities, back, and neck. Hoonakker and van Duivenbooden (2010)
utilized the same survey for the years 1989-2003 and found similar results. LeMasters et al.
(1998) found that the odds of having an MSD of the shoulders, hands/wrists, and knees among
union carpenters were greatest among workers with more than 20 years of employment in the
industry. Age did not remain a significant predictor in the final multivariate logistic regression
model when job duration was added to the model. MSDs among older workers may predispose
them to reoccurring injuries. Lipscomb, et al. (2008) found that carpenters who experienced a
back injury were at an increased risk for a second back injury within three years of the initial
injury. Musculoskeletal disorders may also put older workers at risk for retirement from the
construction trades earlier than anticipated. Welch, et al. (2010) found that the odds of leaving
the roofing trade early were eight times higher for workers with a musculoskeletal disorder than
workers without a musculoskeletal disorder.
A minimal amount of research has evaluated other types of injuries besides
musculoskeletal disorders among older construction workers. Fractures, contusions/abrasions
and sprains/strains are the most common injury among construction workers over 40 years of
age, while contusions/abrasions and sprains/strains are the most common among workers
under 29 years of age (Shishlov et al., 2011). Occupational illnesses such as pneumoconiosis
(Suarthana et al., 2007), mesothelioma, asbestosis (John M. Dement et al., 2009) and hearing
68

loss (J. M. Dement et al., 2005) are primarily seen among older construction workers, likely due
to the well-recognized latency between first exposure and disease onset.
3.2.3. Injury-related costs in the construction industry
Given the precarious and physically challenging work conditions in the construction
industry, coupled with the increasing average age of the workforce, it seems inevitable that the
cost of occupational injuries among construction workers will also increase. While construction
workers represent only six percent of the US workforce, they account for a disproportionate 15
percent of costs related to injuries and fatalities for all US industries (Waehrer et al., 2007).
Vulnerable populations, such as older workers, contribute to much of these costs. In general,
workers’ compensation claim costs increase with the age of workers (Friedman & Forst, 2009).
For example, Lipscomb, et al. (2003) found that costs associated with falls in construction were
three times higher for those over 45 years when compared with those under 30 years of age.
Data from Lowery et al. (1998) indicated that lost work time and related indemnity costs,
increased with age. Schoenfisch et al. (2010) determined that, although injury rates among
older construction workers were lower than younger workers, the injuries among the more
senior workers were more likely to cause more serious problems that required longer
hospitalization stays, indicating a decreased ability to recover from an injury. Physical disability
among older construction workers is a major concern because of its effect on overall
productivity. The ability to fully recover from an injury becomes increasingly difficult with
increasing age. Therefore, the proportion of disability is likely to be higher among older,
compared to younger workers in the construction industry (Arndt et al., 2005; Welch et al.,
2010). Relative to younger workers, older workers miss more days of work when injured
(Kucera, Lipscomb, Silverstein, & Cameron, 2009; Schoenfisch et al., 2010).
Previous research has found that older construction workers are more likely to die from
an occupational injury than younger construction workers. For example, CPWR utilized the
Bureau of Labor Statistics (BLS) Census of Fatal Occupational Injuries (CFOI) and found that
69

44% occupationally related fatalities in 2005 occurred among construction workers over the age
of 45 (Center for Construction Research and Training, 2008). Jackson et al. (2002) utilized the
North Carolina Medical Examiner’s database of occupational fatalities for the construction
industry and found that the crude death rate was highest among workers aged 65-74 and lowest
among workers aged 18-24, with rates of 31.8 and 18.3 per 100,000 person years, respectively.
There may be differences in cause of death among different aged construction workers.
Janicak (2008), for example, found that construction workers aged 16-19 (PMR=144.72, M-H
χ2=4.74, p<0.05) had a greater proportion of electrocution fatalities than expected and
construction workers aged 65+ (PMR=75.69, M-H χ2=45.75, p<0.05) had a lower than expected
proportion of electrocution fatalities.
70

Chapter 4
Discussion
4.1. Promotion of work ability
The promotion of work ability can enable older construction workers to remain employed
and injury free. The Finish work ability index (WAI) was developed in order to understand how
long workers are able to work and whether job demands and job content affects their ability to
continue work (Ilmarinen, 2009). Previous research has used the WAI to predict sickness
absence (Alavinia, de Boer, van Duivenbooden, Frings-Dresen, & Burdorf, 2009) and disability
among older workers (Burdorf, Frings-Dresen, van Duivenbooden, & Elders, 2005) in the
construction industry. A work ability promotion program was developed and modeled around
four different actions: 1) adjustments to the physical environment, 2) adjustments in the psycho-
social environment, 3) health and lifestyle promotion and 4) updating professional skills
(Ilmarien & Rantanen, 1999). Tuomi et al. (2001) utilized data from a 16 year follow-up study of
Finish municipal workers and found that the model of work ability was strongly associated with
the WAI. In addition, a high WAI score was associated with high quality work, high productivity,
the ability to function well and to stay in good health upon retirement (Tuomi et al., 2001).
The work ability promotion program has not been studied within the construction industry
specifically but the model could be a useful guide for future interventions. Welch (2009)
reviewed literature pertaining to the WAI and construction work and recommended rehabilitation
programs for injured workers, ergonomic programs to prevent musculoskeletal disorders, and
comprehensive health promotion programs. In regards to ergonomic programs developed to
reduce the risk of injury, contractors could integrate knowledge regarding workstation and task
adaptations appropriate for older workers into their commonly held pre-task planning meetings
on the construction site. Disseminating information that older workers may need to work at
lower elevations, need more breaks during heavy physical work, or need more time to complete
71

a task may enhance the safety at the job site. Employers may consider providing lighter
materials to handle or manual material handling equipment and eliminate long or heavy reaches
from ladders (Choi, 2009). Providing reasonable accommodations for all older workers may be
difficult to achieve in physically demanding industries like construction. Thus, older construction
workers may be placed in a difficult situation of having to weigh the costs and benefits of
continuing to work in such a physically demanding profession. This may result in a feeling of
“job lock” or the inability to leave a job due to financial or benefit needs, or working while ill (e.g.
presenteeism) (Benjamin et al., 2008) if retirement is not financially feasible. Improving
construction work ability for all ages and physical limitations will require a concerted effort from
workers, contractors, unions, owners, policy makers, regulators and the occupational health and
safety community to implement effective programs that can adapt to the unique challenges
facing the construction industry (Ilmarinen, 2009; Welch, 2009).
4.2. Recommendations for future research
Though older workers may experience physical limitations, their ability to add value to an
organization is a notable strength. A recent meta-analysis examined the relation between age
and several job performance measures. The worker’s age was not found to be related to core
task performance or level of creativity, but it was related to increased safety performance and
decreased counterproductive work behavior (Ng & Feldman, 2008). Employers who resist
adapting work to older workers are susceptible to losing valuable workers and paying more in
hiring and training costs (Yeatts, Folts, & Knapp, 1999). Given the dominant role that older
workers will play in the future, it is critical to understand how to shape work environments in
order to take advantage of their talents and to minimize the risk of injury they face on the job
(Ng & Feldman, 2008). For example, researchers have suggested using ergonomic principles
to fit the job to the worker (Choi, 2009), wellness programs to keep older workers physically fit
(Kowalski-Trakofler, Steiner, & Schwerha, 2005) and good housekeeping (Kemmlert &
Lundholm, 2001).
72

Despite the increased awareness and epidemiologic research related to construction
worker health and safety over the last twenty years, the construction industry remains one of the
most dangerous industries in the US (Choi, 2009). Injury trends among vulnerable workers,
such as the growing number of older workers, needs to be studied in greater depth to determine
specific interventions aimed at preventing age-related injuries and helping older workers remain
employed (Kisner & Fosbroke, 1994; Schoenfisch et al., 2010). The data available on injury
trends among older workers is limited in depth (Table 4). The available literature has focused
primarily on injuries due to falls and injuries that result in musculoskeletal disorders, but the
characteristics of other types of causes and types of injuries have not been reported in as much
detail for older construction workers (Table 5). It is important to note that publication bias may
contribute to the paucity of publications in this area. However, the larger issue is that there are
too few studies that have been conducted that focus on older workers in the construction
industry.
In addition to older workers, Hispanic construction workers are another vulnerable
population have been found to be at increased risk of injury (X. S. Dong, Men, & Ringen, 2010)
and death (X. Dong & Platner, 2004; X. S. Dong, Fujimoto, Ringen, & Men, 2009), compared to
non-Hispanic construction workers. Hispanic construction workers are generally younger than
non-Hispanic workers (Center for Construction Research and Training, 2008) but when older
Hispanic workers are injured on the job they are more likely to die from the injury. For example,
research using the BLS CFOI (1992-2000) has found that the fatality risk index among older
(65+) Hispanic construction workers was greater than older non-Hispanic workers, 5.5 versus
2.7, respectively (X. Dong & Platner, 2004). While the topic of injury among Hispanic
construction workers was beyond the scope of the present review, it is clearly a topic in need of
further research.
73

Table 5. Injury and age studies of construction workers by injury cause, type, body part affected, and cost
Cause of injury and Type of Injury Body part affected Associated cost of injuries
Falls, slips and trips (Colantonio et al., 2009; H. Lipscomb et al., 2003)
Back (de Zwart et al., 1999; Hoonakker & van Duivenbooden, 2010)
Hospitalization days increased (Schoenfisch et al., 2010; Shishlov et al., 2011)
MSD (Arndt et al., 2005; de Zwart et al., 1999; Hoonakker & van Duivenbooden, 2010; G. LeMasters et al., 2006; G. K. LeMasters et al., 1998; Shishlov et al., 2011)
Neck (Hoonakker & van Duivenbooden, 2010)
Retirement (Welch et al., 2010)
Fractures (Shishlov et al., 2011)
Upper extremities (Hoonakker & van Duivenbooden, 2010)
Lost work days (Lowery et al., 1998)
Pneumoconiosis (Suarthana et al., 2007)
Lower extremities (Hoonakker & van Duivenbooden, 2010; G. LeMasters et al., 2006)
Disability (Arndt et al., 2005)
Mesothelioma (John M. Dement et al., 2009)
Increased monetary costs (H. Lipscomb et al., 2003; Waehrer et al., 2007)
Asbestosis (John M. Dement et al., 2009)
Functional Limitations (X. Dong et al., 2011; G. LeMasters et al., 2006)
Contusion/abrasion (Shishlov et al., 2011)
Death (Center for Construction Research and Training, 2008; Jackson & Loomis, 2002)
Hearing loss (J. M. Dement et al., 2005)
Future research should utilize a combination of leading and lagging safety and health
performance metrics to determine the relations between safety, injury and age in the
construction industry. Safety and health performance metrics can be used to monitor the level
of safety or to motivate those in a position of power to take necessary actions to improve safety.
These metrics can also be used to determine how to take action (Hale, 2009). Leading
indicators of safety (i.e., actions, events and processes that precede the event from occurring)
should be tracked by using such metrics as use of personal protective equipment, reporting
unsafe conditions/actions, or participation in health and safety meetings. Lagging indicators
74

(i.e., reactive measures of safety) can also be utilized by tracking existing occupational injury
data (e.g., workers compensation claims, BLS’s Survey of Occupational Injuries and Illnesses,
or National Electronic Injury Surveillance System-Work). By tracking a combination of leading
and lagging indicators, the relation between age, safety, and injury can be determined and the
appropriate interventions can be developed.
Crawford, et al.’s (2010) review of the health and safety needs of older workers found
that there were no intervention studies that specifically evaluated strategies to reduce injuries in
older workers. The identification of specific injury trends and subsequent analytical research
efforts designed to identify risk and protective factors among older construction workers can
provide the necessary guidance needed to develop appropriate interventions aimed at
maintaining their employment. The American College of Occupational and Environmental
Medicine states that it is imperative that more attention and resources be devoted to protecting
the employability of older workers to mitigate the impending consequences of the health care
crisis brought on by chronic disease among the baby boomers (Special committee on health,
2009). A recommended priority for researchers is to make concerted efforts towards
disseminating their research results and translating these results into workable
recommendations that have the potential to reduce workplace injury among older workers in the
construction industry.
75

References Alavinia, S. M., de Boer, A., van Duivenbooden, J. C., Frings-Dresen, M. H. W., & Burdorf, A.
(2009). Determinants of work ability and its predictive value for disability. Occupational Medicine-Oxford, 59(1), 32-37. doi: 10.1093/occmed/kqn148
Arndt, V., Rothenbacher, D., Daniel, U., Zschenderlein, B., Schuberth, S., & Brenner, H. (2005). Construction work and risk of occupational disability: a ten year follow up of 14 474 male workers. Occup Environ Med, 62(8), 559-566. doi: 10.1136/oem.2004.018135
Benjamin, K., Pransky, G., & Savageau, J. (2008). Factors associated with retirement-related job lock in older workers with recent occupational injury. Disabil Rehabil, 30(26), 1976-1983. doi: Doi 10.1080/09638280701772963Pii 794505816
Burdorf, A., Frings-Dresen, M. H. W., van Duivenbooden, C., & Elders, L. A. M. (2005). Development of a decision model to identify workers at risk of long-term disability in the construction industry. Scand J Work Environ Health, 31(Suppl 2), 31-36.
Cahill, K. E., Giandrea, M. D., & Quinn, J. F. (2005). Are traditional retirements a thing of the past? New evidence on retirement pattersn and bridge jobs.: U.S. Department of Labor Burear of Labor Statistics.
Center for Construction Research and Training. (2008). The construction chart book: The U.S. construction industry and its workers (4 ed.). Silver Springs, M.D.
Choi, S. D. (2009). Safety and ergonomic considerations for an aging workforce in the US construction industry. Work, 33(3), 301-315.
Colantonio, A., McVittie, D., Lewko, J., & Yin, J. L. (2009). Traumatic brain injuries in the construction industry. Brain Inj, 23(11), 873-878. doi: 10.1080/02699050903036033
Crawford, J. O., Graveling, R. A., Cowie, H. A., & Dixon, K. (2010). The health safety and health promotion needs of older workers. Occup Med (Lond), 60(3), 184-192. doi: 10.1093/occmed/kqq028
de Zwart, B. C. H., Frings-Dresen, M. H. W., & van Duivenbooden, J. C. (1999). Senior workers in the Dutch construction industry: A search for age-related work and health issues. Exp Aging Res, 25(4), 385-391.
Dement, J. M., & Lipscomb, H. (1999). Workers' compensation experience of North Carolina residential construction workers, 1986-1994. Appl Occup Environ Hyg, 14(2), 97-106.
Dement, J. M., Ringen, K., Welch, L., Bingham, E., & Quinn, P. (2005). Surveillance of hearing loss among older construction and trade workers at Department of Energy nuclear sites. Am J Ind Med, 48(5), 348-358.
Dement, J. M., Ringen, K., Welch, L. S., Bingham, E., & Quinn, P. (2009). Mortality of older construction and craft workers employed at department of energy (DOE) nuclear sites. Am J Ind Med, 52(9), 671-682. doi: 10.1002/ajim.20729
Dong, X., & Platner, J. W. (2004). Occupational fatalities of hispanic construction workers from 1992-2000. Am J Ind Med, 45(1), 45-54.
Dong, X., Wang, X., Daw, C., & Ringen, K. (2011). Chronic diseases and functional limitations among older construction workers in the United States: A 10 year follow-up study. J Occup Environ Med, 53(4), 372-380.
76
Dong, X. S., Fujimoto, A., Ringen, K., & Men, Y. (2009). Fatal falls among Hispanic construction workers. Accid Anal Prev, 41(5), 1047-1052. doi: 10.1016/j.aap.2009.06.012
Dong, X. S., Men, Y., & Ringen, K. (2010). Work-related injuries among Hispanic construction workers—Evidence from the Medical Expenditure Panel Survey. Am J Ind Med, 53(6), 561-569. doi: 10.1002/ajim.20799
Ezzati, M., Friedman, A. B., Kulkarni, S. C., & Murray, C. J. L. (2008). The reversal of fortunes: Trends in county mortality and cross-country mortality disparities in the United States. PLoS Medicine, 5(4), 0557-0568.
Fitzgerald, M. D., Tanaka, H., Tran, Z. V., & Seals, D. R. (1997). Age-related declines in maximal aerobic capacity in regularly exercising vs. sedentary women: a meta-analysis. J Appl Physiol, 83(1), 160-165.
Forde, M. S., & Buchholz, B. (2004). Task content and physical ergonomic risk factors in construction ironwork. Int J Ind Ergon, 34(4), 319-333.
Forde, M. S., Punnett, L., & Wegman, D. H. (2005). Prevalence of musculoskeletal disorders in union ironworkers. J Occup Environ Hyg, 2(4), 203-212.
Friedman, L., & Forst, L. (2009). Workers' compensation costs among construction workers: a robust regression analysis. J Occup Environ Med, 51(11), 1306-1313. doi: 10.1097/JOM.0b013e3181ba46bb
Glazner, J., Bondy, J., Lezotte, D. C., Lipscomb, H., & Guarini, K. (2005). Factors contributing to construction injury at Denver International Airport. Am J Ind Med, 47(1), 27-36. doi: 10.1002/ajim.20108
Goldenhar, L., Hecker, S., Moir, S., & Rosecrance, J. C. (2003). The "Goldilocks model" of overtime in constructin: Not too much, not too little, but just right. J Safety Res, 34(2), 215-226.
Goodrum, M. (1999). Hispanic and non-Hispanic wage differentials: Implications for United States construction industry. Journal of Construction Engineering Management, 130(4), 552-559.
Hale, A. (2009). Why safety performance indicators. Saf Sci, 47(4), 479-480.
Haslam, R. A., Hide, S. A., Gibb, A. G., Gyi, D. E., Pavitt, T., Atkinson, S., & Duff, A. R. (2005). Contributing factors in construction accidents. Appl Ergon, 36(4), 401-415. doi: S0003-6870(05)00033-5 [pii]10.1016/j.apergo.2004.12.002
Hedge, J. W., Borman, W. C., & Lammlein, S. E. (2006). The aging workforce: Realities, myths, and implications for organizations. Washington, D. C.: American Psychological Association.
Hoonakker, P., & van Duivenbooden, C. (2010). Monitoring working conditions and health of older workers in Dutch construction industry. Am J Ind Med, 53(6), 641-653.
Houston, D. K., Nicklas, B. J., & Zizza, C. A. (2009). Weighty Concerns: The Growing Prevalence of Obesity among Older Adults. J Am Diet Assoc, 109(11), 1886-1895. doi: 10.1016/j.jada.2009.08.014
Howard, J., Stafford, P., Branche, C., T., B., & Froetschet, J. (2010). Twenty years of NIOSH construction research. J Safety Res, 41(3), 187-188.
Ilmarien, J., & Rantanen, J. (1999). Promotion of work ability during ageing. Am J Ind Med, Supplement 1(-), 21-23.
77

Ilmarinen, J. (2009). Work ability-A comprehenisve concept for occupational health research and prevention. Scan J Work Environ Health, 35(1), 1-5.
Jackson, S. A., & Loomis, D. (2002). Fatal occupational injuries in the North Carolina construction idustry, 1978-1994. Appl Occup Environ Hyg, 17(1), 27-33.
Janicak, C. A. (2008). Occupational fatalities due to eletrocutions in the construction industry. J Safety Res, 39(6), 617-621.
Kemmlert, K., & Lundholm, L. (2001). Slips, trips and falls in different work groups - with reference to age and from a preventive perspective. Appl Ergon, 32(2), 149-153.
Kisner, S. M., & Fosbroke, D. E. (1994). Injury hazards in the construction industry. J Occup Med, 36(2), 137-143.
Kowalski-Trakofler, K. M., Steiner, L. J., & Schwerha, D. J. (2005). Safety considerations for the aging workforce. Saf Sci, 43(10), 779-793. doi: 10.1016/j.ssci.2005.08.014
Kucera, K. L., Lipscomb, H. J., Silverstein, B., & Cameron, W. (2009). Predictors of Delayed Return to Work After Back Injury: A Case-Control Analysis of Union Carpenters in Washington State. Am J Ind Med, 52(11), 821-830. doi: 10.1002/ajim.20747
Layne, L. A., & Pollack, K. M. (2004). Nonfatal occupational injuries from slips, trips, and falls among older workers treated in hopital emergency departments, United States 1998. Am J Ind Med, 46(1), 32-41. doi: 10.1002/ajim.20038
LeMasters, G., Bhattacharya, A., Borton, E., & Mayfield, L. (2006). Functional impairment and quality of life in retired workers of the construction trades. Exp Aging Res, 32(2), 227-242. doi: Doi 10.1080/03610730600554065
LeMasters, G. K., Atterbury, M. R., Booth-Jones, A. D., Bhattacharya, A., Ollila-Glen, N. F., C., & al., e. (1998). Prevalence of work related musculoskeletal disorders in active union carpenters. J Occup Environ Med, 55(6), 421-427.
Lipscomb, H., Cameron, W., & Silverstein, B. (2008). Incident and recurrent back injuries among union carpenters. Occup Environ Med, 65(12), 827-834.
Lipscomb, H., Leiming, L., & Dement, J. M. (2003). Falls among union carpenters. Am J Ind Med, 44(2), 148-156.
Lipscomb, H. J., Dement, J. M., Li, L., Nolan, J., & Patterson, D. (2003). Work-related injuries in residential and drywall carpentry. Appl Occup Environ Hyg, 18(6), 479-488.
Lowery, J. T., Borgerding, J. A., Zhen, B., Glazner, J. E., Bondy, J., & Kreiss, K. (1998). Risk factors for injury among construction workers at Denver International Airport. Am J Ind Med, 34(2), 113-120. doi: 10.1002/(SICI)1097-0274(199808)34:2<113::AID-AJIM3>3.0.CO;2-Y [pii]
Maertens, J. A., Putter, S. E., Chen, P. Y., Diehl, M., & Huang, E. (In press). Physical capabilities and occupational health of older workers. In J. W. B. Hedge, W. C. (Ed.), Oxford handbook of work and aging. New York: Oxford University Press.
Merlino, L. A., Rosecrance, J. C., Anton, D., & Cook, T. M. (2003). Symptoms of musculoskeletal disorders among apprentice construction workers. Appl Occup Environ Hyg, 18(1), 57-64.
Ng, T. W. H., & Feldman, D. C. (2008). The relationship of age to ten dimensions of job performance. J Appl Psychol, 93(2), 392-423.
78

Nguyen, L. D., Kneppers, J., Garcia de Soto, B., & Ibbs, W. (2010). Analysis of Adverse Weather for Excusable Delays. Journal of Construction Engineering & Management, 136(12), 1258-1267. doi: 10.1061/(asce)co.1943-7862.0000242
NIOSH. (2005). Safety concerns of older drivers demand more attention from employers and workers. (2005-159). Retrieved from http://www.cdc.gov/niosh/docs/2005-159/.
Ore, T., & Fosbroke, D. E. (1997). Motor vehicle fatalities in the United States construction industry. Accid Anal Prev, 29(5), 613-626. doi: 10.1016/s0001-4575(97)00013-4
Pratt, S. G. (2003). Work-related roadway crashes: Challenges and opportunities for prevention NIOSH hazard review: NIOSH.
Ringen, K., & Stafford, E. J. (1996). Intervention research in occupational safety and health: Examples from construction. Am J Ind Med, 29(4), 314-320.
Rosecrance, J. C. (Ed.). (2004). Work design: Ergonomics in the construction industry (2nd ed.): John Wiley Sons, Inc.
Rosecrance, J. C., Cook, T. M., & Zimmerman, C. L. (1996). Work-related musculoskeletal symptoms among construction workers in the pipe trades. Work, 7(1), 13-20.
Sattelmair, J. R., Pertman, J. H., & Forman, D. E. (2009). Effects of Physical Activity on Cardiovascular and Noncardiovascular Outcomes in Older Adults. Clin Geriatr Med, 25(4), 677-702. doi: DOI 10.1016/j.cger.2009.07.004
Schoenfisch, A. L., Lipscomb, H. J., Shishlov, K., & Myers, D. J. (2010). Nonfatal Construction Industry-Related Injuries Treated in Hospital Emergency Departments in the United States, 1998-2005. Am J Ind Med, 53(6), 570-580. doi: Doi 10.1002/Ajim.20829
Shishlov, K. S., Schoenfisch, A. L., Myers, D. J., & Lipscomb, H. J. (2011). Non-fatal construction industry fall-related injuries treated in US emergency departments, 1998–2005. Am J Ind Med, 54(2), 128-135. doi: 10.1002/ajim.20880
Shuford, H., & Restrepo, T. (2005). Thinking about an aging workforce- Potential impact on workers compensation NCCI Research Brief (Vol. 1): NCCI Holdings Inc.
Silverstein, M. (2008). Meeting the challenges of an aging workforce. Am J Ind Med, 51(4), 269-280.
Special committee on health, p., and disability management,. (2009). Healthy workforce/healthy economy: The role of health, productivity, and disability management in addressing the nation's health care crisis. J Occup Environ Med, 51(1), 114-119.
Spector, T. D., Hart, D. J., Nandra, D., Doyle, D. V., Mackillop, N., Gallimore, J. R., & Pepys, M. B. (1997). Low-level increases in serum C-reactive protein are present in early osteoarthritis of the knee and predict progressive disease. Arthritis Rheum, 40(4), 723-727. doi: 10.1002/1529-0131(199704)40:4<723::AID-ART18>3.0.CO;2-L
Strandberg, T. E., & Tilvis, R. S. (2000). C-reactive protein, cardiovascular risk factors, and mortality in prospective study in the elderly. Arterioscler Thromb Vasc Biol, 20(4), 1057-1060.
Suarthana, E., Moons, K. G. M., Heederik, D., & Meijer, E. (2007). A simple diagnostic model for ruling out pneumoconiosis among construction workers. Occup Environ Med, 64(9), 595-601.
Thomas, D. R. (2010). Sarcopenia. Clin Geriatr Med, 26(2), 331-346. doi: DOI 10.1016/j.cger.2010.02.012
79

Toossi, M. (2009). Labor force projections to 2018: Older workers staying more active.
Tuomi, L., Huuhtanen, P., Nykyri, E., & Ilmarien, J. (2001). Promotion of work ability, the quality of work and retirement. Occup. Med., 51(5), 318-324.
U.S. Bureau of Labor Statistics. (2000-2010). Current Population Survey.
U.S. Bureau of Labor Statistics. (2010). Career guide to industries, 2010-2011 edition: Construction. Retrieved April 2011, from http://bls.gov/oco/cg/cgs003.htm
Waehrer, G., Dong, X., Miller, T., Haile, E., & Men, Y. (2007). Costs of occupational injuries in construction in the United States. Accid Anal Prev, 39(6), 1258-1266.
Welch, L. (2009). Improving work ability in construction workers - lets get to work. Scan J Work Environ Health, 35(5), 321-324.
Welch, L., Haile, E., Boden, L., & Hunting, K. (2008). Age, work limitatins and physical functioning among construction roofers. Work, 31(4), 377-385.
Welch, L., Haile, E., Boden, L. I., & Hunting, K. L. (2010). Impact of musculoskeletal and medical conditions on disability retirement- A longitudinal study among construction workers. Am J Ind Med, 53(6), 552-560.
Weller, C. E. (2005). Raising the retirement age for social security: Implications for low wage, minority, and female workers: Center for American Progress.
Wiatrowski, W. J. (2001). Changing retirement age: Ups and downs. Monthly Labor Review, 124(4), 3-12.
The world bank: World development indicators. Retrieved February 28, 2011, from http://data.worldbank.org/country/united-states
Yeatts, D. E., Folts, W. E., & Knapp, J. (1999). Older worker's adaptation to a changing workplace: Employment issues for the 21st century. Educ Gerontol, 25(4), 331-347.
80

PART III
Age in relation to workers’ compensation costs in the construction industry
81

Chapter 1
Introduction
The proportion of workers 55 years of age and older will grow to nearly a quarter of the
United States (US) labor force by 2018, a 43% increase from 2008 (Toossi, 2009). As aging
workers remain on the job longer, understanding the health and safety needs of an aging
workforce will be critical. This will be especially true for physically demanding jobs, such as
those in the construction trades, where older workers may be at higher risk of injury and illness.
The injuries and illnesses sustained by workers in the construction industry often result in a
significant financial burden for the worker, industry and society as a whole (X. W. Dong, Ringen,
Men, & Fujimoto, 2007; G. Waehrer, Dong, Miller, Haile, & Men, 2007).
Construction workers have higher rates of injuries than workers in other industries (U.S.
Bureau of Labor Statistics, 2009) and the average total cost of their injuries is significantly
greater. In the US, the estimated average total cost of construction-related injury was $27,000,
with a greater proportion of the total costs related to indirect costs (e.g., wage loss) rather than
direct costs (e.g., medical costs), compared to $15,000 across all industries in 2002 (G.
Waehrer et al., 2007). Waehrer et al. (2007) estimated that $13 billion is spent annually in the
US on workers’ compensation (WC) costs in the construction industry, making it one of the most
expensive industries to insure. According to the National Compensation Survey in 2011, the
construction industry spent on average, $1.32 per hour worked on WC. This is triple the cost
spent across all industries ($0.44 per hour worked) (U.S. Bureau of Labor Statistics, 2011).
Given the high cost of work-related injuries and illnesses in the construction industry, it is
important to understand what factors contribute to these costs. Older construction workers (>55
years of age) are responsible for a disproportionate risk of work-related health issues (X. Dong,
Wang, Daw, & Ringen, 2011; NORA Construction Sector Council, 2008; Schwatka, Butler, &
Rosecrance, 2012), but their contribution to the total cost of injuries and illnesses has yet to be
82

quantified. Previous research has either limited their discussion to specific construction trades,
types of injuries or WC claims (e.g., Friedman & Forst, 2009; H. Lipscomb, Leiming, & Dement,
2003; H. J. Lipscomb, Dement, Silverstein, Cameron, & Glazner, 2009). As construction
workers age, they will likely experience physical limitations and co-morbidities (X. Dong et al.,
2011; Welch, Haile, Boden, & Hunting, 2008). These vulnerabilities will adversely affect their
ability to perform physically demanding work in the construction industry, leaving them more
susceptible to injuries such as musculoskeletal disorders (MSDs), fractures and contusions
(Maertens, Putter, Chen, Diehl, & Huang, 2012; Schwatka et al., 2012). Despite these findings,
older worker age does not appear to be associated with higher injury rates (Restrepo & Shuford,
2011; Rogers & Wiatrowski, 2005; Schoenfisch, Lipscomb, Shishlov, & Myers, 2010).
Older construction workers, however, may be more likely to experience severe-type
injuries compared with younger construction workers. This trend may result in higher indemnity,
rather than medical costs, as older construction worker’s injuries may require more days away
from work and may result in disabilities and physical limitations (Choi, 2009; Schwatka et al.,
2012). Although injuries among older construction workers may result in greater indemnity
costs, it is not clear whether they may not reflect a greater total cost per claim as compared to
their younger coworkers. In the present study, we performed a comprehensive investigation of
the association between worker age, injury type and WC costs (overall and by cost type) among
claimants employed in the construction industry. Over 100,000 construction WC claims filed in
the state of Colorado between 1998 and 2008 were analyzed in order to test the hypothesis that
the positive association between age and WC cost would differ by cost type (e.g., total, medical
and indemnity costs), and that the relationship between injury type and cost would vary by age.
83

Chapter 2
Methods
2.1. Workers’ Compensation Database
A database of closed WC claims filed between June 30, 1998 and June 30, 2008 by
construction workers in Colorado was created using data from the one of state’s largest WC
insurers, Pinnacol Assurance. A description of the Colorado WC system can be found in
previously published articles (Douphrate, Rosecrance, Reynolds, Stallones, & Gilkey, 2009aa;
Douphrate, Rosecrance, & Wahl, 2006). The claims represented approximately 80% of all
construction company policyholders in the state of Colorado, as referenced by National Council
on Compensation Insurance codes [Actuarial from Pinnacol Assurance, oral communication,
2010]. Using the US Census’s Statistics of US Businesses, we estimated the Pinnacol dataset
represents about 14,000 construction establishments and about 124,000 construction workers
per year in Colorado (Statistics of U.S. Businesses, 1998-2008).
This study includes WC claims that are “closed” rather than claims that are still “open”
and actively incurring costs related to the injury. In order to capture the claims at a time in
which the majority of costs have been incurred, a 24-month period following the initial date of
claim filing was chosen. This timeframe was chosen because >99% of claim costs occur during
this time span [Actuary from Pinnacol Assurance, oral communication, 2010]. For example, for
a claim that was submitted on June 30, 1998, all costs incurred through June 30, 2000 would be
included for that claim. Thus, the dataset includes claim costs incurred from June 30, 2000 to
June 30, 2010 (see Supplement Figure I). The Institutional Review Board (IRB) at Colorado
State University declared in a letter that the project was exempt from IRB since individuals
within the dataset were not identifiable. Thus, informed consent was not necessary.
84

2.2. Statistical Analyses
The following variables were used in these analyses: claimant age at time of first report
of injury (year), injury type (strain, contusion, laceration and other), total cost ($), medical cost
($) indemnity cost ($), and claim type (medical-only cost claims or medical plus indemnity cost
claims). The total cost of a claim included all costs associated with the claim (medical, indemnity
and other expenses). Medical expenses included all healthcare related services and products
(e.g., physician visits, treatment, rehabilitation, diagnostic testing, adaptive equipment and
prescription medications). Indemnity expenses included wage-replacement, disability,
impairment and death benefits. Other expenses included ancillary costs such as legal fees. All
cost variables were adjusted for inflation to 2010 US dollars by using the Consumer Price Index
(CPI-U) (Chairman of the Council of Economic Advisors: United States Government Printing
Office, 2012). Although medical costs generally increase at a greater rate than the overall
inflation rate, adjusting the medical costs by the specific medical CPI did not result in meaningful
changes in the results. The only change observed was an increase in mean medical cost by an
approximate $400 increase for all age groups. Thus, all results are presented with adjustment
using CPI-U.
Descriptive statistics were generated for all variables in the study. Age of the claimant
was evaluated as a continuous (≥18 years) and categorical variable (18-24, 25-34, 35-44, 45-
54, 55-64, ≥65years). More than 60% of all the claims were due to the three most frequent types
of injuries (strains, contusions and lacerations). Thus, type of injury was collapsed into four
categories, ‘other’ being the forth category. The number of claims, type of injury frequency and
mean cost of a claim (total, medical and indemnity) were determined for each age group. For all
inferential statistical analyses, the cost variables were log-transformed in order to correct for
non-normality. Analyses of variance (ANOVA) were used to evaluate whether there were
statistically significant differences in the mean cost of claim (total, medical and indemnity)
across age groups. Bonferroni adjusted multiple pairwise comparisons were conducted to
85

determine which age groups had significant mean differences. Pearson correlation coefficients
were obtained in order to determine if there was a significant linear trend between age (years)
and cost (total, medical and indemnity).
Linear regression analyses were used to evaluate the effect of the explanatory variable
(i.e. claimant years of age) on the outcome variables (i.e. total cost, medical cost and indemnity
cost) overall, and stratified by injury type. Each cost variable was assessed in separate simple
linear regression models with age of claimant as the predictor. Multiple linear regression
analyses were used to evaluate the potential modification of the age of claimant on the
indemnity cost of different types of injuries. The final multiple regression model was run without
the intercept in the final model in order to determine specific slope estimates for each type of
injury by claimant age group. Statistical computing was conducted using SAS PC software
version 9.2 [SAS Institute Inc., Cary, NC, USA]. All P-values were two-sided and considered
statistically significant if less than 0.05.
86

Chapter 3
Results
In our dataset of 107,065 WC claims among construction workers in Colorado, the mean
claimant age was 34 years (SD = 11) and the median was 33 years (IQR = 26-43). The majority
of injured workers who filed a claim were male (97%). Workers under the age of 45 filed
approximately 80% of the WC claims. After adjusting all costs to 2010 dollars, the total cost of
the 107,064 claims was $931,234,994. The total medical cost and total indemnity cost were
$408,613,710 and $461,084,685, respectively.
Of all claims filed, 23% (n = 24,846) were WC claims with medical plus indemnity costs
and 77% (n = 82,219) were WC claims with medical only costs. Claimants over the age of 65
filed more medical plus indemnity-type claims (34%) than claimants between the age of 18 and
24 years of age (18%) (χ2 = 91.68, p < .0001). When the costs ($) of the claim types were
compared, claimants over the age of 65 had a higher percentage of indemnity costs (e.g., 63%
of the total costs were due to indemnity costs), compared to claimants aged 18-24 years (e.g.,
51% of the total costs were due to indemnity costs) (Table 6).
87

Table 6. Inflation adjusted mean and median workers' compensation costs by claimant age and cost type
Age group Total 18-24
n=21,733 25-34
n=36,018 35-44
n=27,092 45-54
n=16,360 55-64
n=5,259 65+
n=603 Type of cost Total ($) Mean 8,432 4,899 7,439 10,320 12,176 13,194 14,253
(std) a (37,637) (31,935) (34,063) (39,287) (48,943) (44,404) (37,170) Median 563 474 544 642 706 775 861
IQR b 280-2,022 254-1,143 285-1,671 296-3,059 305-4,707 308-5,464 295-7,056 Medical ($) Mean 3,709 2,424 3,284 4,207 5,551 5,632 5,275
(std) a (20,672) (14,026) (16,665) (17,387) (35,944) (25,971) (14,291) Median 521 450 507 582 631 674 718
IQR b 261-1,450 240-963 267-1,275 274-1,897 278-2,630 279-2,837 268-3,054 Indemnity ($) Mean 4,306 2,168 3,661 5,402 5,819 6,762 8,142
(std) a (21,676) (20,295) (20,710) (24,075) (19,851) (24,386) (25,809) Median 0 0 0 0 0 0 0
IQR b 0-0 0-0 0-0 0-157 0-690 0-1,004 0-2,380 a Standard deviation b Inter-quartile range Note. Costs ($) adjusted for inflation to 2010 dollars. N=number of claims.
88

The majority of claims were related to strains (27%), contusions (21%) and lacerations
(17%). Other injuries included: foreign body (7.5%), sprain (6.6%), puncture (6.3%), fracture
(3.6%), crushing (1.5%) burn (1.47%), and all other injuries (8.6%). The other category included
injuries that represented <1% of the claims and “all other” injuries, as defined by the insurer who
provided the database of claims. Strains were the most common type of injury among all age
groups except for the oldest age group, ≥65, where strains and contusions occurred at similar
frequencies, 26% and 27% of all claims, respectively. Lacerations occurred more frequently
among younger age groups (18-24 years) compared with older age groups (≥65 years),
accounting for 21% and 12% of all injuries, respectively. There were no meaningful differences
between age groups for the other types of injuries (data not shown). The mean cost of a claim
related to each type of injury (strains, contusions, lacerations, other) generally increased with
increasing age group Table 7 with the greatest proportion of total costs attributed to indemnity
expenses. For example, the proportion of the total WC costs attributable to the indemnity costs
for a strain type of injury were 59% for claimants ≥65, compared to 52% for claimants 18-24
years. The proportion of the total WC costs attributable to the medical cost of a strain type of
injury was and 35% for claimants ≥65 years and 39% for those 18-24 years, respectively (data
not shown).
89

Table 7. Inflation-adjusted mean and median workers' compensation costs by claimant age, cost type and type of injury Age group
Type of injury Total 18-24 n=21,733
25-34 n=36,018
35-44 n=27,092
45-54 n=16,360
55-64 n=5,259
65+ n=603
Strain Total (n)
Percent (%) of claims 28,855 (26%)
4,437 (20%)
9,501 (26%)
8,115 (30%)
5,052 (31%)
1,594 (30%)
156 (26%)
Total cost ($) Mean 10,917 5,385 9,464 13,428 14,392 15,373 11,834 (std) a (30,795) (17,180) (20,020) (33,194) (41,146) (38,150) (24,742)
Median 384 577 750 965 1,147 1,149 976 IQR b 289-430 281-1,732 326-2083 328-6,329 344-9123 339-9,599 381-11,439
Medical cost ($) Mean 4,083 2,103 3,365 4,714 5,629 5,750 4,143 (std) a (14,846) (6,518) (9,755) (15,529) (26,819) (13,977) (6,662)
Median 694 504 642 795 913 929 879 IQR b 287-2,360 256-1,256 291-1,834 294-3,064 304-4,096 289-4,531 349-4,612
Indemnity cost ($) Mean 6,253 2,840 2,840 5,379 7,734 8,671 7,008 (std) a (19,089) (5,417) (11,289) (16,834) (22,170) (25,517) (18,982)
Median 0 0 0 0 0 0 0 IQR b 0-909 0-0 0-0 0-420 0-1,687 0-2,872 0-3,888
Contusion Total (n)
Percent (%) of claims 22,406 (21%)
4,608 (21%)
7,231 (20%)
5,646 (21%)
3,542 (22%)
1,215 (23%)
164 (27%)
Total cost ($) Mean 8,463 4,803 7,638 10,578 11,608 11,979 17,208 (std) a (41,753) (36,871) (39,012) (52,774) (38,649) (38,075) (41,308)
Median 549 456 539 612 640 712 893 IQR b 269-1,882 246-1,081 278-1,704 282-2,630 300-3,645 276-3,566 324-6,411
Medical cost ($) Mean 3,829 2,371 3,482 4,251 5,295 4,858 6,133 (std) a (19,617) (17,725) (21,406) (18,372) (21,217) (15,930) (15,219)
Median 515 434 501 559 593 644 729 IQR b 255-1,453 230-940 259-1,307 259-1,737 281-2,391 266-2,461 292-3,181
Indemnity cost ($) Mean 4,294 2,116 3,645 5,536 5,496 6,350 10,201 (std) a (25,641) (22,150) (21,125) (32,118) (19,469) (24,627) (30,770)
Median 0 0 0 0 0 0 0 IQR b 0-0 0-0 0-0 0-0 0-220 0-255 0-2,691
a Standard deviation bInter-quartile range c The “other” injury types include: burn, crushing, foreign body, fracture, puncture, sprain, and all other. Note. Costs ($) adjusted for inflation to 2010 dollars. N=number of claims.
90

Table 7. Continued Age group
Type of injury Total 18-24 n=21,733
25-34 n=36,018
35-44 n=27,092
45-54 n=16,360
55-64 n=5,259
65+ n=603
Laceration Total (n)
Percent (%) of claims 17,451 (17%)
4,455 (21%)
6,331 (18%)
3,987 (14%)
1,977 (12%)
628 (12%)
70 (12%)
Total cost ($) Mean 2,670 2,160 2,588 3,281 3,323 3,731 1,281 (std) a (13,757) (9,177) (15,025) (15,127) (17,100) (15,645) (3,047)
Median 473 453 467 488 515 507 516 IQR b 289-844 273-806 295-825 294-923 310-944 309-936 289-1,011
Medical cost ($) Mean 1,622 1,404 1,504 1,802 2,030 2,011 856 (std) a (6,188) (4,565) (5,621) (7,176) (8,572) (6,158) (1,384)
Median 465 446 458 480 508 501 514 IQR b 283-813 262-765 289-786 285-874 302-866 304-898 289-988
Indemnity cost ($) Mean 998 664 961 1,289 1,164 1,450 401 (std) a (8,250) (4,826) (9,999) (8,035) (8,644) (8,420) (1,760)
Median 0 0 0 0 0 0 0 IQR b 0-0 0-0 0-0 0-0 0-0 0-0 0-0
Other c Total (n)
Percent (%) of claims 38,350 (36%)
8,232 (38%)
12,951 (36%)
9,343 (35%)
5,789 (35%)
1,822 (35%)
213 (35%)
Total cost ($) Mean 9,227 6,175 8,215 10,470 13,614 15,359 18,013 (std) a (40,033) (41,489) (41,894) (41,337) (65,161) (57,693) (45,606)
Median 532 461 509 613 659 802 988 IQR b 262-2,101 239-1,182 259-1,656 284-3,364 283-5,533 301-7,520 235-11,349
Medical cost ($) Mean 4,607 2,765 3,984 4,766 6,41 7,292 6,897 (std) a (28,723) (17,556) (20,718) (22,613) (52,130) (39,833) (19,514)
Median 503 441 479 552 590 687 795 IQR b 245-1,521 225-986 246-1,267 262-1,943 256-2,904 2753,234 126-4,334
Indemnity cost ($) Mean 4,351 2,649 3,732 5,052 5,942 7,198 9,930 (std) a (24,790) (27,014) (26,099) (21,659) (22,063) (56,562) (29,527)
Median 0 0 0 0 0 0 0 IQR b 0-0 0-0 0-0 0-176 0-912 0-1,863 0-4,355
a Standard deviation b Inter-quartile range c The “other” injury types include: burn, crushing, foreign body, fracture, puncture, sprain, and all other. Note. Costs ($) adjusted for inflation to 2010 dollars. N=number of claims.
91

Claimant age (years) and WC costs had a small, but statistically significant correlation with total
costs (r = .07, P < .0001), medical costs (r = .05, P < .0001), and indemnity costs (r = .10, P <
.0001). Mean costs (total, medical and indemnity) of a claim increased with increasing age
group, with one exception (Table 6). Mean medical cost per claim increased up to the 55 to 64
year age group then slightly decreased for the ≥65 year age group. The differences in mean
cost by age group were statistically significant: total cost (F5,107059 =123.99, P < .0001), medical
costs (F5,107059 = 56.43, P < .0001) and indemnity costs (F5,107059 = 236.86, P < .0001).
A priori multiple pairwise comparisons using a Bonferroni-adjusted alpha level of .003
per test (.05/15) was used to evaluate mean costs between claimant age groups (Table 8).
There were statistically non-significant differences in mean total cost between claimants 35-44
years of age and those ≥45 years of age [e.g., 45-54 (p = 0.02), 55-64 (p = 0.02), ≥65 years
(p=0.33)]. In other words, total costs increased with increasing age category until ≥35 years of
age when total costs plateaued. A similar pattern was observed for medical costs. In terms of
indemnity costs, there were statistically non-significant differences in mean indemnity costs
between claimants 45-54 years of age and those ≥55 years of age [e.g., 55-64 (p = 1.00) and
65+ (p = .014)]. In other words, indemnity costs increased with increasing age category until
≥45 years of age when indemnity costs plateaued.
92

Table 8. ANOVA multiple comparisons p-values for differences in mean costs by claimant age and cost type Age group 18-24 25-34 35-44 45-54 55-64 65+ 18-24
Total <.0001 <.0001 <.0001 <.0001 <.0001 Medical <.0001 <.0001 <.0001 <.0001 .0038
Indemnity <.0001 <.0001 <.0001 <.0001 <.0001 25-34
Total <.0001 <.0001 <.0001 <.0001 Medical <.0001 <.0001 <.0001 .6643
Indemnity <.0001 <.0001 <.0001 <.0001 35-44
Total .0218 .0159 .3318 Medical .4869 .4262 1.000
Indemnity <.0001 <.0001 <.0001 45-54
Total 1.000 1.000 Medical 1.000 1.000
Indemnity 1.000 .0140 55-64
Total 1.000 Medical 1.000
Indemnity .1038 65+
Total Medical
Indemnity Note. A bonferroni adjustment method was used (.05/15=.003). Mean total cost and medical cost by age group are significantly different up until the age group 35-44. However, mean indemnity costs are significantly different up until the age group 45-54.
93

Simple linear regression analyses were used to further evaluate the relationship
between claimant age, type of injury and WC costs. The first step in assessing this relationship
was to evaluate age of claimant and cost in univariate models (see Table 9). When age of
claimant was included in the model as a continuous variable, the strongest association was
observed between claimant age and indemnity costs. There was a 3.51% increase in the
indemnity cost of a claim for each one-year increase in the age of a claimant. In contrast, there
was a smaller 1.11% increase in the medical cost of a claim for each one-year increase in the
age of a claimant. We also included age in the model as a categorical variable, because the
ANOVA results indicated that age might not be a linear function of cost. Compared to claimant’s
aged 18-24, all other age groups exhibited a greater increase in cost, especially for indemnity
costs. For example, a claimant ≥65 years had a 46% higher medical cost than a claimant aged
18-24 but a 372% higher indemnity cost. In summary, we observed the similar relationships
between age and cost by type, regardless of whether age was included as a continuous or
categorical variable in the linear models.
94

Table 9. Individual linear regression models for age (years & categorical) of claimant and cost of a claim by cost type
Outcome β a 95% CI a
Percent (%) Increase d
% of variance explained by age
Total cost b, c Age continuous 1.017 1.016, 1.019 1.7 0.58
Age Groups 18-24 Reference 25-34 1.267 1.21, 1.32 26.7 0.04 35-44 1.582 1.51, 1.66 58.2 0.07 45-54 1.719 1.63, 1.81 71.9 0.24 55-64 1.801 1.66, 1.95 80.1 0.20
65+ 2.026 1.63, 2.50 102.6 0.04 Medical cost b, c
Age continuous 1.011 1.010, 1.013 1.1 0.27 Age Groups
18-24 Reference 25-34 1.187 1.14, 1.24 18.7 0.01 35-44 1.353 1.30, 1.41 35.3 0.04 45-54 1.428 1.36, 1.50 42.8 0.12 55-64 1.470 1.36, 1.60 47.0 0.09
65+ 1.460 1.19, 1.79 46.0 0.01 Indemnity cost b, c
Age continuous 1.036 1.033, 1.037 3.6 1.12 Age Groups
18-24 Reference 25-34 1.419 1.33, 1.51 41.9 0.14 35-44 2.240 2.10, 2.39 124.0 0.08 45-54 2.843 2.63, 3.06 184.4 0.44 55-64 3.074 2.75, 3.43 207.4 0.34
65+ 4.716 3.50, 6.36 372.0 0.10 Costs ($) adjusted for inflation to 2010 dollars and log-transformed. CI = confidence interval. aEstimates and corresponding 95% CI’s have been back transformed (i.e., exp(beta)). bModels with age as a continuous variable and a categorical variable were run separately. cOutcome variables were log transformed. dPercent (%) increase in the cost of a claim for each year increase in age or compared to the age group 18^24, depending on how age was imputed in the model. Percent (%) increase = {[exp(beta)] - 1} 100.
95

To further explore the relationship between age and indemnity costs, we conducted
linear regression analyses with type of injury as one of the predictors (see Table 10). In the
univariate model, a strain type of injury was more costly than the other three types of injuries.
For example, a contusion type of injury was 46% less costly than a strain type of injury.
In multiple linear regression analyses by claimant age, we observed stronger
associations for strains, contusions and other types of injuries with indemnity cost as age
increased (all P for trends <0.05), with the strongest associations observed among claimants
≥65 years. We did not observe evidence for modification by age on the association between
laceration type of injury and indemnity cost. The final interaction model for injury type by age
group explained 3.1% of the variance in indemnity cost (Table 10).
96

Table 10. Linear regression models for type of injury and indemnity cost of a claim by age of claimant
Injury type β (95% CI) a
Age adjusted β (95% CI)a
Interaction model β (95% CI) a, b
Age groups 18-24 25-34 35-44 45-54 55-64 65+ Strain 1.00
- 1.00 -
1.00 -
1.70 (1.48, 1.92)
2.67 (2.33, 3.04)
3.32 (2.86, 3.84)
3.42 (2.77, 4.21)
3.61 (2.02, 6.50)
Contusion 0.46 (0.43, 0.49)
0.48 (0.45, 0.51)
1.00 -
1.507 (1.32, 1.73)
2.34 (2.30, 3.70)
2.78 (2.37, 3.26)
2.86 (2.27-3.61)
6.53 (3.70, 11.53)
Laceration 0.19 (0.17, 0.20)
0.20 (0.190, 0.22)
1.00 -
0.943 (0.82, 1.09)
1.12 (0.96, 1.31)
1.12 (0.92, 1.36)
1.03 (0.76, 1.40)
0.826 (0.35, 1.96)
Other c 0.53 (0.50, 0.56)
0.56 (0.53, 0.59)
1.00 -
1.31 (1.18, 1.38)
2.04 (1.84, 2.78)
2.692 (2.38, 3.04)
3.35 (2.78, 4.04)
6.69 (4.07, 11.00)
r2 .021 .029 .031 a Estimates and corresponding 95% CI’s have been back transformed (i.e., exp(beta))
b The interaction model betas represent a no intercept model where each estimate is considered the change in cost of a claim for type of injury by age group. For example, claimants ≥65 years have a 261% higher indemnity cost of a claim than claimants aged 18-24 for a strain type of injury. Percent (%) increase = {[exp(beta)]-1}*100. c The “other” injury types include: burn, crushing, foreign body, fracture, puncture, sprain, and all other. Note. Costs ($) adjusted for inflation to 2010 dollars and log-transformed. CI = Confidence Interval.
97

Chapter 4
Discussion
Using a large WC database that was representative of approximately 80% of Colorado
construction industry WC policyholders, we evaluated the relationship between age, injury type
and costs. The mean total cost of a claim filed by workers 65 years and older was about three
times the cost of a claim filed by workers aged 18-24. Yet, workers under the age of 45 filed
80% of the claims. Linear regression analyses revealed that the increase in costs among older
workers was driven by increases in indemnity costs, rather than medical costs. We also
reported that the indemnity costs associated with specific injuries (e.g. strains and contusions)
increased along with age of the claimant. These results suggest a major financial burden,
particularly due to indemnity costs (i.e. lost days at work, disabilities, and physical limitations)
among the companies that insure workers and the WC insurance agency that will incur among
the aging construction workforce.
Our findings indicated that overall there were statistically significant differences by mean
WC costs regardless of cost type by increasing age group (18-24, 25-34, …, ≥65 years). For
individual age group comparisons, statistically significant differences in mean total costs were
observed among increasing age groups up to age 35, while mean costs did not differ
significantly between older age groups (35-44, 45-54, 55-64 and ≥65 years). Medical costs
plateaued at 35-44 years of age but indemnity costs plateaued at 45-54 years of age. Our
results suggest that how we define “older age,” in terms of a subset of the workforce most
susceptible to injury, may need to be adjusted downward. Our results also highlight the
importance of evaluating cost type, rather than just total cost when describing relationships
between age and cost.
Our findings support previous research demonstrating that worker age was positively
associated with WC costs, although the age at which costs begin to plateau differs across
98
studies. In a study of over 20,000 WC claims among Illinois construction workers’ between
2000 and 2005, the mean total cost of compensation peaked for workers aged 55 to 64 and
then declined slightly for workers over the age of 65 (Friedman & Forst, 2009). Similar findings
were reported by Waehrer et al.’s (2007) study of construction injuries (N = 162,371 injuries)
where mean total cost of injuries and illnesses requiring days away from work peaked at ages
45-54 and declined for workers over the age of 55. Their database of occupational injuries,
however, came from the Survey of Occupational Injuries and Illnesses (SOII) (2002 Annual
Survey) collected by the Bureau of Labor Statistics (BLS) and only represents construction
companies with ten or more employees. Of all construction establishments in the US, 79%
have less than ten employees, and these establishments make up 24% of the construction
workforce (Center for Construction Research and Training, 2008). These previous studies were
either smaller in size (Friedman & Forst, 2009) or had an occupational injury database that was
not representative of the entire construction industry (G. Waehrer et al., 2007). Our data, while
only representative of the Colorado construction industry, suggest that that the age at which WC
costs plateau may be younger than previously reported. A recent report from the National
Council on Compensation Insurers found similar trends (Restrepo & Shuford, 2011).
We determined that strains and contusions were more common among construction
workers and that age modified the association between injury type and indemnity cost. Our top
three frequently occurring types of injuries (strains, contusions, and lacerations) were also cited
as the top construction industry related injuries treated in hospital emergency rooms in a recent
study using National Electronic Injury Surveillance-Work (NEISS-Work) database (Schoenfisch
et al., 2010). The results of the present study suggest that the divergence in indemnity cost
among older and younger workers becomes greater as injury severity increases.
While the present study determined that older workers filed a small percentage of claims
related to minor injuries (i.e. lacerations), it is possible that older workers selectively report the
most serious of injuries. Older workers may shy away from the negative attention related to
99

injury reporting as they already face the stigma associated with being part an aging
workforce. There may be additional fears related to being singled out for their “carelessness” or
“unsafe acts” that could lead to retaliation. Additionally, throughout their careers, older workers
may have had unpleasant experiences with the WC system and chose not to report minor
injuries in order to avoid further frustrations. Despite these issues, older and younger workers
who filed a claim for minor injuries had similar indemnity costs.
We reported that indemnity costs, rather than medical costs were driving the higher WC
costs among older construction workers. Our findings supports previous research findings that
indicate more lost workdays (Horwitz & McCall, 2004; Kucera, Lipscomb, Silverstein, &
Cameron, 2009; Lowery et al., 1998) and increased disability (Arndt et al., 2005; Courtney,
Matz, & Webster, 2002; Welch, Haile, Boden, & Hunting, 2010), and thus, higher indemnity
costs among aging construction workers. Lowery et al. (1998) determined that rate of lost work
time among construction workers at a large Owner Controlled Insurance Program site was
greatest among workers over the age of 50. Kucera et al. (2009) found that among workers 45
years and older were 60% more likely to have a claim with delayed return to work (>90 days
away after injury), compared to workers less than 30 years of age. A study that utilized WC
claims from the Oregon construction industry found that the temporary total disability
compensated days was greatest among workers 46 and 55 years of age (Horwitz & McCall,
2004). Our findings not only support previous findings, but also provide novel quantitative data
on the increased financial costs associated with lost work time and disability among older
construction workers.
Our study supports previous research that indicates injuries to the musculoskeletal
system (e.g. strains) are of particular concern for aging construction workers (de Zwart, Frings-
Dresen, & van Duivenbooden, 1999; Hoonakker & van Duivenbooden, 2010; Welch et al., 2008;
Welch et al., 2010). In our database, approximately 50% of all strain injuries were to the
spine/back/lower trunk among all age groups. Overexertions of the back are a major source of
100

pain and injury among older construction workers (Hoonakker & van Duivenbooden, 2010;
Welch et al., 2008). A significant amount of lost work time, delayed return to work, and disability
from back injuries among aging construction workers has been reported among carpenters in
Washington state (Kucera et al., 2009; H. Lipscomb, Cameron, & Silverstein, 2008). Lipscomb
et al. (2009) reported that payment rates increased with age but the source of payments were
not reported (i.e. medical vs. indemnity payments). Our results are consistent with these
previous results, but also contribute new information about the actual dollar amount associated
with strain-type injuries and how the association with indemnity costs increase with increasing
age of the claimant.
4.1. Strengths and Limitations
The utility of WC data has been demonstrated by many studies that have characterized
work related injuries in terms of their cost, type, and cause in a variety of occupations (Friedman
& Forst, 2009; Hofmann, Snyder, & Keifer, 2006). Colorado WC data, specifically, have been
used to identify costs, characteristics and contributing factors of agricultural injuries and
illnesses (Douphrate et al., 2009a; Douphrate, Rosecrance, Stallones, Reynolds, & Gilkey,
2009b; Douphrate et al., 2006). Unlike other databases of occupational injuries and illnesses,
WC data are not limited to establishments with less than ten employees (BLS SOII) and workers
who were treated in hospital emergency rooms (NEISS-Work) and includes incurred costs
related to medical treatment and compensation. This allows for greater generalizability of the
results obtained from WC data analyses that can then be used to inform policies aimed at
reducing injury and illness in the workplace.
The data analyzed in the present study was originally created to manage insurance
payments and thus the cost variables are relatively accurate and complete for all claims. The
consistency of medical fees during the ten-year period from which this data was derived is
unclear as fee schedule for medical care may have varied but these possible changes were
likely to be small and thus would not have influenced our main findings. We also did not have
101

information on the workers who filed the claim, which hindered our ability to adjust for potential
confounders, such as race/ethnicity, body mass index, years of experience and other personal
and occupational factors. Similar to the majority of studies that use WC claims data, information
related to the incumbent workforce was not available, such as the number of hours worked and
wages or salaries earned by each claimant. It is possible that the increase in indemnity costs
seen in the present study may be due, in part to higher wages among older construction
workers. Since age and type of injury explained only a small percentage of the variance in
indemnity cost, there are likely to be several other, unexplained factors that contribute to costs
that we were not able to account for. The present study likely underestimates the true frequency
and cost due to potential underreporting of injuries that were covered by Social Security,
unemployment insurance, disability coverage, Medicaid, and other private and public insurance
systems (Dembe, 2001).
4.2. Conclusions
By the year 2018, the participation rate of workers over the age of 55 will have increased
while the participation rate of workers between the ages of 16 and 54 will have decreased
(Toossi, 2009). Maintaining the employability of older workers will be critical in order to
compensate for the decreasing labor force participation rates of those in their prime working
years. In physically demanding industries like construction, the impact of the aging population
can be significant. The physical limitations that older construction workers experience (X. Dong
et al., 2011) may limit older workers ability to perform physically demanding tasks in the
construction industry without becoming injured (Schwatka et al., 2012). Older construction
workers may be more likely to hold supervisorial positions due to experience and tenure, and
thus may not have the same exposures to illness- and injury-related risk factors than younger
workers. However, as the number of skilled construction workers in the labor force decrease,
there may be an increased demand for older workers to remain in more laborious positions
(U.S. Bureau of Labor Statistics, 2012). Thus, subsequent efforts to return to work after injury
102

or illness may be hindered by the difficultly to make accommodations in the construction
industry (Berecki-Gisolf, Clay, Collie, & McClure, 2012).
While this study indicated that older workers filed a small percentage of the total WC
claims, the WC costs incurred by them were more costly on a per claim basis than their younger
counterparts for indemnity rather than medical costs. This study illustrates the economic
significance of injuries and illnesses among older construction workers. Additional research is
needed to determine if older construction workers are selectively reporting injuries, which would
likely have an effect on the medical and indemnity costs. The utilization of WC cost data is a
useful but lagging indicator of the state of occupational health and safety among construction
workers. New research should be aimed at leading indicators (e.g., safety climate / culture) of
health and safety that promote the development of proactive injury prevention strategies.
Leading indicators have the potential to identify the risk of occupational injuries prior to their
occurrence among construction workers of all ages.
103
References
Arndt, V., Rothenbacher, D., Daniel, U., Zschenderlein, B., Schuberth, S., & Brenner, H. (2005). Construction work and risk of occupational disability: a ten year follow up of 14 474 male workers. Occup Environ Med, 62(8), 559-566. doi: 10.1136/oem.2004.018135
Berecki-Gisolf, J., Clay, F. J., Collie, A., & McClure, R. J. (2012). The Impact of Aging on Work Disability and Return to Work Insights From Workers' Compensation Claim Records. Journal of Occupational and Environmental Medicine, 54(3), 318-327. doi: 10.1097/JOM.0b013e31823fdf9d
Center for Construction Research and Training. (2008). The construction chart book: The U.S. construction industry and its workers (4 ed.). Silver Springs, M.D.
Chairman of the Council of Economic Advisors: United States Government Printing Office. (2012). Economic report of the president Retrieved March 2012, from http://www.gpo.gov/fdsys/pkg/ERP-2012/pdf/ERP-2012-table60.pdf
Choi, S. D. (2009). Safety and ergonomic considerations for an aging workforce in the US construction industry. Work, 33(3), 301-315.
Courtney, T. K., Matz, S., & Webster, B. S. (2002). Disabling occupational injury in the US construction industry, 1996. J Occup Environ Med, 44(12), 1161-1168.
de Zwart, B. C. H., Frings-Dresen, M. H. W., & van Duivenbooden, J. C. (1999). Senior workers in the Dutch construction industry: A search for age-related work and health issues. Exp Aging Res, 25(4), 385-391.
Dembe, A. E. (2001). The social consequences of occupational injuries and illnesses. Am J Ind Med, 40(4), 403-417.
Dong, X., Wang, X., Daw, C., & Ringen, K. (2011). Chronic diseases and functional limitations among older construction workers in the United States: A 10 year follow-up study. J Occup Environ Med, 53(4), 372-380.
Dong, X. W., Ringen, K., Men, Y. R., & Fujimoto, A. (2007). Medical costs and sources of payment for work-related injuries among Hispanic construction workers. J Occup Environ Med, 49(12), 1367-1375. doi: 10.1097/JOM.0b013e31815796a8
Douphrate, D. I., Rosecrance, J. C., Reynolds, S. J., Stallones, L., & Gilkey, D. P. (2009a). Tractor-related injuries: an analysis of workers' compensation data. J Agromedicine, 14(2), 198-205. doi: 911107835 [pii]10.1080/10599240902773215
Douphrate, D. I., Rosecrance, J. C., Stallones, L., Reynolds, S. J., & Gilkey, D. P. (2009b). Livestock-handling injuries in agriculture: an analysis of Colorado workers' compensation data. Am J Ind Med, 52(5), 391-407. doi: 10.1002/ajim.20686
Douphrate, D. I., Rosecrance, J. C., & Wahl, G. (2006). Workers' compensation experience of Colorado agriculture workers, 2000-2004. Am J Ind Med, 49(11), 900-910. doi: 10.1002/ajim.20387
Friedman, L., & Forst, L. (2009). Workers' compensation costs among construction workers: a robust regression analysis. J Occup Environ Med, 51(11), 1306-1313. doi: 10.1097/JOM.0b013e3181ba46bb
104
Hofmann, J., Snyder, K., & Keifer, M. (2006). A descriptive study of workers' compensation claims in Washington State orchards. Occup Med (Lond), 56(4), 251-257. doi: kql018 [pii]
10.1093/occmed/kql018
Hoonakker, P., & van Duivenbooden, C. (2010). Monitoring working conditions and health of older workers in Dutch construction industry. Am J Ind Med, 53(6), 641-653.
Horwitz, I. B., & McCall, B. P. (2004). Disabling and fatal occupational claim rates, risks, and costs in the Oregon construction industry 1990-1997. J Occup Environ Hyg, 1(10), 688-698. doi: 10.1080/15459620490508787
Kucera, K. L., Lipscomb, H. J., Silverstein, B., & Cameron, W. (2009). Predictors of Delayed Return to Work After Back Injury: A Case-Control Analysis of Union Carpenters in Washington State. Am J Ind Med, 52(11), 821-830. doi: 10.1002/ajim.20747
Lipscomb, H., Cameron, W., & Silverstein, B. (2008). Incident and recurrent back injuries among union carpenters. Occup Environ Med, 65(12), 827-834.
Lipscomb, H., Leiming, L., & Dement, J. M. (2003). Falls among union carpenters. Am J Ind Med, 44(2), 148-156.
Lipscomb, H. J., Dement, J. M., Silverstein, B., Cameron, W., & Glazner, J. E. (2009). Compensation costs of work-related back disorders among union carpenters, Washington State 1989–2003. Am J Ind Med, 52(8), 587-595. doi: 10.1002/ajim.20715
Lowery, J. T., Borgerding, J. A., Zhen, B., Glazner, J. E., Bondy, J., & Kreiss, K. (1998). Risk factors for injury among construction workers at Denver International Airport. Am J Ind Med, 34(2), 113-120. doi: 10.1002/(SICI)1097-0274(199808)34:2<113::AID-AJIM3>3.0.CO;2-Y [pii]
Maertens, J. A., Putter, S. E., Chen, P. Y., Diehl, M., & Huang, E. (2012). Physical capabilities and occupational health of older workers. In J. W. Hedge & W. C. Borman (Eds.), Oxford handbook of work and aging. New York: Oxford University Press.
NORA Construction Sector Council. (2008). National Occupational Research Agenda - National Construction Agdenda. Retrieved 2011, from http://www.cdc.gov/niosh/nora/comment/agendas/construction/?
Restrepo, T., & Shuford, H. (2011). Workers compensation and the aging workforce NCCI Research Brief.
Rogers, E., & Wiatrowski, W. J. (2005). Injuries, illnesses and fatalities among older workers. Monthly Labor Review.
Schoenfisch, A. L., Lipscomb, H. J., Shishlov, K., & Myers, D. J. (2010). Nonfatal Construction Industry-Related Injuries Treated in Hospital Emergency Departments in the United States, 1998-2005. Am J Ind Med, 53(6), 570-580. doi: Doi 10.1002/Ajim.20829
Schwatka, N. V., Butler, L. M., & Rosecrance, J. C. (2012). An aging workforce and injury in the construction industry. Epidemiol. Rev., 34(1), 156-167. doi: 10.1093/epirev/mxr020
Statistics of U.S. Businesses. (1998-2008). Historcal tabulations by enterprise size. Retrieved March 2012, from http://www.census.gov/econ/susb/historical_data.html
Toossi, M. (2009). Labor force projections to 2018: Older workers staying more active. Monthly Labor Review, 132(11), 30-51.
105

U.S. Bureau of Labor Statistics. (2009). Industry injury and illness data. Retrieved May 2011, from http://bls.gov/iif/oshsum.htm
U.S. Bureau of Labor Statistics. (2011). Employer costs for employee compensation. Retrieved March 2011, from http://www.bls.gov/ncs/ect/
U.S. Bureau of Labor Statistics. (2012). Occupational Outlook Handbook. Construction and extraction occupations. Retrieved March 2012, from http://bls.gov/ooh/construction-and-extraction/home.htm
Waehrer, G., Dong, X., Miller, T., Haile, E., & Men, Y. (2007). Costs of occupational injuries in construction in the United States. Accid Anal Prev, 39(6), 1258-1266.
Waehrer, G. M., Dong, X. S., Miller, T., Men, Y., & Haile, E. (2007). Occupational injury costs and alternative employment in construction trades. J Occup Environ Med, 49(11), 1218-1227. doi: 10.1097/JOM.0b013e318156ed24
Welch, L., Haile, E., Boden, L., & Hunting, K. (2008). Age, work limitatins and physical functioning among construction roofers. Work, 31(4), 377-385.
Welch, L., Haile, E., Boden, L. I., & Hunting, K. L. (2010). Impact of musculoskeletal and medical conditions on disability retirement- A longitudinal study among construction workers. Am J Ind Med, 53(6), 552-560.
106

PART IV
From management to co-workers: The impact of safety climate perceptions on safety
behaviors in the construction industry
107

Chapter 1
Introduction
More than thirty years ago, Herbert A. Applebaum wrote a case study on the culture
within the construction industry titled “Royal blue: The culture of construction workers.” In
Applebaum’s chapter titled “Accidents, danger, and death,” he notes a lunchtime swapping of
stories related to work-related accidents and why accidents occur. At the end of the discussion,
one worker concluded, “What’s the use of looking for a ‘why’? An accident is something that
happens. There is no ‘why.’ It just is. That’s all there is.” Applebaum noted that “this blunt
realism epitomizes construction work culture” (Applebaum, 1981). Although this irremediable
attitude persists today, there have been significant advances in improving safety culture within
the United States construction industry. Since 1990, academics, safety professionals,
construction organizations (e.g., Center for Construction Research and Training), and
governmental agencies (e.g., National Institute for Occupational Safety and Health (NIOSH))
together have made significant strides in raising the awareness of health and safety issues and
the importance of safety culture in the construction industry. Across the United States, the non-
fatal injury rate among construction workers has decreased by 54% from 2002 to 2010 and the
fatality rate decreased by 34% between 1992 and 2010 (Center for Construction Research and
Training, 2013). The importance of the safety culture that Applebaum eluded to, is now a
leading theme in construction health and safety research and practice (Matt Gillen and
Gittleman, 2010). The importance of safety culture is echoed by the NIOSH construction sector
goal 8.0, which focuses on the measurement of and interventions for safety culture in the
construction industry (NORA Construction Sector Council, 2008).
Despite many new and effective control measures (from design to personal protective
equipment) to reduce injury risk on the job-site, high rates of injuries and deaths continue in the
construction industry. Construction workers account for a disproportionate number of the injuries
108

and deaths among the United States (US) workforce. Compared to other industries,
construction work still poses a significant risk for injuries (Kachan et al., 2012), chronic
diseases, and functional limitations (Dong et al., 2011a). In 2011, 738 construction workers
died on the job, which equates to about two worker fatalities each day. Their fatality rate was
much greater than the average across all industries, 9.1 versus 3.5 per 100,000 full-time
equivalent workers (FTE) (Bureau of Labor Statistics, n.d.). The number of injuries resulting in
days away from work was 3.8 per 100 FTE’s, compared to 3.3 for all private industries (Bureau
of Labor Statistics, 2012). Over the course of a 45-year career, a construction worker has a
75% likelihood of sustaining a disabling injury (Dong et al., 2011b). Similar trends can be seen
in Europe. Namely, 7% of construction workers reported health problems due to working
conditions, and among them 75% attributed their health problem to a musculoskeletal health
issues (eurostat, n.d.). The occupational non-fatal and fatal incident rates among construction
workers in the European Union were 2,958 and 6.6, respectively, per 100,000 workers
(eurostat, n.d.). In addition to the innovative designs that eliminate risk and new PPE that
minimizes exposure, an understanding of macro-level (e.g., safety climate) factors that influence
health and safety on the job may also facilitate the continued improvements in health and safety
on construction jobsites.
1.1. Safety climate: Perceptions of top management, supervisors and co-workers
Safety climate represents “shared perceptions among the members of a social unit, of
policies, procedures and practices related to safety in the organization” (Kines et al., 2011).
Zohar (2011; 2010) notes that these perceptions reflect: 1) the relative priority of safety
alongside other competing organizational goals, 2) how much of the espoused safety policies
are used in practice, 3) the consistency with which the safety practices are carried out. Many
studies have linked safety climate to other proximal (e.g., safety knowledge) and distal (e.g.,
safety behaviors and injuries) outcomes (Nahrgang et al., 2011). Measures of safety climate
have also been used as an indicator of health and safety in the construction industry (Gilkey et
109

al., 2012; Goldenhar et al., 2003; Kines et al., 2011). For example, after eight construction
workers died within a period of 18 months on a large Las Vegas construction project, Gittleman
et al. (2010) used safety climate measures focused on management commitment to understand
major health and safety concerns. Although company management is often the focus of safety
climate measures, co-workers may also contribute to safety climate but co-worker effects have
been understudied.
1.1.1. Perceptions of management
One focal point in the safety climate literature is the prominence that company
management plays in the development of climate. At the heart of safety climate are worker’s
perceptions of management’s true priority or value of safety. Since management is responsible
for setting company priorities and carrying them out in practice, their actions are key indicators
of safety climate. Meta-analyses of safety climate studies conducted over a decade ago found
that management related factors were the most common factors included in safety climate
measurements (Flin et al., 2000; Guldenmund, 2000). Since then, management commitment to
safety continues to be a common safety climate measurement factor (Griffin and Neal, 2000;
Kines et al., 2011). Although other factors of safety climate are commonly considered (e.g.,
safety systems and safety training), it is becoming more common to think of safety climate
perceptions in terms of “who” is or “who” is not carrying out company safety policies, procedures
and practices. Recently, there has been greater emphasis on how a variety of “safety agents”
within an organization respond to jobsite safety rather than the actual practices employed
(Brondino et al., 2012; Meliá et al., 2008)? Conceptually, other previously researched
dimensions of safety climate (e.g., safety training) are “at least partially dependent on
management commitment to safety” (Huang et al., 2006).
Previous research suggests that it is not sufficient to assess safety climate based on
perceptions of management as a whole. The multi-level concept of safety climate proposed by
Zohar and Luria (2005) contends that measures tapping into the organization and group level
110

are more useful than measures that address only the organization. While top management is
responsible for setting company priorities and outlining procedures, supervisors are tasked with
disseminating and integrating these concepts into daily practice within their work groups. Zohar
and Luria’s (2005) results demonstrated this effect by showing that perceptions of supervisors’
commitment to safety fully mediated the relationship between perceptions of top management’s
commitment to safety and safety behaviors.
In the construction industry, this distinction is especially conspicuous. Typical
construction work takes place on job sites away from company main offices. The distance
created from this type of work gives supervisors and mid-level management a great amount of
responsibility and discretion in carrying out day-to-day safety practices. This responsibility and
discretion contributes to the development of safety climate perceptions beyond the
organizational level. This means that workers develop distinct perceptions of top management
safety climate and supervisor safety climate. Thus, the role of supervisors on construction job
site safety cannot be understated (Zohar, 2011). In qualitative studies, researchers found that
supervisors can be helpful when they model safe behaviors, put safety before production, and
encourage reporting when workers feel unsafe (Marion Gillen et al., 2004). Construction
workers also see their supervisor as having the second most influential position with respect to
safety, with the safety manager being the first (Dingsdag et al., 2008). In quantitative studies,
the amount of time supervisors spent talking with their crews about safety had a direct impact
on their crew’s safety performance (Kines et al., 2010).
1.1.2. Perceptions of co-workers
While previous research highlighted the role of safety climate perceptions of top
management and supervisors, Kines et al. (2011), Melia et al. (2008) and Brondino et al. (2012)
also emphasized the role of safety climate perceptions of co-workers. Kines et al. (2011)
developed and tested the Nordic safety climate questionnaire (NOSACQ-50), which includes
safety climate factors pertaining to co-workers. Their study found that there were shared
111

perceptions of co-workers’ safety commitment, priority, competence, and communication. Melia
et al. (2008) and Brondino et al. (2012) extended Zohar and Luria’s (2005) organizational and
group level safety climate concept to include perceptions of co-workers. Their concept of safety
climate emphasizes the role of “safety agents” on the job (i.e., top management, supervisors,
and co-workers). Their research indicates that perceptions of co-workers are just as important
as perceptions of top management and supervisor when assessing climate. In fact, Brondino et
al. (2012), using structural equation modeling (SEM), found significant mediation effects,
providing evidence for a concept consistent with a partially causal path of “safety agent”
influences on safety behavior, starting from top management and ending at worker safety
behavior.
In addition to having distinct perceptions of top management and supervisors in the
construction industry, construction workers are also likely to have distinct perceptions of their
co-workers. This is due to a mobile workforce, mixed union and non-union worksites, varying
job sites away from the contractor’s office, and sub-contracting. These characteristics lead to a
workforce that is relatively disconnected with top management and more connected with their
crews (i.e., supervisor and co-workers). While the management sets the stage for the safety of
their job sites, safety climate perceptions of crews may be more likely to affect safety behaviors
on the job.
Although the contribution of co-workers in the development of safety climate in the
construction industry may be critical, the contributing effects are not well understood. Kines et
al. (2011) tested the NOSACQ-50 in the Nordic construction industry and found that co-worker
factors were significantly related to worker safety motivation and safety behavior. In a sample of
construction workers from Hong Kong and Spain, Melia et al. (2008) also found support for the
importance of co-workers in the development of safety climate and in the relationship between
safety climate and safety behaviors.
112

In any models that highlight co-workers in the development of safety climate, it is
important to understand the relationships between safety climate and safety behavior norms
among work groups. Norms are “informal rules that groups adopt to regulate and regularize
group members’ behavior” (Feldman, 1984). Norms are composed of both descriptive (what is
actually done) and injunctive (what should be done) elements (Cialdini et al., 1990). They
develop from what supervisors and co-workers say, memorable events, through primacy, and
prior experiences (Feldman, 1984). On the other hand, safety climate represents worker
perceptions of “how things are really done around here,” not what is espoused. According to
Zohar (2011), safety climate stems from perceptions of the pattern with which safety is
prioritized over competing organizational goals. The main referents of these perceptions are top
management and supervisors, as they hold formal power to dictate safety policies, procedures
and practices. Yet, evidence suggests that co-workers influence each other even after
accounting for managerial influences (Chiaburu and Harrison, 2008). It is likely that that norms
develop based on workers’ perceptions of managements’ response to safety as well as co-
workers’ response to safety. Overtime, through the words and deeds of their responses to
safety, workers learn what types of behaviors should be performed in order to get the job done.
Ultimately, work group safety behavior norms develop that guide each worker’s personal safety
behaviors. This is akin to the behavior-outcome expectancies described by Zohar (2001).
Thus, workers’ perceptions of the safety response of all three referents do not represent group
safety behavior norms, but rather inform them and ultimately influence the personal safety
behaviors of all workers.
1.2. Present study
After interviewing 23 construction workers and supervisors, Torner and Pousette (2009)
concluded that safety performance “is dependent on the development of open and mutually
trustful vertical as well as horizontal relationships within the contractor company…[furthermore],
the complexity of construction work demands…the need for collective norms favoring safety”
113

(pg., 407). While the involvement of management in safety is essential, the perception of co-
workers valuing and prioritizing safety may be just as important. Increasing our understanding
of co-worker safety climate perceptions within a framework that includes top management and
supervisors will allow for a more detailed understanding of how each “safety agent” influences
one another and how their combined effect contributes to safety performance. Thus, the
purpose of the present study is to evaluate the usefulness of Melia et al.’s (2008) and Brondino
et al.’s (2012) concept of safety climate in the US construction industry. The present study is
the first to assess the concept of co-worker safety climate perceptions as well as the cumulative
effect of the safety climate factors on proximal safety outcomes (i.e., safety behaviors) in a US
construction cohort.
The present study evaluated the hypothesized model in Figure 2. It is similar to the
hypothesized relationships in Melia et al.’s (2008) and Brondino et al.’s (2012) studies; however,
the present study distinguished between the two types of safety behaviors (i.e., compliance and
participation). The purpose of including the two types of safety behaviors was to determine if
there was a differential effect of the safety climate factors on the two kinds of safety behaviors.
This is because previous research found that safety climate factors have a greater effect on
behaviors related to promoting safety practices (i.e., participation) than behaviors related to
complying with rules (i.e., compliance) (Christian et al., 2009). While previous research found
significant relationships between safety climate factors and safety behaviors, little research
investigated co-worker safety climate factors and safety behaviors.
Hypothesis 1: There is a direct relationship between all safety climate factors and safety
behaviors.
Hypothesis 2: There is a indirect relationship between all safety climate factors and
safety behaviors.
114
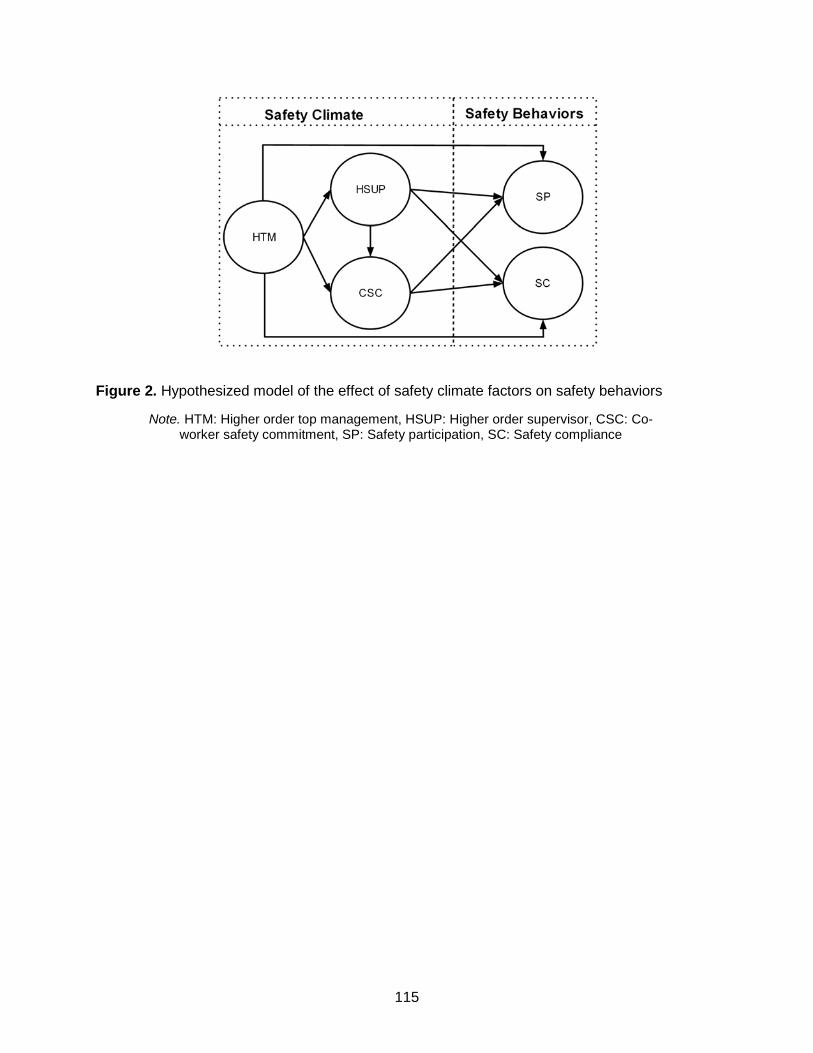
Figure 2. Hypothesized model of the effect of safety climate factors on safety behaviors
Note. HTM: Higher order top management, HSUP: Higher order supervisor, CSC: Co-worker safety commitment, SP: Safety participation, SC: Safety compliance
115

Chapter 2
Methods
2.1. Participants & Procedure
Three medium-sized mechanical construction firms (e.g., installation of plumbing and
heating / ventilation systems) in the Pacific Northwest region of the US participated in the study.
A total of 300 construction workers completed the surveys, which represents a response rate of
71%. The majority of participants were Caucasian (82%) and male (96%) with an average age
of 41.4 years (SD = 11.6). Participants had been with their company an average of 38 months
(SD = 50), with their immediate supervisor for 12 months (SD = 23), and had worked in their
craft for an average of 15 years (SD = 10.7). The sample represented 18 pre-apprentices, 41
apprentices, 136 journeymen, 72 foremen, 5 superintendents, 5 top management, and 20
individuals from other positions (e.g., engineers). The main trades represented by this sample
include unionized plumbers, pipefitters, and sheet metal workers. The University Institutional
Review Board approved all study related methods.
Surveys were distributed during normal work hours during breaks or pre-scheduled
meetings (e.g., morning huddles, tool box talks, or safety meetings). Before the surveys were
distributed, all workers were informed that their participation was voluntary and that no individual
identifying information would be collected from them. They were told the survey would take 15-
20 minutes to complete. The majority of surveys were distributed to the workers by the research
investigators at the jobsite. Members of the company’s safety team distributed surveys to
workers that were not present when the investigators were on the jobsite. Regardless of who
distributed the survey, all surveys were collected upon completion and placed into a sealed
envelope, in which the investigators collected and maintained at the university.
116

2.2. Measures
2.2.1. Safety climate
In the present study, safety climate was defined as worker perceptions of company
safety policies, procedures and practices. Workers were asked to respond to questions
referring to their top management, supervisors, and co-worker’s safety response. The survey
items were adapted from the NOSACQ-50 (Kines et al., 2011), which was tested in the
construction industry and includes a variety of distinct safety climate dimensions that represent
company safety policies, procedures and practices. Four of the seven dimensions of safety
climate in the NOSACQ-50 were used in the present study. These included: 1) management
safety priority, commitment, and competence 2) management safety empowerment, 3)
management safety justice, and 4) co-worker’s safety commitment. The three other dimensions
were excluded because either they did not pertain to the present study (e.g., perceptions of their
trust in the efficacy of their workplace safety systems) or because of survey length restrictions.
In order to evaluate safety climate factors that reflect perceptions of both top
management and supervisors, Kines et al.’s (2011) management factors were altered to reflect
the referents “top management” and “my current, immediate supervisor” instead of
“management.” This was accomplished by splitting Kines et al.’s (2011) management factors
according to Zohar’s (2011) conceptualization of the specific safety activities or focuses that
each respective level of management is concerned with. For example, top management is
concerned with financial expenditures, reducing production in favor of safety and providing
workers with information; on the other hand, supervisors monitor and reward workers and stick
to safety rules when production falls behind. An example question for top management was,
“Top management places safety before production.” An example question for supervisors was,
“My current, immediate supervisor looks the other way when someone is careless with safety.”
This resulted in seven factors: 1) top management safety priority, commitment, and
competence (4 items), 2) top management safety empowerment (3 items), 3) top management
117

safety justice (3 items), 4) supervisor safety priority, commitment, and competence (5 items), 5)
supervisor safety empowerment (4 items), 6) supervisor safety justice (3 items), and 7) co-
worker’s safety commitment (6 items). All items were assessed on a 6-point likert scale (i.e.,
never to always). See Appendix 4.I for a description of each factor and their respective
questions.
In Kines et al.’s (2011) original measure, the management factors had high factor
correlations (r = 0.60 – 0.80), which suggests the possibility for a second order management
factor. Thus in the present study, a second order factor was created for the top management
safety climate factors and supervisor safety climate factors for the sake of parsimony.
2.2.2. Safety behaviors
Safety behaviors were assed by employing a measurement tool that asked questions
related to self reports of safety compliance and participation behaviors (Neal et al., 2000).
Three items of this measurement tool were used to assess safety compliance (e.g., “I use all the
necessary safety equipment to do my job”) and three items assessed safety participation (e.g.,
“I promote the safety program within the organization”). The measure was chosen because it
was found reliable and valid (Griffin and Neal, 2000; Probst, 2004) and for its short length as
compared to other measures of safety behaviors (Pousette et al., 2008). All items were
assessed on a 6-point likert scale (i.e., never to always). Since Brondino et al.’s (2012) findings
suggested that safety climate factors may have a different effect on each factor representing
safety behaviors, a second order safety behaviors factor was not tested. See Appendix 4.I for a
description of each factor and their respective questions.
2.3. Analyses
The psychometric properties of all factors included in the study (i.e., safety climate and
safety behavior factors) were assessed via confirmatory factor analysis (CFA). The direct and
indirect effects of all paths in Figure 1 were determined via SEM. Descriptive analyses in SPSS
21 revealed that the variables exhibited moderate non-normality. Thus, CFA and SEM models
118

were estimated using maximum likelihood parameter estimates with standard errors and a chi-
square test statistic that are more robust to non-normality in MPlus version 7.0 software (Mplus
code: ANALYSIS=MLR). Additionally, MLR is also a full information maximum likelihood (FIML,
also known as direct maximum likelihood) estimation method that can account for missing data.
Unlike pairwise or listwise deletion, FIML estimates all parameters at once with all available data
(Brown, 2011, p. 368; Kline, 2011, p. 177). Model fit was assessed by examining the chi-square
model test statistic, RMSEA, GFI, CFI, and SRMR. Acceptable fit was indicated by values >
0.95 for CFI and TLI, < 0.06 for RMSEA and SRMR (Brown, 2011). The chi-square model test
statistic indicates acceptable fit when the statistic value is low, p > .05 and/or the ratio of the chi-
square test statistic over degrees of freedom (DF) is < 2.0 (Hinkin, 1995). When comparing
nested models (e.g., adding or removing paths) to find the best model fit, the chi-square
difference test specific to the MLR estimator was calculated (Mplus, n.d.). A failure to reject the
chi-square test indicates that the more restrictive (null) model with fewer paths estimated is
better than the less restrictive model (alternative) with more paths estimated (Kline, 2011).
Finally, indirect effects (i.e., mediation effects) were estimated using the MODEL INDIRECT
command and a bias-corrected bootstrapping method to estimate the significance of the effects
(Williams and MacKinnon, 2008).
119

Chapter 3
Results
3.1. Confirmatory factor analysis
A confirmatory factor analysis with all 34 questions representing 7 first order safety
climate factors, 2 first order safety behavior factors, and 2 second order safety climate factors
(top management and supervisor) had poor to moderate fit, χ2 = 810 (511), p = 0.000, RMSEA =
0.044 95% CI = 0.038-0.050, CFI = 0.918, TLI = 0.910, SRMR = 0.062. While a model without
the 2 higher order factors fit the data better (χ2 = 33 (20), p < 0.05), the higher order factors
were retained because 1) the first order factor loadings onto the higher order factors were high
(β = 0.70 – 0.97) and 2) the fit indices did not change appreciably. Thus, the higher order
factors were kept for the sake of parsimony.
To improve the fit of the latter model, all items were inspected for insignificant or low
factor loadings and low squared multiple correlations. Of the 34 items, 5 items had low factor
loadings (β = 0.16 – 0.44) and squared multiple correlation values (0.02 – 0.19), but were
statistically significant. Despite their significance, their low factor loadings indicated that the
items were not related to their proposed factors. Removing the insignificant items resulted in a
poor to moderately good fitting model, χ2 = 595 (361), p = 0.000, RMSEA = 0.047 95% CI =
0.040-0.053, CFI = 0.928, TLI = 0.920, SRMR = 0.060.
Modification indices were inspected from the latter model to determine additional
sources of model misfit. The largest modification index value was related to a correlated errors
term for two of the co-worker safety commitment factor item’s errors, and are indicative of
variance that cannot be accounted for by the factors on which the items load. Theoretically, this
inclusion made sense because the items were worded very similarly (Brown, 2011). Including
the correlated error term in the model resulted in significantly improved model fit (χ2 = 17 (1), p <
120

0.05), and resulted in moderately good fit, χ2 = 549 (360), p = 0.000, RMSEA = 0.042 95% CI =
0.035-0.049, CFI = 0.942, TLI = 0.935, SRMR = 0.056.
Additional modification indices from the latter model indicated that the fit of the model
would be significantly improved if one item from the supervisor safety priority, commitment, and
competence factor was allowed to cross-load onto the supervisor safety empowerment factor.
Including the cross-loading item in the model resulted in significantly improved fit (χ2 = 42.90 (1),
p < 0.05), and resulted in good fit, χ2 = 501 (359), p = 0.000, RMSEA = 0.036 95% CI = 0.029-
0.044, CFI = 0.957, TLI = 0.951, SRMR = 0.048. All item factor loadings were significant (p <
0.01) and had standardized factor loadings ranging from 0.503 to 0.979. One factor loading,
which cross loaded onto two supervisor factors as previously mentioned, had a significant but
low factor loading (β = 0.274) on the supervisor safety priority, commitment and competence
factor, but it was kept. Inter-item reliability scores were good (α = 0.68 - 0.85). A detailed table
with item loadings, standard errors, p-values, and Chronbach’s alpha for each factor can be
seen in Appendix 4.II. Table 11 shows the correlations for all factors in the final conceptual
model.
3.2. Structural equation modeling
The hypothesized model (see Figure 2) provided good fit, χ2 = 507 (359), p = 0.000,
RMSEA = 0.036 95% CI = 0.029-0.044, CFI = 0.957, TLI = 0.951, SRMR = 0.048. However,
Table 11. Means, standard deviations (SD) and factor correlations of all study variables Variable Mean SD 1 2 3 4 5
1. Higher order top management (HTM) 4.14 0.73 1.00 0.66 0.55 0.45 0.40 2. Higher order supervisor (HSUP) 4.35 0.64 1.00 0.58 0.39 0.24 3. Co-worker safety commitment (CSC) 4.29 0.70 1.00 0.62 0.59 4. Safety compliance (SC) 4.41 0.63 1.00 0.63 5. Safety participation (SP) 3.83 0.94 1.00 Note. All correlations are significant (p < 0.001). Items were rated on a frequency scale from 0 to 5, Never to Always.
121

since 1) the second order supervisor factor was hypothesized to mediate the relationship
between the second order top management and co-worker factors, and 2) the co-worker factor
was hypothesized to mediate the relationships between the second order top management and
second order supervisor factors and both safety behavior factors, the hypothesized model was
compared to two competing hierarchical models (see Figure 3). Compared to the hypothesized
model in Figure 1, hierarchical model A did not result in significantly better fit (χ2 = 15.68 (5), p <
0.01), but hierarchical model B did result in better fit (χ2 = 4.79 (4), p > 0.05). This indicates that
the direct paths of both second order management factors on both safety behavior factors did
not improve the fit of the model. The final model with all significant standardized parameter path
estimates and r2 values is illustrated in Figure 4.
The strength of the mediation effects can be seen in Table 12. In relation to just the
safety climate factors, the relationship between second order top management factor and co-
worker safety commitment factor was significantly partially mediated by the second order
supervisor factor. In relation to the safety behavior outcomes, the co-worker safety commitment
factor significantly mediated the relationship between the second order top management and
both types of safety behaviors. The present study hypothesized that the model (see Figure 2)
proposed by Melia et al. (2008) and Brondino et al. (2012) would also be appropriate for an
assessment of safety climate perceptions among US construction workers. Specifically, there
would be significant direct (hypothesis 1) and indirect effects (hypothesis 2). The results
indicated that Hypothesis 1 was only partially supported, because the direct effects from both
second order management factors on both types of safety behaviors were non-significant.
Hypothesis 2 was fully supported, because all estimated indirect effects were significant.
122

Figure 3. Hierarchical models compared to hypothesized model in Figure 2
Note. HTM: Higher order top management, HSUP: Higher order supervisor, CSC: Co-worker safety commitment, SP: Safety participation, SC: Safety compliance
123

Figure 4. Final structural model with significant path estimates
Table 12. Mediation effects in the final structural equation model Estimate (S.E.) 95% CI Safety climate specific Effects from HTM to CSC
HTM HSUP CSC 0.220 (0.085) 0.054-0.386 HTM CSC 0.354 (0.109) 0.140-0.568
Total indirect effect 0.220 (0.085) 0.054-0.386 Total direct + indirect effect 0.571 (0.056) 0.464-0.684
Effects on Safety Participation Effects from HTM to SP
HTM HSUP CSC SP 0.130 (0.049) 0.033-0.226 HTM CSC SP 0.208 (0.057) 0.061-0.356 Total indirect effect 0.338 (0.057) 0.227-0.449
Effects on Safety Compliance Effects from HTM to SC
HTM HSUP CSC SC 0.139 (0.054) 0.034-0.245 HTM CSC SC 0.224 (0.076) 0.076-0.373 Total indirect effect 0.364 (0.055) 0.256-0.472
Note. HTM: Higher order top management, HSUP: Higher order supervisor, CSC: Co-worker safety commitment, SP: Safety participation, SC: Safety compliance
Note. *Significant (p < 0.001). Only paths significant at p < .001 are shown. Values beside latent variables represent variance accounted for. HTM: Higher order top management, HSUP:
Higher order supervisor, CSC: Co-worker safety commitment, SP: Safety participation, SC: Safety compliance
124

Chapter 4
Discussion
The present study was one of the first to test a concept of safety climate that focuses on
perceptions of how individuals at each company level (top management, supervisors and co-
workers) respond to safety and how these perceptions affect personal safety behaviors. This
concept of safety climate was proposed by Melia et al. (2008) and Brondino et al. (2012) as an
extension of Zohar’s (2005) multi-level concept, which focused on top management and
supervisors only. The present study evaluated the three-safety agent safety climate concept in
the US construction industry and found similar results. Specifically, worker perceptions of their
co-workers’ commitment to safety is an important safety climate factor that explains the
mechanism by which safety behaviors are affected by top managements’ and supervisors’
response to safety. The present study’s comparable results strengthens the evidence for a
concept of safety climate that focuses on “who” performs actions rather than relying solely on
“what” actions were performed.
Melia et al. (2008) tested this concept of safety climate among four cohorts, two general
cohorts from the United Kingdom and Spain and two construction cohorts from Hong Kong and
Spain, using multiple regression. Brondino et al. (2012) tested the concept in the Italian
manufacturing industry using multi-level SEM. In both Melia et al.’s (2008) and Brondino et al.’s
(2012) studies, top management’s safety response had a direct effect on safety behaviors. Yet,
in the present study they did not. Supervisor’s safety response affected some sample’s safety
behaviors in Melia et al.’s (2008) study (English general and Chinese construction cohorts), but
they did not affect them in Brondino et al.’s (2012) or the present study’s cohort. In both the
previous and the present studies, co-worker safety response had a significant direct relationship
with safety behaviors. Additionally, Brondino et al.’s (2012) and the present study found
significant mediation effects among the safety climate factors and between the safety climate
125

and safety behavior factors. Melia et al. (2008) did not test mediation in their study. Ultimately,
these studies support the inclusion of perceptions of individuals at all three company levels in
the measurement of safety climate and the prediction of safety behaviors.
While previous research found a direct relationship between both management levels
and safety outcomes (Brondino et al., 2012; Kines et al., 2011; Meliá et al., 2008; Zohar and
Luria, 2005), the present study indicates that the relationship is mediated by co-worker’s
commitment to safety. These findings broaden our understanding of how management’s
response to safety influences safety behaviors. It indicates that it is important to include the co-
worker factor alongside the top management and supervisor factors in the safety agent concept
of safety climate. It’s inclusion helps to explain how top management and supervisor’s safety
response to safety influences safety behaviors. It is through positive perceptions of co-workers
commitment to safety that top management and supervisors can influence safety behaviors. In
other words, workers must perceive that their co-workers are committed to safety in order for
management to positively influence safety behaviors on the job. In practice, co-workers’
response to safety should be seen as just as important in forming a high safety climate as
management’s response to safety. Building a commitment to safety among co-workers should
be emphasized in educational programs such as toolbox talks.
Perhaps the reason that co-worker safety climate factor had such a great influence on
safety behaviors in this study is because the majority of the workers in the study belonged to
unions. Unions provide workers training, they find job sites for them to work on, and negotiate
wages and safety standards. Unions also provide a sense of belonging and brotherhood
(Barbeau et al., 2005). Thus, union workers may feel closer to and responsible for the safety of
their co-workers (who are also members of the same union). Additionally, workers are
influenced by their co-workers commitment to safety and the pressure to conform to group
norms of whether or not to be a “tough guy” (Choudhry and Fang, 2008). Thus, the present
126

study lends support for the necessity to understand the influence of co-workers, not just
management, in safety climate investigations (Chiaburu and Harrison, 2008).
4.1. Future directions & Limitations
4.1.1. Relationships to be addressed
While the present study provides corroborative evidence suggesting a causal
relationship among the variables, the true causal effect cannot be inferred from this study’s
research design. To move towards an understanding of the causal relationships among the
variables in the study, a few additional research activities should be completed (Antonakis et al.,
2010).
The concept of safety climate could be strengthened by the inclusion of other potential
explanatory variables. Since the present study found support for the co-worker safety climate
factor, it is possible that team member exchange (TMX) might have a significant positive
relationship with safety climate. TMX represents worker’s relationship with their work group as
a whole. Under high quality TMX, workers assist each other and share their ideas and feedback
(Seers, 1989). Future research should consider TMX in the context of this safety climate
concept and the potential causal or reciprocal relationship with leader factors that previous
research linked with safety climate (i.e. transformational leadership style and leader member
exchange) (Barling et al., 2002; Hofmann et al., 2003; Mullen and Kelloway, 2009). Additionally,
the inclusion of empirical measures of safety behavior norms was beyond the intention and
scope of the present study. Thus, future research assessing the mediating role of safety
behavior norms between safety climate and personal safety behaviors may be of interest.
Reverse causation should be addressed through a longitudinal design. Reverse
causation suggests that the outcome may actually occur before its predictor. Reverse causation
can be ruled out with longitudinal study designs, as they help to distinguish which variables truly
influence other variables over time. In the present study, it is unclear if the management safety
climate factors predict the co-worker safety climate factor over time. Nor is it clear if one safety
127

climate factor predicts safety behaviors better than the others over time. Furthermore, a
longitudinal design may indicate that workers who perform more safety behaviors may influence
perceptions of co-worker’s commitment to safety or that a feedback loop exists between them.
Within the context of the aforementioned additional leadership and team member variables to
be included in the model, there may be reciprocal relationships between variables or paths that
may work in an unexpected direction.
Finally, the model could be improved by testing its validity among and between other
construction companies in different US geographical regions as well as other countries, trades,
union and non-union contractors, and size of company (i.e., number of workers). Including fixed
effects such as these in the model will allow commonalities between workers and companies to
be addressed. For example, questions remain about how company size may affect safety
climate perceptions. Larger companies have more resources for safety policies, procedures
and practices, thus higher levels of safety climate perceptions may exist among larger
companies. Yet, the majority of contractors in the US and Europe are small in size (i.e., 9
workers or less) (Center for Construction Research and Training, 2013; eurostat, n.d.). A large-
scale multilevel study of safety climate perceptions among different contractors could answer
this question, and offer potential avenues for safety climate intervention research.
4.1.2. Safety climate interventions
The present study supports the use of proactive work place interventions to improve
health and safety. Efforts to improve safety climate on the job include transformational
leadership training (Mullen and Kelloway, 2009) and feedback methods to increase safety
specific communication between supervisors and workers (Kines et al., 2010; Zohar and
Polachek, 2013). The present study supports the use of these kinds of interventions. Yet, it also
supports team based interventions, as suggested by Brondino et al. (2012). Such interventions
could improve the relationship between management and workers as well as among workers
themselves. Specifically, interactive and engaging training among work teams may be an
128

effective means of increasing safety knowledge and performance (Burke et al., 2011).
Participatory ergonomics is an example of one such intervention (Rivilis et al., 2008).
4.2. Limitations
Many of the present study’s limitations were addressed in the previous section 4.1.1.
(i.e., cross-sectional design, omitted variables, omitted fixed effects, and common method
variance). The present study also only represents one region of the US and a few construction
trades, and thus may not be generalizable to the entire US construction industry. Finally, a
main tenant of safety climate is that perceptions of it are shared, but the present study could not
determine sharedness among work groups. Thus, the present study only addressed
psychological safety climate.
4.3. Conclusions
The irremediable construction safety culture depicted in Applebaum’s (1981)
ethnography is slowly transitioning into a culture that rejects the fallacy that accidents just
happen and can’t be prevented. There is growing empirical evidence that as safety climate /
culture improves injuries and fatalities are reduced. The present study evaluated a conceptual
model of safety climate that focused on safety agents (top management, supervisors, and co-
workers) within the US construction industry. The results indicated that the safety responses of
top management, supervisors, as well as co-workers contribute to positively impact safety
behaviors on the job. The present study indicated that worker’s must perceive that their co-
workers are committed to safety in order for top management and supervisors to influence
safety behaviors on the job. These results support workplace health and safety interventions
targeted towards not only leadership, but also work teams.
129

References Antonakis, J., Bendahan, S., Jacquart, P., Lalive, R., 2010. On making causal claims: A review
and recommendations. The Leadership Quarterly 21, 1086–1120.
Applebaum, H.A., 1981. Royal blue: The culture of construction workers. Holt, Rinehart and Winston, New York.
Barbeau, E.M., Goldman, R., Roelofs, C., Gagne, J., Harden, E., Conlan, K., Stoddard, A., Sorensen, G., 2005. A New Channel for Health Promotion: Building Trade Unions. American Journal of Health Promotion 19, 297–303.
Barling, J., Loughlin, C., Kelloway, E.K., 2002. Development and test of a model linking safety-specific transformational leadership and occupational safety. J. Appl. Psychol. 87, 488–496.
Brondino, M., Silva, S.A., Pasini, M., 2012. Multilevel approach to organizational and group safety climate and safety performance: Co-workers as the missing link. Safety Science 50, 1847–1856.
Brown, T.A., 2011. Confirmatory factor analysis for applied research. The Guildford Press, New York.
Bureau of Labor Statistics, 2012. Workplace injuries and illnesses - 2011 [WWW Document]. bls.gov. URL http://www.bls.gov/news.release/archives/osh_10252012.pdf (accessed 10.2.13).
Bureau of Labor Statistics, n.d. Revisions to the 2011 census of fatal occupational injuries (CFOI) counts [WWW Document]. bls.gov. URL http://www.bls.gov/iif/oshwc/cfoi/cfoi_revised11.pdf (accessed 10.2.13).
Burke, M.J., Salvador, R.O., Smith-Crowe, K., Chan-Serafin, S., Smith, A., Sonesh, S., 2011. The dread factor: How hazards and safety training influence learning and performance. J. Appl. Psychol. 96, 46–70.
Center for Construction Research and Training, 2013. The Construction Chart Book: The U.S. construction industry and its workers, 5 ed. CPWR, Silver Spring.
Chiaburu, D.S., Harrison, D.A., 2008. Do peers make the place? Conceptual synthesis and meta-analysis of coworker effects on perceptions, attitudes, OCBs, and performance. J. Appl. Psychol. 93, 1082–1103.
Choudhry, R.M., Fang, D., 2008. Why operatives engage in unsafe work behavior: Investigating factors on construction sites. Safety Science 46, 566–584.
Christian, M.S., Bradley, J.C., Wallace, J.C., Burke, M.J., 2009. Workplace safety: A meta-analysis of the roles of person and situation factors. J. Appl. Psychol. 94, 1103–1127.
Cialdini, R.B., Reno, R.R., Kallgren, C.A., 1990. A focus theory of normative conduct: Recycling the concept of norms to reduce littering in public places. Journal of Personality and Social Psychology 58, 1015–1026.
Dingsdag, D.P., Biggs, H.C., Sheahan, V.L., 2008. Understanding and defining OH&S competency for construction site positions: Worker perceptions. Safety Science 46, 619–633.
Dong, X., Wang, X., Daw, C., Ringen, K., 2011a. Chronic diseases and functional limitations among older construction workers in the United States: A 10 year follow-up study. J. Occup.
130

Environ. Med. 53, 372–380.
Dong, X.W., Welch, L., Dement, J., Ringen, K., 2011b. Construction workers experience significant lifetime risk of occupational injury, premature death [WWW Document]. apha.org. URL http://www.apha.org/about/news/pressreleases/2011/construction+worker+safety+am+11.htm (accessed 10.4.13b).
eurostat, n.d. Health and safety at work in Europe: A statistical portrait [WWW Document]. epp.eurostat.ec.europa.eu. URL http://epp.eurostat.ec.europa.eu/cache/ITY_OFFPUB/KS-31-09-290/EN/KS-31-09-290-EN.PDF (accessed 9.2.10).
eurostat, n.d. Health and safety at work [WWW Document]. epp.eurostat.ec.europa.eu. URL http://epp.eurostat.ec.europa.eu/portal/page/portal/health/health_safety_work/data/database (accessed 9.2.10).
eurostat, n.d. Key figures on European businesses: With a special feature on SMEs [WWW Document]. epp.eurostat.ec.europa.eu. URL http://epp.eurostat.ec.europa.eu/cache/ITY_OFFPUB/KS-ET-11-001/EN/KS-ET-11-001-EN.PDF (accessed 10.2.11).
Feldman, D., 1984. The development and enforcement of group norms. The Academy of Management Review 9, 47–53.
Flin, R., Mearns, K., O'Connor, P., Bryden, R., 2000. Measuring safety climate: identifying the common features. Safety Science 34, 177–192.
Gilkey, D.P., del Puerto, C.L., Keefe, T., Bigelow, P., Herron, R., Rosecrance, J., Chen, P., 2012. Comparative Analysis of Safety Culture Perceptions among HomeSafe Managers and Workers in Residential Construction. Journal of construction engineering and management 138, 1044–1052.
Gillen, Marion, Kools, S., Sum, J., McCall, C., Moulden, K., 2004. Construction workers' perceptions of management safety practices: A qualitative investigation. Work 23, 245–256.
Gillen, Matt, Gittleman, J.L., 2010. Path forward: emerging issues and challenges. J. Saf. Res. 41, 301–306.
Gittleman, J.L., Gardner, P.C., Haile, E., Sampson, J.M., Cigularov, K.P., Ermann, E.D., Stafford, P., Chen, P.Y., 2010. CityCenter and Cosmopolitan Construction Projects, Las Vegas, Nevada: Lessons learned from the use of multiple sources and mixed methods in a safety needs assessment. J. Saf. Res. 41, 263–281.
Goldenhar, L.M., Williams, L.J., Swanson, N.G., 2003. Modelling relationships between job stressors and injury and near-miss outcomes for construction labourers. Work and Stress 17, 218–240.
Griffin, M., Neal, A., 2000. Perceptions of safety at work: a framework for linking safety climate to safety performance, knowledge, and motivation. Journal of Occupational Health Psychology 1, 347–358.
Guldenmund, F., 2000. The nature of safety culture: a review of theory and practice. Safety Science 34, 215–257.
Hinkin, T.R., 1995. A Review of Scale Development Practices in the Study of Organizations. Journal of Management 21, 967–988.
Hofmann, D.A., Morgeson, F.P., Gerras, S.J., 2003. Climate as a moderator of the relationship between leader-member exchange and content specific citizenship: Safety climate as an
131

exemplar. J. Appl. Psychol. 88, 170–178.
Huang, Y., Ho, M., Smith, G.S., Chen, P.Y., 2006. Safety climate and self-reported injury: Assessing the mediating role of employee safety control. Accident Analysis and Prevention 38, 425–433.
Kachan, D., Fleming, L.E., LeBlanc, W.G., Goodman, E., Arheart, K.L., Caban-Martinez, A.J., Clarke, T.C., Ocasio, M.A., Christ, S., Lee, D.J., 2012. Worker populations at risk for work-related injuries across the life course. American Journal of Industrial Medicine 55, 361–366.
Kines, P., Andersen, L. P. S., Spangenberg, S., Mikkelsen, K.L., Dyreborg, J., Zohar, D., 2010. Improving construction site safety through leader-based verbal safety communication. J. Saf. Res. 41, 399–406.
Kines, P., Lappalainen, J., Mikkelsen, K.L., Olsen, E., Pousette, A., Tharaldsen, J., T masson, K., T rner, M., 2011. Nordic Safety Climate Questionnaire (NOSACQ-50): A new tool for diagnosing occupational safety climate. International Journal of Industrial Ergonomics 41, 634–646.
Kline, R.B., 2011. Principles and practice of structural equation modeling. The Guildford Press, New York.
Meliá, J.L., Mearns, K., Silva, S.A., Lima, M.L., 2008. Safety climate responses and the perceived risk of accidents in the construction industry. Safety Science 46, 949–958.
Mplus, n.d. Chi-square difference testing using the satorra-bentler scaled chi-square [WWW Document]. URL http://www.statmodel.com/chidiff.shtml (accessed 8.22.13).
Mullen, J.E., Kelloway, E.K., 2009. Safety leadership: A longitudinal study of the effects of transformational leadership on safety outcomes. Journal of Occupational and Organizational Psychology 82, 253–272.
Nahrgang, J.D., Morgeson, F.P., Hofmann, D.A., 2011. Safety at Work: A Meta-Analytic Investigation of the Link Between Job Demands, Job Resources, Burnout, Engagement, and Safety Outcomes. J. Appl. Psychol. 96, 71–94.
Neal, A., Griffin, M.A., Hart, P.M., 2000. The impact of organizational climate on safety and individual behaviour. Safety Science 34, 99–109.
NORA Construction Sector Council, 2008. National Occupational Research Agenda - National Construction Agdenda [WWW Document]. cdc.gov. URL http://www.cdc.gov/niosh/nora/comment/agendas/construction/pdfs/ConstOct2008.pdf (accessed 9.2.12).
Pousette, A., Larsson, S., Törner, M., 2008. Safety climate cross-validation, strength and prediction of safety behaviour. Safety Science 46, 398–404.
Probst, T.M., 2004. Safety and insecurity: Exploring the moderating effect of organizational safety climate. Journal of Occupational Health Psychology 9, 3–10.
Rivilis, I., Van Eerd, D., Cullen, K., Cole, D.C., Irvin, E., 2008. Effectiveness of participatory ergonomic interventions on health outcomes: A systematic review. Applied Ergonomics 39, 342–358.
Seers, A., 1989. Team-member exchange quality: A new construct for role-making research. Organizational behavior and human decision processes 43, 118–135.
Törner, M., Pousette, A., 2009. Safety in construction – a comprehensive description of the characteristics of high safety standards in construction work, from the combined perspective
132

of supervisors and experienced workers. J. Saf. Res. 40, 399–409.
Williams, J., MacKinnon, D.P., 2008. Resampling and Distribution of the Product Methods for Testing Indirect Effects in Complex Models. Structural equation modeling 15, 23–51.
Zohar, D., 2010. Thirty years of safety climate research: reflections and future directions. Accident Analysis and Prevention 42, 1517–1522.
Zohar, D., 2011. Safety climate: Conceptual and measurement issues, in: Quick, J.C., Tetrick, L.E. (Eds.), Handbook of Occupational Health Psychology. APA, Washington DC.
Zohar, D., Luria, G., 2005. A multilevel model of safety climate: Cross-level relationships between organization and group-level climates. J. Appl. Psychol. 90, 616–628.
Zohar, D., Polachek, T., 2013. Discourse-Based Intervention for Modifying Supervisory Communication as Leverage for Safety Climate and Performance Improvement: A Randomized Field Study. J. Appl. Psychol.
133

Appendix 4.I
Safety behavior and safety climate survey questions
Safety behaviors
(Neal, Griffin, & Hart, 2000) 1. Safety Compliance (SC) adhering to safety procedures and carrying out work in a safe
manner
2. Safety Participation (SP): Helping coworkers, promoting the safety program within the
workplace, demonstrating initiative, and putting effort into improving safety in the workplace
Please circle the number to best rate the frequency of each statement Never
Rarely Sometimes
Fairly Often
Very Often Always
6. I use all the necessary safety equipment to do my job
0 1 2 3 4 5
2. I use the correct safety procedures for carrying out my job
0 1 2 3 4 5
3. I ensure the highest levels of safety when I carry out my job
0 1 2 3 4 5
Please circle the number to best rate the frequency of each statement Never
Rarely Sometimes
Fairly Often
Very Often Always
4. I promote the safety program within the organization
0 1 2 3 4 5
5. I put in extra effort to improve the safety of the workplace
0 1 2 3 4 5
1. I voluntarily carry out tasks or activities that help to improve workplace safety
0 1 2 3 4 5
134

Safety climate
(Kines et al. 2011) Management Level Factors: 1. Management safety priority, commitment and competence (9 questions): Workers’
perceptions of management: prioritizing safety, being active in promoting safety and reacting to unsafe behavior, showing competence in handling safety, and communicating safety issues
Please circle the number to best rate the frequency of each statement Never
Rarely
Some-times
Fairly Often
Very Often Always
Top management (TMP):
7. Top management places safety before production 0 1 2 3 4 5
15. We who work here have confidence in top management's ability to deal with safety
0 1 2 3 4 5
14. Top management ensures that safety problems discovered during safety rounds/evaluations are corrected immediately
0 1 2 3 4 5
16. Top management ensures that everyone receives the necessary information on safety
0 1 2 3 4 5
Supervisor (SUPP): 17. My current, immediate supervisor looks the other way when someone is careless with safety
0 1 2 3 4 5
28. My current, immediate supervisor encourages employees here to work in accordance with safety rules - even when the work schedule is tight
0 1 2 3 4 5
19. My current, immediate supervisor accepts employees here taking risks when the work schedule is tight
0 1 2 3 4 5
20. When a risk is detected, my current, immediate supervisor ignores it without action
0 1 2 3 4 5
21. My current, immediate supervisor does not deal with safety properly
0 1 2 3 4 5
135

2. Management safety empowerment (7 questions): Workers’ perceptions of management empowering workers and supporting participation
Please circle the number to best rate the frequency of each statement Never Rarely
Some-times
Fairly Often
Very Often Always
Top management (TME): 10. Top management strives to design safety routines that are meaningful and actually work
0 1 2 3 4 5
9. Top management involves employees in decisions regarding safety
0 1 2 3 4 5
12. Top management strives for everybody at the worksite to achieve high competence concerning safety and risks
0 1 2 3 4 5
Supervisor (SUPE): 22. My current, immediate supervisor encourages employees here to participate in decisions which affect their safety
0 1 2 3 4 5
24. My current, immediate supervisor considers employees' suggestions regarding safety
0 1 2 3 4 5
26. My current, immediate supervisor asks employees for their opinions before making decisions regarding safety
0 1 2 3 4 5
25. My current, immediate supervisor makes sure that everyone can influence safety in their work environment
0 1 2 3 4 5
136

3. Management safety justice (6 questions): Workers’ perceptions of management treating workers who are involved in accidents fairly
Please circle the number to best rate the frequency of each statement Never Rarely
Some-times
Fairly Often
Very Often Always
Top management (TMJ): 13. Top management looks for causes, not guilty persons, when an accident occurs
0 1 2 3 4 5
11. Top management blames employees for accidents 0 1 2 3 4 5
8. Top management treats employees involved in an accident fairly
0 1 2 3 4 5
Supervisor (SUPJ): 23. My current, immediate supervisor collects accurate information in accident investigations
0 1 2 3 4 5
27. Fear of sanctions (negative consequences) from my current, immediate supervisor discourages employees here from reporting near-miss accidents
0 1 2 3 4 5
18. My current, immediate supervisor listens carefully to all who have been involved in an accident
0 1 2 3 4 5
137

Work crew level factor: 1. Workers’ safety commitment (6 questions): Workers’ perceptions of how they themselves
relate to safety at work concerning if they generally: show commitment to safety and are active in promoting safety and care for each other’s safety
Please circle the number to best rate the frequency of each statement Never Rarely
Some-times
Fairly Often
Very Often Always
Co-worker (CSC): 29. My coworkers and I try hard together to achieve a high level of safety
0 1 2 3 4 5
30. My coworkers and I take joint responsibility to ensure that the workplace is kept tidy
0 1 2 3 4 5
31. My coworkers and I do not care about each others' safety 0 1 2 3 4 5
32. My coworkers and I avoid tackling risks that are discovered 0 1 2 3 4 5
33. My coworkers and I help each other to work safely 0 1 2 3 4 5
34. My coworkers and I take responsibility for each others' safety
0 1 2 3 4 5
138

Appendix 4.II
Safety climate and safety behavior: Confirmatory factor analysis results
Factor Item Estimate S.E. P-Value Inter-item reliability (α)
SP V1 0.686 0.051 P < 0.01 0.828 V4 0.809 0.033 P < 0.01 V5 0.873 0.029 P < 0.01
SC V2 0.851 0.027 P < 0.01 0.840 V3 0.848 0.031 P < 0.01 V6 0.714 0.042 P < 0.01
TMP V7 0.716 0.045 P < 0.01 0.844 V14 0.715 0.038 P < 0.01 V15 0.860 0.024 P < 0.01 V16 0.814 0.028 P < 0.01
TME V9 0.755 0.034 P < 0.01 0.812 V10 0.817 0.036 P < 0.01 V12 0.772 0.036 P < 0.01
TMJ V8 0.784 0.039 P < 0.01 0.717 V13 0.727 0.056 P < 0.01
SUPP V17 0.704 0.074 P < 0.01 0.846 V19 0.823 0.043 P < 0.01 V20 0.752 0.078 P < 0.01 V21 0.759 0.094 P < 0.01 V28 0.274 0.113 P < 0.01
SUPE V24 0.882 0.031 P < 0.01 0.801 V25 0.805 0.035 P < 0.01 V26 0.574 0.060 P < 0.01 V28 0.503 0.098 P < 0.01
SUPJ V18 0.653 0.076 P < 0.01 0.679 V23 0.779 0.062 P < 0.01
CSC V29 0.808 0.034 P < 0.01 0.850 V30 0.731 0.037 P < 0.01 V33 0.702 0.081 P < 0.01 V34 0.683 0.064 P < 0.01
HTM TMP 0.927 0.032 P < 0.01 TME 0.979 0.023 P < 0.01 TMJ 0.920 0.039 P < 0.01
HSUP SUPP 0.625 0.075 P < 0.01 SUPE 0.974 0.034 P < 0.01
SUPJ 0.946 0.054 P < 0.01 Note. Each of the items correspond to the numbered questions in Appendix 4.I. HTM (Higher order top management safety climate factor) and HSUP (Higher order supervisor safety climate factor)
139
PART V
Construction supervisors’ safety performance: The impact of safety climate perceptions
and safety climate knowledge on safety behaviors
140

Chapter 1
Introduction
In Gillen et al.’s (2004) interviews with 64 construction workers on what constituted good
management safety practices, one worker said, “I think as a foreman you have to really…lead
by example more than anything else…then the people that you see know that you’re serious
about it, then they’re going to get serious about it” (pg. 249). This statement typifies the
importance of supervisors in the construction industry. As is common in the construction
industry, directing crews on job sites away from the primary organizational unit allows
superintendents and supervisors to create their own safety climate and influence how the work
is performed (i.e., safely or unsafely). Their safety specific words and deeds set the stage for
how work is performed (Dingsdag, Biggs, & Sheahan, 2008; Törner & Pousette, 2009).
Supervisors who place a low priority and value on safety are likely to negatively influence
worker safety climate, and in turn unknowingly promote poor safety behaviors among their
crews (Zohar, 2011). Ultimately, any effort to monitor and control occupational health and
safety in the construction industry requires buy-in from supervisors such that they are not only
leading by example, but also actively engaging their crews in safety practices (Zohar, 2002).
However, an understanding of why and how supervisors come to perform these types of safety
behaviors is unclear.
1.1. Safety behaviors and the factors that influence them
1.1.1. Types of safety behaviors
Safety behaviors are typically conceptualized as behaviors that are task related and
behaviors that are contextually related to safety specific job-tasks. Task oriented safety
behaviors involve behaviors that directly contribute to job site safety (e.g., following safety
procedures) whereas contextual behaviors indirectly contribute to job site safety (e.g., promoting
the safety program) (Borman & Motowidlo, 1997; Griffin & Neal, 2000). Meta-analyses have
141

linked positive safety behaviors to fewer incidents and injuries on the job (Christian, Bradley,
Wallace, & Burke, 2009; Clarke, 2006; 2010). Among construction supervisors, both types of
safety behaviors are important not only for their personal safety, but also for the safety of their
crews. Supervisors who follow all safety policies and procedures model safe behaviors for their
crews. They demonstrate to their crews that following company safety policies and procedures
is an important facet of job performance. Furthermore, supervisors who promote safe practices
and put in extra effort to ensure a safe workplace convey a value and priority for safety on, as
well as off, the job. Supervisors who perform both types of safety behaviors (task and
contextual) on the job communicate that safety is valued and expected on the job, which
ultimately influences crew safety climate perceptions and other important safety outcomes (S. E.
Biggs, Banks, Davey, & Freeman, 2013; Gittleman et al., 2010; Kines et al., 2010).
1.1.2. Safety climate perceptions
A work environment where safety is talked about, planned for, and ultimately valued
regardless of production schedules is an environment conducive to positive safety climate
perceptions. Prior research has linked positive worker safety climate perceptions to positive
safety outcomes (e.g., safety knowledge and behaviors) (Christian et al., 2009; Clarke, 2006;
2010), and in some cases longitudinal research designs found support for a causal relationship
between safety climate and safety outcomes (Pousette, Larsson, & Törner, 2008).
Alternatively, a lack of attention to safety issues and behaviors that reflect other priorities may
have negative effects on job site safety climate. This is often fueled by workers’ perceptions
that management clearly values adhering to production schedules rather than to safety
practices. Thus, supervisors may be more unlikely to behave safely if they feel under pressure
to meet production demands, and unsupported by their contractor (Conchie, Moon, & Duncan,
2013).
142

1.1.3. Safety climate knowledge
Based on prior safety climate research, there is evidence that safety knowledge
mediates the relationship between safety climate perceptions and personal safety behaviors
(Christian et al., 2009; Griffin & Neal, 2000; Neal, Griffin, & Hart, 2000). An indirect effect in this
case asserts that the link between safety climate perceptions and personal safety behaviors
occurs because workers have adequate knowledge of methods to be safe. This relationship is
based on Campbell’s theory of performance that includes the antecedents (e.g., climate) and
determinants (i.e., knowledge, skill, and motivation) of performance (Neal et al., 2000). Work
environments with a positive safety climate are more likely to have workers who are trained in
methods of how to be safe, and workers who understand how to be safe will perform safe
behaviors more frequently. This area of research within the construction industry, however, has
only investigated general safety knowledge (e.g., “I understand the health and safety regulations
relating to my work” (Griffin & Neal, 2000) and did not stratify by job position (e.g., journeymen,
foremen, superintendents) to understand their relative influence on workers safety perceptions.
Among construction supervisors (foremen, superintendents, project managers),
knowledge specific to safety climate may be an important determinate of their safety related
behaviors. Supervisors who understand their own role in worker’s perception of safety climate
may be more likely to frequently promote safety among their crews. In the present study, the
domain of supervisor specific safety climate knowledge includes two components. First,
supervisors should have a general notion of what safety climate is. Supervisors should
understand that their crew’s safety climate perceptions reflect a supervisor’s pattern of
prioritizing and valuing safety over time (Zohar, 2011). Supervisors should understand that
safety climate is most often measured through perception surveys that ask workers questions
related to company safety policies, procedures, and practices, and is considered to be a leading
(i.e., proactive) indicator of occupational health and safety. Since safety climate measurements
often tap into management’s safety practices (Flin, Mearns, O'Connor, & Bryden, 2000; Kines et
143

al., 2011; Zohar & Luria, 2005), supervisors should understand they are important indicators of
safety climate perceptions. Second, supervisors should understand the safety leadership
behaviors that influence safety climate perceptions. Specifically, supervisors should know how
to involve and empower their workers in job site safety (Gillen et al., 2004; Törner & Pousette,
2009). They should also be aware of how to give their workers feedback on their safe and
unsafe behaviors (Hofmann & Morgeson, 2004; Kines et al., 2010). Finally, when safety-
specific problems arise, supervisors should know to proactively address them as part of their
work routine (Zohar, 2007).
The present study tested the hypothesized following relationships in Figure 5 among a
sample of construction industry supervisors. First, there would be significant, direct
relationships among all study variables. Second, the relationship between safety climate and
both types of safety behaviors would be partially mediated by safety climate knowledge.
Figure 5. Hypothesized relationship between safety climate, safety climate knowledge, and safety behaviors
Safety compliance behaviors
Safety participation behaviors
Safety climate
knowledge
Safety climate
144

Chapter 2
Methods
2.1. Participants
The present study utilized a sub-set of the data reported in a previous study (Schwatka
& Rosecrance, 2014). Ninety-one supervisors from three medium sized contractors in the
United States participated in the study. The supervisors were foremen (53%), general foremen
(20%), field foremen (10%), project managers (9%), superintendents (7%), and project
coordinators (1%). The majority of them were from the sheet metal trade (44%); others were
pipefitters (33%), plumbers (7%), steamfitters (6%), plumbers and pipefitters (3%) or
unspecified (7%). The average age of the supervisors was 44 years (SD = 8.5) and 95% of
them were male. They had worked for their company an average of 5.42 years (SD = 5.33).
2.2. Measures
Safety climate: Safety climate perceptions were measured with an adapted version of
the Nordic safety climate questionnaire (Kines et al., 2011) tested in a previous study by
Schwatka and Rosecrance (2014). A global safety climate score was created based on
responses to questions related to top management, supervisor, and co-worker safety response
(24 items). Top management and supervisor safety response represented safety commitment,
empowerment, and justice questions. For example, “Top management places safety before
production” and “My current, immediate supervisor encourages employees to participate in
decisions which affect their safety.” Co-worker safety response represented safety commitment
questions. For example, “My co-workers and I help each other to work safely.” Responses to
questionnaire items were scored on a Likert scale ranging from 0-6, never to always. See
Appendix 4.I and Appendix 4.II for a description of each factor and their respective questions.
Safety climate knowledge: Supervisors were asked to complete multiple choice,
true/false, and open-ended questions relating to safety climate knowledge that was developed
145

by the researchers. The questionnaire items employed in the present study are outlined in
Appendix 5.I. Each of two research team members graded the open-ended questions, and the
question’s score was derived from the average score given by the two raters. A total safety
climate knowledge score was then given for each supervisor (out of 14 points), where higher
scores indicate greater knowledge.
Safety behaviors: Safety behaviors were measured with Neal et al.’s (2000) measure of
safety performance that includes two factors, safety compliance (3 items) and safety
participation (3 items). Sample items include, “I use the correct safety procedures for carrying
out my job” and “I voluntarily carry out tasks or activities that help to improve workplace safety.”
Responses were scored on a Likert scale ranging from 0-6, never to always. See Appendix 4.I
and Appendix 4.II for a description of each factor and their respective questions. The University
Institutional Review Board approved all methods.
2.3. Statistical analyses
Internal consistency reliability (chronbach’s alpha) was computed to justify the use of
mean scores as study variables. Given that all alpha values were greater than 0.70, there was
adequate justification to create mean scores (see Table 13). Mean scores were computed and
descriptive statistics were generated in SPSS version 21. The conceptual model presented in
Figure 1 was specified as a path analysis in Mplus, Version 7 (L. K. Muthen & Muthen, 2012). A
full information maximum likelihood estimator that appropriately accounts for missing data was
used (Kline, 2011). Model fit was not assessed because the hypothesized path model fit the
data perfectly (i.e., it was a completely saturated model).
146
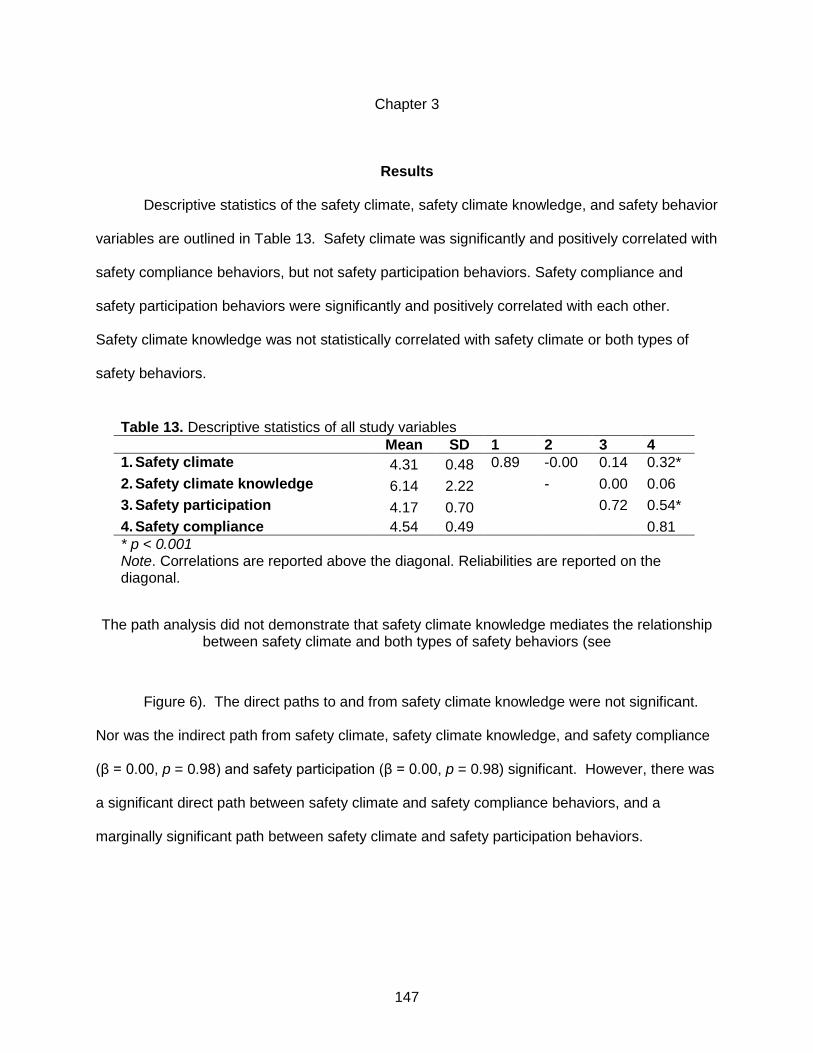
Chapter 3
Results
Descriptive statistics of the safety climate, safety climate knowledge, and safety behavior
variables are outlined in Table 13. Safety climate was significantly and positively correlated with
safety compliance behaviors, but not safety participation behaviors. Safety compliance and
safety participation behaviors were significantly and positively correlated with each other.
Safety climate knowledge was not statistically correlated with safety climate or both types of
safety behaviors.
The path analysis did not demonstrate that safety climate knowledge mediates the relationship between safety climate and both types of safety behaviors (see
Figure 6). The direct paths to and from safety climate knowledge were not significant.
Nor was the indirect path from safety climate, safety climate knowledge, and safety compliance
(β = 0.00, p = 0.98) and safety participation (β = 0.00, p = 0.98) significant. However, there was
a significant direct path between safety climate and safety compliance behaviors, and a
marginally significant path between safety climate and safety participation behaviors.
Table 13. Descriptive statistics of all study variables Mean SD 1 2 3 4
1. Safety climate 4.31 0.48 0.89 -0.00 0.14 0.32* 2. Safety climate knowledge 6.14 2.22 - 0.00 0.06 3. Safety participation 4.17 0.70 0.72 0.54* 4. Safety compliance 4.54 0.49 0.81 * p < 0.001 Note. Correlations are reported above the diagonal. Reliabilities are reported on the diagonal.
147

Figure 6. Final path model for relationships between safety climate, safety climate knowledge, and safety behaviors
0.32*
0.20+
Safety compliance behaviors
Safety participation behaviors
Safety climate
knowledge
Safety climate
-0.01
0.01
0.00
0.02
0.10
0.00
0.17*
*p < 0.001, +p = 0.17 Note. Values in italics represent variance explained
148

Chapter 4
Discussion
The purpose of the present study was to determine if construction supervisor’s knowledge of
safety climate mediated the relationship between their perceptions of safety climate and their
personal safety behaviors. Contrary to the study’s hypothesis, safety climate knowledge was
not related to the study variables. Supervisors’ perceptions of safety climate was associated
with their personal safety behaviors, but this relationship was not mediated by safety climate
knowledge. Although these results did not support the initial study hypothesis, they indicate that
construction supervisors do comply with safety rules and procedures, and actively promote their
contractor’s safety program if they perceive that their top management, supervisor, and co-
workers are committed to safety. While the study results suggest that it may not be necessary
for construction industry supervisors to understand safety climate concepts, it may be more
likely that supervisor safety climate knowledge is more related to safety climate-specific
improvement behaviors (e.g., involving crews in safety program) or to their style of safety
leadership (i.e., safety-specific transformational leadership).
Supervisors mean safety climate knowledge score was relatively low (6.14 out of 14 total
possible points, SD = 2.22). Thus, the construction supervisors in our sample were relatively
unaware of what safety climate was and they did not know what safety leadership actions they
should undertake to influence safety climate. However, our results suggest that it may not
matter how much knowledge of safety climate that supervisors have in terms of their safety
behaviors. Supervisors can perform positive safety behaviors as a result of their own positive
safety climate perceptions regardless of how much they know about safety climate.
The present study provides inconclusive evidence for the hypothesized relationship
between safety climate knowledge and safety climate and safety behaviors. The extremely
small coefficients combined with the high non-significance levels relating safety climate
149

knowledge to the other study variables indicates that there is no relationship. However, these
results may be due to either the way safety climate knowledge was measured or indicative of
safety climate knowledge’s relationship with other variables not measured.
The questions generated to measure safety climate knowledge were based on safety
climate and safety-specific leadership theories, but the wording and structure of some items
may have impacted our results. A combination of true/false, multiple choice and open-ended
questions were chosen to ascertain supervisor’s knowledge. The answers to the open-ended
questions were challenging to assess, as there was considerable variation in responses.
Multiple graders were utilized in order to overcome a grading bias, however some error may
have occurred. Additionally, the closed-ended questions may have been confusing, thus
reducing the sensitivity of the knowledge test to detect accurate safety climate knowledge.
Lastly, the safety climate knowledge variable in the present study was considered to be a
“grade.” Prior attempts to measure safety knowledge relied on question responses that were
Likert in nature (Griffin & Neal, 2000). Perhaps the results would have been different if safety
climate knowledge questions were phrased in a different manner (e.g., “I know how to involve
my crews in workplace safety”)?
Safety climate knowledge may be more related to variables not included in this study.
Prior research that linked safety climate, safety knowledge, and safety behaviors was based on
a safety behavior variable that was measured in a general manner (Christian et al., 2009; Griffin
& Neal, 2000; Neal et al., 2000). Safety behaviors reflected overarching actions to keep oneself
and the work site safe (e.g., “I use the correct safety procedures for carrying out my job”) (Neal
et al., 2000). Safety climate knowledge may be more related to specific safety climate
improvement behaviors (e.g., “I involve my work crew in the safety program”).
Additionally, safety climate knowledge may be related to safety specific transformational
leadership (SSTL). SSTL is measured by asking workers to rate their manager on four aspects
of safety specific transformational leader behaviors (e.g. “My supervisor encourages me to
150
express my ideas and opinions about safety at work”). Prior research linked SSTL to higher
safety climate perceptions and other safety outcomes (Barling, Loughlin, & Kelloway, 2002;
Kelloway, Mullen, & Francis, 2006; Mullen, Kelloway, & Teed, 2011). Thus, leaders who adopt
a transformational style of leadership are likely to positively influence worker safety climate
perceptions and other safety outcomes. Furthermore, leaders who understand the concept of
safety climate may be more likely to display a safety leadership style with transformational
qualities or vice versa. Future research should investigate this potential causal or reciprocal
relationship as it has implications for safety leadership training for supervisors. For example, in
Mullen and Kelloway’s (2009) SSTL intervention, they found that SSTL training for supervisors
increased their worker’s safety climate perceptions. It would be interesting to determine if the
addition of safety climate concepts in such training would impact safety outcomes above and
beyond a more limited SSTL intervention. Supervisors who understand safety climate concepts
may be more motivated to adopt SSTL qualities, as they will understand how their actions
influence the safety climate of their job sites and ultimately their worker’s safety outcomes.
The present study’s results are similar to findings from our previous study, which tested
the safety climate and safety behavior model without the inclusion of safety climate knowledge
and with a more diverse construction sample (i.e., crews and supervisors) (Schwatka &
Rosecrance, 2014). Despite differences in the way safety climate was represented (i.e.,
globally or by multiple factors), the direct relationships between safety climate and both types of
safety behaviors were similar. The present study’s sample size limited our ability to accurately
test for measurement equivalence across company position. However, the similarity in findings
provides preliminary evidence for a model of safety climate and safety behaviors that is
consistent across company position. There is some evidence for measurement equivalence of
safety climate measurements across construction trades and worker ethnicities (Cigularov,
Adams, Gittleman, Haile, & Chen, 2013a; Cigularov, Lancaster, Chen, Gittleman, & Haile,
2013b), but no studies known to the researchers have tested for similarities between company
151
position. Since it is common to compare responses between company position within the
construction industry (Gilkey et al., 2012; Gittleman et al., 2010), measurement equivalence
testing will provide the necessary justification to continue to compare mean scores across
company positions.
4.1. Limitations
While the present study provided some interesting preliminary answers to questions
regarding supervisor safety climate knowledge, the study’s limitations should be kept in mind.
First, the study design was cross sectional, and thus causal assumptions cannot be made.
Because of this, we can only determine if the models are consistent or inconsistent with
mediation, and not that mediation actually exists. Second, the study had a relatively small
sample, and may not be generalizable to a larger population of construction supervisors.
Additionally, the small sample size hindered our ability to analyze our data in a more
sophisticated manner that accounts for the latent structure of our study variables (i.e., structural
equation modeling). Other potential omitted variables may affect the hypothesized relationships
in this study (e.g., motivation to improve safety climate perceptions). Lastly, the relationships
studied may differ for different sized contractors, trades, geographical regions, etc., but our
study was not able to account for them.
4.2. Conclusion
The present study reaffirms prior research that suggests the relationship between safety
climate and safety behaviors is significant (Christian et al., 2009; Clarke, 2010). The results
extend previous research by demonstrating that this relationship is significant among site-
supervisors. Namely, supervisors with positive safety climate perceptions are likely to behave in
a safe manner. The importance of their participation in job site safety practices cannot be
understated. When supervisors model safe behaviors and engage their crews in safety
practices, they inform their crews that safety is important and valued. Crews who perceive that
safety is important and valued have positive safety climate perceptions. Thus, supervisors must
152

build and utilize safety leadership skills in order to improve the safety of their job sites. However,
methods to develop these skills are not well understood. The present study hypothesized that
supervisor safety climate knowledge was a critical link between their safety climate perceptions
and safety behaviors. The study’s findings suggest that future research should refine safety
climate knowledge measures and test it against measures of supervisor safety climate
improvement behaviors and safety-specific transformational leadership qualities.
153
References
Barling, J., Loughlin, C., & Kelloway, E. K. (2002). Development and test of a model linking safety-specific transformational leadership and occupational safety. Journal of Applied Psychology, 87, 488–496.
Biggs, S. E., Banks, T. D., Davey, J. D., & Freeman, J. E. (2013). Safety leaders' perceptions of safety culture in a large Australasian construction organization. Safety Science, 52, 3–12. doi:10.1016/j.ssci.2012.04.012
Borman, W. C., & Motowidlo, S. J. (1997). Task Performance and Contextual Performance: The Meaning for Personnel Selection Research. Human Performance, 10(2), 99–109. doi:10.1207/s15327043hup1002_3
Christian, M. S., Bradley, J. C., Wallace, J. C., & Burke, M. J. (2009). Workplace safety: A meta-analysis of the roles of person and situation factors. Journal of Applied Psychology, 94(5), 1103–1127. doi:10.1037/a0016172
Clarke, S. (2006). The relationship between safety climate and safety performance: A meta-analytic review. Journal of Occupational Health Psychology, 11, 315–327.
Clarke, S. (2010). An integrative model of safety climate: Linking psychological climate and work attitudes to individual safety outcomes using meta-analysis. Journal of Occupational and Organizational Psychology, 83(3), 553–578. doi:10.1348/096317909X452122
Conchie, S. M., Moon, S., & Duncan, M. (2013). Supervisors engagement in safety leadership: Factors that help and hinder. Safety Science, 51(1), 109–117. doi:10.1016/j.ssci.2012.05.020
Dingsdag, D. P., Biggs, H. C., & Sheahan, V. L. (2008). Understanding and defining OH&S competency for construction site positions: Worker perceptions. Safety Science, 46(4), 619–633. doi:10.1016/j.ssci.2007.06.008
Flin, R., Mearns, K., O'Connor, P., & Bryden, R. (2000). Measuring safety climate: identifying the common features. Safety Science, 34, 177–192.
Gillen, M., Kools, S., Sum, J., McCall, C., & Moulden, K. (2004). Construction workers' perceptions of management safety practices: A qualitative investigation. Work, 23(3), 245–256.
Gittleman, J. L., Gardner, P. C., Haile, E., Sampson, J. M., Cigularov, K. P., Ermann, E. D., et al. (2010). CityCenter and Cosmopolitan Construction Projects, Las Vegas, Nevada: Lessons learned from the use of multiple sources and mixed methods in a safety needs assessment. Journal of Safety Research, 41(3), 263–281.
Griffin, M., & Neal, A. (2000). Perceptions of safety at work: a framework for linking safety climate to safety performance, knowledge, and motivation. Journal of Occupational Health Psychology, 1, 347–358.
Hofmann, D. A., & Morgeson, F. P. (2004). The role of leadership in safety. In J. Barling & F. M. R (Eds.), The psyhcology of workplace safety (pp. 159–180). Washington, DC: American Psychological Association.
Kelloway, E. K., Mullen, J., & Francis, L. (2006). Divergent effects of transformational and passive leadership on employee safety. Journal of Occupational Health Psychology, 11(1),
154

76–86. doi:10.1037/1076-8998.11.1.76
Kines, P., Andersen, L. P. S., Spangenberg, S., Mikkelsen, K. L., Dyreborg, J., & Zohar, D. (2010). Improving construction site safety through leader-based verbal safety communication. Journal of Safety Research, 41(5), 399–406. doi:10.1016/j.jsr.2010.06.005
Kines, P., Lappalainen, J., Mikkelsen, K. L., Olsen, E., Pousette, A., Tharaldsen, J., et al. (2011). Nordic Safety Climate Questionnaire (NOSACQ-50): A new tool for diagnosing occupational safety climate. International Journal of Industrial Ergonomics, 41(6), 634–646. doi:10.1016/j.ergon.2011.08.004
Kline, R. B. (2011). Principles and practice of structural equation modeling. New York: The Guildford Press.
Mullen, J. E., & Kelloway, E. K. (2009). Safety leadership: A longitudinal study of the effects of transformational leadership on safety outcomes. Journal of Occupational and Organizational Psychology, 82(2), 253–272. doi:10.1348/096317908x325313
Mullen, J., Kelloway, E. K., & Teed, M. (2011). Inconsistent style of leadership as a predictor of safety behavior. Work and Stress, 25(1), 41–54.
Muthen, L. K., & Muthen, B. O. (2012). Mplus user's guide (7 ed.). Los Angeles: Muthen & Muthen.
Neal, A., Griffin, M. A., & Hart, P. M. (2000). The impact of organizational climate on safety and individual behaviour. Safety Science, 34, 99–109.
Pousette, A., Larsson, S., & Törner, M. (2008). Safety climate cross-validation, strength and prediction of safety behaviour. Safety Science, 46(3), 398–404. doi:10.1016/j.ssci.2007.06.016
Schwatka, N. V., & Rosecrance, J. C. (2014). From management to co-workers: The impact of safety climate perceptions on safety behaviors. Safety Science, Under Review.
Törner, M., & Pousette, A. (2009). Safety in construction – a comprehensive description of the characteristics of high safety standards in construction work, from the combined perspective of supervisors and experienced workers. Journal of Safety Research, 40(6), 399–409.
Zohar, D. (2002). Modifying supervisory practices to improve submit safety: A leadership-based intervention model. Journal of Applied Psychology, 87(1), 156–163.
Zohar, D. (2007). On the difficultly of promoting workers' safety behavior: Overcoming the underweighting of routine risks. Int. J. Risk Assessment and Management, 7(2), 122–136.
Zohar, D. (2011). Safety climate: Conceptual and measurement issues. In J. C. Quick & L. E. Tetrick (Eds.), Handbook of Occupational Health Psychology (2nd ed.). Washington DC: APA.
Zohar, D., & Luria, G. (2005). A multilevel model of safety climate: Cross-level relationships between organization and group-level climates. Journal of Applied Psychology, 90, 616–628.
155
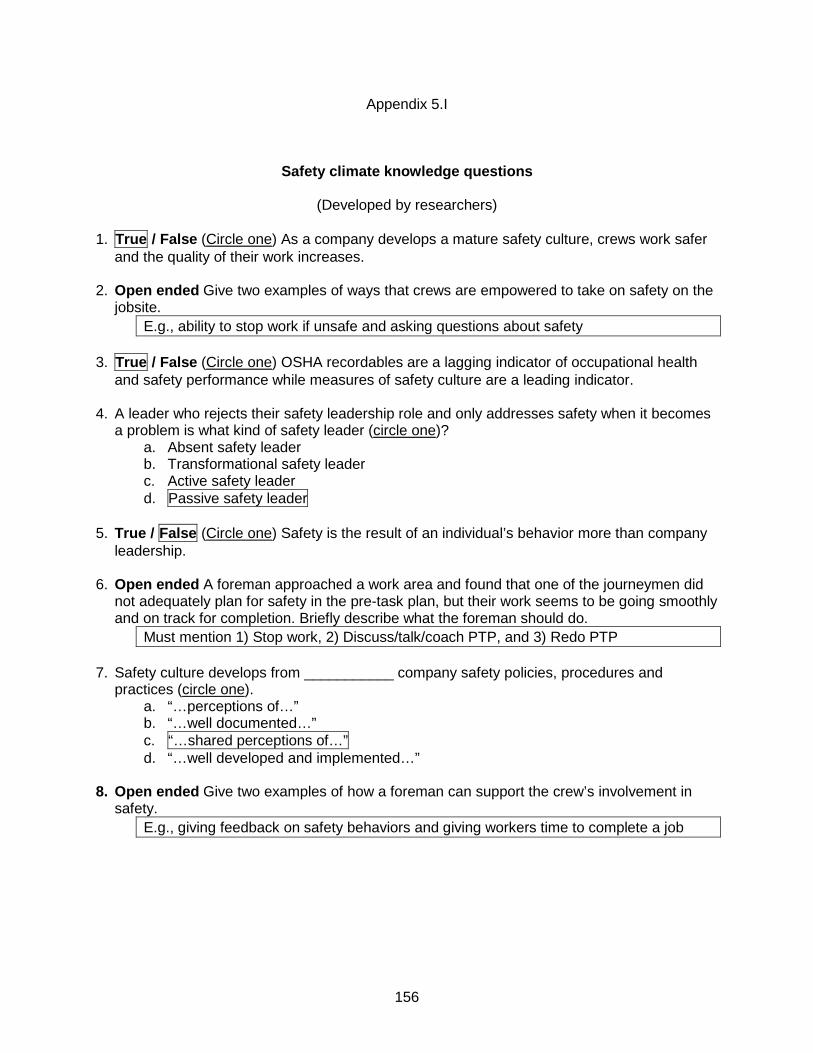
Appendix 5.I
Safety climate knowledge questions
(Developed by researchers) 1. True / False (Circle one) As a company develops a mature safety culture, crews work safer
and the quality of their work increases.
2. Open ended Give two examples of ways that crews are empowered to take on safety on the jobsite.
E.g., ability to stop work if unsafe and asking questions about safety
3. True / False (Circle one) OSHA recordables are a lagging indicator of occupational health and safety performance while measures of safety culture are a leading indicator.
4. A leader who rejects their safety leadership role and only addresses safety when it becomes
a problem is what kind of safety leader (circle one)? a. Absent safety leader b. Transformational safety leader c. Active safety leader d. Passive safety leader
5. True / False (Circle one) Safety is the result of an individual’s behavior more than company
leadership. 6. Open ended A foreman approached a work area and found that one of the journeymen did
not adequately plan for safety in the pre-task plan, but their work seems to be going smoothly and on track for completion. Briefly describe what the foreman should do.
Must mention 1) Stop work, 2) Discuss/talk/coach PTP, and 3) Redo PTP 7. Safety culture develops from ___________ company safety policies, procedures and
practices (circle one). a. “…perceptions of…” b. “…well documented…” c. “…shared perceptions of…” d. “…well developed and implemented…”
8. Open ended Give two examples of how a foreman can support the crew’s involvement in safety.
E.g., giving feedback on safety behaviors and giving workers time to complete a job
156

9. Which of the following are components of effective feedback (circle all that apply)? a. Discuss what specific behavior should be changed or repeated in the future b. Record all observations and discuss them at the next tool-box talk c. Describe what ideal or poor behavior was observed d. Discuss observations when there is a break in work (unless there is immediate
danger) e. Discuss the impact and consequences of the behavior
10.True /False (Circle one) A company that has a great safety culture knows that prioritizing
safety just as much as other organizational goals is more important than frequently communicating the value of safety to crews.
157

PART VI
Safety climate and safety leadership training for construction supervisors
158

Chapter 1
Introduction
Every construction company has its own unique safety culture that dictates “tacit ways of
perceiving, thinking, and reacting” towards safety, indeed it is “one of the most powerful and
stable forces operating in organizations” (Schein, 1996 pg. 231). Many contractors in the
construction industry use the term safety culture to describe their value for safety. It is also
commonly referred to as the way safety is treated when no one is looking. Research suggests
that building and sustaining a positive safety culture can result in safer and healthier working
conditions for construction workers (Guldenmund, 2000).
Safety climate, on the other hand, is a subset or snapshot of safety culture that may be
more easily measured and influenced (Denison, 1996). It is a subset of safety culture stemming
from the underlying organizational assumptions regarding safety and safety practices in the
workplace. Safety climate can be considered an “artifact” of culture, which can be tangibly
measured (Schein, 1990; 2010) by administering questionnaires that query workers about their
perceptions relating to company safety policies, procedures and practices. These perceptions
are often in reference to management’s safety actions (Flin, Mearns, O'Connor, & Bryden,
2000). Measures of safety climate can reflect the disparity between what management says
about safety and what they do in practice (Gittleman et al., 2010). Thus, best practices aimed at
improving safety climate should focus on management’s safety actions that are not only
endorsed, but also performed.
Although enforcement agencies such as OSHA (Occupational Safety and Health
Administration) require written safety policies and procedures, it is just as important for
management to actively demonstrate the practice of such policies. Construction workers often
describe this practice as “walk the talk.” This phrase goes back as far as Shakespeare’s play
Richard III when the evil Richard hires a man to murder his brother. The murder assures
159

Richard that he will back up his word with a deed, “Fear not, my lord, we will not stand to prate;
Talkers are no good doers: be assured. We come to use our hands and not our tongues”
(Shakespeare, I.iii.557-559).
1.1. Leader-focused safety climate intervention strategies
Safety climate perceptions are largely shaped by management’s words and actions.
Although top-level management may emphasize safety in written company policies, jobsite
foremen may focus their attention on production. Thus, their informal words and actions on site
(e.g., increasing accident risk to finish a job quickly) indicate to crews that safety is not the
priority. On construction job sites, the power of supervisors’ words and actions is illustrated in
Kosney et al.’s (2013) interview study with 35 workers. They found that reducing costs and
working faster was often emphasized as opposed to reinforcing safety. One worker even
recalled being laughed at after following procedures to report an injury saying,
“So, I ended up cutting my hand on a stud, when I…was [a] second year apprentice. So, I went to my foreman he started laughing at me you know, come on you’re a big baby. I am like I am not a big baby, you told me I have to report all accidents so I am doing what I am supposed to do. Are you going to fill out the report or you’re not going to fill out the report? Oh, you’re a big baby, so I am kind of, I am left there - what do I do right?” (pg., 446). After experiencing multiple events like these with their supervisors, crewmembers
develop perceptions of “how things are done around here.” These perceptions represent a
company’s safety climate, and are powerful enough to influence crew safety outcomes such as
knowledge, motivation, behavior, and injuries and illnesses (Christian, Bradley, Wallace, &
Burke, 2009; Clarke, 2006; 2010; Goldenhar, Williams, & Swanson, 2003; Kines et al., 2011;
Nahrgang, Morgeson, & Hofmann, 2011; Pousette, Larsson, & Törner, 2008; Probst & Estrada,
2010; Probst, Brubaker, & Barsotti, 2008). Despite the empirical evidence regarding the
positive effects of a high safety climate, little has been done to actively influence safety climate
perceptions on construction job sites.
160

Based on prior research, there are three leader-based avenues to influence safety
climate perceptions. First, at the most basic level, safety specific communication between
management and employees is likely to positively influence safety climate perceptions (Zohar,
2002a). This is because, at its core, safety climate reflects perceptions of the priority of safety
over competing organizational goals (e.g., productivity). This inference is based on what
management says and does in practice, rather than what is promoted by the company. For
example, supervisors who talk about safety just as much as getting the job done on time are
more likely to promote a positive safety climate than those who do not. A climate for safety,
good or bad, ultimately forms from shared worker perceptions of this pattern of management
practices (Zohar, 2011). Second, leaders who go beyond simply communicating about safety
with employees to developing quality relationships marked by open communication (i.e., leader
member exchange) are also likely to have a positive impact on worker’s safety climate
perceptions (Hofmann, Morgeson, & Gerras, 2003). Third, and perhaps as an exemplar,
leaders who develop a leadership style with transformational qualities can positively influence
safety climate perceptions (Barling, Loughlin, & Kelloway, 2002; Kelloway, Mullen, & Francis,
2006; Zohar, 2002b). These qualities include being role models, inspiring workers to be safe for
the sake of the group, challenge worker’s perceptions about safety to encourage them to
develop innovative and improved safety methods, and lastly conveying an active interest in
worker’s safety that goes beyond company or government requirements (Barling et al., 2002).
Of the studies that attempted to enhance safety climate perceptions by translating this
knowledge into practice, only one study was within the construction industry. A few studies
have addressed methods to increase leader’s safety specific communication with workers
(Zohar, 2002a; Zohar & Luria, 2003; Zohar & Polachek, 2013); one study was within the Dutch
construction industry (Kines et al., 2010). No studies investigated methods to improve safety-
specific leader member exchanges. Finally, only one study attempted to enhance safety
specific transformational leader behaviors through leadership training workshops (Mullen &
161

Kelloway, 2009). All of these studies found promising results and provide evidence for leader-
focused interventions to improve safety climate perceptions. Yet, none have explored methods
of training supervisors on the principles of safety climate and the role they play in the
development and maintenance of climate. This type of training could be a supplement to typical
occupational health and safety (OHS) training such that leaders will not only understand how to
be safe but also how to influence the safety of their crew members. Formal training on safety
climate for supervisors could provide a structured approach to alert them to the importance of
their safety specific actions, and learn what is expected of them (Hale & Borys, 2013).
The importance of safety climate is understood among many construction industry
stakeholders (Laboers' Health and Safety Fund of North America, n.d.). It was also the sole
topic of a joint National Institutional Occupational Safety and Health (NIOSH), Center for
Construction Research and Training (CPWR), and National Occupational Research Agenda
(NORA) one-day workshop with participants from industry, academia, and governmental
agencies (CPWR, 2013). Furthermore, studies aimed at improving safety culture were identified
as one of the top ten priorities identified by the Construction Section of the National
Occupational Research Agenda (2008). Thus, validated safety climate training may be well
received among numerous construction industry stakeholders.
1.2. Present study
The purpose of the present study was to develop and evaluate a safety climate
intervention for site supervisors (site superintendents, foremen, engineering managers) in the
construction industry using a pre-post, control group design. The first aspect of the intervention
was a workshop to teach supervisors about safety climate and safety leadership. The
objectives of the training were to educate supervisors on safety climate, the effects of a positive
and negative climate, how their style of leadership impacts safety climate, and the specific steps
they can take to improve safety climate among their crews. The second aspect of the
intervention was two progress checks designed to assess their progress towards meeting goals
162

set during the training, and to engage the supervisor’s manager in the process. The
intervention was not designed to be a leadership-training program nor did it include traditional
OHS training concepts (e.g., personal protective equipment, safety management plans, OSHA
regulations). Additionally, the training was not designed for crewmembers (i.e., pre-apprentices,
apprentices, journeymen), but intervention effects were expected to trickle down from
supervisors to their crews (Zohar, 2011). The theoretical background and specifics of the
intervention is described in the methods section.
The study was designed to answer two primary research questions: 1.) Can an
intervention composed of a workshop plus progress checks result in positive safety outcomes,
and 2.) Can the addition of progress checks to the workshop enhance the treatment effect? The
safety outcomes addressed in this study were three safety climate indicators (top management,
supervisor, and co-worker), safety behaviors (safety participation and safety compliance), safety
climate knowledge, and training transfer behaviors. It was hypothesized that an intervention
with both the workshop and the progress checks would enhance the training transfer
environment, and thus greater improvements in safety outcomes would be observed as
opposed to the workshop alone. Furthermore, regardless of intervention type, it was
hypothesized that positive, significant trends would be observed among all study variables
except the top management safety climate outcome. This was because the intervention was
focused on supervisors, and supervisors who improve their safety leadership behaviors are
likely to influence worker’s supervisor safety climate perceptions. Furthermore, supervisors are
likely to influence worker involvement in safety and thus an equal rise in worker’s co-worker
safety climate perceptions and personal safety behaviors was expected.
163

Chapter 2
Methods
2.1. Study design & participants
The effectiveness of the two intervention components, workshop and progress checks,
was evaluated with a pre-post, quasi-experimental design. Three companies were recruited to
participate. Two of these companies participated in the workshop only and one company
participated in both the workshop plus progress checks. There was no treatment control group.
See Figure 1 for detailed information on study design.
The three contractors participating in the study were mechanical contractors in the
Pacific Northwest region of the United States. All companies worked in the same geographical
region, were active in a local construction safety group, employed similar trades, worked on
similar jobsites, and were medium sized construction firms (60-300 employees). All front-line
supervisors (i.e., foreman, general foremen and superintendents) were asked to participate in
the intervention components and evaluation surveys. If appropriate, project managers and
project engineers participated as well. All crewmembers of the supervisors (i.e., pre-
apprentices, apprentices, and journeymen) were asked to participate in all surveys except for
the 2nd baseline and immediate follow-up surveys, which occurred the same day as the
supervisor workshops. The University Institutional Review Board approved all methods.
164

Figure 7. Study design
Intervention Component
Wave of data collection
Variables measured
Study month
Variables measured
Intervention group
Baseline 2
Supervisor Surveys:
HTM, HSUP, CSC, SP, SC, SCK
Immediate follow-up
Supervisor Surveys:
SCK, WSR
3-Month follow-up
Supervisor Surveys:
HTM, HSUP, CSC, SP, SC, SCK, TTB
Crewmember Surveys:
HTM, HSUP, CSC, SP, SC
6-Month follow-up
Supervisor Surveys:
HTM, HSUP, CSC, SP, SC, SCK, TTB
Crewmember Surveys:
HTM, HSUP, CSC, SP, SC
Supervisor Workshops Supervisor Progress Checks
1 2 & 3 7 10
Crewmember Surveys:
Baseline 1
Supervisor Surveys:
HTM, HSUP, CSC, SP, SC, SCK
HTM, HSUP, CSC, SP, SC
0
Group 1: Workshop plus progress checks
Group 2: Workshop only Group 2: Workshop only
Note. HTM = Top management safety climate, HSUP = Supervisor safety climate, CSC = Co-worker safety climate, SP = Safety participation, SC = Safety compliance, SCK = Safety
climate knowledge, WSR = Workshop reaction, TTB = Training transfer behaviors
165

Workshops were delivered in a series of small groups of approximately 12-15
supervisors. They took place in company offices or union halls, and each lasted four hours. For
supervisors that were part of the workshop plus progress check condition, the manager’s of
supervisors participating in the intervention were asked to schedule short on-on-one meetings
(approximately 15 minutes in length) with each of the supervisors in the intervention that they
are in charge of. The meetings occurred one time per month for the following two months. The
managers did not receive training on the progress check methods; rather each supervisor-
manager pair followed a progress check guide with discussion questions and spaces to record
answers (see Appendix 6.I.). All progress checks were collected immediately after each
meeting, content analyzed by the researchers, and results were reported back to the company’s
existing safety committee during their monthly committee meeting.
As per requests from the participating companies, crewmembers were not matched to
their respective supervisor due to concerns of anonymity. Participants’ surveys were tracked
based on a unique identifier that the participant wrote on the top of their survey (i.e., 2 digits of
day of birth, last 2 digits of phone number, last 2 digits of social security number).
2.2. Intervention components
2.2.1. Workshop
A needs assessment identified the requisite safety climate and safety leadership
knowledge that construction supervisors should possess (see Appendix 6.II for the workshop
outline). The content was designed around the five specific components of ACTIVE safety
leadership:
Always 1 Communicate your value of safety to your crew frequently, 2 Treat safety with the same priority as other organizational goals, 3 Involve crews in safety analyses and pre-task planning, 4 Voice your feedback when you see safe and unsafe behaviors, 5 Empower crews to actively take on safety on the job.
166

The training was designed to include an appropriate balance between information given,
discussion and practice. This included a consideration of what construction workers typically
prefer in terms of training: engagement, based on reality, and the use of adult learning principles
(Burke et al., 2011; Kaskutas et al., 2010; Lipscomb, Dale, Kaskutas, Sherman-Voellinger, &
Evanoff, 2008). All content was applicable to the regional construction industry and trades in
which the participating companies operate. Video vignettes facilitated learning and elicited
discussion on the key concepts addressed in the workshop. Other interactive aspects included
a leadership self-assessment exercise and a feedback themed role-play exercise. Each trainee
received a training workbook that contained all the information discussed in the training.
Supervisors’ motivation to learn was addressed by appealing to their personal stake in
the development and maintenance of safety climate perceptions of their crews. This was
addressed throughout the workshop by educating them on safety climate principles, but also
engaging them in a discussion about their personal safety specific experiences with previous
supervisors and as a supervisor themselves.
2.2.2. Progress checks
Strategies to help supervisors transfer learned concepts to their jobs included goal
setting and employing the support of the supervisor’s managers in the progress checks. At the
end of the workshop, trainees were given time to write down four specific goals that they wanted
to work towards over the next few months in their workbook. They were asked to refer back to
material discussed during the training and to write down SMART goals (i.e., specific,
measureable, actionable, relevant, and time oriented). Setting specific goals helps trainees to
purposefully direct their actions, regulate their effort, and ensure persistence. Their commitment
to them depends on their ability to believe that it is possible (self-efficacy) and important.
Supervisor’s acknowledgement and encouragement of training can aid in goal attainment (Al-
Eisa, Furayyan, & Alhemoud, 2009; Latham & Locke, 1991). Thus, the progress checks were
167

conducted in house between supervisors and their manager to help foster the communication
and support that is necessary for goal attainment.
2.3. Intervention evaluation
2.3.1. Process evaluation
A process evaluation was used to account for how the intervention was implemented
and the processes that either helped or hindered its implementation. The process evaluation
components followed those outlined in Saunders (2005): fidelity, dose delivered (completeness),
dose received (exposure), reach, and context.
2.3.2. Outcome evaluation
Training content and design. Members of the construction industry evaluated the
workshop and progress check materials developed by the research team to ensure that the
content was understandable and applicable to the construction industry. This occurred during
one of the participating contractor’s safety committee meetings. Following each workshop,
participants were asked to complete workshop reaction questionnaires. The reaction questions
were used to evaluate the workshop materials, content and delivery (see Appendix 6.III.).
Sample items include, “I consider the training highly relevant to my job” and “The training
materials are too simple and basic; they do not challenge trainees with anything new.”
Responses were scored on a Likert scale ranging from 0-6, strongly disagree to strongly agree.
These evaluations also serve as process evaluation indicators.
Changes in learners. Supervisors were asked safety climate knowledge questions to
determine how effective the workshop was in conveying the concepts of safety climate and
active safety leadership (see Appendix 5.I). The specific true/false, multiple-choice, and open-
ended questions were developed based on the content of the workshop. Safety climate
knowledge questions had a total possible score of 14 points. The open-ended questions were
graded by two separate individuals who were blinded to when the questions were answered
(i.e., before or after the intervention), and the average of their score was the amount of points
168

given. Sample questions include, “As a company develops a mature safety culture, crews work
safer and the quality of their work increases” and “Give two examples of how a foreman can
support the crew’s involvement in safety.” Additionally, supervisors were asked to fill out
questions relating to training transfer behaviors during both follow-up surveys (Al-Eisa et al.,
2009; Machin & Fogarty, 2004) (see Appendix 6.II). A sample question is, “I have discussed
with my supervisor ways to apply the material that I learned in the leaders create culture training
program.” Responses were scored on a Likert scale ranging from 0-6, strongly disagree to
strongly agree.
Organizational payoffs. Even though the training was focused on leaders, positive
changes were expected among crews. Thus, an assessment of safety climate perceptions and
personal safety behaviors were completed among supervisors and their crews. Safety climate
was measured with a modified version of the Nordic safety climate questionnaire (Kines et al.,
2011). The measure reflects the safety responses of top management, supervisors, and co-
workers. Sample items include, “Top management ensures that everyone receives the
necessary information on safety,” “My current, immediate supervisor looks the other way when
someone is careless with safety,” and “My co-workers and I try hard together to achieve a high
level of safety.” Responses were scored on a Likert scale ranging from 0-6, never to always.
Safety behaviors were measured with Neal et al.’s (2000) measure of safety performance that
includes two factors, safety participation and safety compliance. Safety compliance measures
behaviors intended to comply with safety rules, whereas safety participation refers to behaviors
that go above and beyond complying to helping and promoting safety. Sample items include, “I
use the correct safety procedures for carrying out my job” and “I voluntarily carry out tasks or
activities that help to improve workplace safety.” Responses were scored on a Likert scale
ranging from 0-6, never to always. See Appendix 4.I and Appendix 4.II for a description of the
variables and their questions.
169

2.3.3. Statistical analysis
2.3.3.1. Data collection
The surveys were distributed and collected during normal business hours during pre-
scheduled meetings such as toolbox talks or safety meetings. The researchers distributed and
collected the majority of the surveys, but members of the company’s safety team distributed
surveys to workers that were not present when the researchers were on the jobsite. All surveys
were collected upon completion and placed into a sealed envelope, in which the researchers
collected and maintained at the university.
2.3.3.2. Data preparation
Within each wave of data, all questions for each respective outcome were averaged in
SPSS version 21. A safety climate knowledge score was given to each supervisor as previously
described. Surveys from all waves of data collection were then merged into one file by the
worker’s unique identifier they wrote on the top of their survey. Thus, only surveys with unique
identifiers were retained for data analysis Crewmembers unique identifiers were missing from all
three waves of data collection at 10%, 19%, and 16%. Supervisor’s unique identifiers were
missing from all five waves of data collection at 8%, 7%, 0%, 6%, and 9%. Four additional
crewmembers were removed from the dataset because they moved from one company to
another in the study at follow-up. One supervisor was removed for the same reasons as well.
See Table 1 for the study’s sample size at each wave of data collection after removing surveys
without unique identifiers and participants who changed companies during the study. See Table
14 for the study’s sample size at each wave of data collection after removing surveys without
unique identifiers and participants who changed companies during the study. Typical of the
construction industry, participating companies fluctuated in the number of employees throughout
the study. Thus, the number of employees participating in each wave of the surveys varied.
Supervisors and crewmembers’ data were analyzed separately because they played
different roles in the intervention. It is of note that supervisors were defined as individuals who
170

took the workshop and completed a 2nd baseline questionnaire. Supervisors who did not attend
the workshop but took surveys at other time points were included in the study, but coded as
crewmembers. This is because it is common for construction workers to move from journey
(crew) level positions to foremen (supervisor) level, and vice versa, from project to project.
See Table 15 for the response pattern of supervisors and crewmembers in each
intervention group. Among crewmembers, the final dataset containing all three waves of data
on the five outcomes contained a total of 608 uniquely identified workers with varying patterns of
missing data. For example, in the workshop plus progress check intervention group, 10 (4.2%)
crewmembers had complete data from all three waves of data collection. Within this same
intervention group, there were many uniquely identified individuals that only had information
from one wave of data (e.g., n = 82 at 3-month follow-up), but at least 25% of the uniquely
identified crewmembers had responses from at least two waves of data. Among supervisors,
the final dataset on all their outcomes contained 107 uniquely identified workers with varying
patterns of missing data. For example, in the workshop plus progress check intervention group,
only 6 (10%) supervisors had information on variables from all four waves of data. Within this
Table 14. Sample size by data collection wave, job position, and intervention group
Supervisors Crewmembers Intervention group Intervention group
Workshop + Progress Checks
Workshop
Workshop + Progress Checks
Workshop
Wave N
Wave N
Wave N
Wave N 1 26 1 14 1 94 1 119 2 61 2 46 3 47 3 40 4 24 4 16 4 132 4 192 5 8 5 13 5 82 5 155 Note. Waves of data collection = 1 (baseline 1), 2 (baseline 2), 3 (immediate follow-up), 4 (3-month follow-up), and 5 (6-month follow-up).
171

same intervention group, at least 57% of the uniquely identified supervisors from this
intervention group had responses from at least two waves of data.
Upon inspection, there was a significant missing data pattern for the variables top
management safety climate and supervisor safety climate among all workers. Namely, missing
data within these variables was more prevalent among workers in the workshop only
intervention group, as compared to workers in the workshop plus progress checks intervention
group and among crewmembers, as compared to supervisors. It was determined that the
missing data pattern between the workshop plus progress check and workshop only intervention
groups could in part be explained by tenure and time spent with current supervisor in the
analyses. Workers in the workshop plus progress checks intervention group worked for their
company and their current supervisor significantly longer than workers in the workshop only
intervention group, thus, these variable were included as covariates in the subsequent analysis
models. Correlations between intervention group and tenure and time spent with supervisor
ranged from 0.16 to 0.30 (p < 0.05) at each point in time. Workers in the full intervention group
might have felt like they had more time to judge questions relating to top management safety
climate and supervisor safety climate, and thus would not have left the question blank. Since
supervisors’ and crewmembers’ data were analyzed separately, the difference between missing
data was not controlled for.
172

Table 15. Pattern of study participation by data wave combination, job position, intervention group and variable studied Supervisors
Crewmembers
Workshop + Progress checks
Workshop
Workshop + Progress checks
Workshop
Variables: HTM, HSUP,
CSC, SP, & SC Variable:
SCK
Variables: HTM, HSUP, CSC, SP, &
SC Variable:
SCK
Variables: HTM, HSUP,
CSC, SP, & SC
Variables: HTM, HSUP,
CSC, SP, & SC Wave(s) N
Wave(s) N
Wave(s) N
Wave(s) N
Wave(s) N
Wave(s) N
2 26
2 10
2 21
2 5
1 61
1 81 1 & 2 10
1 & 2 1
1 & 2 3
2 & 3 16
4 82
4 118
2 & 4 7
2 & 3 16
2 & 4 7
2 & 5 1
5 37
5 100 2 & 5 1
1, 2 & 3 9
2 & 5 3
1, 2 & 3 3
1 & 4 14
1 & 4 16
1, 2 & 4 10
1, 2 & 4 2
1, 2 & 4 2
2, 3 & 4 7
1 & 5 9
1 & 5 7 2, 4 & 5 1
2, 3 & 4 7
1, 2 & 5 3
2, 3 & 5 2
4 & 5 26
4 & 5 37
1, 2, 4 & 5 6
2, 3 & 5 1
2, 4 & 5 1
1, 2, 3 & 4 2
1, 4 & 5 10
1, 4 & 5 10 Total 61
1, 2, 3 & 4 8
1, 2, 4 & 5 6
1, 2, 3 & 5 3
Total 239
Total 369
1, 2, 4 & 5 1
Total 46
2, 3, 4 & 5 1
2, 3, 4 & 5 1
1, 2, 3, 4 & 5 6
1, 2, 3, 4 & 5 5
Total 46
Total 61 Note. Waves of data collection = 1 (baseline 1), 2 (baseline 2), 3 (immediate follow-up), 4 (3-month follow-up), and 5 (6-month follow-up). The sample size at each combination of data wave(s) represents the number of participants with information from that data wave(s).
173

2.3.3.3. Latent growth modeling
Latent growth modeling (LGM) in Mplus version 7 was utilized to determine if the
intervention influenced change among the safety climate, safety behavior and safety climate
knowledge variables. LGM’s for supervisor’s scores on the safety climate (HTM, HSUP and
CSC) and safety behavior (SP and SC) variables were assessed at 4 time points (baseline 1,
baseline 2, 3-month follow-up, and 6-month follow-up). LGM’s for crewmember’s scores were
assessed at 3 time points (baseline 1, 3-month follow-up, and 6-month follow-up). The LGM for
supervisor’s SCK scores was assessed at 5 time points (baseline 1, baseline 2, immediate
follow-up, 3-month follow-up, and 6-month follow-up).
Unlike repeated measures ANOVA, LGM in Mplus allows researchers to determine
within and between individual differences in development over time, rather than just within
individual change over time. LGM is similar to multi-level modeling (MLM) in that the intercept
and slope can be modeled randomly, time is treated as a continuous variable, contextual effects
can be time variant or invariant, variance and covariance of observations overtime do not need
to be assumed to be equal, and missing data is handled well (Jackson, 2010; Kwok et al.,
2008). In LGM, however, the intercept and slope are treated as latent factors. LGM results can
be evaluated based on not only the significance of parameter estimates, but also the model fit
statistics (i.e., how does the hypothesized growth model fit the study’s data). Maximum
likelihood estimation (ML) was used, which appropriately handles missing data when the
missing data are missing at random, or the mechanism for missingness is available and
included in the model.
The trend and coding of time chosen for each outcome was initially set in a linear
fashion with time scores representing study month. In all LGMs in this study, baseline 1 was the
intercept and reference point for all change overtime. If a linear growth model did not fit the
data well, parameters (i.e., time scores) were freely estimated to allow for the determination of a
non-linear growth model (e.g., curved) (McArdle & D, 1987). Additionally, in some cases the
174

slope growth factor or the residual variance of one of the loadings had a non-significant zero or
very small negative variance, and was set to zero to allow for adequate model estimation (L.
Muthen & Muthen, 2008). The LGMs for each growth model were assessed via the chi-square
test, RMSEA, CFI/TLI, and SRMR. A non-significant chi-square test indicates that the
hypothesized model fits the data well. Smaller AIC, RMSEA (< 0.08) and SRMR (<0.08) values
and larger CFI (> 0.95) and TLI (> 0.95) values are indicative of good fitting models. Once the
trend and coding of time was determined for each LGM and the hypothesized LGM model was
determine to provide adequate fit to the data, the indicator of intervention type (i.e., workshop
only (coded as a 1), or workshop plus progress checks (coded as a 2)) was entered into the
model. As previously mentioned, tenure was included as a time varying covariate (e.g., tenure
reported at baseline 1 loaded onto top management safety climate at baseline 1) in the top
management safety climate conditional model and time with supervisor was included in the
supervisor safety climate conditional model to account for the missing data pattern. Since the
unconditional and conditional growth models were non-hierarchical, the final model was chosen
by examining the Akaike AIC values. If no appreciable change in fit was seen, the more
parsimonious model was kept (i.e., the unconditional growth model without the covariate).
The latent growth intercept, slope and estimated parameters in the present study can be
interpreted as follows. In a linear model,
Intercept growth factor = Mean outcome score at baseline 1
Slope growth factor = Mean growth per 1 month increase in time.
Model estimated mean at time point i = Intercept growth factor + (slope growth
factor*study month).
In a non-linear model,
Intercept growth factor = Mean outcome score at baseline 1
Slope growth factor = Mean growth from baseline 1 to data wave set to one
Estimated loadings = Latent time estimated by model
175

Model estimated mean at time point i = Intercept growth factor + (slope growth
factor*estimated loading).
Furthermore, comparisons between waves of data can be made not only by observing the
significance of the parameters but also the magnitude of change between mean scores. Such
comparisons determine at which time point the greatest “velocity” of change occurred (McArdle
& D, 1987).
176

Chapter 3
Results
3.1. Process evaluation
Fidelity and dose delivered. Overall, the workshop portion of the intervention was
implemented as planned and in accordance with theory. This was possible because the
workshop was outlined and scripted such that all workshops were consistent with each other,
and the same trainers were present at all workshops. Among the majority of the workshops,
however, it was often the case that more time was spent on earlier sections, leaving minimal
time for the concluding sections. The progress checks were guided by a worksheet in hopes
that the content of the checks would be consistent among all trainees. However, it was not
possible to track how much time was spent discussing progress and on some occasions
progress checks occurred among work groups rather than one-on-one as planned. This was
because some of the trainee’s supervisors either did not have enough time to schedule
separate progress checks or thought that a group discussion was best for their work group.
Dose received. All scheduled workshops (N=12) occurred as planned, but the progress
checks did not occur at both time points for all workshop participants in the full intervention
group (see Table 1). Just over half of those that participated in the workshop also participated
in the first progress check, and just over one quarter participated in the second round.
Reach. The majority of all supervisors at each company participated in the intervention,
resulting in 96% of all eligible supervisors the full intervention group and 100% in the partial
intervention group participating. Additionally, the majority of supervisors that participated in the
intervention continued to work at their respective company at the time of the final 6-month
follow-up survey, resulting in 93% of supervisors in the full intervention group and 91% of
supervisors in the partial intervention group.
177

Context. An important aspect of the study’s sample is the context in which many
participants worked. The geographical region in which the contractors work is known for an
above average safety record. This is in part due to a construction job site that has been in
constant construction for a couple of decades and the general contractor’s and local union’s
focus on safety.
3.1. Outcome evaluation
3.1.1. Supervisors
After the workshop, trainees were asked to answer questions related to the training
content and design. On a scale of 1-6, from completely disagree to completely agree, the
majority of trainees: 1) Rated the relevance of the training to their job at a 5 or above (95%), 2)
Rated the simplicity and challenging nature of the training at a 2 or below (73%), 3) Rated the
engagement of the training at a 5 or above (92%), 4) Rated the opportunity to demonstrate their
knowledge during training at a 5 or above (90%), 5) Rated the inability to apply training
knowledge to their job at a 2 or below (89%), 6) Rated the video’s helpfulness in understanding
training concepts at a 5 or above (90%), and 7) Rated their intent to strongly recommend the
training to other leaders in the industry at a 5 or above (84%).
During the 3 and 6-month follow-up surveys, trainees were asked questions related to
training transfer and to rate their level of agreement on a scale of 0-5 with the statement from
strongly disagree to strongly agree. At both 3 and 6-month follow-up, the majority of trainees
rated the transfer questions at a 4 and above. At 3-month follow-up, the majority of trainees
discussed with their supervisor and co-workers ways to apply the material (78% and 75%,
respectively), used the knowledge and skills learned (70%), found them to be useful (64%), and
found that it helped improve their job performance (68%). At 6-month follow-up, they discussed
with their supervisor and co-workers ways to apply the material (74% and 77%, respectively),
used the knowledge and skills learned (71%), found them to be useful (63%), and found that it
helped improve their job performance (69%). The intervention groups did not differ significantly
178

on their average training transfer behaviors score at 3-months (t = -0.64(114), p = .52) and 6-
months follow-up (t = 0.52(86), p = .60).
Supervisor safety climate knowledge was assessed via LGM among five separate waves
of data (baseline 1, baseline 2, immediate follow-up, 3-month follow-up, and 6-month follow-up).
Since baseline 2 and immediate follow-up were collected on the same day as the workshops,
their residuals were allowed to correlate. The linear LGM fit the data very poorly (AIC = 1218, χ2
= 47 (10), p < 0.01, RMSEA = 0.18, CFI = 0.59, TLI = 0.59, SRMR = 0.25), so a non-linear
model with free time scores was estimated (i.e., baseline 1 was set to 0 and 6-month follow-up
was set to 1, and all scores in between were freely estimated). The slope’s variance was
negative and non-significant, and thus was set to zero to allow for adequate model estimation
(L. Muthen & Muthen, 2008). The resulting model fit the data well (see Table 16). After
including the intervention group covariate in the model, the fit of the model was not improved
(AIC = 1187, χ2 = 14 (12), p = 0.26), so the unconditional growth model was retained. Thus, the
growth pattern of the safety climate knowledge was positive and did not depend on which
intervention group the supervisor was in. The greatest amount of growth, however, occurred
between baseline 2 and immediate follow-up. At baseline average knowledge scores were at
5.91 points, and immediately after the workshop it increased to 7.70 (i.e., intercept +
(slope*loading estimate), 7.70 = 5.91+(1.25*1.44)). This means that supervisors gained the
most knowledge immediately after the workshop, and their knowledge gain did not decrease to
baseline 1 levels at 6-months post intervention. Model estimated mean scores plotted by time
point are presented in Figure 8.
179

Table 16. Supervisors univariate latent growth models for each study outcome
HTM
HSUP
CSC
Parameter estimate S.E.
P-value
Parameter estimate S.E.
P-value
Parameter estimate S.E. P-value
Intercept 4.36 0.05 0.00 4.45 0.05 0.00 4.57 0.04 0.00 Slope 0.00 0.01 0.89 -0.01 0.01 0.44 -0.02 0.01 0.02 Estimated loadings
Baseline 1 0.00 Baseline 2 1.00 Immediate follow-up + + + 3-month
follow-up 7.00 6-month
follow-up 2.47 1.22 0.04
Intercept variance 0.14 0.03 0.00 0.16 0.03 0.00 0.17 0.04 0.00
Slope variance * * * * * * * * *
Model fit AIC 264.00 282 222 X2 (df) 16.5 (7) 0.02 6.07 (7) 0.53 3.32 (4) 0.0501
RMSEA (95%CI)
0.11 (0.04-0.18)
0.00 (0.00-0.11)
0.00 (0.00-0.13)
CFI/TLI 0.83/0.86 1.00/1.00 1.0/1.0 SRMR 0.43 0.37 0.07
+Variable was not measured at this time point *Parameter was fixed to zero due to a non-significant zero or negative variance Note. LGMs for HTM, HSUP & SC were linear (0 1 7 10) and LGMS for HSUP (0 * * 1), CSC (0 1 7 *) and SP (0 * * 1) were non-linear. HTM (top management safety climate), HSUP (supervisor safety climate), CSC (co-worker safety climate), SP (safety participation behaviors), SC (safety compliance behaviors), SCK (safety climate knowledge)
180

Table 16. Continued
SP
SC SCK
Parameter estimate S.E. P-value
Parameter estimate S.E. P-value
Parameter estimate S.E. P-value
Intercept 4.07 0.12 0.00 4.54 0.05 0.00 5.91 0.27 0.00 Slope 0.15 0.10 0.16 0.00 0.01 0.99 1.25 0.34 0.00 Estimated loadings
Baseline 1 0.00 0.00 Baseline 2 1.09 0.26 0.00 0.51 0.19 0.01 Immediate follow-up + + 1.44 0.35 0.00
3-month follow-up 1.50 0.55 0.01 1.00 0.26 0.00
6-month follow-up 1.00 1.00
Intercept variance 0.72 0.32 0.02 0.15 0.04 0.00 2.36 0.45 0.00
Slope variance 0.18 0.25 0.46 0.00 0.00 0.47 * * *
Model fit AIC 379 238 1187
X2 (df) 4.65 (3) 0.20 1.98 (5) 0.85 14.18 (9) 0.11 RMSEA
(95% CI) .07 (0.00-0.19)
0.00 (0.00-0.07)
0.07 (0.00-0.14)
CFI/TLI .97/.94 1.0/1.0 0.94/0.94 SRMR 0.09 0.21 0.11
+Variable was not measured at this time point *Parameter was fixed to zero due to a non-significant zero or negative variance Note. LGMs for HTM, HSUP & SC were linear (0 1 7 10) and LGMS for HSUP (0 * * 1), CSC (0 1 7 *) and SP (0 * * 1) were non-linear. HTM (top management safety climate), HSUP (supervisor safety climate), CSC (co-worker safety climate), SP (safety participation behaviors), SC (safety compliance behaviors), SCK (safety climate knowledge)
181

Figure 8. Significant supervisor and crewmember model estimated mean scores
Linear LGMs for top management safety climate, supervisor safety climate and safety
compliance behaviors had good model fit. However, linear models for co-worker safety climate
(AIC = 230, χ2 = 16.2 (5), p < 0.01, RMSEA = 0.15, CFI = 0.83, TLI = 0.80, SRMR = 0.25) and
safety participation behaviors (AIC = 378, χ2 = 12 (7), p = 0.10, RMSEA = 0.08, CFI = 0.92, TLI
= 0.93, SRMR = 0.41) fit the data poorly. For co-worker safety climate, the scores at 6-month
follow-up were freely estimated, but the non-linear model fit the data poorly (AIC = 299, χ2 =
13.3 (5), p = 0.03, RMSEA = 0.12, CFI = 0.89, TLI = 0.87, SRMR = 0.22). Modification indices
suggested that the residuals of the baseline 1 and 6-month follow-up scores be allowed to
Note. Supervisor SCK scores were on a scale from 0-16. Supervisor SP and crewmember SP were on a scale from 0-5.
5.91
6.55
7.71
7.16 7.16
4.07 4.23 4.23 4.29
4.22
3.72 3.72 3.72
3.93 4.02
3
3.5
4
4.5
5
5.5
6
6.5
7
7.5
8
Baseline 1 Baseline 2 Immediatefollow-up
3-monthfollow-up
6-monthfollow-up
Mea
n sc
ore
Model estimated mean score at each time point
Supervisor safetyclimate knowledge
Supervisor safetyparticipationbehaviorsCrewmember safetyparticipationbehaviors
182

correlate. This improved the fit of the model (see Table 16 for the final results). It should be
noted that, in order for this analysis to run in Mplus, the residual variance of the 3-month follow-
up co-worker safety climate score had to be set to zero. However, setting it to zero significantly
changed the coefficient of the freely estimated time score (β = 1.99, p = 0.15 to β = 2.47, p
=0.04). For safety participation behaviors, the scores at baseline 2 and 3-month follow-up were
freely estimated (see Table 16). It should be noted that the linear LGM for top management
safety climate fit the data poorly; however, a non-linear model did not fit the data better (AIC =
267, χ2 = 15 (5), p < 0.01, RMSEA = 0.14, CFI = 0.82, TLI = 0.78, SRMR = 0.43). Thus, the
LGM for top management safety climate should be interpreted with caution. Once adequate
model fit was established, the intervention group covariate was added to each of the models in
Table 16. Among all outcomes, the inclusion of the intervention group covariate in the LGMs
did not improve the fit of the models. Compared to the AIC values in the unconditional growth
models in Table 16, the AIC values of the conditional growth models were either equal or larger
(top management safety climate AIC = 1346, supervisor safety climate AIC = 1379, co-worker
safety climate AIC = 224, safety participation AIC = 382, and safety compliance AIC = 239).
As can be seen in Table 16, there were significant growth trends among the co-worker
safety climate and safety participation behavior variables. Supervisor’s co-worker safety climate
declined significantly from baseline 1 to 3-month follow-up, but increased at 6-month follow-up
back to baseline 1 scores. However, since the coefficient of the freely estimated time score
changed significantly after setting one of the residual variances to zero, these results should be
interpreted with caution. Supervisor’s safety participation behaviors increased significantly over
time up until 3-months follow-up. However, their mean score at 6-months follow-up was not
significantly different from baseline 1. Supervisor’s top management safety climate, supervisor
safety climate and safety compliance behaviors did not change overtime. Model estimated
mean scores of safety participation behaviors plotted by time point can be seen in Figure 8.
183

3.1.2. Crewmembers
Linear LGMs for supervisor safety climate, co-worker safety climate, safety participation
behaviors, and safety compliance behaviors had good model fit (see Table 17). However, a
linear model for top management safety climate fit the data very poorly. Non-linear models with
freely estimated time scores would not converge, so the linear model with poor fit was retained.
Thus, top management safety climate results should be interpreted with caution. Once
adequate model fit was established, the intervention group covariate was added to each of the
models in Table 17. Among all outcomes, the inclusion of the intervention group covariate in
the LGMs did not improve the fit of the models. Compared to the AIC values in the
unconditional growth models in Table 4, the AIC values of the conditional growth models were
either equal or larger (top management safety climate AIC = 5414, supervisor safety climate
AIC = 4104, co-worker safety climate AIC = 1474, safety participation AIC = 1825, and safety
compliance AIC = 1293).
As can be seen in Table 17, there were significant linear growth trends in the safety
participation behavior variable. Crew’s safety participation behaviors increased from 3.72 at
baseline 1 to 3.93 at 3-months follow-up and to 4.02 at 6-months follow-up. Crew’s top
management safety climate, supervisor safety climate, co-worker safety climate and safety
compliance behaviors did not change overtime. Model estimated mean scores of safety
participation behaviors plotted by time point can be seen in Figure 8.
184

Table 17. Crewmember univariate latent growth models for each study outcome
HTM
HSUP
CSC
Parameter estimate S.E. P-value
Parameter estimate S.E. P-value
Parameter estimate S.E. P-value
Intercept 4.10 0.05 0.00 4.31 0.04 0.00 4.30 0.05 0.00 Slope 0.00 0.01 0.75 0.00 0.01 0.94 0.01 0.01 0.34 Estimated loadings
Baseline 1 3-month follow-up 6-month
follow-up Intercept variance 0.44 0.04 0.00 0.32 0.03 0.00 0.52 0.05 0.00
Slope variance * * * * * * 0.01 0.00 0.00
Model fit AIC 1610 1495 1472
X2 (df) 16 (3) 0.38 5.1 (3) 0.16 0.09 (2) 0.67 RMSEA
(95% CI) 0.08 (0.05-0.13)
0.3 (0.00-0.08)
0.00 (0.00-0.06)
CFI/TLI 0.88/0.88 0.98/0.98 1.0/1.0 SRMR 0.10 0.07 0.01
*Parameter was fixed to zero due to a non-significant zero or negative variance Note. LGMS for HSUP, CSC, SP & SC were linear (0 7 10) and the LGM for HTM (0 1 *) was non-linear. HTM (top management safety climate), HSUP (supervisor safety climate), CSC (co-worker safety climate), SP (safety participation behaviors), SC (safety compliance behaviors)
185

Table 17. Continued
SP
SC
Parameter estimate S.E.
P-value
Parameter estimate S.E.
P-value
Intercept 3.72 0.06 0.00 4.38 0.04 0.00 Slope 0.03 0.01 0.00 0.01 0.01 0.24 Estimated loadings Baseline 1 3-month follow-up 6-month
follow-up Intercept variance 0.46 0.04 0.00 0.18 0.02 0.00
Slope variance * * * 0.00 0.00 0.31
Model fit AIC 1824 1292 Chi-square (df)
1.71 (3) 0.64
3.14 (2) 0.37
RMSEA (95% CI)
0.00 (0.00-0.06)
0.01 (0.00-0.07)
CFI/TLI 1.0/1.0 0.99/0.99 SRMR 0.02 0.09
*Parameter was fixed to zero due to a non-significant zero or negative variance Note. LGMS for HSUP, CSC, SP & SC were linear (0 7 10) and the LGM for HTM (0 1 *) was non-linear. HTM (top management safety climate), HSUP (supervisor safety climate), CSC (co-worker safety climate), SP (safety participation behaviors), SC (safety compliance behaviors)
186

Chapter 4
Discussion
The present study was one of the first to develop and test a safety climate intervention in
the construction industry. This intervention focused on both safety climate and safety
leadership concepts. In addition to teaching these concepts in a workshop, a reinforcement
method (i.e., progress checks) was hypothesized to facilitate the transfer of workshop concepts
to the job. However, the results suggest that a workshop results in the same outcomes as an
intervention composed of the workshop and progress checks. Generally, the present study
suggests that a safety climate and safety leadership workshop results in increased supervisor
knowledge of safety climate and safety leadership, supervisor training transfer behaviors, and
positive safety participation behaviors for both supervisors, and their crewmembers. However,
the workshop did not facilitate any changes in safety climate outcomes for both supervisors and
their crewmembers. This result may be due in part to high baseline safety climate perceptions,
which indicates that workers already felt that their top management, supervisors, and co-
workers valued and prioritized safety.
Contrary to what was hypothesized, the additional intervention component (i.e., progress
checks) did not improve all study outcomes after the intervention. There may be a couple of
reasons for this null finding. First, the way the progress checks were designed may have
influenced its implementation fidelity. When designing the intervention, the researchers
considered conducting the progress checks themselves instead of relying on the managers of
supervisors to organize and conduct them. While this method would offer better control over the
implementation of the intervention, it was not a logistically feasible or sustainable method. The
researchers believed that initiating a discussion between supervisors and their managers would
spark an on-going conversation about safety culture and safety leadership. It would also foster
critical support for the supervisor (Al-Eisa et al., 2009; Conchie, Moon, & Duncan, 2013).
187

However, only half of supervisors in the workshop participated in the first progress check and
participation dropped to one-quarter at the second progress check. Thus, not all of the
supervisors received the full amount of training. Second, of those that did receive the full
amount of training, the researchers could not fully control the conversation that was had
between the supervisors and their managers. Each supervisor/manager pair was required to fill
out a progress check guide, and return it to the researchers. Thus, there was some structure to
their progress checks, but since the researchers were not present it was difficult to determine
how the conversation unfolded. Also, in some cases, the conversation was not one-on-one as
planned, but rather amongst a group (i.e., multiple supervisors and their common manager). A
one-on-one environment would allow for a more open conversation, but the supervisor’s
manager argued that a group conversation was best for them since they all know each other
well. The null findings may be due to implementation fidelity and dose delivered rather than
inadequate intervention design.
Among all participants, there were some positive trends post-intervention. Post-
intervention, supervisors better understood what safety climate is and the specific things they
should do to improve safety climate perceptions among their crews. Supervisors also indicated
that they were transferring concepts learned in the workshop to their job by talking with others
about the learned concepts and using the concepts during the course of their work. Positive
changes were also observed in safety participation behaviors. Supervisors reported performing
more behaviors that actively promote the safety program, and putting in extra effort to ensure a
safe job site post-intervention. Furthermore, their crewmembers reported performing more of
these behaviors too. However, safety behaviors related to complying with rules and procedures
did not increase post-intervention. The relationship between safety climate and leadership style
and safety participation behaviors, compared to safety compliance behaviors, has been noted in
prior research (Clarke, 2006; Griffin & Neal, 2000; Hoffmeister et al., 2014; Martínez-Córcoles,
Schöbel, Gracia, Tomás, & Peiró, 2012). The present study supports and extends these
188

findings. It demonstrates that supervisors’ knowledge gained during the training and
subsequent efforts to transfer this knowledge to their job, results in more safety participation
behaviors. Furthermore, the effect trickled down to crewmembers that did not participate in the
intervention.
The present study’s safety climate results are comparable to other construction industry
leader focused interventions that measured safety climate. Previous non-construction studies
resulted in improved supervisor specific safety climate perceptions (Zohar, 2002a; Zohar &
Luria, 2003; Zohar & Polachek, 2013), but a change was not observed in the construction
specific study (Kines et al., 2010). The present study also did not observe any practical
changes in safety climate perceptions. The lack of change in the present study, however, may
be due to high baseline scores. This indicates that workers already felt that people at their
company valued and prioritized safety. The present study also found that safety behaviors
related to contextual performance (e.g., promoting the safety program) positively increased
post-intervention for both supervisors and their crewmembers. No prior studies measured
contextual safety behaviors. It is interesting that both the present study and the leader focused
intervention study in construction (Kines et al., 2010) did not improve safety climate perceptions
related to supervisor safety response. Kines et al. (2010) notes that the lack of change may be
representative of the difficultly of changing climate and the time it may take to change climate.
This change may be especially difficult in the construction industry due to several unique
industry characteristics. For a detailed description of the nature of the construction industry see
Loushine et al. (2006).
4.1. Future directions
Changing safety climate perceptions in the construction industry may take time as
supervisors work to modify how they approach safety on the job. As supervisors start to actively
promote safety amongst their crews, crewmember safety climate perceptions may evolve.
These new, positive efforts made by supervisors, however, may take time to significantly
189

influence crewmember perceptions. Indeed, worker safety climate perceptions are rooted in
“procedures as pattern” (Zohar, 2010). Supervisors who consistently work to promote safety
amongst their crewmembers remove the disparity between what the company espouses in
theory, and what is actually done in practice. Thus, supervisor safety participation behaviors
may be a critical link in the development of safety climate perceptions. The present study
measured safety climate at two time-points post-intervention (3 and 6 months post-intervention).
Had the present study continued to measure safety climate past 6-months post intervention,
significant changes may have been revealed. Furthermore, the short term positive changes in
supervisor’s contextual safety behaviors observed in the present study may influence safety
climate perceptions down the line. This relationship, however, has yet to be studied.
The present study’s findings offer several avenues for future research. As previously
mentioned, the intervention should be evaluated amongst other types of construction
contractors. This includes contractors with poor baseline safety climate scores, but also among
different sized contractors, types of work (e.g., carpentry), and industry segments (e.g.,
residential). The nature of construction also presents several potential challenges to improving
safety climate. First, the construction workforce is always in transition. Unless contractors have
a steady flow of work, workers will move between contractors as projects arise. So, even if a
company consciously strives to improve safety climate amongst their workforce, it may be
difficult to sustain due to a transient workforce. It will be especially important for supervisors to
set the stage for safety up front and to consistently promote safety through out the project.
Future research should study this intervention while accounting for the flow of employees
between contractors and projects.
Additionally, it is unclear how the multi-level nature of construction work might affect
safety climate development. The construction industry is segmented into general contractor and
sub-contractor relationships, trade, union status, and within one contractor, there are differences
by project and work group unit. For example, while contractors may each have their own unique
190

safety climate on one job site (Probst et al., 2008), a general contractor’s safety climate may
significantly influence a sub-contractor’s safety climate (Lingard, Cooke, & Blismas, 2010).
Thus, one contractor’s safety climate may be susceptible to outside influences. It may be
possible to target safety climate perceptions by employing a triangulating method whereby
general contractors, sub-contractors, and unions work together to improve safety climate
perceptions among a common workforce.
4.2. Strengths and limitations
The present study drew upon participatory action research to engage and empower
study participants. Throughout the study, the researchers consulted with members of the
construction industry on the study content, design, and implementation. While the researchers
heavily controlled the implementation of the workshop intervention component, supervisory
participants had a significant amount of control over the intervention progress checks. As with
any field research in the construction industry, the researchers had no control of workplace
factors that may have influenced the results. While actively engaging participants in the
research process is beneficial, it shifts some control away from the researchers.
A primary study’s strength is the pre-post, quasi-control group design evaluated within a
latent growth-modeling framework. However, the selection of participating contractors and
assignment to intervention group was non-random, and the present study could not compare
the two intervention types to a zero-intervention group. Thus, our findings may not be
generalizable to other contractors. Another strength is the almost perfect participation rate of all
eligible supervisors during the workshops and their continued employment with their respective
contractor at 6-months follow-up.
The main limitation of the present study was an inability to account for the nested nature
of the data. Thus, safety climate could not be evaluated as a shared phenomenon. It also
means that differences between work groups could not be accounted for. For example, it could
191

not be determined if there was an interaction between supervisor knowledge and crewmember
safety participation.
Only supervisors who attended the workshop were considered “supervisors” in this
study; however, other supervisors who did not attend the workshop may have contributed to the
results seen in this study. However, this effect may be minimal for a few reasons. First, most
supervisors who were employed at the time of the workshop attended the workshop, and were
still employed at the time of follow-up. Second, from what can be estimated based on the
matched surveys, few participants switched roles (supervisor - crewmember) throughout the
course of the study (n = 3). Third, there were some new supervisors that joined the company
after the intervention started, but not many (about 10%). However, since this study had a hard
time following people over time, it cannot be determined how many workers switched roles after
the intervention began.
There are some limitations to the measurement of the study variables. Given the large
amount of missing data within each wave of data, the present study had a difficult time tracking
individuals overtime. This could be due to a variety of factors including workers entering their
unique identifier during some data waves but not all, individuals forgetting their unique identifier
and entering a new code in subsequent data waves, workers leaving a participating contractor
for another non-participating contractor, and workers not being present during scheduled survey
times. Common method bias was also a limitation of the study since all study variables were
self-report questionnaires. Future research should include objective measures of safety
performance to evaluate the effectiveness of the intervention. Finally, the present study did not
account for the measurement invariance of the measures overtime.
4.3. Conclusions
Safety culture in the construction industry can be represented by two components of
workplace health and safety: the internal and environmental factors (H. C. Biggs & Biggs, 2013;
H. C. Biggs, Dingsdad, & Roos, 2008; Choudhry, Fang, & Mohamed, 2007; Zou, 2011).
192

Environmental factors include safety management systems, behavior based safety, life cycle
safety management, and safety knowledge management. Internal factors, on the other hand,
represent employee empowerment, leadership, safety knowledge, safety motivation, safety
behaviors and safety climate. Zou (2011) appropriately distinguished between them by calling it
the “art” and “science” of safety management. Guldenmund (2000) notes that addressing safety
culture is an “ambitious and time consuming” endeavor, which requires someone with detailed
knowledge of the company to pin point the company’s basic assumptions regarding safety.
Contractor’s can use safety climate measurements to understand their safety culture. As they
measure it overtime, it can become a leading measure of their safety performance.
The present study found that a workshop for construction site-supervisors focused on
safety climate and safety leadership principles significantly increased supervisor safety climate
knowledge, training transfer behaviors, and safety participation behaviors. Crewmember safety
participation behaviors also increased. Thus, a safety intervention targeted at supervisors can
be used to foster critical employee involvement in job site health and safety efforts. Since
crewmember involvement in safety programs is a critical element of any occupational health and
safety intervention, this safety climate intervention could be a useful tool to foster the
crewmember participation needed to increase the effectiveness of any OSH effort (Nielsen,
Randall, Holten, & Gonzalez, 2010).
193

References
Al-Eisa, A. S., Furayyan, M. A., & Alhemoud, A. M. (2009). An empirical examination of the
effects of self-efficacy, supervisor support and motivation to learn on transfer intention. Management Decision, 47(8), 1221–1244. doi:10.1108/00251740910984514
Barling, J., Loughlin, C., & Kelloway, E. K. (2002). Development and test of a model linking safety-specific transformational leadership and occupational safety. Journal of Applied Psychology, 87, 488–496.
Bass, B. (1985). Leadership and performance beyond expectations. New York: Free Press.
Biggs, H. C., & Biggs, S. E. (2013). Interlocked projects in safety competency and safety effectiveness indicators in the construction sector. Safety Science, 52, 37–42. doi:10.1016/j.ssci.2012.03.014
Biggs, H. C., Dingsdad, D. P., & Roos, C. R. (2008). A practical guide to safety leadership: Implementing a construction safety competency framework (pp. 1–48). CRC Construction Innovation.
Burke, M. J., Salvador, R. O., Smith-Crowe, K., Chan-Serafin, S., Smith, A., & Sonesh, S. (2011). The dread factor: How hazards and safety training influence learning and performance. Journal of Applied Psychology, 96(1), 46–70. doi:10.1037/a0021838
Choudhry, R. M., Fang, D., & Mohamed, S. (2007). Developing a Model of Construction Safety Culture. Journal of Management in Engineering, 23(4), 207–212. doi:10.1061/ASCE0742-597X200723:4207
Christian, M. S., Bradley, J. C., Wallace, J. C., & Burke, M. J. (2009). Workplace safety: A meta-analysis of the roles of person and situation factors. Journal of Applied Psychology, 94(5), 1103–1127. doi:10.1037/a0016172
Clarke, S. (2006). The relationship between safety climate and safety performance: A meta-analytic review. Journal of Occupational Health Psychology, 11, 315–327.
Clarke, S. (2010). An integrative model of safety climate: Linking psychological climate and work attitudes to individual safety outcomes using meta-analysis. Journal of Occupational and Organizational Psychology, 83(3), 553–578. doi:10.1348/096317909X452122
Conchie, S. M., Moon, S., & Duncan, M. (2013). Supervisors engagement in safety leadership: Factors that help and hinder. Safety Science, 51(1), 109–117. doi:10.1016/j.ssci.2012.05.020
CPWR. (2013, September 15). Safety culture. Cpwr.com. Retrieved September 30, 2013, from http://cpwr.com/safety-culture
Dedobbeleer, N., & Beland, F. (1991). A safety climate measure for construction sites. Journal of Safety Research, 22, 97–103.
Denison, D. R. (1996). What is the Difference between Organizational Culture and Organizational Climate? A Native's Point of View on a Decade of Paradigm Wars. The Academy of Management Review, 21(3), 619–654.
Flin, R., Mearns, K., O'Connor, P., & Bryden, R. (2000). Measuring safety climate: identifying the common features. Safety Science, 34, 177–192.
194

Gillen, M., Kools, S., Sum, J., McCall, C., & Moulden, K. (2004). Construction workers' perceptions of management safety practices: A qualitative investigation. Work, 23(3), 245–256.
Gittleman, J. L., Gardner, P. C., Haile, E., Sampson, J. M., Cigularov, K. P., Ermann, E. D., et al. (2010). CityCenter and Cosmopolitan Construction Projects, Las Vegas, Nevada: Lessons learned from the use of multiple sources and mixed methods in a safety needs assessment. Journal of Safety Research, 41(3), 263–281.
Goldenhar, L. M., Williams, L. J., & Swanson, N. G. (2003). Modeling relationships between job stressors and injury and near-miss outcomes for construction labourers. Work and Stress, 17(3), 218–240.
Griffin, M., & Neal, A. (2000). Perceptions of safety at work: a framework for linking safety climate to safety performance, knowledge, and motivation. Journal of Occupational Health Psychology, 1, 347–358.
Guldenmund, F. (2000). The nature of safety culture: a review of theory and practice. Safety Science, 34, 215–257.
Hale, A., & Borys, D. (2013). Working to rule or working safely? Part 2: The management of safety rules and procedures. Safety Science, 55, 222–231. doi:10.1016/j.ssci.2012.05.013
Hoffmeister, K., Gibbons, A. M., Johnson, S. K., Cigularov, K. P., Chen, P. Y., & Rosecrance, J. C. (2014). The differential effects of transformational leadership facets on employee safety. Safety Science, 62(C), 68–78. doi:10.1016/j.ssci.2013.07.004
Hofmann, D. A., & Morgeson, F. P. (2004). The role of leadership in safety. In J. Barling & F. M. R (Eds.), The psyhcology of workplace safety (pp. 159–180). Washington, DC: American Psychological Association.
Hofmann, D. A., Morgeson, F. P., & Gerras, S. J. (2003). Climate as a moderator of the relationship between leader-member exchange and content specific citizenship: Safety climate as an exemplar. Journal of Applied Psychology, 88(1), 170–178. doi:10.1037/0021-9010.88.1.170
Jackson, D. L. (2010). Reporting results of latent growth modeling and multilevel modeling analyses: Some recommendations for rehabilitation psychology. Rehabilitation Psychology, 55(3), 272–285. doi:10.1037/a0020462
Kaskutas, V., Dale, A. M., Lipscomb, H., Gaal, J., Fuchs, M., Evanoff, B., & Team, T. C. J. A. P. I. (2010). Changes in fall prevention training for apprentice carpenters based on a comprehensive needs assessment. Journal of Safety Research, 41(3), 221–227. doi:10.1016/j.jsr.2010.01.006
Kelloway, E. K., Mullen, J., & Francis, L. (2006). Divergent effects of transformational and passive leadership on employee safety. Journal of Occupational Health Psychology, 11(1), 76–86. doi:10.1037/1076-8998.11.1.76
Kines, P., Andersen, L. P. S., Spangenberg, S., Mikkelsen, K. L., Dyreborg, J., & Zohar, D. (2010). Improving construction site safety through leader-based verbal safety communication. Journal of Safety Research, 41(5), 399–406. doi:10.1016/j.jsr.2010.06.005
Kines, P., Lappalainen, J., Mikkelsen, K. L., Olsen, E., Pousette, A., Tharaldsen, J., et al. (2011). Nordic Safety Climate Questionnaire (NOSACQ-50): A new tool for diagnosing occupational safety climate. International Journal of Industrial Ergonomics, 41(6), 634–646. doi:10.1016/j.ergon.2011.08.004
195

Kosny, A., Lifshen, M., Pugliese, D., Majesky, G., Kramer, D., Steenstra, I., et al. (2013). Buddies in Bad Times? The Role of Co-workers After a Work-Related Injury. Journal of Occupational Rehabilitation, 23(3), 438–449. doi:10.1007/s10926-012-9411-z
Kwok, O.-M., Underhill, A. T., Berry, J. W., Luo, W., Elliott, T. R., & Yoon, M. (2008). Analyzing longitudinal data with multilevel models: An example with individuals living with lower extremity intra-articular fractures. Rehabilitation Psychology, 53(3), 370–386. doi:10.1037/a0012765
Laboers' Health and Safety Fund of North America. (n.d.). Safety culture. Retrieved June 4, 2013, from http://www.lhsfna.org/index.cfm?objectID=EB15F3F6-D56F-E6FA-95A598B4A77FBAE6
Las Vegas Sun. (2013, March 20). Construction deaths: Cost of expansion. Www.Lasvegassun.com. Retrieved February 20, 2013, from http://www.lasvegassun.com/news/topics/construction-deaths/
Latham, G. P., & Locke, E. A. (1991). Self-regulation through goal setting. Organizational Behavior and Human Decision Processes, 50(2), 212–247. doi:10.1016/0749-5978(91)90021-K
Lingard, H. C., Cooke, T., & Blismas, N. (2010). Safety climate in conditions of construction subcontracting: a multi‐level analysis. Construction Management and Economics, 28(8), 813–825. doi:10.1080/01446190903480035
Lipscomb, H. J., Dale, A. M., Kaskutas, V., Sherman-Voellinger, R., & Evanoff, B. (2008). Challenges in residential fall prevention: insight from apprentice carpenters. American Journal of Industrial Medicine, 51(1), 60–68. doi:10.1002/ajim.20544
Loushine, T. W., Hoonakker, P. L. T., Carayon, P., & Smith, M. J. (2006). Quality and safety management in construction. Total Quality Management, 17(9), 1171–1212.
Machin, M. A., & Fogarty, G. J. (2004). Assessing the antecedents of transfer intentions in a training context. International Journal of Training and Development, 8(3), 222–236. doi:10.1111/j.1360-3736.2004.00210.x
Martínez-Córcoles, M., Schöbel, M., Gracia, F. J., Tomás, I., & Peiró, J. M. (2012). Linking empowering leadership to safety participation in nuclear power plants: A structural equation model. Journal of Safety Research, 43(3), 215–221. doi:10.1016/j.jsr.2012.07.002
McArdle, J. J., & D, E. (1987). Latent growth curves within developmental structural equation models. Child Development, 58, 110–133.
Mohamed, S. (2002). Safety climate in construciton site environments. Journal of Construction Engineering & Management, 128(5), 375–384.
Mullen, J. E., & Kelloway, E. K. (2009). Safety leadership: A longitudinal study of the effects of transformational leadership on safety outcomes. Journal of Occupational and Organizational Psychology, 82(2), 253–272. doi:10.1348/096317908x325313
Mullen, J., Kelloway, E. K., & Teed, M. (2011). Inconsistent style of leadership as a predictor of safety behavior. Work and Stress, 25(1), 41–54.
Muthen, L., & Muthen, B. (2008, August 7). Growth modeling with latent variables using mplus. UCLA: Statistical Consulting Group. Retrieved December 15, 2013, from http://statistics.ats.ucla.edu/stat/mplus/seminars/gm/Topic3_FINAL.pdf
Nahrgang, J. D., Morgeson, F. P., & Hofmann, D. A. (2011). Safety at Work: A Meta-Analytic Investigation of the Link Between Job Demands, Job Resources, Burnout, Engagement,
196

and Safety Outcomes. Journal of Applied Psychology, 96(1), 71–94. doi:10.1037/a0021484
Neal, A., Griffin, M. A., & Hart, P. M. (2000). The impact of organizational climate on safety and individual behaviour. Safety Science, 34, 99–109.
Nielsen, K., Randall, R., Holten, A.-L., & Gonzalez, E. R. (2010). Conducting organizational-level occupational health interventions: What works? Work and Stress, 24(3), 234–259. doi:10.1080/02678373.2010.515393
NORA Construction Sector Council. (2008). National Occupational Research Agenda - National Construction Agenda. Cdc.Gov. Retrieved September 2, 2012, from http://www.cdc.gov/niosh/nora/comment/agendas/construction/pdfs/ConstOct2008.pdf
Pousette, A., Larsson, S., & Törner, M. (2008). Safety climate cross-validation, strength and prediction of safety behaviour. Safety Science, 46(3), 398–404. doi:10.1016/j.ssci.2007.06.016
Probst, T. M., & Estrada, A. X. (2010). Accident under-reporting among employees: testing the moderating influence of psychological safety climate and supervisor enforcement of safety practices. Accid Anal Prev, 42(5), 1438–1444. doi:10.1016/j.aap.2009.06.027
Probst, T., Brubaker, T., & Barsotti, A. (2008). Organizational injury rate underreporting: The moderating effect of organizational safety climate. Journal of Applied Psychology, 93, 1147–1154.
Reason, J. (1997). Managing the risks of organizational accidents. Aldershot: Ashgate Publishing Ltd.
Saunders, R. P., Evans, M. H., & Joshi, P. (2005). Developing a Process-Evaluation Plan for Assessing Health Promotion Program Implementation: A How-To Guide. Health Promotion Practice, 6(2), 134–147. doi:10.1177/1524839904273387
Schein, E. H. (1990). Organizational culture. American Psychologist, 45(2), 109–119. doi:10.1037/0003-066x.45.2.109
Schein, E. H. (1996). Culture: The Missing Concept in Organization Studies. Administrative Science Quarterly, 41(2), 229–240.
Schein, E. H. (2010). Organizational culture and leadership. Ebook Library (EBL). San Francisco: Jossey-Bass.
Schwatka, N. V., & Rosecrance, J. C. (2014). From management to co-workers: The impact of safety climate perceptions on safety behaviors. Safety Science, Under Review.
Shannon, H. S., Mayr, J., & Haines, T. (1997). Overview of the relationship between organization and workplace factors and injury rates. Safety Science, 26(3), 201–217.
Stajkovic, A. D., & Luthans, F. (1997). A meta-analysis of the effects of organizational behavior modification on task performance. Academy of Management Journal, 40(5), 1122–1149. doi:10.2307/256929
Törner, M., & Pousette, A. (2009). Safety in construction – a comprehensive description of the characteristics of high safety standards in construction work, from the combined perspective of supervisors and experienced workers. Journal of Safety Research, 40(6), 399–409.
Wiegmann, D. A., Zhang, H., Thaden, von, T. L., Sharma, G., & Gibbons, A. M. (2002). A synthesis of safety culture and safety climate research (2nd ed.). Atlantic City International Airport, NJ: Federal Aviation Administration.
Zohar, D. (2000). A group-level model of safety climate: Testing the effect of group climate on
197

micro-accidents in manufacturing jobs. Journal of Applied Psychology, 85, 587–596.
Zohar, D. (2002a). Modifying supervisory practices to improve submit safety: A leadership-based intervention model. Journal of Applied Psychology, 87(1), 156–163.
Zohar, D. (2002b). The effects of leadership dimensions, safety climate, and assigned priorities on minor injuries in work groups. Journal of Organizational Behavior, 23(1), 75–92. doi:10.1002/job.130
Zohar, D. (2007). On the difficultly of promoting workers' safety behavior: Overcoming the underweighting of routine risks. Int. J. Risk Assessment and Management, 7(2), 122–136.
Zohar, D. (2010). Thirty years of safety climate research: reflections and future directions. Accident Analysis and Prevention, 42, 1517–1522.
Zohar, D. (2011). Safety climate: Conceptual and measurement issues. In J. C. Quick & L. E. Tetrick (Eds.), Handbook of Occupational Health Psychology (2nd ed.). Washington DC: APA.
Zohar, D., & Luria, G. (2003). The use of supervisory practices as leverage to improve safety behavior: a cross level intervention model. Journal of Safety Research, 34, 567–577.
Zohar, D., & Luria, G. (2005). A multilevel model of safety climate: Cross-level relationships between organization and group-level climates. Journal of Applied Psychology, 90, 616–628.
Zohar, D., & Luria, G. (2010). Group Leaders as Gatekeepers: Testing Safety Climate Variations across Levels of Analysis. Appl Psychol: an Int Rev, 59(4), 647–673. doi:10.1111/j.1464-0597.2010.00421.x
Zohar, D., & Polachek, T. (2013). Discourse-Based Intervention for Modifying Supervisory Communication as Leverage for Safety Climate and Performance Improvement: A Randomized Field Study. Journal of Applied Psychology. doi:10.1037/a0034096
Zou, P. X. W. (2011). Fostering a strong construction safety culture. Leadership and Management in Engineering, 11–22.
198

Appendix 6.I.
Progress check guide
Goal: Set aside time to discuss employee progress towards development of ACTIVE safety leadership skills. Objectives:
1. Determine if employee has met goals or took action after the workshop to become more of an ACTIVE safety leader.
2. Discuss enablers and barriers to becoming more of an ACTIVE safety leader. 3. Discuss ways to continue becoming more of an ACTIVE safety leader and ways to overcome
barriers to doing so. 4. Set new ACTIVE safety leadership goals.
Instructions:
During the ACTIVE safety leadership workshop, all trainees were asked to write down four goals in their workbook. These were specific goals that they were asked to work on achieving over the next few months. The purpose of the meeting with your employee(s) is to determine their progress towards meeting these goals and to discuss ways to achieve the goals. If goals were forgotten, discuss actions taken after workshop to become more of an ACTIVE safety leader.
Frequency: Meet with employees that you supervise 1 time per month for 2 months. Location: The meeting can be before or after a pre-planned meeting. It can also be scheduled
separately to take place during lunch or a coffee break. Duration: Take at least 15 minutes to discuss your employee’s progress. If you have more time,
feel free to take longer. Content: Use the progress check guide to guide your discussion. Fill out the questions. Turn in progress check guide ASAP to ______ when done.
ACTIVE Safety Leadership Development Progress Check
199

Progress Check Number (Circle One): 1st 2nd Employee Name: ____________ DATE: ____ Step 1: Determine if employee has met goals or took action after the workshop to become more of an ACTIVE safety leader. 1. What were their goals? If goals were forgotten discuss actions taken after
workshop. (Provide a summary) ___________________________________________________________________________________________________________________________________________________________________________________________________________________________________________________________________________________________________________________________ _______________________________________________________________ _______________________________________________________________
Step 2: Discuss enablers and barriers to becoming more of an ACTIVE safety leader.
2. Did the training help them become more of an ACTIVE safety leader? (Circle one) Yes No Why or why not? _____________________________________________________________________________________________________________________________________________________________________________________________
Always
Communicate your value of safety to your crew frequently,
Treat safety with the same priority as other organizational goals, Involve crews in safety analyses and pre-task planning,
Voice your feedback when you see safe and unsafe behaviors, Empower crews to actively take on safety on the job.
ACTIVE Safety Leadership Development Progress Check
200

______________________________________________________________________________________________________________________________ ______________________________________________________________________________________________________________________________
3. If becoming more of an ACTIVE safety leader has been challenging, what were the specific issues or barriers they faced? (Provide a summary) __________________________________________________________________________________________________________________________________________________________________________________________________________________________________________________________________________________________________________________________________________________________________________________________ ______________________________________________________________________________________________________________________________
4. If no challenges or barriers occurred, what enabled them to apply what they learned in the workshop? ___________________________________________________________________________________________________________________________________________________________________________________________________________________________________________________________________________________________________________________________
Step 3: Discuss ways to continue becoming more of an ACTIVE safety leader and ways to overcome barriers to doing so. 5. What suggestions or solutions can be employed to continue to become
more of an ACTIVE safety leader? How can you help your employee? ___________________________________________________________________________________________________________________________________________________________________________________________________________________________________________________________________________________________________________________________ ______________________________________________________________________________________________________________________________
201

Step 4: Set new ACTIVE safety leadership goals. 6. Modify goals or create new goals based on your discussion.
1. __________________________________________________________________________________________________________________________
2. __________________________________________________________________________________________________________________________
3. __________________________________________________________________________________________________________________________
4. __________________________________________________________________________________________________________________________
202

Appendix 6.II
Workshop and progress check organization and content
Workshop Hour Section and description Reference
0.0 – 1.0 Safety culture/climate overview
1. Safety culture and climate defined and differentiated (Christian et al., 2009; Clarke, 2010; Gittleman et al., 2010; Las Vegas Sun, 2013; Nahrgang et al., 2011; Wiegmann et al., 2002; Zohar, 2011; 2000; Zohar and Luria, 2005)
2. Role of supervisors in crew perceptions of safety climate on the job
3. Las Vegas City Center case study – Impact of safety climate perception differences between management and crews
3.a. Video: City Center project overview 4. Consequences of a poor safety climate
1.0 – 2.0 Safety leadership characteristics 5. Range of leadership styles from passive to active (Bass, 1985;
Kelloway et al., 2006; Mullen et al., 2011; Mullen and Kelloway, 2009)
5a. Video: What is it like to be a leader in the construction industry?
5b. Exercise: What kind of safety leader are you?
2.0 – 4.0 ACTIVE safety leadership 6. Communication about your value for safety (Dedobbeleer and
Beland, 1991; Gillen et al., 2004; Hofmann and Morgeson, 2004; Kines et al., 2010; Latham and Locke, 1991; Mohamed, 2002; Reason, 1997; Shannon et al., 1997; Stajkovic and Luthans, 1997; Törner and Pousette, 2009; Zohar, 2007; 2002; Zohar and Luria, 2010; 2003)
7. Treating safety with the same priority as other organizational goals
7a. Video: Safety is a priority 7b. Video: Safety is more than just a priority, it is a value 8. Multi-causal nature of organizational accidents 9. Balancing organizational goals: Production, efficiency,
quality, safety 9a. Video: How do others balance organizational goals? 10. Importance of walking the talk when it comes to safety 10a. Video: How are others walking the talk? 11. Voicing feedback when safe and unsafe behaviors are
seen 11a. Video: How do others give feedback? 11b. Role play: Practicing feedback when an unsafe
behavior is seen 12. Empower crews to take on safety 12a. Video: How do others empower their crews? 13. Ways to involve crews in safety 14. Goal setting: List 4 SMART goals to work on becoming a
more active safety leader
Progress Checks Description Reference
~0.15 1. Discussion of goal attainment, factors that helped or hindered goal attainment, methods to overcome barriers, setting new or revised goals.
(Al-Eisa et al., 2009; Latham and Locke, 1991)
203

Appendix 6.III.
Workshop reaction and training transfer behaviors survey questions
Workshop reaction survey (Kirkpatrick & Kirkpatrick 2008)
Please rate the following statements by your level agreement
Com
plet
ely
disa
gree
Som
ewha
t di
sagr
ee
Slig
htly
di
sagr
ee
Slig
htly
ag
ree
Som
ewha
t ag
ree
Com
plet
ely
agre
e
1. I consider the training highly relevant to my job. 1 2 3 4 5 6
2. The training materials are too simple and basic; they do not challenge trainees with anything new.
1 2 3 4 5 6
3. The training materials kept me interested and engaged throughout the training.
1 2 3 4 5 6
4. During the training I had many opportunities to demonstrate my knowledge.
1 2 3 4 5 6
5. I will not be able to apply anything that I learned on the job.
1 2 3 4 5 6
6. The videos were very helpful for understanding the concepts being taught.
1 2 3 4 5 6
7. I will strongly recommend this training to other leaders in the construction industry.
1 2 3 4 5 6
204

Training transfer behaviors (Al-Eisa et al, 2009; Machin & Fogarty, 2004)
Please circle the number to best indicate your level of agreement with each statement.
Stro
ngly
D
isag
ree
Dis
agre
e
Som
ewha
t D
isag
ree
Som
ewha
t A
gree
Agr
ee
Stro
ngly
A
gree
1. I have discussed with my supervisor ways to apply the material that I have learned in the Leaders Create Culture workshop.
0 1 2 3 4 5
2. I have discussed with my co-workers ways to apply the material that I have learned in the Leaders Create Culture workshop.
0 1 2 3 4 5
3. I have used the knowledge and skills I learned in the Leaders Create Culture workshop on the job.
0 1 2 3 4 5
4. The knowledge and skills I learned in the Leaders Create Culture workshop are useful to me in my current role.
0 1 2 3 4 5
5. The knowledge and skills I learned in the Leaders Create Culture workshop have helped me improve my job performance.
0 1 2 3 4 5
205