Dissertation - Ningapi.ning.com/files/XK2Klt0F5AurVyM3L1MLLdZoRyH1zSXE60cyWWiznx… · I express my...
213
I “DESIGN AND PHYSICO-CHEMICAL CHARACTERIZATION OF TABLET CONTAINING NOVEL ANTIDEPRESSANT DRUG USING VARIOUS FORMULATION TECHNIQUES” Dissertation Submitted to KLE University, Belgaum, Karnataka In partial fulfillment of the requirement for the degree of M M a a s s t t e e r r o o f f P P h h a a r r m m a a c c y y I I n n P P h h a a r r m m a a c c e e u u t t i i c c s s By Mr. RITESH A. UDHANI B.Pharm Under the guidance of DR. BASAVARAJ K.NANJWADE M.Pharm, Ph.D DEPARTMENT OF PHARMACEUTICS, JN MEDICAL COLLEGE, BELGAUM-590010, KARNATAKA, INDIA MAY-2010
Transcript of Dissertation - Ningapi.ning.com/files/XK2Klt0F5AurVyM3L1MLLdZoRyH1zSXE60cyWWiznx… · I express my...
I
““DDEESSIIGGNN AANNDD PPHHYYSSIICCOO--CCHHEEMMIICCAALL CCHHAARRAACCTTEERRIIZZAATTIIOONN OOFF TTAABBLLEETT CCOONNTTAAIINNIINNGG
NNOOVVEELL AANNTTIIDDEEPPRREESSSSAANNTT DDRRUUGG UUSSIINNGG VVAARRIIOOUUSS FFOORRMMUULLAATTIIOONN TTEECCHHNNIIQQUUEESS””
Dissertation
Submitted to KLE University, Belgaum, Karnataka In partial fulfillment of the requirement for the degree of
MMMaaasssttteeerrr ooofff PPPhhhaaarrrmmmaaacccyyy IIInnn
PPPhhhaaarrrmmmaaaccceeeuuutttiiicccsss
By
Mr. RITESH A. UDHANI B.Pharm
Under the guidance of
DR. BASAVARAJ K.NANJWADE M.Pharm, Ph.D
DEPARTMENT OF PHARMACEUTICS, JN MEDICAL COLLEGE,
BELGAUM-590010, KARNATAKA, INDIA
MAY-2010
II
KKLLEE UUNNIIVVEERRSSIITTYY,, BBEELLGGAAUUMM,, KKAARRNNAATTAAKKAA
Declaration by the Candidate
II hheerreebbyy ddeeccllaarree tthhaatt tthhiiss ddiisssseerrttaattiioonn eennttiittlleedd ““DDEESSIIGGNN
AANNDD PPHHYYSSIICCOO--CCHHEEMMIICCAALL CCHHAARRAACCTTEERRIIZZAATTIIOONN OOFF TTAABBLLEETT
CCOONNTTAAIINNIINNGG NNOOVVEELL AANNTTIIDDEEPPRREESSSSAANNTT DDRRUUGG UUSSIINNGG
VVAARRIIOOUUSS FFOORRMMUULLAATTIIOONN TTEECCHHNNIIQQUUEESS”” iiss aa bboonnaaffiiddee aanndd
ggeennuuiinnee rreesseeaarrcchh wwoorrkk ccaarrrriieedd oouutt bbyy mmee uunnddeerr tthhee gguuiiddaannccee ooff
Dr. BASAVARAJ K. NANJWADE PPrrooffeessssoorr,, DDeeppaarrttmmeenntt ooff
PPhhaarrmmaacceeuuttiiccss,, JJNN MMeeddiiccaall CCoolllleeggee,, BBeellggaauumm.
DDaattee::
PPllaaccee:: BBeellggaauumm..
MMrr.. RRIITTEESSHH AA.. UUDDHHAANNII BB..PPhhaarrmm DDeepptt.. ooff PPhhaarrmmaacceeuuttiiccss,, JJNN MMeeddiiccaall CCoolllleeggee,, BBeellggaauumm –– 559900 001100,, KKaarrnnaattaakkaa..
III
KKLLEE UUNNIIVVEERRSSIITTYY,, BBEELLGGAAUUMM,, KKAARRNNAATTAAKKAA
Certificate by the Guide
II hheerreebbyy ddeeccllaarree tthhaatt tthhiiss ddiisssseerrttaattiioonn eennttiittlleedd ““DDEESSIIGGNN
AANNDD PPHHYYSSIICCOO--CCHHEEMMIICCAALL CCHHAARRAACCTTEERRIIZZAATTIIOONN OOFF TTAABBLLEETT
CCOONNTTAAIINNIINNGG NNOOVVEELL AANNTTIIDDEEPPRREESSSSAANNTT DDRRUUGG UUSSIINNGG VVAARRIIOOUUSS
FFOORRMMUULLAATTIIOONN TTEECCHHNNIIQQUUEESS”” iiss aa bboonnaaffiiddee rreesseeaarrcchh wwoorrkk ddoonnee
bbyy MMrr.. RRIITTEESSHH AA.. UUDDHHAANNII iinn ppaarrttiiaall ffuullffiillllmmeenntt ooff tthhee
rreeqquuiirreemmeenntt ffoorr tthhee ddeeggrreeee ooff MMaasstteerr ooff PPhhaarrmmaaccyy iinn
PPhhaarrmmaacceeuuttiiccss..
DDaattee:: PPllaaccee:: BBeellggaauumm..
DDrr.. BB..KK.. NNAANNJJWWAADDEEMM..PPhhaarrmm,,PPhh.. DD PPrrooffeessssoorr,, DDeepptt.. ooff PPhhaarrmmaacceeuuttiiccss,, JJNN MMeeddiiccaall CCoolllleeggee,, BBeellggaauumm –– 559900 001100,, KKaarrnnaattaakkaa..
IV
KKLLEE UUNNIIVVEERRSSIITTYY,, BBEELLGGAAUUMM,, KKAARRNNAATTAAKKAA
Endorsement By The HOD, Principal/ Head of The Institution
This is to certify that the dissertation entitled ““DDEESSIIGGNN AANNDD
PPHHYYSSIICCOO--CCHHEEMMIICCAALL CCHHAARRAACCTTEERRIIZZAATTIIOONN OOFF TTAABBLLEETT
CCOONNTTAAIINNIINNGG NNOOVVEELL AANNTTIIDDEEPPRREESSSSAANNTT DDRRUUGG UUSSIINNGG
VVAARRIIOOUUSS FFOORRMMUULLAATTIIOONN TTEECCHHNNIIQQUUEESS”” is a bonafide
research work done by Mr. RITESH A. UDHANI in partial
fulfillment of the requirement for the degree of Master of
Pharmacy in Pharmaceutics, under the guidance of DDrr.. BB.. KK..
NNAANNJJWWAADDEE,, Professor, Department of Pharmaceutics, JN Medical
College, Belgaum.
DDaattee:: PPllaaccee:: BBeellggaauumm..
DDRR.. VV.. DD.. PPAATTIILL MMDD,, DDCCHH
PPrriinncciippaall,, JJNN MMeeddiiccaall CCoolllleeggee,, BBeellggaauumm –– 559900 001100,, KKaarrnnaattaakkaa..
MMRRSS.. RR.. SS.. MMAASSAARREEDDDDYY MM..PPHHAARRMM AAssssoocciiaattee PPrrooffeessssoorr && HHeeaadd,, DDeepptt.. ooff PPhhaarrmmaacceeuuttiiccss,, JJNN MMeeddiiccaall CCoolllleeggee,, BBeellggaauumm –– 559900 001100.. KKaarrnnaattaakkaa
DDaattee:: PPllaaccee:: BBeellggaauumm..
V
KKLLEE UUNNIIVVEERRSSIITTYY,, BBEELLGGAAUUMM,, KKAARRNNAATTAAKKAA
Copyright Declaration by the Candidate
II hheerreebbyy ddeeccllaarree tthhaatt tthhee KKLLEE UUnniivveerrssiittyy,, BBeellggaauumm,,
KKaarrnnaattaakkaa sshhaallll hhaavvee tthhee rriigghhttss ttoo pprreesseerrvvee,, uussee aanndd
ddiisssseemmiinnaattee tthhiiss ddiisssseerrttaattiioonn//tthheessiiss iinn pprriinntt oorr eelleeccttrroonniicc ffoorrmmaatt
ffoorr aaccaaddeemmiicc//rreesseeaarrcchh ppuurrppoossee..
DDaattee::
PPllaaccee:: BBeellggaauumm..
© J.N. Medical College, KLE University, Belgaum, Karnataka
MMrr.. RRIITTEESSHH AA.. UUDDHHAANNIIBB..PPhhaarrmm DDeepptt.. ooff PPhhaarrmmaacceeuuttiiccss,, JJNN MMeeddiiccaall CCoolllleeggee,, BBeellggaauumm –– 559900 001100,, KKaarrnnaattaakkaa..

VI
AAffffeeccttiioonnaatteellyy DDeeddiiccaatteedd
TToo
MMyy BBeelloovveedd PPaarreennttss
&&
EEsstteeeemmeedd gguuiiddee

VII
Acknowledgement
It is a great pleasure for me to acknowledge all those who have contributed
towards the conception, origin and nurturing of this project.
The person whose picture comes first in my mind is that of my esteemed guide
Dr. Basavaraj K. Nanjwade, Professor, Department of Pharmaceutics, KLE University,
Belgaum, for his invaluable guidance, timely advice, kind co-operation, understanding and
constant inspiration throughout the course of the study. It is with affection and reverence
that I dedicate often beyond the call of duty; it was pleasure of working under his
guidance. No words can speak of his involvement and fatherly care.
It is a delightful moment for me, to put into words all my gratitude to my esteemed
industrial guide, Mr. Pramod Pathak, Research Associate, F & D, PTC, Zydus Cadila,
Ahmedabad, for his inestimable guidance, valuable suggestions and constant
encouragement during the course of this study. It is with affection and reverence that I
acknowledge my indebtness to him and his outstanding dedication, often far beyond the
call of duty. Apart from guiding me, his unwearing moral support and advice was of great
help.
I shall forever remain indebted to my co-guide Ms. Arti Potdar, Sr. GM and
Mr. Praful Chouhan, Dy. GM, F&D, Pharmaceutical technology center, Cadila
Healthcare Limited, Ahmedabad, allowing me to carry out M.Pharm dissertation work
within a well established organization along with their valuable guidance, keen interest,
perennial inspiration and everlasting encouragement. I would also like to thank Mr. Vinay
Upadhyay who supported me during my dissertation work.

VIII
It gives me pleasure in thanking Mr. Sunil B. Roy, Sr. VP, PTC, Zydus Cadila,
Ahmedabad for allowing me to undertake this present work. I would like to give special
thanks to Mr. Vinit Thombare, Mr. Narendra Patidar and Mr. Rahul Agarwal who
guided me during my dissertation work. Apart from guiding me, their unwearing moral
support and advice.
I give my special thanks to our respected Vice Chancellor Dr. C. K. Kokate, KLE
University and Dr. Pramod H. J. for their help and support during my study.
I would like to give the special thanks to Mr. Nishit Bhatt, Research Scientist and
Ms. Hiral Raval for supporting me from the very first day of my project in industry.
I am grateful to Dr. Hemendra Bhatt, Dr. Manish Rachchh, Dr. H.M. Tank and
Mr. Darshan Parekh for their constant moral support throughout my career.
I express my deep gratitude to Jigar Vyas, Kalpit Dalal, Abhilash Bhong, Ruchir
Shah, Ambuj Shukla, Vinod Raguvanshi, Devendra Dewangan, Basant Verma, Nikalesh
Patel, Prateek Gandhi, Bhavesh Patel and other scientist who have supported me directly
or indirectly during my project work. I am also thankful to Dhruvin, Ashish, Vijay, Ankit,
Milan, Karamsinh, Maunesh, Abhishekh, Akshita and all other colleagues who supported
me during this project.
“A Friend in need is the Friend Indeed”: I would like to give a special thank to
Jatin, Dhaval, Mac, Ayaz, Ketan and Pratin for their ever appraising support and who
helped me when I needed someone desperately.

IX
I would also like to thank one special person, Ms. Sai Susmitha, who has always
been with me on every step of mine during the course and who gave me all the support I
needed.
I am thankful to my friends who have always cared for me, Viral, Kalyani, Ankit,
Rugved, Kaushal, Vinod, Jay, Jiten, Devang, Nikunj, Dilip, Varun and all others.
I am thankful to my batchmates Vishwas, Amol, Bhushan, Rajesh, Nitin, Eshwar,
Kunal, Suhas, Chirag, Vishal, Kemy, Rucha, Anu and Kiran.
I owe my thanks to my juniors Aman, Nishant, Amit, Jagdish, Alok and Mayank
for their support and respect.
I owe my special thanks to Mr. R. M. Kolar and his family for showing care and
support and making my stay at Belgaum a comfortable one.
At this moment, I thanks with deep gratitude to my Mother, Father, brother
Sandeep, sisters Poonam, Ekta, Sheetal and Dipika and all other family members for their
moral support, constant encouragement and patience absolutely needed to complete my
entire study. It was the blessing of them that gave me courage to face the challenges and
made my path easier. I expect and request them to shower their blessings and love on me
throughout my life and for my future endeavors.
I acknowledge from the bottom of my heart to my uncle and my aunty for bearing
the pain for me and making my stay very comfortable at Ahmedabad. I will always be
indebted to their blessings.
I owe my special thanks to Mr. Sanjay Sheth and Mr. Akhil Dalal, the two people
without whom, it was impossible for me to reach at the present stage of life. It is with
affection and reverence that I acknowledge my indebtness to them.

X
I sincerely acknowledge my Jiju Mr. Parshotam Bhaktyarpuri for his continuous
help while my stay at Ahmedabad.
I sincerely acknowledge my Jiju Mr. Mukesh Thakwani for his continuous support
which was a solid pillar for my work.
I am thankful to Miss. Veena and Mr. Deepak of Sai DTP and Xerox, Belgaum,
for formatting, printing and binding of my thesis.
I firmly believe that there cannot be any gain without the pain, so at last I would
like to thank all those people who said me no, who left me on the way and those who gave
me pain; because of whom I did it myself.
Thanks to one and all………
Ritesh Udhani
XI
ABBREVIATIONS
USP : United states of pharmacopeia
HPMC : Hydroxy propyl methyl cellulose
MTC : Minimum toxic concentration
MEC : Minimum effective concentration
cGMP : Current good manufacturing practice
SUPAC : scale up post approval changes
KF : Karl Fischer
R & D : Research and Development
FDA : Food and drug administration
QC : Quality control
CNS : central nervous system
INV : Invega
PEO : Polyethylene Oxide
EC : Ethyl cellulose
PEG : Polyethylene Glycol
BHT : Butylated hydroxy Toluene
ER : Extended release
DSC : Differnetial Scanning Calorimetry
API : Active Pharmaceutical Ingredient
RH : Relative Humidity
LOD : Loss on drying
NMT : Not more than
NLT : Not less than
MCC : Microcrystalline cellulose
RPM : Rotations per minute

XII
ABSTRACT
The present work was based on “DESIGN AND PHYSICO-CHEMICAL
CHARACTERIZATION OF TABLET CONTAINING NOVEL
ANTIDEPRESSANT DRUG USING VARIOUS FORMULATION
TECHNIQUES”. 32 full factorial experiment was designed to study the effect of
Concentration of HPMC (X1) and PEO (X2) combination on the % cumulative
release after two hours (Y1), after 6 hours (Y2) and on the % cumulative release after
10 hours (Y3) in the core tablet. In vitro release profiles of all the batches were
performed with the kinetic model studies. Response surface graph were presented to
examine the effects of independent variables on the responses studied. The optimized
factorial batch was further given the functional coating to control the release. 32 x 21
factorial design was applied to study the effect of ratio of polymer:plasticizer (X1), %
coating (X2) and grade of polymer(X3). Polymer grade was used at 2 levels, whereas
other two factors at 3 levels. The final optimized batch was kept for 3 months of
stability study according to ICH guidelines and formulation was found to be stable
after 3 months of study. The optimized batch was studied for the dissolution kinetic
modeling.
KEYWORDS: Surface response graphs, 32 full factorial design, functional coating,
Anti-depressant drug, 32 x 21 factorial design
XIII
CONTENTS
SL. NO. TITLE PAGE
NO.
1. INTRODUCTION 1-36
2. OBJECTIVE OF STUDY 37-38
3. INTRODUCTION TO MATERIALS 39-69
4. REVIEW OF LITERATURE 70-79
5. MATERIAL & METHODOLOGY-1 80-100
6. RESULTS AND DISCUSSION-1 101-147
7. MATERIAL & METHODOLOGY-2 148-163
8. RESULTS AND DISCUSSION-2 164-179
9. CONCLUSION 180-181
10. SUMMARY 182-184
11. BIBLIOGRAPHY 185-195
12. ANNEXURE
XIV
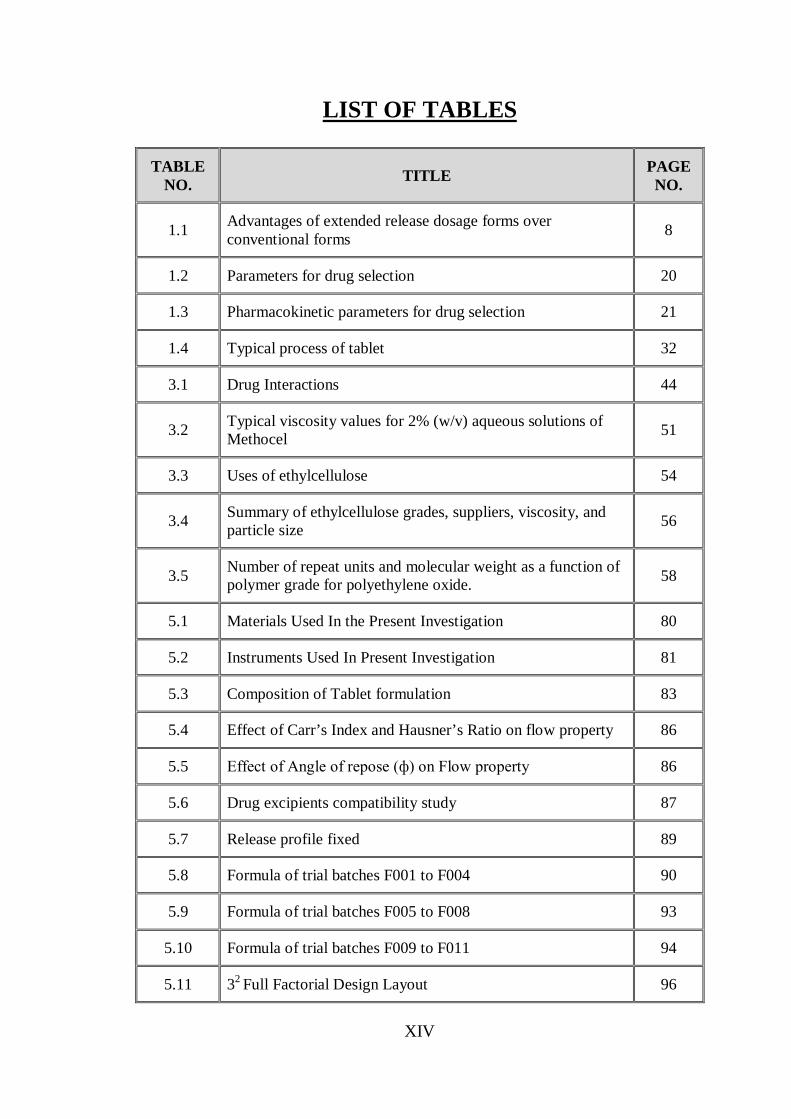
LIST OF TABLES
TABLE NO. TITLE PAGE
NO.
1.1 Advantages of extended release dosage forms over conventional forms 8
1.2 Parameters for drug selection 20
1.3 Pharmacokinetic parameters for drug selection 21
1.4 Typical process of tablet 32
3.1 Drug Interactions 44
3.2 Typical viscosity values for 2% (w/v) aqueous solutions of Methocel 51
3.3 Uses of ethylcellulose 54
3.4 Summary of ethylcellulose grades, suppliers, viscosity, and particle size 56
3.5 Number of repeat units and molecular weight as a function of polymer grade for polyethylene oxide. 58
5.1 Materials Used In the Present Investigation 80
5.2 Instruments Used In Present Investigation 81
5.3 Composition of Tablet formulation 83
5.4 Effect of Carr’s Index and Hausner’s Ratio on flow property 86
5.5 Effect of Angle of repose (ф) on Flow property 86
5.6 Drug excipients compatibility study 87
5.7 Release profile fixed 89
5.8 Formula of trial batches F001 to F004 90
5.9 Formula of trial batches F005 to F008 93
5.10 Formula of trial batches F009 to F011 94
5.11 32 Full Factorial Design Layout 96
XV
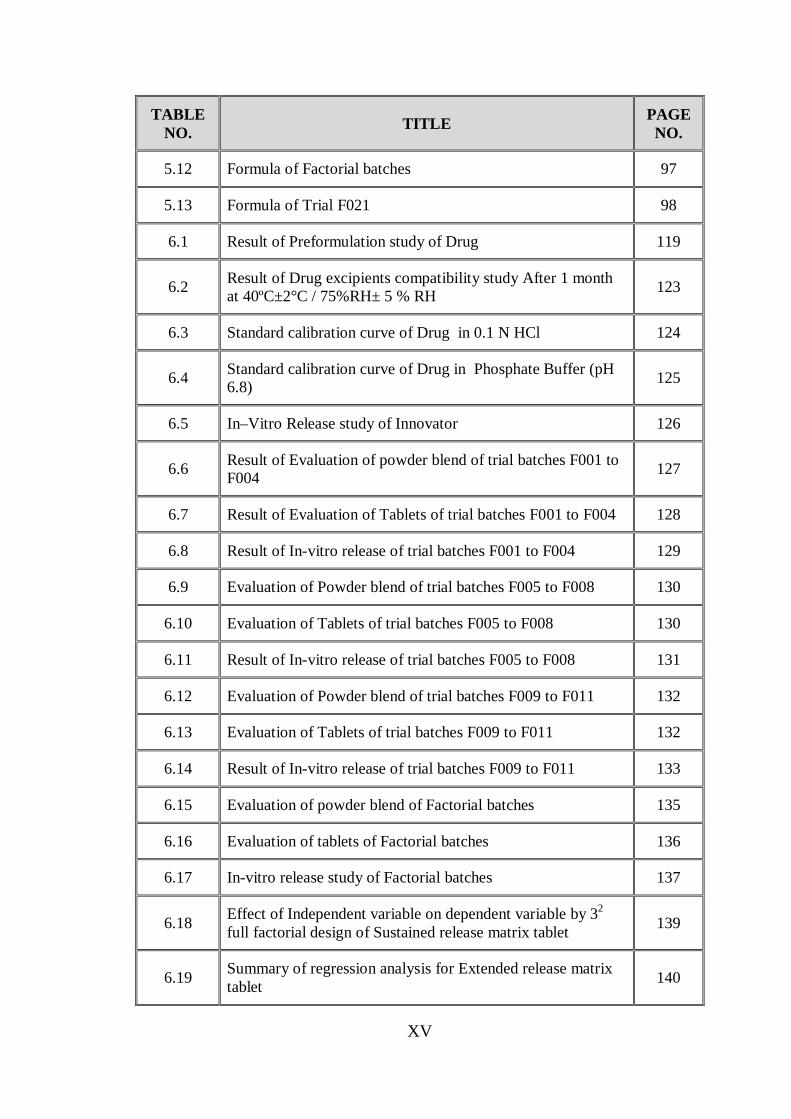
TABLE NO. TITLE PAGE
NO.
5.12 Formula of Factorial batches 97
5.13 Formula of Trial F021 98
6.1 Result of Preformulation study of Drug 119
6.2 Result of Drug excipients compatibility study After 1 month at 40ºC±2°C / 75%RH± 5 % RH 123
6.3 Standard calibration curve of Drug in 0.1 N HCl 124
6.4 Standard calibration curve of Drug in Phosphate Buffer (pH 6.8) 125
6.5 In–Vitro Release study of Innovator 126
6.6 Result of Evaluation of powder blend of trial batches F001 to F004 127
6.7 Result of Evaluation of Tablets of trial batches F001 to F004 128
6.8 Result of In-vitro release of trial batches F001 to F004 129
6.9 Evaluation of Powder blend of trial batches F005 to F008 130
6.10 Evaluation of Tablets of trial batches F005 to F008 130
6.11 Result of In-vitro release of trial batches F005 to F008 131
6.12 Evaluation of Powder blend of trial batches F009 to F011 132
6.13 Evaluation of Tablets of trial batches F009 to F011 132
6.14 Result of In-vitro release of trial batches F009 to F011 133
6.15 Evaluation of powder blend of Factorial batches 135
6.16 Evaluation of tablets of Factorial batches 136
6.17 In-vitro release study of Factorial batches 137
6.18 Effect of Independent variable on dependent variable by 32 full factorial design of Sustained release matrix tablet 139
6.19 Summary of regression analysis for Extended release matrix tablet 140
XVI
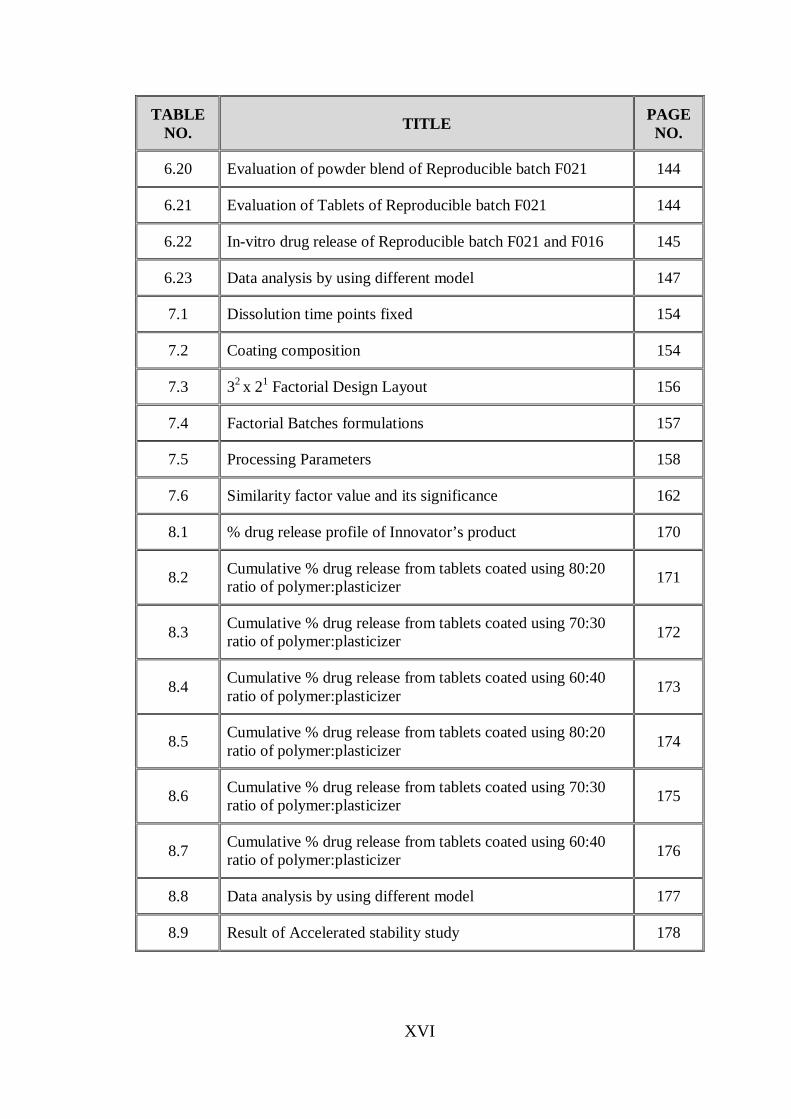
TABLE NO. TITLE PAGE
NO.
6.20 Evaluation of powder blend of Reproducible batch F021 144
6.21 Evaluation of Tablets of Reproducible batch F021 144
6.22 In-vitro drug release of Reproducible batch F021 and F016 145
6.23 Data analysis by using different model 147
7.1 Dissolution time points fixed 154
7.2 Coating composition 154
7.3 32 x 21 Factorial Design Layout 156
7.4 Factorial Batches formulations 157
7.5 Processing Parameters 158
7.6 Similarity factor value and its significance 162
8.1 % drug release profile of Innovator’s product 170
8.2 Cumulative % drug release from tablets coated using 80:20 ratio of polymer:plasticizer 171
8.3 Cumulative % drug release from tablets coated using 70:30 ratio of polymer:plasticizer 172
8.4 Cumulative % drug release from tablets coated using 60:40 ratio of polymer:plasticizer 173
8.5 Cumulative % drug release from tablets coated using 80:20 ratio of polymer:plasticizer 174
8.6 Cumulative % drug release from tablets coated using 70:30 ratio of polymer:plasticizer 175
8.7 Cumulative % drug release from tablets coated using 60:40 ratio of polymer:plasticizer 176
8.8 Data analysis by using different model 177
8.9 Result of Accelerated stability study 178

XVII
LIST OF FIGURES
FIGURE NO. TITLE PAGE
NO.
1.1 Drug release from hydrophilic matrix tablet 13
1.2 The fronts in a swellable HPMC matrix 17
3.1 Structure of Drug 39
3.2 Structure of HPMC 48
3.3 Structure of Ethyl cellulose 53
6.1 Thermal Analysis result of pure drug 119
6.2 Thermal Analysis result of Drug + PEO 120
6.3 Thermal Analysis result of Drug + MCC 120
6.4 Thermal Analysis result of Drug + HPMC 121
6.5 Thermal Analysis result of Drug + Stearic Acid 121
6.6 Thermal Analysis result of Drug + Mg - stearate 122
6.7 Thermal Analysis result of Mixture of Drug with other excipients
122
6.8 Calibration curve of Drug in 0.1 N HCl at 275nm 124
6.9 Calibration curve of Drug in Phosphate buffer pH 6.8 at 275nm
125
6.10 In-vitro drug release profile of Innovator’s product 126
6.11 Dissolution profile of F001 to F004 129
6.12 Dissolution Profile of f005 to foo8 131
6.13 Comparative dissolution profile of Trials F009 to F011 134
6.14 Comparative dissolution profile of Factorial batches of F012 to F020
138
XVIII
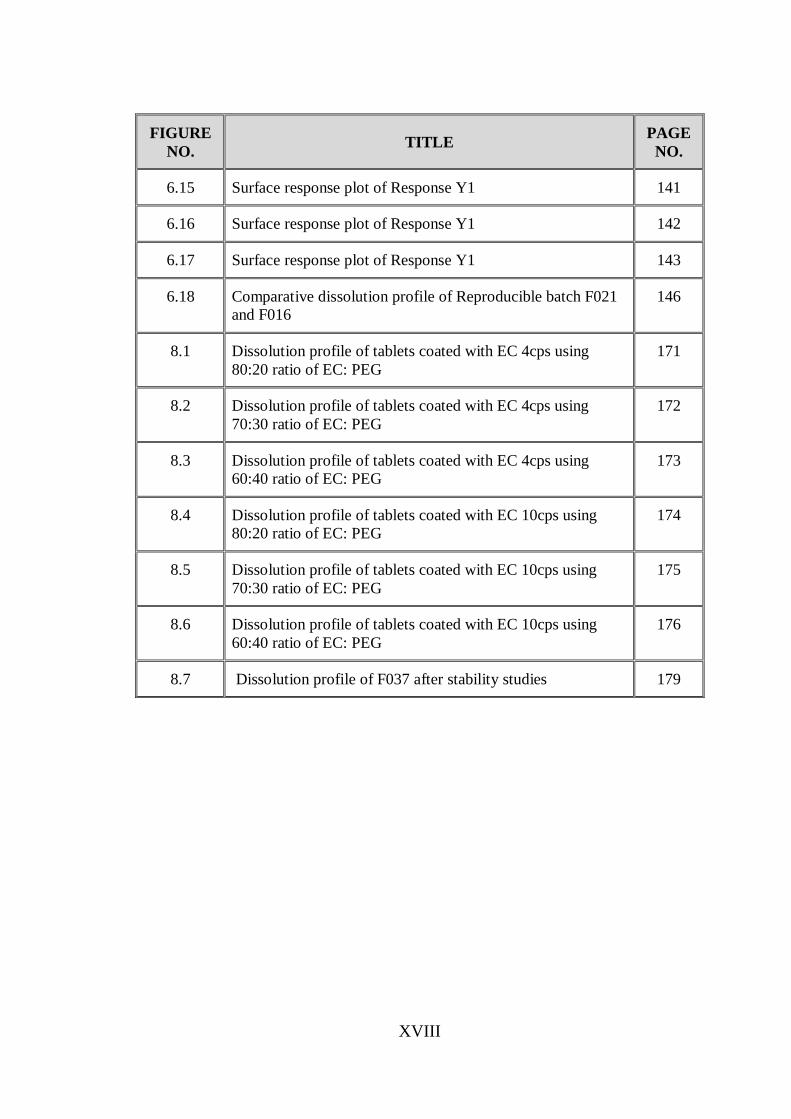
FIGURE NO. TITLE PAGE
NO.
6.15 Surface response plot of Response Y1 141
6.16 Surface response plot of Response Y1 142
6.17 Surface response plot of Response Y1 143
6.18 Comparative dissolution profile of Reproducible batch F021 and F016
146
8.1 Dissolution profile of tablets coated with EC 4cps using 80:20 ratio of EC: PEG
171
8.2 Dissolution profile of tablets coated with EC 4cps using 70:30 ratio of EC: PEG
172
8.3 Dissolution profile of tablets coated with EC 4cps using 60:40 ratio of EC: PEG
173
8.4 Dissolution profile of tablets coated with EC 10cps using 80:20 ratio of EC: PEG
174
8.5 Dissolution profile of tablets coated with EC 10cps using 70:30 ratio of EC: PEG
175
8.6 Dissolution profile of tablets coated with EC 10cps using 60:40 ratio of EC: PEG
176
8.7 Dissolution profile of F037 after stability studies 179
Chapter -1 IInnttrroodduuccttiioonn
Department of Pharmaceutics, KLE University, Belgaum 1
1.1 Oral drug delivery systems 1.1.1 Introduction
Oral drug delivery has been known for decades as the most widely utilized route of
administration among all the routes that have been explored for the systemic delivery
of drugs via various pharmaceutical products of different dosage forms. The reasons
that the oral route achieved such popularity may be in part of its ease of
administration as well as the traditional belief that by oral administration the drug is
well absorbed as the food stuffs that are ingested daily. The development of a
pharmaceutical product for oral delivery irrespective of its physical forms (solid,
semisolid, or oral liquid dosage form) involves varying extents of optimization of
dosage form characteristics within the inherent constraints of gastrointestinal
physiology1.
Oral dosage forms are taken orally for a local effect in the mouth, throat or
gastrointestinal tract or for a systemic effect in the body after absorption from the
mouth or gastrointestinal tract. Oral dosage forms can be divided into two main
groups based on the physical state of the dosage form, solid oral dosage forms
(tablets, capsules or powders) and liquid oral dosage forms (solutions, syrups,
emulsions, and powders for suspensions)2.
1.1.2 Merits and Demerits of solid oral dosage forms
1.1.2.1 Merits
Unit dose system and Long shelf life
More Economic and Ease of administration
Tastelessness and Elegance
Patient compliance
Chapter -1 IInnttrroodduuccttiioonn
Department of Pharmaceutics, KLE University, Belgaum 2
1.1.2.2 Demerits
Posses swallowing difficulty
Onset of action is slow and depends on disintegration and dissolution
1.1.3 Merits and Demerits of liquid oral dosage forms
1.1.3.1 Merits
Onset of action is quick as compared to pills, tablets and capsules
Certain medicinal substances can only be given in liquid form such as liquid
paraffin, castor oil etc
Certain drugs are to be in suspended or diffused form to produce maximum
surface area viz., kaolin
Few drugs if taken in dry form may cause pain and irritation for e.g. potassium
bromide and aspirin.
1.1.3.2 Demerits
Dose has to be measured
May not be highly stable
May face storage and transportation hazards3
1.1.4 Types of oral drug delivery systems
Approximately 50% of the drugs in the market are available in their oral dosage forms
because of its easily administration and patient compliance; some of the oral dosage
forms are as follows.
Chapter -1 IInnttrroodduuccttiioonn
Department of Pharmaceutics, KLE University, Belgaum 3
1.1.4.1 Solid oral dosage forms
1.1.4.1.1 Powders
Powders are dry mixtures of finely divided medicinal and nonmedicinal agents
intended for internal or external use. Powders may be dispensed to a patient and used
in bulk form or as a single unit packaged form.
1.1.4.1.2 Tablets
Tablets are solid oral dosage forms containing one or more medicinal substances with
or without added pharmaceutical ingredients. Tablets may be coated for appearance,
for stability, to mask the bitter taste of the medication, or to provide controlled drug
release. Tablets are solid, flat or biconvex discs prepared by compressing a drug or
mixture of drugs with or without suitable diluents. They vary in shape and differ
greatly in size and weight depending on the amount of medicinal substances and the
intended mode of administration. Most tablets are intended to be swallowed orally.
Some however, are prepared for chewing and have a pleasant taste and feel. Other
tablets dissolve in the mouth (buccal tablets) or under the tongue (sublingual tablets),
whereas effervescent tablets are intended to be dissolved in water before taking.
1.1.4.1.3 Capsules
Hard gelatin capsules are solid dosage forms in which one or more medicinal and
inert substances are enclosed within small shells of gelatin. Capsule shells are
produced in varying size, shape, thickness, softness, and color. Hard shell capsules,
which have two telescoping parts–the body and the cap are commonly used in
extemporaneous hand filling operations as well as in small & large scale manufacture
of commercial capsules. After filling, two capsule parts are joined for tight closure.
Soft-shell gelatin capsules, which are one bodied, are formed, filled, and sealed in the
same process. Highly specialized and large-scale equipment is required, and thus soft
Chapter -1 IInnttrroodduuccttiioonn
Department of Pharmaceutics, KLE University, Belgaum 4
gelatin capsules are only prepared commercially. They are rendered soft through the
addition of a plasticizer to the capsule shell. Soft gelatin capsules may be filled with
powders, semisolids, or liquids.
1.1.4.1.4 Lozenges
Lozenges are solid preparations containing one or more medicinal agents in a
flavored, sweetened base intended to dissolve or disintegrate slowly in the mouth,
releasing medication generally for localized effects. Lozenges are prepared by
molding or compression.
1.1.4.2 Liquid oral dosage forms
1.1.4.2.1 Solutions
The USP states that “Oral solutions are liquid preparations, intended for oral
administration, that contain one or more substances with or without flavoring,
sweetening or coloring agents dissolved in water or cosolvent-water mixture.” A
solution is a homogeneous, one phase system, or product that has two or more
components.
1.1.4.2.2 Elixir
An elixir is a type of solution. Therefore, it is a homogeneous one –phase product. An
elixir has three or more components. Two of the components are water and alcohol.
An elixir is a solution since all of the components are present in one phase.
1.1.4.2.3 Syrup
Syrup is another type of solution. Like a solution or elixir, it is a homogeneous, one-
phase product. Syrups can be medicated or nonmedicated. Medicated syrups contain
three or more components. Most syrup contains a high proportion of sucrose, usually
60 to 80 % (w/v). The most commonly used syrup is syrup NF, also known as simple
syrup.
Chapter -1 IInnttrroodduuccttiioonn
Department of Pharmaceutics, KLE University, Belgaum 5
1.1.4.2.4 Suspensions
A suspension is a dispersion of insoluble drug particles (the disperse phase) in a
liquid; usually water (the dispersion medium). This is a two phase system since there
is one kind of solid particle dispersed in a continuous fluid medium. Drugs with
limited solubility, or large dose requirements, are often formulated in a suspension
dosage form.
1.1.4.2.5 Emulsion
An emulsion is a two phase system with at least three components. It is composed of
oil and water and an appropriate emulsifying agent. If water droplets are dispersed
throughout a continuous oil phase, then it is a water-in-oil emulsion. If oil droplets are
dispersed throughout a continuous water phase, it is an oil-in-water emulsion2.
Chapter -1 IInnttrroodduuccttiioonn
Department of Pharmaceutics, KLE University, Belgaum 6
1.2 Extended drug delivery systems:
1.2.1 Introduction
Extended release drug delivery systems are designed to release drug in a pre-
determined manner over an extended period of time. An extended-release dosage
form may be desirable to provide patients with a convenient dosage regimen that
allows less frequent dosing, thus enhancing compliance. Extended release dosing can
reduce peak-related side effects, maintain therapeutic concentrations throughout the
dosing period avoiding periods of insufficient therapeutic plasma concentrations
between doses, and enable a less frequent dosing regimen. Extended drug delivery
systems are beneficial especially for the patients who are not able to take the medicine
frequently specially in geriatric and mental patients2.
1.2.2 Types of extended-release products
1.2.2.1 Diffusion-controlled products
In these systems, there is a water-insoluble polymer, which controls the flow of water
and the subsequent release of dissolved drug from the dosage form. Both diffusional
and dissolution processes are involved. In `reservoir' devices, a core of drug is coated
with the polymer and, in `matrix' systems; the drug is dispensed throughout the
matrix. Cellulose derivatives are commonly used in the reservoir types, while the
matrix material may be plastic, e.g. methylacrylate-methylmethacrylate, polyvinyl
chloride, and hydrophilic polymers such as cellulose derivatives or fatty compounds
including carnauba wax.
1.2.2.2 Dissolution-controlled products
In these products, the rate of dissolution of the drug (and thereby availability for
absorption) is controlled by slowly soluble polymers or by microencapsulation. Once
the coating is dissolved, the drug becomes available for dissolution. By varying the
Chapter -1 IInnttrroodduuccttiioonn
Department of Pharmaceutics, KLE University, Belgaum 7
thicknesses of the coat and its composition, the rate of drug release can be controlled.
Some preparations contain a fraction of the total dose as an immediate-release
component to provide a pulse dose soon after administration4. The pellet dosage
forms of diffusion- or dissolution-controlled products can be encapsulated or prepared
as a tablet. These products should not be chewed as the coating may be damaged. One
of the advantages of encapsulated pelleted products is that the onset of absorption is
less sensitive to stomach emptying. The entrance of the pellets into the small intestine
(where the majority of drug absorption occurs) is usually more uniform than with
non-disintegrating extended-release tablet formulations2.
1.2.2.3 Erosion products
The release of drug from these products is controlled by the erosion rate of a carrier
matrix. The rate of release is determined by the rate of erosion. With this product,
some patients may experience a later onset of effect after the morning dose, compared
to conventional tablets. E.g.: Delayed release of the drug Levodopa.
1.2.2.4 Osmotic pump system
The rate of release of drug in these products is determined by the constant inflow of
water across a semipermeable membrane into a reservoir, which contains an osmotic
agent. The drug is either mixed with the agent is located in a reservoir. The dosage
form contains a small hole from which dissolved drug is pumped at a rate determined
by the rate of entrance of water due to osmotic pressure. The rate of release is
constant and can be controlled within tight limits yielding relatively constant blood
concentrations. The advantage of this type of product is that the constant release is
unaltered by the environment of the gastrointestinal tract and relies simply on the
passage of water into the dosage form. The rate of release can be modified by altering
the osmotic agent and the size of the hole.
Chapter -1 IInnttrroodduuccttiioonn
Department of Pharmaceutics, KLE University, Belgaum 8
1.2.2.5 Ion exchange resins
Some drugs can be bound to ion exchange resins and, when ingested, the release of
drug is determined by the ionic environment within the gastrointestinal tract4.
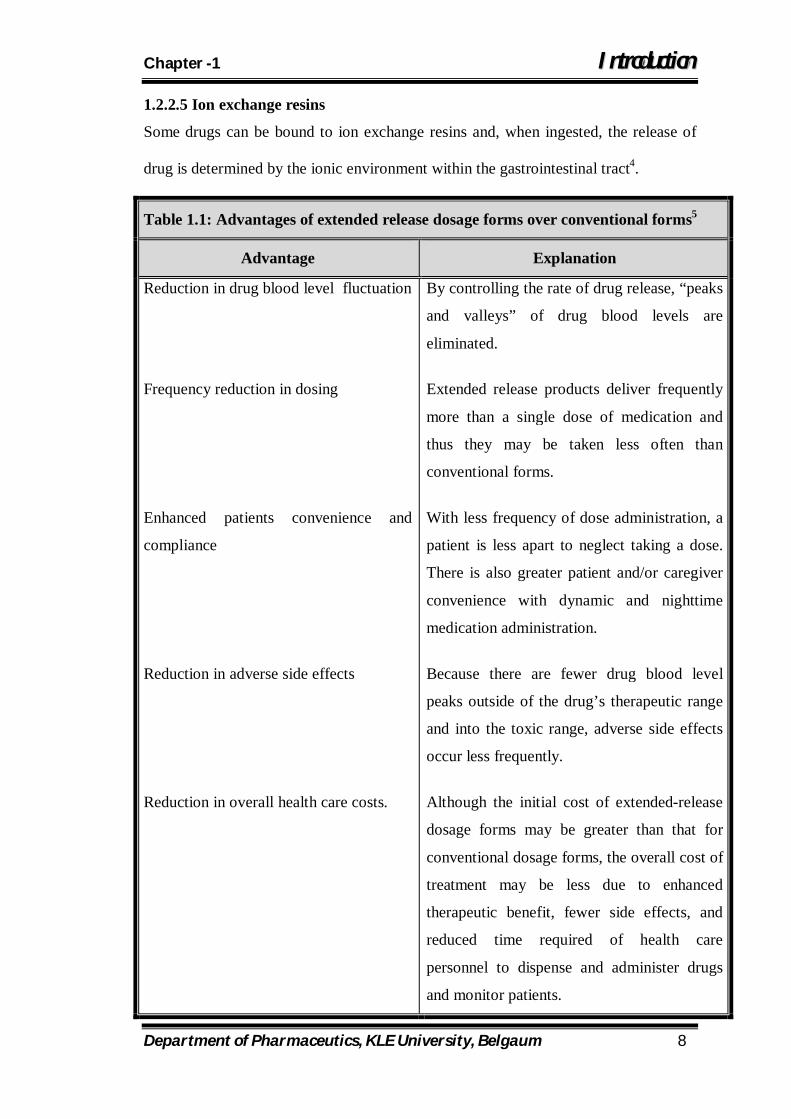
Table 1.1: Advantages of extended release dosage forms over conventional forms5
Advantage Explanation
Reduction in drug blood level fluctuation
Frequency reduction in dosing
Enhanced patients convenience and
compliance
Reduction in adverse side effects
Reduction in overall health care costs.
By controlling the rate of drug release, “peaks
and valleys” of drug blood levels are
eliminated.
Extended release products deliver frequently
more than a single dose of medication and
thus they may be taken less often than
conventional forms.
With less frequency of dose administration, a
patient is less apart to neglect taking a dose.
There is also greater patient and/or caregiver
convenience with dynamic and nighttime
medication administration.
Because there are fewer drug blood level
peaks outside of the drug’s therapeutic range
and into the toxic range, adverse side effects
occur less frequently.
Although the initial cost of extended-release
dosage forms may be greater than that for
conventional dosage forms, the overall cost of
treatment may be less due to enhanced
therapeutic benefit, fewer side effects, and
reduced time required of health care
personnel to dispense and administer drugs
and monitor patients.
Chapter -1 IInnttrroodduuccttiioonn
Department of Pharmaceutics, KLE University, Belgaum 9
1.2.3 Mechanisms of drug release from matrix systems
The release of drug from controlled devices is via dissolution or diffusion or a
combination of the two mechanisms.
1. Dissolution controlled systems
A drug with slow dissolution rate will demonstrate sustaining properties, since the
release of the drug will be limited by the rate of dissolution. In principle, it would
seem possible to prepare extended release products by decreasing the
dissolution rate of drugs that are highly water-soluble7. This can be done by:
Preparing an appropriate salt or derivative
Coating the drug with a slowly dissolving material – encapsulation
dissolution control
Incorporating the drug into a tablet with a slowly dissolving carrier –
matrix dissolution control (a major disadvantage is that the drug release
rate continuously decreases with time).
The dissolution process can be considered diffusion-layer-controlled, where the
rate of diffusion from the solid surface to the bulk solution through an unstirred
liquid film is the rate-determining step. The dissolution process at steady-state is
described by the Noyes-Whitney equation:
………………….. (1)
Where,
dC / dt = dissolution rate
D = the dissolution rate constant (equivalent to the diffusion coefficient
divided by the thickness of the diffusion layer D/h)
Chapter -1 IInnttrroodduuccttiioonn
Department of Pharmaceutics, KLE University, Belgaum 10
Co = saturation solubility of the solid
C = concentration of solute in the bulk solution
A = Surface area
h = Diffusion layer thickness
Equation predicts that the rate of release can be constant only if the following
parameters are held constant:
Surface area
Diffusion coefficient
Diffusion layer thickness
Concentration difference.
These parameters, however, are not easily maintained constant, especially
surface area, and this is the case for combination diffusion and dissolution
systems7.
2. Diffusion controlled systems
Diffusion systems are characterized by the release rate of a drug being
dependent on its diffusion through an inert membrane barrier6. Usually, this barrier is
an insoluble polymer. In general, two types or subclasses of diffusional systems are
recognized: reservoir devices and matrix devices7. It is very common for the
diffusion-controlled devices to exhibit a non-zero order release rate due to an
increase in diffusional resistance and a decrease in effective diffusion area as the
release proceeds8.
Diffusion in matrix devices
In this model, drug in the outside layer exposed to the bathing solution is
dissolved first and then diffuses out of the matrix. This process continues with the
interface between the bathing solution and the solid drug moving toward the
Chapter -1 IInnttrroodduuccttiioonn
Department of Pharmaceutics, KLE University, Belgaum 11
interior. It follows obviously that for this system to be diffusion controlled, the rate
of dissolution of drug particles within the matrix must be much faster than the
diffusion rate of dissolved drug leaving the matrix7. Derivation of the
mathematical model to describe this system involves the following
assumptions:
a. A pseudo-steady state is maintained during drug release;
b. The diameter of the drug particles is less than the average distance of drug
diffusion through the matrix;
c. T he diffusion coefficient of drug in the matrix remains constant (no change
occurs in the characteristics of the polymer matrix7;
d. The bathing solution provides sink conditions at all times;
e. No interaction occurs between the drug and the matrix;
f. The total amount of drug present per unit volume in the matrix is substantially
greater than the saturation solubility of the drug per unit volume in the
matrix(Excess solute is present)9
g. Only the diffusion process occurs10
In a hydrophilic matrix, there are two competing mechanisms involved in the
drug release: Fickian diffusional release and relaxation release. Diffusion is not
the only pathway by which a drug is released from the matrix; the erosion of the
matrix following polymer relaxation contributes to the overall release. The relative
contribution of each component to the total release is primarily dependent on the
properties of a given drug11.
For example, the release of a sparingly soluble drug from hydrophilic matrices
involves the simultaneous absorption of water and desorption of drug via a
swelling-controlled diffusion mechanism. As water penetrates into a glassy

Chapter -1 IInnttrroodduuccttiioonn
Department of Pharmaceutics, KLE University, Belgaum 12
polymeric matrix, the polymer swells and its glass transition temperature is
lowered. At the same time, the dissolved drug diffuses through this swollen
rubbery region into the external releasing medium12.
This type of diffusion and swelling does not generally follow a Fickian diffusion
mechanism10. The semi-empirical equation to describe drug release behavior from
hydrophilic matrix systems12:
Q = k ⋅ t n …………………(2) Where,
Q = fraction of drug released in time t,
k = rate constant incorporating characteristics of the macromolecular network
system and the drug
n = the diffusional exponent. It has been shown that the value of n is indicative of
the drug release mechanism.
For n=0.5, drug release follows a Fickian diffusion mechanism that is driven by a
chemical potential gradient. For n=1 drug release occurs via the relaxational transport
that is associated with stresses and phase transition in hydrated polymers. For
0.5<n<1 non-Fickian diffusion is often observed as a result of the
contributions from diffusion and polymer erosion10.
Chapter -1 IInnttrroodduuccttiioonn
Department of Pharmaceutics, KLE University, Belgaum 13
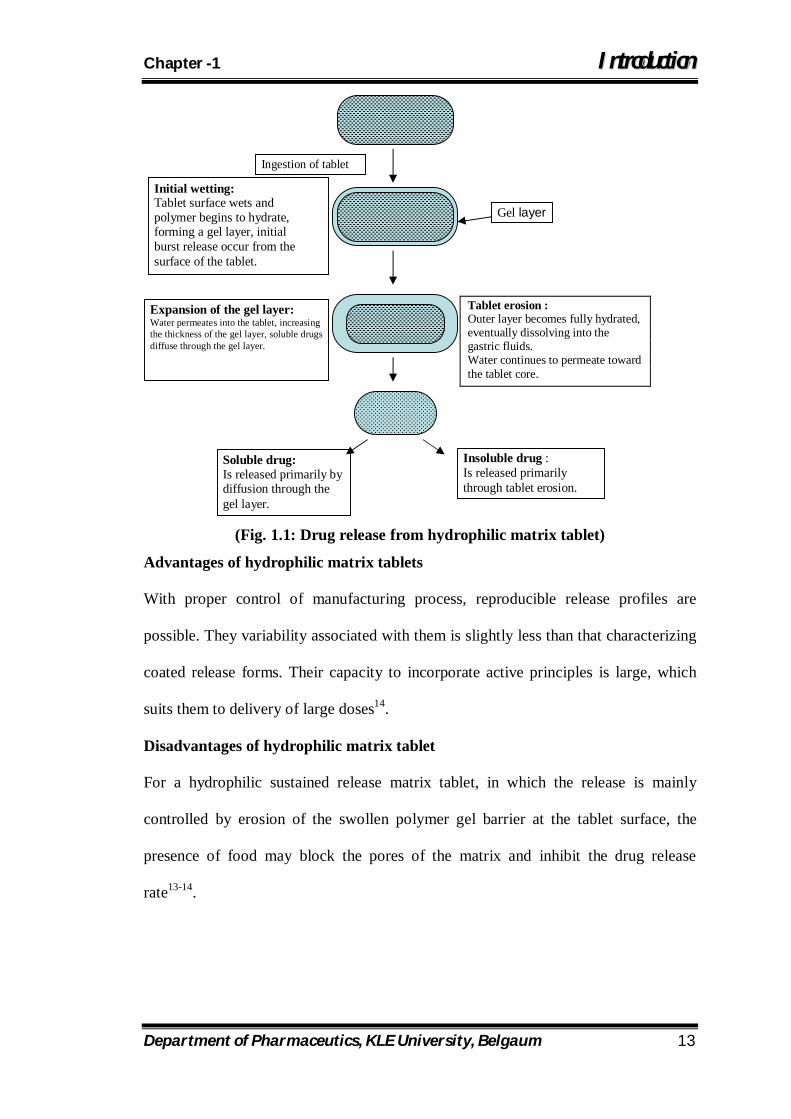
(Fig. 1.1: Drug release from hydrophilic matrix tablet)
Advantages of hydrophilic matrix tablets
With proper control of manufacturing process, reproducible release profiles are
possible. They variability associated with them is slightly less than that characterizing
coated release forms. Their capacity to incorporate active principles is large, which
suits them to delivery of large doses14.
Disadvantages of hydrophilic matrix tablet
For a hydrophilic sustained release matrix tablet, in which the release is mainly
controlled by erosion of the swollen polymer gel barrier at the tablet surface, the
presence of food may block the pores of the matrix and inhibit the drug release
rate13-14.
Tablet erosion : Outer layer becomes fully hydrated, eventually dissolving into the gastric fluids. Water continues to permeate toward the tablet core.
Gel layer
Ingestion of tablet
Initial wetting: Tablet surface wets and polymer begins to hydrate, forming a gel layer, initial burst release occur from the surface of the tablet.
Expansion of the gel layer: Water permeates into the tablet, increasing the thickness of the gel layer, soluble drugs diffuse through the gel layer.
Soluble drug: Is released primarily by diffusion through the gel layer.
Insoluble drug : Is released primarily through tablet erosion.
Chapter -1 IInnttrroodduuccttiioonn
Department of Pharmaceutics, KLE University, Belgaum 14
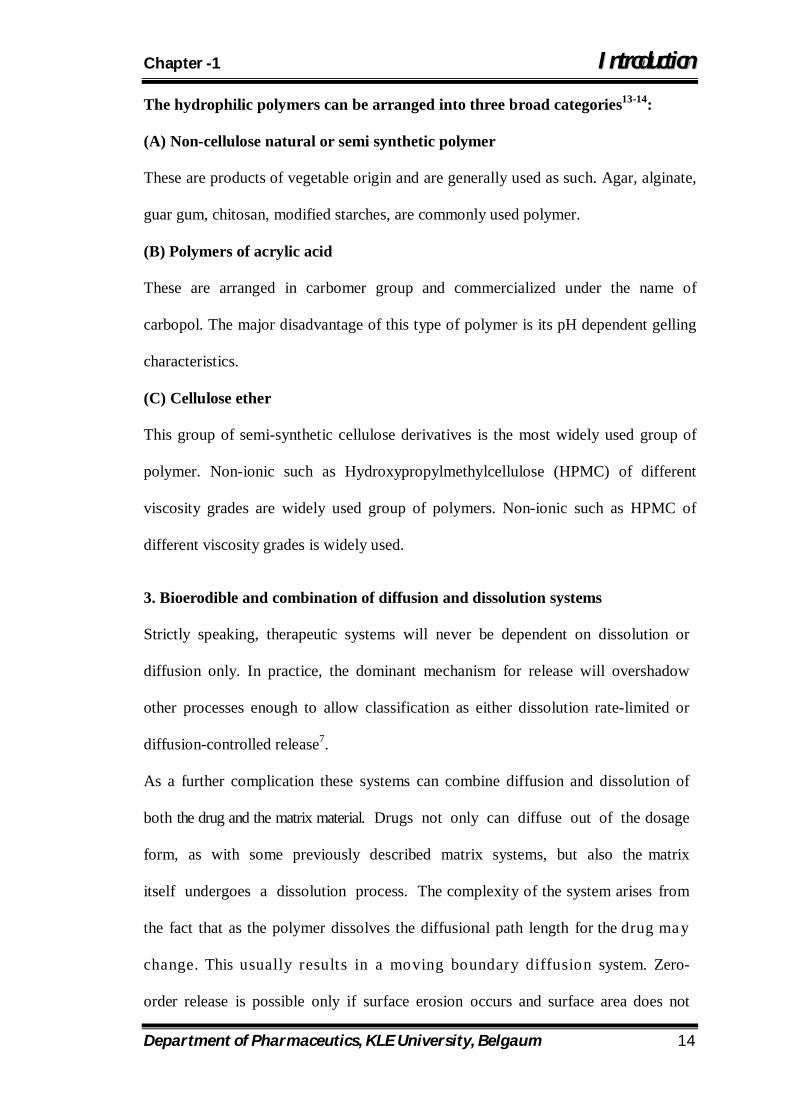
The hydrophilic polymers can be arranged into three broad categories13-14:
(A) Non-cellulose natural or semi synthetic polymer
These are products of vegetable origin and are generally used as such. Agar, alginate,
guar gum, chitosan, modified starches, are commonly used polymer.
(B) Polymers of acrylic acid
These are arranged in carbomer group and commercialized under the name of
carbopol. The major disadvantage of this type of polymer is its pH dependent gelling
characteristics.
(C) Cellulose ether
This group of semi-synthetic cellulose derivatives is the most widely used group of
polymer. Non-ionic such as Hydroxypropylmethylcellulose (HPMC) of different
viscosity grades are widely used group of polymers. Non-ionic such as HPMC of
different viscosity grades is widely used.
3. Bioerodible and combination of diffusion and dissolution systems
Strictly speaking, therapeutic systems will never be dependent on dissolution or
diffusion only. In practice, the dominant mechanism for release will overshadow
other processes enough to allow classification as either dissolution rate-limited or
diffusion-controlled release7.
As a further complication these systems can combine diffusion and dissolution of
both the drug and the matrix material. Drugs not only can diffuse out of the dosage
form, as with some previously described matrix systems, but also the matrix
itself undergoes a dissolution process. The complexity of the system arises from
the fact that as the polymer dissolves the diffusional path length for the drug may
change. This usually results in a moving boundary diffusion system. Zero-
order release is possible only if surface erosion occurs and surface area does not
Chapter -1 IInnttrroodduuccttiioonn
Department of Pharmaceutics, KLE University, Belgaum 15
change with time.
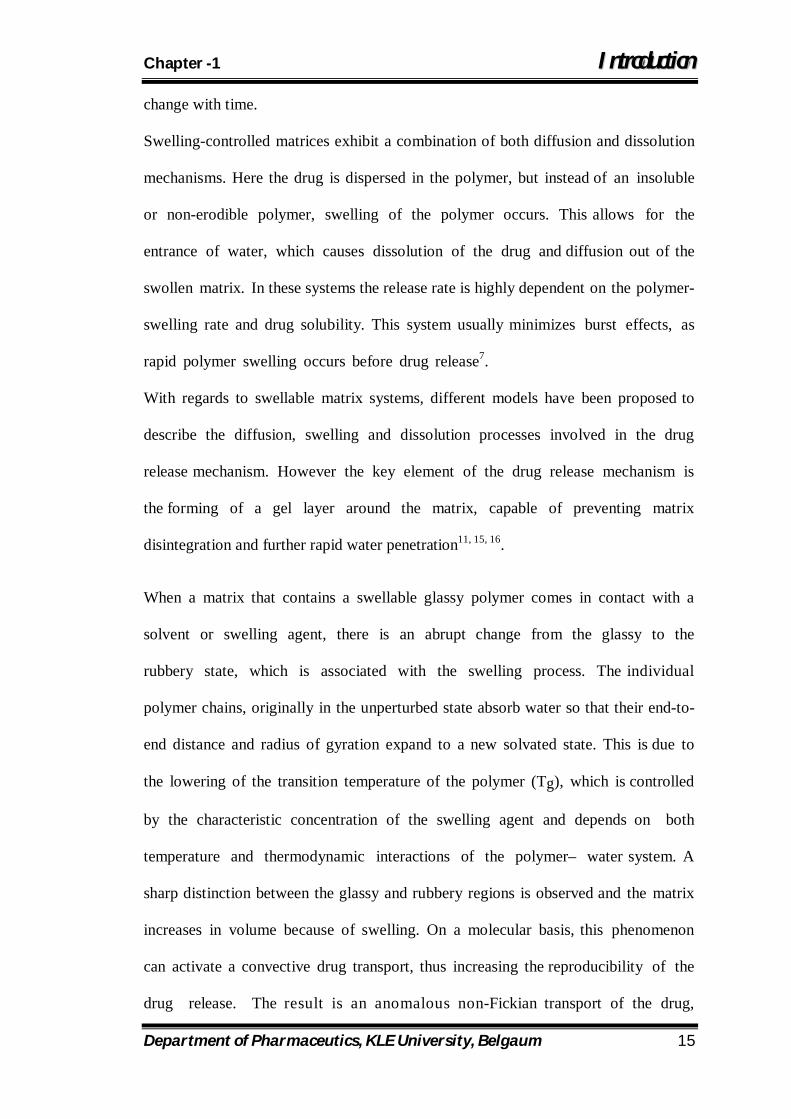
Swelling-controlled matrices exhibit a combination of both diffusion and dissolution
mechanisms. Here the drug is dispersed in the polymer, but instead of an insoluble
or non-erodible polymer, swelling of the polymer occurs. This allows for the
entrance of water, which causes dissolution of the drug and diffusion out of the
swollen matrix. In these systems the release rate is highly dependent on the polymer-
swelling rate and drug solubility. This system usually minimizes burst effects, as
rapid polymer swelling occurs before drug release7.
With regards to swellable matrix systems, different models have been proposed to
describe the diffusion, swelling and dissolution processes involved in the drug
release mechanism. However the key element of the drug release mechanism is
the forming of a gel layer around the matrix, capable of preventing matrix
disintegration and further rapid water penetration11, 15, 16.
When a matrix that contains a swellable glassy polymer comes in contact with a
solvent or swelling agent, there is an abrupt change from the glassy to the
rubbery state, which is associated with the swelling process. The individual
polymer chains, originally in the unperturbed state absorb water so that their end-to-
end distance and radius of gyration expand to a new solvated state. This is due to
the lowering of the transition temperature of the polymer (Tg), which is controlled
by the characteristic concentration of the swelling agent and depends on both
temperature and thermodynamic interactions of the polymer– water system. A
sharp distinction between the glassy and rubbery regions is observed and the matrix
increases in volume because of swelling. On a molecular basis, this phenomenon
can activate a convective drug transport, thus increasing the reproducibility of the
drug release. The result is an anomalous non-Fickian transport of the drug,
Chapter -1 IInnttrroodduuccttiioonn
Department of Pharmaceutics, KLE University, Belgaum 16
owing to the polymer-chain relaxation behind the swelling position. This, in turn,
creates osmotic stresses and convective transport effects.
The gel strength is important in the matrix performance and is controlled by the
concentration, viscosity and chemical structure of the rubbery polymer. This restricts
the suitability of the hydrophilic polymers for preparation of swellable matrices.
Polymers such as carboxymethyl cellulose, hydroxypropyl cellulose or tragacanth gum,
do not form the gel layer quickly. Consequently, they are not recommended as
excipients to be used alone in swellable matrices15, 17.
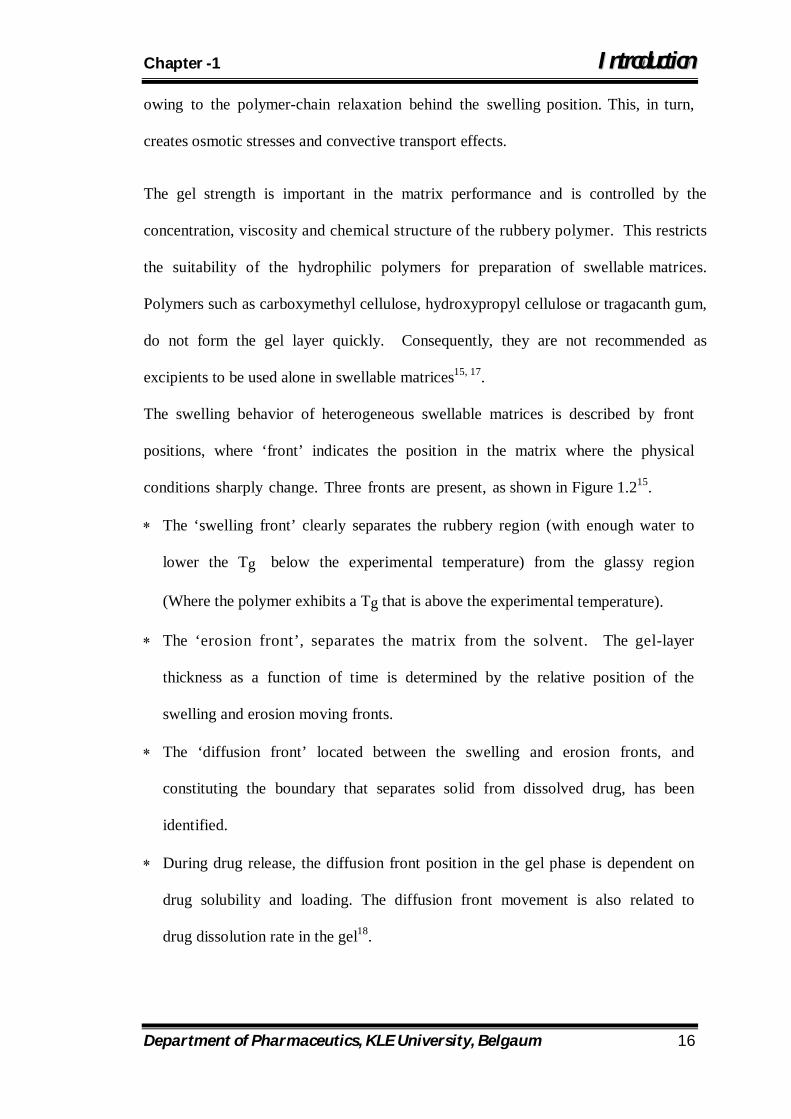
The swelling behavior of heterogeneous swellable matrices is described by front
positions, where ‘front’ indicates the position in the matrix where the physical
conditions sharply change. Three fronts are present, as shown in Figure 1.215.
The ‘swelling front’ clearly separates the rubbery region (with enough water to
lower the Tg below the experimental temperature) from the glassy region
(Where the polymer exhibits a Tg that is above the experimental temperature).
The ‘erosion front’, separates the matrix from the solvent. The gel-layer
thickness as a function of time is determined by the relative position of the
swelling and erosion moving fronts.
The ‘diffusion front’ located between the swelling and erosion fronts, and
constituting the boundary that separates solid from dissolved drug, has been
identified.
During drug release, the diffusion front position in the gel phase is dependent on
drug solubility and loading. The diffusion front movement is also related to
drug dissolution rate in the gel18.
Chapter -1 IInnttrroodduuccttiioonn
Department of Pharmaceutics, KLE University, Belgaum 17
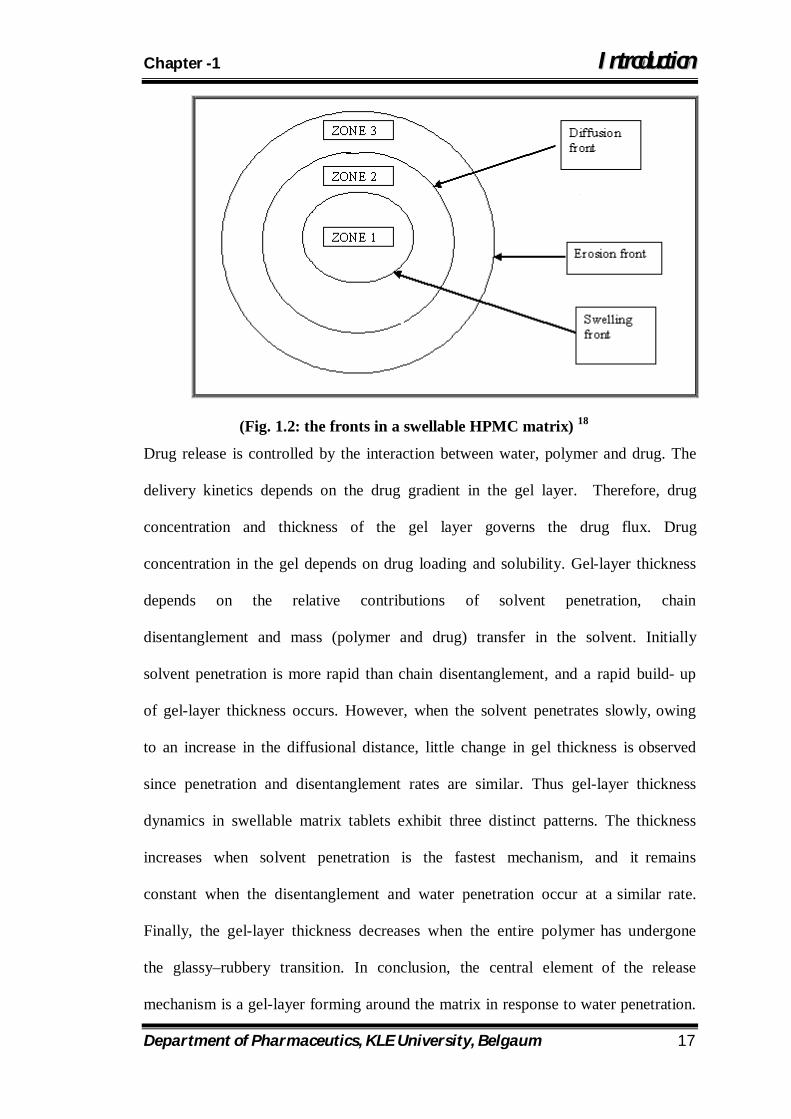
(Fig. 1.2: the fronts in a swellable HPMC matrix) 18
Drug release is controlled by the interaction between water, polymer and drug. The
delivery kinetics depends on the drug gradient in the gel layer. Therefore, drug
concentration and thickness of the gel layer governs the drug flux. Drug
concentration in the gel depends on drug loading and solubility. Gel-layer thickness
depends on the relative contributions of solvent penetration, chain
disentanglement and mass (polymer and drug) transfer in the solvent. Initially
solvent penetration is more rapid than chain disentanglement, and a rapid build- up
of gel-layer thickness occurs. However, when the solvent penetrates slowly, owing
to an increase in the diffusional distance, little change in gel thickness is observed
since penetration and disentanglement rates are similar. Thus gel-layer thickness
dynamics in swellable matrix tablets exhibit three distinct patterns. The thickness
increases when solvent penetration is the fastest mechanism, and it remains
constant when the disentanglement and water penetration occur at a similar rate.
Finally, the gel-layer thickness decreases when the entire polymer has undergone
the glassy–rubbery transition. In conclusion, the central element of the release
mechanism is a gel-layer forming around the matrix in response to water penetration.
Chapter -1 IInnttrroodduuccttiioonn
Department of Pharmaceutics, KLE University, Belgaum 18
Phenomena that govern gel-layer formation, and consequently drug-release rate, are
water penetration, polymer swelling, drug dissolution and diffusion, and matrix
erosion. Drug release is controlled by drug diffusion through the gel layer, which can
dissolve and/or erode15, 18.
1.2.4 Biological factors influencing oral sustained-release dosage form design 19
1) Biological half-life:
Therapeutic compounds with short half-lives are excellent candidates for sustained-
release preparations, since this can reduce dosing frequency.
2) Absorption:
The absorption rate constant is an apparent rate constant, and should, in actuality, be
the release rate constant of the drug from the dosage form. If a drug is absorbed by
active transport, or transport is limited to a specific region of the intestine, sustained-
release preparations may be disadvantageous to absorptions.
3) Metabolism:
Drugs that are significantly metabolized before absorption, either in the lumen or
tissue of the intestine, can show decreased bioavailability from slower-releasing
dosage forms. Most intestinal wall enzyme systems are saturable. As the drug is
released at a slower rate to these regions, less total drug is presented to the enzymatic
process during a specific period, allowing more complete conversion of the drug to its
metabolite.
Chapter -1 IInnttrroodduuccttiioonn
Department of Pharmaceutics, KLE University, Belgaum 19
1.2.5. Physicochemical factors influencing oral sustained-release dosage form
design19
1) Dose Size:
In general, single dose of 0.5 – 1.0 g is considered maximal for a conventional dosage
form. This also holds true for sustained-release dosage forms. Another consideration
is the margin of safety involved in administration of large amounts of drug with a
narrow therapeutic range.
2) Ionization, pKa, and aqueous solubility:
Most drugs are weak acids or bases. Since the unchanged form of a drug
preferentially permeates across lipid membranes, it is important to note the
relationship between the pKa of the compound and the absorptive environment.
Delivery systems that are dependent on diffusion or dissolution will likewise be
dependent on the solubility of drug in the aqueous media. For dissolution or diffusion
sustaining forms, much of the drug will arrive in the small intestine in solid form,
meaning that the solubility of the drug may change several orders of magnitude
during its release. The lower limit for the solubility of a drug to be formulated in a
sustained release system has been reported to be 0.1 mg/ml.
3) Partition coefficient:
Compounds with a relatively high partition coefficient are predominantly lipid-
soluble and, consequently, have very low aqueous solubility. Furthermore these
compounds can usually persist in the body for long periods, because they can localize
in the lipid membranes of cells.
Chapter -1 IInnttrroodduuccttiioonn
Department of Pharmaceutics, KLE University, Belgaum 20
4) Stability:
Orally administered drugs can be subjected to both acid-base hydrolysis and
enzymatic degradation. For drugs that are unstable in the stomach, systems that
prolong delivery over the entire course of transit in the GI tract are beneficial.
Compounds that are unstable in the small intestine may demonstrate decreased
bioavailability when administered from a sustaining dosage form.
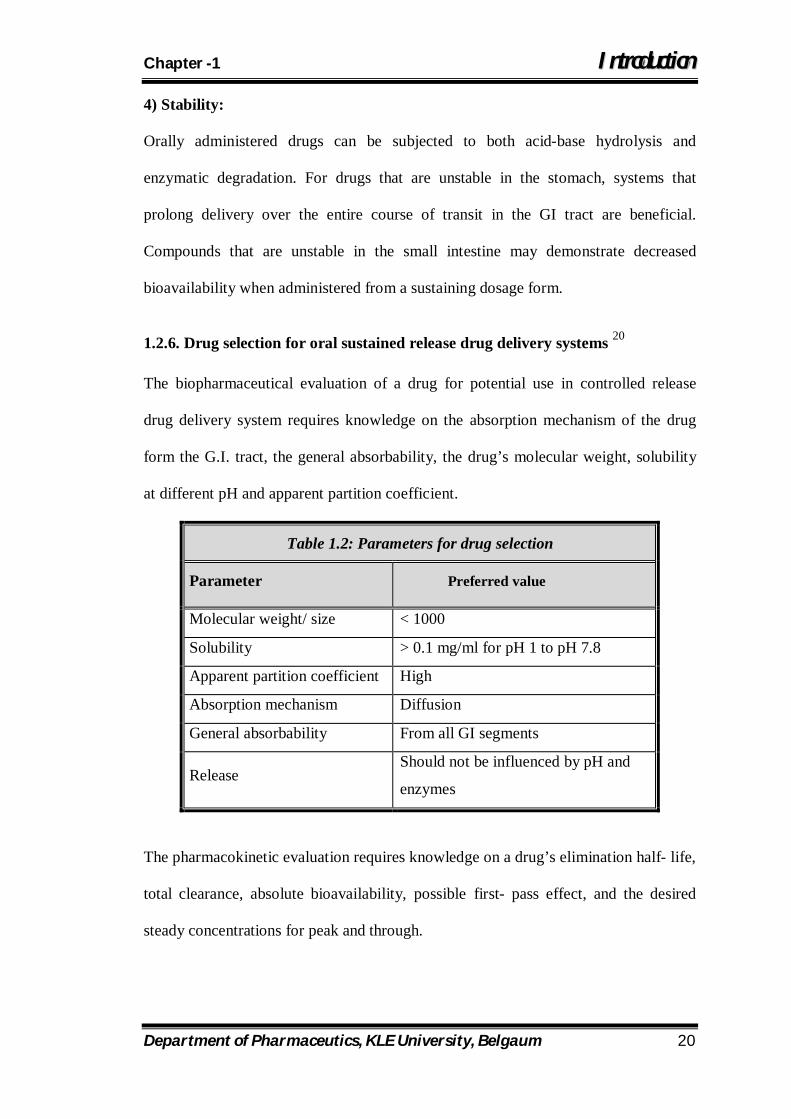
1.2.6. Drug selection for oral sustained release drug delivery systems 20
The biopharmaceutical evaluation of a drug for potential use in controlled release
drug delivery system requires knowledge on the absorption mechanism of the drug
form the G.I. tract, the general absorbability, the drug’s molecular weight, solubility
at different pH and apparent partition coefficient.
Table 1.2: Parameters for drug selection
Parameter Preferred value
Molecular weight/ size < 1000
Solubility > 0.1 mg/ml for pH 1 to pH 7.8
Apparent partition coefficient High
Absorption mechanism Diffusion
General absorbability From all GI segments
Release Should not be influenced by pH and
enzymes
The pharmacokinetic evaluation requires knowledge on a drug’s elimination half- life,
total clearance, absolute bioavailability, possible first- pass effect, and the desired
steady concentrations for peak and through.
Chapter -1 IInnttrroodduuccttiioonn
Department of Pharmaceutics, KLE University, Belgaum 21
1.2.7. Basic kinetics of controlled drug delivery 21
In order to establish a basis for discussion of the influence of drug properties and the
route of administration on controlled drug delivery, following mechanisms need a fair
mention,
Behavior of drug within its delivery systems
Behavior of the drug and its delivery system jointly in the body.
The first of the two elements basically deal with the inherent properties of drug
molecules, which influence its release from the delivery system. For conventional
systems, the rate-limiting step in drug availability is usually absorption of drug across
a biological membrane such as the gastro intestinal wall.
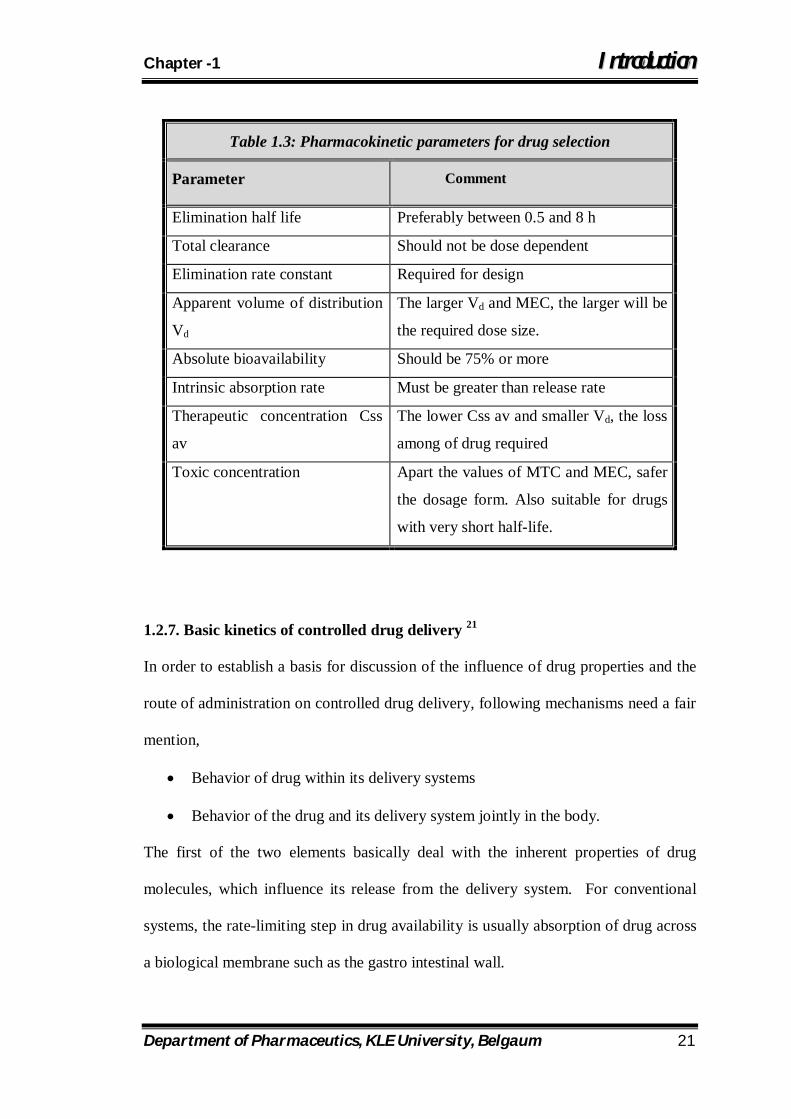
Table 1.3: Pharmacokinetic parameters for drug selection
Parameter Comment
Elimination half life Preferably between 0.5 and 8 h
Total clearance Should not be dose dependent
Elimination rate constant Required for design
Apparent volume of distribution
Vd
The larger Vd and MEC, the larger will be
the required dose size.
Absolute bioavailability Should be 75% or more
Intrinsic absorption rate Must be greater than release rate
Therapeutic concentration Css
av
The lower Css av and smaller Vd, the loss
among of drug required
Toxic concentration Apart the values of MTC and MEC, safer
the dosage form. Also suitable for drugs
with very short half-life.
Chapter -1 IInnttrroodduuccttiioonn
Department of Pharmaceutics, KLE University, Belgaum 22
However, in sustained/controlled release product, the release of drug from the dosage
form is the rate limiting instead; thus, drug availability is controlled by the kinetics of
drug release than absorption.
1.2.8. Factors influencing the in vivo performance of sustained release dosage
formulations 22
There are various factors that can influence the performance of a sustained release
product. The physiological, biochemical, and pharmacological factors listed below
can complicate the evaluation of the suitability of a sustained release dosage
formulation.
Physiological
Prolonged drug absorption
Variability in GI emptying and motility
Gastrointestinal blood flow
Influence of feeding on drug absorption
Pharmacokinetic/ biochemical
Dose dumping
First- pass metabolism
Variability in urinary pH; effect on drug elimination
Enzyme induction/ inhibition upon multiple dosing
Pharmacological
Changes in drug effect upon multiple dosing
Sensitization/ tolerance
Chapter -1 IInnttrroodduuccttiioonn
Department of Pharmaceutics, KLE University, Belgaum 23
1.2.9. In vitro evaluation of sustained release formulation
The data is generated in a well-designed reproducible in-vitro test such as dissolution
test. The method should be sensitive enough for discriminating any change in
formulation parameters and lot-to-lot variations. The key elements for dissolution are:
a) Reproducibility of method
b) Proper choice of media
c) Maintenance of sink conditions
d) Control of solution hydrodynamics
e) Dissolution rate as a function of pH ranging from pH 1 to 8 including several
intermediate values preferably as topographic dissolution characterization.
f) Selection of the most discriminating variables (media, pH rotation speed etc.)
as the basis for dissolution test and specification.
Ideal in-vitro method can be utilized to characterize bio-availability of the sustained
release product and can be relied upon to ensure lot-to-lot performance.

Chapter -1 IInnttrroodduuccttiioonn
Department of Pharmaceutics, KLE University, Belgaum 24
1.3 Introduction of product development
Product development usually begins when the active chemical entity has been shown
to process the necessary attributes for a commercial product. Generally product
development activities can be sub divided into formulation development and
process development.
1.3.1 Formulation development 23
Formulation development provides the basic information on the active chemical, the
formula and the impact of raw materials or excipients on the product. A typical
supportive data generated during these activities may include:
1. Preformulation profile, which includes all the basic physical or chemical
information about the chemical entity.
2. Formulation profile, which consist of physical and chemical characteristics
required for the product, drug excipients compatibility studies, and effect of
formulation on in-vitro dissolution.
3. Effect of formulation variable on the bioavailability of the product.
4. Specific test methods.
5. Key product attributes and specification
6. Optimum formulation
Formulation development should not be considered complete until all those factors
which could significantly alter the formulation have been studied. Subsequent minor
changes to the formulation, however, may be acceptable, provide they are thoroughly
tested and as shown to have no adverse effect on product characteristics. In case of
drug development process, compound tested is only one. A variety of studies must be
performed for this single drug, each designed to characterize its efficacy, safety,

Chapter -1 IInnttrroodduuccttiioonn
Department of Pharmaceutics, KLE University, Belgaum 25
selectivity or purity. Much of the data generation is driven by strict and extensive
regulatory control and in this most of the studies are interdependent.
Objective: The overall objective of a drug development process is to move product
candidate through development so that a new drug applicant (NDA) or product
license application (PLA) can be submitted as quickly as possible with best chance of
approval.
1.3.2 Pharmaceutical issues in drug development
1) Role of excipients in drug development: The bulk of final product in dosage
form such as tablet, capsule etc the speed of disintegration, rate of dissolution/ release
of drug, protection against moisture and stability during storage, as well as
compatibility are determined by the excipients. Various excipients used are adhesives,
absorbent excipients, liquid excipients, diluents, fillers, disintegrants, etc.
The general characteristics of excipients are
Must not react with drug substance
No effect on function of other excipients
Not interfere with the bioavailability of active material nor influence
dissolution of the product.
No pharmaceutical or physiological activity.
Have consistent and stable chemical and physical characteristics & properties
from batch to batch and ideally between suppliers.
Colorless and not support microbiological growth in the product.
Performance characteristics of the excipients are 24
Functionality: The control of functionality is important because many
excipients have multiple functions or sometimes there is lack of awareness in
some situations that excipients behave differently.
Chapter -1 IInnttrroodduuccttiioonn
Department of Pharmaceutics, KLE University, Belgaum 26
Rework ability: The reworking potential is defined as the ratio of areas under
the tensile strength compression profiles for re compression and for initial
compression. Often the results show that recompression reduces tablet
strength and that this reduction is more significant when the initial compaction
is carried out at high pressure.
Response and force loading rate:
Modes of deformation: Tabletting machines, which deform plastically with
little elastic recovery, should produce better quality tablets than more resilient
materials.
Effects on compression rate: Mostly strength of the tablets depend on the
speed of rotary tablet press and hence on rate of tablet compression. In
virtually all the cases, increase in tablet press speed led to a decrease in tablet
strength.
2) Dosage form design 25
A rational approach to dosage form design for any drug requires a complete
understanding of its physiochemical and biopharmaceutical properties which can have
a tremendous impact on its bioavailability and thereby on its efficacy and toxicity
profile. Properties that dictate the selection and formulation of dosage forms include:
Solubility and dissolution rate.
Partition coefficient.
Stability and/or degradation in physiologic fluids.
Susceptibility to metabolic inactivation.
Transport mechanism across biological membranes.
Chapter -1 IInnttrroodduuccttiioonn
Department of Pharmaceutics, KLE University, Belgaum 27
3) In-vitro correlation26
In vitro dissolution tests seem to be the most sensitive and reliable predictors of in
vivo availability. Invitro invivo correlations are classified as pharmacological
correlations, semi quantitative correlations and quantitative correlations.
Drug development also includes phase 1, 2 and 3 trials carried out on a particular
group of people after analogue development and screening process.
1.3.3 Process development
Process development activities begin after the formulation has been developed. The
process development should meet the following objectives:
1. Develop a suitable process to produce a product which meets all:
a. Product specifications
b. Economic constrains
c. cGMP
2. Identify the key process parameters that affect the product attributes
3. Identify in-process specification and test method
4. Identify generic and specific equipment that may required.

Chapter -1 IInnttrroodduuccttiioonn
Department of Pharmaceutics, KLE University, Belgaum 28
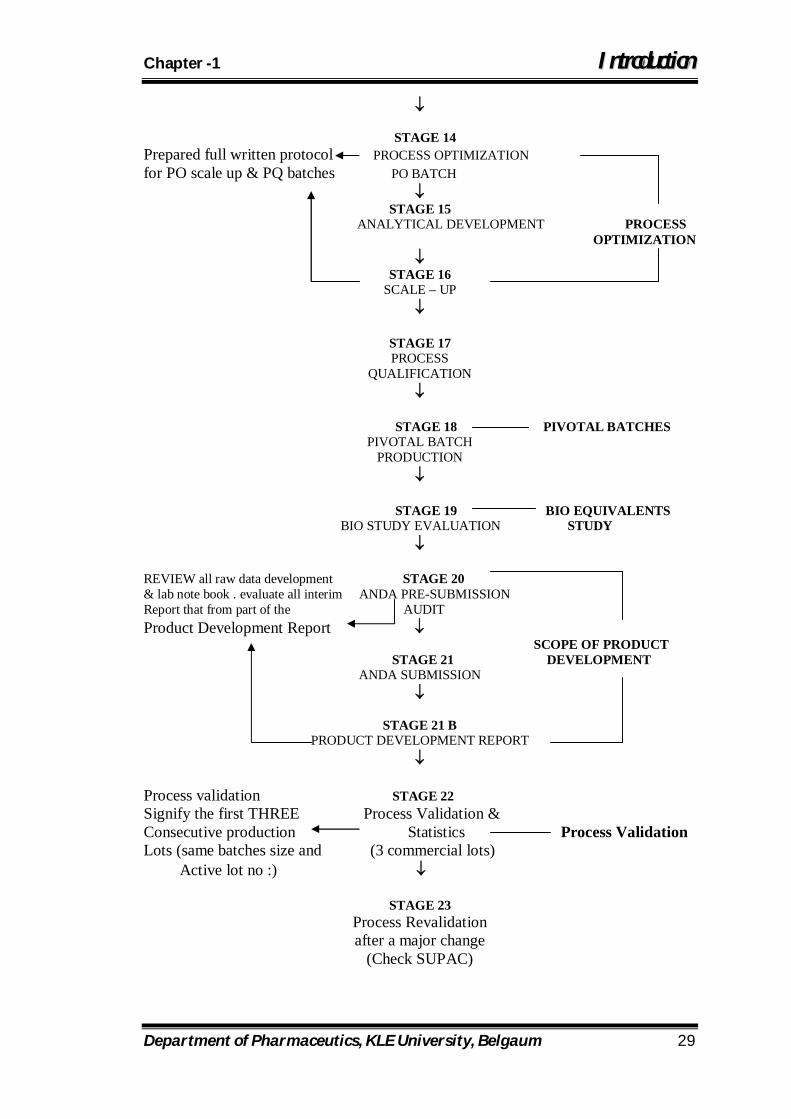
Product development flowchart
Solid, Dosage Forms STAGE 1
LITERATURE SEARCH
STAGE 2 ACTIVE SOURCING
STAGE 3 ACTIVE EVALUATION
Do not evaluate material While still in a R & D stage STAGE 4 Use only production activity ACTIVE PURCHASING PREFORMULATION STAGES
STAGE 5
ACTIVE TESTING
STAGE 6 INNOVATOR PRODUCT PURCHASING
Purchase a new lot Lot number every 3 mth From the smallest to the STAGE 7 Largest pack size INNOVATOR PRODUCT TESTING (in each dosage strength )
STAGE 8
BULK ACTIVE TESTING
STAGE 9 EXCIPIENT EVALUATION
Residual solvent Check STAGE 10
CONTAINER CLOSURE SYSTEM CHOICES
STAGE 11 DEVELOPMENT MANUFACTURING PROCESS EVALUATION BATCHES
STAGE 12 BULK ACTIVE PURCHASE
STAGE 13 ANALYTICAL EVALUATION
Chapter -1 IInnttrroodduuccttiioonn
Department of Pharmaceutics, KLE University, Belgaum 29
STAGE 14 Prepared full written protocol PROCESS OPTIMIZATION for PO scale up & PQ batches PO BATCH
STAGE 15
ANALYTICAL DEVELOPMENT PROCESS OPTIMIZATION
STAGE 16
SCALE – UP
STAGE 17 PROCESS
QUALIFICATION
STAGE 18 PIVOTAL BATCHES
PIVOTAL BATCH PRODUCTION
STAGE 19 BIO EQUIVALENTS BIO STUDY EVALUATION STUDY
REVIEW all raw data development STAGE 20 & lab note book . evaluate all interim ANDA PRE-SUBMISSION Report that from part of the AUDIT Product Development Report
SCOPE OF PRODUCT STAGE 21 DEVELOPMENT
ANDA SUBMISSION
STAGE 21 B PRODUCT DEVELOPMENT REPORT
Process validation STAGE 22 Signify the first THREE Process Validation & Consecutive production Statistics Process Validation Lots (same batches size and (3 commercial lots) Active lot no :)
STAGE 23 Process Revalidation after a major change
(Check SUPAC)
Chapter -1 IInnttrroodduuccttiioonn
Department of Pharmaceutics, KLE University, Belgaum 30
1.3.3.1 Process development can be divided into several stages:
1. Design
2. Ranging
3. Characterization
4. Verification
1. Design
This is the initial planning stage of process development. During this stage, technical
operation in both the manufacturing and quality-control departments should be
consulted. The practically and the reality of the manufacturing operation should be
kept in perspective.
Key documents for the technical definition of the process are the flow diagram, the
cause and effect diagram and the influence matrix.
The flow diagram provides a convenient basic on which to develop a detailed list of
variables and responses. Preliminary working documents are critical, but they should
never be “cast in stone”, since new experimental data may drastically alter them. The
final version will eventually be an essential part of the process characterization and
technical transfer documents. Regardless of the stage of formulation/process
development being considered, a detail identification of variables and response is
necessary for early program planning.
As the development program progresses, new discoveries will provide an update of
the variable and responses. It is important that current knowledge be adequately
summarized for the particular process being considered. It should be pointed out,
however that common sense and experience must be used in evaluating the variable
during process design and development.
Chapter -1 IInnttrroodduuccttiioonn
Department of Pharmaceutics, KLE University, Belgaum 31
An early transfer of the preliminary documentation to the manufacturing and quality
control department is essential, so that they can being to prepare for any new
equipment or facilities that may required.
2. Ranging
Process-ranging studies will test whether identified parameter are critical to the
product and process being developed. These studies determined the:
a. Feasibility of the design process
b. Criticality of the parameter
c. Failure limits for each of the critical variable
d. Validity of the test methods
This is usually a transition stage between the laboratory and the projected final
process.
3. Characterization
Process characterization provides a systematic examination of critical variables found
during process ranging. The objectives of these studies are:
a) Confirm key process control variables and quality their effect on product
attributes.
b) Establish product conditions for each unit operation.
c) Determine in process operating limits to guarantee acceptable finished product
and yield.
d) A carefully planned and coordinate experimental program is essential in order
to achieve these objectives.
4. Verification
Prior to a process being scale-up and transferred to production, verification is
required.
Chapter -1 IInnttrroodduuccttiioonn
Department of Pharmaceutics, KLE University, Belgaum 32
This ensures that it behave as designed under simulated production conditions and
determines its reproducibility. Key elements of the process-verification runs should be
evaluated using well-designed in-process sampling procedure. These should be
focused on potentially critical unit operations. Validated in-process and final product
analytical procedures should always be used. Sufficient replicate batches should be
produced to determine between and within-batch variations.
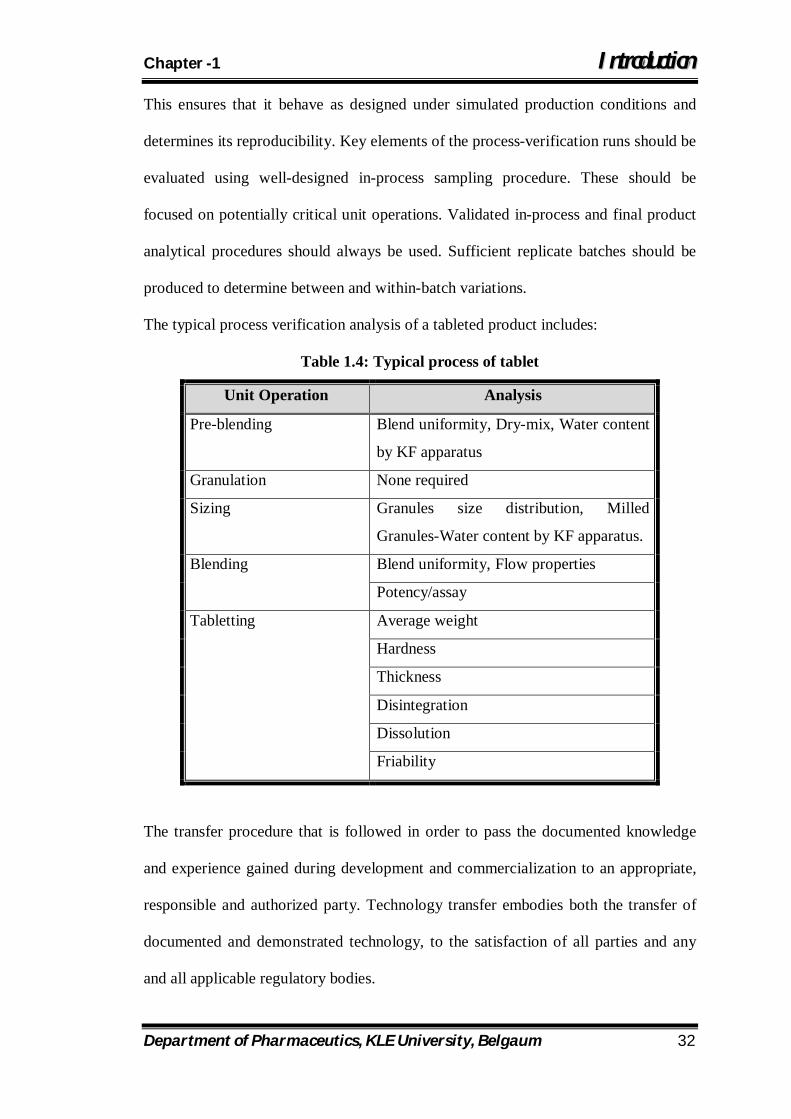
The typical process verification analysis of a tableted product includes:
Table 1.4: Typical process of tablet
Unit Operation Analysis
Pre-blending Blend uniformity, Dry-mix, Water content
by KF apparatus
Granulation None required
Sizing Granules size distribution, Milled
Granules-Water content by KF apparatus.
Blending Blend uniformity, Flow properties
Potency/assay
Tabletting Average weight
Hardness
Thickness
Disintegration
Dissolution
Friability
The transfer procedure that is followed in order to pass the documented knowledge
and experience gained during development and commercialization to an appropriate,
responsible and authorized party. Technology transfer embodies both the transfer of
documented and demonstrated technology, to the satisfaction of all parties and any
and all applicable regulatory bodies.

Chapter -1 IInnttrroodduuccttiioonn
Department of Pharmaceutics, KLE University, Belgaum 33
1.3.4 Technology transfer subdivided into two units
I. Sending unit
II. Receiving unit
1.3.4.1 Advantages
i. The transfer of technology from R & D (sending unit) to manufacturing
(Receiving unit) is the first key steps to getting a high quality product to the
market place.
ii. The transfers of the process technology from the R & D bench to large scale
manufacturing present some unique challenges.
iii. It also useful to make a timeframe of the process for that particular product.
iv. Hold time studies is useful for the planning of the product with other batches.
1.3.4.2 Objectives
The objective of the technology transfer guide in two-fold.
1. To describe the appropriate information set that needs to be complied to
support the transfer of the information and provide regulatory filing
documents.
2. To provide guidance on effective approaches for ensuring this information is
available at “print of use” where guidance on specific topic already exists this
will be referred.
The technology transfer guide is planning in such a way that technology transfer
performed in accordance with the recommendations in this guide will be the
regulatory authorities.

Chapter -1 IInnttrroodduuccttiioonn
Department of Pharmaceutics, KLE University, Belgaum 34
1.3.5 Process optimization
In the environment of increasing international competition where counters with lower
production cost luckily catch up technologically, new thinking is required in order to
meeting the competition is to focus on maximizing the utilization of exiting
technology. This means much more than just investing in new equipment.
The ability to optimize or improve a process is dependent upon the ability to control
the process. The ability to control the process is dependent upon the access to reliable
and valid management. A successful industrial organization thus entails a strategic
approach encompassing the whole chain.
1) Need for optimization
In an environment of increasing competition where countries with lower production
cost, quickly catch up technologically, new thinking is required in order to meet the
competition. Efficient organization and leadership is more difficult to copy than
technology. A successful way of meeting the increasing competition can thus be to
focus the effort on adapting the organization for maximal utilization of existing
technology and faster than competitors, being able to continuously introduce and
make use of new technology.
2) Optimization technology
There are two type optimization problems. They are:
1.Constrained optimization
Constrains are those restricted placed on the system due to physical limitation.
(Ex: Economic consideration)
2.Unconstrained optimization
Chapter -1 IInnttrroodduuccttiioonn
Department of Pharmaceutics, KLE University, Belgaum 35
In unconstrained optimization problems there are no restriction (such as tablet
hardness and disintegration).
An additional complication in pharmacy is that formulations are not usually simple
system. They often contain many ingredients and variables, which may interact with
one another to produce unexpected.
1.3.6 Scale up & technology transfer consideration
Scale up means increase the batch size; it acts a link between the formulation research
development and production. The pilot plant and its staff play a critical role in
technology evolution scale-up and transfer activity of new products. These activities
being early in the development cycle and include technical aspects of process
development and scale-up, organization and responsibility of technology transfer
team, documentation of transfer process, and obtain preparation for an FDA pre-
approval inspection. A properly design and operated pilot plant enhance the collection
of scientific data necessary to support internal transfer activities as well as regulatory
submission and FDA pre-approval inspection.
Four key technical aspects must be addressed during scale-up in the pilot plant.
I. Identification and control of critical component and formulation variables early
in the development.
II. Pilot plant equipment that simulates as closely as possible equipment used at
the manufacturing site.
III. Identification of critical process parameter and operating ranges with pilot plant
equipment through the use of engineering and regret ion models.
IV. Collection of product and process data to adequately characterized each unit
operation.
Chapter -1 IInnttrroodduuccttiioonn
Department of Pharmaceutics, KLE University, Belgaum 36
The success of any program is highly dependent on the effectiveness of the
communication presiding its implementation. Therefore, the preparation and
distribution of a complete document summarizing the raw material and equipment
requirements, manufacturing and packing process, process validation protocol, QC
processor, safe handling processor as well as a detail plan of action out limiting
expected result and time framer must be distributes prior to scale-up experiences. The
three main considerations to be address during an effective technology transfer of
plan. The person involved and process steps. Once prepared, the plan must be
communicated to the involved part in research, at the corporate level and at the
production site. The facility design plan a critical role in addressing each of their
technical aspects, however scientific and pilot plant staff involved in manufacturing
operations within the pilot facility also play a key role in ensuring smooth and timely
transfer of process technology to the manufacturing site. In the part, the transfer of
formulation and, manufacturing technology was sometimes discretely processed from
development staff with little interaction. Today, however, it is commonly recognize
the interaction of these groups at an early development stage is critical in obtaining an
efficient and successful transfer. Scientific and pilot plants staff a key role in
demonstrating new product manufacturing techniques to produce personal in the pilot
plant environment. A team orientation approach to the manufacture of pilot or large
scale batches in the pilot plant will allow key production site personnel to view and
comment on the process and make a specific recommendation for improvement based
on the knowledge of the manufacturing site.
Chapter -2 OObbjjeeccttiivvee ooff SSttuuddyy
Department of Pharmaceutics, KLE University, Belgaum 37
2.1. Aim of the present work:
Depression is the most common affective disorder and affects as many as 1 in 4
people in their teen years. It is an extremely common psychiatric condition, about
which a variety of neurochemical theories exist and for which a corresponding variety
of different types of drug is used in treatment ‘Major’ depression is a severe and
widespread psychiatric disorder which is on way to becoming a killer disease
worldwide.
There is no single cause for depression. Many factors play a role including genetics,
environment, life events, medical conditions, and the way people react to things that
happen in their lives. Depression involves the brain’s delicate chemistry –
specifically, it involves chemicals called neurotransmitters. These chemicals send
messages between nerve cells in the brain. Certain neurotransmitters regulate mood,
and if they run low, people become depressed, anxious, and stressed. Stress also
affects the balance of neurotransmitters and lead to depression.
Anti depressants are the classes of drugs which can elevate mood in depressive
illness. Almost all anti-depressants affect mono-aminergic transmission in the brain.
There are various classes of anti-depressant drugs available viz.,
1. Reversible Inhibitors of MAO-A
2. Tricyclic Antidepressants
3. Selective serotonin reuptake inhibitors
4. Atypical antidepressants.
But all the drugs in above mentioned classes have various side-effects such as
sedation, hypotension, cardiac arrhythmias, seizure precipitation, enzyme inhibitory
Chapter -2 OObbjjeeccttiivvee ooff SSttuuddyy
Department of Pharmaceutics, KLE University, Belgaum 38
action, dose related CNS toxicity, renal diabetes insipidus, loss of libido and failure or
orgasm.
Hence, there is a need for the development of a formulation containing new anti-
depressant drug belonging to any of the above class which will help to overcome
above mentioned side-effects.
2.2. Objectives of the present study:
1. Preparation and characterization of novel anti-depressant tablet.
2. To study the various formulation variables that ultimately affects the drug release.
3. Selection and optimization of polymer concentration, that has pronounced effect
on tablet properties and drug release profile of the formulations.
4. To maintain the plasma concentration of drug within the therapeutic window.
5. To increase the patient’s compliance.
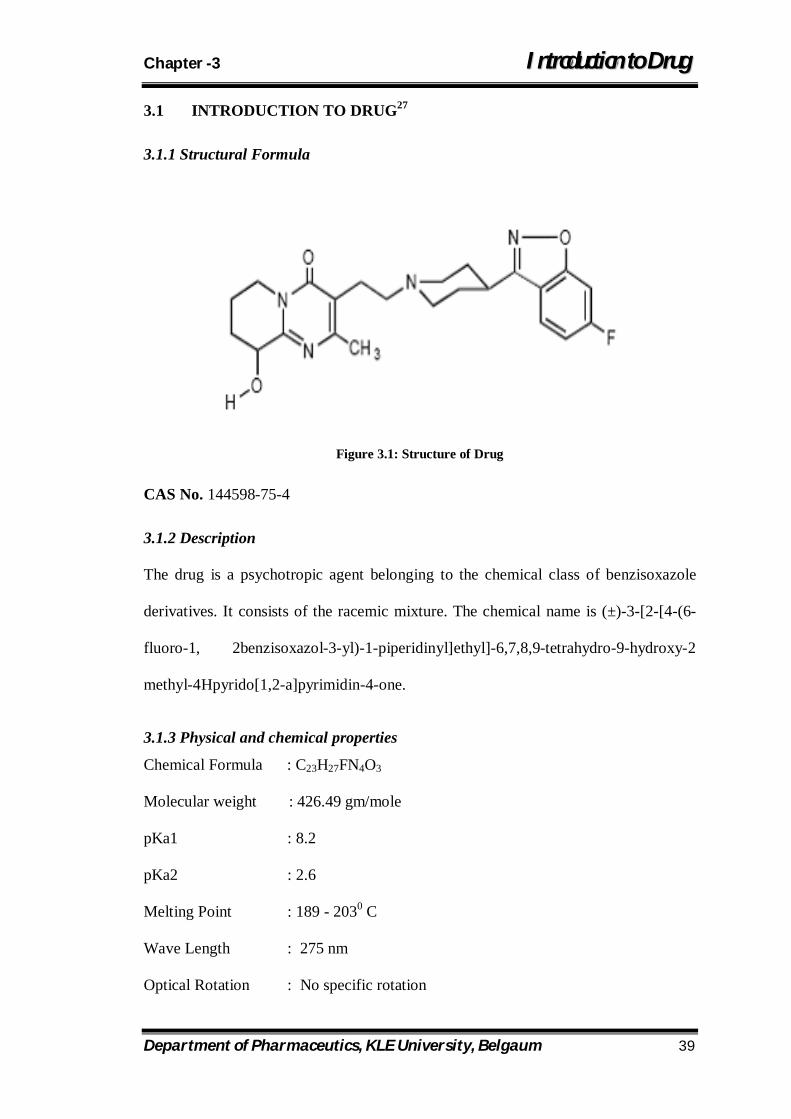
Chapter -3 IInnttrroodduuccttiioonn ttoo DDrruugg
Department of Pharmaceutics, KLE University, Belgaum 39
3.1 INTRODUCTION TO DRUG27
3.1.1 Structural Formula
Figure 3.1: Structure of Drug
CAS No. 144598-75-4
3.1.2 Description
The drug is a psychotropic agent belonging to the chemical class of benzisoxazole
derivatives. It consists of the racemic mixture. The chemical name is (±)-3-[2-[4-(6-
fluoro-1, 2benzisoxazol-3-yl)-1-piperidinyl]ethyl]-6,7,8,9-tetrahydro-9-hydroxy-2
methyl-4Hpyrido[1,2-a]pyrimidin-4-one.
3.1.3 Physical and chemical properties
Chemical Formula : C23H27FN4O3
Molecular weight : 426.49 gm/mole
pKa1 : 8.2
pKa2 : 2.6
Melting Point : 189 - 2030 C
Wave Length : 275 nm
Optical Rotation : No specific rotation
Chapter -3 IInnttrroodduuccttiioonn ttoo DDrruugg
Department of Pharmaceutics, KLE University, Belgaum 40
Color : White to pale yellow
Log P : 2.39
Solubility - : Drug is sparingly soluble in 0.1N HCl and methylene chloride
practically insoluble in water, 0.1N NaOH, and hexane; and
slightly soluble in N,N-dimethylformamide.
3.1.4 Pharmacology
3.1.4.1 Mechanism of Action
Drug is the major active metabolite of risperidone. The mechanism of action of drug,
as with other drugs having efficacy as antidepressant, mood stabilizer and in
schizophrenia, is unknown, but it has been proposed that the drug's therapeutic
activity is mediated through a combination of central dopamine Type 2 (D2) and
serotonin Type 2 (5HT2A) receptor antagonism. Drug also has antagonist effect at α1
and α2 adrenergic receptors and at H1 histamine receptors.
3.1.4.2 Pharmacodynamics
Drug is a centrally active dopamine Type 2 (D2) antagonist and with predominant
serotonin Type 2 (5HT2A) activity. It is also active as an antagonist at α1 and α2
adrenergic receptors and H1 histaminergic receptors, which may explain some of the
other effects of the drug. It has no affinity for cholinergic muscarinic or β1- and β2-
adrenergic receptors. The pharmacological activity of the (+)- and (-)- drug
enantiomers is qualitatively and quantitatively similar.
3.1.4.3 Pharmacokinetics
Following a single dose, the plasma concentrations of paliperidone gradually rise to
reach peak plasma concentration (Cmax) approximately 24 hours after dosing. The
pharmacokinetics of drug following oral administration are dose-proportional within
Chapter -3 IInnttrroodduuccttiioonn ttoo DDrruugg
Department of Pharmaceutics, KLE University, Belgaum 41
the available dose range. The terminal elimination half-life of drug is approximately
23 hours. Steady-state concentrations of drug are attained within 4-5 days of dosing
with INV in most subjects. The mean steady-state peak:trough ratio for an INV dose
of 9 mg was 1.7 with a range of 1.2-3.1.
Absorption and Distribution
The absolute oral bioavailability of drug following INVEGA® administration is 28%.
Administration of a 12 mg drug extended-release tablet to healthy ambulatory
subjects with a standard high-fat/high-caloric meal gave mean Cmax and AUC values
of drug that were increased by 60% and 54%, respectively, compared with
administration under fasting conditions. Clinical trials establishing the safety and
efficacy of INV were carried out in subjects without regard to the timing of meals.
While INV can be taken without regard to food, the presence of food at the time of
INV administration may increase exposure to drug.
Based on a population analysis, the apparent volume of distribution of drug is 487 L.
The plasma protein binding of racemic drug is 74%.
Metabolism and Excretion
Although in vitro studies suggested a role for CYP2D6 and CYP3A4 in the
metabolism of drug, in vivo results indicate that these isozymes play a limited role in
the overall elimination of drug. One week following administration of a single oral
dose of 1 mg immediate-release 14C-paliperidone to 5 healthy volunteers, 59% (range
51% - 67%) of the dose was excreted unchanged into urine, 32% (26% - 41%) of the
dose was recovered as metabolites, and 6% - 12% of the dose was not recovered.
Approximately 80% of the administered radioactivity was recovered in urine and 11%
in the feces. Four primary metabolic pathways have been identified in vivo, none of
Chapter -3 IInnttrroodduuccttiioonn ttoo DDrruugg
Department of Pharmaceutics, KLE University, Belgaum 42
which could be shown to account for more than 10% of the dose: dealkylation,
hydroxylation, dehydrogenation, and benzisoxazole scission.
Population pharmacokinetic analyses found no difference in exposure or clearance of
paliperidone between extensive metabolizers and poor metabolizers of CYP2D6
substrates.
3.1.5 Indications
Extended release tablets are indicated for acute and maintenance treatment of bipolar
disorder, schizophrenia, as an adjunct to mood stabilizers.
3.1.6 Contraindications
Pregnancy Patients with dementia related psychosis.
Severe renal or hepatic impairment.
Patients with serious cardiac or gastrointestinal disorders.
Patients with orthostatic hypotension.
Hypersensitivity to drug.
Children under 2 years of age.
3.1.7 Precautions
Concerns related to adverse effects:
• Gastrointestinal symptoms: Dosage reduction is recommended in
patients who develop gastrointestinal symptoms (anorexia, diarrhea,
nausea, vomiting) related to drug therapy.
• Weakness: Dosage reduction is recommended in patients who develop
weakness related to drug therapy.
Chapter -3 IInnttrroodduuccttiioonn ttoo DDrruugg
Department of Pharmaceutics, KLE University, Belgaum 43
Disease-related concerns:
• Cardiovascular disease: Use with caution in patients with mild-to-
moderate cardiac disease.
• Hepatic impairment: No dosage adjustment is required in patients with
mild to moderate hepatic impairment
• Renal impairment: Dosing must be individualized according to the
patient's renal function status
• Diabetic Condition: Use with caution in patients with high blood sugar
conditions as the drug may infrequently make blood sugar level rise,
causing or worsening diabetes.
Special populations:
• Pregnancy: Should be used only when clearly needed.
• Nursing: Breast-feeding while using this drug is not recommended.
• Safety and effectiveness of INV in patients < 18 years of age have not
been established
• INV (drug) is not approved for the treatment of dementia-related
psychosis
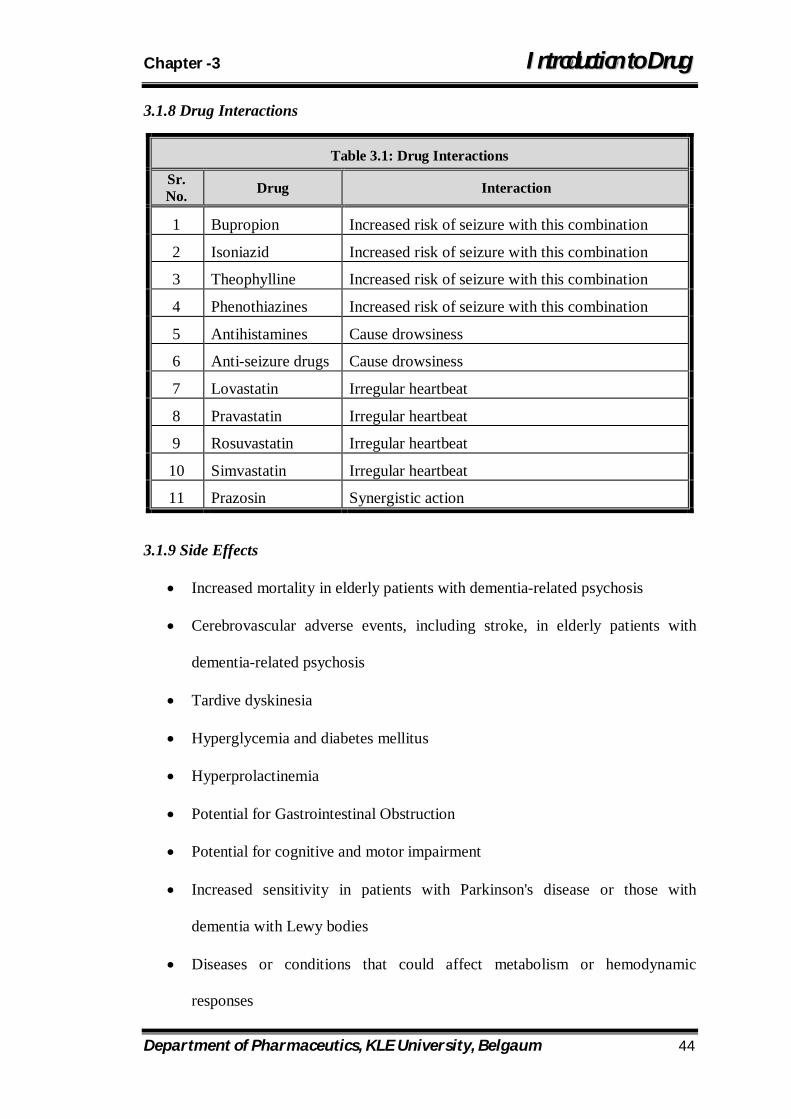
Chapter -3 IInnttrroodduuccttiioonn ttoo DDrruugg
Department of Pharmaceutics, KLE University, Belgaum 44
3.1.8 Drug Interactions
Table 3.1: Drug Interactions Sr. No. Drug Interaction
1 Bupropion Increased risk of seizure with this combination
2 Isoniazid Increased risk of seizure with this combination
3 Theophylline Increased risk of seizure with this combination
4 Phenothiazines Increased risk of seizure with this combination
5 Antihistamines Cause drowsiness
6 Anti-seizure drugs Cause drowsiness
7 Lovastatin Irregular heartbeat
8 Pravastatin Irregular heartbeat
9 Rosuvastatin Irregular heartbeat
10 Simvastatin Irregular heartbeat
11 Prazosin Synergistic action
3.1.9 Side Effects
Increased mortality in elderly patients with dementia-related psychosis
Cerebrovascular adverse events, including stroke, in elderly patients with
dementia-related psychosis
Tardive dyskinesia
Hyperglycemia and diabetes mellitus
Hyperprolactinemia
Potential for Gastrointestinal Obstruction
Potential for cognitive and motor impairment
Increased sensitivity in patients with Parkinson's disease or those with
dementia with Lewy bodies
Diseases or conditions that could affect metabolism or hemodynamic
responses
Chapter -3 IInnttrroodduuccttiioonn ttoo DDrruugg
Department of Pharmaceutics, KLE University, Belgaum 45
3.1.10 Dosage and administration
The recommended dose of INV (drug) Extended-Release Tablets for the treatment of
bipolar depression is 6 mg once daily, administered in the morning. Initial dose
titration is not required. Although it has not been systematically established that doses
above 6 mg have additional benefit, there was a general trend for greater effects with
higher doses. This must be weighed against the dose-related increase in adverse
reactions. Thus, some patients may benefit from higher doses, up to 12 mg/day, and
for some patients, a lower dose of 3 mg/day may be sufficient. Dose increases above 6
mg/day should be made only after clinical reassessment and generally should occur at
intervals of more than 5 days. When dose increases are indicated, increments of 3
mg/day are recommended. The maximum recommended dose is 12 mg/day.
Children:
The safety and effectiveness in this age group have not been established.
Elderly:
Because elderly patients may have diminished renal function, dose adjustments may
be required according to their renal function status. In general, recommended dosing
for elderly patients with normal renal function is the same as for younger adult
patients with normal renal function. For patients with moderate to severe renal
impairment (creatinine clearance 10 mL/min to < 50 mL/min), the maximum
recommended dose of INV is 3 mg once daily
Reduced hepatic function:
For patients with mild to moderate hepatic impairment, (Child-Pugh Classification A
and B), no dose adjustment is recommended.
Chapter -3 IInnttrroodduuccttiioonn ttoo DDrruugg
Department of Pharmaceutics, KLE University, Belgaum 46
Reduced renal function:
Dosing must be individualized according to the patient's renal function status. For
patients with mild renal impairment (creatinine clearance ≥ 50 mL/min to < 80
mL/min), the recommended initial dose of INV is 3 mg once daily. The dose may
then be increased to a maximum of 6 mg once daily based on clinical response and
tolerability. For patients with moderate to severe renal impairment (creatinine
clearance ≥ 10 mL/min to < 50 mL/min), the recommended initial dose of INV is 1.5
mg once daily, which may be increased to a maximum of 3 mg once daily after
clinical reassessment.
Chapter -3 IInnttrroodduuccttiioonn ttoo PPoollyymmeerrss
Department of Pharmaceutics, KLE University, Belgaum 47
3.2.1 Hydroxypropylmethylcellulose
1. Nonproprietary Names
BP: Hypromellose
JP: Hydroxypropylmethylcellulose
PhEur: Hypromellosum
USP: Hypromellose
2. Chemical Name and CAS Registry Number
Cellulose hydroxypropyl methyl ether [9004-65-3]
3. Empirical Formula and Molecular Weight
The PhEur 2005 describes hypromellose as a partly O-methylated and O-(2-
hydroxypropylated) cellulose. It is available in several grades that vary in viscosity
and extent of substitution. Grades may be distinguished by appending a number
indicative of the apparent viscosity, in mPa s, of a 2% w/w aqueous solution at 20°C.
Hypromellose defined in the USP 28 specifies the substitution type by appending a
four-digit number to the nonproprietary name: e.g., hypromellose 1828. The first two
digits refer to the approximate percentage content of the methoxy group (OCH3). The
second two digits refer to the approximate percentage content of the hydroxypropoxy
group (OCH2CH(OH)CH3), calculated on a dried basis. It contains methoxy and
hydroxypropoxy groups conforming to the limits for the types of hypromellose stated
in Table I. Molecular weight is approximately 10 000–1 500 000. The JP 2001
includes three separate monographs for hypromellose: hydroxypropylmethylcellulose
2208, 2906, and 2910, respectively.
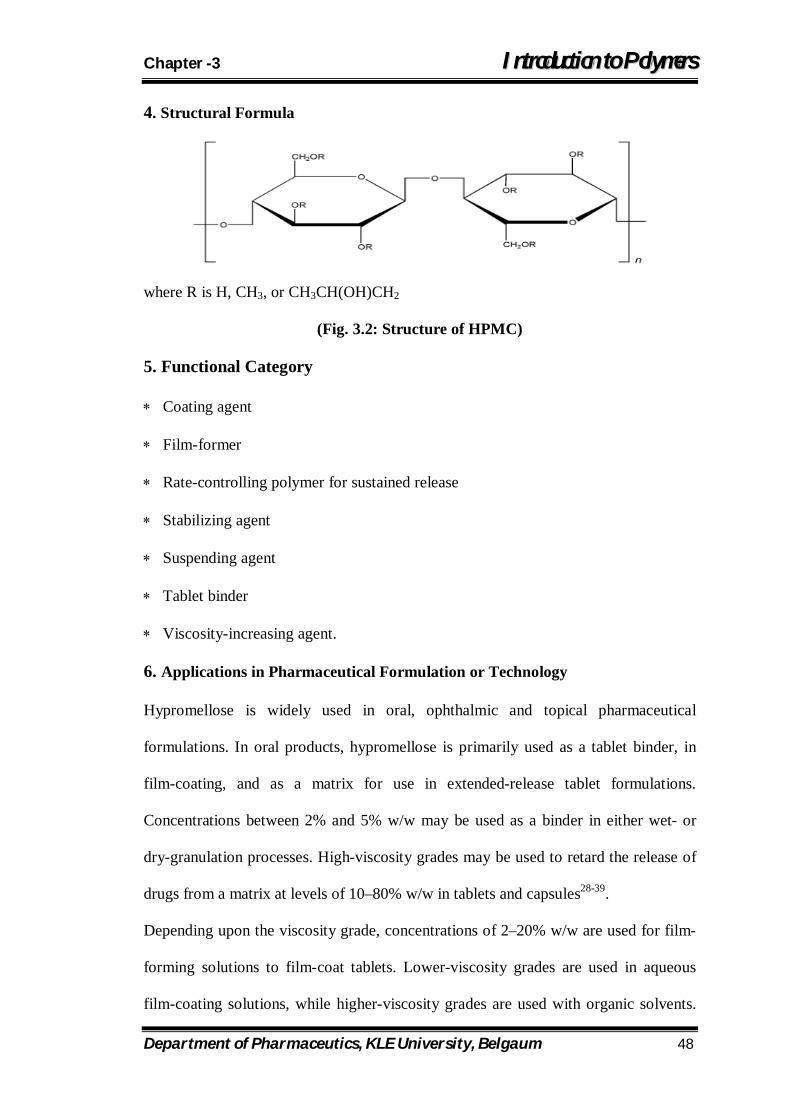
Chapter -3 IInnttrroodduuccttiioonn ttoo PPoollyymmeerrss
Department of Pharmaceutics, KLE University, Belgaum 48
4. Structural Formula
where R is H, CH3, or CH3CH(OH)CH2
(Fig. 3.2: Structure of HPMC)
5. Functional Category
Coating agent
Film-former
Rate-controlling polymer for sustained release
Stabilizing agent
Suspending agent
Tablet binder
Viscosity-increasing agent.
6. Applications in Pharmaceutical Formulation or Technology
Hypromellose is widely used in oral, ophthalmic and topical pharmaceutical
formulations. In oral products, hypromellose is primarily used as a tablet binder, in
film-coating, and as a matrix for use in extended-release tablet formulations.
Concentrations between 2% and 5% w/w may be used as a binder in either wet- or
dry-granulation processes. High-viscosity grades may be used to retard the release of
drugs from a matrix at levels of 10–80% w/w in tablets and capsules28-39.
Depending upon the viscosity grade, concentrations of 2–20% w/w are used for film-
forming solutions to film-coat tablets. Lower-viscosity grades are used in aqueous
film-coating solutions, while higher-viscosity grades are used with organic solvents.
Chapter -3 IInnttrroodduuccttiioonn ttoo PPoollyymmeerrss
Department of Pharmaceutics, KLE University, Belgaum 49
Examples of film-coating materials that are commercially available include AcryCoat
C, Spectracel, and Pharmacoat.
Hypromellose is also used as a suspending and thickening agent in topical
formulations. Compared with methylcellulose, hypromellose produces aqueous
solutions of greater clarity, with fewer undispersed fibers present, and is therefore
preferred in formulations for ophthalmic use. Hypromellose at concentrations between
0.45–1.0% w/w may be added as a thickening agent to vehicles for eye drops and
artificial tear solutions.
Hypromellose is also used as an emulsifier, suspending agent, and stabilizing agent in
topical gels and ointments. As a protective colloid, it can prevent droplets and
particles from coalescing or agglomerating, thus inhibiting the formation of
sediments.
In addition, hypromellose is used in the manufacture of capsules, as an adhesive in
plastic bandages, and as a wetting agent for hard contact lenses. It is also widely used
in cosmetics and food products.
7. Description & Typical Properties
Hypromellose is an odorless and tasteless, white or creamy-white fibrous or granular
powder.
Acidity/alkalinity: pH = 5.5–8.0 for a 1% w/w aqueous solution.
Ash: 1.5–3.0%, depending upon the grade and viscosity.
Autoignition temperature: 360°C
Density (bulk): 0.341 g/cm3
Density (tapped): 0.557 g/cm3
Density (true): 1.326 g/cm3
Chapter -3 IInnttrroodduuccttiioonn ttoo PPoollyymmeerrss
Department of Pharmaceutics, KLE University, Belgaum 50
Melting point: browns at 190–200°C; chars at 225–230°C. Glass transition
temperature is 170–180°C.
Moisture content: hypromellose absorbs moisture from the atmosphere; the
amount of water absorbed depends upon the initial moisture content and the
temperature and relative humidity of the surrounding air.
Solubility: soluble in cold water, forming a viscous colloidal solution; practically
insoluble in chloroform, ethanol (95%), and ether, but soluble in mixtures of
ethanol and dichloromethane, mixtures of methanol and dichloromethane, and
mixtures of water and alcohol. Certain grades of hypromellose are soluble in
aqueous acetone solutions, mixtures of dichloromethane and propan-2-ol, and other
organic solvents.
Specific gravity: 1.26
Viscosity (dynamic): a wide range of viscosity types are commercially available.
Aqueous solutions are most commonly prepared, although hypromellose may also
be dissolved in aqueous alcohols such as ethanol and propan-2-ol provided the
alcohol content is less than 50% w/w. Dichloromethane and ethanol mixtures may
also be used to prepare viscous hypromellose solutions. Solutions prepared using
organic solvents tend to be more viscous; increasing concentration also produces
more viscous solutions.
To prepare an aqueous solution, it is recommended that hypromellose is dispersed and
thoroughly hydrated in about 20–30% of the required amount of water. The water
should be vigorously stirred and heated to 80–90°C, then the remaining hypromellose
should be added. Sufficient cold water should then be added to produce the required
volume.
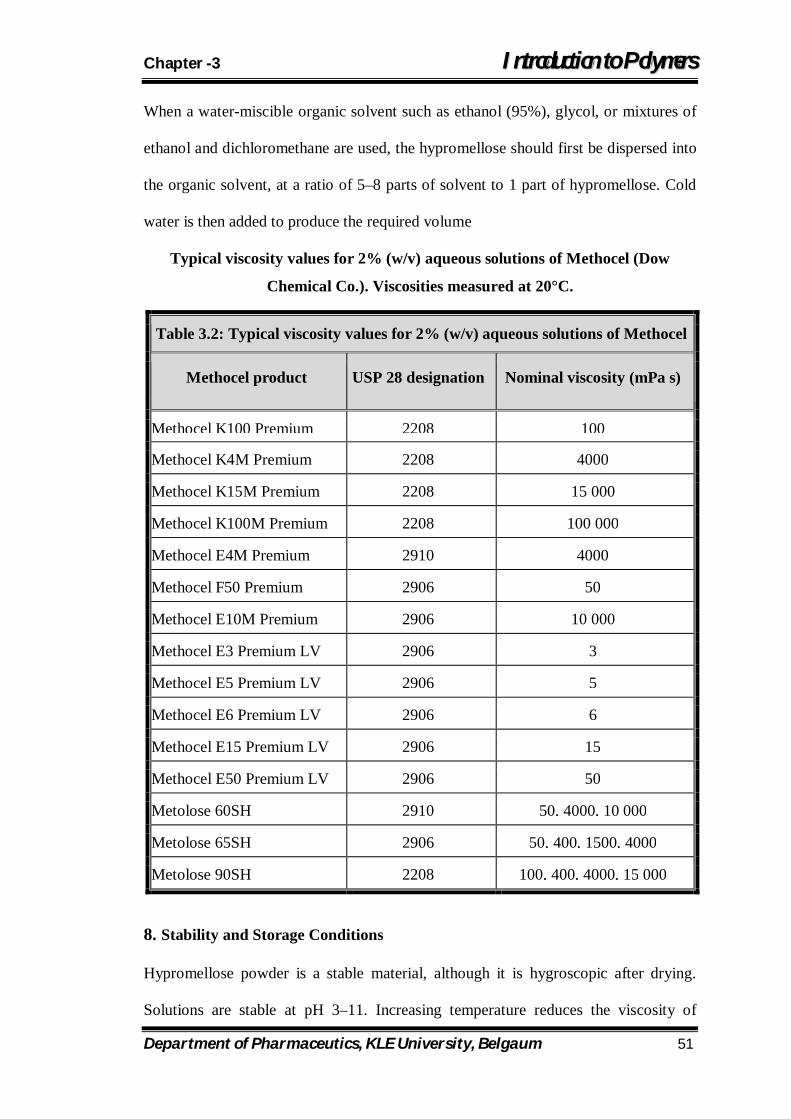
Chapter -3 IInnttrroodduuccttiioonn ttoo PPoollyymmeerrss
Department of Pharmaceutics, KLE University, Belgaum 51
When a water-miscible organic solvent such as ethanol (95%), glycol, or mixtures of
ethanol and dichloromethane are used, the hypromellose should first be dispersed into
the organic solvent, at a ratio of 5–8 parts of solvent to 1 part of hypromellose. Cold
water is then added to produce the required volume
Typical viscosity values for 2% (w/v) aqueous solutions of Methocel (Dow
Chemical Co.). Viscosities measured at 20°C.
8. Stability and Storage Conditions
Hypromellose powder is a stable material, although it is hygroscopic after drying.
Solutions are stable at pH 3–11. Increasing temperature reduces the viscosity of
Table 3.2: Typical viscosity values for 2% (w/v) aqueous solutions of Methocel
Methocel product USP 28 designation Nominal viscosity (mPa s)
Methocel K100 Premium 2208 100
Methocel K4M Premium 2208 4000
Methocel K15M Premium 2208 15 000
Methocel K100M Premium 2208 100 000
Methocel E4M Premium 2910 4000
Methocel F50 Premium 2906 50
Methocel E10M Premium 2906 10 000
Methocel E3 Premium LV 2906 3
Methocel E5 Premium LV 2906 5
Methocel E6 Premium LV 2906 6
Methocel E15 Premium LV 2906 15
Methocel E50 Premium LV 2906 50
Metolose 60SH 2910 50, 4000, 10 000
Metolose 65SH 2906 50, 400, 1500, 4000
Metolose 90SH 2208 100, 400, 4000, 15 000
Chapter -3 IInnttrroodduuccttiioonn ttoo PPoollyymmeerrss
Department of Pharmaceutics, KLE University, Belgaum 52
solutions. Hypromellose undergoes a reversible sol–gel transformation upon heating
and cooling, respectively. The gel point is 50–90°C, depending upon the grade and
concentration of material40.
Aqueous solutions are comparatively enzyme-resistant, providing good viscosity
stability during long-term storage. However, aqueous solutions are liable to microbial
spoilage and should be preserved with an antimicrobial preservative: when
hypromellose is used as a viscosity-increasing agent in ophthalmic solutions,
benzalkonium chloride is commonly used as the preservative. Aqueous solutions may
also be sterilized by autoclaving; the coagulated polymer must be redispersed on
cooling by shaking.
Hypromellose powder should be stored in a well-closed container, in a cool, dry
place.
9. Incompatibilities
Hypromellose is incompatible with some oxidizing agents. Since it is nonionic,
hypromellose will not complex with metallic salts or ionic organics to form insoluble
precipitates.
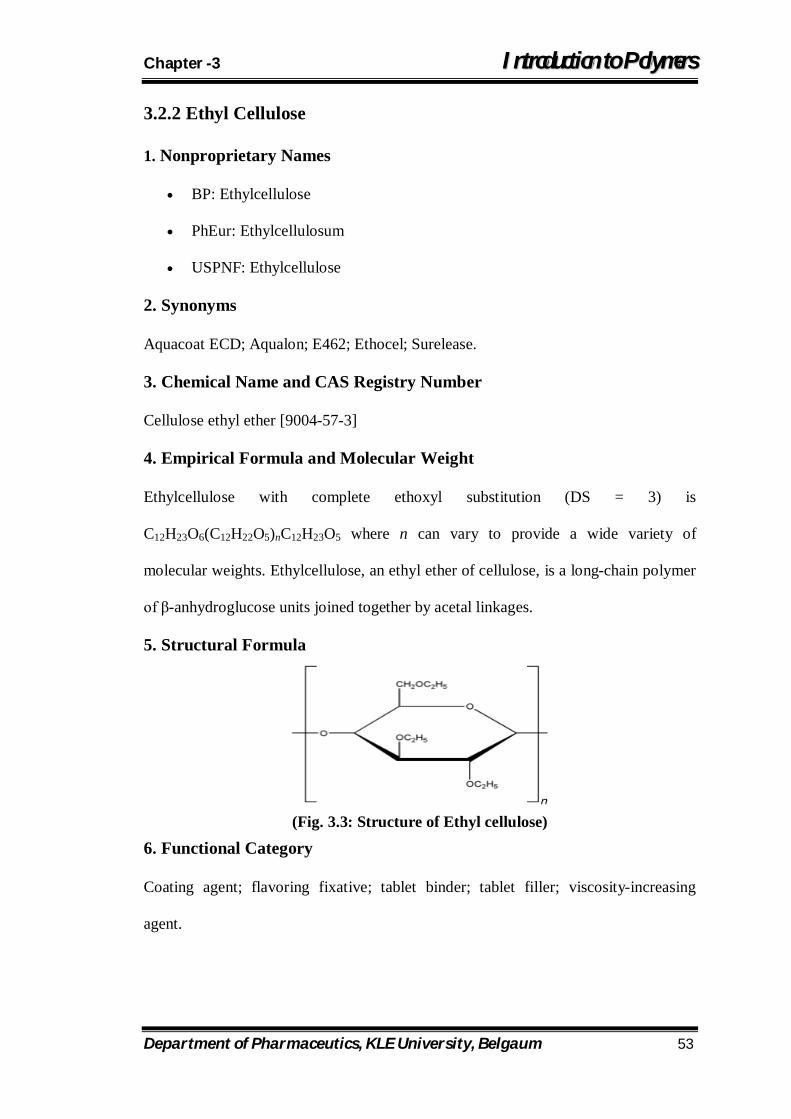
Chapter -3 IInnttrroodduuccttiioonn ttoo PPoollyymmeerrss
Department of Pharmaceutics, KLE University, Belgaum 53
3.2.2 Ethyl Cellulose
1. Nonproprietary Names
BP: Ethylcellulose
PhEur: Ethylcellulosum
USPNF: Ethylcellulose
2. Synonyms
Aquacoat ECD; Aqualon; E462; Ethocel; Surelease.
3. Chemical Name and CAS Registry Number
Cellulose ethyl ether [9004-57-3]
4. Empirical Formula and Molecular Weight
Ethylcellulose with complete ethoxyl substitution (DS = 3) is
C12H23O6(C12H22O5)nC12H23O5 where n can vary to provide a wide variety of
molecular weights. Ethylcellulose, an ethyl ether of cellulose, is a long-chain polymer
of β-anhydroglucose units joined together by acetal linkages.
5. Structural Formula
(Fig. 3.3: Structure of Ethyl cellulose)
6. Functional Category
Coating agent; flavoring fixative; tablet binder; tablet filler; viscosity-increasing
agent.
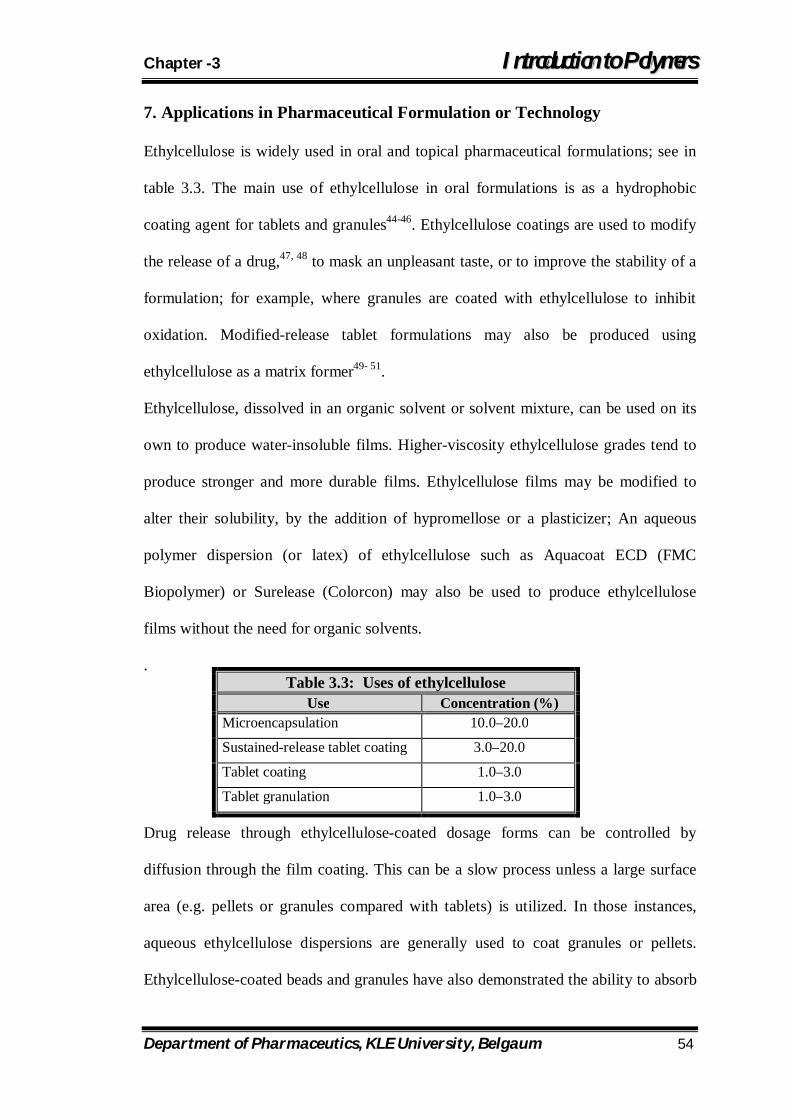
Chapter -3 IInnttrroodduuccttiioonn ttoo PPoollyymmeerrss
Department of Pharmaceutics, KLE University, Belgaum 54
7. Applications in Pharmaceutical Formulation or Technology
Ethylcellulose is widely used in oral and topical pharmaceutical formulations; see in
table 3.3. The main use of ethylcellulose in oral formulations is as a hydrophobic
coating agent for tablets and granules44-46. Ethylcellulose coatings are used to modify
the release of a drug,47, 48 to mask an unpleasant taste, or to improve the stability of a
formulation; for example, where granules are coated with ethylcellulose to inhibit
oxidation. Modified-release tablet formulations may also be produced using
ethylcellulose as a matrix former49- 51.
Ethylcellulose, dissolved in an organic solvent or solvent mixture, can be used on its
own to produce water-insoluble films. Higher-viscosity ethylcellulose grades tend to
produce stronger and more durable films. Ethylcellulose films may be modified to
alter their solubility, by the addition of hypromellose or a plasticizer; An aqueous
polymer dispersion (or latex) of ethylcellulose such as Aquacoat ECD (FMC
Biopolymer) or Surelease (Colorcon) may also be used to produce ethylcellulose
films without the need for organic solvents.
.
Drug release through ethylcellulose-coated dosage forms can be controlled by
diffusion through the film coating. This can be a slow process unless a large surface
area (e.g. pellets or granules compared with tablets) is utilized. In those instances,
aqueous ethylcellulose dispersions are generally used to coat granules or pellets.
Ethylcellulose-coated beads and granules have also demonstrated the ability to absorb
Table 3.3: Uses of ethylcellulose Use Concentration (%)
Microencapsulation 10.0–20.0
Sustained-release tablet coating 3.0–20.0
Tablet coating 1.0–3.0
Tablet granulation 1.0–3.0
Chapter -3 IInnttrroodduuccttiioonn ttoo PPoollyymmeerrss
Department of Pharmaceutics, KLE University, Belgaum 55
pressure and hence protect the coating from fracture during compression. High-
viscosity grades of ethylcellulose are used in drug microencapsulation52.
Release of a drug from an ethylcellulose microcapsule is a function of the
microcapsule wall thickness and surface area.
In tablet formulations, ethyl cellulose may additionally be employed as a binder, the
ethyl cellulose being blended dry or wet-granulated with a solvent such as ethanol
(95%). Ethylcellulose produces hard tablets with low friability, although they may
demonstrate poor dissolution.
Ethylcellulose has also been used as an agent for delivering therapeutic agents from
oral (e.g. dental) appliances.
In topical formulations, ethylcellulose is used as a thickening agent in creams, lotions,
or gels, provided an appropriate solvent is used. Ethylcellulose has been studied as a
stabilizer for emulsions. Ethylcellulose is additionally used in cosmetics and food
products53.
8. Description
Ethylcellulose is a tasteless, free-flowing, white to light tan-colored powder.
9. Typical Properties
Density (bulk): 0.4 g/cm3
Glass transition temperature: 129–133°C 54
Moisture content: Ethylcellulose absorbs very little water from humid air or during
immersion, and that small amount evaporates readily55.
Solubility: Ethylcellulose is practically insoluble in glycerin, propylene glycol, and
water. Ethylcellulose that contains less than 46.5% of ethoxyl groups is freely soluble
in chloroform, methyl acetate, and tetrahydrofuran, and in mixtures of aromatic
hydrocarbons with ethanol (95%). Ethylcellulose that contains not less than 46.5% of
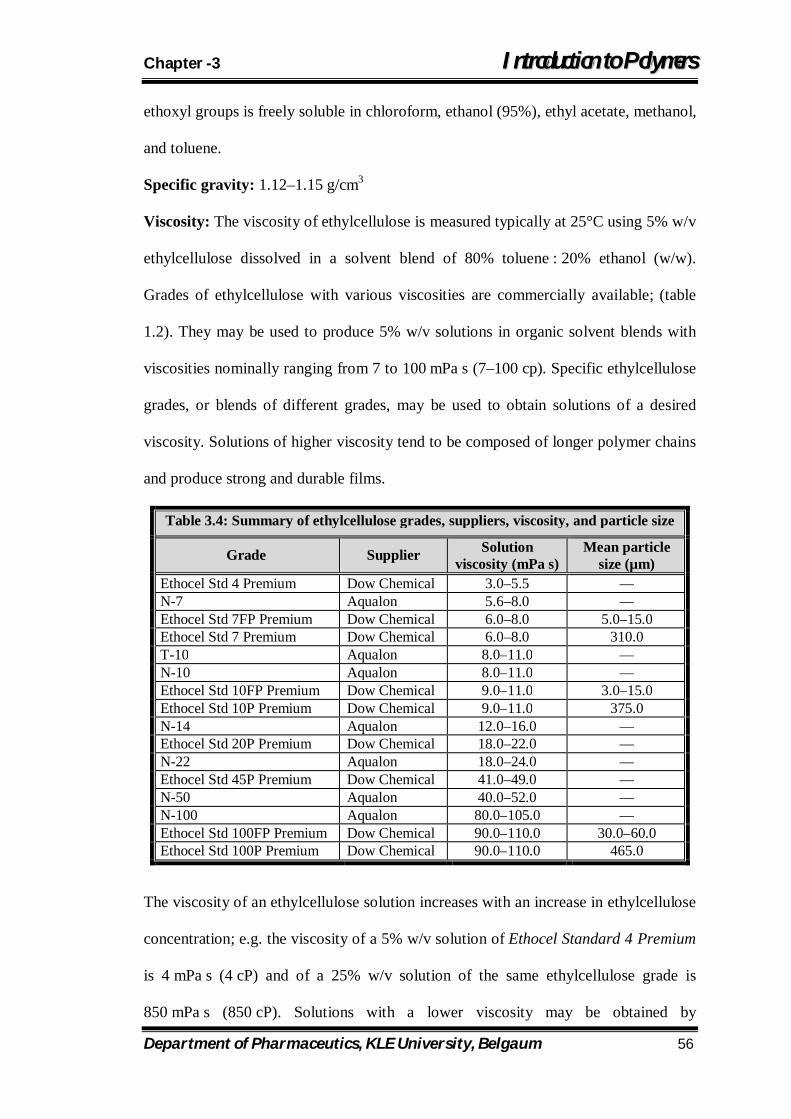
Chapter -3 IInnttrroodduuccttiioonn ttoo PPoollyymmeerrss
Department of Pharmaceutics, KLE University, Belgaum 56
ethoxyl groups is freely soluble in chloroform, ethanol (95%), ethyl acetate, methanol,
and toluene.
Specific gravity: 1.12–1.15 g/cm3
Viscosity: The viscosity of ethylcellulose is measured typically at 25°C using 5% w/v
ethylcellulose dissolved in a solvent blend of 80% toluene : 20% ethanol (w/w).
Grades of ethylcellulose with various viscosities are commercially available; (table
1.2). They may be used to produce 5% w/v solutions in organic solvent blends with
viscosities nominally ranging from 7 to 100 mPa s (7–100 cp). Specific ethylcellulose
grades, or blends of different grades, may be used to obtain solutions of a desired
viscosity. Solutions of higher viscosity tend to be composed of longer polymer chains
and produce strong and durable films.
Table 3.4: Summary of ethylcellulose grades, suppliers, viscosity, and particle size
Grade Supplier Solution viscosity (mPa s)
Mean particle size (µm)
Ethocel Std 4 Premium Dow Chemical 3.0–5.5 — N-7 Aqualon 5.6–8.0 — Ethocel Std 7FP Premium Dow Chemical 6.0–8.0 5.0–15.0 Ethocel Std 7 Premium Dow Chemical 6.0–8.0 310.0 T-10 Aqualon 8.0–11.0 — N-10 Aqualon 8.0–11.0 — Ethocel Std 10FP Premium Dow Chemical 9.0–11.0 3.0–15.0 Ethocel Std 10P Premium Dow Chemical 9.0–11.0 375.0 N-14 Aqualon 12.0–16.0 — Ethocel Std 20P Premium Dow Chemical 18.0–22.0 — N-22 Aqualon 18.0–24.0 — Ethocel Std 45P Premium Dow Chemical 41.0–49.0 — N-50 Aqualon 40.0–52.0 — N-100 Aqualon 80.0–105.0 — Ethocel Std 100FP Premium Dow Chemical 90.0–110.0 30.0–60.0 Ethocel Std 100P Premium Dow Chemical 90.0–110.0 465.0
The viscosity of an ethylcellulose solution increases with an increase in ethylcellulose
concentration; e.g. the viscosity of a 5% w/v solution of Ethocel Standard 4 Premium
is 4 mPa s (4 cP) and of a 25% w/v solution of the same ethylcellulose grade is
850 mPa s (850 cP). Solutions with a lower viscosity may be obtained by
Chapter -3 IInnttrroodduuccttiioonn ttoo PPoollyymmeerrss
Department of Pharmaceutics, KLE University, Belgaum 57
incorporating a higher percentage (30–40%) of a low-molecular-weight aliphatic
alcohol such as ethanol, butanol, propan-2-ol, or n-butanol with toluene. The viscosity
of such solutions depends almost entirely on the alcohol content and is independent of
toluene.
In addition, nonpharmaceutical grades of ethylcellulose that differ in their ethoxyl
content and degree of polymerization are available.
10. Stability and Storage Conditions
Ethylcellulose is a stable, slightly hygroscopic material. It is chemically resistant to
alkalis, both dilute and concentrated, and to salt solutions, although it is more
sensitive to acidic materials than are cellulose esters.
Ethylcellulose is subject to oxidative degradation in the presence of sunlight or UV
light at elevated temperatures. This may be prevented by the use of antioxidant and
chemical additives that absorb light in the 230–340 nm range.
Ethylcellulose should be stored at a temperature not exceeding 32°C (90°F) in a dry
area away from all sources of heat. It should not be stored next to peroxides or other
oxidizing agents.
11. Incompatibilities
Incompatible with paraffin wax and microcrystalline wax.
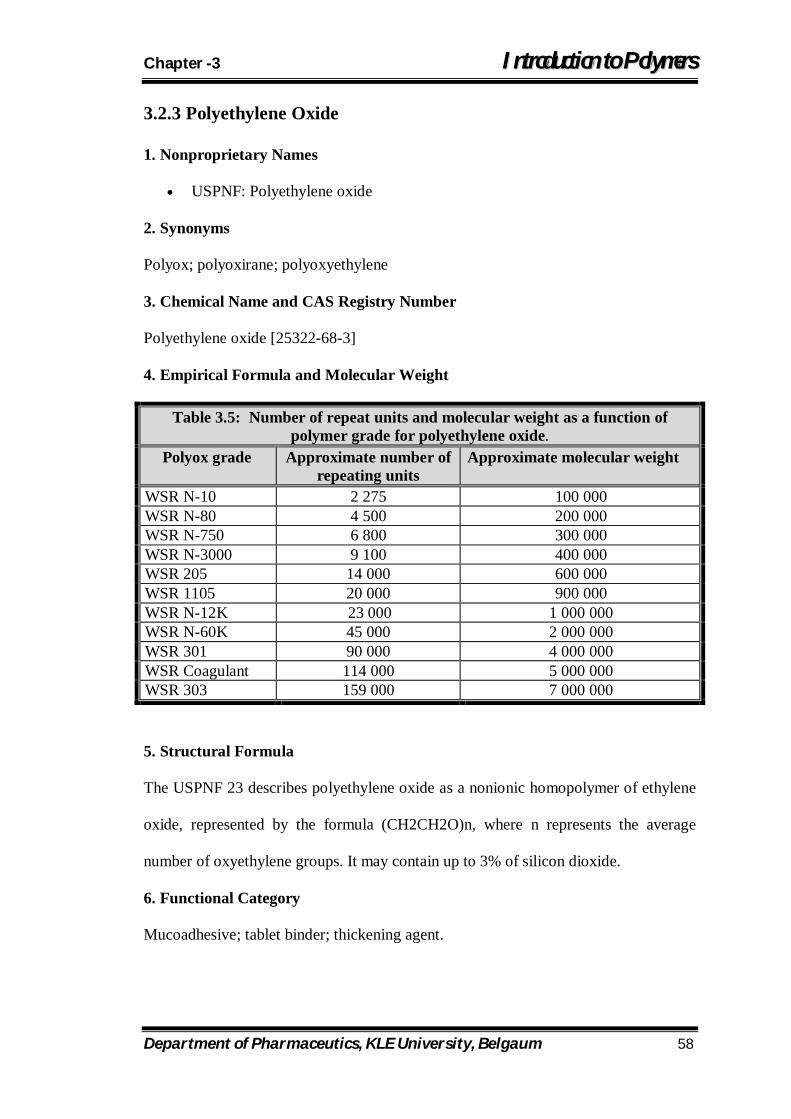
Chapter -3 IInnttrroodduuccttiioonn ttoo PPoollyymmeerrss
Department of Pharmaceutics, KLE University, Belgaum 58
3.2.3 Polyethylene Oxide
1. Nonproprietary Names
USPNF: Polyethylene oxide
2. Synonyms
Polyox; polyoxirane; polyoxyethylene
3. Chemical Name and CAS Registry Number
Polyethylene oxide [25322-68-3]
4. Empirical Formula and Molecular Weight
Table 3.5: Number of repeat units and molecular weight as a function of polymer grade for polyethylene oxide.
Polyox grade Approximate number of repeating units
Approximate molecular weight
WSR N-10 2 275 100 000 WSR N-80 4 500 200 000 WSR N-750 6 800 300 000 WSR N-3000 9 100 400 000 WSR 205 14 000 600 000 WSR 1105 20 000 900 000 WSR N-12K 23 000 1 000 000 WSR N-60K 45 000 2 000 000 WSR 301 90 000 4 000 000 WSR Coagulant 114 000 5 000 000 WSR 303 159 000 7 000 000
5. Structural Formula
The USPNF 23 describes polyethylene oxide as a nonionic homopolymer of ethylene
oxide, represented by the formula (CH2CH2O)n, where n represents the average
number of oxyethylene groups. It may contain up to 3% of silicon dioxide.
6. Functional Category
Mucoadhesive; tablet binder; thickening agent.
Chapter -3 IInnttrroodduuccttiioonn ttoo PPoollyymmeerrss
Department of Pharmaceutics, KLE University, Belgaum 59
7. Applications in Pharmaceutical Formulation or Technology
Polyethylene oxide can be used as a tablet binder at concentrations of 5–85%. The
higher molecular weight grades provide delayed drug release via the hydrophilic
matrix approach.
The relationship between swelling capacity and molecular weight is a good guide
when selecting products for use in immediate- or sustained-release matrix
formulations.
Polyethylene oxide has been shown to be an excellent mucoadhesive polymer56. Low
levels of polyethylene oxide are effective thickeners, although alcohol is usually
added to water based formulations to provide improved viscosity stability.
8. Description
White to off-white, free-flowing powder. Slight ammoniacal odor.
9. Typical Properties
Angle of repose: 340
Density (bulk): 1.3 g/cm3
Melting point: 65–700C
Moisture content: <1%
Solubility: Polyethylene oxide is soluble in water and a number of common organic
solvents such as acetonitrile, chloroform, and methylene chloride. It is insoluble in
aliphatic hydrocarbons, ethylene glycol, and most alcohols57.
11. Stability and Storage Conditions
Store in tightly sealed containers in a cool, dry place. Avoid exposure to high
temperatures since this can result in reduction in viscosity.
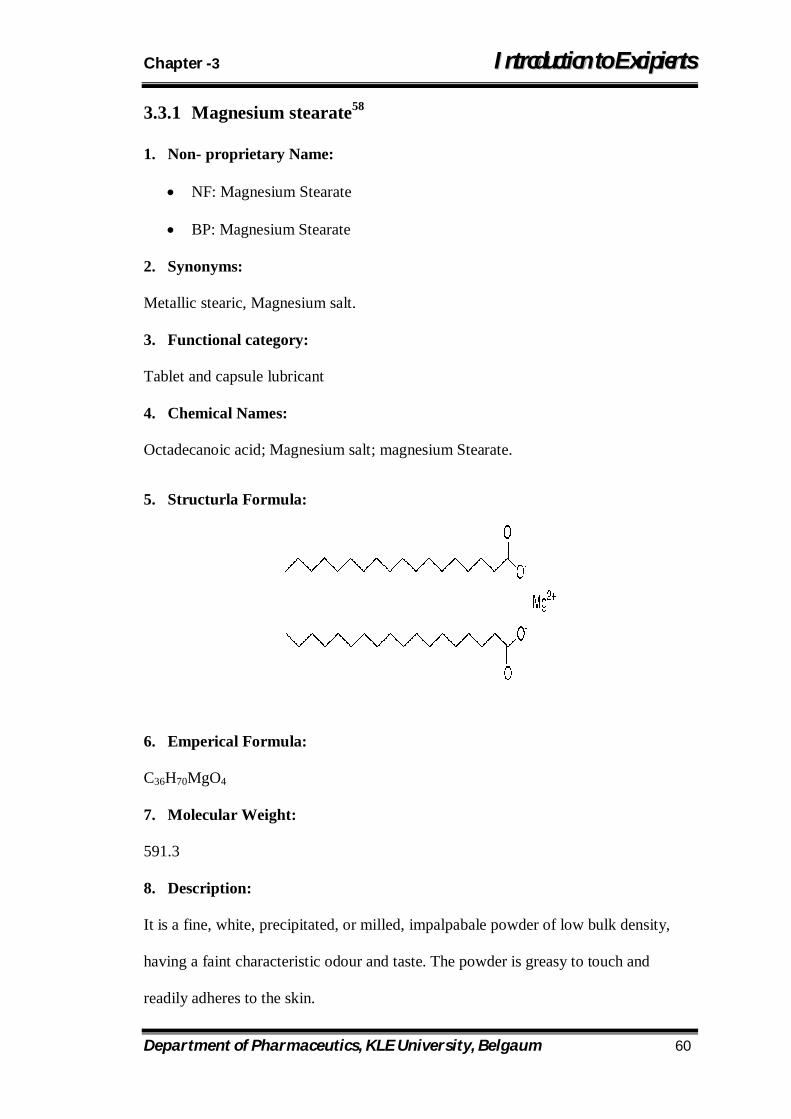
Chapter -3 IInnttrroodduuccttiioonn ttoo EExxcciippiieennttss
Department of Pharmaceutics, KLE University, Belgaum 60
3.3.1 Magnesium stearate58
1. Non- proprietary Name:
NF: Magnesium Stearate
BP: Magnesium Stearate
2. Synonyms:
Metallic stearic, Magnesium salt.
3. Functional category:
Tablet and capsule lubricant
4. Chemical Names:
Octadecanoic acid; Magnesium salt; magnesium Stearate.
5. Structurla Formula:
6. Emperical Formula:
C36H70MgO4
7. Molecular Weight:
591.3
8. Description:
It is a fine, white, precipitated, or milled, impalpabale powder of low bulk density,
having a faint characteristic odour and taste. The powder is greasy to touch and
readily adheres to the skin.
Chapter -3 IInnttrroodduuccttiioonn ttoo EExxcciippiieennttss
Department of Pharmaceutics, KLE University, Belgaum 61
9. Typical properties:
Solubility
Practically insoluble in ethanol, ethanol(95%), ether and water, slightly soluble in
benzene and warm ethanol(95%)
Stability and storage conditions:
Stable, non-self polymerizable. Store in a cool, dry place in a well closed container.
Incompatibilities:
Incompatible with strong acids, alkalies, iron salts and with strong oxidizing material.
10. Applications in Pharmaceuticals Formulation or Technology:
Tablet and capsule lubricant, glidant and antiadherent in the concentration range of
0.25-2.0%.
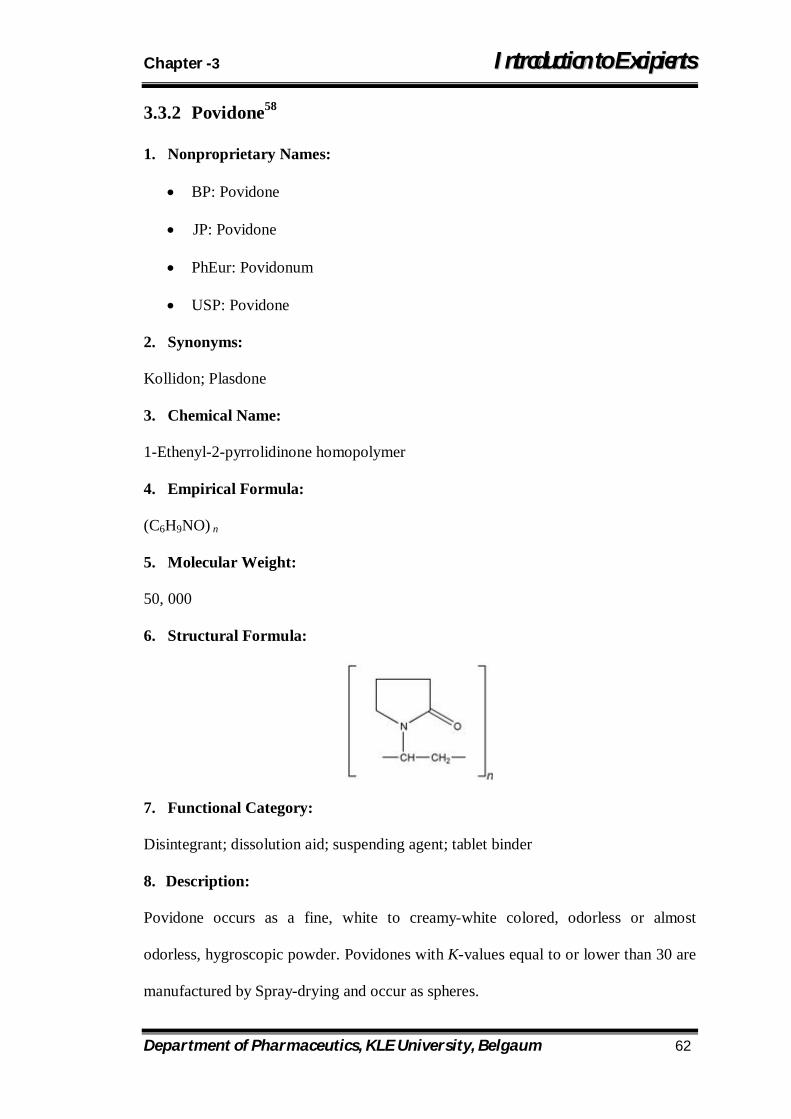
Chapter -3 IInnttrroodduuccttiioonn ttoo EExxcciippiieennttss
Department of Pharmaceutics, KLE University, Belgaum 62
3.3.2 Povidone58
1. Nonproprietary Names:
BP: Povidone
JP: Povidone
PhEur: Povidonum
USP: Povidone
2. Synonyms:
Kollidon; Plasdone
3. Chemical Name:
1-Ethenyl-2-pyrrolidinone homopolymer
4. Empirical Formula:
(C6H9NO) n
5. Molecular Weight:
50, 000
6. Structural Formula:
7. Functional Category:
Disintegrant; dissolution aid; suspending agent; tablet binder
8. Description:
Povidone occurs as a fine, white to creamy-white colored, odorless or almost
odorless, hygroscopic powder. Povidones with K-values equal to or lower than 30 are
manufactured by Spray-drying and occur as spheres.
Chapter -3 IInnttrroodduuccttiioonn ttoo EExxcciippiieennttss
Department of Pharmaceutics, KLE University, Belgaum 63
9. Method of Manufacture:
Povidone is manufactured by the Reppe process. Acetylene and formaldehyde are
reacted in the presence of a highly active copper acetylide catalyst to form butynediol,
which is hydrogenated to butanediol and then cyclodehydrogenated to form
butyrolactone. Pyrrolidone is produced by reacting butyrolactone with ammonia. This
is followed by a vinylation reaction in which pyrrolidone and acetylene are reacted
under pressure. The monomer, vinylpyrrolidone, is then polymerized in the presence
of a combination of catalysts to produce povidone.
10. Typical Properties:
Density: 1.180 g/cm 3
Melting point: Softens at 150°C.
Solubility: Freely soluble in acids, chloroform, ethanol (95%), ketones, methanol, and
water; practically insoluble in ether, hydrocarbons, and mineral oil.
11. Incompatibilities:
Povidone is compatible in solution with a wide range of inorganic salts, natural and
synthetic resins, and other chemicals. It forms molecular adducts in solution with
sulfathiazole, sodium salicylate, salicylic acid, phenobarbital, tannin, and other
compounds.
12. Stability and Storage Conditions:
Povidone darkens to some extent on heating at 150°C, with a reduction in aqueous
solubility. It is stable to a short cycle of heat exposure around 110–130°C; steam
sterilization of an aqueous solution does not alter its properties. Aqueous solutions are
susceptible to mold growth and consequently require the addition of suitable
Chapter -3 IInnttrroodduuccttiioonn ttoo EExxcciippiieennttss
Department of Pharmaceutics, KLE University, Belgaum 64
preservatives. Povidone may be stored under ordinary conditions without undergoing
decomposition or degradation. However, since the powder is hygroscopic, it should be
stored in an airtight container in a cool, dry place.
13. Application in Pharmaceutical Formulation and Technology:
Although povidone is used in a variety of pharmaceutical formulations, it is primarily
used in solid-dosage forms. In tableting, povidone solutions are used as binders in
wet-granulation processes. Povidone is also added to powder blends in the dry form
and granulated in situ by the addition of water, alcohol, or hydroalcoholic solutions.
Povidone is used as a solubilizer in oral and parenteral formulations and has been
shown to enhance dissolution of poorly soluble drugs from solid-dosage forms.
Povidone solutions may also be used as coating agents.

Chapter -3 IInnttrroodduuccttiioonn ttoo EExxcciippiieennttss
Department of Pharmaceutics, KLE University, Belgaum 65
3.3.3 Stearic acid58
1. Nonproprietary Names
BP: Stearic acid
JP: Stearic acid
PhEur: Acidum stearicum
USPNF: Stearic acid
2. Synonyms
Cetylacetic acid; Crodacid; E570; Edenor; Emersol; Hystrene; Industrene; Kortacid
1895; Pearl Steric; Pristerene; stereophonic acid; Tegostearic.
3. Chemical Name and CAS Registry Number
Octadecanoic acid [57-11-4]
4. Empirical Formula C18H36O2 5. Molecular Weight
284.47 (for pure material)
6. Structural Formula
7. Functional Category Emulsifying agent; solubilizing agent; tablet and capsule lubricant. 8. Description
Stearic acid is a hard, white or faintly yellow-colored, somewhat glossy, crystalline
solid or a white or yellowish white powder. It has a slight odor and taste suggesting
tallow.
Chapter -3 IInnttrroodduuccttiioonn ttoo EExxcciippiieennttss
Department of Pharmaceutics, KLE University, Belgaum 66
9. Typical properties :
Saponification value: 200–220
Solubility: freely soluble in benzene, carbon tetrachloride, chloroform, and ether;
soluble in ethanol (95%), hexane, and propylene glycol; practically insoluble in water.
10. Stability and Storage Conditions
Stearic acid is a stable material; an antioxidant may also be added to it; see Section
13. The bulk material should be stored in a well-closed container in a cool, dry place.
11. Incompatibilities
Stearic acid is incompatible with most metal hydroxides and may be incompatible
with oxidizing agents. Insoluble stearates are formed with many metals; ointment
bases made with stearic acid may show evidence of drying out or lumpiness due to
such a reaction when compounded with zinc or calcium salts. A number of differential
scanning calorimetry studies have investigated the compatibility of stearic acid with
drugs. Although such laboratory studies have suggested incompatibilities, e.g. with
naproxen, they may not necessarily be applicable to formulated products. Stearic acid
has been reported to cause pitting in the film coating of tablets coated using an
aqueous film-coating technique; the pitting was found to be a function of the melting
point of the stearic acid.
12. Applications in Pharmaceutical Formulation or Technology:
Stearic acid is widely used in oral and topical pharmaceutical formulations. It is
mainly used in oral formulations as a tablet and capsule lubricant, although it may
also be used as a binderor in combination with shellac as a tablet coating. It has also
been suggested that stearic acid may be used as a sustained-release drug carrier.
Chapter -3 IInnttrroodduuccttiioonn ttoo EExxcciippiieennttss
Department of Pharmaceutics, KLE University, Belgaum 67
In topical formulations, stearic acid is used as an emulsifying and solubilizing agent.
When partially neutralized with alkalis or triethanolamine, stearic acid is used in the
preparation of creams.
Stearic acid is also widely used in cosmetics and food products.
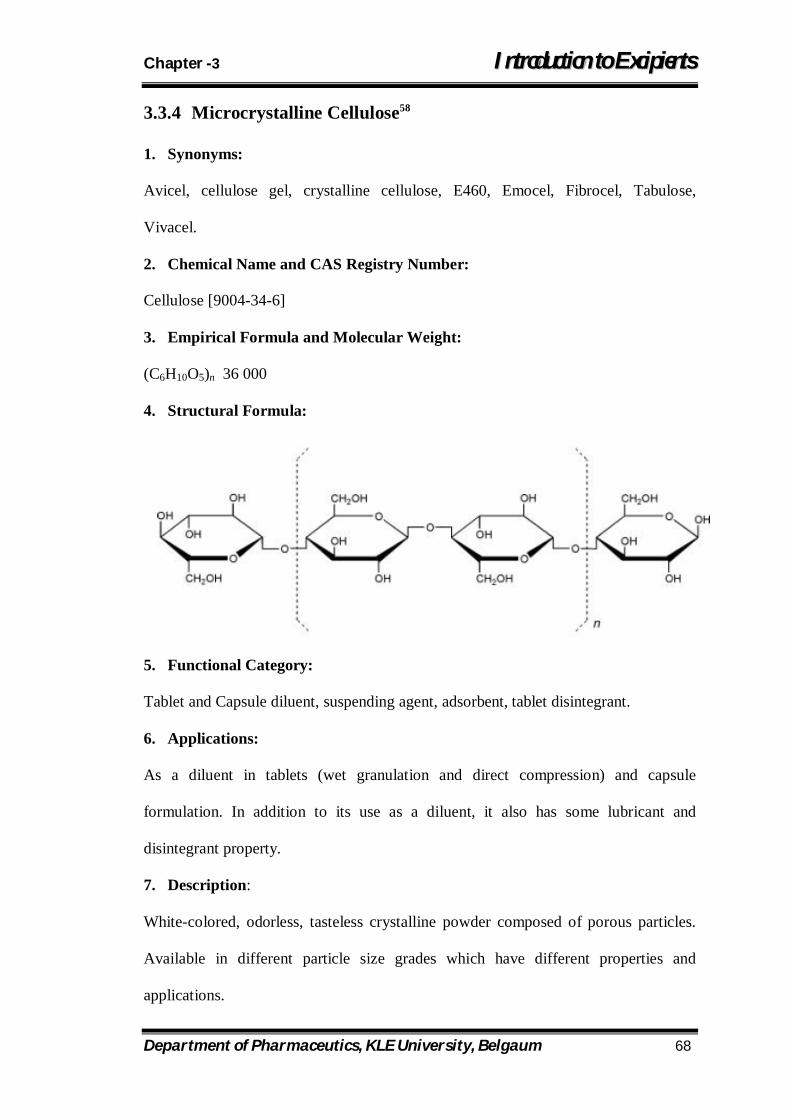
Chapter -3 IInnttrroodduuccttiioonn ttoo EExxcciippiieennttss
Department of Pharmaceutics, KLE University, Belgaum 68
3.3.4 Microcrystalline Cellulose58
1. Synonyms:
Avicel, cellulose gel, crystalline cellulose, E460, Emocel, Fibrocel, Tabulose,
Vivacel.
2. Chemical Name and CAS Registry Number:
Cellulose [9004-34-6]
3. Empirical Formula and Molecular Weight:
(C6H10O5)n 36 000
4. Structural Formula:
5. Functional Category:
Tablet and Capsule diluent, suspending agent, adsorbent, tablet disintegrant.
6. Applications:
As a diluent in tablets (wet granulation and direct compression) and capsule
formulation. In addition to its use as a diluent, it also has some lubricant and
disintegrant property.
7. Description:
White-colored, odorless, tasteless crystalline powder composed of porous particles.
Available in different particle size grades which have different properties and
applications.
Chapter -3 IInnttrroodduuccttiioonn ttoo EExxcciippiieennttss
Department of Pharmaceutics, KLE University, Belgaum 69
8. Solubility:
Slightly soluble in 5 % w/v NaOH solution, practically insoluble in water, dilute acids
and most organic solvents.
9. Stability:
It is a stable, though hygroscopic material.
10. Storage conditions:
The bulk material should be stored in a well-closed container in a cool, dry, place.
11. Incompatibilities:
Incompatible with strong oxidizing agents.
12. Safety:
It is generally regarded as a nontoxic and nonirritant material.
Chapter -4 RReevviieeww ooff LLiitteerraattuurree
Department of Pharmaceutics, KLE University, Belgaum 70
4.1 Review of Work Done using HPMC
Khanvilkar et al59 investigated the effects of three factors: 1. use of a mixture of two
different grades of hydroxypropyl methylcellulose (HPMC), 2. apparent viscosity, and
3. tablet hardness on drug release profiles of extended-release matrix tablets. They
used 23 full factorial design to study various combinations of the three factors using
eight experiments conducted in a randomized order. They reported that dissolution
rates were independent of tablet hardness for all formulations within the range of 3.3
– 6 Kp. Although significantly shorter lag times were observed for the tablets
formulated with low- and high-viscosity HPMC mixtures in comparison to those
containing a single grade of HPMC. They have concluded that lot-to-lot variability in
apparent viscosity of HPMC should not be a concern in achieving similar dissolution
profiles. Results also indicated that an HPMC mixture of two viscosity grades could
be substituted for another HPMC grade if the apparent viscosity was comparable.
They also concluded that the drug release from an HPMC matrix tablet prepared by
dry blend and direct compression approach was independent of tablet hardness, and
depend mostly on the viscosity of the gel layer formed.
Suvarna et al60 had formulated ranitidine hydrochloride sustained release tablets with
three different viscosity grades of HPMC viz. K 100M, K 15M and K4M, as release
retardants. Drug and matrix materials were blended for direct compression and
granulated using absolute ethanol for wet granulation. For all the three polymers, it
was observed that as the polymer concentration was increased, drug release was
retarded for longer period of time and percentage as well was more irrespective of
granulation method used. However, drug:polymer ratio and other excipients was kept
constant. The granulation method had a significant effect on the dissolution profile.
The dissolution rate was higher for wet granulated tablets as compared to direct
Chapter -4 RReevviieeww ooff LLiitteerraattuurree
Department of Pharmaceutics, KLE University, Belgaum 71
compression. By wet granulation, drug:polymer ratio of 3:2.5 showed t90 and t50 of
12.5 hr and 3.7 hour respectively. There was greater release retardation in initial
period with direct compression method as compared to wet granulation method.
Higher viscosity grades of polymer retarded the drug release for a longer period of
time for both the methods. In conclusion, direct compression method resulted in
prolonged and consistent drug release with reduced processing steps at lower polymer
concentration, as compared to wet granulation process for preparation of controlled
release ranitidine hydrochloride tablets.
Ayhan et al61 studied the effect of formulation variables on release profile of
diclofenac sodium from hydroxypropylmethyl cellulose and chitosan matrix tables.
Diclofenac sodium tablets were prepared by wet granulation and direct compression
method and different ratios of HPMC and chitosan were used. They reported that 20%
HPMC contained sustained release formulation with direct (dry) compression method
was the optimum formulation due to its better targeting profile in terms of release.
This formulation exhibited the best-fitted formulation into the zero order kinetics.
However, in developing sustained release formulations containing diclofenac sodium,
it has been shown that chitosan provided a better result in preparation of sustained
release formulation prepared by wet granulation method. In addition, better results
have been seen with 15%, 20%, and 25% chitosan in these formulations.
Yaw-Bin Huang et al62 had formulated the pH-dependent release of nicardipine
hydrochloride extended release tablets. Simultaneously combination two hydrophilic
polymers: Hydroxypropylmethylcellulose and sodium alginate as retardant and avicel
as additive were used to formulate tablets. The constrained mixture experimental
design and the response surface methodology (RSM) and multiple response
optimizations utilizing the polynomial equation were used to search for the optimal
Chapter -4 RReevviieeww ooff LLiitteerraattuurree
Department of Pharmaceutics, KLE University, Belgaum 72
formulation. The combination effect of HPMC and sodium alginate was the most
influencing factor on the drug release from extended-release matrix tablets. The
release kinetic of drug from HPMC matrix tablets with alginate followed the zero-
order release pattern. The mechanism of drug release from extended-release matrix
tablets was dependent on the added amount of alginate.
Shoufeng et al63 illustrated statistical experimental design and data analysis using
response surface methodology. A central composite Box-Wilson design for the
controlled release of calcium was used with three formulation variables like HPMC
loading, citric acid loading and magnesium stearate loading. Sustained release
delivery of calcium with increased bioavailability was achieved.
Kavanagh et al64 checked the effect of dissolution medium variables, such as
medium composition, ionic strength and agitation rate, on the swelling and erosion of
Hypromellose (hydroxypropylmethylcellulose, HPMC) matrices of different
molecular weights. Swelling and erosion of HPMC polymers were determined by
measuring the wet and subsequent dry weights of matrices. The extent of swelling
increased with increasing molecular weight, and decreased with increasing agitation
rate. The erosion rate was seen to increase with decrease in polymer molecular
weight, with a decrease in ionic strength and with increasing agitation rate.
Farouk et al65 developed a programmable controlled release drug delivery system.
The device in the form of a non-digestible oral capsule was designed to utilize an
automatically operated geometric obstruction that kept the device floating. Different
viscosity grades of HPMC were employed as model eroding matrices. Zero-order
release could be maintained for periods ranging between 5 to 20 days before the
geometric obstruction was triggered off. The rate of drug release was dependant on
the nature, viscosity and ratio of polymer employed.
Chapter -4 RReevviieeww ooff LLiitteerraattuurree
Department of Pharmaceutics, KLE University, Belgaum 73
Siepmann et al66 had developed mathematical model to predict the release kinetics of
water-soluble drugs from HPMC matrices. The effects of the dimensions and aspect
ratio (radius:height) of the tablets on the drug release rate were evaluated. Drug
release rates were overestimated at the beginning and underestimated at the end of the
process. It has been conclude that the mathematical model generated was capable of
predicting the drug release kinetics from hydrophilic polymer matrices of various
shapes and sizes, in different release media, and for different drugs. It can thus be
used to calculate the required aspect ratio and dimensions of new controlled drug
delivery systems to achieve desired release profiles, hence facilitating the
development of new products. The effect of the initial matrix radius on release was
found to be more pronounced than the effect of the initial thickness.
Fua et al67 studied the effect of physicochemical properties of drug and polymer
concentration on drug release from HPMC matrices. They conclude that the release of
ranitidine hydrochloride, diltiazem hydrochloride, isoniazid, ribavirin, theophyline,
tinidazole, propylthiouracil, and sulfamethoxazole from HPMC matrices having
different HPMC concentration (16.5–55% w/w) follow the power law. Increasing
HPMC concentration decreased kinetic constant in Peppas’ equation, so decreased
release rate of a drug from HPMC matrices. The benefit of the novel model was to
predict Mt/M∞ values of the drug from formulation and its physicochemical
properties. The model was applicable to the HPMC matrices of different polymer
levels and different drugs including soluble drugs and slightly soluble drugs.
Gubbins et al68 reported that the inclusion of casein modified the release of
diclofenac from hydroxypropylmethycellulose (HPMC, Methocel grades K100LV
and K15M) based matrices. The presence of casein in diclofenac sodium - K100LV
matrices increased the drug release rate and rendered the release profile more linear.

Chapter -4 RReevviieeww ooff LLiitteerraattuurree
Department of Pharmaceutics, KLE University, Belgaum 74
Incorporation of sodium caseinate in HPMC-drug system retarded the disintegrating
tendency by enhancing the initial gel forming ability of these systems. They also
conclude that the presence of casein decreased the extent of medium uptake (swelling)
of the matrices and accelerated the rate of erosion, while not altering the dissolution
medium infiltration rate.
Williams et al69 have investigated the influence of Hydroxypropyl methylcellulose
(HPMC) molecular weight on pharmacokinetic and pharmacodynamic parameters of
controlled release formulations containing alprazolam. They used HPMC K4MP or
HPMC K100LVP in formulation. They have reported that the tablet formulations
containing either HPMC K4MP or HPMC K100LVP had similar dissolution profiles,
and the dissolution profiles did not change through 6 months at 40oC/75% RH or 12
months at 25oC/65% relative humidity. They also reported that the area under the
plasma concentration-time curve, time to peak concentration and peak plasma
concentration were not significantly different between the two tablet formulations
investigated in either the fed or fasted states. They also conclude that types and
concentrations of HPMC could not influence in vitro or in vivo performance of
controlled release tablets containing lipophilic alprazolam.
Wan et al70 was studied the action of hydroxypropylmethylcellulose (HPMC) on
aqueous penetration into matrices containing HPMC of varying viscosity and
concentration. They reported that incorporation of HPMC into matrices improved
wetting and enhanced water uptake into the matrices. As the molecular weight and
concentration of HPMC increase the water uptake by system was greater. They
concluded that the action of HPMC on aqueous uptake was depended on the
molecular weight of HPMC.
Chapter -4 RReevviieeww ooff LLiitteerraattuurree
Department of Pharmaceutics, KLE University, Belgaum 75
Tahara et al71 have studied the mechanisms of sustained release from tablet matrices
prepared with hydroxypropyl methylcellulose (HPMC) 2910. The two important
parameters for the release of drug from tablet matrices are the infiltration rate of
medium into the matrix, and the erosion rate of the matrix system. They reported that
the infiltration rate of medium into the matrix could be controlled by changing the
interspace volume of the matrix by the use of higher levels of materials such as
lactose, which could quickly rinse out of matrix system. The larger interspace
volumes produced by the higher ratio resulted in more rapid release of the drug. They
also reported that the viscosity of HPMC polymers was related to the molecular
weight and had a large influence on the erosion rate of matrix tablet. Use of a low
viscous grade HPMC polymer was desirable for poorly water soluble drugs because
the release rate of poorly soluble drug can be controlled by the rate of tablet erosion.
The tablet erosion rate can also be adjusted by the choice of HPMC polymer viscosity
or by mixing HPMC of different viscosity grades.
Vazquez et al72 used hydroxypropylmethylcellulose {Methocel K100LV (an HPMC
with nominal viscosity of 100 cP) and Methocel K100M (HPMC with nominal
viscosity of 100000 cP)} mixtures as gelling agents in matrix tablets for hydrosoluble
drugs and to investigate relationship between gelling agent viscosity and the kinetics
of drug release from such tablets. Atenolol tablets were formulated with 40% or 80%
gelling agent (i.e. K100LV, K100M or one of the K100LV:K100M mixtures). From
Higuchi's model and the equation of Korsmeyer, drug release was found to be
diffusion limited. They reported that a negative relationship was observed between the
Higuchi constant for each tablet type and the apparent viscosity of the corresponding
gelling agent in aqueous dispersion.

Chapter -4 RReevviieeww ooff LLiitteerraattuurree
Department of Pharmaceutics, KLE University, Belgaum 76
Sarvanan et al73 have formulated the hydroxypropyl methylcellulose based
cephalexin extended release tablet, which could release the drug for six hours in
predetermined rate. Cephalexin extended release tablets were prepared by changing
various physical and chemical parameters (hardness and granulation), in order to get
required theoretical release profile. They reported that a higher amount of HPMC in
tablet composition resulted in reduced drug release. Addition of MCCP resulted in
faster drug release. Tablets prepared by dry granulation released the drug slowly than
the same prepared with a wet granulation technique. Addition of wetting agent in the
tablets prepared with dry granulation technique showed slower release. An increase in
tablet hardness resulted in faster drug release. They also studied the effect of storage
on in vitro release and physicochemical properties for successful batch. Results were
found to be within acceptable limit.
Bravo et al74 have formulated the uncoated HPMC matrix tablets and evaluated the
relationship and influence of different content levels of microcrystalline cellulose
(MCC), starch and lactose in order to achieve a zero-order release of diclofenac
sodium. They reported that release of diclofenac sodium was influenced by the
presence of MCC and by the different concentrations of starch and lactose. Drug
release kinetics from these formulations corresponded best to the zero-order kinetics.
Compared to conventional tablets, release of the model drug from these HPMC matrix
tablets was prolonged. As a result, an oral controlled release dosage form to avoid the
gastrointestinal adverse effects was achieved.
María Elena et al75 have formulated matrix tablets of metronidazole with
hydroxypropyl methylcellulose prepared by granulation with water. They studied on
the influence of the HPMC viscosity grade and particle size on the release profile of
metronidazole. They evaluated the release profile of metronidazole at viscosity grades
Chapter -4 RReevviieeww ooff LLiitteerraattuurree
Department of Pharmaceutics, KLE University, Belgaum 77
of 15, 860, 5000, 20 000 and 30 000 cps and at particle sizes of 163, 213, 335 and 505
µm. They observed a linear relationship between the release rate and the cube of the
diameter of the HPMC particles. An increasing burst effect occurred with increasing
viscosity grades and increasing particle sizes of HPMC.
Sharma et al76 have used Methocel K15M as a bioadhesive polymer. They evaluated
its adhesion and bioadhesion characteristics by shear stress measurement and
detachment force measurement methods, respectively. They have reported the
maximum adhesion was found between pH 5 and pH 6 and maximum adhesion
strength was found in the duodenal portion of the intestine. They also reported that the
release of chlorpheniramine maleate (1:1 and 1:1.5) and with diclofenac sodium (1:1,
1:1.2, and 1:14) followed initial first-order release behavior and then zero-order
release behavior.

Chapter -4 RReevviieeww ooff LLiitteerraattuurree
Department of Pharmaceutics, KLE University, Belgaum 78
4.2. Review of Work Done using PEO
Yang et al77 developed a mathematical model to describe the transport phenomena of
a water-soluble small molecular drug (caffeine) from highly swellable and dissoluble
polyethylene oxide (PEO) cylindrical tablets. It was found Drug release from PEO
matrices involves two mechanisms, diffusion through swelling polymer and release
via polymer dissolution. Thus the swelling and dissolution behaviors of tablets made
of pure polymer play important roles in the overall drug release process. It is found
that swelling is the dominant factor in drug release kinetics for higher molecular
weight of PEO (Mw=8x10⁶) while both swelling and dissolution are important to
caffeine release for lower molecular weight PEO (Mw=4x10⁶).
Zelko et al78 studied the effect of storage and active ingredient properties on the drug
release profile of poly(ethylene oxide) matrix tablets. Study suggests that both the
hydration properties of the active ingredient and the molecular weight of the polymer
influence the effect of physical ageing of poly(ethyle oxide) on the drug release of
matrix tablets.
Lambov et al79 performed the study of Verapamil hydrochloride release from
compressed hydrophilic Polyox-Wsr tablets. It was found that mol. wt. of polymer
affects significantly the drug release – the higher the mol. wt., the smaller the amount
of the drug released. The main factors determining release rate were found to be mol.
wt. of polymer in the matrix and drug conc. (to a lesser extent).
Petrovic et al80 conducted the water uptake and polymer dissolution studies of pure
PEO matrices. Diffusion coefficient of water was found to be D1=3442×10−5 cm2/s
and concentration dependent constant β1 was 0.74. Dissolution rate constant Kdiss,
polymers mass loss rate normalized to the actual surface of the system, was found to
be 1.84×10⁻⁶ g/cm2s. From the study it was found that developing mathematical
Chapter -4 RReevviieeww ooff LLiitteerraattuurree
Department of Pharmaceutics, KLE University, Belgaum 79
models which give complex insight into drug release is crucial for adequate
characterization of sustained release dosage forms. It enables elucidation of the
precise drug release mechanism and prediction of behavior of different drug loadings
of matrices.
Conte et al81 compared the performance of PEO and HPMC polymers when
employed in the Geomatrix® technology, a versatile, well-known method to achieve
extended release of drugs at a constant rate. Four core formulations were prepared,
containing a soluble drug (diltiazem) and, alternatively, PEO or HPMC of two
different viscosity grades. Dissolution tests performed on the four different core
formulations showed that the diltiazem release rate from the two matrices containing
HPMC is slower compared to the release rate of PEO matrices. HPMCs tablets
showed a slow and continuous volume increase, up to four-fold (Methocel K4M) or
six-fold (Methocel K100M) the volume of the dry tablet, after 20 h in distilled water.
On the other hand, tablets made of pure PEOs swelled rapidly (up to six-fold or two-
fold in the case of Polyox WSR 303 or Polyox NF-60K tablets, respectively, after 8
h), but these polymers formed a weaker gel, which tend to be eroded much more
quickly and the tablet volume decreases progressively. It was concluded that HPMC
controls the release rate better as compared to PEO.
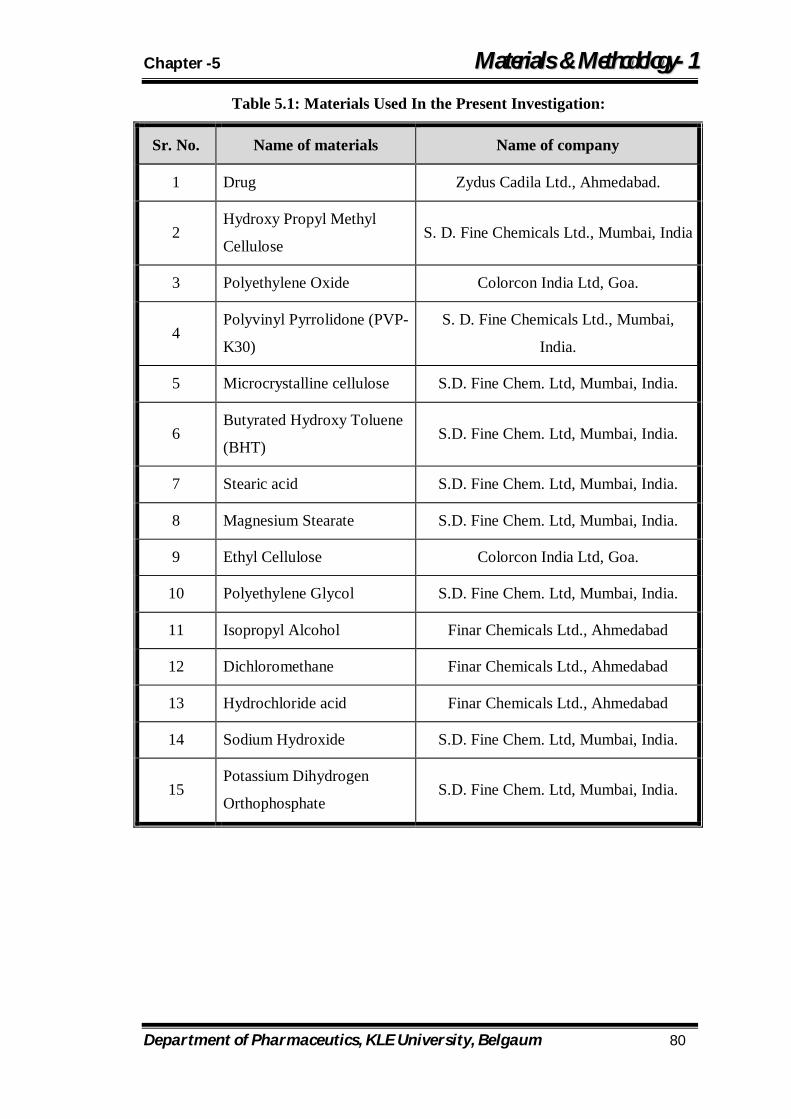
Chapter -5 MMaatteerriiaallss && MMeetthhooddoollooggyy--11
Department of Pharmaceutics, KLE University, Belgaum 80
Table 5.1: Materials Used In the Present Investigation:
Sr. No. Name of materials Name of company
1 Drug Zydus Cadila Ltd., Ahmedabad.
2 Hydroxy Propyl Methyl
Cellulose S. D. Fine Chemicals Ltd., Mumbai, India
3 Polyethylene Oxide Colorcon India Ltd, Goa.
4 Polyvinyl Pyrrolidone (PVP-
K30)
S. D. Fine Chemicals Ltd., Mumbai,
India.
5 Microcrystalline cellulose S.D. Fine Chem. Ltd, Mumbai, India.
6 Butyrated Hydroxy Toluene
(BHT) S.D. Fine Chem. Ltd, Mumbai, India.
7 Stearic acid S.D. Fine Chem. Ltd, Mumbai, India.
8 Magnesium Stearate S.D. Fine Chem. Ltd, Mumbai, India.
9 Ethyl Cellulose Colorcon India Ltd, Goa.
10 Polyethylene Glycol S.D. Fine Chem. Ltd, Mumbai, India.
11 Isopropyl Alcohol Finar Chemicals Ltd., Ahmedabad
12 Dichloromethane Finar Chemicals Ltd., Ahmedabad
13 Hydrochloride acid Finar Chemicals Ltd., Ahmedabad
14 Sodium Hydroxide S.D. Fine Chem. Ltd, Mumbai, India.
15 Potassium Dihydrogen
Orthophosphate S.D. Fine Chem. Ltd, Mumbai, India.
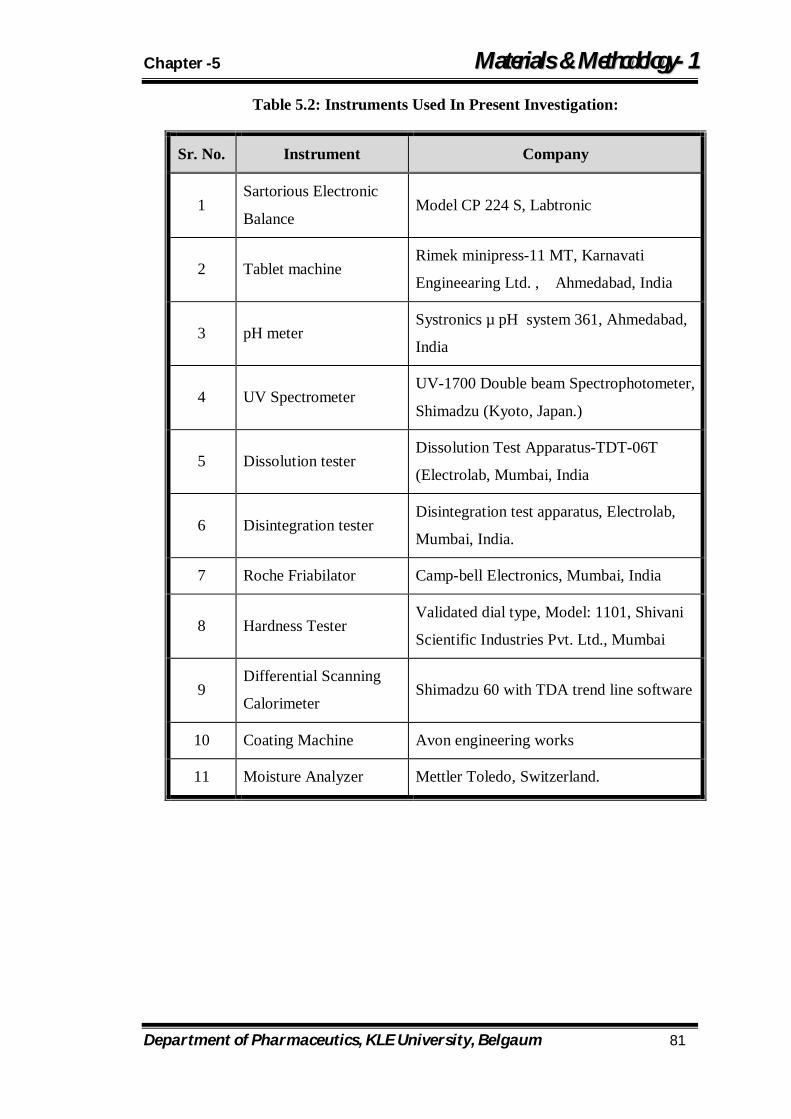
Chapter -5 MMaatteerriiaallss && MMeetthhooddoollooggyy--11
Department of Pharmaceutics, KLE University, Belgaum 81
Table 5.2: Instruments Used In Present Investigation:
Sr. No. Instrument Company
1 Sartorious Electronic
Balance Model CP 224 S, Labtronic
2 Tablet machine Rimek minipress-11 MT, Karnavati
Engineearing Ltd. , Ahmedabad, India
3 pH meter Systronics µ pH system 361, Ahmedabad,
India
4 UV Spectrometer UV-1700 Double beam Spectrophotometer,
Shimadzu (Kyoto, Japan.)
5 Dissolution tester Dissolution Test Apparatus-TDT-06T
(Electrolab, Mumbai, India
6 Disintegration tester Disintegration test apparatus, Electrolab,
Mumbai, India.
7 Roche Friabilator Camp-bell Electronics, Mumbai, India
8 Hardness Tester Validated dial type, Model: 1101, Shivani
Scientific Industries Pvt. Ltd., Mumbai
9 Differential Scanning
Calorimeter Shimadzu 60 with TDA trend line software
10 Coating Machine Avon engineering works
11 Moisture Analyzer Mettler Toledo, Switzerland.
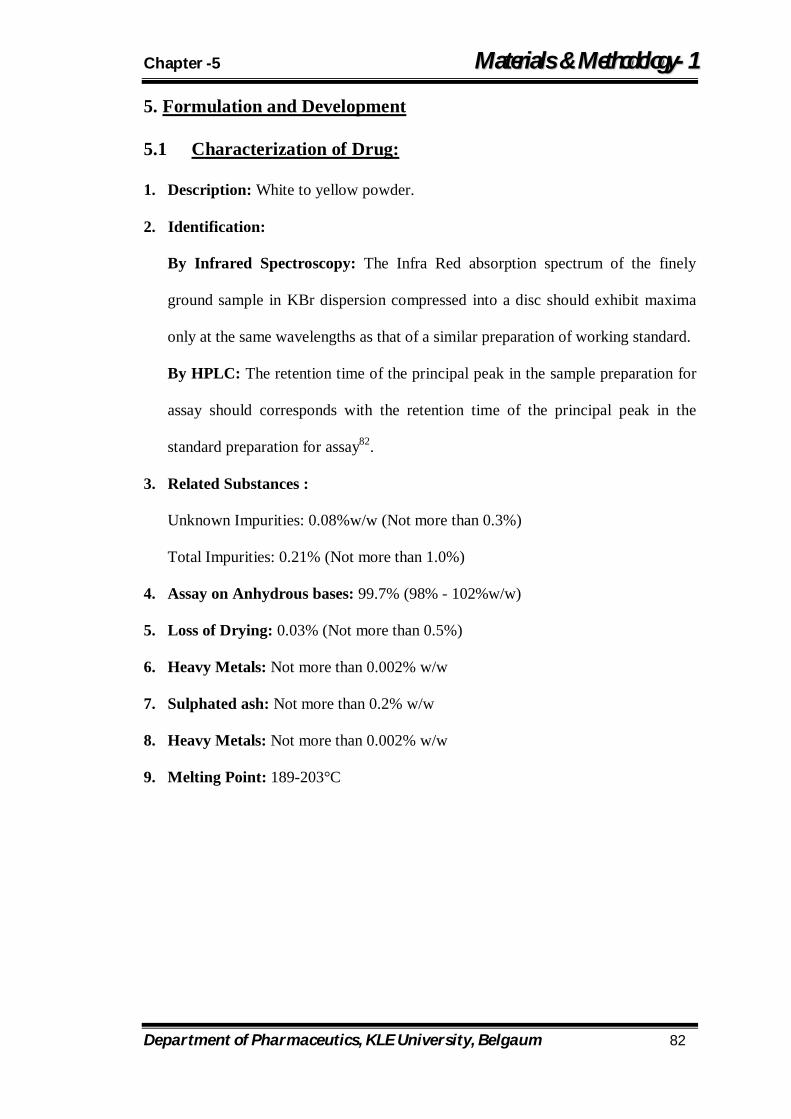
Chapter -5 MMaatteerriiaallss && MMeetthhooddoollooggyy--11
Department of Pharmaceutics, KLE University, Belgaum 82
5. Formulation and Development
5.1 Characterization of Drug:
1. Description: White to yellow powder.
2. Identification:
By Infrared Spectroscopy: The Infra Red absorption spectrum of the finely
ground sample in KBr dispersion compressed into a disc should exhibit maxima
only at the same wavelengths as that of a similar preparation of working standard.
By HPLC: The retention time of the principal peak in the sample preparation for
assay should corresponds with the retention time of the principal peak in the
standard preparation for assay82.
3. Related Substances :
Unknown Impurities: 0.08%w/w (Not more than 0.3%)
Total Impurities: 0.21% (Not more than 1.0%)
4. Assay on Anhydrous bases: 99.7% (98% - 102%w/w)
5. Loss of Drying: 0.03% (Not more than 0.5%)
6. Heavy Metals: Not more than 0.002% w/w
7. Sulphated ash: Not more than 0.2% w/w
8. Heavy Metals: Not more than 0.002% w/w
9. Melting Point: 189-203°C
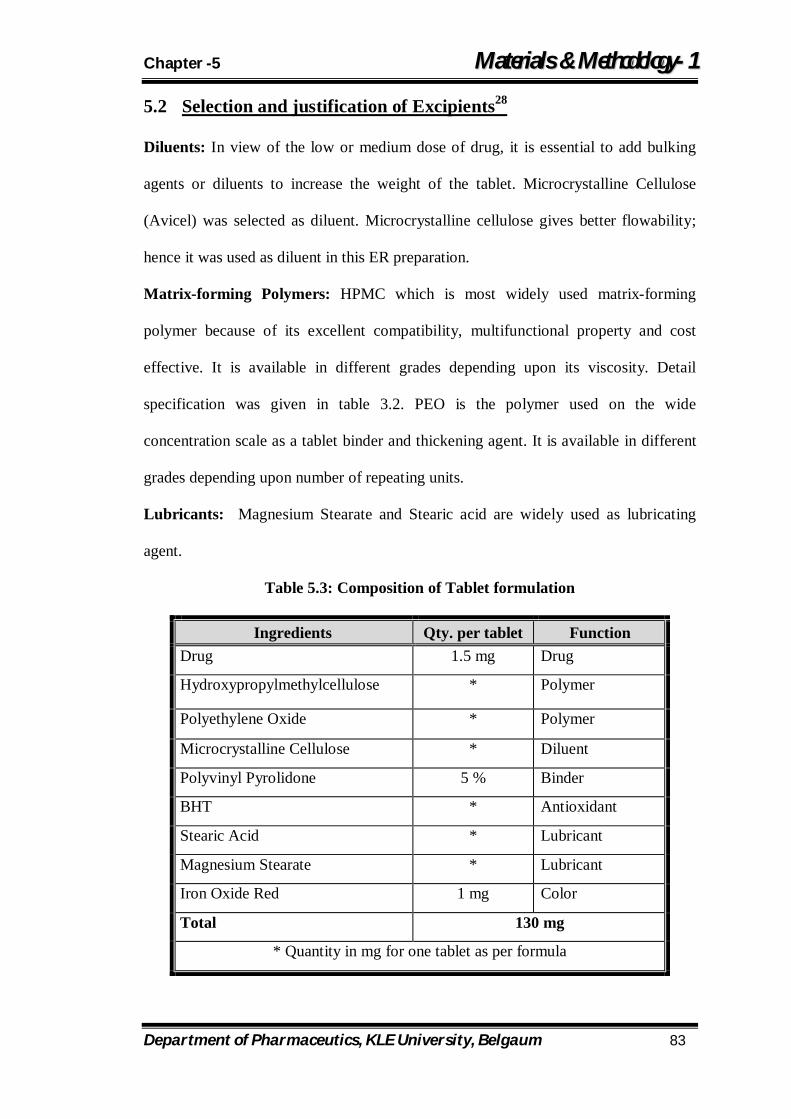
Chapter -5 MMaatteerriiaallss && MMeetthhooddoollooggyy--11
Department of Pharmaceutics, KLE University, Belgaum 83
5.2 Selection and justification of Excipients28
Diluents: In view of the low or medium dose of drug, it is essential to add bulking
agents or diluents to increase the weight of the tablet. Microcrystalline Cellulose
(Avicel) was selected as diluent. Microcrystalline cellulose gives better flowability;
hence it was used as diluent in this ER preparation.
Matrix-forming Polymers: HPMC which is most widely used matrix-forming
polymer because of its excellent compatibility, multifunctional property and cost
effective. It is available in different grades depending upon its viscosity. Detail
specification was given in table 3.2. PEO is the polymer used on the wide
concentration scale as a tablet binder and thickening agent. It is available in different
grades depending upon number of repeating units.
Lubricants: Magnesium Stearate and Stearic acid are widely used as lubricating
agent.
Table 5.3: Composition of Tablet formulation
Ingredients Qty. per tablet Function Drug 1.5 mg Drug
Hydroxypropylmethylcellulose * Polymer
Polyethylene Oxide * Polymer
Microcrystalline Cellulose * Diluent
Polyvinyl Pyrolidone 5 % Binder
BHT * Antioxidant
Stearic Acid * Lubricant
Magnesium Stearate * Lubricant
Iron Oxide Red 1 mg Color
Total 130 mg
* Quantity in mg for one tablet as per formula
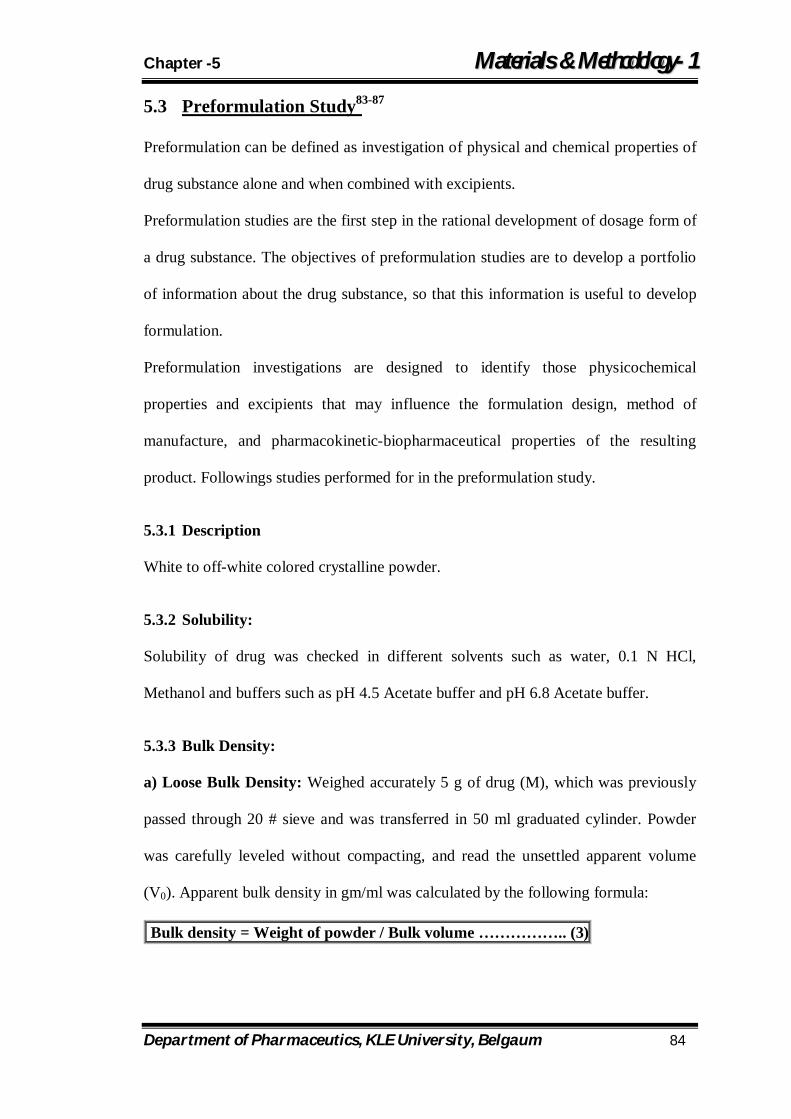
Chapter -5 MMaatteerriiaallss && MMeetthhooddoollooggyy--11
Department of Pharmaceutics, KLE University, Belgaum 84
5.3 Preformulation Study83-87
Preformulation can be defined as investigation of physical and chemical properties of
drug substance alone and when combined with excipients.
Preformulation studies are the first step in the rational development of dosage form of
a drug substance. The objectives of preformulation studies are to develop a portfolio
of information about the drug substance, so that this information is useful to develop
formulation.
Preformulation investigations are designed to identify those physicochemical
properties and excipients that may influence the formulation design, method of
manufacture, and pharmacokinetic-biopharmaceutical properties of the resulting
product. Followings studies performed for in the preformulation study.
5.3.1 Description
White to off-white colored crystalline powder.
5.3.2 Solubility:
Solubility of drug was checked in different solvents such as water, 0.1 N HCl,
Methanol and buffers such as pH 4.5 Acetate buffer and pH 6.8 Acetate buffer.
5.3.3 Bulk Density:
a) Loose Bulk Density: Weighed accurately 5 g of drug (M), which was previously
passed through 20 # sieve and was transferred in 50 ml graduated cylinder. Powder
was carefully leveled without compacting, and read the unsettled apparent volume
(V0). Apparent bulk density in gm/ml was calculated by the following formula:
Bulk density = Weight of powder / Bulk volume …………….. (3)
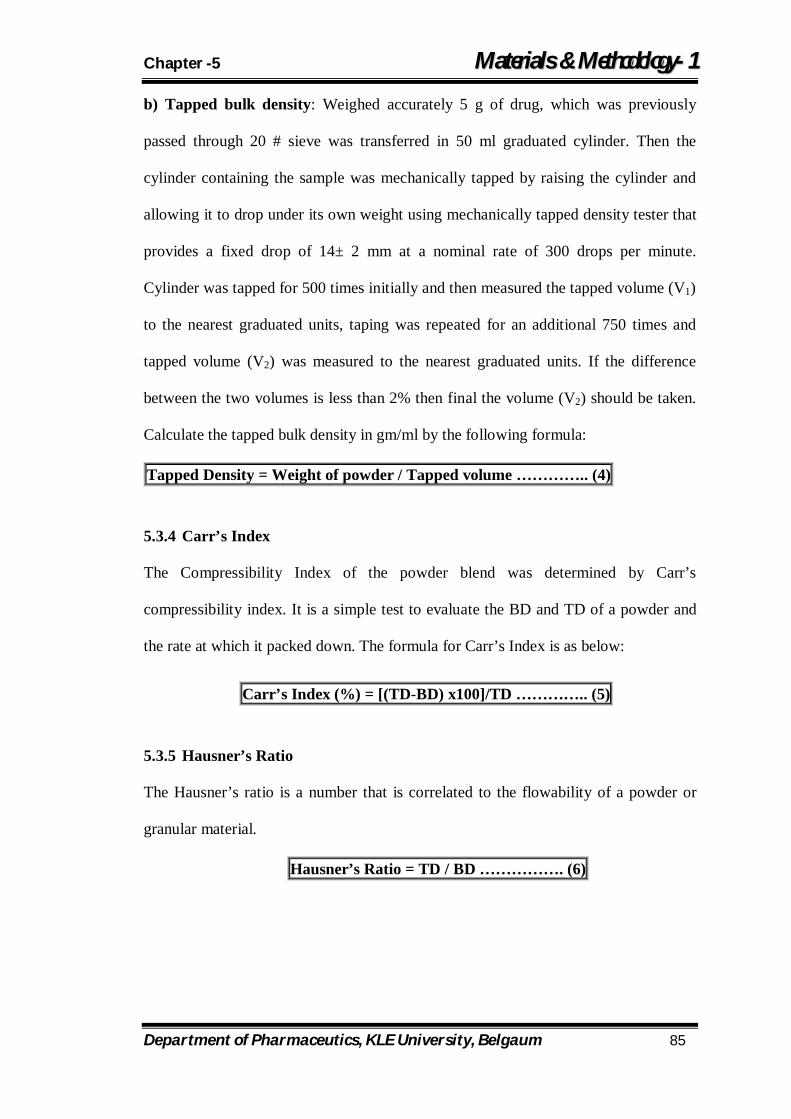
Chapter -5 MMaatteerriiaallss && MMeetthhooddoollooggyy--11
Department of Pharmaceutics, KLE University, Belgaum 85
b) Tapped bulk density: Weighed accurately 5 g of drug, which was previously
passed through 20 # sieve was transferred in 50 ml graduated cylinder. Then the
cylinder containing the sample was mechanically tapped by raising the cylinder and
allowing it to drop under its own weight using mechanically tapped density tester that
provides a fixed drop of 14± 2 mm at a nominal rate of 300 drops per minute.
Cylinder was tapped for 500 times initially and then measured the tapped volume (V1)
to the nearest graduated units, taping was repeated for an additional 750 times and
tapped volume (V2) was measured to the nearest graduated units. If the difference
between the two volumes is less than 2% then final the volume (V2) should be taken.
Calculate the tapped bulk density in gm/ml by the following formula:
Tapped Density = Weight of powder / Tapped volume ………….. (4)
5.3.4 Carr’s Index
The Compressibility Index of the powder blend was determined by Carr’s
compressibility index. It is a simple test to evaluate the BD and TD of a powder and
the rate at which it packed down. The formula for Carr’s Index is as below:
Carr’s Index (%) = [(TD-BD) x100]/TD ………….. (5)
5.3.5 Hausner’s Ratio
The Hausner’s ratio is a number that is correlated to the flowability of a powder or
granular material.
Hausner’s Ratio = TD / BD ……………. (6)
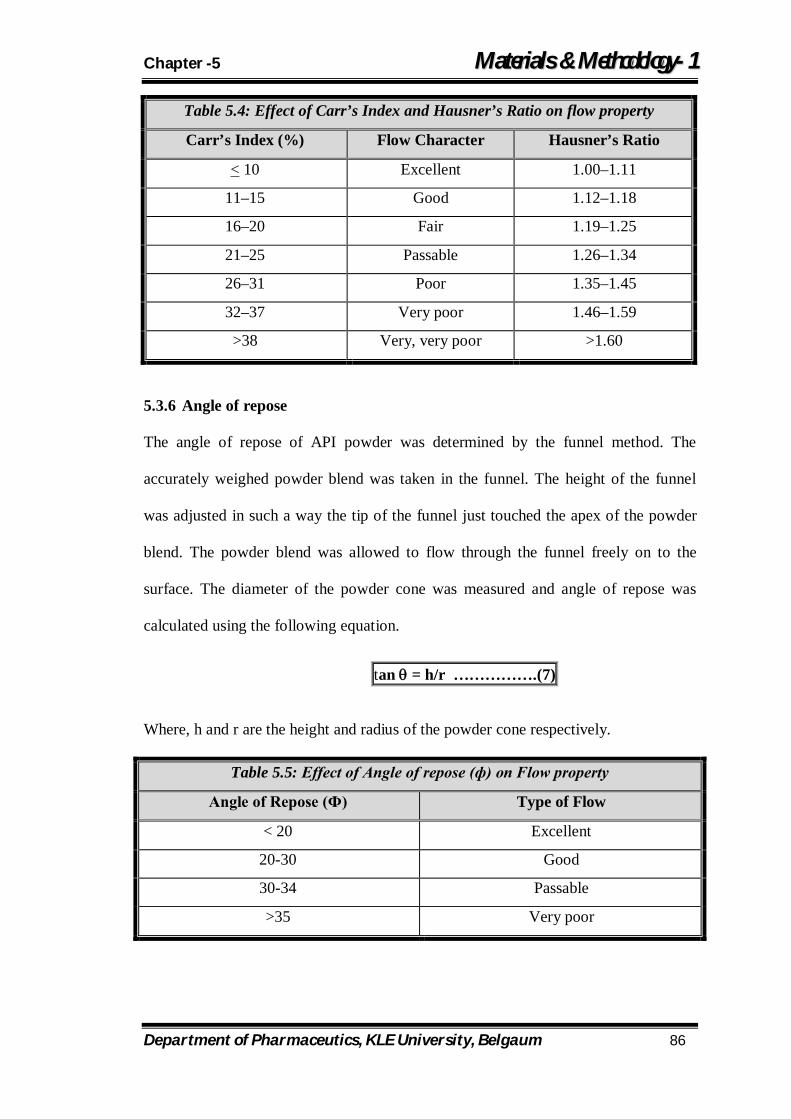
Chapter -5 MMaatteerriiaallss && MMeetthhooddoollooggyy--11
Department of Pharmaceutics, KLE University, Belgaum 86
Table 5.4: Effect of Carr’s Index and Hausner’s Ratio on flow property
Carr’s Index (%) Flow Character Hausner’s Ratio
< 10 Excellent 1.00–1.11
11–15 Good 1.12–1.18
16–20 Fair 1.19–1.25
21–25 Passable 1.26–1.34
26–31 Poor 1.35–1.45
32–37 Very poor 1.46–1.59
>38 Very, very poor >1.60
5.3.6 Angle of repose
The angle of repose of API powder was determined by the funnel method. The
accurately weighed powder blend was taken in the funnel. The height of the funnel
was adjusted in such a way the tip of the funnel just touched the apex of the powder
blend. The powder blend was allowed to flow through the funnel freely on to the
surface. The diameter of the powder cone was measured and angle of repose was
calculated using the following equation.
tan = h/r …………….(7)
Where, h and r are the height and radius of the powder cone respectively.
Table 5.5: Effect of Angle of repose (ф) on Flow property
Angle of Repose (Ф) Type of Flow
< 20 Excellent
20-30 Good
30-34 Passable
>35 Very poor
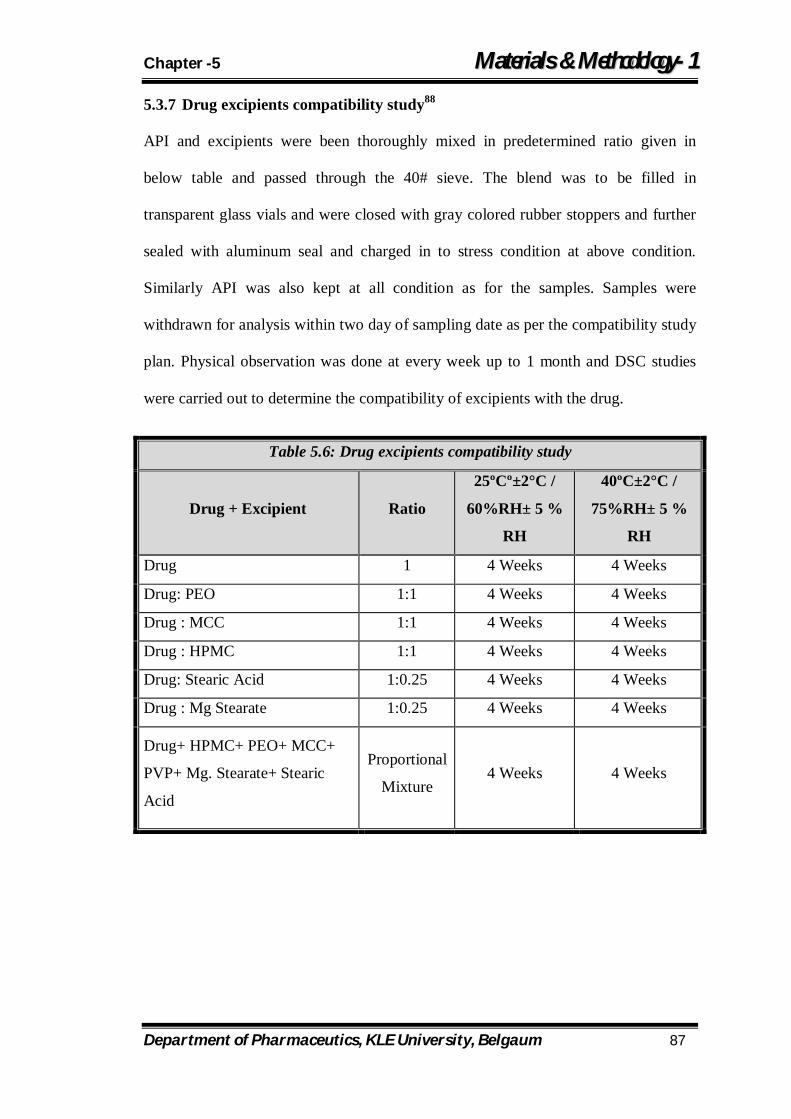
Chapter -5 MMaatteerriiaallss && MMeetthhooddoollooggyy--11
Department of Pharmaceutics, KLE University, Belgaum 87
5.3.7 Drug excipients compatibility study88
API and excipients were been thoroughly mixed in predetermined ratio given in
below table and passed through the 40# sieve. The blend was to be filled in
transparent glass vials and were closed with gray colored rubber stoppers and further
sealed with aluminum seal and charged in to stress condition at above condition.
Similarly API was also kept at all condition as for the samples. Samples were
withdrawn for analysis within two day of sampling date as per the compatibility study
plan. Physical observation was done at every week up to 1 month and DSC studies
were carried out to determine the compatibility of excipients with the drug.
Table 5.6: Drug excipients compatibility study
Drug + Excipient Ratio
25ºCº±2°C /
60%RH± 5 %
RH
40ºC±2°C /
75%RH± 5 %
RH
Drug 1 4 Weeks 4 Weeks
Drug: PEO 1:1 4 Weeks 4 Weeks
Drug : MCC 1:1 4 Weeks 4 Weeks
Drug : HPMC 1:1 4 Weeks 4 Weeks
Drug: Stearic Acid 1:0.25 4 Weeks 4 Weeks
Drug : Mg Stearate 1:0.25 4 Weeks 4 Weeks
Drug+ HPMC+ PEO+ MCC+
PVP+ Mg. Stearate+ Stearic
Acid
Proportional
Mixture 4 Weeks 4 Weeks
Chapter -5 MMaatteerriiaallss && MMeetthhooddoollooggyy--11
Department of Pharmaceutics, KLE University, Belgaum 88
5.4 Analytical Method Development Calibration curve of Drug:
Calibration curve for Drug was taken in 0.1 N HCl and Phosphate buffer (pH 6.8)
Preparation of Reagents:
(i) 0.1 N Hydrochloric acid (pH = 1.2):89
8.5 ml of concentrated Hydrochloric acid was taken and added to 1000 ml of
water and measured the pH of solution.
(ii) 6.8 pH Phosphate buffer solution:
Weighed 27.22g of monobasic potassium phosphate and diluted up to 1000 ml
to get stock solution of monobasic potassium phosphate. Weighed 8g Sodium
hydroxide and diluted up to 1000ml to get 0.2M sodium hydroxide solution.
Then 50 ml of the monobasic potassium phosphate solution was taken from
stock solution in a 200-mL volumetric flask, 22.4 ml of sodium hydroxide
solution was added from stock solution of 0.2M sodium hydroxide solution,
and then water was added to make final volume.
(iii)Standard (Stock) solution:
Drug (10 mg) was dissolved in a 100 ml of buffer solution to obtain 100g/ml
stock solution. 0.3 ml of stock solution was diluted to 10 ml with buffer
solution to get 3g/ml solution. Then 0.6, 0.9, 1.2, 1.5, 1.8 ml solution was
taken from stock solution and diluted with buffer solution to get 6, 9, 12, 15,
18 g/ml concentration solution. Absorbance of each solution was measured at
275 nm using Shimadzu UV-1700 UV/Vis double beam spectrophotometer
and Dissolution Medium as reference standard. The standard curve was
generated for the entire range from 3 to18 mcg/ml.
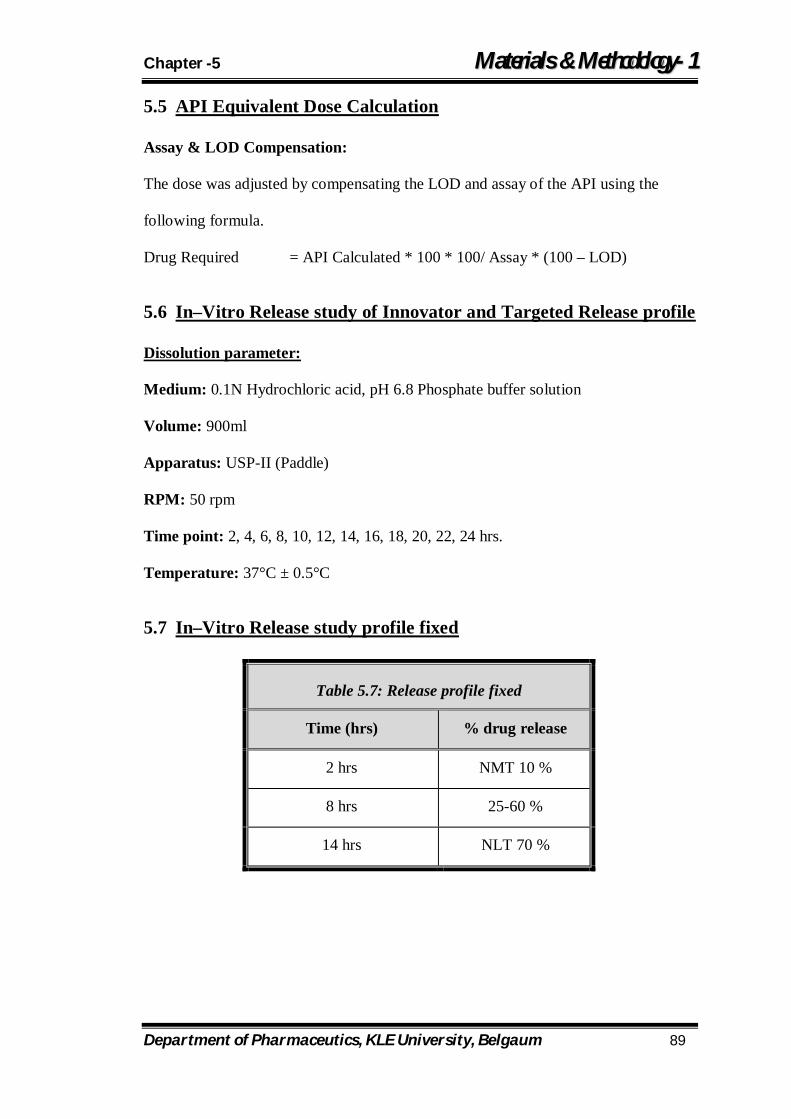
Chapter -5 MMaatteerriiaallss && MMeetthhooddoollooggyy--11
Department of Pharmaceutics, KLE University, Belgaum 89
5.5 API Equivalent Dose Calculation
Assay & LOD Compensation:
The dose was adjusted by compensating the LOD and assay of the API using the
following formula.
Drug Required = API Calculated * 100 * 100/ Assay * (100 – LOD)
5.6 In–Vitro Release study of Innovator and Targeted Release profile
Dissolution parameter:
Medium: 0.1N Hydrochloric acid, pH 6.8 Phosphate buffer solution
Volume: 900ml
Apparatus: USP-II (Paddle)
RPM: 50 rpm
Time point: 2, 4, 6, 8, 10, 12, 14, 16, 18, 20, 22, 24 hrs.
Temperature: 37°C ± 0.5°C
5.7 In–Vitro Release study profile fixed
Table 5.7: Release profile fixed
Time (hrs) % drug release
2 hrs NMT 10 %
8 hrs 25-60 %
14 hrs NLT 70 %
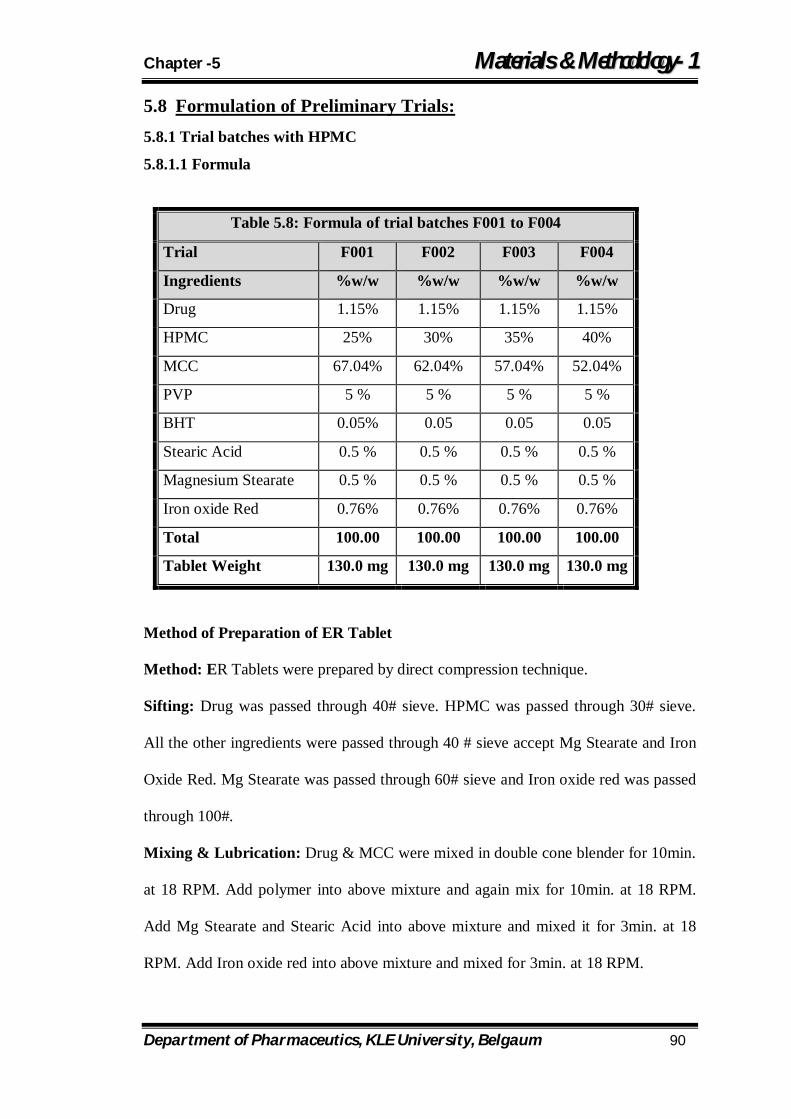
Chapter -5 MMaatteerriiaallss && MMeetthhooddoollooggyy--11
Department of Pharmaceutics, KLE University, Belgaum 90
5.8 Formulation of Preliminary Trials: 5.8.1 Trial batches with HPMC
5.8.1.1 Formula
Method of Preparation of ER Tablet
Method: ER Tablets were prepared by direct compression technique.
Sifting: Drug was passed through 40# sieve. HPMC was passed through 30# sieve.
All the other ingredients were passed through 40 # sieve accept Mg Stearate and Iron
Oxide Red. Mg Stearate was passed through 60# sieve and Iron oxide red was passed
through 100#.
Mixing & Lubrication: Drug & MCC were mixed in double cone blender for 10min.
at 18 RPM. Add polymer into above mixture and again mix for 10min. at 18 RPM.
Add Mg Stearate and Stearic Acid into above mixture and mixed it for 3min. at 18
RPM. Add Iron oxide red into above mixture and mixed for 3min. at 18 RPM.
Table 5.8: Formula of trial batches F001 to F004
Trial F001 F002 F003 F004
Ingredients %w/w %w/w %w/w %w/w
Drug 1.15% 1.15% 1.15% 1.15%
HPMC 25% 30% 35% 40%
MCC 67.04% 62.04% 57.04% 52.04%
PVP 5 % 5 % 5 % 5 %
BHT 0.05% 0.05 0.05 0.05
Stearic Acid 0.5 % 0.5 % 0.5 % 0.5 %
Magnesium Stearate 0.5 % 0.5 % 0.5 % 0.5 %
Iron oxide Red 0.76% 0.76% 0.76% 0.76%
Total 100.00 100.00 100.00 100.00
Tablet Weight 130.0 mg 130.0 mg 130.0 mg 130.0 mg
Chapter -5 MMaatteerriiaallss && MMeetthhooddoollooggyy--11
Department of Pharmaceutics, KLE University, Belgaum 91
Compression: The prepared blend was compressed (8/32 diameter (6.35mm), flat
punches) using 8 station tablet compression machine (Cadmach, Ahmedabad, India).
Evaluation of Powder blend89
1. Blend Uniformity:
An accurately weighed amount of powdered drug blend (150 mg) was extracted with
0.1N HCl and the solution was filtered through 0.45-µ membrane. The absorbance
was measured at 275 nm after suitable dilution.
Other Evaluation parameters of powder blend were done as per the section 5.3.
Evaluation of Tablets
1. Appearance
Twenty tablets of each formulation were taken to check any discoloration or surface
ruffness in the tablet formulation.
2. Weight variation test
To study weight variation twenty tablets of the formulation were weighed using a
Mettler Toledo electronic balance and the test was performed according to the official
method.
3. Hardness
The hardness of five tablets was determined using the Benchsavertm Series type
hardness tester and the average values were calculated.
4. Thickness
The Thickness of the tablets was determined by using Digital vernier calipers. Five
tablets were used, and average values were calculated.
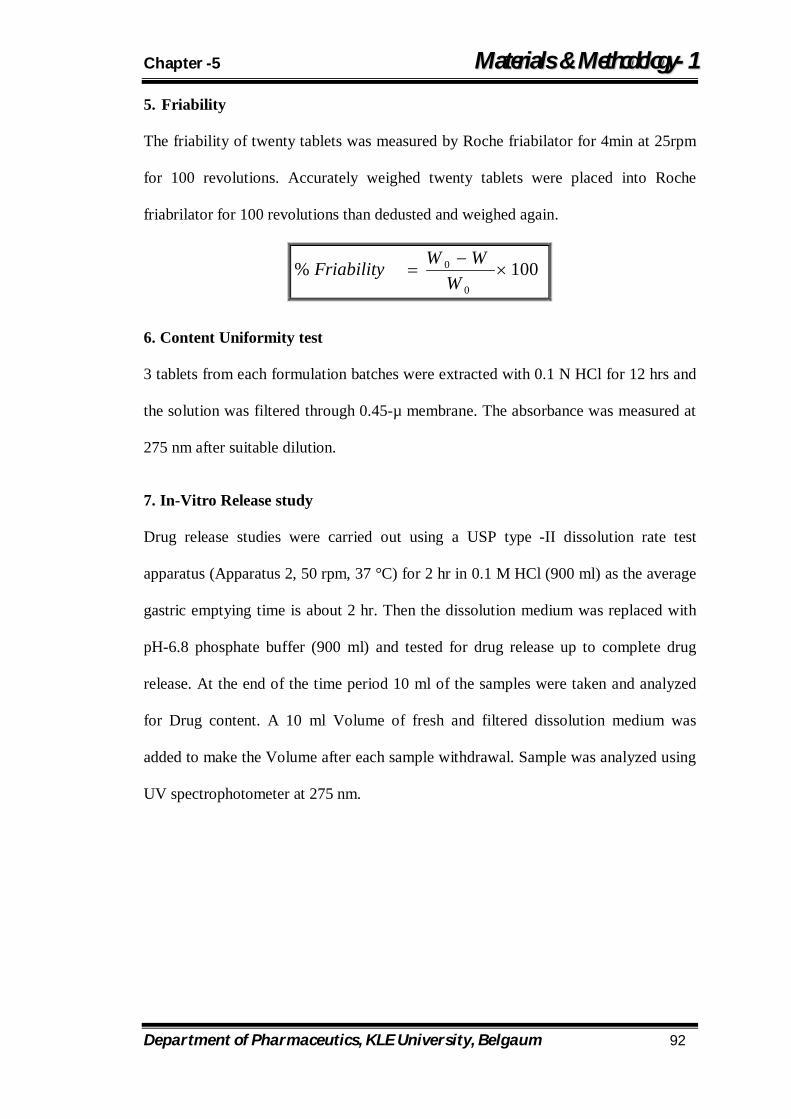
Chapter -5 MMaatteerriiaallss && MMeetthhooddoollooggyy--11
Department of Pharmaceutics, KLE University, Belgaum 92
5. Friability
The friability of twenty tablets was measured by Roche friabilator for 4min at 25rpm
for 100 revolutions. Accurately weighed twenty tablets were placed into Roche
friabrilator for 100 revolutions than dedusted and weighed again.
100%0
0
W
WWFriability
6. Content Uniformity test
3 tablets from each formulation batches were extracted with 0.1 N HCl for 12 hrs and
the solution was filtered through 0.45-µ membrane. The absorbance was measured at
275 nm after suitable dilution.
7. In-Vitro Release study
Drug release studies were carried out using a USP type -II dissolution rate test
apparatus (Apparatus 2, 50 rpm, 37 °C) for 2 hr in 0.1 M HCl (900 ml) as the average
gastric emptying time is about 2 hr. Then the dissolution medium was replaced with
pH-6.8 phosphate buffer (900 ml) and tested for drug release up to complete drug
release. At the end of the time period 10 ml of the samples were taken and analyzed
for Drug content. A 10 ml Volume of fresh and filtered dissolution medium was
added to make the Volume after each sample withdrawal. Sample was analyzed using
UV spectrophotometer at 275 nm.
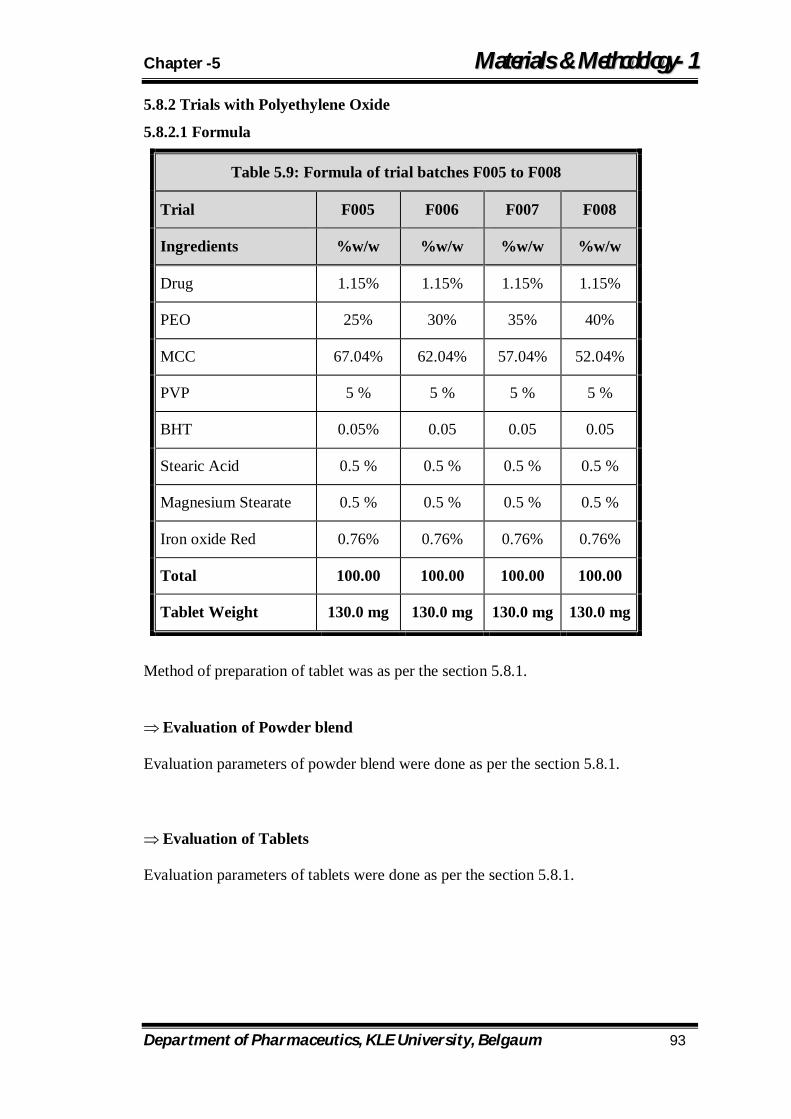
Chapter -5 MMaatteerriiaallss && MMeetthhooddoollooggyy--11
Department of Pharmaceutics, KLE University, Belgaum 93
5.8.2 Trials with Polyethylene Oxide
5.8.2.1 Formula
Method of preparation of tablet was as per the section 5.8.1.
Evaluation of Powder blend
Evaluation parameters of powder blend were done as per the section 5.8.1.
Evaluation of Tablets
Evaluation parameters of tablets were done as per the section 5.8.1.
Table 5.9: Formula of trial batches F005 to F008
Trial F005 F006 F007 F008
Ingredients %w/w %w/w %w/w %w/w
Drug 1.15% 1.15% 1.15% 1.15%
PEO 25% 30% 35% 40%
MCC 67.04% 62.04% 57.04% 52.04%
PVP 5 % 5 % 5 % 5 %
BHT 0.05% 0.05 0.05 0.05
Stearic Acid 0.5 % 0.5 % 0.5 % 0.5 %
Magnesium Stearate 0.5 % 0.5 % 0.5 % 0.5 %
Iron oxide Red 0.76% 0.76% 0.76% 0.76%
Total 100.00 100.00 100.00 100.00
Tablet Weight 130.0 mg 130.0 mg 130.0 mg 130.0 mg
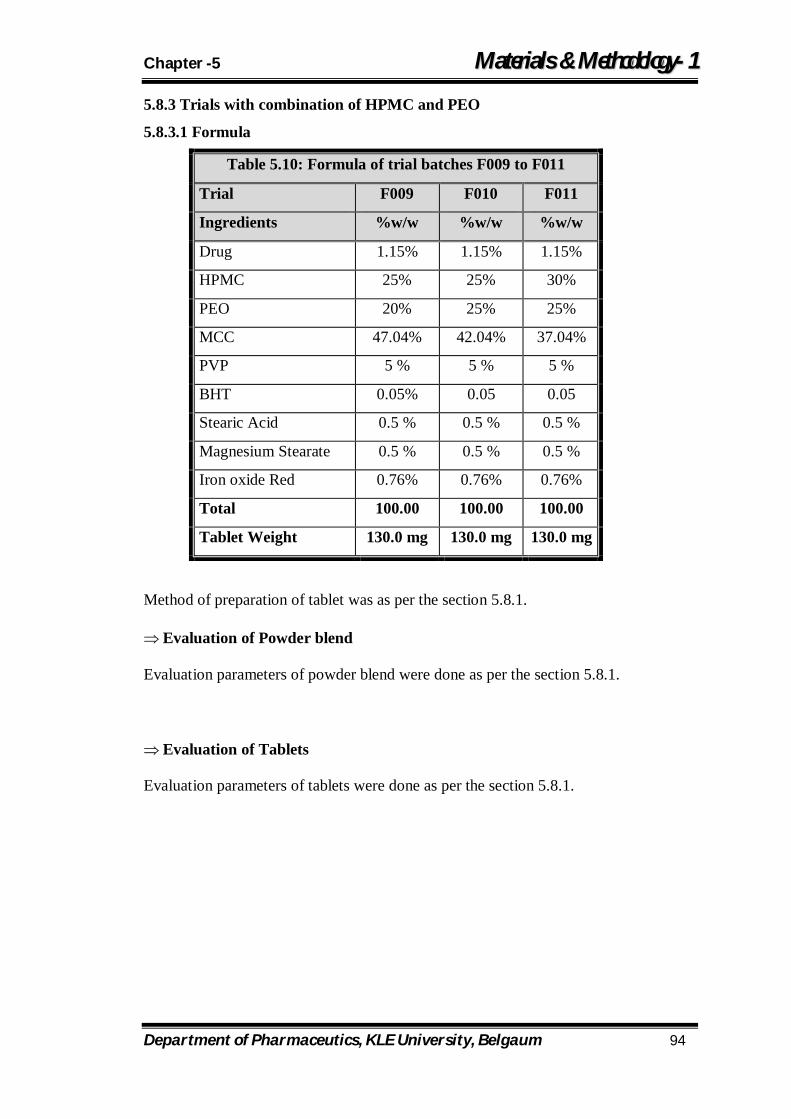
Chapter -5 MMaatteerriiaallss && MMeetthhooddoollooggyy--11
Department of Pharmaceutics, KLE University, Belgaum 94
5.8.3 Trials with combination of HPMC and PEO
5.8.3.1 Formula
Method of preparation of tablet was as per the section 5.8.1.
Evaluation of Powder blend
Evaluation parameters of powder blend were done as per the section 5.8.1.
Evaluation of Tablets
Evaluation parameters of tablets were done as per the section 5.8.1.
Table 5.10: Formula of trial batches F009 to F011
Trial F009 F010 F011
Ingredients %w/w %w/w %w/w
Drug 1.15% 1.15% 1.15%
HPMC 25% 25% 30%
PEO 20% 25% 25%
MCC 47.04% 42.04% 37.04%
PVP 5 % 5 % 5 %
BHT 0.05% 0.05 0.05
Stearic Acid 0.5 % 0.5 % 0.5 %
Magnesium Stearate 0.5 % 0.5 % 0.5 %
Iron oxide Red 0.76% 0.76% 0.76%
Total 100.00 100.00 100.00
Tablet Weight 130.0 mg 130.0 mg 130.0 mg
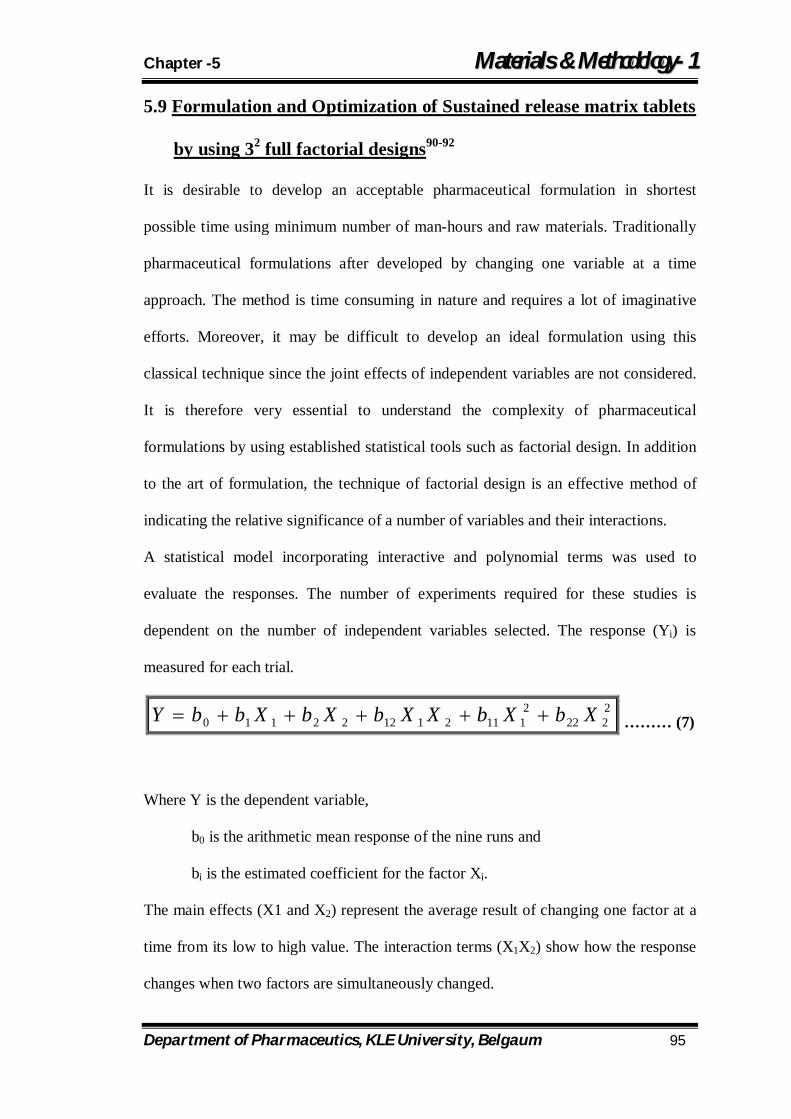
Chapter -5 MMaatteerriiaallss && MMeetthhooddoollooggyy--11
Department of Pharmaceutics, KLE University, Belgaum 95
5.9 Formulation and Optimization of Sustained release matrix tablets
by using 32 full factorial designs90-92
It is desirable to develop an acceptable pharmaceutical formulation in shortest
possible time using minimum number of man-hours and raw materials. Traditionally
pharmaceutical formulations after developed by changing one variable at a time
approach. The method is time consuming in nature and requires a lot of imaginative
efforts. Moreover, it may be difficult to develop an ideal formulation using this
classical technique since the joint effects of independent variables are not considered.
It is therefore very essential to understand the complexity of pharmaceutical
formulations by using established statistical tools such as factorial design. In addition
to the art of formulation, the technique of factorial design is an effective method of
indicating the relative significance of a number of variables and their interactions.
A statistical model incorporating interactive and polynomial terms was used to
evaluate the responses. The number of experiments required for these studies is
dependent on the number of independent variables selected. The response (Yi) is
measured for each trial.
2222
2111211222110 XbXbXXbXbXbbY ……… (7)
Where Y is the dependent variable,
b0 is the arithmetic mean response of the nine runs and
bi is the estimated coefficient for the factor Xi.
The main effects (X1 and X2) represent the average result of changing one factor at a
time from its low to high value. The interaction terms (X1X2) show how the response
changes when two factors are simultaneously changed.
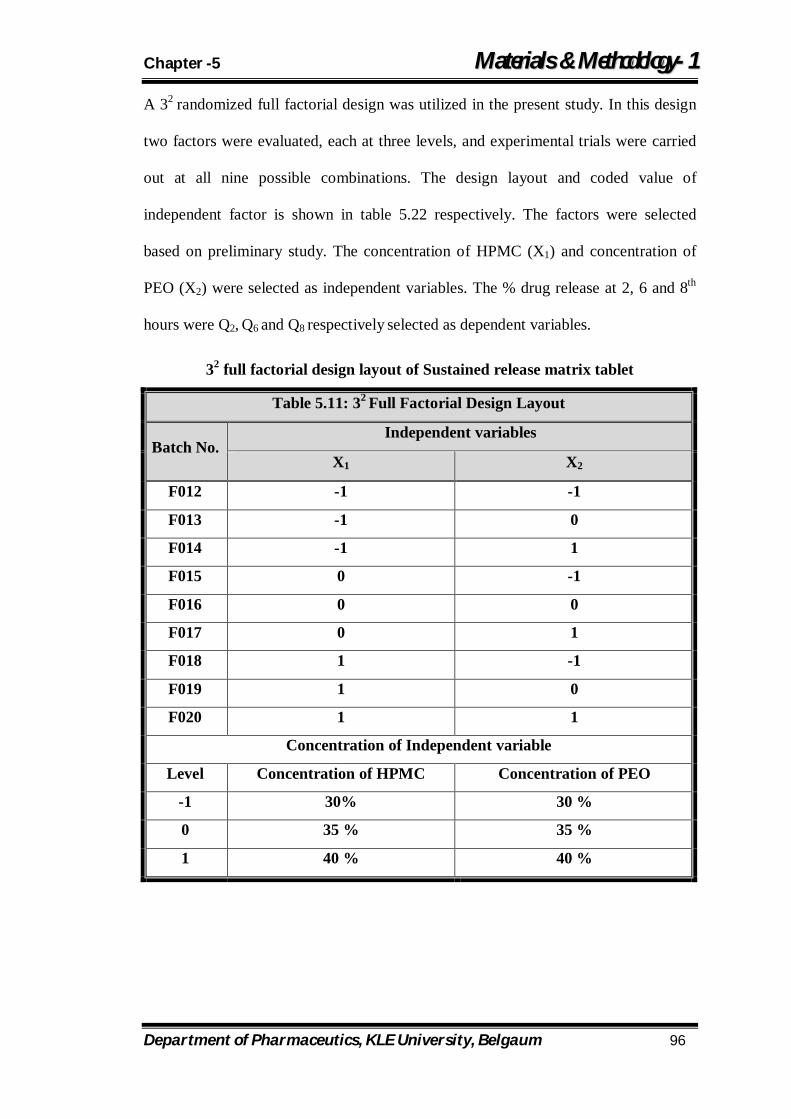
Chapter -5 MMaatteerriiaallss && MMeetthhooddoollooggyy--11
Department of Pharmaceutics, KLE University, Belgaum 96
A 32 randomized full factorial design was utilized in the present study. In this design
two factors were evaluated, each at three levels, and experimental trials were carried
out at all nine possible combinations. The design layout and coded value of
independent factor is shown in table 5.22 respectively. The factors were selected
based on preliminary study. The concentration of HPMC (X1) and concentration of
PEO (X2) were selected as independent variables. The % drug release at 2, 6 and 8th
hours were Q2, Q6 and Q8 respectively selected as dependent variables.
32 full factorial design layout of Sustained release matrix tablet
Table 5.11: 32 Full Factorial Design Layout
Batch No. Independent variables
X1 X2
F012 -1 -1
F013 -1 0
F014 -1 1
F015 0 -1
F016 0 0
F017 0 1
F018 1 -1
F019 1 0
F020 1 1
Concentration of Independent variable
Level Concentration of HPMC Concentration of PEO
-1 30% 30 %
0 35 % 35 %
1 40 % 40 %
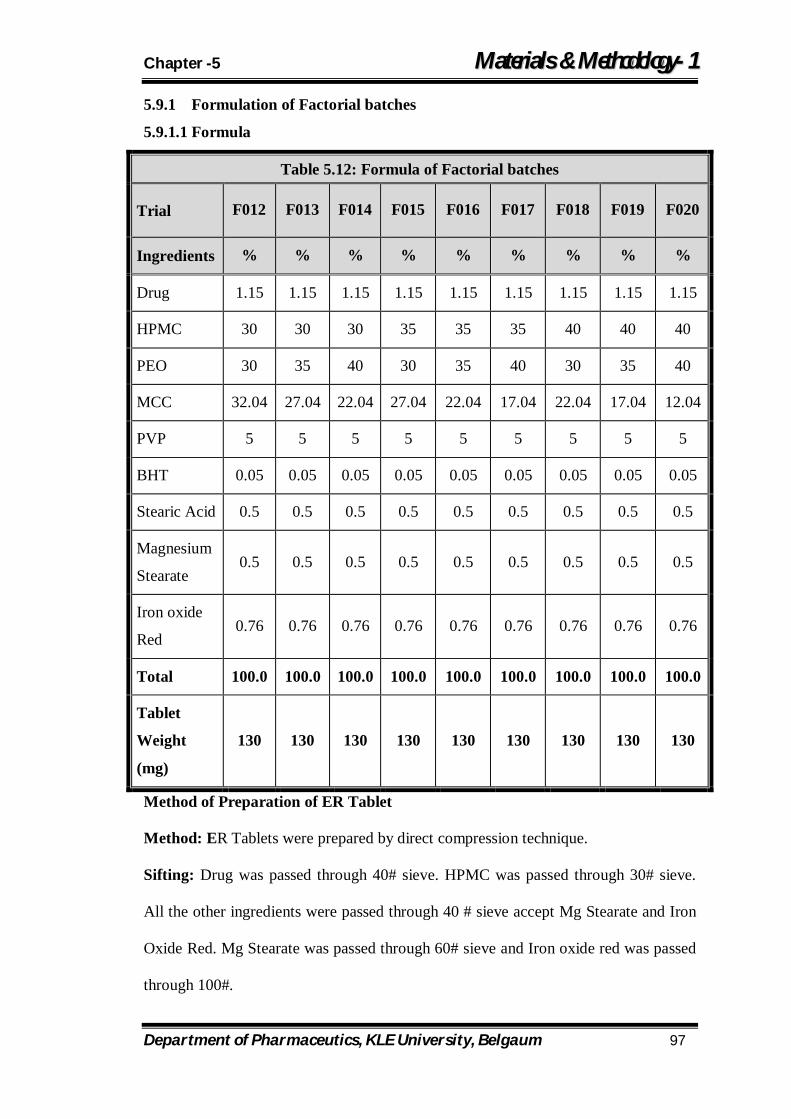
Chapter -5 MMaatteerriiaallss && MMeetthhooddoollooggyy--11
Department of Pharmaceutics, KLE University, Belgaum 97
5.9.1 Formulation of Factorial batches
5.9.1.1 Formula
Table 5.12: Formula of Factorial batches
Trial F012 F013 F014 F015 F016 F017 F018 F019 F020
Ingredients % % % % % % % % %
Drug 1.15 1.15 1.15 1.15 1.15 1.15 1.15 1.15 1.15
HPMC 30 30 30 35 35 35 40 40 40
PEO 30 35 40 30 35 40 30 35 40
MCC 32.04 27.04 22.04 27.04 22.04 17.04 22.04 17.04 12.04
PVP 5 5 5 5 5 5 5 5 5
BHT 0.05 0.05 0.05 0.05 0.05 0.05 0.05 0.05 0.05
Stearic Acid 0.5 0.5 0.5 0.5 0.5 0.5 0.5 0.5 0.5
Magnesium
Stearate 0.5 0.5 0.5 0.5 0.5 0.5 0.5 0.5 0.5
Iron oxide
Red 0.76 0.76 0.76 0.76 0.76 0.76 0.76 0.76 0.76
Total 100.0 100.0 100.0 100.0 100.0 100.0 100.0 100.0 100.0
Tablet
Weight
(mg)
130 130 130 130 130 130 130 130 130
Method of Preparation of ER Tablet
Method: ER Tablets were prepared by direct compression technique.
Sifting: Drug was passed through 40# sieve. HPMC was passed through 30# sieve.
All the other ingredients were passed through 40 # sieve accept Mg Stearate and Iron
Oxide Red. Mg Stearate was passed through 60# sieve and Iron oxide red was passed
through 100#.
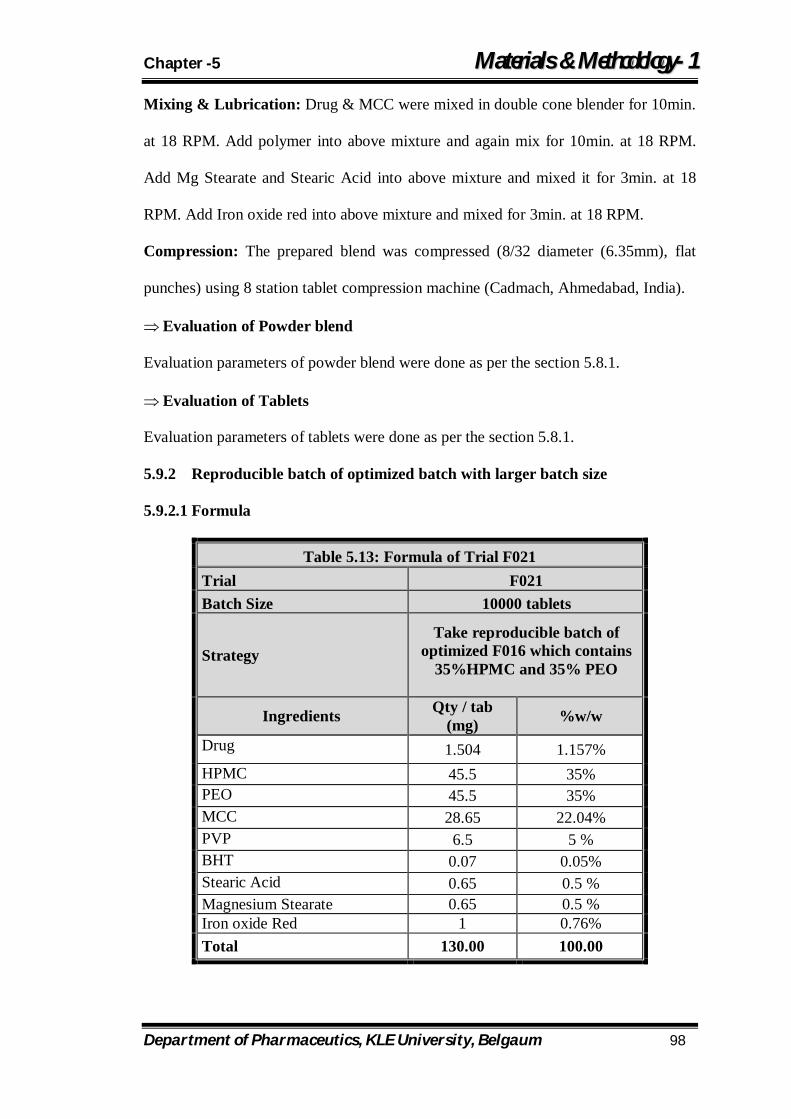
Chapter -5 MMaatteerriiaallss && MMeetthhooddoollooggyy--11
Department of Pharmaceutics, KLE University, Belgaum 98
Mixing & Lubrication: Drug & MCC were mixed in double cone blender for 10min.
at 18 RPM. Add polymer into above mixture and again mix for 10min. at 18 RPM.
Add Mg Stearate and Stearic Acid into above mixture and mixed it for 3min. at 18
RPM. Add Iron oxide red into above mixture and mixed for 3min. at 18 RPM.
Compression: The prepared blend was compressed (8/32 diameter (6.35mm), flat
punches) using 8 station tablet compression machine (Cadmach, Ahmedabad, India).
Evaluation of Powder blend
Evaluation parameters of powder blend were done as per the section 5.8.1.
Evaluation of Tablets
Evaluation parameters of tablets were done as per the section 5.8.1.
5.9.2 Reproducible batch of optimized batch with larger batch size
5.9.2.1 Formula
Table 5.13: Formula of Trial F021 Trial F021 Batch Size 10000 tablets
Strategy Take reproducible batch of
optimized F016 which contains 35%HPMC and 35% PEO
Ingredients Qty / tab (mg) %w/w
Drug 1.504 1.157% HPMC 45.5 35% PEO 45.5 35% MCC 28.65 22.04% PVP 6.5 5 % BHT 0.07 0.05% Stearic Acid 0.65 0.5 % Magnesium Stearate 0.65 0.5 % Iron oxide Red 1 0.76% Total 130.00 100.00
Chapter -5 MMaatteerriiaallss && MMeetthhooddoollooggyy--11
Department of Pharmaceutics, KLE University, Belgaum 99
Method of Preparation of ER Matrix tablet
Method: ER Tablets were prepared by direct compression technique.
Sifting: Drug was passed through 40# sieve. HPMC was passed through 30# sieve.
All the other ingredients were passed through 40 # sieve accept Mg Stearate and Iron
Oxide Red. Mg Stearate was passed through 60# sieve and Iron oxide red was passed
through 100#.
Mixing & Lubrication: Drug & MCC were mixed in double cone blender for 10min.
at 18 RPM. Add polymer into above mixture and again mix for 10min. at 18 RPM.
Add Mg Stearate and Stearic Acid into above mixture and mixed it for 3min. at 18
RPM. Add Iron oxide red into above mixture and mixed for 3min. at 18 RPM.
Compression: The prepared blend was compressed (8/32 diameter (6.35mm), flat
punches) using 8 station tablet compression machine (Cadmach, Ahmedabad, India).
Evaluation of Powder blend
Evaluation parameters of powder blend were done as per the section 5.8.1.
Evaluation of Tablets
Evaluation parameters of tablets were done as per the section 5.8.1.
Chapter -5 MMaatteerriiaallss && MMeetthhooddoollooggyy--11
Department of Pharmaceutics, KLE University, Belgaum 100
5.10 Drug release kinetic analysis by using different release model
of Extended release matrix tablet93-94
To know the mechanism of drug release from these formulations, the data were
treated according to first-order, zero order, Higuchis’s, Korsmeyer and Hixon-
Crowell’s model.
Chapter -6 RReessuullttss && DDiissccuussssiioonn--11
Department of Pharmaceutics, KLE University, Belgaum 101
6.1 Preformulation Studies 6.1.1 Solubility:
Freely soluble in water, 0.1N HCl and pH 4.5 Acetate buffer.
Freely Soluble in methanol.
Soluble in pH 6.8 Acetate buffer.
6.1.2 Other preformulational parameters:
The preformulational parameters of pure drug such as Angle of repose, Loose bulk
density, Tapped bulk density, Carr’s compressibility index and Hausner’s Ratio of
pure drug are shown in Table 6.1. From the Results of Preformulation studies of the
API, It was concluded that drug has poor flow property and compressibility property.
So, to improve the flow and compressibility property, it was beneficial to use the
directly compressible grade components in the formulation of tablet.
6.1.3 Drug excipients compatibility study
Compatibility studies of pure drug with polymers and other excipients were carried
out prior to the preparation of tablets. DSC spectra of pure drug, and that of with
polymers and other ingredients were obtained, which are shown in Figure 6.1 to 6.7.
The results of DSC study shown that there is no change in drug’s melting peak after
the preparation of tablet. So we can conclude that drug and other excipients are
compatible which each other. It shows that there was no significant change in the
chemical integrity of the drug. The results of compatibility study are shown in Table
6.2.

Chapter -6 RReessuullttss && DDiissccuussssiioonn--11
Department of Pharmaceutics, KLE University, Belgaum 102
6.2 Analytical Method Development
Table 6.3 shows the absorption reading of standard drug solution containing 3 –
18µg/ml of drug in pH 1.2 at the maximum wavelength of 275 nm.
Figure 6.8 shows the standard calibration curve for pure drug in pH 1.2 with slope,
intercept and regression co-efficient. The calculations of drug contents and in-vitro
drug release study are based on this standard curve.
Table 6.4 shows the absorption reading of standard drug solution containing 3 –
18µg/ml of drug in pH 6.8 phosphate buffer at the maximum wavelength of 275 nm.
Figure 6.9 shows the standard calibration curve for pure drug in pH 6.8 phosphate
buffer with slope, intercept and regression co-efficient. The calculations of drug
contents and in-vitro drug release study are based on this standard curve.
6.3 API Equivalent Dose Calculation
Drug Required = API Calculated * 100 * 100/ Assay * (100 – LOD)
= 1.50 * 100 * 100/ 99.9 * 99.87
= 1.504 mg
6.4 In–Vitro Release study of Innovator
The Innovator’s tablets were subjected for in vitro dissolution studies using
dissolution test apparatus USP XXIII. The dissolution medium used was pH 1.2 for
initial 2 hrs as average gastric emptying time of stomach is 2 hrs and rest was carried
out in pH 6.8 phosphate buffer solution to study the release of drug. The samples were
withdrawn at different intervals of time and analyzed at 275nm using UV
Spectrophotometer. Cumulative percentage drug release was calculated on the basis
of average amount of drug present in the dissolution chamber. The results obtained in
Chapter -6 RReessuullttss && DDiissccuussssiioonn--11
Department of Pharmaceutics, KLE University, Belgaum 103
the in-vitro drug release study are tabulated in Table 6.5. The cumulative percentage
of drug released as a function of time for all the formulations are shown in Figure
6.10. From the in-vitro drug release profile data of Innovator’s product, three time
points were fixed for the generic product’s dissolution to match the release profile
with Innovator.
6.5 Formulation of Preliminary Trials
6.5.1 Trials with HPMC:
Evaluation of Powder blend
Bulk density and tapped density
Loose bulk density (LBD) and tapped bulk density (TBD) of the powder blends of all
the batches are shown in Table 6.6. The loose bulk density and tapped bulk density of
all the batches were varied from 0.431 to 0.468 gm/cm3 and 0.504 to 0.534 gm/cm3.
Carr’s consolidation index
The results of Carr’s consolidation index or compressibility index of all the trial
batches with HPMC ranged from 11.83% to 15.28%. Results of Carr’s consolidation
index are shown in Table 6.6. Results clearly showed that flowability of all the
batches is good and also the blend has good compressibility as per the Table 5.4.
Hausner’s Ratio
The Hausner’s ratio of all the batches prepared with HPMC ranged from 1.13 to 1.18.
Results are tabulated in Table 6.6. The results obtained indicated that all the powder
blends had good flow property.
Chapter -6 RReessuullttss && DDiissccuussssiioonn--11
Department of Pharmaceutics, KLE University, Belgaum 104
Angle of repose
The data obtained for angle of repose for all the batches prepared by using HPMC are
tabulated in Table 6.6. The values were found to be in the range of 23.31 to 25.14. All
the formulations showed the Carr’s consolidation index between 14 to 20 and angle of
repose less than 30 which reveals good to fair inherent flow property of the powder
blend.
Blend Uniformity
The results of blend uniformity of all the powder blends were found to be ranging
from 98.32% to 99.21%. The results are tabulated in Table 6.6. The results showed
that the drug was uniformly mixed and distributed throughout the powder blend in all
the formulation powder blends.
Evaluation of Tablets
Appearance
Formulations prepared were randomly picked from each batch examined under lens
for shape and in presence of light for color. Tablets showed standard concave surfaces
with circular shape. Tablets were red in color.
Weight variation test
The weight variation for all the formulations is shown in Table 6.7. All the tablets
passed the weight variation test, i.e., average percentage weight variation was found
within the pharmacopoeial limits of ±7.5%.
Hardness
Hardness or crushing strength of the tablets of all the batches was found to be ranging
from 6.5 to 8.0 kP. The mean hardness test results are tabulated in Table 6.7. The low
standard deviation values indicated that the hardness of all the formulations was
Chapter -6 RReessuullttss && DDiissccuussssiioonn--11
Department of Pharmaceutics, KLE University, Belgaum 105
almost uniform and the tablets possess good mechanical strength with sufficient
hardness.
Thickness
The results of thickness for tablets are shown in Table 6.7. The mean thickness of
tablets (n=3) prepared using HPMC polymer was found be ranging from 3.45 – 3.51
mm.
Friability
Friability values of all the batches were in the range of 0.048 % to 0.062 %. The
obtained results were found to be well within the approved range (<1%) in all the
designed formulations. That indicated tablets possess good mechanical strength.
Friability results of all the batches are tabulated in Table 6.7.
Content Uniformity test
Drug content uniformity was performed for all the formulations. Three replicates of
each test were carried out and the average value of all the formulations was
calculated. Drug content uniformity in the formulations was found to be 99.7% to
102.3%. The results are tabulated in Table 6.7.
In-Vitro Release study
All the formulations prepared were subjected for in vitro dissolution studies using
dissolution test apparatus USP XXIII. The results of in-vitro dissolution study of trial
batches F001 to F004 which was taken using single polymer HPMC is shown in the
Table 6.8 and comparative dissolution profile was shown in Figure. 6.11. The results
of in-vitro dissolution study of trial batches F001 and F002 which were taken with
HPMC showed the faster drug release as compared to the targeted drug release.
Formulation F001 and F002 failed to generate sustained release of drug upto 12 hr
Chapter -6 RReessuullttss && DDiissccuussssiioonn--11
Department of Pharmaceutics, KLE University, Belgaum 106
and drug was completely release at 8 hrs. So, to retard the drug release next trial
batches F003 and F004 were taken with higher percentage of HPMC (35%) and
HPMC (40%). As the percentage of polymer increased, the release of drug from tablet
was decreased. This may be due to structural reorganization of hydrophilic HPMC
polymer. Increase in concentration of HPMC may result in increase in the tortuosity
or gel strength of the polymer. Further study was carried out by increasing the
viscosity of HPMC. In the present study, HPMC was used as a hydrophilic matrixing
agent because it forms a strong viscous gel on contact with aqueous media, which
may be useful in controlled delivery of highly water-soluble drugs.
From the above result, it was concluded that by using single polymer like HPMC,
release profile was not desirable. So, further study was planned by using some release
retardant polymer like Polyethylene Oxide in different concentration.
Chapter -6 RReessuullttss && DDiissccuussssiioonn--11
Department of Pharmaceutics, KLE University, Belgaum 107
6.5.2 Trials with PEO
Evaluation of Powder blend
Bulk density and tapped density
Loose bulk density (LBD) and tapped bulk density (TBD) of the powder blends of all
the batches from F005 to F008 are shown in Table 6.9. The loose bulk density and
tapped bulk density of all the batches were varied from 0.419 to 0.489 gm/cm3 and
0.502 to 0.564 gm/cm3.
Carr’s consolidation index
The results of Carr’s consolidation index or compressibility index of all the trial
batches with PEO ranged from 12.59% to 16.80%. Results of Carr’s consolidation
index are shown in Table 6.9. Results clearly showed that flowability of all the
batches is good and also the blend has good compressibility as per the Table 5.4.
Hausner’s Ratio
The Hausner’s ratio of all the batches prepared with PEO ranged from 1.14 to 1.20.
Results are tabulated in Table 6.9. The results obtained indicated that all the powder
blends had good flow property.
Angle of repose
The data obtained for angle of repose for all the batches prepared by using HPMC are
tabulated in Table 6.9. The values were found to be in the range of 22.14 to 24.84. All
the formulations showed the Carr’s consolidation index between 14 to 20 and angle of
repose less than 30 which reveals good to fair inherent flow property of the powder
blend.
Chapter -6 RReessuullttss && DDiissccuussssiioonn--11
Department of Pharmaceutics, KLE University, Belgaum 108
Blend Uniformity
The results of blend uniformity of all the powder blends were found to be ranging
from 97.85% to 101.2%. The results are tabulated in Table 6.9. The results showed
that the drug was uniformly mixed and distributed throughout the powder blend in all
the formulation powder blends.
Evaluation of Tablets
Appearance
Formulations prepared were randomly picked from each batch examined under lens
for shape and in presence of light for color. Tablets showed standard concave surfaces
with circular shape. Tablets were red in color.
Weight variation test
The weight variation for all the formulations is shown in Table 6.10. All the tablets
passed the weight variation test, i.e., average percentage weight variation was found
within the pharmacopoeial limits of ±7.5%.
Hardness
Hardness or crushing strength of the tablets of all the batches was found to be ranging
from 6.5 to 8.0 kP. The mean hardness test results are tabulated in Table 6.10. The
low standard deviation values indicated that the hardness of all the formulations was
almost uniform and the tablets possess good mechanical strength with sufficient
hardness.
Thickness
The results of thickness for tablets are shown in Table 6.10. The mean thickness of
tablets (n=3) prepared using PEO polymer was found be ranging from 3.46 to 3.50
mm.
Chapter -6 RReessuullttss && DDiissccuussssiioonn--11
Department of Pharmaceutics, KLE University, Belgaum 109
Friability
Friability values of all the batches were in the range of 0.072 % to 0.084 %. The
obtained results were found to be well within the approved range (<1%) in all the
designed formulations. That indicated tablets possess good mechanical strength.
Friability results of all the batches are tabulated in Table 6.10.
Content Uniformity test
Drug content uniformity was performed for all the formulations. Three replicates of
each test were carried out and the average value of all the formulations was
calculated. Drug content uniformity in the formulations was found to be 98.4% to
99.6%. The results are tabulated in Table 6.10.
In-Vitro Release study
The results of in-vitro dissolution study of trial batches F005 to F008 which was taken
using single polymer PEO is shown in the Table 6.11 and comparative dissolution
profile was shown in Figure 6.12. In further formulation development process, trial
batches F005 and F006 were modified by incorporation of retarding polymer PEO
25% and 30% respectively and showed the faster drug release than targeted drug
release at all the time points and the drug was completely released from the matrix
within 12h. The tablets from F005 and F006 released 79.24% and 68.10% of the drug
at 2h, respectively (Figure 6.12). As the concentration of retarding polymer PEO
increases the drug release was decreased but not up to the desired mark. In addition 3
to 12h, the tablets slowly released the drug, and at the end of 12h the drug release was
99.97% and 99.89% from F006 and F007 respectively.
The trial batches F007 and F008 were taken using 35% and 40% of retarding
polymer. The in-vitro release study in formulation F007 showed the 66.93% drug
Chapter -6 RReessuullttss && DDiissccuussssiioonn--11
Department of Pharmaceutics, KLE University, Belgaum 110
release in 2h that is comparable with targeted release profile. Furthermore, from 3 to
12h the drug release was sustained from the tablets and 99.45% drug was released at
the end of 12h from the matrix. The F008 batch shown 55.54% drug release in initial
2h and 98.12 % drug was released at end of 12 hr.
The results with release retardant polymer PEO indicate that the formulations still
need modification to get desired release profile. Based on this study, it was proposed
to use the combination of both water soluble matrix forming polymer HPMC and
PEO in proper concentration.
Chapter -6 RReessuullttss && DDiissccuussssiioonn--11
Department of Pharmaceutics, KLE University, Belgaum 111
6.5.3 Trials with HPMC and PEO Evaluation of Powder blend
The powder blends of different formulations were evaluated for angle of repose, LBD,
TBD, compressibility index, and drug content and the results are shown in Table 6.12.
The results of angle of repose and compressibility index ranged from 21.58 to 23.39
and 13.19 to 14.89 respectively. The results of Hausner’s ratio and blend uniformity
ranged from1.15 to 1.18 and 97.85 to 99.87. The results of angle of repose (<30)
indicate good flow properties of the powder. The Carr’s index was also lower than 15
which also supported for good flow property.
Evaluation of Tablets
All the tablet formulations showed acceptable pharmacotechnical properties and
complied with the in-house specifications for weight variation, drug content (98.3 to
99.6%), hardness (6-8 kP), and friability (0.011 to 0.061%). Result of evaluation
parameters are shown in Table 6.13.
In-Vitro Release study
Trial batches formulated using combination of HPMC and PEO were evaluated for
dissolution study (Table 6.14). Trial F009 shown 56.97 % initial 2h release and at the
end of 12h 98.51 % drug was released. It is known that higher viscosity grade
polymer HPMC hydrates at faster rate and therefore, it is capable of forming gel
structure quick than a low viscosity grade PEO polymer. So, in further trials the
concentration of HPMC and PEO was varied to check the effect on drug release when
two polymers are used in combination. Trial F010 shown 46.33% initial drug release
at 2h, and at the end of 12h the drug release was 91.58%. In F010 batch prepared with
higher concentration of HPMC and PEO, it shown 47.29% initial release at 2h and at
Chapter -6 RReessuullttss && DDiissccuussssiioonn--11
Department of Pharmaceutics, KLE University, Belgaum 112
the end of 12h the drug release was found to be 89.97. Graphs are shown in Figure
6.13.
Hydrophilic matrix of HPMC and PEO in combination sustained the drug release
effectively for more than 12 hours. From the above result, it was concluded that the
combination of HPMC and PEO can be successfully utilized to create core tablet
formulation and then control the release further with polymeric functional coating. On
the basis of the preliminary trials in the present investigation a 32 full factorial design
was applied to study the effect of independent variables, i.e. concentration of HPMC
(X1) and concentration of PEO (X2) on dependent variables like %drug release Q2, Q6
and Q10.
Chapter -6 RReessuullttss && DDiissccuussssiioonn--11
Department of Pharmaceutics, KLE University, Belgaum 113
6.6 Formulation and Optimization of Extended release matrix
tablets by using 32 full factorial designs
Evaluation of Powder blend
Factorial batches taken by using 32 full factorial designs of Sustained release matrix
tablets (Table 5.12). The powder blends of different formulations were evaluated for
angle of repose, LBD, TBD, compressibility index, and drug content; the results of
which are shown in Table 6.15.
The results of angle of repose and compressibility index ranged from 19.80 to 25.10
and 11.39 to 15.22 respectively. The results of Hausner’s ratio and blend uniformity
ranged from 1.13 to 1.18 and 97.64 to 100.32%. The results of angle of repose (<30)
indicate good flow properties of the powder. It was further supported by lower
compressibility index value that was less than 15.5%.
Evaluation of Tablets
The tablet formulations were evaluated for different parameter like hardness,
friability, assay, weight variation (Table 6.16). Hardness of the prepared tablets was
found in range of 6-8 kP. All the tablet formulations showed acceptable
pharmacotechnical properties and complied with the in-house specifications for
weight variation, drug content, hardness, and friability. The size and surface area were
kept constant by adding required quantity of MCC as a diluent, as it is well known
fact that the drug release is also dependent on the size and surface area of matrix
tablets.
In-Vitro Release study
The drug release profiles were characterized by an initial burst effect Q2 i.e. initial 30-
35% drug release required in 2 hrs (Figure 6.14). The biphasic release is often
Chapter -6 RReessuullttss && DDiissccuussssiioonn--11
Department of Pharmaceutics, KLE University, Belgaum 114
observed from hydrophilic matrix systems. As the release rate limiting polymer like
HPMC changes from a glassy state to rubbery state, a gel structure is formed around
the tablet matrix, which considerably decreases the release rate of drug since the drug
has to diffuse through this gel barrier into bulk phase. The strength of the gel depends
on the chemical structure and molecular size of the polymer. It is known that higher
viscosity grade polymer hydrates at faster and therefore, it is capable of forming gel
structure quickly than a low viscosity grade polymer. The drug release is significantly
dependent on the proportion and type of the polymer used. PEO was responsible for
initial burst effect and HPMC was used to sustained drug release. Factorial batches
formulated using combination of HPMC and PEO were evaluated for dissolution
study (Table 6.17).
6.6.1 Effect of Independent variable on dependent variable by 32 full factorial
design of extended release matrix tablet
The factorial batches were prepared by using independent variable concentration of
HPMC (X1) and PEO (X2) and check its effect on dependent variable like Q2, Q6, and
Q10.
The values of dependent variables are shown in Table 6.18.
Factorial batches of sustained release matrix tablets were evaluated for the in-vitro
drug release and by regression analysis of it, the effect of the individual polymer and
combination of the polymers studied. The summary of regression analysis for
Sustained release matrix tablet shown in Table 6.19.
The result of regression analysis showed that all the co-efficient bear a different sign,
which indicate that both the polymers shows different effect on the release of drug.
Drug release at 2nd hr (Q2) gives correlation co-efficient 0.9585. The P value for
variable X1 and X2 were 0.0087 and 0.2594 respectively (P<0.05), it indicate that X1
Chapter -6 RReessuullttss && DDiissccuussssiioonn--11
Department of Pharmaceutics, KLE University, Belgaum 115
variable shown significant effect on drug release whereas X2 variable does not show
significant effect on drug release and combination co-efficient was positive but the P
value was not less than 0.05, which indicates that combination of independent
variable not showed significant effect at 2nd h release.
Q2 = 45.733 – 4.133X1 – 0.933X2 + 0.175X1X2 + 6.30X12 + 0.70X2
2 ……… (9)
Drug release at 6h (Q6) has less linearity compared to Q2 with correlation co-efficient
0.9113. The P value for variable X1 and X2 were 0.024 and 0.239 (P<0.05), it indicate
that variable X1 has significant effect on the drug release at 6h; whereas X2 fails to
show any significant effect even after 6h. and the combination co-efficient was
negative but the P value was not less than 0.05 so, we say that the combination of
independent variable was not give the significant effect at 6h release. The co-efficient
of X1 and X2 were negative indicate that when concentration of both the variable
increase than drug release was decrease.
Q6 = 65.644 – 5.45X1 – 1.833X2 – 0.05X1X2 + 7.316X12 + 0.416X2
2 …………. (10)
Drug release at 10h (Q10) has the P value for variable X1, X2 and X1X2 were 0.040,
0.24, 0.973 respectively, it indicate that variable X1 has significant effect; whereas
variable X2 does not show significant effect and also the combination of variable fails
to show significant effect on drug release at 10h. The co-efficient of X1 and X2 were
negative indicate that when concentration of both the variable increase than drug
release was decrease.
Q10 = 84.322 – 3.86X1 – 1.633X2 + 0.05X1X2 + 7.233X12 + 1.733X2
2 ……… (11)
The Q2, Q6, and Q10 for all the batches F012 to F020 varied from 39.9 % to 52.4%,
57.3% to 74.6%, and 76.8% to 91.6% with correlation coefficient as 0.9585, 0.9113
and 0.9059 respectively.
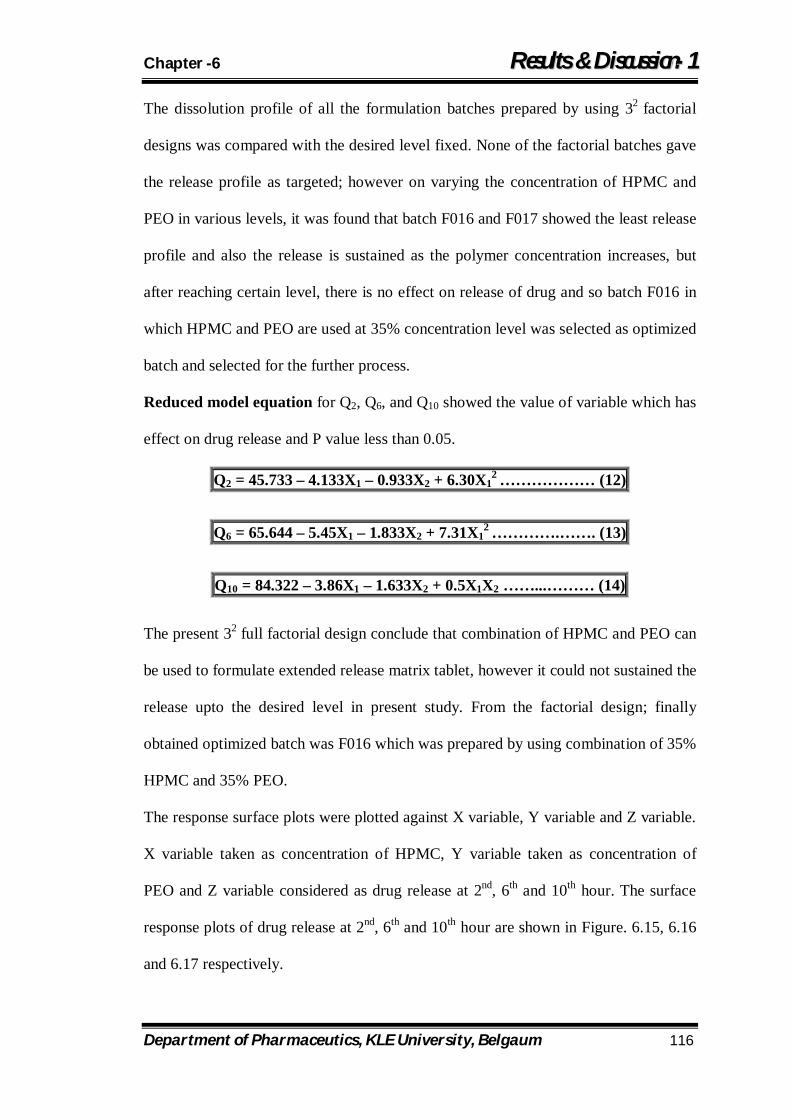
Chapter -6 RReessuullttss && DDiissccuussssiioonn--11
Department of Pharmaceutics, KLE University, Belgaum 116
The dissolution profile of all the formulation batches prepared by using 32 factorial
designs was compared with the desired level fixed. None of the factorial batches gave
the release profile as targeted; however on varying the concentration of HPMC and
PEO in various levels, it was found that batch F016 and F017 showed the least release
profile and also the release is sustained as the polymer concentration increases, but
after reaching certain level, there is no effect on release of drug and so batch F016 in
which HPMC and PEO are used at 35% concentration level was selected as optimized
batch and selected for the further process.
Reduced model equation for Q2, Q6, and Q10 showed the value of variable which has
effect on drug release and P value less than 0.05.
Q2 = 45.733 – 4.133X1 – 0.933X2 + 6.30X12 ……………… (12)
Q6 = 65.644 – 5.45X1 – 1.833X2 + 7.31X12 ………….……. (13)
Q10 = 84.322 – 3.86X1 – 1.633X2 + 0.5X1X2 ……...……… (14)
The present 32 full factorial design conclude that combination of HPMC and PEO can
be used to formulate extended release matrix tablet, however it could not sustained the
release upto the desired level in present study. From the factorial design; finally
obtained optimized batch was F016 which was prepared by using combination of 35%
HPMC and 35% PEO.
The response surface plots were plotted against X variable, Y variable and Z variable.
X variable taken as concentration of HPMC, Y variable taken as concentration of
PEO and Z variable considered as drug release at 2nd, 6th and 10th hour. The surface
response plots of drug release at 2nd, 6th and 10th hour are shown in Figure. 6.15, 6.16
and 6.17 respectively.

Chapter -6 RReessuullttss && DDiissccuussssiioonn--11
Department of Pharmaceutics, KLE University, Belgaum 117
6.6.2 Reproducible batch of optimized batch with larger batch size
Evaluation of Powder blend
The powder blend of batch F021 was evaluated for angle of repose, LBD, TBD,
compressibility index, and drug content (Table 6.20).
The result of angle of repose and compressibility index was found 21.41 and 12.55
respectively. The result of Hausner’s ratio and blend uniformity was 1.14 and 99.16%.
The results of angle of repose (<30) indicate good flow properties of the powder. This
was further supported by lower compressibility index value that was less than 15.0%.
Evaluation of Tablets
The formulations were evaluated for different parameter like hardness, friability,
assay, weight variation (Table 6.21).
Hardness of the prepared tablets was 6-8 kP. All the tablet formulations showed
acceptable pharmacotechnical properties and complied with the in-house
specifications for weight variation, drug content, hardness, and friability.
In-Vitro Drug release
Prepared optimized batch of large scale was evaluated for dissolution study (Table
6.22).
Drug release of F021 was comparable with F016 drug release. No significant change
was observed compared to optimized batch. Comparative dissolution profile is shown
in Figure 6.18.
Chapter -6 RReessuullttss && DDiissccuussssiioonn--11
Department of Pharmaceutics, KLE University, Belgaum 118
6.7 Drug release kinetic analysis by using different release model
of Extended release matrix tablet:
To know the mechanism of drug release from these formulations, the data were
treated according to first-order (log cumulative percentage of drug remaining vs time),
Higuchi’s15 (cumulative percentage of drug released vs square root of time),
Korsmeyer et al’s16 (log cumulative percentage of drug released vs log time), Hixon-
Crowell’s (cube root of % drug retained vs time) equations along with zero order
(cumulative amount of drug released vs time) pattern the results shown in Table 6.23.
The in vitro release profiles of drug from the optimized formulation could be best
expressed by Higuchi’s equation, as the plots showed high linearity (R2 = 0.980,
Table 6.23). To confirm the diffusion mechanism, the data were fit into Korsmeyer-
Peppas’s equation. The formulations F021 showed good linearity (R2: 0.963), with
slope (n) value 0.369, indicating that diffusion is the dominant mechanism of drug
release with these formulations. This n value, however, appears to indicate a coupling
of diffusion and erosion mechanisms so called anomalous diffusion. The relative
complexity of this formulation and its components may indicate that the drug release
is controlled by more than one process.
From the result, it was concluded that the batch taken with 35% HPMC and 35% PEO
had good reproducibility. Reproducible batch F021 was selected for further study.
The drug release followed Higuchi’s model with diffusion following Fickian
behavior; also n value indicated a coupling of diffusion and erosion mechanisms so
called anomalous diffusion. As the release profile of core matrix tablet could not
match the required drug release profile, it was decided to further control the release of
drug by functional coating with EC as a polymer using PEG as plasticizer to match
the initial time point of release.
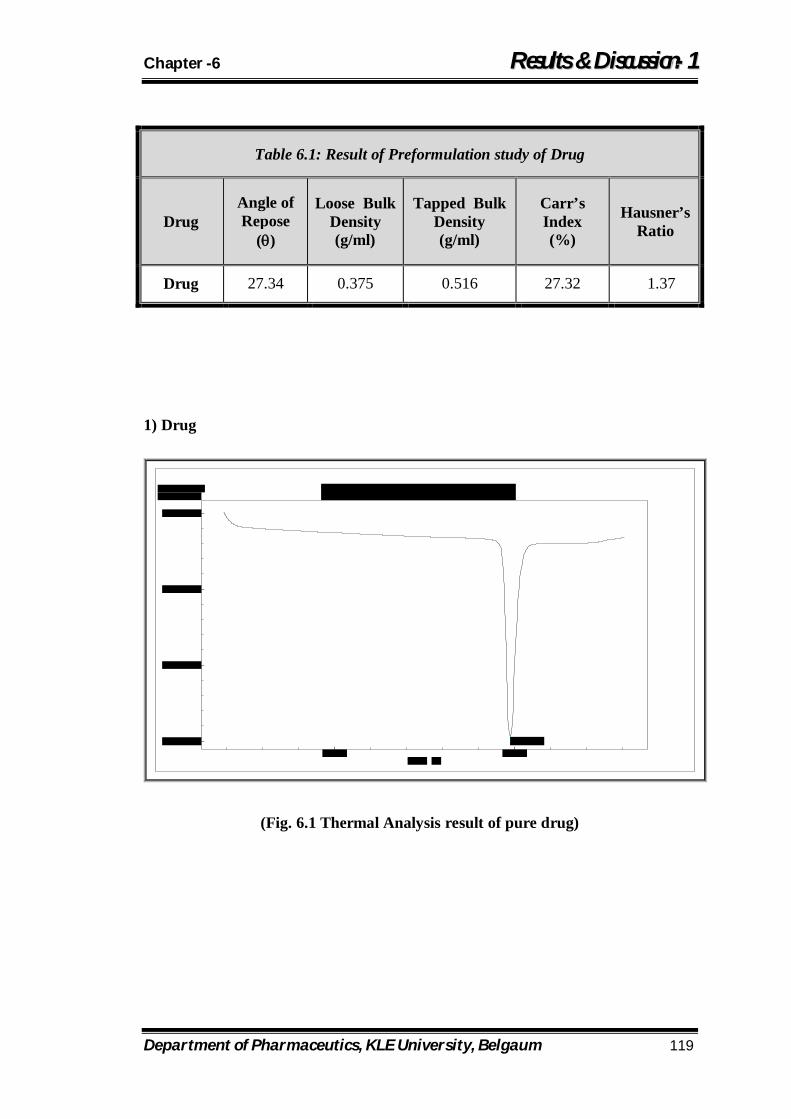
Chapter -6 RReessuullttss && DDiissccuussssiioonn--11
Department of Pharmaceutics, KLE University, Belgaum 119
Table 6.1: Result of Preformulation study of Drug
Drug Angle of Repose
()
Loose Bulk Density (g/ml)
Tapped Bulk Density (g/ml)
Carr’s Index (%)
Hausner’s Ratio
Drug 27.34 0.375 0.516 27.32 1.37
1) Drug
100.00 200.00Temp [C]
-30.00
-20.00
-10.00
0.00
mWDSC
197.56 C
Thermal Analysis Result
(Fig. 6.1 Thermal Analysis result of pure drug)

Chapter -6 RReessuullttss && DDiissccuussssiioonn--11
Department of Pharmaceutics, KLE University, Belgaum 120
2) Drug + PEO
100.00 200.00 300.00Temp [C]
-30.00
-20.00
-10.00
0.00
mWDSC
189.91 C
224.95 C
Thermal Analysis Result
(Fig. 6.2 Thermal Analysis result of Drug + PEO)
3) Drug + MCC (Avicel pH102)
(Fig. 6.3 Thermal Analysis result of Drug + MCC)
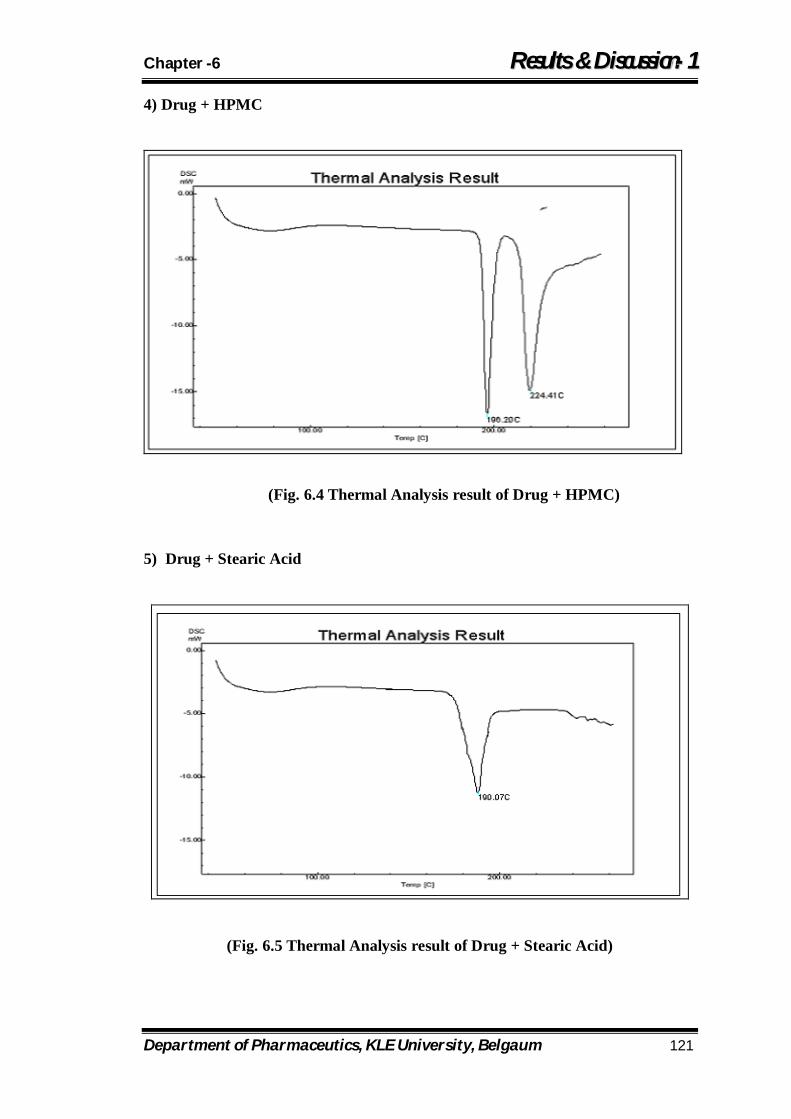
Chapter -6 RReessuullttss && DDiissccuussssiioonn--11
Department of Pharmaceutics, KLE University, Belgaum 121
4) Drug + HPMC
(Fig. 6.4 Thermal Analysis result of Drug + HPMC) 5) Drug + Stearic Acid
(Fig. 6.5 Thermal Analysis result of Drug + Stearic Acid)
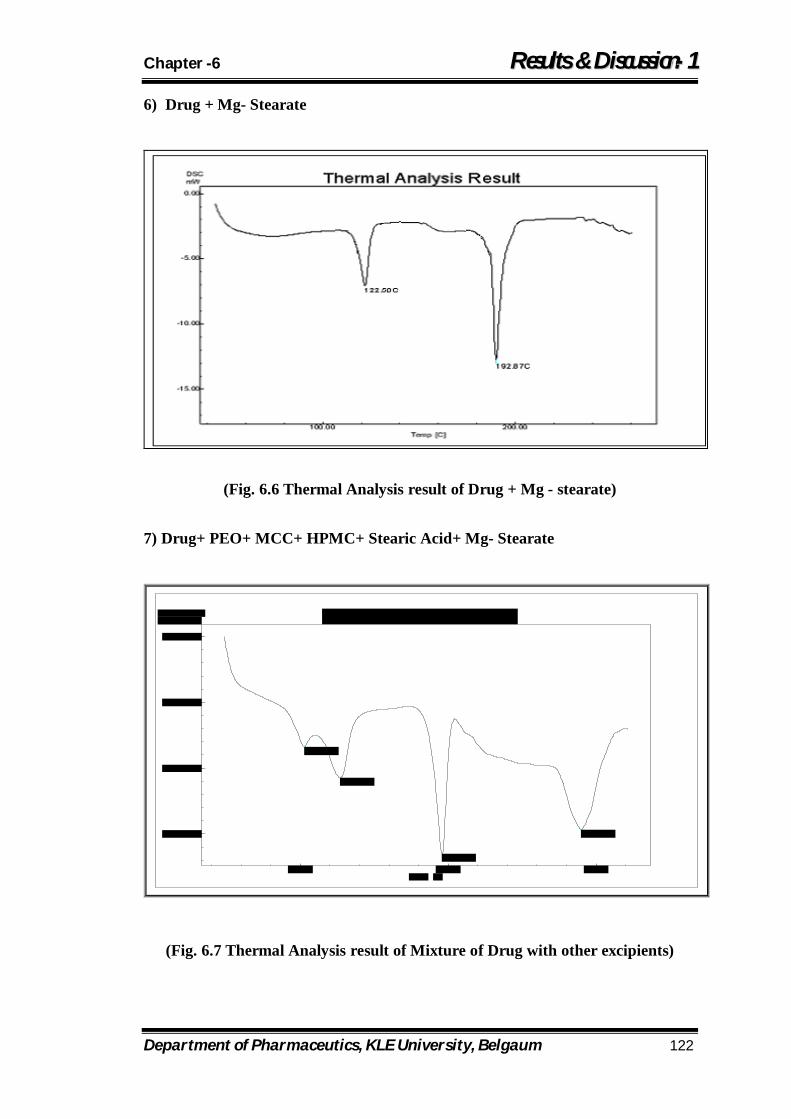
Chapter -6 RReessuullttss && DDiissccuussssiioonn--11
Department of Pharmaceutics, KLE University, Belgaum 122
6) Drug + Mg- Stearate
(Fig. 6.6 Thermal Analysis result of Drug + Mg - stearate) 7) Drug+ PEO+ MCC+ HPMC+ Stearic Acid+ Mg- Stearate
100.00 200.00 300.00Temp [C]
-15.00
-10.00
-5.00
0.00
mWDSC
102.69 C
127.07 C
195.81 C
289.88 C
Thermal Analysis Result
(Fig. 6.7 Thermal Analysis result of Mixture of Drug with other excipients)
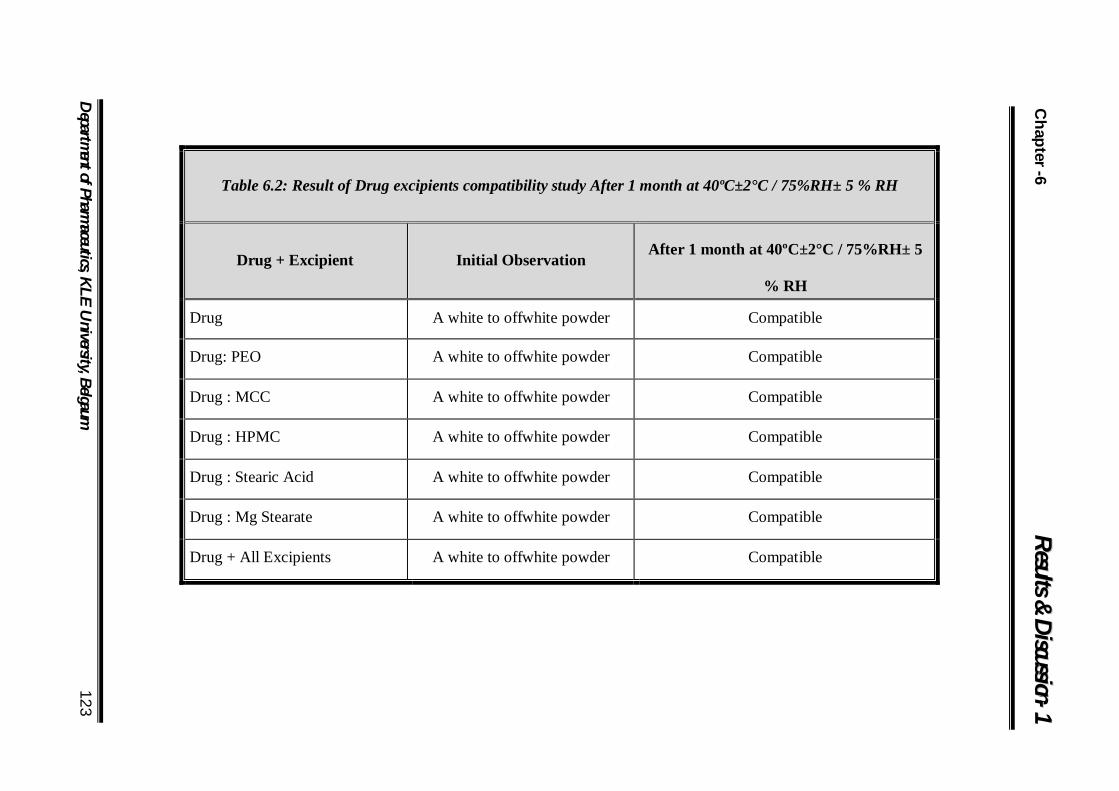
Chapter -6 RR
ee ss uu ll tt ss && DDii ss cc uu ss ss ii oo nn -- 11
Departm
ent of Pharmaceutics, K
LE U
niversity, Belgaum 123 Table 6.2: Result of Drug excipients compatibility study After 1 month at 40ºC±2°C / 75%RH± 5 % RH
Drug + Excipient Initial Observation After 1 month at 40ºC±2°C / 75%RH± 5
% RH
Drug A white to offwhite powder Compatible
Drug: PEO A white to offwhite powder Compatible
Drug : MCC A white to offwhite powder Compatible
Drug : HPMC A white to offwhite powder Compatible
Drug : Stearic Acid A white to offwhite powder Compatible
Drug : Mg Stearate A white to offwhite powder Compatible
Drug + All Excipients A white to offwhite powder Compatible
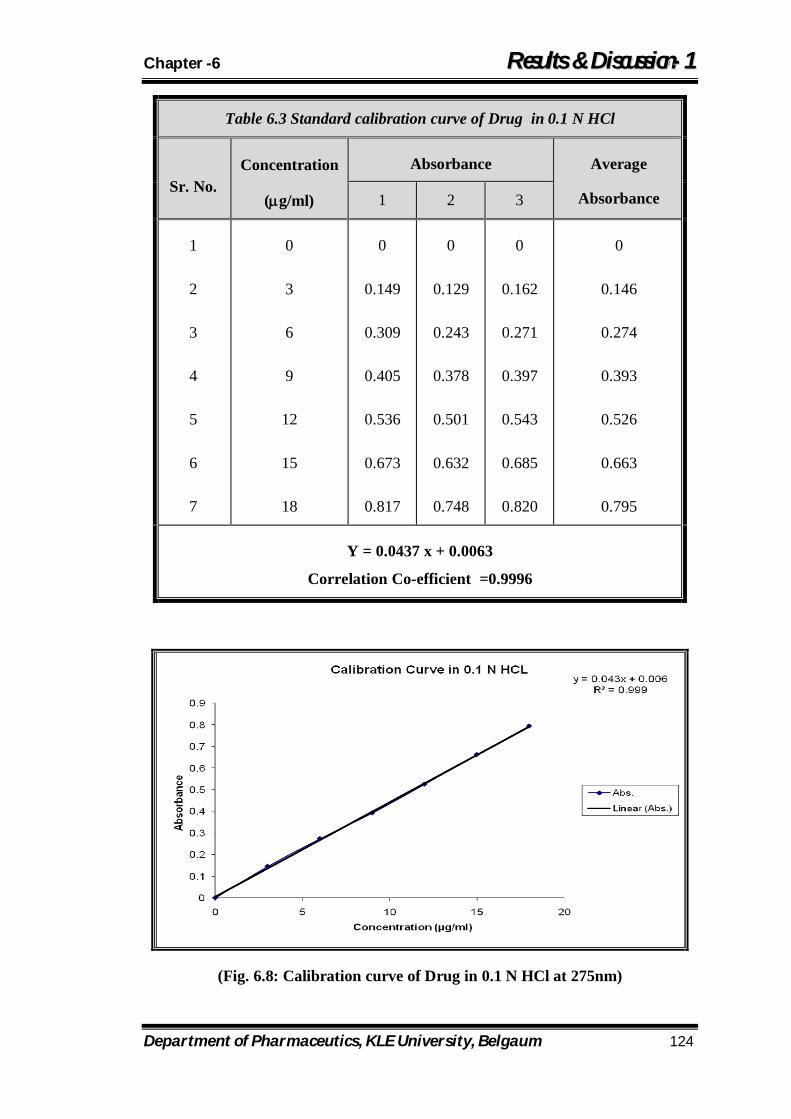
Chapter -6 RReessuullttss && DDiissccuussssiioonn--11
Department of Pharmaceutics, KLE University, Belgaum 124
Table 6.3 Standard calibration curve of Drug in 0.1 N HCl
Sr. No. Concentration
(g/ml)
Absorbance Average
Absorbance 1 2 3
1
2
3
4
5
6
7
0
3
6
9
12
15
18
0
0.149
0.309
0.405
0.536
0.673
0.817
0
0.129
0.243
0.378
0.501
0.632
0.748
0
0.162
0.271
0.397
0.543
0.685
0.820
0
0.146
0.274
0.393
0.526
0.663
0.795
Y = 0.0437 x + 0.0063
Correlation Co-efficient =0.9996
(Fig. 6.8: Calibration curve of Drug in 0.1 N HCl at 275nm)
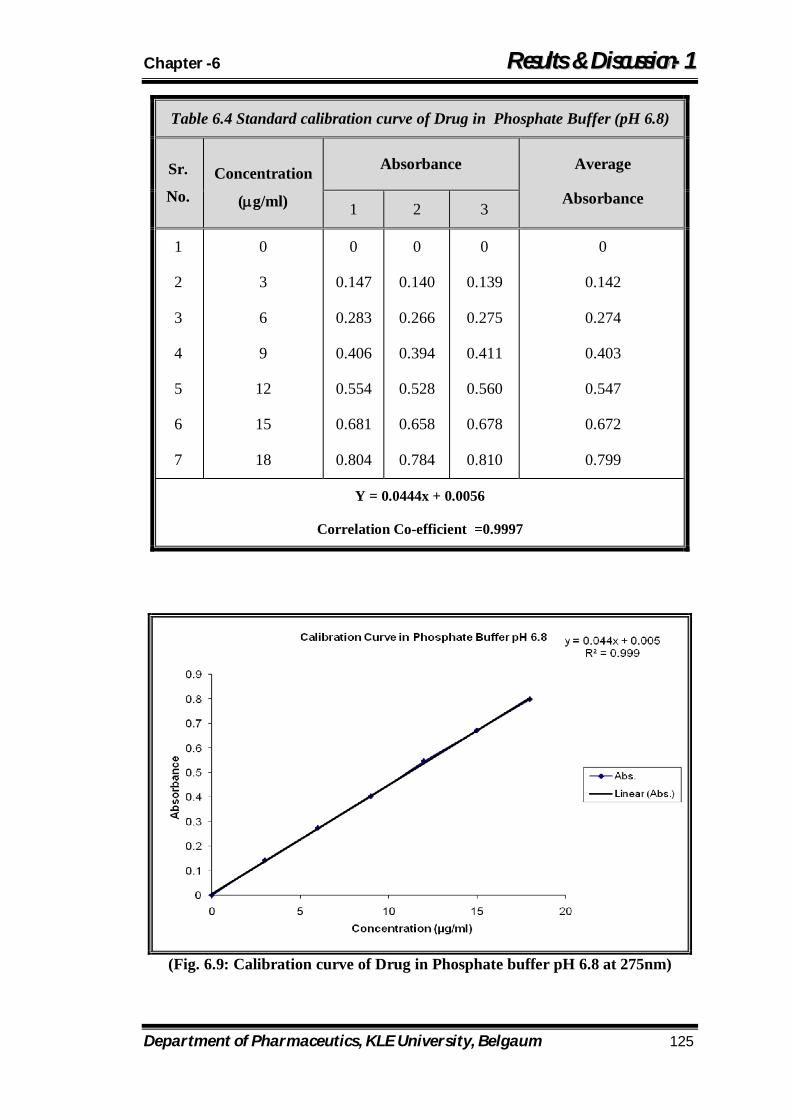
Chapter -6 RReessuullttss && DDiissccuussssiioonn--11
Department of Pharmaceutics, KLE University, Belgaum 125
Table 6.4 Standard calibration curve of Drug in Phosphate Buffer (pH 6.8)
Sr.
No. Concentration
(g/ml)
Absorbance Average
Absorbance 1 2 3
1
2
3
4
5
6
7
0
3
6
9
12
15
18
0
0.147
0.283
0.406
0.554
0.681
0.804
0
0.140
0.266
0.394
0.528
0.658
0.784
0
0.139
0.275
0.411
0.560
0.678
0.810
0
0.142
0.274
0.403
0.547
0.672
0.799
Y = 0.0444x + 0.0056
Correlation Co-efficient =0.9997
(Fig. 6.9: Calibration curve of Drug in Phosphate buffer pH 6.8 at 275nm)
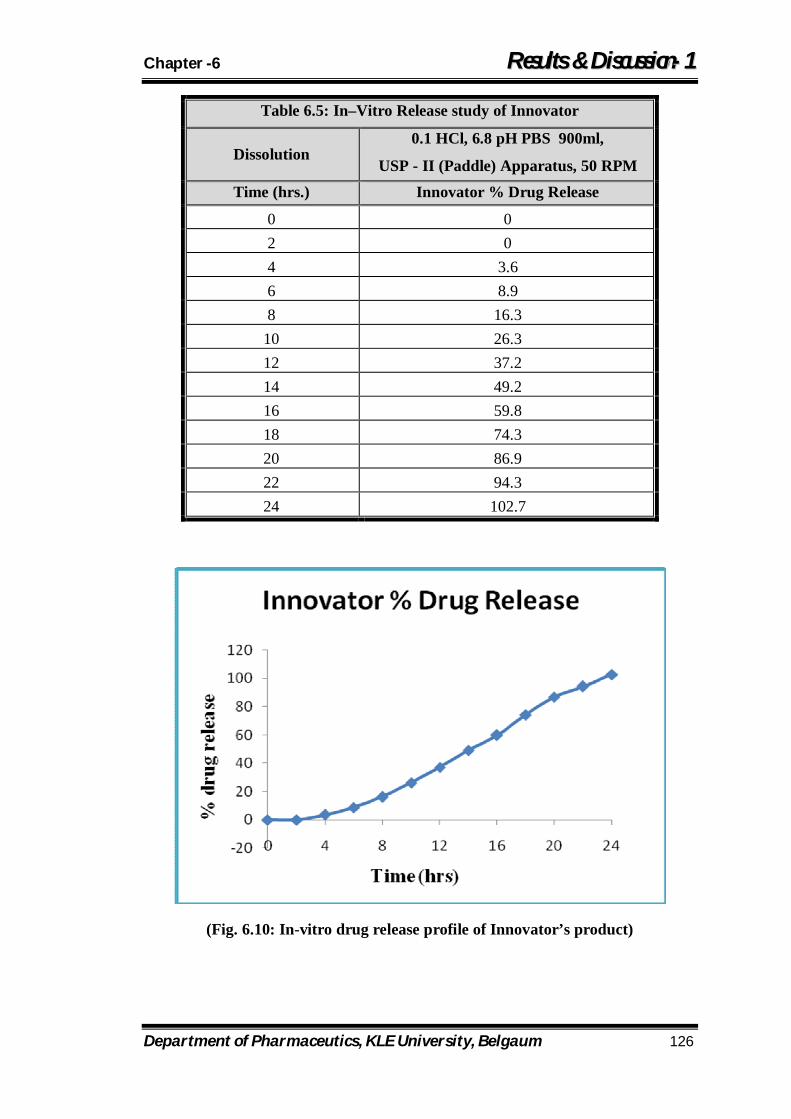
Chapter -6 RReessuullttss && DDiissccuussssiioonn--11
Department of Pharmaceutics, KLE University, Belgaum 126
Table 6.5: In–Vitro Release study of Innovator
Dissolution 0.1 HCl, 6.8 pH PBS 900ml,
USP - II (Paddle) Apparatus, 50 RPM Time (hrs.) Innovator % Drug Release
0 0 2 0 4 3.6 6 8.9 8 16.3
10 26.3 12 37.2 14 49.2 16 59.8 18 74.3 20 86.9 22 94.3 24 102.7
(Fig. 6.10: In-vitro drug release profile of Innovator’s product)
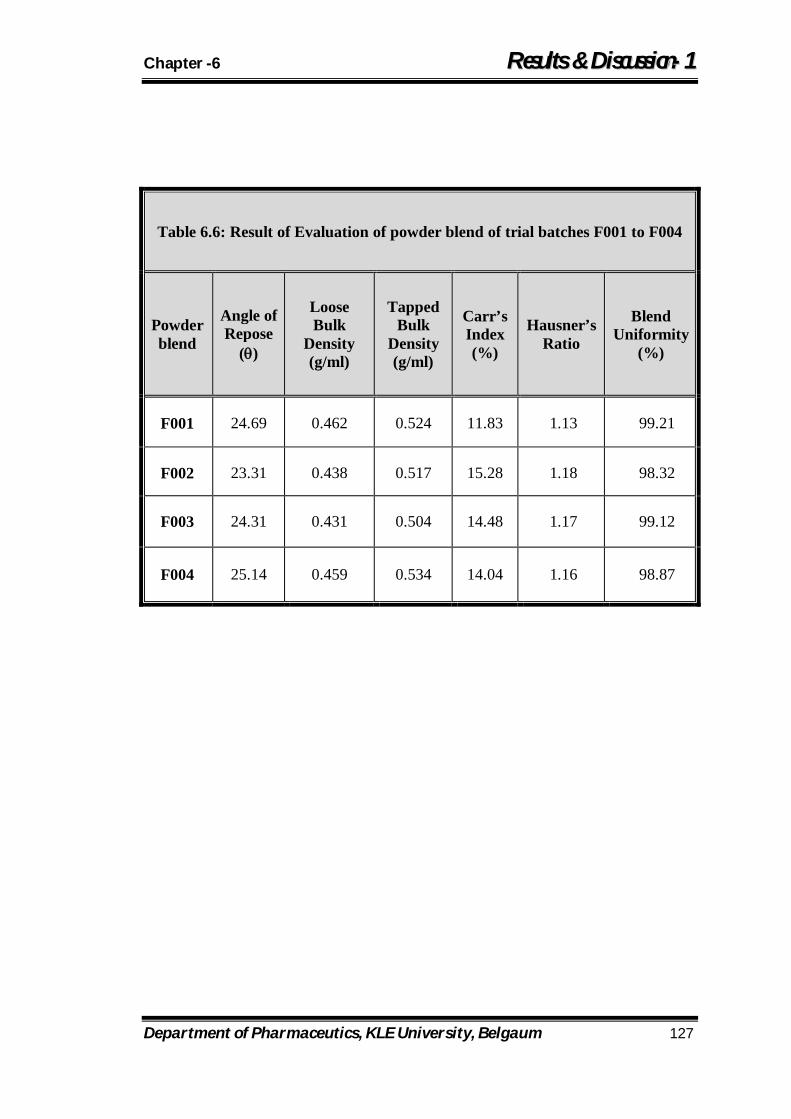
Chapter -6 RReessuullttss && DDiissccuussssiioonn--11
Department of Pharmaceutics, KLE University, Belgaum 127
Table 6.6: Result of Evaluation of powder blend of trial batches F001 to F004
Powder blend
Angle of Repose
()
Loose Bulk
Density (g/ml)
Tapped Bulk
Density (g/ml)
Carr’s Index (%)
Hausner’s Ratio
Blend Uniformity
(%)
F001 24.69 0.462 0.524 11.83 1.13 99.21
F002 23.31 0.438 0.517 15.28 1.18 98.32
F003 24.31 0.431 0.504 14.48 1.17 99.12
F004 25.14 0.459 0.534 14.04 1.16 98.87
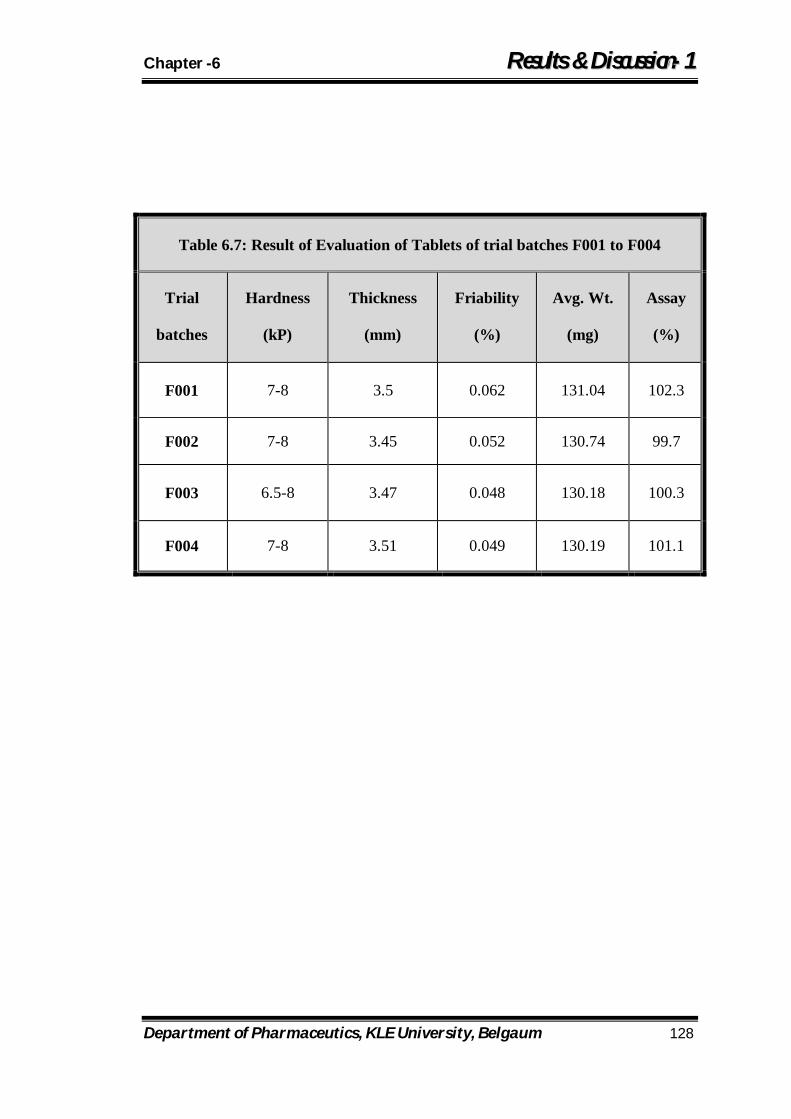
Chapter -6 RReessuullttss && DDiissccuussssiioonn--11
Department of Pharmaceutics, KLE University, Belgaum 128
Table 6.7: Result of Evaluation of Tablets of trial batches F001 to F004
Trial
batches
Hardness
(kP)
Thickness
(mm)
Friability
(%)
Avg. Wt.
(mg)
Assay
(%)
F001 7-8 3.5 0.062 131.04 102.3
F002 7-8 3.45 0.052 130.74 99.7
F003 6.5-8 3.47 0.048 130.18 100.3
F004 7-8 3.51 0.049 130.19 101.1
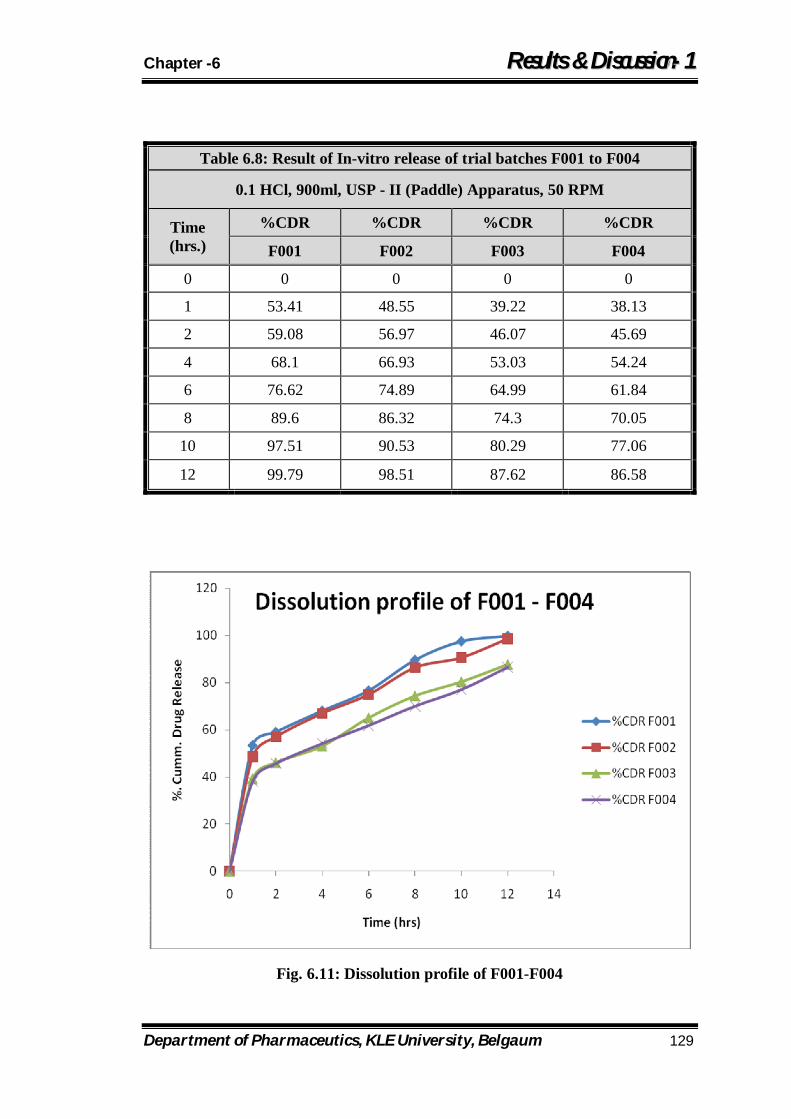
Chapter -6 RReessuullttss && DDiissccuussssiioonn--11
Department of Pharmaceutics, KLE University, Belgaum 129
Fig. 6.11: Dissolution profile of F001-F004
Table 6.8: Result of In-vitro release of trial batches F001 to F004
0.1 HCl, 900ml, USP - II (Paddle) Apparatus, 50 RPM
Time (hrs.)
%CDR %CDR %CDR %CDR
F001 F002 F003 F004
0 0 0 0 0
1 53.41 48.55 39.22 38.13
2 59.08 56.97 46.07 45.69
4 68.1 66.93 53.03 54.24
6 76.62 74.89 64.99 61.84
8 89.6 86.32 74.3 70.05
10 97.51 90.53 80.29 77.06
12 99.79 98.51 87.62 86.58
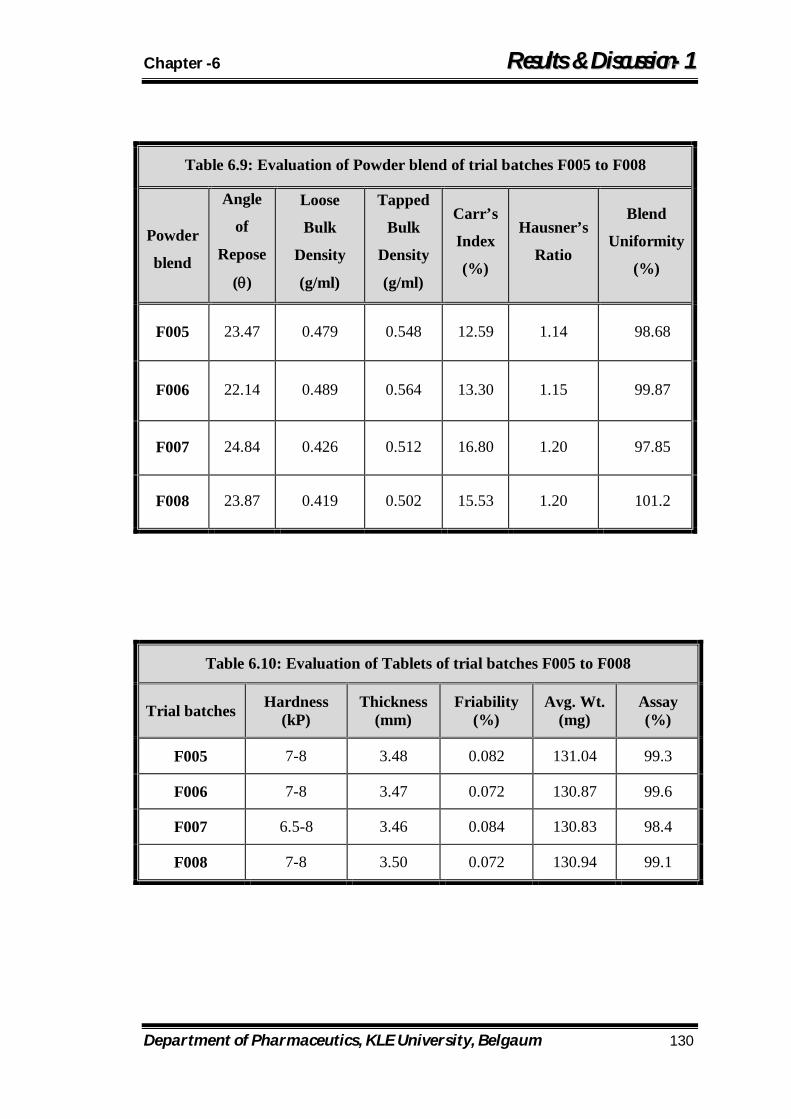
Chapter -6 RReessuullttss && DDiissccuussssiioonn--11
Department of Pharmaceutics, KLE University, Belgaum 130
Table 6.9: Evaluation of Powder blend of trial batches F005 to F008
Powder
blend
Angle
of
Repose
()
Loose
Bulk
Density
(g/ml)
Tapped
Bulk
Density
(g/ml)
Carr’s
Index
(%)
Hausner’s
Ratio
Blend
Uniformity
(%)
F005 23.47 0.479 0.548 12.59 1.14 98.68
F006 22.14 0.489 0.564 13.30 1.15 99.87
F007 24.84 0.426 0.512 16.80 1.20 97.85
F008 23.87 0.419 0.502 15.53 1.20 101.2
Table 6.10: Evaluation of Tablets of trial batches F005 to F008
Trial batches Hardness (kP)
Thickness (mm)
Friability (%)
Avg. Wt. (mg)
Assay (%)
F005 7-8 3.48 0.082 131.04 99.3
F006 7-8 3.47 0.072 130.87 99.6
F007 6.5-8 3.46 0.084 130.83 98.4
F008 7-8 3.50 0.072 130.94 99.1
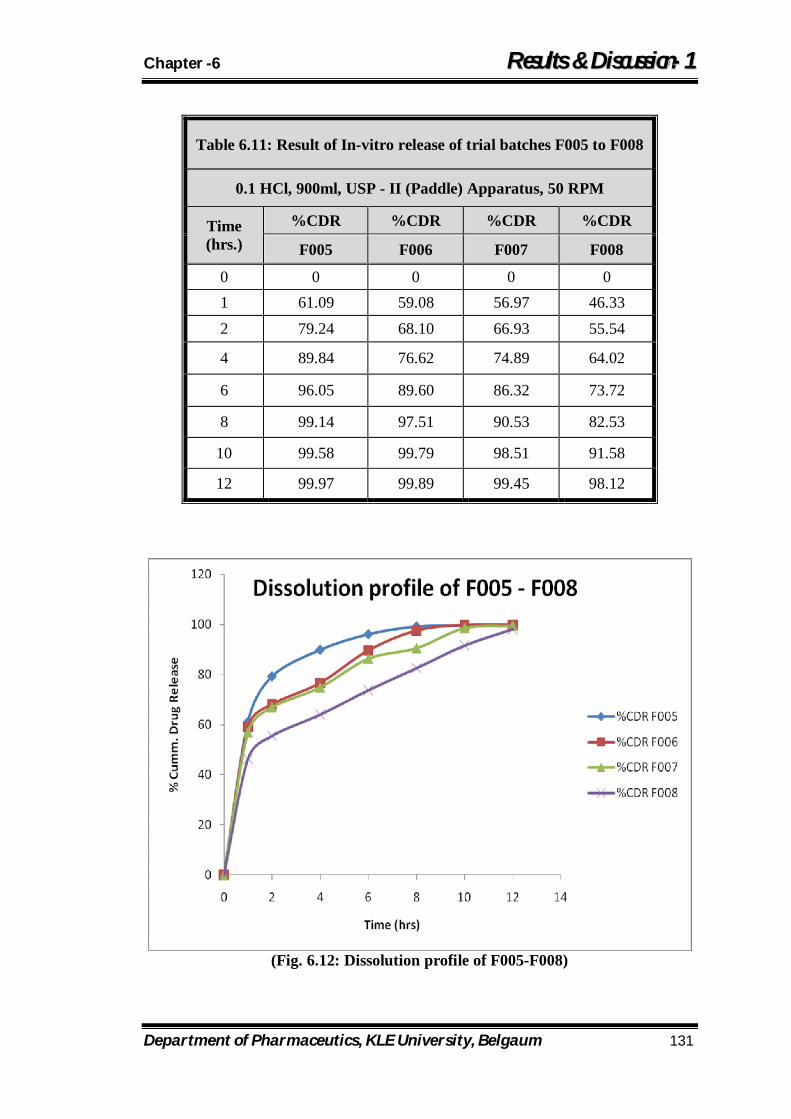
Chapter -6 RReessuullttss && DDiissccuussssiioonn--11
Department of Pharmaceutics, KLE University, Belgaum 131
(Fig. 6.12: Dissolution profile of F005-F008)
Table 6.11: Result of In-vitro release of trial batches F005 to F008
0.1 HCl, 900ml, USP - II (Paddle) Apparatus, 50 RPM
Time (hrs.)
%CDR %CDR %CDR %CDR
F005 F006 F007 F008
0 0 0 0 0 1 61.09 59.08 56.97 46.33 2 79.24 68.10 66.93 55.54
4 89.84 76.62 74.89 64.02
6 96.05 89.60 86.32 73.72
8 99.14 97.51 90.53 82.53
10 99.58 99.79 98.51 91.58
12 99.97 99.89 99.45 98.12
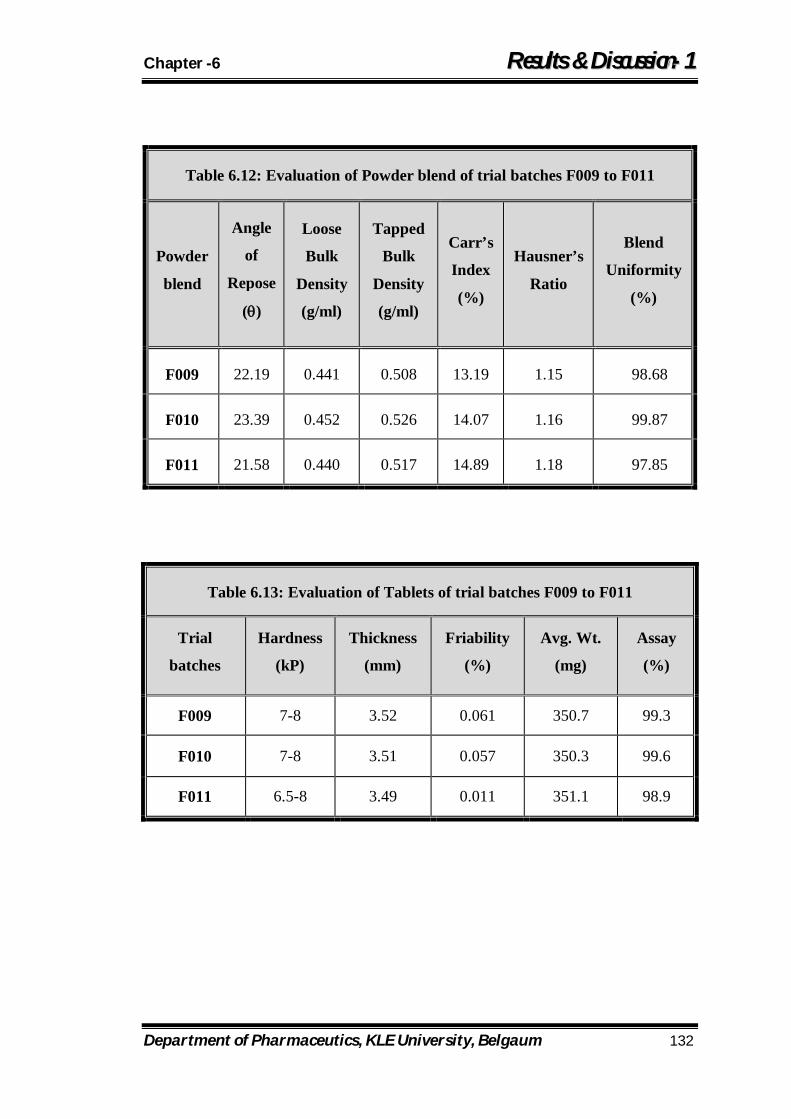
Chapter -6 RReessuullttss && DDiissccuussssiioonn--11
Department of Pharmaceutics, KLE University, Belgaum 132
Table 6.12: Evaluation of Powder blend of trial batches F009 to F011
Powder
blend
Angle
of
Repose
()
Loose
Bulk
Density
(g/ml)
Tapped
Bulk
Density
(g/ml)
Carr’s
Index
(%)
Hausner’s
Ratio
Blend
Uniformity
(%)
F009 22.19 0.441 0.508 13.19 1.15 98.68
F010 23.39 0.452 0.526 14.07 1.16 99.87
F011 21.58 0.440 0.517 14.89 1.18 97.85
Table 6.13: Evaluation of Tablets of trial batches F009 to F011
Trial
batches
Hardness
(kP)
Thickness
(mm)
Friability
(%)
Avg. Wt.
(mg)
Assay
(%)
F009 7-8 3.52 0.061 350.7 99.3
F010 7-8 3.51 0.057 350.3 99.6
F011 6.5-8 3.49 0.011 351.1 98.9
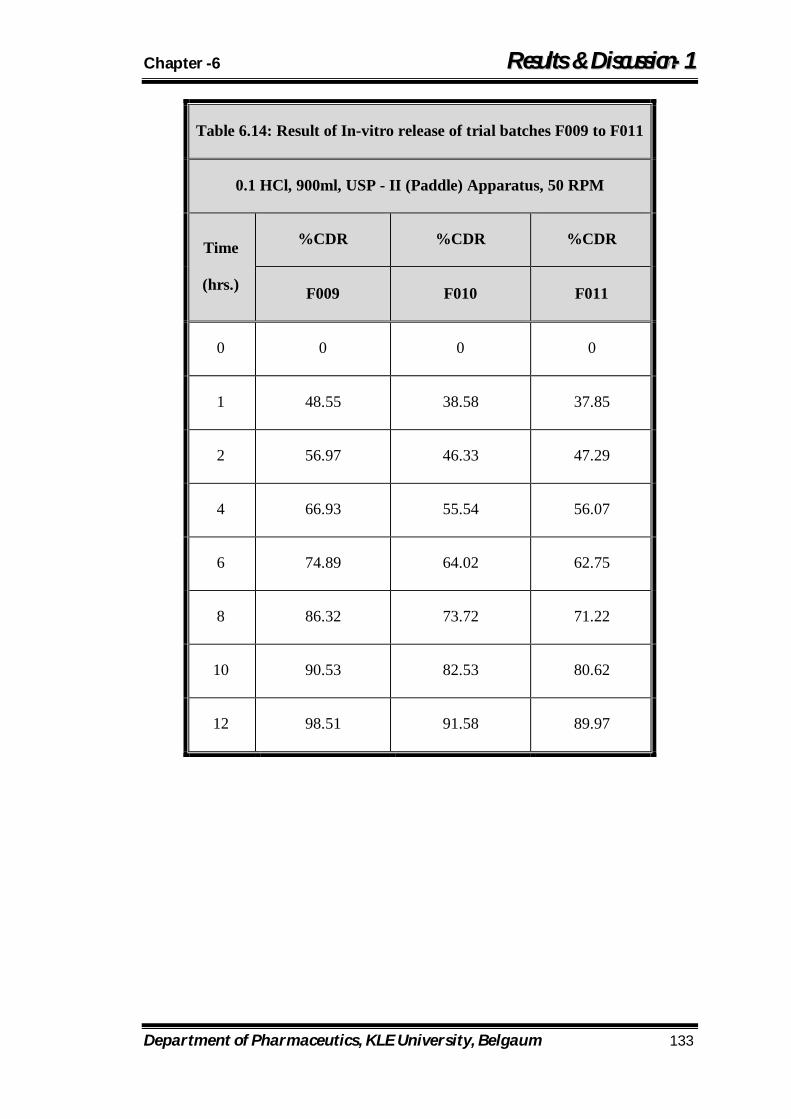
Chapter -6 RReessuullttss && DDiissccuussssiioonn--11
Department of Pharmaceutics, KLE University, Belgaum 133
Table 6.14: Result of In-vitro release of trial batches F009 to F011
0.1 HCl, 900ml, USP - II (Paddle) Apparatus, 50 RPM
Time
(hrs.)
%CDR %CDR %CDR
F009 F010 F011
0 0 0 0
1 48.55 38.58 37.85
2 56.97 46.33 47.29
4 66.93 55.54 56.07
6 74.89 64.02 62.75
8 86.32 73.72 71.22
10 90.53 82.53 80.62
12 98.51 91.58 89.97
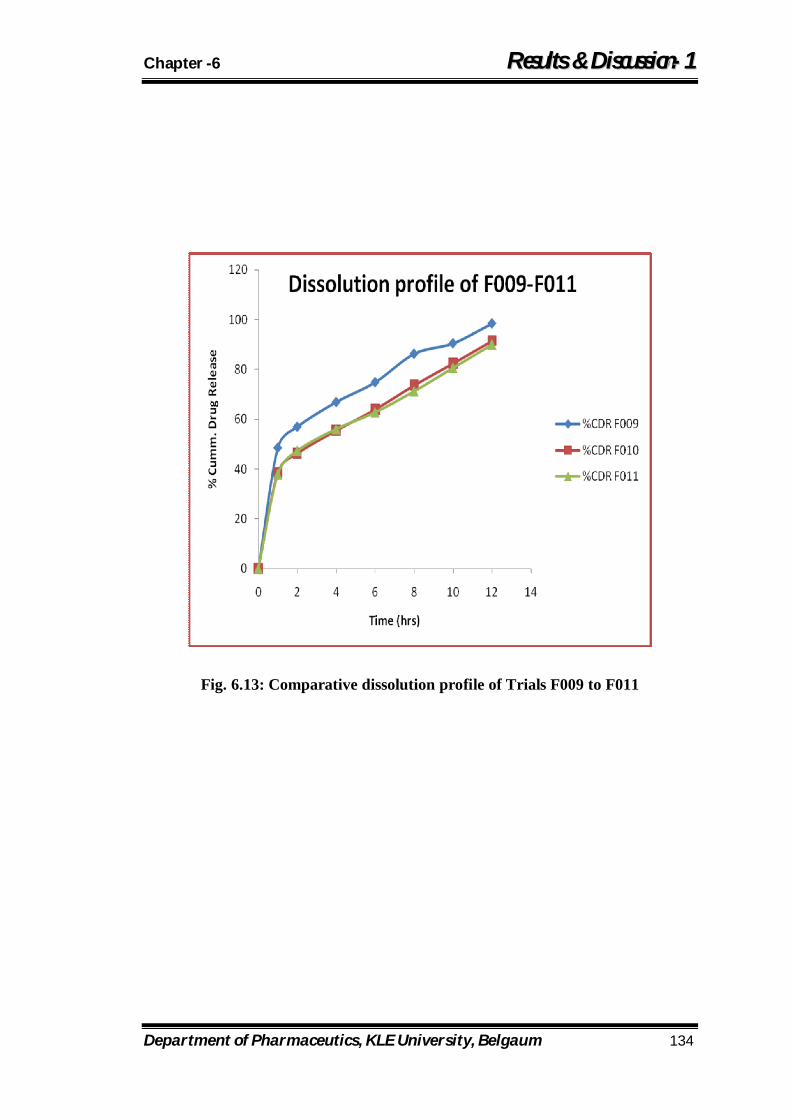
Chapter -6 RReessuullttss && DDiissccuussssiioonn--11
Department of Pharmaceutics, KLE University, Belgaum 134
Fig. 6.13: Comparative dissolution profile of Trials F009 to F011
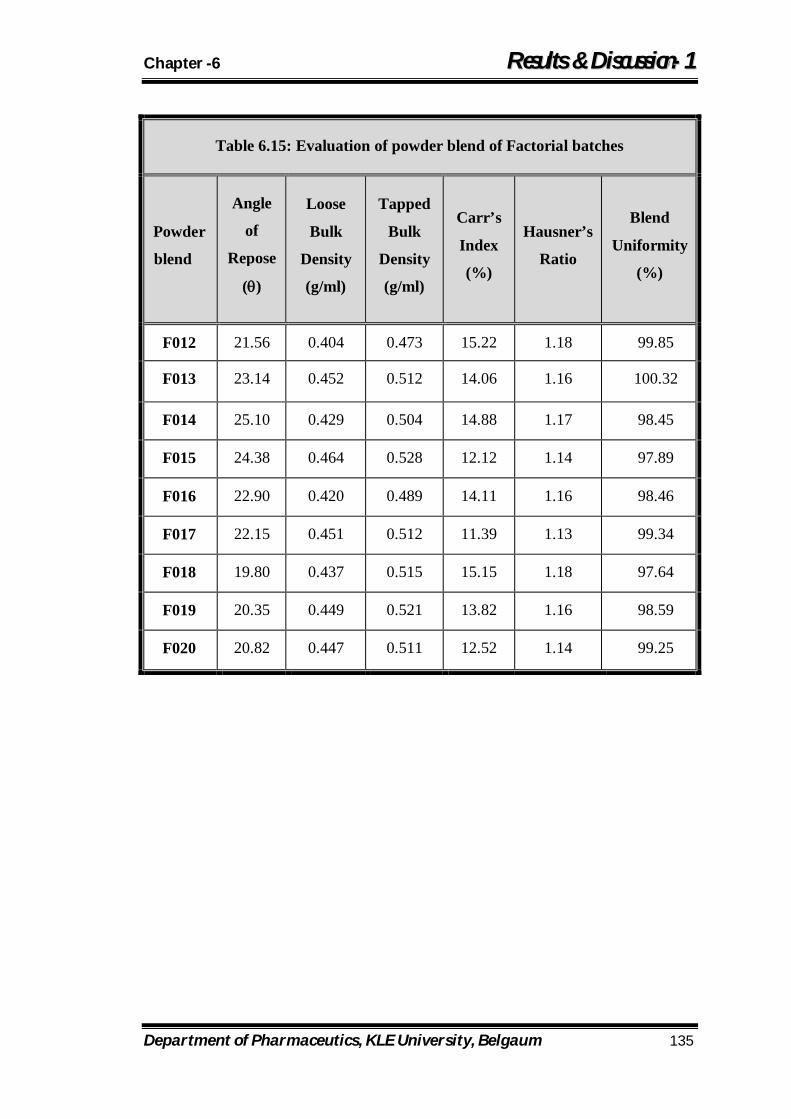
Chapter -6 RReessuullttss && DDiissccuussssiioonn--11
Department of Pharmaceutics, KLE University, Belgaum 135
Table 6.15: Evaluation of powder blend of Factorial batches
Powder
blend
Angle
of
Repose
()
Loose
Bulk
Density
(g/ml)
Tapped
Bulk
Density
(g/ml)
Carr’s
Index
(%)
Hausner’s
Ratio
Blend
Uniformity
(%)
F012 21.56 0.404 0.473 15.22 1.18 99.85
F013 23.14 0.452 0.512 14.06 1.16 100.32
F014 25.10 0.429 0.504 14.88 1.17 98.45
F015 24.38 0.464 0.528 12.12 1.14 97.89
F016 22.90 0.420 0.489 14.11 1.16 98.46
F017 22.15 0.451 0.512 11.39 1.13 99.34
F018 19.80 0.437 0.515 15.15 1.18 97.64
F019 20.35 0.449 0.521 13.82 1.16 98.59
F020 20.82 0.447 0.511 12.52 1.14 99.25
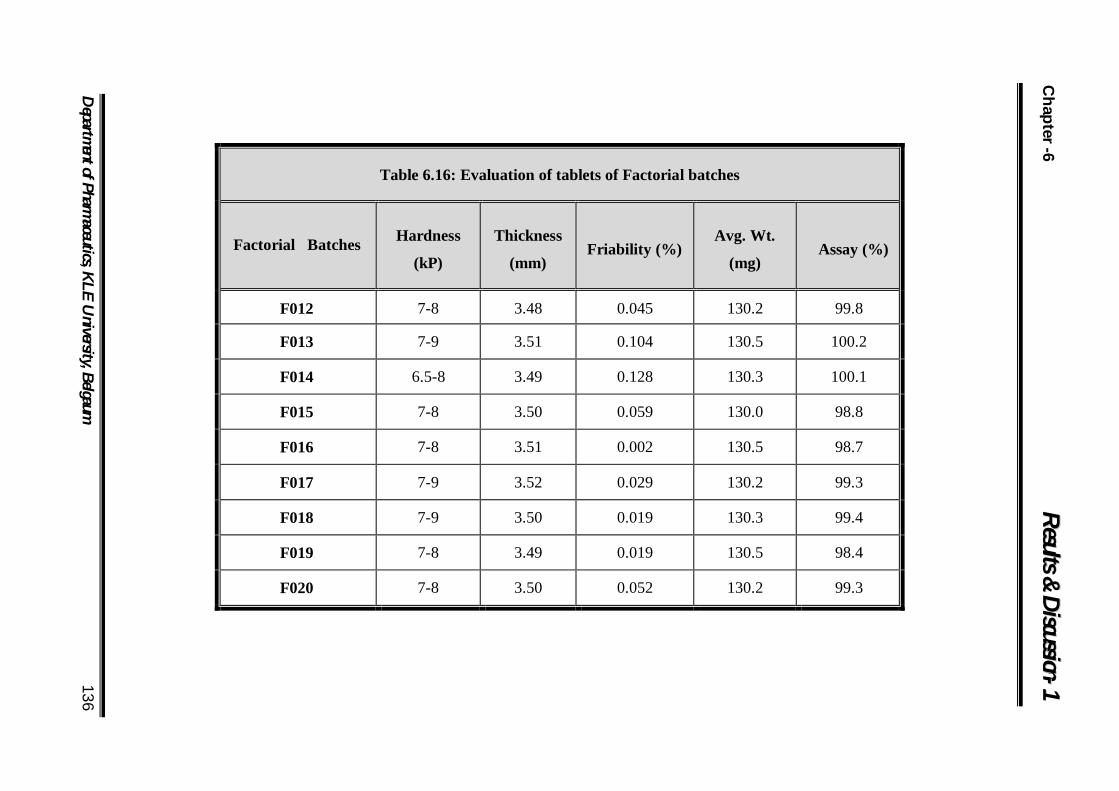
Chapter -6 RR
ee ss uu ll tt ss && DDii ss cc uu ss ss ii oo nn -- 11
Departm
ent of Pharmaceutics, K
LE U
niversity, Belgaum 136 Table 6.16: Evaluation of tablets of Factorial batches
Factorial Batches Hardness
(kP)
Thickness
(mm) Friability (%)
Avg. Wt.
(mg) Assay (%)
F012 7-8 3.48 0.045 130.2 99.8
F013 7-9 3.51 0.104 130.5 100.2
F014 6.5-8 3.49 0.128 130.3 100.1
F015 7-8 3.50 0.059 130.0 98.8
F016 7-8 3.51 0.002 130.5 98.7
F017 7-9 3.52 0.029 130.2 99.3
F018 7-9 3.50 0.019 130.3 99.4
F019 7-8 3.49 0.019 130.5 98.4
F020 7-8 3.50 0.052 130.2 99.3
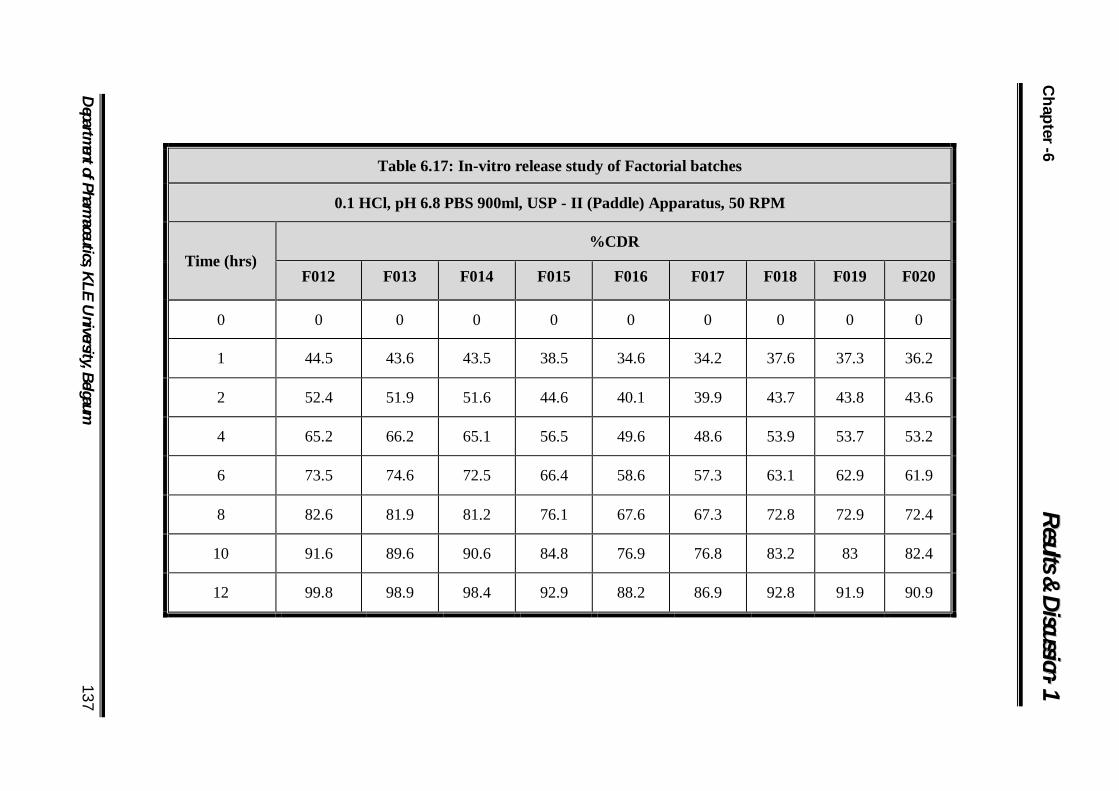
Chapter -6 RR
ee ss uu ll tt ss && DDii ss cc uu ss ss ii oo nn -- 11
Departm
ent of Pharmaceutics, K
LE U
niversity, Belgaum 137
Table 6.17: In-vitro release study of Factorial batches
0.1 HCl, pH 6.8 PBS 900ml, USP - II (Paddle) Apparatus, 50 RPM
Time (hrs) %CDR
F012 F013 F014 F015 F016 F017 F018 F019 F020
0 0 0 0 0 0 0 0 0 0
1 44.5 43.6 43.5 38.5 34.6 34.2 37.6 37.3 36.2
2 52.4 51.9 51.6 44.6 40.1 39.9 43.7 43.8 43.6
4 65.2 66.2 65.1 56.5 49.6 48.6 53.9 53.7 53.2
6 73.5 74.6 72.5 66.4 58.6 57.3 63.1 62.9 61.9
8 82.6 81.9 81.2 76.1 67.6 67.3 72.8 72.9 72.4
10 91.6 89.6 90.6 84.8 76.9 76.8 83.2 83 82.4
12 99.8 98.9 98.4 92.9 88.2 86.9 92.8 91.9 90.9
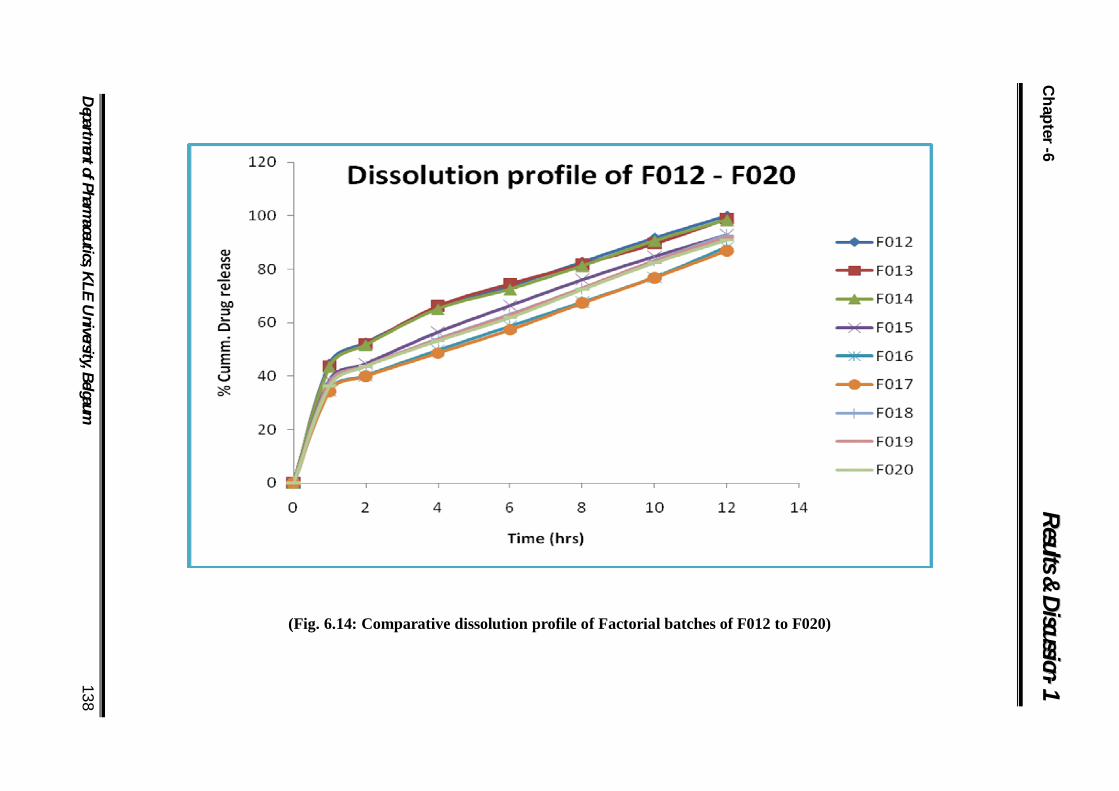
Chapter -6 RR
ee ss uu ll tt ss && DDii ss cc uu ss ss ii oo nn -- 11
Departm
ent of Pharmaceutics, K
LE U
niversity, Belgaum 138
(Fig. 6.14: Comparative dissolution profile of Factorial batches of F012 to F020)
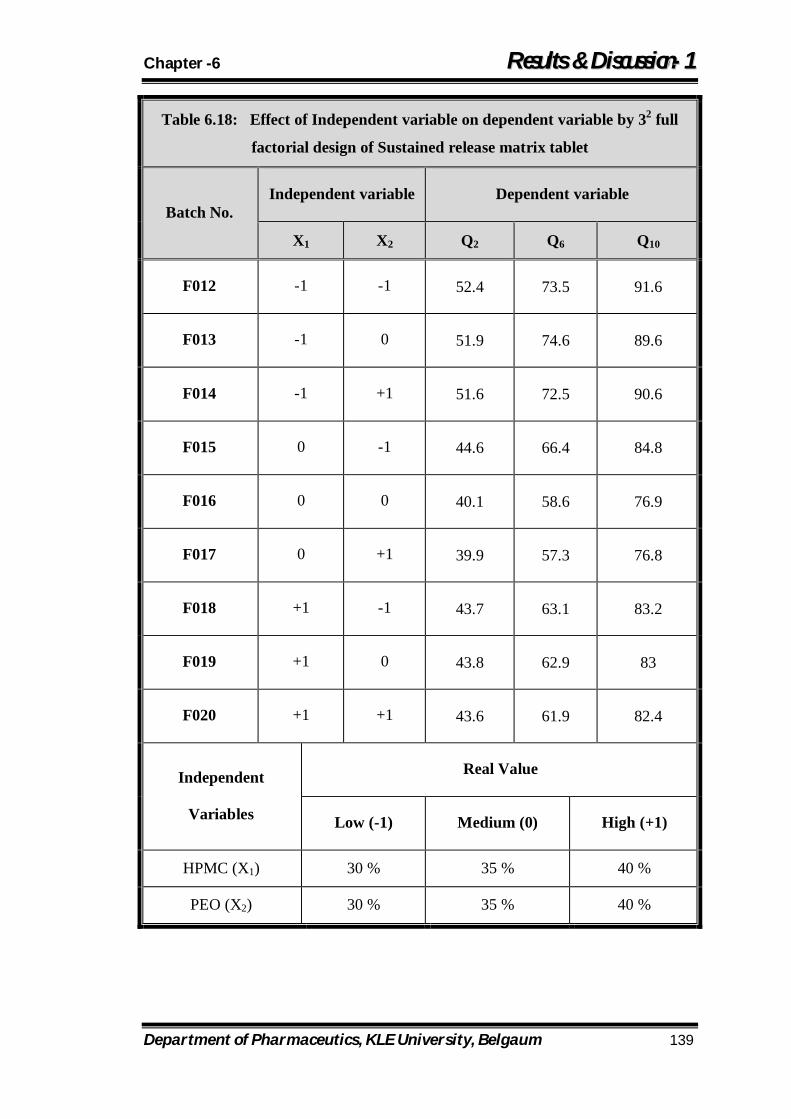
Chapter -6 RReessuullttss && DDiissccuussssiioonn--11
Department of Pharmaceutics, KLE University, Belgaum 139
Table 6.18: Effect of Independent variable on dependent variable by 32 full
factorial design of Sustained release matrix tablet
Batch No. Independent variable Dependent variable
X1 X2 Q2 Q6 Q10
F012 -1 -1 52.4 73.5 91.6
F013 -1 0 51.9 74.6 89.6
F014 -1 +1 51.6 72.5 90.6
F015 0 -1 44.6 66.4 84.8
F016 0 0 40.1 58.6 76.9
F017 0 +1 39.9 57.3 76.8
F018 +1 -1 43.7 63.1 83.2
F019 +1 0 43.8 62.9 83
F020 +1 +1 43.6 61.9 82.4
Independent
Variables
Real Value
Low (-1) Medium (0) High (+1)
HPMC (X1) 30 % 35 % 40 %
PEO (X2) 30 % 35 % 40 %
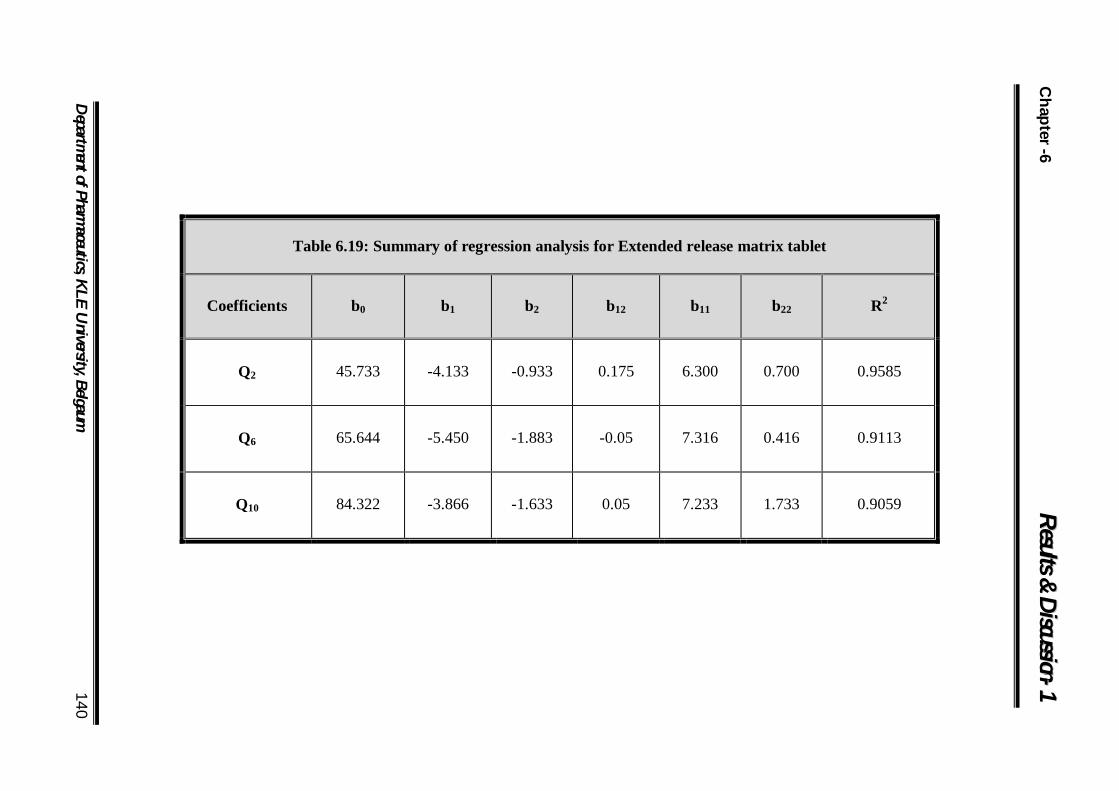
Chapter -6 RR
ee ss uu ll tt ss && DDii ss cc uu ss ss ii oo nn -- 11
Departm
ent of Pharmaceutics, K
LE U
niversity, Belgaum 140
Table 6.19: Summary of regression analysis for Extended release matrix tablet
Coefficients b0 b1 b2 b12 b11 b22 R2
Q2 45.733 -4.133 -0.933 0.175 6.300 0.700 0.9585
Q6 65.644 -5.450 -1.883 -0.05 7.316 0.416 0.9113
Q10 84.322 -3.866 -1.633 0.05 7.233 1.733 0.9059
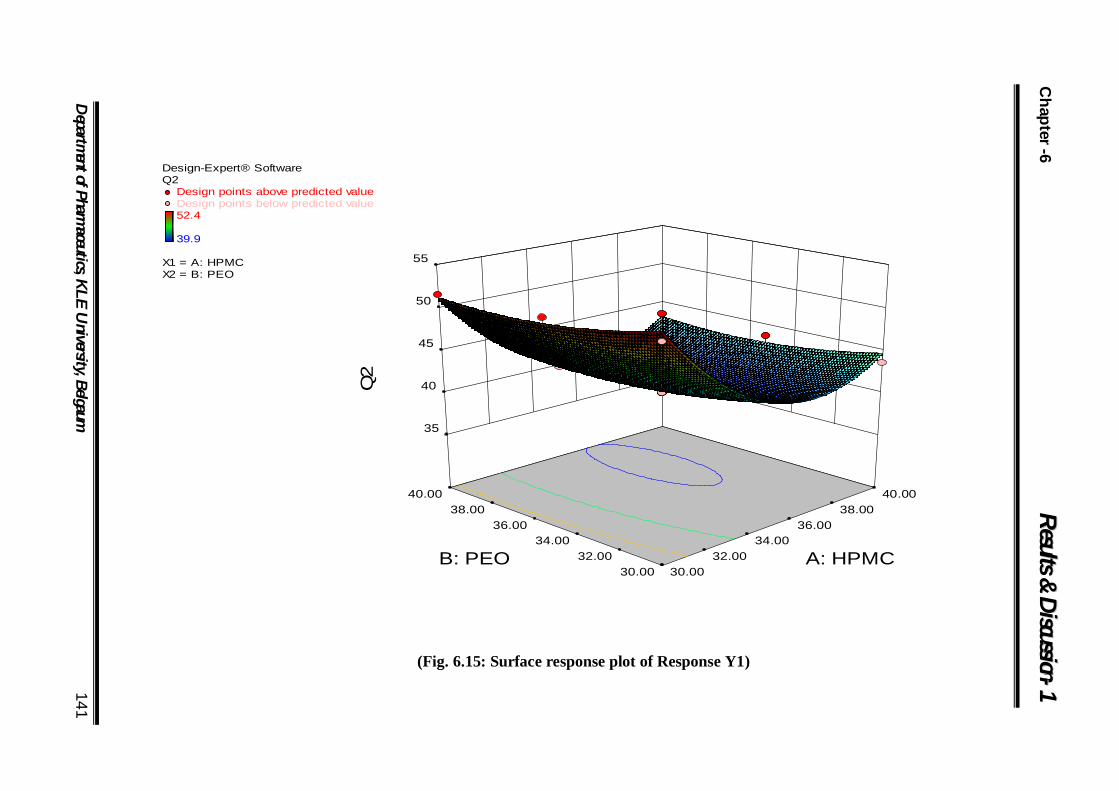
Chapter -6 RR
ee ss uu ll tt ss && DDii ss cc uu ss ss ii oo nn -- 11
Departm
ent of Pharmaceutics, K
LE U
niversity, Belgaum 141
Design-Expert® SoftwareQ2
Design points above predicted valueDesign points below predicted value52.4
39.9
X1 = A: HPMCX2 = B: PEO
30.00 32.00
34.00 36.00
38.00 40.00
30.00 32.00
34.00 36.00
38.00 40.00
35
40
45
50
55
Q2
A: HPMC B: PEO
(Fig. 6.15: Surface response plot of Response Y1)
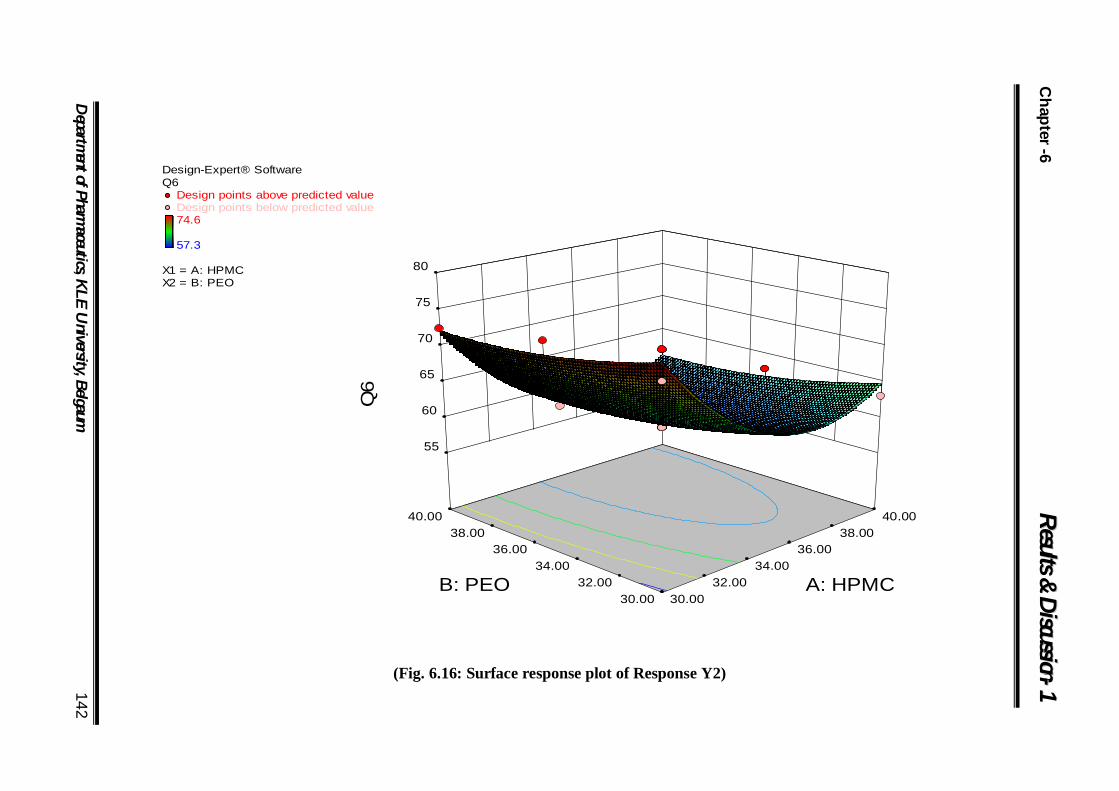
Chapter -6 RR
ee ss uu ll tt ss && DDii ss cc uu ss ss ii oo nn -- 11
Departm
ent of Pharmaceutics, K
LE U
niversity, Belgaum 142
Design-Expert® SoftwareQ6
Design points above predicted valueDesign points below predicted value74.6
57.3
X1 = A: HPMCX2 = B: PEO
30.00 32.00
34.00 36.00
38.00 40.00
30.00 32.00
34.00 36.00
38.00 40.00
55
60
65
70
75
80
Q6
A: HPMC B: PEO
(Fig. 6.16: Surface response plot of Response Y2)
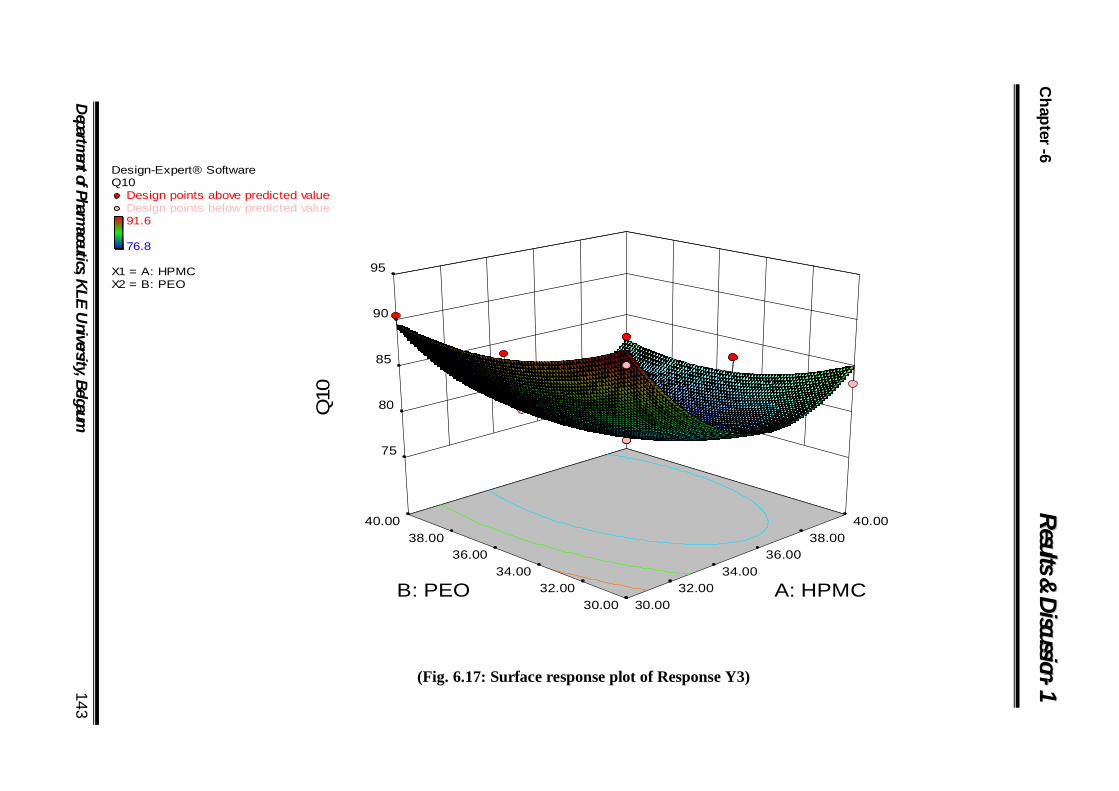
Chapter -6 RR
ee ss uu ll tt ss && DDii ss cc uu ss ss ii oo nn -- 11
Departm
ent of Pharmaceutics, K
LE U
niversity, Belgaum 143
Design-Expert® SoftwareQ10
Design points above predicted valueDesign points below predicted value91.6
76.8
X1 = A: HPMCX2 = B: PEO
30.00 32.00
34.00 36.00
38.00 40.00
30.00 32.00
34.00 36.00
38.00 40.00
75
80
85
90
95
Q10
A: HPMC B: PEO
(Fig. 6.17: Surface response plot of Response Y3)
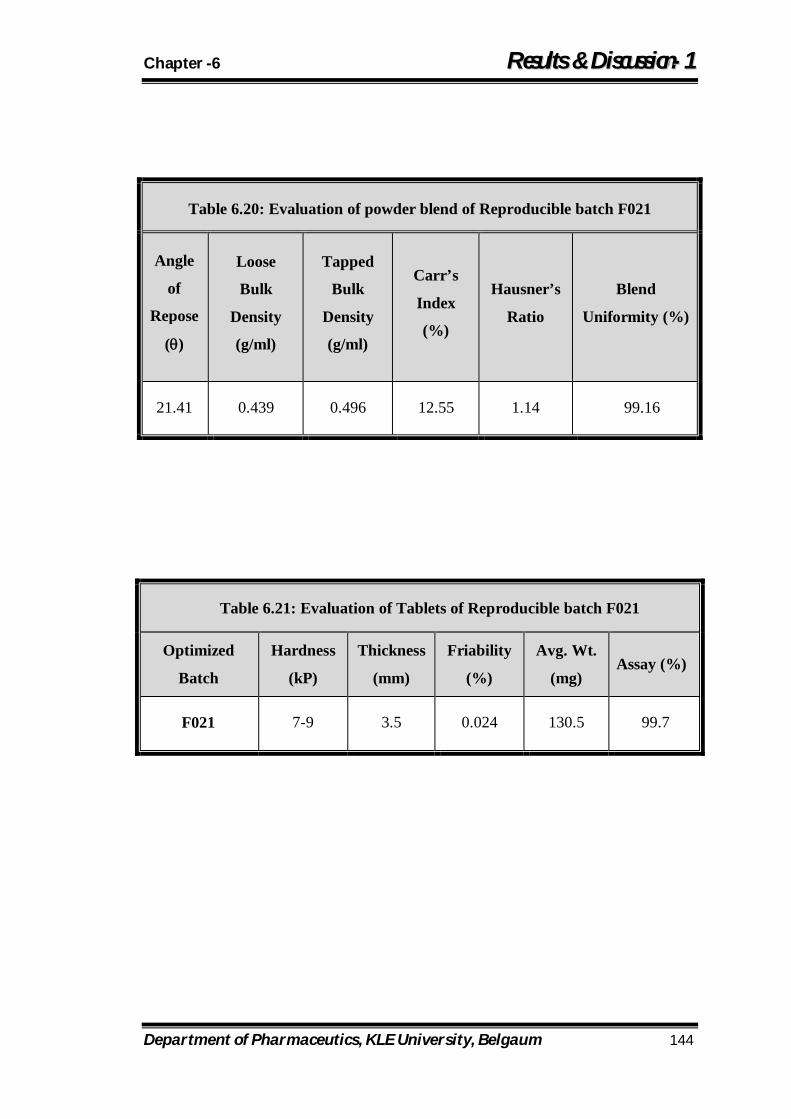
Chapter -6 RReessuullttss && DDiissccuussssiioonn--11
Department of Pharmaceutics, KLE University, Belgaum 144
Table 6.20: Evaluation of powder blend of Reproducible batch F021
Angle
of
Repose
()
Loose
Bulk
Density
(g/ml)
Tapped
Bulk
Density
(g/ml)
Carr’s
Index
(%)
Hausner’s
Ratio
Blend
Uniformity (%)
21.41 0.439 0.496 12.55 1.14 99.16
Table 6.21: Evaluation of Tablets of Reproducible batch F021
Optimized
Batch
Hardness
(kP)
Thickness
(mm)
Friability
(%)
Avg. Wt.
(mg) Assay (%)
F021 7-9 3.5 0.024 130.5 99.7
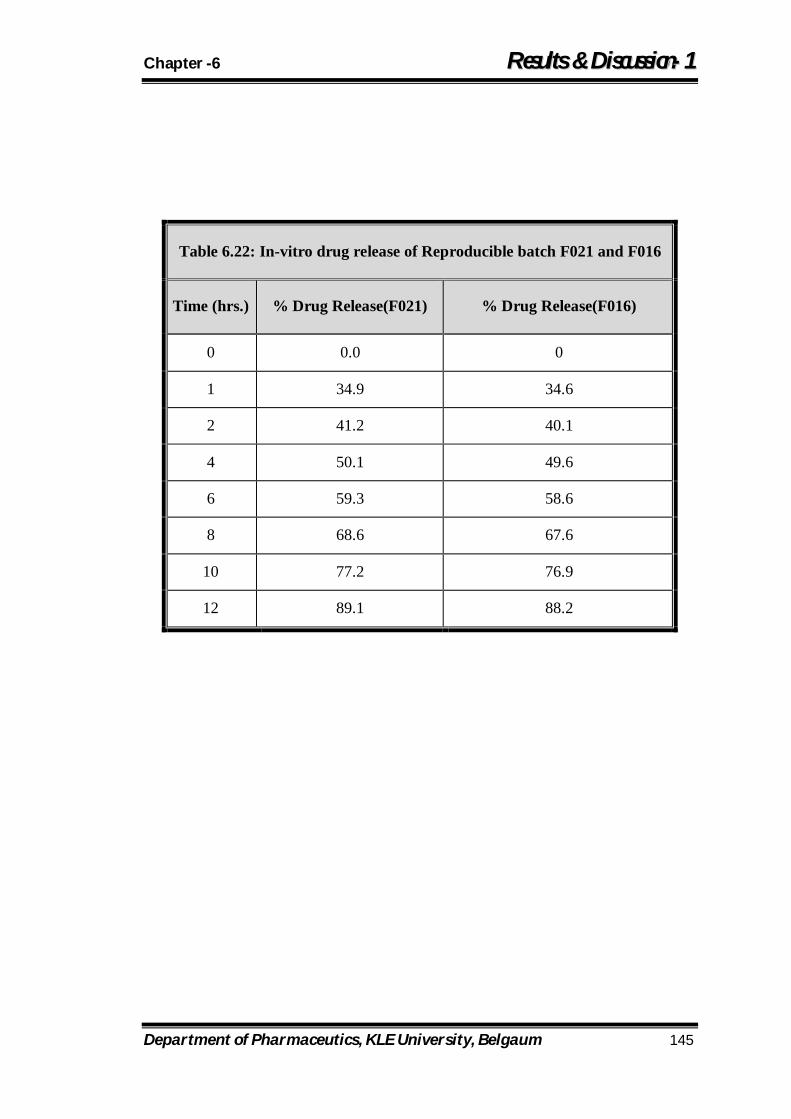
Chapter -6 RReessuullttss && DDiissccuussssiioonn--11
Department of Pharmaceutics, KLE University, Belgaum 145
Table 6.22: In-vitro drug release of Reproducible batch F021 and F016
Time (hrs.) % Drug Release(F021) % Drug Release(F016)
0 0.0 0
1 34.9 34.6
2 41.2 40.1
4 50.1 49.6
6 59.3 58.6
8 68.6 67.6
10 77.2 76.9
12 89.1 88.2
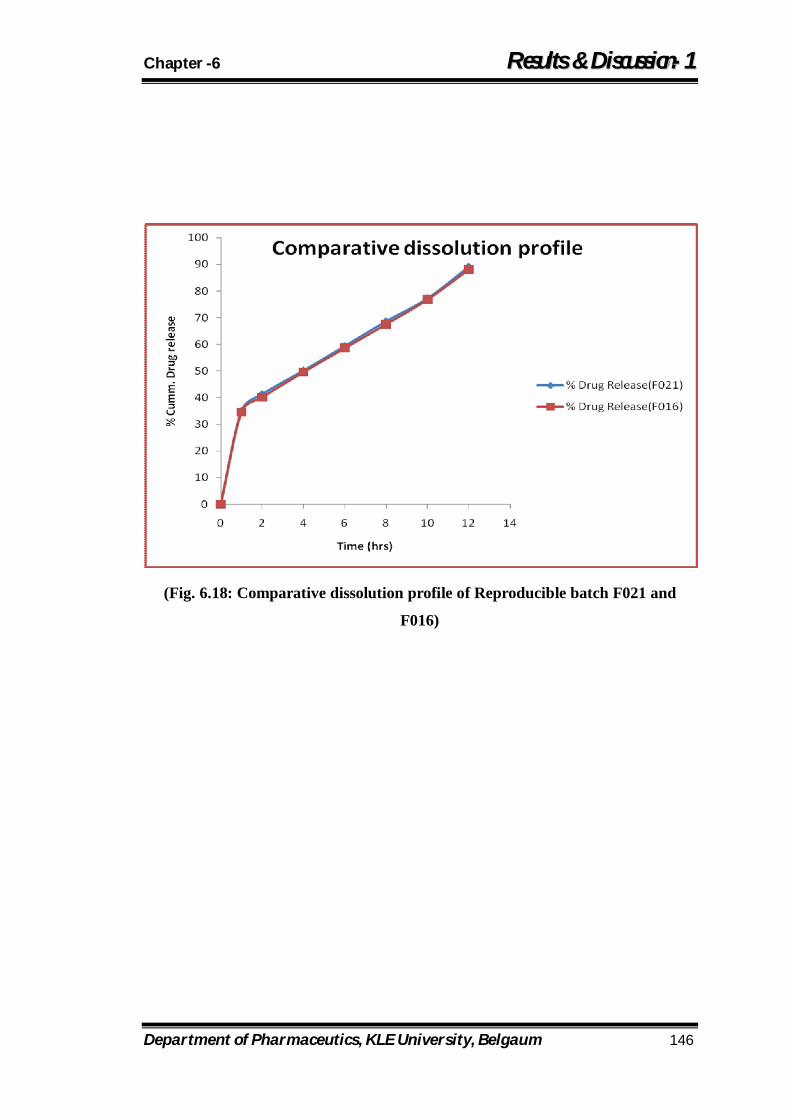
Chapter -6 RReessuullttss && DDiissccuussssiioonn--11
Department of Pharmaceutics, KLE University, Belgaum 146
(Fig. 6.18: Comparative dissolution profile of Reproducible batch F021 and
F016)
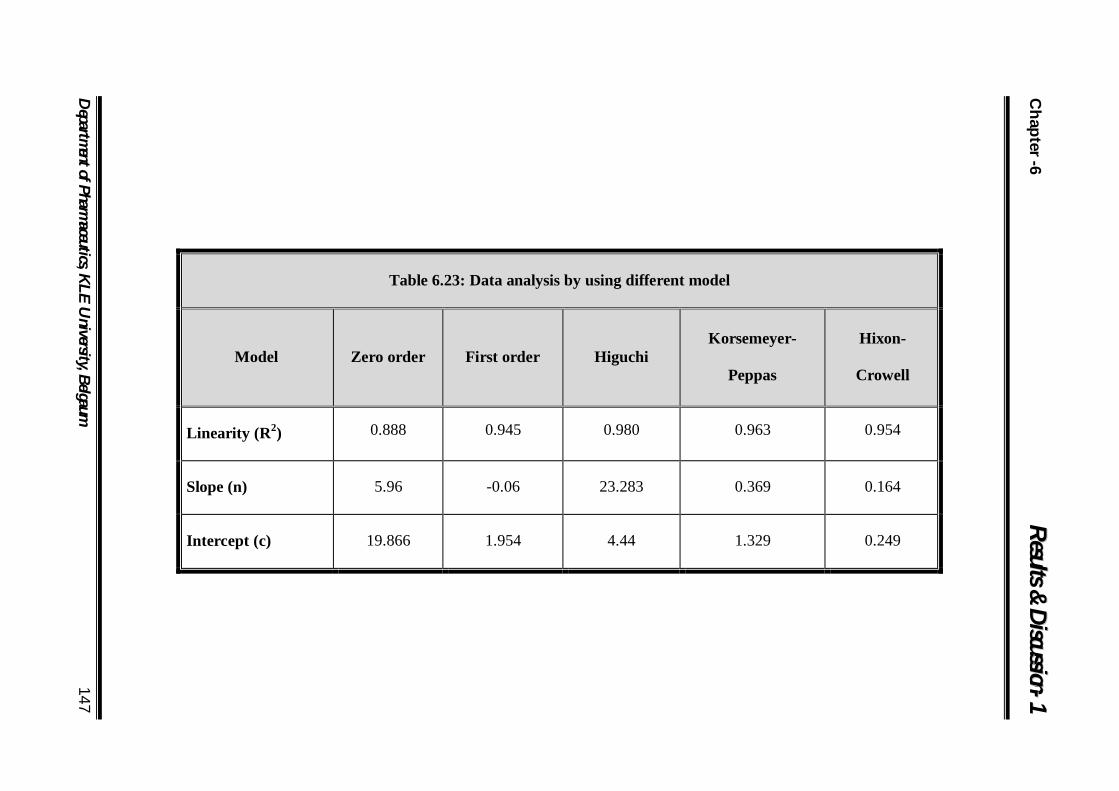
Chapter -6 RR
ee ss uu ll tt ss && DDii ss cc uu ss ss ii oo nn -- 11
Departm
ent of Pharmaceutics, K
LE U
niversity, Belgaum 147
Table 6.23: Data analysis by using different model
Model Zero order First order Higuchi Korsemeyer-
Peppas
Hixon-
Crowell
Linearity (R2) 0.888 0.945 0.980 0.963 0.954
Slope (n) 5.96 -0.06 23.283 0.369 0.164
Intercept (c) 19.866 1.954 4.44 1.329 0.249
Chapter -7 MMaatteerriiaallss && MMeetthhooddoollooggyy--22
Department of Pharmaceutics, KLE University, Belgaum 148
7.1. Aim of the present work
The selected matrix tablet formulation was further coated with rate controlling
polymer to retard the initial time point release so as to match the time points selected
to match with the Innovator’s release profile. Ethyl cellulose was selected as the
polymer and PEG was added as the plasticizer. 3 grades of Ethyl cellulose (i.e., low
viscosity, medium viscosity and high viscosity) were chosen for coating. Coating
parameters were kept fixed and coating variables were changed on trial and error
method. The aim of this study was to further reduce the release rate of selected matrix
formulation with Ethyl Cellulose coating by utilizing 32 x 21 factorial design to the
desired level.
7.2. Coating Process Variables
The processing variable parameters for coating can be divided into two groups:
(1) Independent variables and (2) Dependent variables
7.2.1 Independent Variables
Independent Variables can be considered to have a direct effect on the quality of the
coated materials. These are:
Inlet air Temperature
Spray Atomizing pressure
Blower Speed
Spray Rate
The objective must be to obtain a satisfactorily coated material with minimum coating
time. This means the spray rate optimizing the spray rate with the other three
parameters. It is difficult to reproduce exactly conditions for each experimental run
due to variation in such in-house systems as steam supply and compressed air.

Chapter -7 MMaatteerriiaallss && MMeetthhooddoollooggyy--22
Department of Pharmaceutics, KLE University, Belgaum 149
7.2.2. Dependent Variables
Data can also obtain from those dependent variables which result from the value of
the setting for independent variables. These are:
Dew point of exhaust air
Outlet air temperature
Bed temperature
Coat quality
Detailed consideration of processing variables:
7.2.2.1 Inlet Air Temperature:
The temperature of the inlet air is a processing factor related to both the evaporative
process and to polymer characteristics. In the evaporative sense, the higher the
temperature, the better. The limitation comes in by virtue of polymer properties. In
particular, polymeric dispersions requiring a coalescent mechanism for film formation
will have a low glass transition temperature, which is accomplished by the addition of
plasticizers to the polymer dispersion. The temperature of the incoming air will thus
be limited to the optimal temperature for film formation. Temperature is the prime
consideration in the processing of pharmaceutical polymers. Every polymer has a
distinct set of characteristics that are influenced by temperature or a change in
temperature. The effect of temperature is far reaching, often affecting the mechanical,
physical, and chemical properties of a polymer. The degree of effect will be related to
the polymer properties and the range of temperatures experienced.
The most common and obvious effects are changes in mechanical properties at key
temperatures. The mechanical changes are a physical result of imparting more
mobility to the polymer. These can be subtle effects at points where side groups in the
chain free up, or a more abrupt change when the main chains become mobile. In
Chapter -7 MMaatteerriiaallss && MMeetthhooddoollooggyy--22
Department of Pharmaceutics, KLE University, Belgaum 150
amorphous polymers, the glass transition temperature, Tg, is the temperature at which
a polymer undergoes a change from a glassy to a rubbery elastomer or flexible plastic.
This transition can cause an abrupt change in mechanical properties.
Temperature not only is important in its mechanical effects on the polymer, but also
plays a role in both the physical cohesion and coalescence of colloidal particles and
the adhesion of the polymeric film to the product substrate. As the temperature
increases, the cohesive strength of the polymer and adhesivity of the film to the
substrate increases.
For aqueous polymeric dispersions, higher temperatures will increase the rate of water
evaporation, thus increasing the cohesive force between polymer particles that leads
to coalescence. It stands to reason that if the temperature is too high that this would be
an adverse effect in coating operations, causing droplet spray drying, incomplete
coalescence, and increased porosity to the film, as well as sticking or adhesion of
product during the coating process.
Temperatures may also impact product performance in augmenting a chemical or
physical interaction between the polymer and other substances, including the active
ingredient in the substrate, or with other film components. In addition, temperature
may have an indirect effect on a polymeric film by volatizing vital additives from the
film, such as plasticizers.
7.2.2.2 Outlet Air Temperature
Outlet air temperature is almost always monitored to give information on the
evaporative process taking place. Nozzle occlusions and changes in fluidization
dynamics can often be detected through changes in this temperature. In an air
suspension process, product bed temperature is also monitored because it is the most
sensitive indicator of process changes other than visual monitoring. The product
Chapter -7 MMaatteerriiaallss && MMeetthhooddoollooggyy--22
Department of Pharmaceutics, KLE University, Belgaum 151
temperature reflects the balance between liquid application and water evaporation. If
this temperature is too high or too low, the coating microstructure can be adversely
affected.
7.2.2.3 Spray Rate:
The spray rate at which the polymer solution or dispersion is applied to a solid
substrate is a very important processing factor. Aqueous film coating requires the
uniform application of a polymeric film to the substrate surface, and a well-controlled
evaporation of water from that surface. The equipment design plays a key role in the
success of this process
7.2.2.4 Atomizing Spray Pressure:
Atomization is the process whereby a liquid is broken up into spray droplets.
Atomized droplets hitting the substrate during film coating should be in such a state
that they spread evenly over the surface and form the smooth continuous film of even
thickness. It is very critical parameter in the fluid bed coating process because it
directly affects the droplet size of the coating solution sprayed. The droplet size of the
liquid spray is determined by the atomizing air pressure delivered to the nozzle. The
mean droplets diameter in atomized nozzle configuration is also a function of the
liquid spray volume (air atomization volume ratio). While atomizing air pressure is a
commonly used representation for changing droplet size, the volume ratio can be
mathematically correlated to mean droplet diameter. This allows for scaling up of this
process variable when changing equipment sizes. In order for uniform, precise, and
thin film formation to occur on the substrate surface, the polymer solution or
dispersion must contact all surfaces evenly and evaporate quickly. Consistent droplet
size will result in a more even coating thickness, which, in turn, means that complete

Chapter -7 MMaatteerriiaallss && MMeetthhooddoollooggyy--22
Department of Pharmaceutics, KLE University, Belgaum 152
cover of the material to be coated is obtained with less coating material. Using less
coating materials reduces both the coating time and quantity of heat required as less
solvent to evaporate. The efficiency of the coating process is therefore very dependent
upon the degree of atomization of the spray. The best way for this to be accomplished
is by breaking the liquid into small droplets, with the use of two-fluid atomizers,
hydraulic nozzles, or ultrasonic nozzles for aqueous solution & airless pump for the
nonaqueous coating solution. Higher the atomization pressure, finer the droplet size.
Very small droplets may dry before contacting the substrate, a phenomenon termed
spray drying. Large droplets will overwhelm the evaporative capacity of the system
causing overwetting. This may lead to agglomeration or loss of fluidization in fluid
bed coaters. As a result, it is desirable to control droplet diameter to optimize this
important factor. Droplet size in turn also affects the coat quality.
7.2.2.5 Blower Speed:
Blower speed is the key parameter in fluid bed coating process because proper
fluidization of bed is the function of the blower speed. Other important function of the
blowing air is to enhance the drying of coated materials. And the proper air flow rate
is most important for the successful operation of the process. Since a variety of
particles of differing size, shape and density are encountered; the precise calculation
of the required air flow rate is difficult. Since the bed of material to be coated is
considered to be truly suspended, the pressure drop across the bed must at least
approximate the weight of the bed. Lower the blower speed lesser the pressure drop,
which cause failure or insufficient bed lifting, hence improper fluidization and more
incidence of the agglomeration. Too high blower speed causes increase in air velocity
and does not yield a concomitant increase in the pressure drop. An increase in air
velocity does increase bed expansion, and ultimately at higher velocities pneumatic
Chapter -7 MMaatteerriiaallss && MMeetthhooddoollooggyy--22
Department of Pharmaceutics, KLE University, Belgaum 153
transport occurs. Due to higher pneumatic transport, results in non uniform coating
and less coating efficiency.
7.2.2.6 The Dew Point of the Air:
The dew point of the air must be considered because this air is usually drawn from the
outside environment before it is HEPA filtered, heated, and passed through the
equipment. The amount of moisture in the air may vary significantly from season to
season, and even from day to day. Because air has a given capacity to hold water at a
particular temperature, changes in the dew point of the incoming air will affect the
evaporative efficiency of that air.
The most obvious solution to eliminating this processing factor is to dehumidify the
air. Another solution is to monitor the dew point of the air and adjust other variables
to compensate. This would require a process validation study that would establish
ranges of each variable and the relationship between them.
However, optimization of the process variables will required the dynamic study to
optimization each parameter because each parameter is inter related with the other
parameter. Also it is depend on the instrument configuration. So it is necessary to
determine whether the instrument configuration is designed according to the standard
or not.
7.3. In-vitro drug release profile of Innovator's product:
Drug release studies were carried out using a USP type -II dissolution rate test
apparatus (Apparatus 2, 50 rpm, 37 °C) for 2 hr in 0.1 M HCl (900 ml) as the average
gastric emptying time is about 2 hr. Then the dissolution medium was replaced with
pH-6.8 phosphate buffer (900 ml) and tested for drug release up to complete drug
release. At the end of the time period 10 ml of the samples were taken and analyzed

Chapter -7 MMaatteerriiaallss && MMeetthhooddoollooggyy--22
Department of Pharmaceutics, KLE University, Belgaum 154
for Drug content. A 10 ml Volume of fresh and filtered dissolution medium was
added to make the Volume after each sample withdrawal. Sample was analyzed using
UV spectrophotometer at 275 nm. The results of dissolution are shown in Table 8.1.
7.4. Selection of dissolution time points:
From the above data, 3 time points were selected for % drug release to be fixed in
final formulation product.
Table 7.1: Dissolution time points fixed
Time (hrs) % drug release
2 hrs NMT 10 %
8 hrs 25-60 %
14 hrs NLT 70 %
7.5. Preparation of Coating solution:
A 5% w/v solution of Ethyl Cellulose in Isopropyl Alcohol: Dichloro Methane was
used as a membrane provider. Polyethylene Glycol was used as a plasticizer.
Table 7.2: Coating composition
Ingredients Quantity
Ethyl Cellulose
PEG
Isopropyl Alcohol
Dichloro Methane
Q.S.
Q.S.
80 %
20 %
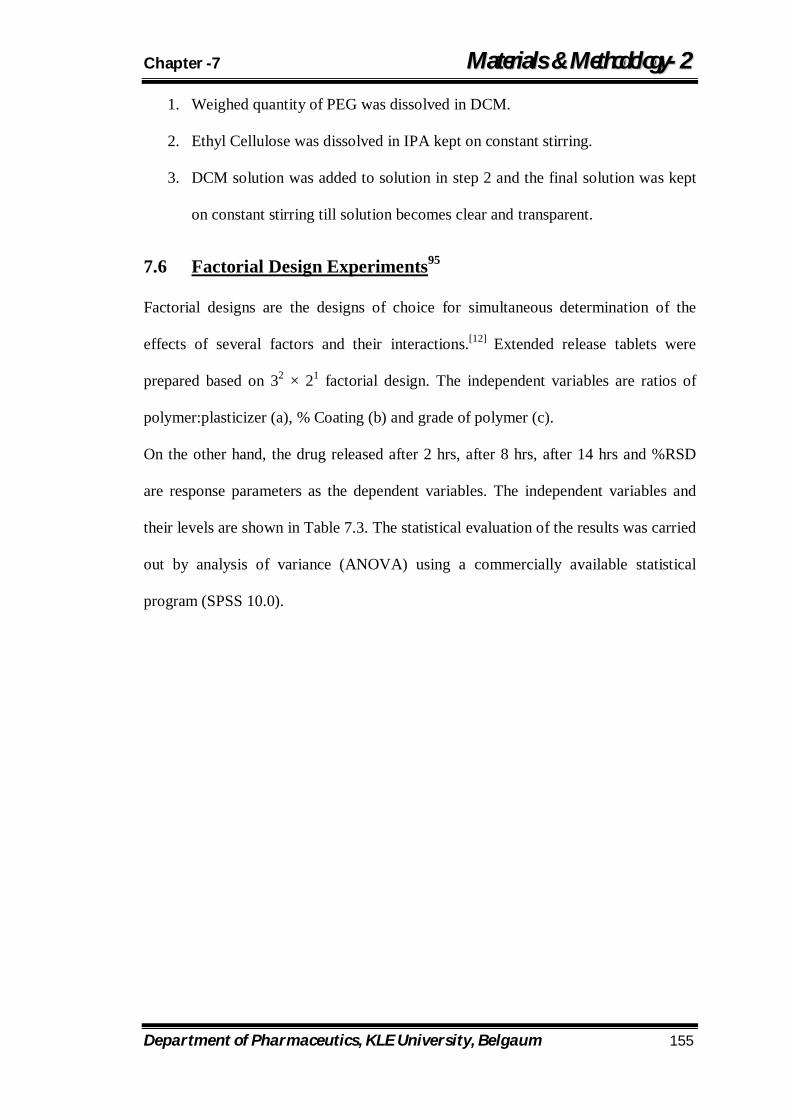
Chapter -7 MMaatteerriiaallss && MMeetthhooddoollooggyy--22
Department of Pharmaceutics, KLE University, Belgaum 155
1. Weighed quantity of PEG was dissolved in DCM.
2. Ethyl Cellulose was dissolved in IPA kept on constant stirring.
3. DCM solution was added to solution in step 2 and the final solution was kept
on constant stirring till solution becomes clear and transparent.
7.6 Factorial Design Experiments95
Factorial designs are the designs of choice for simultaneous determination of the
effects of several factors and their interactions.[12] Extended release tablets were
prepared based on 32 × 21 factorial design. The independent variables are ratios of
polymer:plasticizer (a), % Coating (b) and grade of polymer (c).
On the other hand, the drug released after 2 hrs, after 8 hrs, after 14 hrs and %RSD
are response parameters as the dependent variables. The independent variables and
their levels are shown in Table 7.3. The statistical evaluation of the results was carried
out by analysis of variance (ANOVA) using a commercially available statistical
program (SPSS 10.0).

Chapter -7 MMaatteerriiaallss && MMeetthhooddoollooggyy--22
Department of Pharmaceutics, KLE University, Belgaum 156
Table 7.3: 32 x 21 Factorial Design Layout
Batch
No.
Independent variables
X1 X2 X3
F022 -1 -1 -1
F023 -1 -1 0
F024 -1 0 -1
F025 -1 0 0
F026 -1 1 -1
F027 -1 1 0
F028 0 -1 -1
F029 0 -1 0
F030 0 0 -1
F031 0 0 0
F032 0 1 -1
F033 0 1 0
F034 +1 -1 -1
F035 +1 -1 0
F036 +1 0 -1
F037 +1 0 0
F038 +1 1 -1
F039 +1 1 0
Concentration of Independent variable
Level Ratio of EC : PEG % Coating Grade of EC
-1 80 : 20 8 4 cps
0 70 : 30 10 10 cps
1 60 : 40 12 -
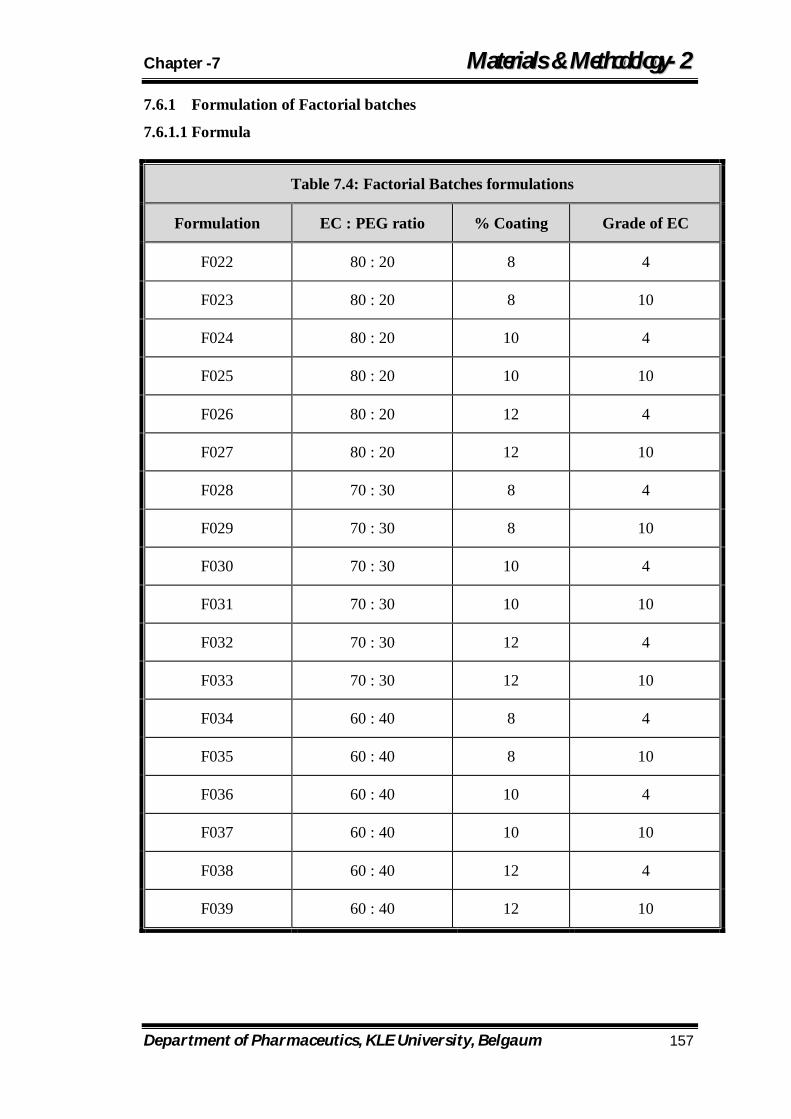
Chapter -7 MMaatteerriiaallss && MMeetthhooddoollooggyy--22
Department of Pharmaceutics, KLE University, Belgaum 157
7.6.1 Formulation of Factorial batches
7.6.1.1 Formula
Table 7.4: Factorial Batches formulations
Formulation EC : PEG ratio % Coating Grade of EC
F022 80 : 20 8 4
F023 80 : 20 8 10
F024 80 : 20 10 4
F025 80 : 20 10 10
F026 80 : 20 12 4
F027 80 : 20 12 10
F028 70 : 30 8 4
F029 70 : 30 8 10
F030 70 : 30 10 4
F031 70 : 30 10 10
F032 70 : 30 12 4
F033 70 : 30 12 10
F034 60 : 40 8 4
F035 60 : 40 8 10
F036 60 : 40 10 4
F037 60 : 40 10 10
F038 60 : 40 12 4
F039 60 : 40 12 10
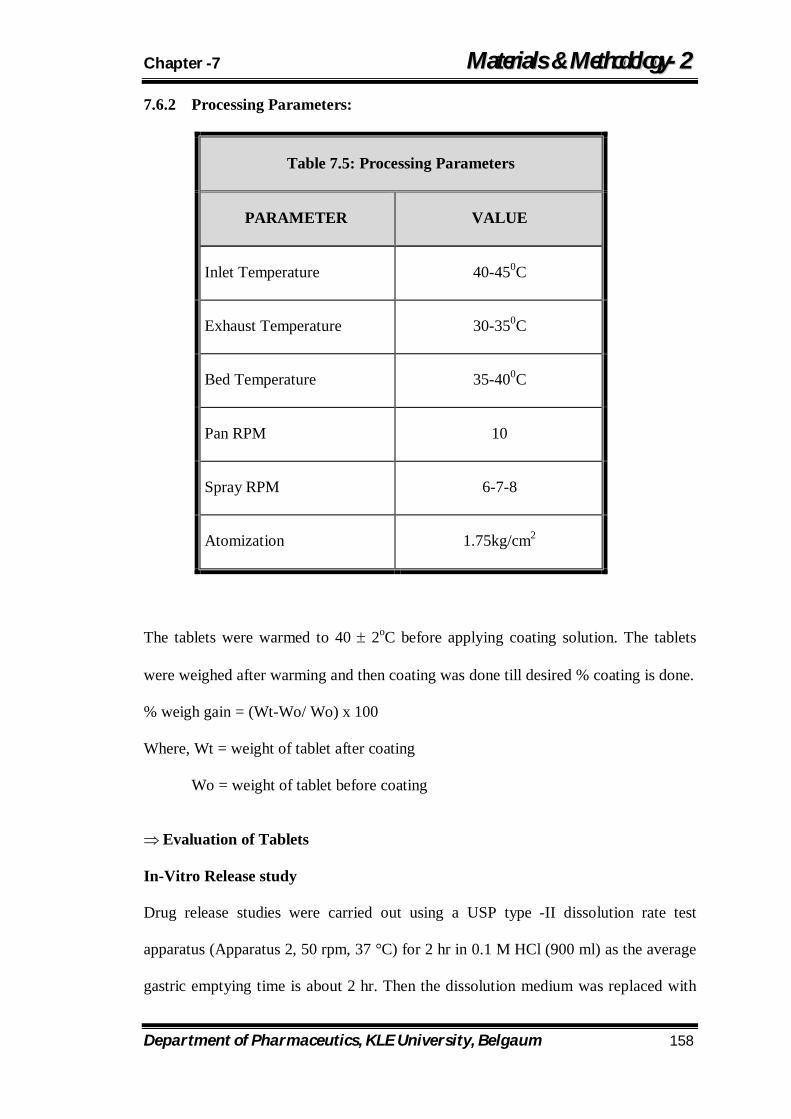
Chapter -7 MMaatteerriiaallss && MMeetthhooddoollooggyy--22
Department of Pharmaceutics, KLE University, Belgaum 158
7.6.2 Processing Parameters:
Table 7.5: Processing Parameters
PARAMETER VALUE
Inlet Temperature 40-450C
Exhaust Temperature 30-350C
Bed Temperature 35-400C
Pan RPM 10
Spray RPM 6-7-8
Atomization 1.75kg/cm2
The tablets were warmed to 40 2oC before applying coating solution. The tablets
were weighed after warming and then coating was done till desired % coating is done.
% weigh gain = (Wt-Wo/ Wo) x 100
Where, Wt = weight of tablet after coating
Wo = weight of tablet before coating
Evaluation of Tablets
In-Vitro Release study
Drug release studies were carried out using a USP type -II dissolution rate test
apparatus (Apparatus 2, 50 rpm, 37 °C) for 2 hr in 0.1 M HCl (900 ml) as the average
gastric emptying time is about 2 hr. Then the dissolution medium was replaced with
Chapter -7 MMaatteerriiaallss && MMeetthhooddoollooggyy--22
Department of Pharmaceutics, KLE University, Belgaum 159
pH-6.8 phosphate buffer (900 ml) and tested for drug release up to complete drug
release. At the end of the time period 10 ml of the samples were taken and analyzed
for Drug content. A 10 ml Volume of fresh and filtered dissolution medium was
added to make the Volume after each sample withdrawal. Sample was analyzed using
UV spectrophotometer at 275 nm.
7.7 Drug release kinetic analysis by using different release model
of Extended release matrix tablet93-94
Drug release kinetics can be analyzed by various mathematical models, which are
applied considering the amounts of drug released from 0 to 24 hour. Following
equations presents the models tested. Depending on these estimations, suitable
mathematical models to describe the dissolution profiles were determined. The
following plots were made: cumulative % drug release versus time (zero-order kinetic
model); log cumulative % drug remaining versus time (first-order kinetic model);
cumulative % drug release versus square root of time (Higuchi model); cube root of
drug % remaining in matrix versus time (Hixson–Crowell cuberoot law)
Zero order kinetic
Drug dissolution from pharmaceutical dosage forms that do not disaggregate and
release the drug slowly (assuming that area does not change and no equilibrium
conditions. are obtained) can be represented by the following equation:
Q1 = Q0 +K0t
Where Q is the amount of drug dissolved in time t, Q is the initial amount of drug in
the solution (most times, Q 50) and K is the zero order release constant.
Chapter -7 MMaatteerriiaallss && MMeetthhooddoollooggyy--22
Department of Pharmaceutics, KLE University, Belgaum 160
First order kinetics:
The application of this model to drug dissolution studies was first proposed by
Gibaldi and Feldman (1967) and later by Wagner (1969). This model has been also
used to describe absorption and/or elimination of some drugs, although it is difficult
to conceptualise this mechanism in a theoretical basis. The following relation can also
express this model:
ln Qt =lnQ0 –k1t
Where Qt is the amount of drug released in time t, Q0 is the initial amount of drug in
the solution and K is the first order release constant. In this way a graphic of the
decimal logarithm of the released amount of drug versus time will be linear. The
pharmaceutical dosage forms following this dissolution profile, such as those
containing water-soluble drugs in porous matrices (Mulye and Turco, 1995), release
the drug in a way that is proportional to the amount of drug remaining in its interior,
in such way, that the amount of drug released by unit of time diminish.
Higuchi model
Higuchi (1961, 1963) developed several theoretical models to study the release of
water soluble and low soluble drugs incorporated in semi-solid and/or solid.
Mathematical expressions were obtained for drug particles dispersed in a uniform
matrix behaving as the diffusion media. In a general way it is possible to resume the
Higuchi model to the following exprssion
Qt = KH t 1/2
Where Qt is amount of drug released in time t and KH is release rate constants.
Higuchi describes drug release as a diffusion process based in the Fick’s law, square
root time dependent. This relation can be used to describe the drug dissolution from
several types
Chapter -7 MMaatteerriiaallss && MMeetthhooddoollooggyy--22
Department of Pharmaceutics, KLE University, Belgaum 161
of modified release pharmaceutical dosage forms, as in the case of some transdermal
systems (Costa et al., 1996) and matrix tablets with water soluble drugs.
Hixon crowell model
Hixson and Crowell (1931) recognizing that the particle regular area is proportional to
the cubic root of its volume derived an equation that can be described in the following
manner:
W0 1/3 – Wt1/3 = Ks t
where W is the initial amount of drug in the pharmaceutical dosage form, W is the
remaining amount of drug in the pharmaceutical dosage form at time t and K is a
constant incorporating the surface– volume relation. This expression applies to
pharmaceutical dosage form such as tablets, where the dissolution occurs in planes
that are parallel to the drug surface if the tablet dimensions diminish proportionally, in
such a manner that the initial geometrical form keeps constant all the time. This
model has been used to describe the release profile keeping in mind the diminishing
surface of the drug particles during the dissolution.
Korsmeyer–Peppas model
Korsmeyer et al. (1983) developed a simple, semiempirical model, relating
exponentially the drug release to the elapsed time (t). An equation that can be
described in the following manner:
Mt / M∞ = atn
where a is a constant incorporating structural and geometric characteristics of the drug
dosage form, n is the release exponent, indicative of the drug release mechanism, and
the function of t is M /M (fractional release of drug). Peppas (1985) used this n value
in order to characterize different release mechanisms, concluding for values for a slab,
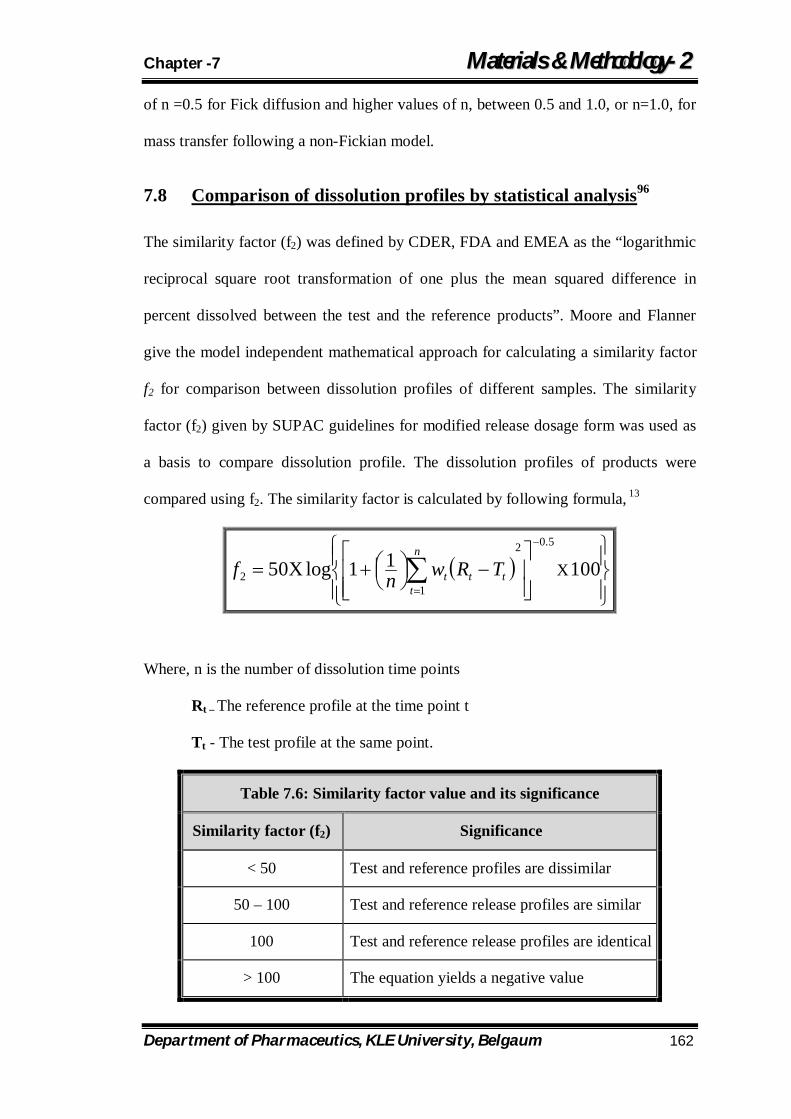
Chapter -7 MMaatteerriiaallss && MMeetthhooddoollooggyy--22
Department of Pharmaceutics, KLE University, Belgaum 162
of n =0.5 for Fick diffusion and higher values of n, between 0.5 and 1.0, or n=1.0, for
mass transfer following a non-Fickian model.
7.8 Comparison of dissolution profiles by statistical analysis96
The similarity factor (f2) was defined by CDER, FDA and EMEA as the “logarithmic
reciprocal square root transformation of one plus the mean squared difference in
percent dissolved between the test and the reference products”. Moore and Flanner
give the model independent mathematical approach for calculating a similarity factor
f2 for comparison between dissolution profiles of different samples. The similarity
factor (f2) given by SUPAC guidelines for modified release dosage form was used as
a basis to compare dissolution profile. The dissolution profiles of products were
compared using f2. The similarity factor is calculated by following formula, 13
10011logX50 X
5.02
12
n
tttt TRwnf
Where, n is the number of dissolution time points
Rt – The reference profile at the time point t
Tt - The test profile at the same point.
Table 7.6: Similarity factor value and its significance
Similarity factor (f2) Significance
< 50 Test and reference profiles are dissimilar
50 – 100 Test and reference release profiles are similar
100 Test and reference release profiles are identical
> 100 The equation yields a negative value
Chapter -7 MMaatteerriiaallss && MMeetthhooddoollooggyy--22
Department of Pharmaceutics, KLE University, Belgaum 163
A value of 100% for the similarity factor suggests that the test and reference profiles
are identical. Values between 50 and 100 indicate that the dissolution profiles are
similar whilst smaller values imply an increase in dissimilarity between release
profiles.14
7.9 Accelerated Stability study97
Optimized batch F037 was packed in blister pack (PVDC – Alu blister packing), and
was placed for stability study at 40˚C/75% RH for 3 months. Sample was collected at
every 1 month interval and evaluated for dissolution in 0.1N HCl, USP- II paddle
apparatus, 50rpm. f2 value was applied to stability study to show the effect of storage
on in-vitro drug release of formulation.
Chapter -8 RReessuullttss && DDiissccuussssiioonn--22
Department of Pharmaceutics, KLE University, Belgaum 164
8.1 In–Vitro Release study of Innovator
The Innovator’s tablets were subjected for in vitro dissolution studies using
dissolution test apparatus USP XXIII. The dissolution medium used was pH 1.2 for
initial 2 hrs as average gastric emptying time of stomach is 2 hrs and rest was carried
out in pH 6.8 phosphate buffer solution to study the release of drug. The samples were
withdrawn at different intervals of time and analyzed at 275nm using UV
Spectrophotometer. Cumulative percentage drug release was calculated on the basis
of average amount of drug present in the dissolution chamber. The results obtained in
the in-vitro drug release study are tabulated in Table 8.1. The cumulative percentage
of drug released as a function of time for all the formulations are shown in Figure
6.10. From the in-vitro drug release profile data of Innovator’s product, three time
points were fixed for the generic product’s dissolution to match the release profile
with Innovator.
8.2 Formulation of Factorial batches
8.2.1 Coating with EC 4 cps
8.2.1.1 Cumulative % drug release profile of tablets coated using 80:20 ratio of
polymer:plasticizer
All the formulations prepared were subjected for in vitro dissolution studies using
dissolution test apparatus USP XXIII. The results of in-vitro dissolution study of trial
batches F022, F024 and F026 which were coated using polymer:plasticizer ratio of
80:20 is shown in the Table 8.2 and comparative dissolution profile was shown in
Figure 8.1. Formulation F022, F024 and F026 which were coated for 8%, 10% and
12% respectively showed 24, 23 and 21% drug release after initial time point of 2 hrs,
54, 54 and 56% drug release after 8 hrs and 73, 72and 68% drug release after 14 hrs.
Chapter -8 RReessuullttss && DDiissccuussssiioonn--22
Department of Pharmaceutics, KLE University, Belgaum 165
However, % RSD for all the time points was found to be much higher than accepted
level. This may be due to uneven coating on tablet surface or may be because of
uneven distribution of polymer as the polymer concentration is much higher i.e.,
80:20 ratio of polymer:plasticizer. Further study was carried out by increasing the
level of plasticizer and ratio of polymer:plasticizer was taken as 70:30. So the study
was further continued to optimize the ratio of polymer:plasticzer and % coating to
bring the level of %RSD in acceptable range and to achieve drug release in desired
range.
8.2.1.2 Cumulative % drug release profile of tablets coated using 70:30 ratio of
polymer:plasticizer
All the formulations prepared were subjected for in vitro dissolution studies using
dissolution test apparatus USP XXIII. The results of in-vitro dissolution study of trial
batches F028, F030 and F032 which were coated using polymer:plasticizer ratio of
70:30 is shown in the Table 8.3 and comparative dissolution profile was shown in
Figure 8.2. Formulation F028, F030 and F032 which were coated for 8%, 10% and
12% respectively showed 29, 28 and 27% drug release after initial time point of 2 hrs,
54, 58 and 52% drug release after 8 hrs and 81, 79and 76% drug release after 14 hrs.
However, % RSD for all the time points decreased as compared to the above
formulations where tablets were coated with 80:20 ratio of polymer:plasticizer, but
still found to be much higher than accepted level. This may again be due to uneven
coating on tablet surface or may be because of uneven distribution of polymer as the
polymer concentration is much higher i.e., 70:30 ratio of polymer:plasticizer. Further
study was carried out by increasing the level of plasticizer and ratio of
polymer:plasticizer was taken as 60:40. So the study was further continued to
Chapter -8 RReessuullttss && DDiissccuussssiioonn--22
Department of Pharmaceutics, KLE University, Belgaum 166
optimize the ratio of polymer:plasticzer and % coating to bring the level of %RSD in
acceptable range and to achieve drug release in desired range.
8.2.1.3 Cumulative % drug release profile of tablets coated using 60:40 ratio of
polymer:plasticizer
All the formulations prepared were subjected for in vitro dissolution studies using
dissolution test apparatus USP XXIII. The results of in-vitro dissolution study of trial
batches F034, F036 and F038 which were coated using polymer:plasticizer ratio of
60:40 is shown in the Table 8.4 and comparative dissolution profile was shown in
Figure 8.3. Formulation F034, F036 and F038 which were coated for 8%, 10% and
12% respectively showed 34, 32 and 31% drug release after initial time point of 2 hrs,
65, 61 and 56% drug release after 8 hrs and 89, 85and 83% drug release after 14 hrs.
% RSD for all the time points decreased as compared to all the above formulations
where tablets were coated with 80:20 ratio and 70:30 ratio of polymer:plasticizer, and
was found to be in the accepted level. But from the dissolution study; none of the
formulations could control the initial time point release. Further study was carried out
by changing the grade of polymer to EC 10 cps. So the study was further continued to
optimize the ratio of polymer:plasticzer and % coating to bring the drug release in the
desired level after selected time points.
8.2.2 Coating with EC 10 cps
8.2.2.1 Cumulative % drug release profile of tablets coated using 80:20 ratio of
polymer:plasticizer
All the formulations prepared were subjected for in vitro dissolution studies using
dissolution test apparatus USP XXIII. The results of in-vitro dissolution study of trial
batches F022, F024 and F026 which were coated using polymer:plasticizer ratio of
Chapter -8 RReessuullttss && DDiissccuussssiioonn--22
Department of Pharmaceutics, KLE University, Belgaum 167
80:20 is shown in the Table 8.5 and comparative dissolution profile was shown in
Figure 8.4. Formulation F023, F025 and F027 which were coated for 8%, 10% and
12% respectively showed 0.3, 0 and 0% drug release after initial time point of 2 hrs,
21.6, 5.9 and 0% drug release after 8 hrs and 42.8, 14.6 and 19.5% drug release after
14 hrs. However, % RSD for all the time points was found to be much higher than
accepted level. Also, the drug release does not fit in the desired fixed level. Hence,
further study was decided to perform using 70:30 ratio of polymer:plasticizer using
EC 10 cps.
8.2.2.2 Cumulative % drug release profile of tablets coated using 70:30 ratio of
polymer:plasticizer
The results of in-vitro dissolution study of trial batches F029, F031 and F033 which
were coated using polymer:plasticizer ratio of 70:30 is shown in the Table 8.6 and
comparative dissolution profile was shown in Figure 8.5. Formulation F029, F031 and
F033 which were coated for 8%, 10% and 12% respectively showed 1.6, 0.9 and 0.5%
drug release after initial time point of 2 hrs, 23.6, 18.6 and 16.8% drug release after 8
hrs and 48.5, 41.5 and 40.5% drug release after 14 hrs. However, the drug release
does not fit in the desired fixed level. Also, the % RSD level was found to decrease to
the accepted range as the level of polymer decreases and as % coating on tablets
increases. Hence, further study was decided to perform using 60:40 ratio of
polymer:plasticizer using EC 10 cps.
8.2.2.3 Cumulative % drug release profile of tablets coated using 60:40 ratio of
polymer:plasticizer
The results of in-vitro dissolution study of trial batches F035, F037 and F039 which
were coated using polymer:plasticizer ratio of 60:40 is shown in the Table 8.7 and
Chapter -8 RReessuullttss && DDiissccuussssiioonn--22
Department of Pharmaceutics, KLE University, Belgaum 168
comparative dissolution profile was shown in Figure 8.6. Formulation F029, F031 and
F033 which were coated for 8%, 10% and 12% respectively showed 10.3, 7.8 and
5.7% drug release after initial time point of 2 hrs, 53.7, 54.8 and 54% drug release
after 8 hrs and 78.9, 76.6 and 75.9% drug release after 14 hrs. From the in-vitro drug
release data of the tablets coated with EC 10 cps using polymer:plasticizer ratio of
60:40, it was found that formulations F037 and F039 shows the release as per our
required range and also the % RSD was well in the accepted range. From the above
two formulations, formulation F037 was selected to proceed further with stability
studies as the drug release after 20 hrs of dissolution study was found to be 95.8% in
case of F037, whereas; it was just 89.2% in case of F039.
8.3 Drug release kinetic analysis by using different release model of
Extended release matrix tablet
To know the mechanism of drug release from the best formulations, the data were
treated according to first-order (log cumulative percentage of drug remaining vs time),
Higuchi’s15 (cumulative percentage of drug released vs square root of time),
Korsmeyer et al’s16 (log cumulative percentage of drug released vs log time), Hixon-
Crowell’s (cube root of % drug retained vs time) equations along with zero order
(cumulative amount of drug released vs time) pattern the results shown in Table 8.8.
The in vitro release profiles of drug from the best formulation could be best expressed
by zero order, as the plots showed high linearity (R2 = 0.966, Table 5.33). To confirm
the mechanism of release, data were fit to other model equations. The formulation
could be best described by Hixon-Crowell’s equation, as the plot showed high
linearity (R2: 0.987).
Chapter -8 RReessuullttss && DDiissccuussssiioonn--22
Department of Pharmaceutics, KLE University, Belgaum 169
8.4 Accelerated Stability study
The result of accelerated stability study showed that there was no change in the
formulation after 3 months. In-vitro drug release study show that after 1, 2 and 3
month, f2 value obtained was 77.35, 84.94and 73.17 respectively. The drug release
through out 24 hours obtained within range of targeted release profile. The related
substance results showed that individual maximum impurity below 0.5% and total
maximum impurity below 1.0%. After 3 month accelerated stability study the assay
result was stable. The results are shown in Table 8.9 and dissolution plots are shown
in Figure 8.7.
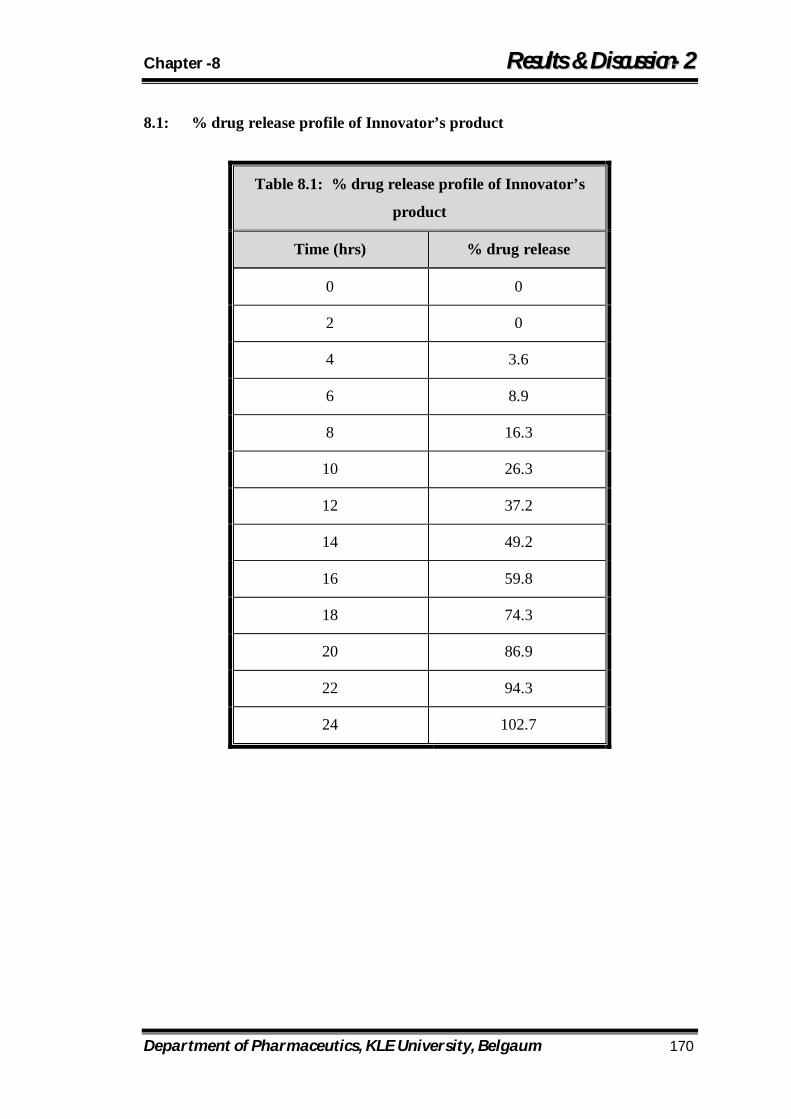
Chapter -8 RReessuullttss && DDiissccuussssiioonn--22
Department of Pharmaceutics, KLE University, Belgaum 170
8.1: % drug release profile of Innovator’s product
Table 8.1: % drug release profile of Innovator’s
product
Time (hrs) % drug release
0 0
2 0
4 3.6
6 8.9
8 16.3
10 26.3
12 37.2
14 49.2
16 59.8
18 74.3
20 86.9
22 94.3
24 102.7

Chapter -8 RReessuullttss && DDiissccuussssiioonn--22
Department of Pharmaceutics, KLE University, Belgaum 171
Table 8.2: Cumulative % drug release from tablets coated using 80:20 ratio of polymer:plasticizer
Time (Hr) F022 % RSD F024 % RSD F026 % RSD
0 0 0 0 0 0 0
2 24 121.3 23 117 21 76.2
8 54 42.3 54 37.6 56 31.9
14 73 26 72 20.3 68 23.8
20 94 16.9 89 15.6 85 13.9
(Figure 8.1: Dissolution profile of tablets coated with EC 4cps using 80:20 ratio
of EC: PEG)
0
10
20
30
40
50
60
70
80
90
100
0 5 10 15 20 25
% d
rug
rele
ase
Time (hrs)
F022
F024
F026
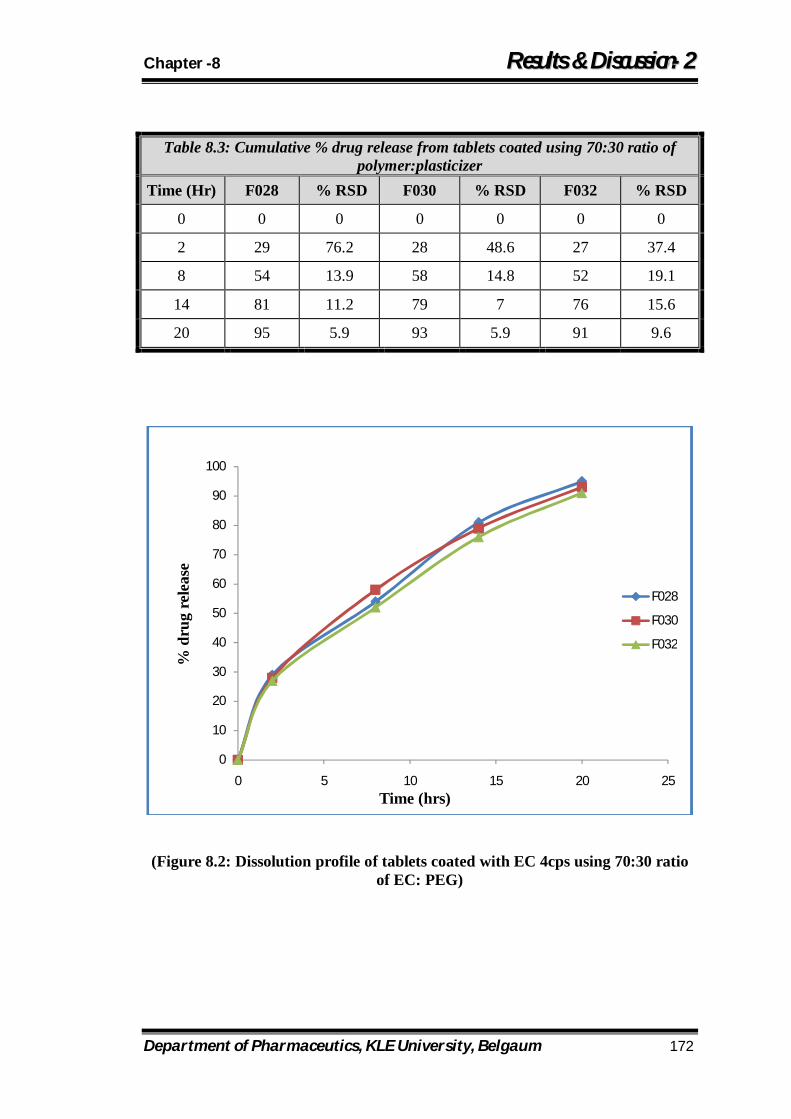
Chapter -8 RReessuullttss && DDiissccuussssiioonn--22
Department of Pharmaceutics, KLE University, Belgaum 172
Table 8.3: Cumulative % drug release from tablets coated using 70:30 ratio of polymer:plasticizer
Time (Hr) F028 % RSD F030 % RSD F032 % RSD
0 0 0 0 0 0 0
2 29 76.2 28 48.6 27 37.4
8 54 13.9 58 14.8 52 19.1
14 81 11.2 79 7 76 15.6
20 95 5.9 93 5.9 91 9.6
(Figure 8.2: Dissolution profile of tablets coated with EC 4cps using 70:30 ratio
of EC: PEG)
0
10
20
30
40
50
60
70
80
90
100
0 5 10 15 20 25
% d
rug
rele
ase
Time (hrs)
F028
F030
F032
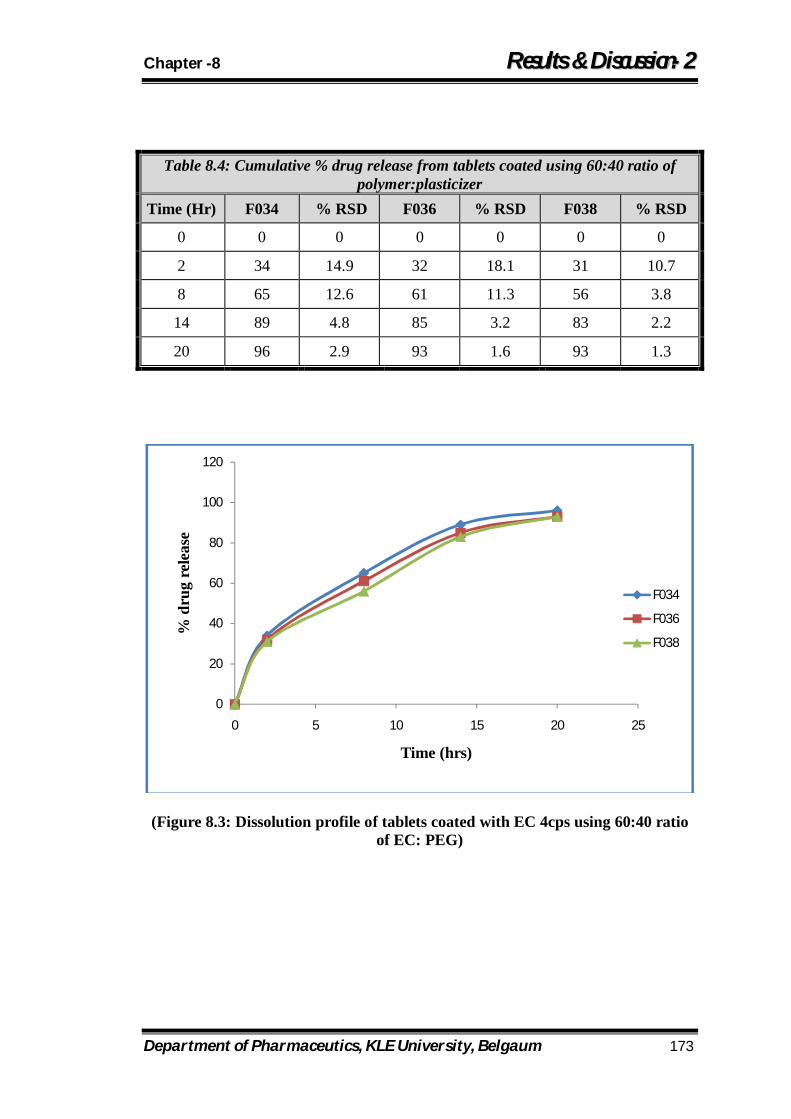
Chapter -8 RReessuullttss && DDiissccuussssiioonn--22
Department of Pharmaceutics, KLE University, Belgaum 173
Table 8.4: Cumulative % drug release from tablets coated using 60:40 ratio of polymer:plasticizer
Time (Hr) F034 % RSD F036 % RSD F038 % RSD
0 0 0 0 0 0 0
2 34 14.9 32 18.1 31 10.7
8 65 12.6 61 11.3 56 3.8
14 89 4.8 85 3.2 83 2.2
20 96 2.9 93 1.6 93 1.3
(Figure 8.3: Dissolution profile of tablets coated with EC 4cps using 60:40 ratio
of EC: PEG)
0
20
40
60
80
100
120
0 5 10 15 20 25
% d
rug
rele
ase
Time (hrs)
F034
F036
F038
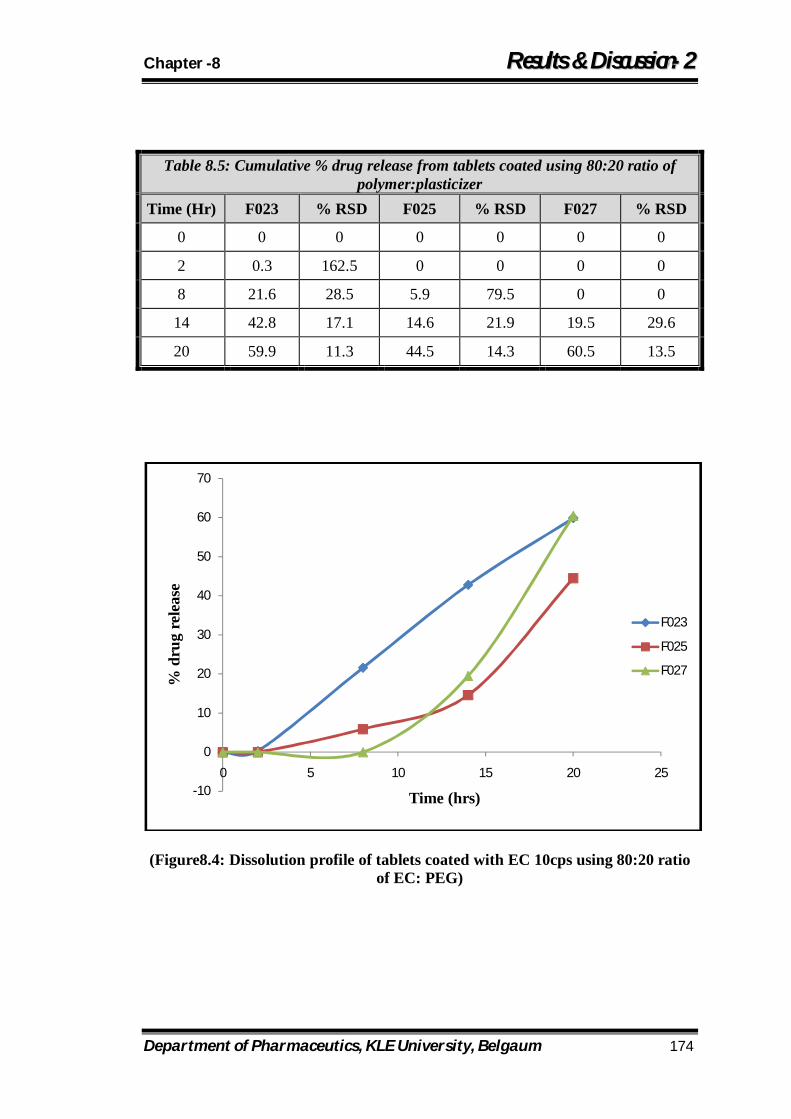
Chapter -8 RReessuullttss && DDiissccuussssiioonn--22
Department of Pharmaceutics, KLE University, Belgaum 174
Table 8.5: Cumulative % drug release from tablets coated using 80:20 ratio of polymer:plasticizer
Time (Hr) F023 % RSD F025 % RSD F027 % RSD
0 0 0 0 0 0 0
2 0.3 162.5 0 0 0 0
8 21.6 28.5 5.9 79.5 0 0
14 42.8 17.1 14.6 21.9 19.5 29.6
20 59.9 11.3 44.5 14.3 60.5 13.5
(Figure8.4: Dissolution profile of tablets coated with EC 10cps using 80:20 ratio
of EC: PEG)
-10
0
10
20
30
40
50
60
70
0 5 10 15 20 25
% d
rug
rele
ase
Time (hrs)
F023
F025
F027
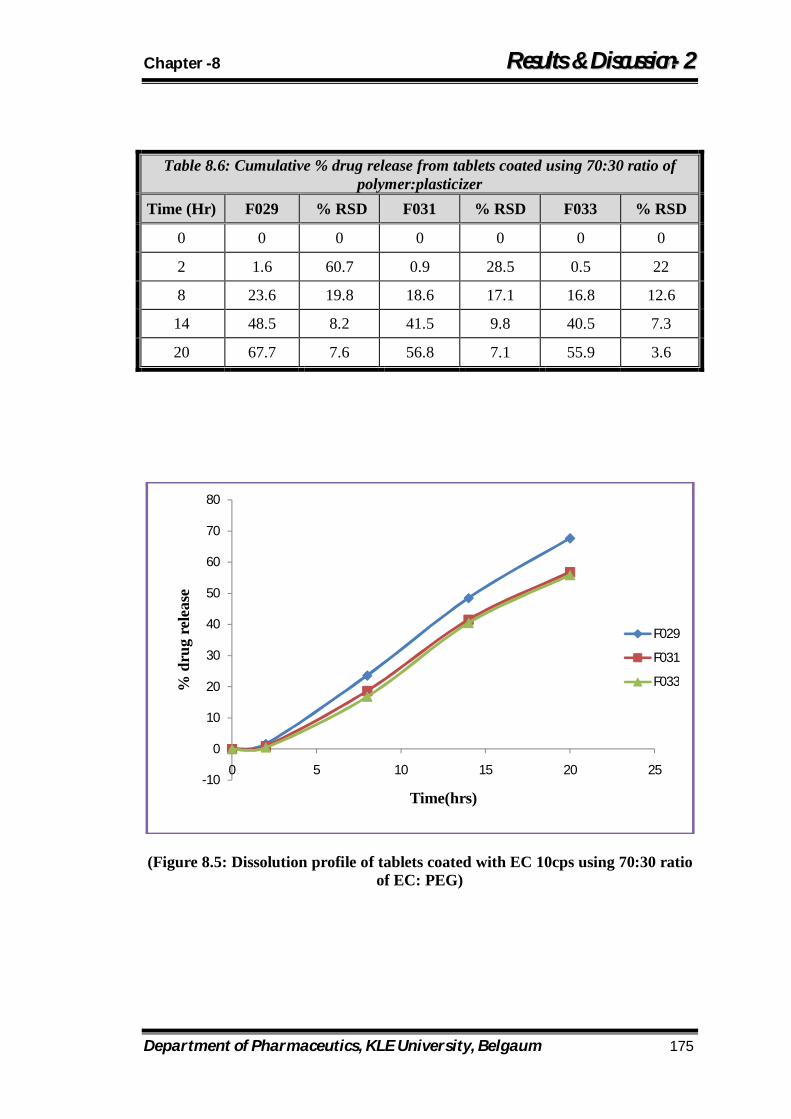
Chapter -8 RReessuullttss && DDiissccuussssiioonn--22
Department of Pharmaceutics, KLE University, Belgaum 175
Table 8.6: Cumulative % drug release from tablets coated using 70:30 ratio of polymer:plasticizer
Time (Hr) F029 % RSD F031 % RSD F033 % RSD
0 0 0 0 0 0 0
2 1.6 60.7 0.9 28.5 0.5 22
8 23.6 19.8 18.6 17.1 16.8 12.6
14 48.5 8.2 41.5 9.8 40.5 7.3
20 67.7 7.6 56.8 7.1 55.9 3.6
(Figure 8.5: Dissolution profile of tablets coated with EC 10cps using 70:30 ratio
of EC: PEG)
-10
0
10
20
30
40
50
60
70
80
0 5 10 15 20 25
% d
rug
rele
ase
Time(hrs)
F029
F031
F033
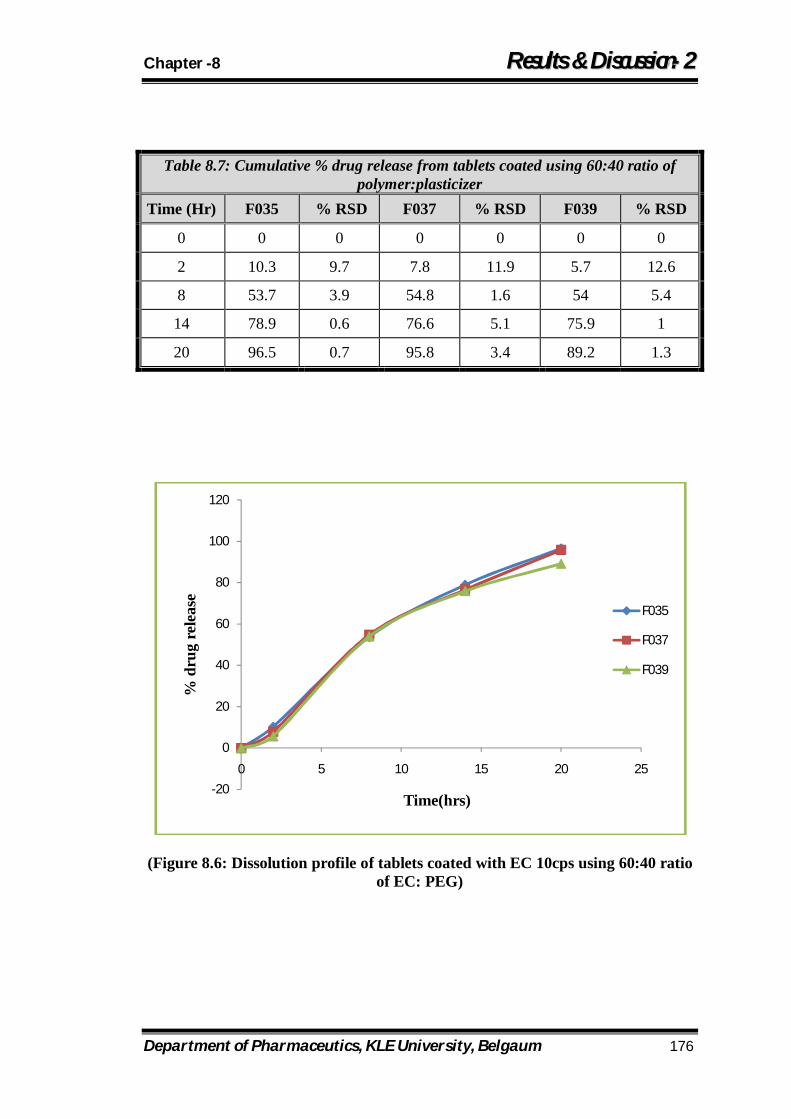
Chapter -8 RReessuullttss && DDiissccuussssiioonn--22
Department of Pharmaceutics, KLE University, Belgaum 176
Table 8.7: Cumulative % drug release from tablets coated using 60:40 ratio of polymer:plasticizer
Time (Hr) F035 % RSD F037 % RSD F039 % RSD
0 0 0 0 0 0 0
2 10.3 9.7 7.8 11.9 5.7 12.6
8 53.7 3.9 54.8 1.6 54 5.4
14 78.9 0.6 76.6 5.1 75.9 1
20 96.5 0.7 95.8 3.4 89.2 1.3
(Figure 8.6: Dissolution profile of tablets coated with EC 10cps using 60:40 ratio
of EC: PEG)
-20
0
20
40
60
80
100
120
0 5 10 15 20 25
% d
rug
rele
ase
Time(hrs)
F035
F037
F039
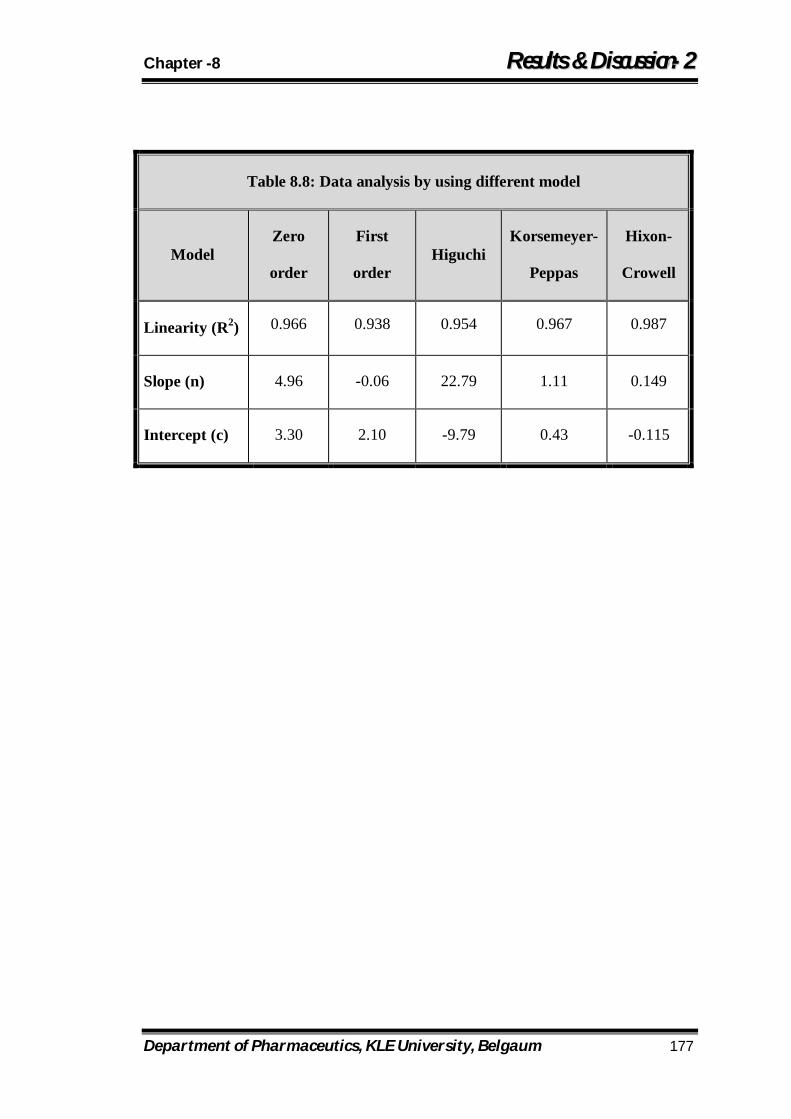
Chapter -8 RReessuullttss && DDiissccuussssiioonn--22
Department of Pharmaceutics, KLE University, Belgaum 177
Table 8.8: Data analysis by using different model
Model Zero
order
First
order Higuchi
Korsemeyer-
Peppas
Hixon-
Crowell
Linearity (R2) 0.966 0.938 0.954 0.967 0.987
Slope (n) 4.96 -0.06 22.79 1.11 0.149
Intercept (c) 3.30 2.10 -9.79 0.43 -0.115
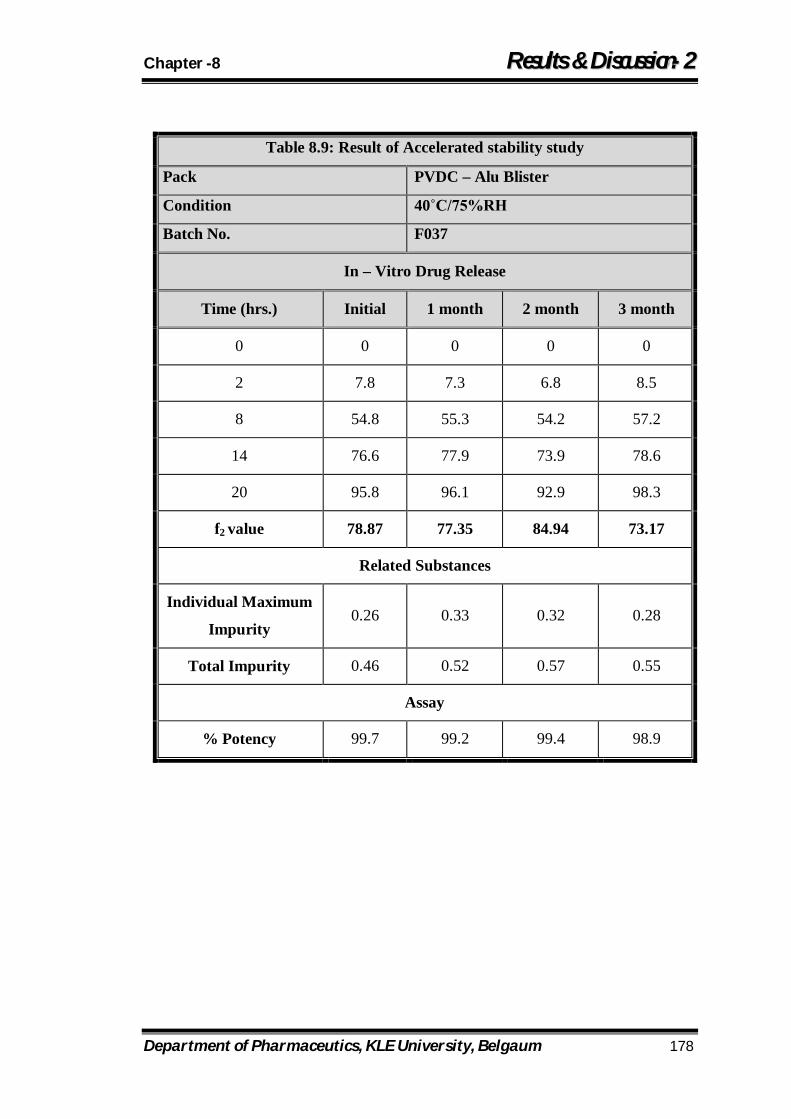
Chapter -8 RReessuullttss && DDiissccuussssiioonn--22
Department of Pharmaceutics, KLE University, Belgaum 178
Table 8.9: Result of Accelerated stability study
Pack PVDC – Alu Blister
Condition 40˚C/75%RH
Batch No. F037
In – Vitro Drug Release
Time (hrs.) Initial 1 month 2 month 3 month
0 0 0 0 0
2 7.8 7.3 6.8 8.5
8 54.8 55.3 54.2 57.2
14 76.6 77.9 73.9 78.6
20 95.8 96.1 92.9 98.3
f2 value 78.87 77.35 84.94 73.17
Related Substances
Individual Maximum
Impurity 0.26 0.33 0.32 0.28
Total Impurity 0.46 0.52 0.57 0.55
Assay
% Potency 99.7 99.2 99.4 98.9
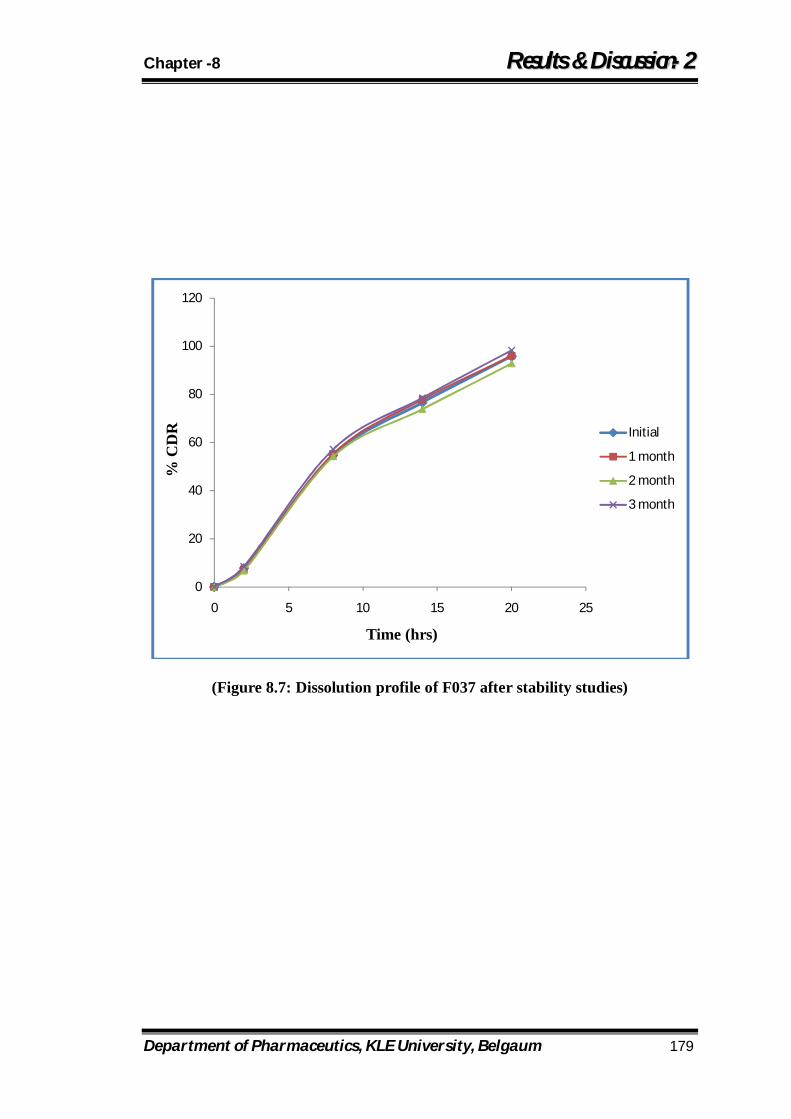
Chapter -8 RReessuullttss && DDiissccuussssiioonn--22
Department of Pharmaceutics, KLE University, Belgaum 179
(Figure 8.7: Dissolution profile of F037 after stability studies)
0
20
40
60
80
100
120
0 5 10 15 20 25
% C
DR
Time (hrs)
Initial
1 month
2 month
3 month
Chapter -9 CCoonncclluussiioonn
Department of Pharmaceutics, KLE University, Belgaum 180
CONCLUSION:
1. The aim of Present work was to prepare extended release tablets of novel anti
depressant drug.
2. HPMC and PEO were selected to control the release of drug from the matrix
system.
3. Preliminary trials were done to optimize the level of HPMC and PEO to form the
matrix tablet.
4. 32 full factorial design was applied to obtain a validated ratio of polymers which
can control the release rate and polymer concentrations were taken as factors
(HPMC was kept as X1 and PEO was kept as X2).
5. The batches were formulated and checked for all the related parameters. Drug
release after 2 hrs (Y1), release after 6 hrs (Y2) and drug release after 10 hrs (Y3)
were taken as dependant variables.
6. Surface plots were performed to validate the batches.
7. The drug release followed Anomalous Fickian diffusion; which indiacates a
coupling of diffusion and erosion mechanism.
8. Optimized matrix tablet formulation was further coated with Ethyl Cellulose using
PEG as a plasticizer in different ratios and for different weight gain to control the
release upto the desired level.
9. 32 x 21 factorial design was applied to obtain a validated ratio of
polymer:plasticizer, % coating and also grade of Ethyl cellulose to be used to
control the release keeping %RSD in the limit (Ratio of Polymer:Plasticizer as
X1, % coating as X2 and grade of Ethyl Cellulose as X3).
Chapter -9 CCoonncclluussiioonn
Department of Pharmaceutics, KLE University, Belgaum 181
10. The batches were formulated and checked for all the related parameters and
release obtained for each formulation was compared with the levels fixed keeping
a watch on %RSD.
11. Final batch F037 was selected for accelerated stability study and kinetic modeling
for drug release.
12. The drug release followed by zero order with diffusion mechanism.
13. The formulation was stable after 3 months of stability study.

Chapter -10 SSuummmmaarryy
Department of Pharmaceutics, KLE University, Belgaum 182
Summary:
Depression is the most common affective disorder and affects as many as 1 in 4
people in their teen years. Anti depressants are the classes of drugs which can elevate
mood in depressive illness. But all Anti depressant drugs have various side-effects
such as sedation, hypotension, cardiac arrhythmias, seizure precipitation, enzyme
inhibitory action, dose related CNS toxicity, renal diabetes insipidus, loss of libido
and failure or orgasm. Hence, there is a need for the development of a formulation
containing new anti-depressant drug. By preparing extended release formulation of
the drug dosage frequency can be reduced, optimized and controlled therapy can be
achieved and also it has better patient compliance.
Preliminary trials of matrix tablet:
Attempts were made for preparation of matrix tablet by HPMC which is most widely
used matrix-forming polymer because of its compatibility, multifunctional property
and low cost and also by PEO which provides delayed drug release via the
hydrophilic matrix approach. Combination of HPMC and PEO was also used for
preparation of matrix tablet. Results of Preformulation studies of the drug indicated
that, it had poor flow property and compressibility property. To improve the flow and
compressibility property, it was beneficial to use the directly compressible grade
components in the formulation of tablet. Results of DSC study shown that there is no
change in drug’s melting peak after the preparation of tablet.
The preliminary trials were taken by using single polymer HPMC and PEO. The
results of PEO indicate that the drug release obtained was faster than the required
drug release. By using HPMC initial slower drug release and than after faster drug
release was obtained. Hydrophilic matrix of HPMC and PEO in combination,

Chapter -10 SSuummmmaarryy
Department of Pharmaceutics, KLE University, Belgaum 183
sustained the drug release effectively for 12h. The result indicated that the
combination of HPMC and PEO can be successfully utilized to create matrix tablet,
but the targeted release profile was not achieved even with the combination.
Preliminary trials of Coating with Ethyl cellulose:
The optimized matrix tablet formulation was then coated with Ethyl Cellulose
polymer using PEG as plasticizer. Different ratios of Polymer:Plasticizer (viz., 80:20,
70:30 and 60:40) were evaluated to achieve the desired release profile. Tablets were
coated for different % weight gain and evaluated for release profile. Two different
grades of Ethyl Cellulose were used for same ratios and % weight gain to obtain the
desired release profile.
The results indicated that ratio of polymer:plasticizer and % weight gain had
significant effect on %RSD in release profile. Ethyl cellulose 4 cps failed to control
the release in desired level and Ethyl cellulose 10 cps successfully controlled the
release for 24 hrs and the release profile obtained was similar to the targeted release
profile.
6.2 Formulation and Optimization of Sustained release matrix tablets by using
32 full factorial designs
On the basis of the preliminary trials in the present study a 32 full factorial design was
employed to study the effect of independent variables, i.e. concentration of HPMC
(X1) and concentration of PEO (X2) on dependent variables like % drug release Q2, Q6
and Q10. Drug release is also dependent on the size of matrix tablets so, size and
surface area was kept constant. The strength of the gel depends on the chemical
structure and molecular size of the polymer. It is known that higher viscosity grade
polymer HPMC hydrates at faster rate and therefore, it is capable of forming gel
Chapter -10 SSuummmmaarryy
Department of Pharmaceutics, KLE University, Belgaum 184
structure than a low viscosity grade PEO polymer. The co-efficients of X1 and X2
were negative indicate that when concentration of both the variable increase than drug
release was decreased. From the result of 32 full factorial design and regression
analysis for Extended release matrix tablet, it was concluded that factorial batch F016
taken with combination of 35% HPMC and 35% PEO gives better sustaining capacity
than all other combinations.
In present study to check the reproducibility, batch taken with larger batch size and
evaluated for reproducibility. From the result, concluded that reproducible batch taken
with 35% HPMC and 35% PEO had good reproducibility. The result of regression
analysis showed that all the co-efficient bear a negative sign, which indicate that by
increasing the concentration of both the polymers the drug release was sustained. The
drug release followed Higuchi’s model with n value 0.369, which indicate a coupling
of diffusion and erosion mechanisms so called anomalous diffusion. The higher value
of correlation co-efficient of Q2, Q6, and Q10 indicate that a good fit i.e., good
agreement between the dependent and independent variables.
Formulation F037, containing coating of tablets with EC 10cps using 60:40 ratio of
polymer:plasticizer and 10% coating was selected as best formulation and kept for
stability studies according ICH guidelines. From the stability result, it was found that
there was no change in the formulation after 3 months of accelerated stability study
and the prepared formulation was stable.
Chapter -11 BBiibblliiooggrraapphhyy
Department of Pharmaceutics, KLE University, Belgaum 185
BIBLIOGRAPHY:
1. Chien YW. Novel Drug delivery systems. Second edition (Revised & Expanded),
Marcel Dekker Inc 1992 160- 64, 139-96.
2. Ghosh TK, Jasti BR. Theory and practice of contemporary pharmaceutics. CRC
press; 2005, 282-367, 150-155.
3. Kasture PV, Parakh SR, Gokhale SB, Hasan SA. Pharmaceutics-I. Nirali
prakashan; 1993, 2-3.
4. http://www.australianprescriber.com/magazine.
5. H C Ansel, L V Allen, Jr. N C Popovich, Pharmaceutical dosage forms and drug
delivery systems., Lippincott Williams and Wilkins; Baltimore 7th
edition. 2000:
231.
6. Higuchi T., Mechanism of Sustained Action Medication: Theoretical Analysis of
Rate of Release of Solid Drugs Dispersed in Solid Matrices; Journal of
Pharmaceutical Science; 1963; 52; 1145-1149. (26)
7. Jantzen, GM., Robinson JR., Sustained- and Controlled-Release Drug Delivery
Systems in Modern Pharmaceutics; (Banker G., Rhodes, C. Edts). Marcel Dekker
Inc.; 1996; 3rd edition; 196-211. (34)
8. Venkatraman S., Davar N., Chester A., Kleiner L., An Overview of Controlled-
Release Systems in Handbook of Pharmaceutical Controlled Release Technology
(Wise, D. L. Edt), Marcel Dekker Inc.,; 2000; 4th edition; 233. (35)
9. Chiao CSL., Robinson JR., Sustained Release Drug Delivery Systems; 1995; 2nd
edition; 244-258. (36)
10. Qiu Y., Zhang G., Research and Development Aspects of Oral Controlled-Release
Dosage Forms in Handbook of Pharmaceutical Controlled Release Technology
(Wise, D. L. Edt), Marcel Dekker Inc; 2000. (37)
Chapter -11 BBiibblliiooggrraapphhyy
Department of Pharmaceutics, KLE University, Belgaum 186
11. Siepmann J., Podual K., Sriwongjanya M., Peppas NA., Bodmeier R., New model
describing the swelling and drug release kinetics from hydroxypropyl
methylcellulose tablets; Journal of Pharmaceutical Science; 1999; 88; 65-72. (38)
12. Peppas NA., Analysis of Fickian and Non-Fickian Drug Release from Polymers;
Pharm. Acta Helv; 1985; 60 (4); 110-111. (39)
13. Vyas SP, Khar RK. Controlled drug delivery: concepts and advances. 1st Ed.
Vallabh prakashan, Delhi; 2002; 1-150, 167. (4)
14. Lachman L., Lieberman HA., Kanig JL., The theory and practice of industrial
pharmacy; Varghese Publishing House Bombay; 1987; 293-345, 430. (7)
15. Colombo P., Bettini R., Santi PA., Peppas NA., Swellable matrices for controlled
drug delivery: gel-layer behaviour, mechanisms and optimal performance;
Pharmaceutical Science and Technology Today; 2000; 6; 198-204. (40)
16. Colombo P., Bettini R., Peppas NA., Observation of swelling process and
diffusion front position during swelling in hydroxypropyl methylcellulose
(HPMC) matrices containing a soluble drug; Journal of Controlled Release; 1999;
61; 83-91. (41)
17. Colombo P., Bettini R., Santi P., De A., Peppas NA., Analysis of the swelling and
release mechanisms from drug delivery systems with emphasis on drug solubility
and water transport; Journal of Controlled Release; 1996; 39; 231-237. (43)
18. Aditya ST., Ketan AM., Larry LA. Stephen WH., Influence of methacrylic and
acrylic acid polymers on the release performance of weakly basic drugs from
sustained release hydrophilic matrix; Journal of Pharmaceutical Science; 2004;
93; 2319-2331. (44)
Chapter -11 BBiibblliiooggrraapphhyy
Department of Pharmaceutics, KLE University, Belgaum 187
19. Jantzen GM, Robinson JR, Sustained- and controlled-release drug delivery
systems. In: Banker GS, Rhodes CT, editors. Modern pharmaceutics. 3rd Ed.;
Marcel Dekker Inc; New York, 1996; 575-609. (1)
20. Yie W, Chien, Rate controlled drug delivery systems.; 2nd Ed.;Marcel Dekker;
New York, Revised and expanded, 2005. (2)
21. Jose Gutierrerz-Rocca, Hossein O, Khalid S, Progress in gastroretentive drug
delivery systems. Solid dose research and development. Pharmatech, 152-56
(2003). (3)
22. Jaber E, Naser D, Formulation of sustrained release lithium carbonate matrix
tablets: influence of hydrophilic materials on the release rate and in vitro – in
vivo evaluation, J Pharm Pharmaceut Sci ,7: 338-44(2004). (4)
23. The drug development process, Edited by: Peter welling and Umesh. V. Banakar.
Published in: United State of America.
24. Theory and Practice of Industrial Pharmacy: Third edition, Edited by: Leon
Lachman. Published by: Varghese publishing house, Bombay.
25. Introduction to Pharmaceutical Dosage Forms: Third edition, Edited by: Howard
Ansel Published by: K.M Varghese Company, Bombay.
26. Food and Drug Administration, Guidance for Industry: Waiver of In Vivo
Bioavailability and Bioequivalence Studies for Immediate Release Solid Oral
Dosage Forms Based on a Biopharmaceutics Classification System (FDA,
Rockville,MD, August 2000).
27. http://www.janseen-ortho.com.
Chapter -11 BBiibblliiooggrraapphhyy
Department of Pharmaceutics, KLE University, Belgaum 188
28. Kibbe AH., Handbook of pharmaceutical excipients; American Pharmaceutical
Association and Pharmaceutical Press, Washington London; 2000; 3rd Ed; 102-
106.
29. Chowhan ZT. Role of binders in moisture-induced hardness increase in
compressed tablets and its effect on in vitro disintegration and dissolution. J
Pharm Sci 1980; 69: 1–4.
30. Rowe RC. The adhesion of film coatings to tablet surfaces – the effect of some
direct compression excipients and lubricants. J Pharm Pharmacol 1977; 29: 723–
726.
31. Banker G, Peck G, Jan S, Pirakitikulr P. Evaluation of hydroxypropyl cellulose
and hydroxypropyl methyl cellulose as aqueous based film coatings. Drug Dev
Ind Pharm 1981; 7: 693–716.
32. Okhamafe AO, York P. Moisture permeation mechanism of some aqueous-based
film coats. J Pharm Pharmacol 1982; 34 (Suppl.): 53P.
33. Alderman DA, Schulz GJ. Method of making a granular, cold water dispersible
coating composition for tablets. United States Patent No. 4,816,298; 1989.
34. Patell MK. Taste masking pharmaceutical agents. United States Patent No.
4,916,161; 1990.
35. Hardy JG, Kennerley JW, Taylor MJ, et al. Release rates from sustained-release
buccal tablets in man. J Pharm Pharmacol 1982; 34 (Suppl.): 91P.
36. Hogan JE. Hydroxypropylmethylcellulose sustained release technology. Drug
Dev Ind Pharm 1989; 15: 975–999.
37. Shah AC, Britten NJ, Olanoff LS, Badalamenti JN. Gel-matrix systems exhibiting
bimodal controlled release for oral delivery. J Control Release 1989; 9: 169–175.
Chapter -11 BBiibblliiooggrraapphhyy
Department of Pharmaceutics, KLE University, Belgaum 189
38. Wilson HC, Cuff GW. Sustained release of isomazole from matrix tablets
administered to dogs. J Pharm Sci 1989; 78: 582–584.
39. Dahl TC, Calderwood T, Bormeth A, et al. Influence of physicochemical
properties of hydroxypropyl methylcellulose on naproxen release from sustained
release matrix tablets. J Control Release 1990; 14: 1–10.
40. Banker G, Peck G, Williams E, et al. Microbiological considerations of polymer
solutions used in aqueous film coating. Drug Dev Ind Pharm 1982; 8: 41–51.
41. Anonymous. Final report on the safety assessment of hydroxyethylcellulose,
hydroxypropylcellulose, methylcellulose, hydroxypropyl methylcellulose and
cellulose gum. J Am Coll Toxicol 1986; 5(3): 1–60.
42. FAO/WHO. Evaluation of certain food additives and contaminants. Thirty-fifth
report of the joint FAO/WHO expert committee on food additives. World Health
Organ Tech Rep Ser 1990; No. 789.
43. Lewis RJ, ed. Sax’s Dangerous Properties of Industrial Materials, 11th edn. New
York: Wiley, 2004: 2054.
44. Ozturk AG., Ozturk SS., Palsson BO., Mechanism of release from pellets coated
with an ethyl cellulose-based film; Journal of Controlled Release; 1990; 14(3);
203–213.
45. Narisawa S., Yoshino H., Hirakawa Y., Noda K., Porosity-controlled ethyl
cellulose film coating. IV. Evaluation of mechanical strength of porous ethyl
cellulose film. Chem Pharm Bull; 1994; 42(7); 1491–1495.
46. Bodmeier R., Paeratakul O., The effect of curing on drug release and
morphological properties of ethylcellulose pseudolatex-coated beads; Drug
Development and Industrial Pharmacy; 1994; 20(9); 1517–1533.
Chapter -11 BBiibblliiooggrraapphhyy
Department of Pharmaceutics, KLE University, Belgaum 190
47. Sadeghi F., Ford JL., Rubinstein MH., Rajabi-Siahboomi AR., Study of drug
release from pellets coated with surelease containing
hydroxypropylmethylcellulose; Drug Development and Industrial Pharmacy;
2001; 27(5): 419–430.
48. Lin S., Studies on microencapsulation. 14. Theophylline bioavailability after
single oral-administration of sustained-release microcapsules; Curr Ther Res Clin
Exp; 1987; 41(4); 564–573.
49. Pollock D., Sheskey P., Micronized ethylcellulose: opportunities in direct-
compression controlled-release tablets; Pharmaceutical Technology; 1996; 20(9);
120–130.
50. Katikaneni P., Upadrashta SM., Neau SH., Mitra AK., Ethyl cellulose matrix
controlled-release tablets of a water-soluble drug; International Journal of
Pharmaceutics; 1995; 123; 119–125.
51. Kulvanich P., Leesawat P., Patomchaiviwat V., Release characteristics of the
matrices prepared from co-spray-dried powders of theophylline and
ethylcellulose; Drug Development and Industrial Pharmacy; 2002; 28; 727–739.
52. Lavasanifar A., Ghalandari R., Ataei Z., Microencapsulation of theophylline using
ethyl cellulose: In vitro drug release and kinetic modeling; Journal of
Microencapsulation; 1997; 14(1); 91–100.
53. Melzer E., Kreuter J., Daniels R., Ethylcellulose: A new type of emulsion
stabilizer. European Journal of Pharm Biopharm; 2003; 56; 23–27.
54. Sakellariou P., Rowe RC., White EFT., The thermomechanical properties and
glass transition temperatures of some cellulose derivatives used in film coating;
International Journal of Pharmaceutics;1985; 27; 267–277.
Chapter -11 BBiibblliiooggrraapphhyy
Department of Pharmaceutics, KLE University, Belgaum 191
55. Velazquez D., Cruz G., Torres J., Martin-Polo M., Temperature effects on the
moisture sorption isotherms for methylcellulose and ethylcellulose films; J Food
Engin 2001; 48; 91–94.
56. Bottenberg P, Cleymaet R, de Muynck C, et al. Development and testing of
bioadhesive, fluoride-containing slow-release tablets for oral use. J Pharm
Pharmacol 1991; 43: 457–464.
57. Bailey FE, Kolesky JV. Poly(ethylene oxide). London: Academic Press: 1976.
58. Hand book of pharmaceutical excipients. USA: American pharmaceutical
Associate 1986.
59. Khanvilkar et al., Influence of Hydroxypropyl Methylcellulose Mixture, Apparent
Viscosity, and Tablet Hardness on Drug Release Using a 23 Full Factorial Design.,
Drug Dev. Ind. Phar.; 2002, 28: 601-608.
60. S Somade, K Singh, Comparative evaluation of wet granulation and direct
compression methods for preparation of controlled release Ranitidine HCl tablets.,
Ind. J. Pharm Sci.; 2002, 64(3): 285.
61. Ayhan Savas¸ Yalcın Ozkan, Askın Isımer, Preparation and in vitro evaluation of
sustained release tablet formulations of diclofenac sodium., Il Farmaco; 2005, 60:
171–177.
62. Yaw-Bin Huang, Yi-Hung Tsai, Shu-Hui Lee, Jui-Sheng Chang, Pao-Chu Wu,
Optimization of pH-independent release of nicardipine hydrochloride extended-
release matrix tablets using response surface methodology., International Journal
of Pharmaceutics; 2005, 289: 87–95.
63. L Shoufeng, Statistical optimization of gastric floating system for oral controlled
delivery of calcium., AAPS PharmSciTech.; 2001, 2(1): 1-10.
Chapter -11 BBiibblliiooggrraapphhyy
Department of Pharmaceutics, KLE University, Belgaum 192
64. Nicole Kavanagh, Owen Corrigan, Swelling and erosion properties of
Hydroxypropylmethylcellulose (Hypromellose) matrices: influence of agitation
rate and dissolution medium composition., International Journal of Pharmaceutics;
2004, 279: 141–152.
65. M Farouk, A programmable drug delivery system for oral administration., Int. J.
Pharm.; 1999, 184: 131-139.
66. J Siepmann, H Kranz, N A Peppas, R Bodmeier, Calculation of the required size
and shape of hydroxypropylmethylcellulose matrices to achieve desired drug
release profiles., International Journal of Pharmaceutics; 2000, 201: 151–164.
67. X C Fua, G P Wang, W Q Liang, M S S Chowd, Prediction of drug release from
HPMC matrices: effect of physicochemical properties of drug and polymer
concentration., Journal of Controlled Release; 2004, 95: 209– 216.
68. Rachel Gubbins, Catriona O’Driscoll, Owen Corrigan. The effects of casein on
diclofenac release from hydroxypropylmethylcellulose (HPMC) compacts.,
International Journal of Pharmaceutics; 2003, 260: 69–76.
69. Vorapann Mahaguna, Robert Talbert, Jay Peter, Sandra Adam. Thomas Reynold,
Francis Lam, Robert Williams, Influence of hydroxypropyl methylcellulose
polymer on in vitro and in vivo performance of controlled release tablets
containing alprazolam., European Journal of Pharmaceutics and
Biopharmaceutics; 2003, 56: 461–468.
70. L S C Wan, P W S. Heng and L F Wong, The effect of hydroxypropylmethyl-
cellulose on water penetration into a matrix system., International Journal of
Pharmaceutics; 1991, 73(2): 111-116.
Chapter -11 BBiibblliiooggrraapphhyy
Department of Pharmaceutics, KLE University, Belgaum 193
71. Koichiro Tahara, Ken Yamamoto and Toshiaki Nishihata, Overall mechanism
behind matrix sustained release (SR) tablets prepared with hydroxypropyl
methylcellulose 2910., Journal of Controlled Release; 1995, 35(1): 59-66.
72. Maria-Jesus Vazquez, Marta Casalderrey, Roberto Duro, Jose-Luis Gomez-
Amoza, Ramón Martínez-Pacheco, Consuelo Souto and Angel Concheiro,
Atenolol release from hydrophilic matrix tablets with hydroxypropyl-
methylcellulose (HPMC) mixtures as gelling agent: effects of the viscosity of the
HPMC mixture., European Journal of Pharmaceutical Sciences; 1996, 4(1):39-48.
73. Muniyandy Sarvanan, Kalakonda Sri Nataraj, and Kettavarampalayam Swaminath
Ganesh, Hydroxypropylmethylcellulose Based Cephalexin Extended Release
Tablets: Influence of Tablet Formulation, Hardness and Storage on in Vitro
Release Kinetics., Chem. Pharm. Bull.; 2003, 51(8): 978 - 983.
74. Silvina Bravo, Maria Lamas, Claudio Salomon, In-Vitro Studies of Diclofenac
sodium controlled release from biopolymeric hydrophilic matrices., J Pharm
Pharmaceut Sci; 2002, 5(3): 213-219.
75. Maria Elena Campos-Aldrete and Leopoldo Villafuerte-Robles, Influence of the
viscosity grade and the particle size of HPMC on metronidazole release from
matrix tablets., European Journal of Pharmaceutics and Biopharmaceutics; 1997,
43(2): 173-178.
76. R Bala Ramesha Chary, Y Madhusudan Rao, Formulation and Evaluation of
Methocel K15M Bioadhesive Matrix Tablets., Drug Development and Industrial
Pharmacy; 2000, 26(8): 901 -906.
77. Yang YY., Wu N., Wang LS., Tan DC., Moochhala SM., Mathematical modeling
and in vitro study of controlled drug release via a highly swellable and dissoluble
Chapter -11 BBiibblliiooggrraapphhyy
Department of Pharmaceutics, KLE University, Belgaum 194
polymer matrix:polyethylene oxide with high molecular weights; Journal of
Controlled Release; 2005; 102; 569-581.
78. Zelko R., Suvegh K., Kiss D., The effect of storage and active ingredient
properties on the drug release profile of poly(ethylene oxide) matrix tablets;
Carbohydrate Polymers; 2008; 74; 930-933.
79. Lambov N., Dimitrov M., Study of Verapamil hydrochloride release from
compressed hydrophilic Polyox-Wsr tablets; International Journal of
Pharmaceutics; 1999; 189; 105-111.
80. Petrovic J., Jockovic J., Ibric S., Parojcic J., Djuric Z., Mathematical modeling of
diclofenac sodium's release from polyethylene oxide matrices; Journal of
Controlled Relese; 2008; 132; 37-53.
81. Conte U., Bruni R., Maggi L., High molecular weight polyethylene oxides
(PEOs) as an alternative to HPMC in controlled release dosage forms; 2000; 195; 229-
238.
82. http://www.symedlabs.com/p6.htm
83. Lachman L., Lieberman HA., Kanig JL., The theory and practice of Industrial
pharmacy, Varghese Publishing House Bombay; 1987; 171-293.
84. Aulton ME., The Science of dosage form design; Churchill living stone; 2002;
2nd edition; 414-418.
85. Cooper J, Gun C, Powder Flow and Compaction. Inc Carter SJ, Eds. Tutorial
Pharmacy. New Delhi, hidix CBS Publishers and Distributors; 1986:211-233.
86. Martin A, Micromeretics, In: Martin A, ed. Physical Pharmacy.Baltimores, MD:
Lippincott Williams and Wilkins; 2001:423-454.
87. ICH topic 8 Pharmaceutical guidelines, Note for Guidence on Pharmaceutical
Developments, (EMEA/CHMP167068/2004).
Chapter -11 BBiibblliiooggrraapphhyy
Department of Pharmaceutics, KLE University, Belgaum 195
88. Baertschi, S. W., Pharmaceutical stress testing, predicting drug degradation,
Taylor and Francis group, 2005, 344-350.
89. The Indian Pharmacopoeia; Ministry of Health and Family Welfare, Government
of India, Controller of Publications, New Delhi; 1996; 4th Edition; Volume II.
90. Rekub, K., Shaikh, M., Statistical design of experiments with engineering
application; 172-180.
91. William MK., Research methods knowledge base, factorial design, 2006.
92. Box GEP., Behnken DW., Some new three level designs for the study of
quantitative variables, Technometrics; 1960; 2; 455–475.
93. Korsmeyer RW., Peppas NA., Effect of the morphology of hydrophilic polymeric
matrices on the diffusion and release of water soluble drugs, Journal of Membr.
Science; 1981; 9; 211–227.
94. Higuchi T., Mechanism of sustained action medication, Theoretical analysis of
rate release of solid drugs dispersed in solid matrices; Journal of Pharmaceutical
Science; 1963; 52; 1145-1149.
95. Ozguney (Sarigullu), Ozcan I., Ertan G., and Guneri T. The Preparation and
Evaluation of Sustained Release Suppositories Containing Ketoprofen and
Eudragit RL 100 by Using Factorial Design. Pharmaceutical Development and
Technology, 2007; 12:97–107.
96. Paulo C., Jose Manuel, Sousa L., Modeling and comparison of dissolution
profiles; European Journal of Pharmaceutical Science; 2001; 13; 123-133.
97. ICH GUIDELINES Q1A (R2), Guidance for industry, stability testing of new
drug substance and products (Available on: http:// http://www.ich.org).