
Dissertation Final
74
Consumer perceptions of financial advisers: A critical evaluation of the role of technology Kevin Barry Regan Masters of Business Administration (MBA) 2014 1
-
Upload
kevin-regan -
Category
Documents
-
view
20 -
download
2
Transcript of Dissertation Final

Consumer perceptions of financial advisers: A critical evaluation of the role of technologyKevin Barry ReganMasters of Business Administration (MBA)2014
Dundee Business School, Abertay University
1

REPRODUCTION OF DISSERTATION OR PROJECT REPORT(PERMISSION TO COPY)
Author: Kevin Barry Regan
Title of Report: Consumer perceptions of financial advisers: A critical evaluation of the role of technology
Qualification: MBAYear of submission: 2014
Please delete all statements which do NOT apply.
(a) I agree that a copy of the document specified above may be made available to be viewed by others, either by electronic means or by placing it in the University library.
Signature: ………………………………………………
Address: ………………………………………………
Date: …………………………………
2

Dundee Business School
DECLARATION OF ORIGINALITY
I declare that the following Dissertation is all my own work and has not been copied or plagiarised from any other source. In addition I have read and understood the University’s Academic Deceit Policy and Procedures and have fully complied with all of its requirements in this Dissertation.
Matriculation Number: 1306863
Course: MBA
Signature:
Name: Kevin Barry Regan
Address:
Contents
3

Dundee Business School.............................................................................................................................3
DECLARATION OF ORIGINALITY..................................................................................................................3
1. Abstract...............................................................................................................................................5
2. Introduction.............................................................................................................................................9
3. Literature Review..............................................................................................................................11
3.1Using Behavioral Finance to Explain Investment Decisions..............................................................11
3.2 The Impact of Financial Literacy......................................................................................................13
3.3 Portfolio Performance and Trust.....................................................................................................14
3.4 The Role of Technology...................................................................................................................16
4. Methodology.........................................................................................................................................19
4.2 Research aims and hypotheses........................................................................................................19
4.3 Research design...............................................................................................................................20
4.4 Survey Method................................................................................................................................24
4.5 Pre-test............................................................................................................................................25
4.6 Sample and Location........................................................................................................................26
5. Analysis and Discussion.........................................................................................................................27
5.1 Respondent profiles.........................................................................................................................27
5.2 Values for Financial Advice..............................................................................................................30
5.21 Behavioral Values......................................................................................................................30
5.22 Financial Literacy.......................................................................................................................32
5.23 The Value of Trust......................................................................................................................34
5.24 Value of Performance................................................................................................................35
5.3 The Role of Technology in the Financial Planning Relationship.....................................................36
5.31 Important Features of a Client Portal........................................................................................36
5.32 Effect of Technology on the Consumption of Financial Advice..................................................39
5.33 The use of web-based financial planning software....................................................................40
6. Conclusion and Further Research..........................................................................................................42
7. References.............................................................................................................................................44
4

1. Abstract
A sample of 205 individuals was analyzed to ascertain current perceptions of the financial
services industry. Building upon previous research, demographic variables were used to discover which
segments of the population currently use a financial planner. Income, level of investable assets, and
level of educational attainment were found to have significant relationship to the likelihood of
consulting a financial professional, supporting research by Elmerick, et al., (2002); Chang (2005); and
Hanna (2011). Gender and age showed no statistically significant effect on the decision to consult
financial advice, contradicting results by Hanna (2011) and Chang (2005) that suggest women and the
elderly would be more likely to seek financial advice. However, when pressed for the reasons for
deciding not to use a financial advisor, males were more likely to believe in their own ability to manage
investments, suggesting a male overconfidence also found (Barber and Odean 2001).
A growing body of research, Lusardi and Mitchell (2007, 2104,); Calacagno and Monitcone
(2014), suggests a lack of financial literacy in the United States. Should financial advisors, who have
asymmetrical informational advantages in regards to their clients, withhold such information or engage
customers in education? Respondents overwhelmingly indicated that increased financial literacy would
either make them more willing, or have no effect, on the decision to consult a professional financial
advisor. These results suggest financial literacy should be seen as a complement to, rather than a
replacement for, professional financial advice (Willis 2008, 2011; Collins 2012). The financial services
industry in general would benefit from a greater public understanding of its services. In regards to
gaining educational access through interactive technology, nearly 90% of respondents indicated they
would use resources to increase literacy, but still retain the services of a financial planner, further
indicating an opportunity for the industry to educate its consumers.
As Tversky and Khanemen (1974) demonstrated, most people fall subject to behavioral biases
and heuristics. Consumers are not always rational decisions makers. Expanding from this initial research,
the field of behavioral finance has helped explain individuals’ investment decisions. Researchers have
shown how individuals suffer from overconfidence (Garling, et al., 2009), anxiety (Gambetti and
Giusberti 2012), and inertia (Benartzi 2012). Researches, including Mardsen, et al., (2011) and
Hackenthall, et al., (2012), suggest that financial planners adopt a role as a behavioral coach or financial
psychologist more than an investment guru. In that note, respondents were asked to rank on a Likert
scale the values each individual placed on certain services offered by a planner. Overall, individuals
5

placed a higher mean value ranking on behavioral values such as trust, preparedness, reducing fear of
investing over numerical, or return-based metrics, such as outperforming the market or certain
benchmarks. These results indicate support for previous research, and suggests that the investment
advisory industry focus on a more holistic approach to managaing and engaging clients.
The last parts of this research sought to determine how technology was changing the financial
advisory relationship. Partcipants were asked what technological features they would like to have access
to through an advisor, and if these technologies would make them more or less likely to consult an
advisor. Finally, participants were asked if they would be willing to use a completely automized
investment management system, similar to recently founded companies like Wealthfront and
Betterment. Hamilton (2012), Savikhin (2008,2011), and Scott-Brown (2012) showed that visual
analytics could be employed to help consunmrs make more optimal investment decsions. Respndents
gave the highest mean value ranings to linking all financial accounts in one place (5.49), and to the
ability to scenario test with real data (5.31). Comparing portfolio returns to benchmarkets received the
lowest mean value ranking (4.79). This data help show that consumers would value the opportunity to
interact more with their financial data, and also lent support to the notion that behavioral values still
have more support than pure investment performance.
When asked if access to technology would make a person more likely, less likely, or have no
effect on the decision to use a financial advisor, 33.8% of people claimes increase use of technology
would make them more likely to use a financial planner, and 50.4% claimed it would have no effect. This
data supports the notion that the population as a whole would value a more interactive role in a
relationship with a financial advisor, and that increased access to technology should not make the
traditional role of a financial planner irrelevent. However, a statistically significant association existed
between gender and and whether technology would influence the decision to consult a financial
planner. 27% of males indicated that an increased access to technology would lead to a decrease need
in financial professional, compared to just 11% for females, supporting the research by Barber and
Odean (2001) indicating males are more likely to be overconfident and manage their own finances.
Interestingly there was no relationship between age anf the effect of technology on the decision to use a
financial planner, rejecting the hypothesis that you nger individuals would be more likely to ise
technology to manage their own finances and forgo the traditional financial advisory relationship.
In order to more specifically discover individuals’ propensity to use a new web based financially
planning system such as Betterment or Wealthfront, the participants were given the following prompt:
6

“There are many new webbased applications that use computer software to manage a client's
investment portfolio. The software lets you input your personal data and will automate many of the
actions completed by a financial advisor including selecting investments. The applications use algorithms
and formulas to construct efficient portfolios. The applications generally use low cost index funds and
therefore charge less in fees than traditional financial advisors”
The participants were fairly evenly split on whether they would consider using such services,
with 46.7% choosing yes and 53.3% choosing no. A Chi squared test for association was chosen to see if
there was significant relationship between any of the grouping variables and the responses. Of the
variables age, gender, and income, none proved significant, helping to reject the hypothesis that
younger, less wealthy individuals would be more willing to use such a service. For the participants who
responded ‘no’, feeling more confident in using a financial planner and believing a financial planner
would provide a better overall service had the highest level of agreement; despite this, the sample
indicated that they did not fell the situation would be too complicated for the web based platform. For
the participants who chose ‘yes’, cost and convenience remained the primary reasons, although this
sample believed a financial planner would still provide a better overall service.
This study provided some useful insight into the demographics of the population that use
financial planning services, the reasons they choose to use such services, and the effect financial literacy
and technology would have on that relationship. Helping to confirm previous studies, older and
wealthier individuals are more likely to have consulted a financial planner. Overall, the sample believed
increased financial literacy would make an individual either more likely, or have no effect on, the
decision to use a financial planner. This would suggest the industry in general would benefit from an
increase in the general public’s understanding of personal finance, perhaps showing the population the
complexities of the field and the need for professional advice. The sample indicated a similar response
to the increased access to technology, with the majority indicating it would make an individual more
likely, or have no effect on, the decision to use a financial planner. As participants indicated support for
a more interactive based platform, the industry should continue to try to engage consumers with
increased use of technology, as it only appear to strengthen the advisory relationship. Finally, the
sample was fairly evenly split on the likelihood of using a web-based financial planning application. Trust
and confidence in an advisor gathered the most support for those who did not support the notion,
whereas cost and convenience were the primary reasons for those willing to use such an application.
However, there was no relationship between age and wealth on the likelihood to use web based
7

financial planning applications. This helps to reject conventional wisdom that a younger generation
would be unwilling to consult a financial planner in person, but also rejects the notion that older
consumers would not be willing to adopt such services. Financial planners would do well to understand
this paradox. Younger generations still seem to value the traditional role of a financial advisor, and older
generations are quickly adapting to the use of technology and should not be forgotten in this process.
Although financial planners could not compete on cost with web-based investment management
platforms, the industry would benefit from increasing its convenience, its adaptation of technology, its
role as an educational leader, and its ability to provide the consumer what a website lacks: the ability to
provide an overall service package and to help overcome the behavioral and judgmental faults of its
clients.
8

2. Introduction
The field of personal financial advising is currently under dramatic changes. Increasingly
powerful and accessible technology has brought the computing power once used only in large financial
institutions available to the average consumer. Rasmusen (2014) describes the new applications:
“In the same way sites like Mint.com have tried to take over personal household accounting,
this wave of new online advisory firms in the past four years has taken the logic a step farther by
automatically investing client money in diversified investment strategies, using sliders for goals and risk
tolerance, then investing in ETFs according to what the algorithms and calculators decide is the best
risk/reward profile for the customer”
Along with the rise of these new competitors, the financial industry as a whole has struggled to
regain its trust with the consumer after the 2008 financial crisis. Banks and financial services
were the two least trusted industries in the U.S., while technology remained the trusted
industry (Edelman, 2012). In this new environment, does the consumer still value the role of a
professional financial advisor?
Another emerging trend in the United States is the push to achieve personal financial
literacy. Ben Bernake, then Chairman of the U.S. Federal Reserve Bank, claims:
. “In light of the problems that have arisen in the subprime mortgage market, we are reminded
of how critically important it is for individuals to become financially literate at an early age so
that they are better prepared to make decisions and navigate an increasingly complex financial
marketplace”
Yet, financial professionals receive year of training in order to navigate such a complex
marketplace. Can we expect consumers to have the same expertise in their own daily lives?
Also, conceptually, one would believe that an increase in an individual’s personal financial
literacy would lead to a decrease in the use of professional financial advice. However, literature
reviewed in the next session suggests the opposite effect. I try to explore to what extent
individuals’ value increasing their understanding of financial products and services, and what
effect this will have on their decision to us financial advice.
9
Technology is changing the traditional role of the financial advisor. Along with the rise of
new competitors, financial advisors now have many varied means of communication and
powerful technology at their own disposal. I try to explore the role of technology in this
relationship. What do consumer’s value in terms of features in a client portal? Will increased
access and use pf technology make individuals more or less likely to use a financial advisor?
Finally, this study seeks to explore if any individuals would be likely to use a service similar in
feature to companies such as Wealthfront and Betterment. In order to explore these trends, I
have issued a survey to discover who currently uses the services of a financial professional and
for what reasons do they choose to utilize those services, and to what extent this changing
landscape will cause people to modify their traditional role in the advisor/ advisee relationship.
10

3. Literature Review
3.1Using Behavioral Finance to Explain Investment Decisions
Much of the basis of modern financial theory derives from the theory of market efficiency,
where individuals behave fully rational and therefor make optimal investment decisions based on
available information. However, the efficient market hypothesis does not always stand up to close
scrutiny, nor does it explain the existence of bubbles and market failures such as the crash of 2008
(Shiller, 2003; Tversky & Khanemen, 1974) . Academics have begun to use psychological factors as a way
to explain the irrational behaviors of investors. Khanemen won a Noble Prize for his work, showing how
individuals are susceptible to cognitive illusions in the same way we fall prey to optical illusions
(Benartzi, 2012). Research shows that, “a growing number of economists recognize that a psychological
perspective is necessary in economic analysis” (Garling, et al., 2009, p. 32). This new breed of economist
has borrowed ideas specifically from the sociology field of psychology. Other believe, “behavioural
finance has a pragmatic aim – decision-making analysis…[it] should not be looked into as a way of
generating instant returns, but rather as a way of approaching or using the knowledge to understand
decision-making processes” (DeBondt, et al., 2010, pp. 31-32). The research has suggested a new way of
perceiving investor behavior, and therefore a new way for financial service professionals to approach
client relationships.
Gärling, et al., (2009) showed how cognitive biases such as overconfidence, over-optimism,
biased information search, as well as mood and social forces all effect investor behavior and lead to over
trading and inefficiency in financial markets. Gärling, et al., would continue to describe that, “people
high in sensation seeking, extraversion, and openness to experience are likely to take more and higher
financial risks, whereas people high in conscientiousness, anxiety, and neuroticism are likely to take
fewer financial risks (2009, p. 6). Gambetti and Giusberti (2012) followed that research, using a
psychometric scale as evaluation, and found persons displaying traits of anger and hostility displayed
more risk-taking investment behavior, but also made more efficient long-term investments. In contrast,
individuals displaying the trait of anxiety “perceive future situations as uncertain and unpredictable” and
are likely to refrain from making investment decisions all together (Gambetti & Giusberti, 2012, p. 1068).
Klement and Miranda (2012) show that life experience will change an investor’s risk preference. Other
researchers have shown that individuals with an internal locus of control (LOC) believe in their own
actions and will therefore pursue optimal investment strategies, whereas individuals with an external 11
LOC, who believe their outcomes result from outside forces, will be less likely to “master the skills
necessary to accomplish their goals or demonstrate goal-directed arousal” (Perry & Morris, 2005, p.
300). Shih and Ke (2014) explain how a consumer’s attitudes toward money, which can vary greatly,
even at the same income level, affect participation in financial markets.
The emergence of the psychological traits of risk or loss aversion may be the most important
contribution of behavioral finance to the personal financial industry. Tversky and Kahneman (1974)
showed that the function for losses was approximately twice as steep as that for gains. A rational
investor should feel indifferent that, given the same 50% probability of occurrence, in winning or losing
$100. However, Khanemen and Tversky’s work showed that the majority of individuals would need the
possibility of a $200 gain to offset the risk of a loss. Benartzi explains, “Psychologists speculate that loss
aversion makes sense in terms of evolution and survival: better to be cautious and give that saber-
toothed tiger a wide berth rather than take the risk of confronting it by yourself. Whatever its origin,
loss aversion affects many of our decisions, including financial ones” (2012, p. 5). This results in many
sub-optimal investment behaviors. Individuals can succumb to inertia, where the fear of risk paralyzes
all decisions. Likewise many investors choose not to sell a stock after it has lost value, due to the pain
from actually realizing the loss, whereas they might sell a gain to early, thereby realizing a gain and a
pleasurable feeling. These decisions stray far from the optimal, rational decisions based on the optimal
selection of a portfolio.
The literature also suggests new ways to view the client-advisor relationship. Academics have
suggested: “Financial advisors are like clinical psychologists whose services are of value per se. They
encourage people to examine their most basic desires and priorities, establish concrete goals, withstand
(and even taken advantage of) adverse events, and feel confident about their future” (Mardsen, et al.,
2011, p. 640). Others have concluded that, “the contexts share commonality in that there is advice-
giving/taking in a relationship between a professional and a layman, information is sensitive, risk is
present, and the purpose is to arrive at an action plan for the advice-taker” (Sodberg, et al., 2014, p.
246). Financial advisors should acknowledge their own cognitive biases, as these professionals have
been shown to exhibit myopic, risk averse behavior and also pass these trait to the consumers with
whom they work (Siebenmorgen & Weber, 2003; Eriksen & Kvaloy, 2010). So, rather than basing the
relationship solely on portfolio return and asset growth, advisors should view their role more as a
consultant or mediator in the financial markets. By knowing investor biases in investment decisions, and
12

recognizing their own, advisors can work to create a more comprehensive planning approach to address
not only the value of client’s portfolios, but also their emotional well-being.
3.2 The Impact of Financial Literacy
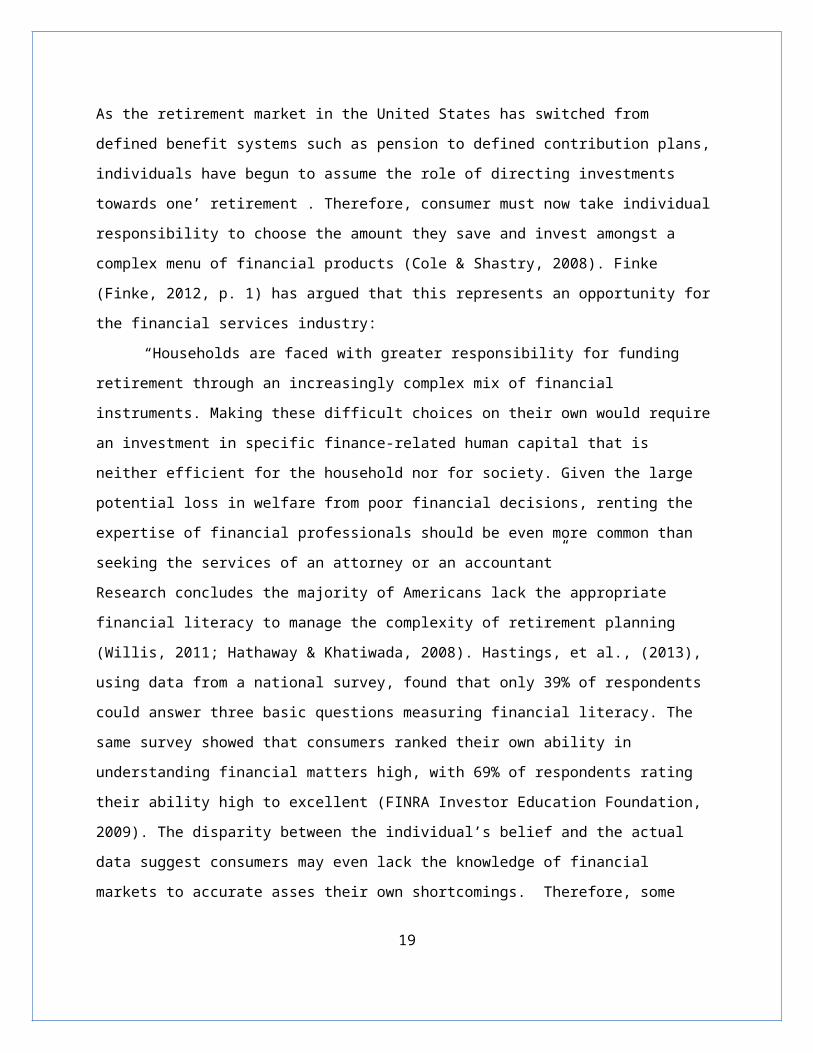
As the retirement market in the United States has switched from defined benefit systems such as
pension to defined contribution plans, individuals have begun to assume the role of directing
investments towards one’ retirement . Therefore, consumer must now take individual responsibility to
choose the amount they save and invest amongst a complex menu of financial products (Cole & Shastry,
2008). Finke (Finke, 2012, p. 1) has argued that this represents an opportunity for the financial services
industry:
“Households are faced with greater responsibility for funding retirement through an increasingly
complex mix of financial instruments. Making these difficult choices on their own would require an
investment in specific finance-related human capital that is neither efficient for the household nor for
society. Given the large potential loss in welfare from poor financial decisions, renting the expertise of
financial professionals should be even more common than seeking the services of an attorney or an
accountant”
Research concludes the majority of Americans lack the appropriate financial literacy to manage the
complexity of retirement planning (Willis, 2011; Hathaway & Khatiwada, 2008). Hastings, et al., (2013),
using data from a national survey, found that only 39% of respondents could answer three basic
questions measuring financial literacy. The same survey showed that consumers ranked their own ability
in understanding financial matters high, with 69% of respondents rating their ability high to excellent
(FINRA Investor Education Foundation, 2009). The disparity between the individual’s belief and the
actual data suggest consumers may even lack the knowledge of financial markets to accurate asses their
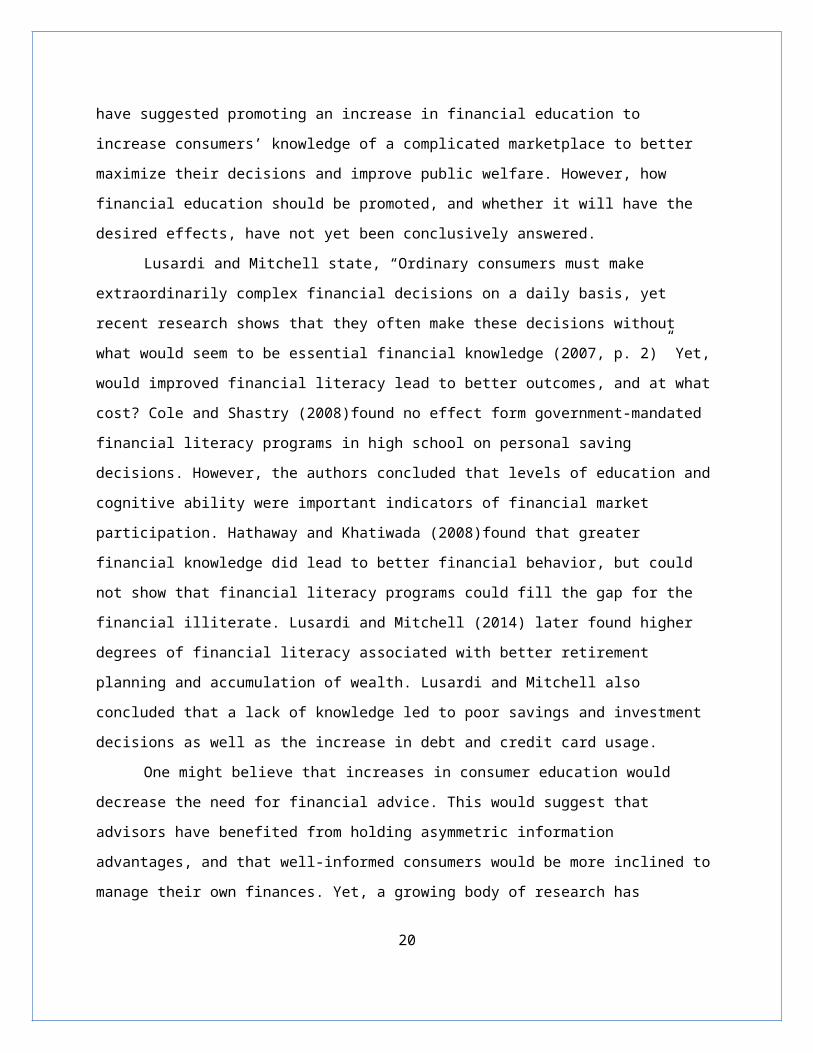
own shortcomings. Therefore, some have suggested promoting an increase in financial education to
increase consumers’ knowledge of a complicated marketplace to better maximize their decisions and
improve public welfare. However, how financial education should be promoted, and whether it will have
the desired effects, have not yet been conclusively answered.
Lusardi and Mitchell state, “Ordinary consumers must make extraordinarily complex financial
decisions on a daily basis, yet recent research shows that they often make these decisions without what
would seem to be essential financial knowledge (2007, p. 2)” Yet, would improved financial literacy lead
to better outcomes, and at what cost? Cole and Shastry (2008)found no effect form government-
13

mandated financial literacy programs in high school on personal saving decisions. However, the authors
concluded that levels of education and cognitive ability were important indicators of financial market
participation. Hathaway and Khatiwada (2008)found that greater financial knowledge did lead to better
financial behavior, but could not show that financial literacy programs could fill the gap for the financial
illiterate. Lusardi and Mitchell (2014) later found higher degrees of financial literacy associated with
better retirement planning and accumulation of wealth. Lusardi and Mitchell also concluded that a lack
of knowledge led to poor savings and investment decisions as well as the increase in debt and credit
card usage.
One might believe that increases in consumer education would decrease the need for financial
advice. This would suggest that advisors have benefited from holding asymmetric information
advantages, and that well-informed consumers would be more inclined to manage their own finances.
Yet, a growing body of research has suggested the opposite; that an increase in financial literacy lead to
a greater consumption of financial advice. Shih and Ke (2014) found that the level of financial literacy
was the most important factor in the decision to seek investment advice. Bell and Eisingerich (2007)
show an increase in education, and therefore expertise, has increased loyalty in investment services.
Collins (2012) and Finke (2012) have argued that financial education should serve as a complement to,
rather than a substitute for, the advice of a trained financial professional. Winchester, et al., believe
“resources spent on increasing the financial literacy of individuals may not be the best approach to
helping investors overcome their behavioral biases. Public funds may be better spent making
professional financial services affordable for the masses rather than focusing on financial literacy
education alone (2011, p. 49). These results indicate that the financial advisory industry would benefit
from an increase in the general public’s knowledge of personal finance. Perhaps a well-educated
consumer would understand the benefits from proper financial planning. Advisors in practice could seek
to better educate and involve their own clients, thereby creating more loyalty and increasing satisfaction
in their clients.
3.3 Portfolio Performance and Trust
The previous sections have shown that both behavioral biases and financial education will have
an effect on the relationship between financial advisors and their clients. Trust and investment
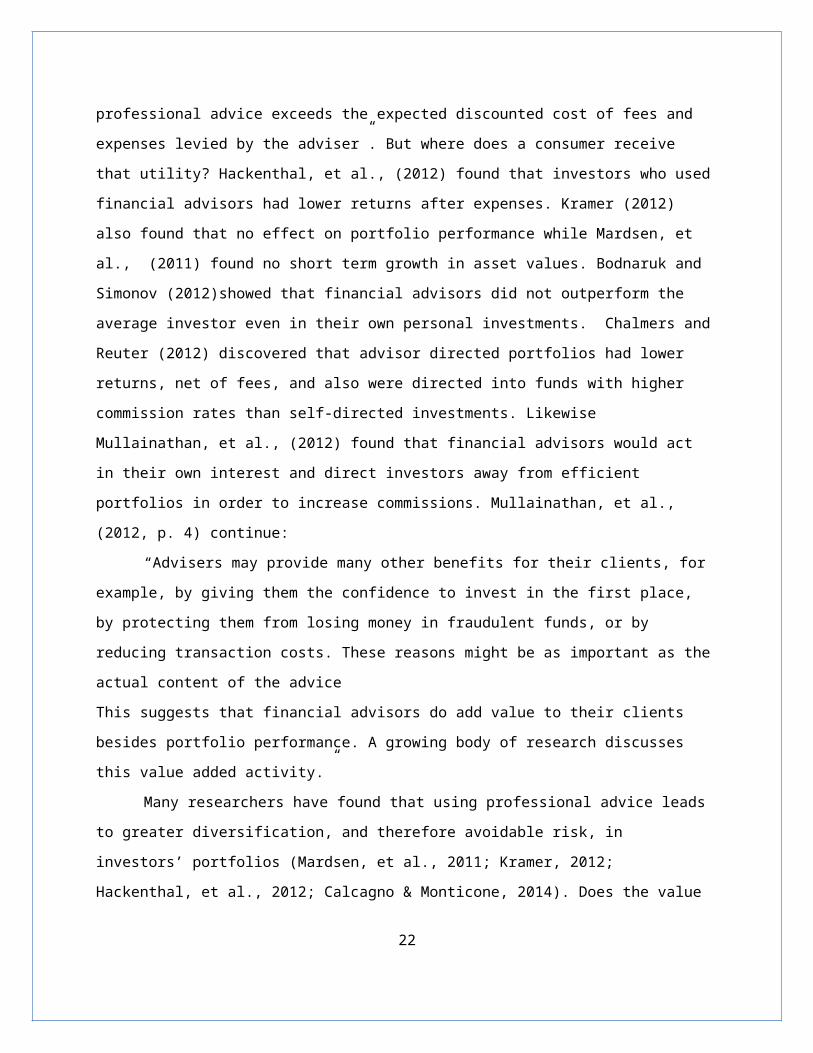
performance will also have an impact on this relationship. Finke (2012, p. 2) claims, “Theoretically, a
household hires a financial adviser if the expected increase in discounted lifetime utility from receiving
professional advice exceeds the expected discounted cost of fees and expenses levied by the adviser”.
14
But where does a consumer receive that utility? Hackenthal, et al., (2012) found that investors who used
financial advisors had lower returns after expenses. Kramer (2012) also found that no effect on portfolio
performance while Mardsen, et al., (2011) found no short term growth in asset values. Bodnaruk and
Simonov (2012)showed that financial advisors did not outperform the average investor even in their
own personal investments. Chalmers and Reuter (2012) discovered that advisor directed portfolios had
lower returns, net of fees, and also were directed into funds with higher commission rates than self-
directed investments. Likewise Mullainathan, et al., (2012) found that financial advisors would act in
their own interest and direct investors away from efficient portfolios in order to increase commissions.
Mullainathan, et al., (2012, p. 4) continue:
“Advisers may provide many other benefits for their clients, for example, by giving them the
confidence to invest in the first place, by protecting them from losing money in fraudulent funds, or by
reducing transaction costs. These reasons might be as important as the actual content of the advice
This suggests that financial advisors do add value to their clients besides portfolio performance. A
growing body of research discusses this value added activity.”
Many researchers have found that using professional advice leads to greater diversification, and
therefore avoidable risk, in investors’ portfolios (Mardsen, et al., 2011; Kramer, 2012; Hackenthal, et al.,
2012; Calcagno & Monticone, 2014). Does the value of diversification outweigh the potential loss of
return or the cost of fees? Maybe not, but perhaps the advisor’s primary goal should not be to create
excess returns in his or her client’s portfolio. Collins contends “the impacts of advice extend beyond
financial returns to include non-pecuniary factors” (Collins, 2012, p. 310). Winchester, et al., (2011)
show that investors who use professional advice have better asset allocation and reallocation, as well as
receive help to overcome the impulses to behave irrationally. Finke, Huston, and Waller (2009) find that
using a financial planner leads to more comprehensive insurance coverage and risk management. These
studies suggest a different rationale for seeking financial advice. Perhaps consumers would place greater
value by considering a financial planner to be like a financial therapist [insert working alliance here]
helping them overcome cognitive biases and creating value beyond the simple statistics of portfolio
returns.
The role of trust in the financial advisor / client relationship has received little attention in the
academic literature, although it remains a main concern with the general public]. A survey by State
Street Global Advisors (2006) showed that 69% of consumers placed trust as the most important
characteristic in an advisor, more than performance and understanding the consumer’s situation.
15

Finance was reported as the least trusted industry in the United States for the third year in a row
(Harper, 2013). However, this encompasses both large banks and financial services companies, and
perhaps not the role of an individual advisor. Krishnan, Ramaswamy, Meyer, and Damien (1999) found
customer satisfaction with financial companies to be dependent of product offerings and client service.
Llewellyn (2005)showed how building trust is a competitive necessary: “financial transactions are
fundamentally different from most other economic transactions…trust and confidence are central
ingredients” (p. 334). Llewellyn also notes that the presence of asymmetric information and the
complexity of financial products creates a greater need for trust in both the salesperson and the
financial institution, and could provide firms with a competitive advantadge. Likewise, Lachance and
Tang believe, “several factors make trust paramount in a financial context: large sums of money are
entrusted to advisors, significant investment risk is present, sales-based incentives can create conflicts of
interest, and fee schedules often lack transparency” (2012, p. 209). The authors note some important
findings, notably that trust increases the use of financial advice and it is the most important determinant
of seeking financial advice, along with cost. Roman (2003) demonstrated that ethical sales behavior by
financial professionals led to greater satisfaction with products and more trust in the company.
Expanding on the research of relationship marketing, researchers have found that trust led to a greater
commitment to service organization, and more loyalty to financial services companies in general
(Fullerton, 2011; Auh, et al., 2007).
3.4 The Role of Technology
The role of technology in the services model of financial planners has seen relatively little
coverage in the academic literature. With the rise of so-called robo-advisors such as Wealthfront and
Betterment, technology may have a greater impact of the financial market if the future. This paper seeks
to address if people would feel comfortable allowing computer software to completely manage their
investment, or if there is some combination of human advice and technological processed that could
strengthen the relationship. Financial planner use varying levels of technology to help manage clients
investment and to help manage the efficiency in running a financial planning practice. This paper seeks
to explore in what ways a planner could use emerging technologies to help strengthen and extend this
relationship.
Technological simulations and gaming have long been suggested as a tool to enhance education
in schools. The recent push for comprehensive personal financial literacy suggests a possible role for
16

technology to achieve this goal. Hamilton (2012) notes that simulations can support decision-making, as
they are capable of elaborating on complex systems and provide a method of experimentation, allowing
users to test a range of input values for decision variables and observe the results on output values” (p.
33). She also notes that “many financial concepts are too abstract to be easily understood without the
use of visual aids” (2012, p. 39), and that simulations can have a positive effect by removing the
mathematical burden away from the consumer and helping address the inertia bias in risk-adverse
consumers. The author continues to break down the simulations into low, mid, and high-fidelity, with
the latter involving complex and dramatic storylines focusing on the use of characters. Way and Wong
(2010) also suggest a role for games in simulation in enhancing financial literacy, pointing to popular
gaming models such as World of Warcraft and The Sims, in which people engage in virtual economies.
What type of technology would help enhance a consumer's financial choices? How would this
software be designed, presented, and utilized? The field of visual analytics has researches how people
interact with technology. Savikhin defines visual analytics as “represent[ing] large amounts of
information visually on the computer screen and allows the decision-maker to interact with the
information, enabling him or her to gain insight, draw conclusions and make improved decisions” (2011,
p. 7) Savikhin, et al., (2008) showed that visual analytics could improve the economic decision making of
participants under cognitive limitations. In terms of an individual’s participation in financial markets,
“The fundamental question is whether the individual has a clear understanding of the risk level of
different assets and whether he or she can choose a portfolio that is appropriate for his or her risk
tolerance” (Savikhin, et al., n.d.). The authors show that individuals rely on subjective, not objective,
measures of probability and risk, and that visual representations of data can help to solve this problem.
The authors then comment on the explosion of online financial services, especially among younger
individuals, that could potentially reduce the need for financial advisors. They issue a warning
“However, online financial planning may result in an overload of information, giving the
consumer instant access to a myriad of financial instruments with different risk and return attributes.
The negative effect of information overload on cognition has been reported for decisions in domains
such as healthcare, accounting and business” (Savikhin, et al., n.d., p. 1)
In developing a ‘financial time machine’, Scott-Brown, et al., (2010) demonstrated a way to reinforce
proper savings decisions using a game-like and interactive interface:
17
“The beauty of the multi-touch interface and game format arise here - the format allows users
to imagine scenarios and play at ‘what ifs’. In a formal bank sales consultancy scenario, where the user is
immediately pinned down to their own financial situation the user can feel inhibited. A game-based
more format allows for people not commit to the actual figures they possess. This can help reduce
embarrassment, particularly for people who may have a problem, an experience such as this may be an
easier way to make the transition to acknowledgement of a problem than an full on debt counseling
session” (Scott-Brown, et al., 2010, p. 5)
The authors caveat that such a system would work ideally with a trained professional to provide
feedback and counselling. This suggests an important role for the financial advisor, even as technology
helps empower consumers to make more appropriate financial decisions.
Technology and visual analytics can be used to enhance a consumer’s financial literacy and
overall understanding of financial markets, but professionals will still have a role in separating the white
noise in the market. Fernandez-Saboite and Roman (2012) show that, in a retail setting, online value
assessments were influenced not only by the performance of the online channel, but also by the way in
which the two channels work together to offer the total service experience” (p. 43) and suggest that
companies practice a multi-channel strategy using both an online and offline experience. Sillence and
Briggs (2007) show that a large proportion of people use the internet for financial advice, and the layout
and design of the web interface influences the trust a consumer has with a core product. These
examples, taken from a retail perspective, can be easily applied to the market for financial advice. There
is some research to suggest technology can help aid consumers and guide them to proper financial
decisions, but people still value the advice of a professional and see technological-based service
deliveries as a complement to a physical presence.
18
4. Methodology4.1 Introduction
This research project was designed under a positivistic paradigm, which seeks to find facts and
causes for the relationship between individuals and the perception of the financial services industry
(Hussey & Hussey, 1997). It was conducted under a deductive approach, to test hypothesis surrounding
the views of an individual in regards to professional financial advice (Saunders, et al., 2003). This study
will use a mixed-method research strategy, but the emphasis will be on obtaining and analyzing
quantitative data (Bryman & Bell, 2011). Qualitative data will be used to support data analyzed
quantitatively. The data will be analyzed to compare the effects of certain demographic variables, such
as gender, age, education level, and income on the decisions to use financial advice and the value
perceived from particular services offered by a professional financial advisor.
4.2 Research aims and hypotheses
This research attempts to discover the consumers’ overall perception of the financial planning
industry. In order to discover these details, this research covers four interrelated aims: what
demographic variables are associated with currently using a financial plan; the value and effect of
financial literacy; the value consumers place in certain financial planning services, and the role of
technology in supporting or weakening this relationship. In following the previous research of Elmerick,
Montalto, & Fox (2002), Chang (2005), and Hanna (2011), the first aim of this research is to dicover
which demographic variables have an effect on the decision to seek financial advice. This leads to the
first research hypothesis:
H1: Age, Gender, and Income will have an effect on the decision to seek financial advice.
The second aim of this research is to discover the value individuals place on increased financial literacy,
and whether this will serve as a complement to professional financial advice, as discovered by Collins
(2010) and Finke (2012), and leads to the second research hypothesis:
H2: Financial literacy will serve as a complement to professional financial advice.
The third aim of this research is discover what services individuals value, or would value, from a financial
advisor. Research by Bodnaruk & Simonov (2012), Hackenthal, et al., (2012), and Mullainathan, et al.,
(2012) proved critical of a financial advisor’s ability to provide excess returns to an investor. However,
research by Garling, et al., (2009) and Bernartzi (2012)suggest than an advisor’s pivotal role is to manage
the behavioral biases of an individual investor. In this exploratory research, this thesis seeks to 19
determine if individuals value behavioral associations over investment performance, and leads to the
third and fourth research hypotheses:
H3: Individuals will value behavioral associations more than investment performance
H4: Age, Gender, and Income will have an effect on the value of financial planning services
The fourth aim of this research will be to explore the evolving role of technology in the financial
planning industry. Research by Savikhin, et al., (2008), Savikhin (2011) suggests that visual analytics and
portal design can improve individual’s economic and financial decision making. Scott-Brown, et al.,
(2010) and Benartzi (2012) show how interactive interfaces can also improve decision making. Hamilton
(2012) provides details into how game-like simulations can improve delivery of financial education and
therefore financial decision making. This research aims to expand upon this research and to explore to
what extent technology will support or weaken the financial advising relationship, what clients would
desire as features in a client interaction portal, and whether individuals would be willing to adopt a web
based financial management system such as Wealthfront or Betterment. This leads to the following
research hypotheses:
H5: Interactive technology will increase the consumption of financial advice
H6: Individuals will value scenario testing as a feature in a client portal
H7: Age, Gender, and Income will effect an individual’s value of client portal features
H8: Younger participants will be more likely to adopt a web-based platform
H9: Income will have a negative effect on the decision to adopt a web-based platform
4.3 Research design
A survey of over 6,000 Americans conducted by the Financial Planning Association (2008)
showed only 60% had a financial plan in place. Furthermore, the study showed that only 34% of
participants with a financial planner had used the advice of a professional to establish the plan. I wanted
to discover why, or why not, the general population decides to use the services of a professional
financial planner. This paper tries to determine what services an individual would value most from a
financial planner. For example, do people only care about portfolio performance, and seek a financial
20

advisor to outperform an investment allocation they could choose by themselves? Do people seek the
advice to help overcome their fear of investing and aversion to risk? Do they value financial education,
or do they prefer to leave all investment decisions to their professionals? What kinds of features would
people value on a technological portal? Finally, the rise of sophisticated software platforms such as
Betterment and Wealthfront, this paper seeks to address to role of technology in the financial advisor
relationship. Would consumers be comfortable allowing software to completely manage their finances,
or do they prefer a combination of technology and human interaction?
The first part of this research will gather demographic information and see if there is any
relationship between gender, age, relationship status, number of dependents, level of education,
household income, or level of assets on the decision to use a financial advisor in the past five years. The
research will continue to test if there is any association for the demographic variables and how and
when an individual would like to communicate with a financial advisor, and in what format would the
participants prefer to receive a customized financial plan. Robb, et al. (2012) found that age income had
a significant effect on the decision to seek financial advice. I would also expect that level of investable
assets and level of education would also have an effect on the decision to use a financial planner.
Though not studied before, I would expect that younger consumers would prefer electronic
communication (e-mail, video conferencing, and social media) to more traditional channels. I would also
younger consumers to desire to meet with a financial advisor more infrequently.
The field of behavioral economics, and behavioral finance, has been growing for decades. Based on the
work of scholars such as Tversky and Khanemen (1974) and Shiller (2003) many people have questioned
the efficient market hypothesis of scholars such as Fama (1970). For the financial planning industry in
particular, much of the academic literature has focused on the quantitative nature of financial advisor’s
advice. Many have focused on the overall performance of a financial advisor directed portfolio versus an
efficient and low cost indexed portfolio (Hackenthal, et al., 2012; Chalmers & Reuter, 2012; Kramer,
2012). Some articles have shown the improvement in an individual’s diversification with an advisor
(Mardsen, et al., 2011; Kramer, 2012) However, there is some information to suggest that a financial
advisor’s most important role is to help de-bias their client behavioral misconceptions and judgmental
hues (Finke, 2012). This paper seeks to expand upon that notion, and to see if consumers value
behavioral view like trust, relationships, and education more than quantitative performance.
In order to compare an individual’s propensity to value services such as trust, education, risk
mitigation over services such as investment performance would expect that, on Likert scale questions,
21
participants will give higher mean ranking scores to the questions Feeling prepared for retirement,
Having adequate insurance coverage, and Having a professional reduce my fears and anxieties about
investing than to questions judging the value of investment performance. I will also test to see if any
demographic variable have an impact on the mean value rankings.
A growing body of literature has discussed the goals and effectiveness of financial literacy
programs in the country. Perhaps, increased financial literacy education may not be appropriate public
policy:
“In an idealized first-best world, where all people are far above average, education
would train every consumer to be financially literate and would motivate every consumer
to use that literacy to make good choices. The costs of the education model would be low
enough and the benefits high enough that empowered citizens of the ownership society
could flourish, and more rather than less education would be desirable. Unfortunately,
such an education is not possible, or, if it were possible, the price of such an education
would be so high as to reduce social welfare. In the real, second-best world, less rather
than more financial literacy education may be better.” (Willis, 2008, p. 57)
If the movement continues to grow, what will be the effect on the financial planning industry? In Willis’
ideal world, each consumer would be able to optimally manage his or her own finances completely.
However, her research concluded that the complexity of the financial marketplace requires professional
attention. Intuitively, one would believe an increase in financial education would lead to a decrease in
the use of professional advice. However, some have concluded that financial knowledge is an important
indicator in seeking financial advice (Collins, 2012; Finke, 2012; Shih & Ke, 2014). I would expect that
individuals would indicate that increase financial education would lead to an increase in the use of a
financial planner.
The role of trust in the financial advisor / client relationship has seen little coverage in the
academic literature. The finance industry, still reeling from the crisis of 2008, has been named the least
trusted industry in America. Clearly, this will have an impact of the personal financial industry, and the
nature of the client relationship. Although the overall view of the financial service industry is negative, it
remains an important and necessary for individuals to save for and fund retirement. Llewellyn (2005)
showed how trust is financial transaction is fundamentally different and more important than most
retail transactions. Others have demonstrated that ethical service behavior from salespeople will
generate more trust in the client relationship (Auh, et al., 2007; Roman, 2003). Overall, there is little
22

academic research on the role of trust in the relationship between a consumer and an individual advisor.
This paper seeks to expand upon the role of trust in the financial services industry, and to discover the
degree to which trust play the largest role in seeking financial advice. I expect that consumers will have a
high mean value ranking for questions pertaining to trust in their financial professional.
The increasing sophistication and reducing costs of financial software means powerful
technology is now available at competitive prices to the average consumer. Though self-directed online
brokerage accounts have long offered certain tools and educational materials to do-it-yourself investors,
the most sophisticated platforms have been reserved for financial professionals. The emergence of
companies such as Betterment and Wealthfront provides the consumer with an avenue to these
technologies at a fraction of the costs of utilizing a professional advisor. Research has shown that web-
based applications play an important role in service delivery, but that consumers still value a physical
presence and traditional services (Fernandez-Sabiote & Roman, 2012). Other research has shown that
improved visual design can help an individual make better financial choices (Savikhin, et al., n.d.; Scott-
Brown, et al., 2010). Trahan, et al., (2012) showed that a market would exist for virtual financial planning
based on the price and reputation of the vendor. The authors noted that the industry would face “major
challenges to broad market acceptance” including complexity and availability (p. 115). The authors also
point to interface design as an important part of the success of any product. This research, and the
evolution of technology and the overall acceptance of technological solutions, would suggest that the
model of a face-to-face financial planner may be coming to an end. However there is enough research to
suggest that people still value the knowledge of a financial professional, and that technology, like
financial literacy, should be seen as a complement, rather than a substitute for, professional financial
advice.
In order to assess the role of technology in the financial planning process, this last part of this
research will seek to gather consumer views on client portal design, the impact of increased access to
technology on the decision to use a financial planner, and whether, and for what reasons, individuals
would be willing to use a web-based application to manage investment portfolios. I would expect that
younger, more educated individuals would more likely to use a web-based financial planning
application. I would also expect that those with higher income and levels of investable assets would not
be likely to use a web-based financial planning application. I would also expect to see an association of
age and the reasons an individual would choose to use such an explanation.
23

As this paper intends to capture highly subjective and difficult to quantify data, the perceptions
of the financial industry, I have chosen a mixed method approach of gathering quantitative and
qualitative data. A self-administered survey, distributed through the website Survey Monkey, was
chosen for both cost and ease of distribution. As the surveys would be both anonymous and taken
without a supervisor, it should reduce the bias to answer questions in what would be perceived as a
socially acceptable manner. The sensitivity of the data would also require anonymity and discretion. I
used a mixture of multiple choice, ranking, and Likert scale questions to spread responses and gather
the required data.
4.4 Survey Method
The survey begins by collecting demographic data that will aid in categorizing and comparing
responses across age, income, and other demographic factors. The first page was also used to ‘ease’ the
respondents into the survey by placing these questions first. The end of the first page asks the question,
“Have you sought the advice of a financial professional in the last five years?” in order to compare the
responses of people who currently use and don’t use financial planning services. For respondents who
used a financial planner, multiple choice questions sought to classify the most valued of financial
planning services, building on the research of Warschauer and Sciglimpaglia (2012). For respondents
that have yet to establish a relationship with a financial planner, the multiple choice question sought to
discover consumer views about the industry, gathering questions on perceived performance, trust, and
financial knowledge.
To establish a comparison, participants were asked, based on a 0-6 Likert point scale, with
prompts ranging from ‘No Value’ to ‘Extremely Valuable’, how they found statement relating to
investment performance, trust, behavioral characteristics, and increasing financial literacy. The nest
stage of question sought to understand when and how an individual would like to communicate with a
financial advisor. I expected there to be a relationship between age, household income, and level of
investable assets on these choices. Younger participants would be more likely to choose electronic
means of communication infrequently, whereas wealthier individuals would prefer to meet more
regularly and in-person. The following questions seek to discover the importance of certain feature if the
participant were to have access to a client portal, including ability to scenario test data and the ability to
24

track and categorize spending. Again, I expect to find a statistically significant relationship between age,
income, and level of assets and the preference for using a client portal.
To further explore the relationship between technologies and the financial planning process,
individuals were asked if increased access to technology would make the more or less likely to consume
financial advice or if this would have no effect. In line with the research showing an increase in financial
literacy with an increase in the use of professional financial advice, I would expect technology to act as
complement to financial services. Participants were then asked if they would be willing to use a web-
based application that used computer-driven algorithms to manage their finances. I would expect
younger, more educated, and less wealthy individuals to have a preference for using this type of
technology, an older wealthier clients to be more likely to answer no. In addition to this multiple choice
response, individuals were asked to expand upon their answers by selecting to what extent they agree
or disagree with statements about the benefits or problems with using such a service. I expect that
individuals who chose to answer no would express more confidence and trust in using a professional
advisor, along with a distrust of computer technology to accurately manage their finances. Conversely, I
would expect to find that people who chose yes would agree that computers would do a superior job a t
a lower cost. Lastly, participants were asked two open-ended responses about what type of features
would they like to have on a client portal, and what other services would they like to see form a financial
advisor.
4.5 Pre-test
To test the survey an email link to the self-administered survey was sent to a total of 8 people.
As suggested by Monroe and Adams (2012), the pilot participants were chosen to represent sample of
the survey population, and asked if there were any difficulties due to formatting, language, and length.
No significant issues were brought forth, so no changes were made. However, when attempting to enter
this sample data into SPSS, I noticed that software could not decipher an answer between the marked
prompts on the Likert scale (although there were seven points for individuals to check, only the
minimum, mean, and maximum answers were labeled) and questions that were left blank. After the
change to these questions, the software was able to except the answers to be analyzed.
25

4.6 Sample and Location
Invitations to take this survey were distributed through a Facebook account. A total of 423
people were asked to complete the survey with a link to Survey Monkey. A total of 205 persons
completed the survey, for a completion rate of 48%. The Facebook account was chosen for ease of
distribution and notification. It also provided a good cross section of age and gender.
26

5. Analysis and Discussion
5.1 Respondent profilesIndividuals were asked to provide certain demographic data for categorization and comparative
purposes. The responses are summarized in the tables above. Respondents were mainly female
(76.5%). The age group 25 to 34 appeared most frequently (53.4%) followed by 55 to 64 (14.7%) and 45
to 54 (11.8%). Overall 96.1% of respondents were under the age of 65 and 69.6% of respondents were
under the age of 45, suggesting a younger demographic than national averages [probably need to cite
census here]. The majority of respondents were married (58.8%). Including data on civil partnerships
and those who cohabitate with a significant other, 74.5% of respondents reported being in a
relationship with another individual. The most likely level of education for respondents was a Bachelor
degree (45.8%), with 73.9% of individual achieving a college or graduate degree. Most individuals
reported an annual oncome of $75,000-$124,999, with the majority of responses indicating households
of above $75,000 (60%). However, a majority of responses showed individuals in lower classes of
investable assets, with <$49,999 the most chosen response at 39.4%, with 60.1 % of respondents
indicating investable assets under $149,999. Respondents were fairly evenly split on obtaining financial
advice in the last five years, with 47.5% indicating they have received some sort of professional
financial advice and 52.5% indication they have not used the advice of a professional.
5.12Consumption of Advice
Males were evenly split on having sought out financial advice in the last five years, while females were
slightly more likely to respond no 53.2%. Age seems to have an effect on the decision to receive financial
advice. Only 23.1% of dependents age 18 to 24 used some form of professional financial advice. Only
40% of respondents in the in 35 to 44 age bracket used professional financial advice, compared to 66.7%
and 63.3% for those in the 45 to 54 and 55 to 64 year old age group. Respondents were fairly evenly
split as yes or no answers based on all levels of educational attainment. Both wealth and investable
assets appear to have an effect on choosing to seek financial advice, with 63.2% of respondents
reporting using a professional advisor for incomes over$125,000. Likewise, 66.7% individuals with
investable assets between $500,000-$999,999 sought professional financial advice. 92.9% of individuals
27

with investable assets over $1,000,000 report using a financial advisor in the last five years, and only
30% of people with assets under $49,000 used similar advice.
Chi Squared tests for association were run to help see if there was a significant relationship
between age, gender, and income on the choosing to seek financial advice. Of the variables tested, only
income showed a statistically significant relationship. Results showed a significant relationship at the 1%
level (p-value of .009). These results do not support the hypothesis that age and gender have an effect
on the decision to seek financial advice, and do not support the findings of Elmerick, Montalto, and Fox
(2002). However, the results do support the hypothesis that income had an effect on using a financial
advisor. These results support the conclusion reached by Elmerick, Montalto, and Fox (2002) ,Chang
(2005) and Hanna (2011). Perhaps people with larger incomes feel there is a value-added activity in
seeking advice from a professional financial planner, or the effect could come from simply having a
surplus of investable assets.
5.13 Reasons for choosing to see a financial advisor
For the reasons why people chose to seek financial advice, individuals were asked to check all
answers that apply. The most common responses was To help pan and save for retirement (57.45%)
followed by To have a professional manage an investment portfolio (41.49%) and To have a professional
provide a comprehensive financial plan (38.30%). Responses To plan for a trust or estate, To reduce
debts, and To establish adequate insurance coverage all received under 20% of marks.
28

5.14 Reason for choosing not to see a financial planner
Table 1: Reasons for not seeking financial advice
I thought the
services
would be too
expensive
I don't trust
financial
advisors to act
in my best
interests
I am afraid of
losing my
savings in the
market
I don't think an
advisor can
provide any
more growth
in my
investments
than I would
be able to
provide myself
I don't know or
understand
what services
are offered by
a financial
advisor
Other
Male 16.7% 5.6% 5.6% 38.9% 19.4% 13.9% 100.0%
Female 24.5% 5.7% 6.6% 12.3% 32.1% 18.9% 100.0%
For those who chose not to use financial advice. For individuals who did not choose to use a
financial planner, 28.9% cited a lack of knowledge or understanding, and another 22.5% believing the
services would be too expensive. This suggests the possibility that increased financial education [cite
studies…..] should lead to an increase in the consumption of financial services. The confusion over
expenses lends to a model of more transparency over fees and commissions [cite research here]. Only
5.6% of respondents expressed a lack of trust in financial advisors. This result is surprising considering
general surveys about the view of the financial industry in general [cite surveys and research here].
Perhaps individuals have a negative view of the system, or of large institutions, but have more trust in
certain individual’s traits, which would be interesting to explore further. Only 19% of respondents
claimed they could outperform financial professionals in investment returns, suggesting people
consume financial advice for reason other than net returns.
Chi-Squared test for association could not be completed on age, number of dependents, level of
education, income level, and level of investable assets. However, results show a statistically significant
relationship between gender and the reasons why an individual chose to not seek financial advice[insert
p-value here]. A cross-tabulation was used to show the percentage between genders for the reasons not
to seek financial advice. Specifically, 38.9% of males chose I don’t think an advisor can provide any more
growth in my investments than I would be able to provide for myself, compared with only 23% for
females. This supports research that men feel more over-confident in their ability to select investments,
and that women are more likely to use a professional for financial advice.
29

5.2 Values for Financial Advice
Table 2: Mean Value Ranking
N Mean
Having investments that outperform the market or close benchmarks 121 3.90
Having adequate insurance coverage (life, health, liability, etc.) 136 5.24
Having a written financial plan 117 3.92
Having a greater understanding of financial prod 115 4.58
Receiving advice to minimize tax expenses 123 4.38
Trusting that my advisor is acting in my best interests 124 5.54
Feeling that I am adequately prepared for retirement 119 5.58
Establishing a close relationship with advisor 125 3.98
Having a professional reduce fears of investing 120 4.14
Individuals were asked to give their response to how valuable they found certain statements,
and to rank from no value to extremely valuable. Responses were weighted on a 1-7 Likert scale. So as
to not overload any individuals, the responses were gathered over two questions. The responses were
listed above in one cart as a means to help visualize the data. Feeling adequately prepared for
retirement and Trusting that my advisor is acting in my best interests received highest mean ranking,
indicating a higher valued activity for respondents. Respondents also listed having adequate insurance
coverage as a valuable goal. Trusting that my advisor is acting in best interests also received the most
responses listed as ‘Extremely Valuable’, with 104. The lowest mean values were Having investments
that outperform the markets or benchmarks and Having a written financial plan. (supporting the
research hypothesis that the population in general would find trusting their advisor and behavioral
[methods] more valuable than having a financial professional provide excess portfolio returns).
5.21 Behavioral Values
Feeling Prepared for Retirement
For the value of “feeling prepared for retirement”, a one-way analysis of variance was chosen to
test if there were any significant difference in the mean value rankings across the subsets of the
grouping variables. Results showed no statistically significant difference in the mean response across
age, gender, number of dependent children, or assets. There was a statistically significant difference
30

between the mean score values across relationship status (p-value of .000), education level (.019), and
income (p-value 006). The lack of difference was further explored by using two population independent
mean test for income, age, and level of assets in order to further confirm or deny research by [find
research to enter here].,In order to further explore the relationship between age and retirement values,
the sample groups of 25 to 34 and 55 to 64 were chosen for an independent sample t-test. The age
groups were chosen for large sample size and as wide difference in age. There was a statistically
significant difference in the mean weighting for these age groups (p-value of .001). Income level was
further explored by comparing means of two groups. This was confirmed using the independent t-test
for groups $25,000-$49,999 and $125,000-$249,999 showing higher income levels to have higher mean
scores. The t-test on two age group would suggest that age has an impact on the importance of feeling
prepared for retirement, while there is not enough evidence to support this notion across all age groups,
perhaps because of the close (10 years grouping of the age variable. Surprisingly, income was shown to
have an effect on the value of feeling prepared, whereas the level of investable assets was shown to
have no effect. Perhaps those with large amount of assets have no need floor a financial advisor to make
them feel any more prepared, whereas at lower levels of assets, a financial planner can help individuals
feel more secure through a variety of methods.
Having a professional reduce my fears and anxieties about investing
For the question, please describe how important the following statements are to you, with
respect to having a financial professional alleviate my fears and anxieties about investing, there
was found to be no statistically significant difference of mean value between the groups of age,
gender, relationship status, number of dependents, level of education, income or investable
assets. These results were further explored by using an independent t-test to test two
representative proportions for age and investable assets. The independent t-test results confirmed
there were no difference in the mean value response for the age group 25 to 34 and 55 to 64; also
there was no statistically significant difference in the mean value response for income levels
$50,000-$149,999 and $500,000-$999,999. These results indicate that individuals across all
groups place the same value on helping to overcome risk aversion. Additionally, the results could
31

indicate that the ability to tolerate risk has no correlation with any of the grouping demographics
used in this survey and could be an area for further research.
Having adequate insurance coverage
Overall, respondents listed having adequate insurance coverage, the majority of respondents
ranked the statement as ‘extremely valuable’ (59.6%) and 83.1% respondents ranked the category as at
least ‘greatly valuable’. After running a one way analysis of variance by each grouping category, there
was found to be no significant difference in the mean value ranking for the grouping factors of gender,
age, number of dependents, level of education, income level, or amount of assets. This was confirmed
for age by running a two sample mean test using representative population of 25 to 34 and 55 to 64; for
income by using a two sample mean test using the groupings of $25,000-$49,000 and $125,000-
$249,999, and for assets by using a two sample mean test and the grouping $50,000-$149,999 and
$500,000-$999,999. There was a statistically significant difference in the mean value ranking for
relationship status.
5.22 Financial Literacy
Having a greater understanding of financial products and services
In order to assess the level of value individuals place on improving their personal financial
literacy, were respondents were asked how valuable having a greater understanding of financial
products and services was to them. Responses were ranked on a seven point Likert scale with responses
from ‘No Value’ to ‘Extremely Valuable’. Overall, individuals placed a mean value of 4.58. A One way
analysis of variance test was chosen to see if any subset of the grouping variables recorded differences
in the mean ranking. Results showed no statistically significant difference in the mean value response
32

across any of the sample groups. This contradicts the research hypothesis that higher levels of income
and educational attainment would have a positive effect on valuing increased financial literacy.
However, the high mean ranking across all groups lends support to the notion that consumers, as a
whole, would value financial education as complement to professional financial advice.
Education offered through a client portal
In order to assess the effect of increased access to financial literacy on the decision to use a
financial planner, individuals were given the following prompt:
“Some client portals offer educational materials about financial products and services targeted to your
specific situation. Some of these portals are offered though the services of an advisor, while some are
offered through self-directed accounts that allow you complete control over how to manage your
finances. Given these two options, check which of the following statements best describes you.”
The multiple-choice responses sought to ascertain how willing an individual would be to continue to use
an advisor’s services if they had more access to education. The majority of respondents (54.5%) chose
the response I would access educational materials frequently, in order to become a more informed
consumer; however, I would still prefer to hear an advisor’s recommendations. 87.3% of respondents
indicated using interactive educational materials, but still retain the services of an advisor. Only 5.2% of
respondents indicated that they would choose to take control over their finances with increased access
to education. These results support the research hypothesis that increased access to financial education
would increase an individual’s consumption of financial advice.
Effect of Increased Access to Education
Following the previous question of how an individual would prefer to access educational
materials, participants were asked directly if increased access to education would make them more or
less likely to use the services of a professional financial advisor, or if increased financial literacy would
have no effect on the use of an advisor. 51.1% of individuals chose No Effect while 48.9% of individuals
responded that increased access to education would make them more likely to consult a financial
advisor. No participant responded that increased access to education would make them less likely to
consult a financial advisor. These results give strong support to the research hypothesis that financial
education will increase consumption of financial advice. Since a large majority of indivduals claimed
education would have no effect on their decision to use a financial advisor, one could also include that
33

time constraints or other factors would make people unwilling to increase their own financial literacy,
and therefore prefer to use an advisor.
5.23 The Value of Trust
Trusting that my advisor is acting in my best interest
For the whole sample, the mean value ranking of trusting one’s financial advisor to act in the
best interest of the client was the highest of all mean rankings at 5.54. 83.9% of respondents ranked this
statement as extremely valuable, the highest of all value-ranked statements. These results would
indicate support for the research hypothesis that consumers will value trust over investment
performance. One way analysis of variance test were ran to test if there were any statistically different
mean rankings for any of the grouping factors. Results showed no statistically significant difference in
the mean ranking for the variables of gender, age, relationship status, education level or number of
assets. Results have shown a statistically significant difference in the mean value ranking across income
levels at the 1% level (p-value of .009).
In order to explore the research hypothesis that higher levels of educational attainment would
lead to lower levels of trust, the sample population of those having a high school degree or equivalent
and those having a Bachelors and Doctorate degrees were chosen to test if there was any difference in
the mean value rankings across these groups. These particular sample were chosen as a good
representation of higher and lower educational attainment and because of large sample sizes. There was
a statistically significant relationship between having a high-school degree or equivalent and a
Bachelor’s degree at the 1% level (p-value of .008), and between a high school degree or equivalent and
a doctoral degree at the 10% level (p-value of .056). The results indicate higher levels of trust in an
advisor with higher level of educational attainment, rejecting the research hypothesis.
34

5.24 Value of Performance
Having investments that outperform the market
The sample population gave the statement Having investments that outperform the market, a
mean value ranking of 3.90. 36.4% of respondents chose ‘Valuable’, the most selected response. This
response had the lowest mean ranking amongst the value questions for the sample population. This
supports the research hypothesis that individuals will value other services of a financial professional
over investment performance. An independent samples t-test was chosen to test the research
hypothesis that will have an effect on valuing investment performance. Results show no statistically
significant mean value ranking for either gender, rejecting the hypothesis that males would be more
likely to value investment performance. In order to test the research hypothesis that individuals with
higher levels of income and investable assets would value investment performance more than those
with lower levels of income and investable assets, a one-way analysis of variance was chosen to test for
significance. Results showed no statistically significant difference in the mean valu rankings across any of
the subgroups for income and investable asset levels. These results would reject the hypothesis that
income or assets have an effect on the value of investment performance. Although wealth has been
shown to have a positive effect on seeking financial advice, perhaps it is only the presence of surplus
assets, and not the desire for excess returns, that drives wealthier households to seek investment
advice.
35

5.3 The Role of Technology in the Financial Planning Relationship
5.31 Important Features of a Client Portal
Table 3: Importance of Client Portal Features
N Mean
Linking all financial accounts on one portal 93 5.49
Tracking and categorizing spending 97 5.21
Providing a comparison of portfolio returns to benchmarks 97 4.79
Ability to scenario test with real data 94 5.31
Detailed cash flow statements 94 5.16
Graphical representation of all accounts 99 4.88
Participants were asked the following, “If you were given access to a client portal…how
important would the following features be to you.” Responses were weighted on a seven point Likert
scale from ‘Not at all Important’ to ‘Extremely Important’. Overall, the highest mean importance ranking
was the ability to link all financial account on to one portal (5.49). The sample population chose the
ability to scenario test with real data as more important than the ability to compare portfolio returns,
suggesting support for the research hypothesis that individuals would value a more interactive experience
with a financial planner over pure investment return. As having graphical representations of all accounts
received the second lowest mean importance ranking, it would reject the hypothesis that individuals
would place a high value on aesthetic design. However, surprisingly, participants ranked both liking all
accounts together and tracking and categorizing spending relatively high. This would suggest that
consumers value organization and utility over design, against the research of [cite research].
Linking all Financial Accounts in One Portal
In order to test the research hypothesis that older clients would prefer this particular
feature, a one-way analysis of variance was used to see if there was any statistically significant
difference in the mean ranking of importance across any age group. The results showed no
statistically significant difference on the mean ranking of importance for the grouping variable of
age. In order to expand upon this data, two representative sub groups were chosen for an
36

independent sample t-test. The age groups 25 to 34 and 55 to 64 were chosen because of large sample
size and as a good measure of ‘younger’ and ‘older’ participants. The results showed no statistically
significant difference in the mean rankings of importance across these two age groups. Both results have
to help reject the hypothesis that older clients would prefer this particular feature.
Tracking and categorizing spending
Overall, the sample population responded with a mean value ranking of 5.21, which would be
classified as slightly above the response titled ‘Slightly Important’. One analysis of variance did not show
any statistically relationship between the mean value rankings of any of the grouping variables. 2 sample
population test showed a did not show a statistically significant difference in the mean importance
ranking between the age groups of 25 to 34 and from 55 to 64. Independent sample t-test did show,
however, a significant difference in the mean importance ranking between the income level groupings
of $25,000-$49,999 and $125,000-$149,999 and between the asset levels of $50,000-$149,999 and
>$1,000,000. These results and a visual comparison of the mean importance ranking
suggest that, at higher levels of income and assets, an individual place more importance on being able to
track and categorize spending. However, there was also found to be no significant relationship between
the groups of investable assets of $50,000-$149,999 and $500,000-$999,999. Overall, the results are
inconclusive to suggest a relationship between any of the grouping variables and placing importance on
the value of being able to track and categorize spending
Providing a Comparison of Portfolio Returns to Benchmarks
The sample population gave a mean ranking of importance of 4.79, the lowest of all statements
concerning the feature of a client portal. The most chosen response (38.1%) was ‘Neutral’, and the lowest
percentage of participants (23.2%) chose ‘Extremely Important’ for this portal feature. As consumers
gave a relatively low importance ranking, it would add support to the hypothesis that consumers value
many factors other than pure investment performance. As it showed with questions pertaining to the value
provided by a financial advisor, consumers want a ore holistic experience extending to the technology
involved in the financial advisor relationship A one-way analysis of variance test was used to determine if
there was any difference in the mean rankings of importance across the subgroups of income and assets.
There was no statistically significant difference in the mean rankings for the subsets of both household
income and investable assets. This helps to reject the hypothesis that individuals with higher incomes and
37

levels of investable assets would prefer comparing portfolio performance to the overall market on a client
portal.
Scenario Testing
The sample population scored a mean weighting of 5.31 for the importance of being able to
scenario test with actual data. The mean ranking, and the percentage of individuals (37.2%) rating this
feature as ‘Extremely Important’ was second only to feature of inking all accounts in the same portal.
Overall, this would neither confirm nor deny the hypothesis that individuals would find extreme value in
the ability to use powerful scenario testing technology in their relationships with advisors. A one way
analysis of variance was chosen to determine if there were differences in the mean value rankings
between the subgroups of gender and age. Results showed no statistically significant difference in the ,ean
ranking of importance between males or females or across any age groups. These results would help
reject the hypothesis that males would prefer a more interactive role in technology. In order to further
explore the effects of age on this feature, the age groups 18 to 24 and 55 to 64 were chosen as a
representative ‘younger’ and ‘older’ population. An independent sample t-test was used to determine if
there was a statistically significant difference in the mean rankings of importance between these two age
groups. At a p-value of .759, there was no statistically significant in the mean rankings of importance
across these two age groups. These results were surprising, helping to reject the hypothesis that younger
individuals would prefer a more active and interactive role with technology.
Graphical Representations of All Accounts
The sample population gave a mean ranking of importance of 4.88, with the most participants
(34.3%) ranking this feature as ‘Somewhat Important’ and only 23.2% of respondents choosing
‘Extremely Important’. This does not either confirm or deny the hypothesis that individuals would value
design over numeric importance. To test the hypothesis that older consumers would value this particular
design feature, a one-way analysis of variance was used to determine if there was any difference in the
mean value ranking across the different age groups. At a p-value of .358, there was no statistically
significant difference in the mean rankings of importance across all of the age groups. To further test this
hypothesis, the sample age groups of 18 to 24 and 55 to 64 were chosen as a representative ‘younger’ and
‘older population. An independent sample t-test, at a p-value of .793, indicated no statistically significant
difference in the mean rankings of importance across these two age groups. This help to reject the
hypothesis that older consumers would value a more visual interface in client portal.
38

5.32 Effect of Technology on the Consumption of Financial Advice
Table 4: Effect of Technology on Using a Financial Planner
Frequency Valid Percent
I would be MORE likely to consult a
financial advisor
45 33.8
I would be LESS likely to consult a
financial advisor
21 15.8
Access to more powerful technology
would have NO EFFECT on my decision
to consult a financial advisor
67 50.4
In order to understand the effect of technology on the decision to use a financial advisor,
participants were asked to choose one of three multiple choice responses would most likely describe
them. The questions asked if increased access technology would have more, less, or no effect on the
decision to use financial planner. Only 15.8% of participants responded that they would be less likely to
use a financial planner with increase access to more technology, whereas 33.8% of people thought access
to technology would make the more likely to use a financial planner. The most common response was
that technology would have no effect on the decisions to use a financial planner. As 89.2% of respondents
indicated that technology would either have a positive or no effect on the subsequent decision to use the
services of a financial planner, this data supports the hypothesis that technology can be used as a
complement to professional financial advice.
In order to support the research hypothesis that males would be less likely to use a financial
advisor if given technology, and that, at higher levels of income and investable assets, individuals would
still be more likely to use the services of a financial professional. Of the variables of age, gender, income,
and investable assets that were tested, only gender showed a statistically significance. At a p-value
of .065, there was a statistically significant relationship at the 10% level for the gender. 27% of males
responded that increase access to technology would lead to a decrease in the need for financial advice,
compared with on 12% for females. This again gives support to the notion that men are more likely to be
overconfident and more likely to manage investments themselves. The lack of relationship between age
and the effect of technology helps to does not support the hypothesis that younger individuals would be
more likely manage investments on their own if given access to technology. Results also help to disprove
39
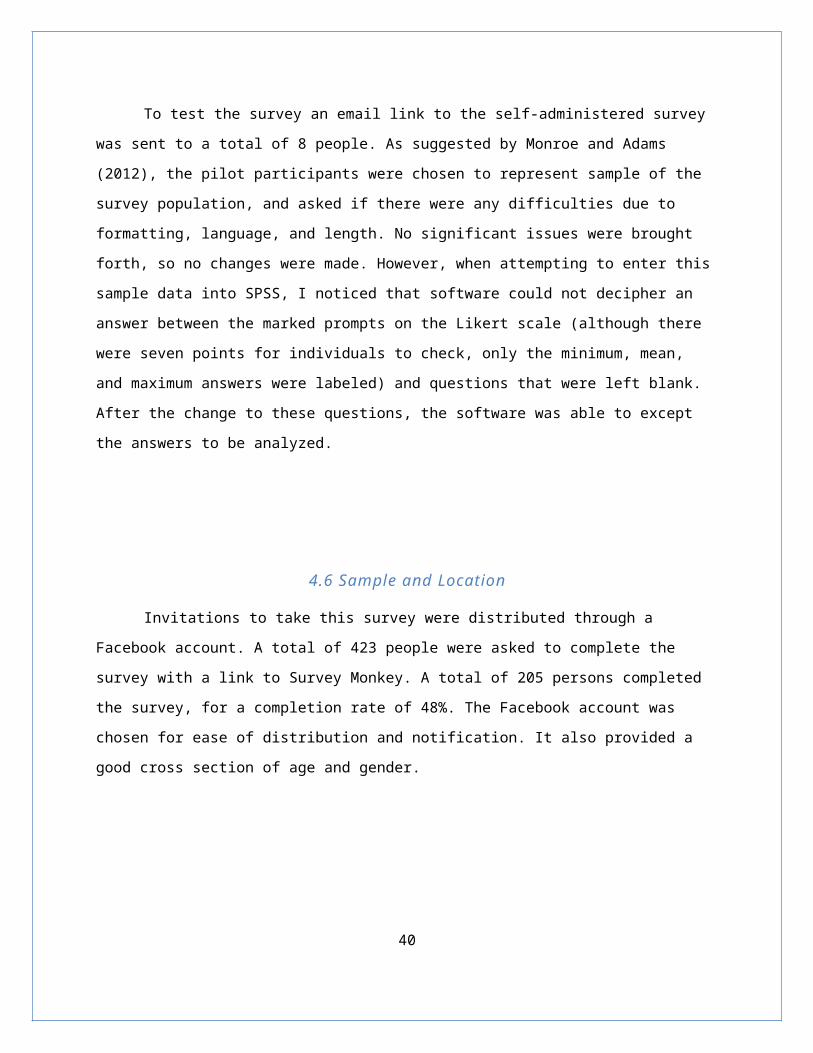
the hypothesis that at higher levels of income, individuals would prefer the services of a financial
professional.
5.33 The use of web-based financial planning software
In order to more specifically discover individuals’ propensity to use a new web based financially
planning system such as Betterment or Wealthfront, the participant were given the following prompt:
“There are many new webbased applications that use computer software to manage a client's
investment portfolio. The software lets you input your personal data and will automate many of the
actions completed by a financial advisor including selecting investments. The applications use algorithms
and formulas to construct efficient portfolios. The applications generally use low cost index funds and
therefore charge less in fees than traditional financial advisors”
The participants were fairly evenly split on whether they would consider using such services,
with 46.7% choosing yes and 53.3% choosing no. A Chi squared test for association was chosen to see if
there was significant relationship between any of the grouping variables and the responses. Of the
variables age, gender, and income, none proved significant. These results would not support the
hypothesis that younger individuals would be more willing to use a web based application to manage
their finances. The results also disprove the theory that individuals with higher incomes would be less
likely to use such an application and therefore prefer the use of a financial planner.
Table 5: Mean Ranking for No Answers
Mean
I do not trust software to make accurate predictions and recommendations 4.58
I feel more confident using a professional financial advisor 5.63
I feel my financial situation is too complicated for financial software 3.94
I do not believe the software will provide a good benefit for the money 4.18
A professional financial advisor will provide a better service 5.30
I would not trust sensitive financial data to the software 5.23
Overall, the participant who answered ‘no’ to using a web-based financial application most strongly
agreed with the statement; “I would feel more confident using a professional financial advisor”. The
40

responses also indicated participants felt financial advisors would provide a better overall service, but
did not strongly agree that the web based software would be inaccurate or unable to respond to a
complicated financial situation. There were no statistically significant differences in the responses across
gender, age, income, and level of assets. Again, this helps to reject the hypothesis that younger, less
wealthy individuals would prefer to use such a service.
Table 6: Mean Ranking for No Answers
Mean
I feel the software will make accurate predictions and recommendations 4.60
I feel the software will provide a good benefit for the cost 4.77
I trust the software will be free from biases and conflicts of interest 4.55
I feel the software will provide a better overall service than a professional financial advisor
3.49
I would like the convenience of a web- based application 4.95
For the participants that indicated they would be likely to use a web based platform for financial
services, cost (4.77) and convenience (4.95) were the objectives respondents had the highest overall
level of agreement. The sample population was least likely to agree that the web-based service would
provide a better overall service. Again, there was no statistically significant difference in the mean
ranking for any of the questions across gender, age, income, and level of investable assets. Both ‘yes’
and ‘no’ respondents seemed to agree that a professional financial advisor would provide a better
overall service. However, cost and convenience seemed to be a determining factor in the willingness to
try a web based application. This provides a context for financial planners to compete against these new
web-based financial planning platforms, by making their services more convenient and more cost
effective while also highlighting the strengths of their total approach to financial planning.
41

6. Conclusion and Further ResearchThe sample population was fairly even split between those who have used a financial advisor in
the last five years (47.5%) and those who have not used advice(52.5%). Income and wealth were the
only demographic variables to have an association with seeking financial advice. This supports previous
studies that suggest wealthier individuals tend to be more likely to use a financial professional. Though,
this study does not test for causation, it is possible that surplus assets drive wealthier individuals to seek
investment advice, or that people in this income bracket perceive more value from the service pf a
financial advisor. There was also a significant relationship between gender and outperforming an advisor
in regards to investment performance.
Feeling adequately prepared for retirement and trusting an advisor is acting in their best interest
were the highest valued responses among participants. Having investments that outperform the
markets and having a professional reduce fear about investing were the lowest valued responses. This
data helps support the notion that consumers value trust, relationship, and general feelings of
preparation over quantifiable performance. The low mean ranking given to reducing fears of investing
might suggest that individuals do not fully understand their own risk perception. This is an area where
advisors could benefit from increased collaboration with his or her clients. Individuals also gave a low
mean value ranking to having a greater understanding of financial products and services, suggesting that
an increase in financial literacy through an advisor is not a primary goal of individuals.
Age, income, relationship status, and level of education had a statistically significant relationship
with the feeling of preparedness for retirement, while none of the grouping variable had an impact on
the mean value ranking of increased understanding of financial products and services. Trust in a financial
advisor was based on income and education level, with both higher level of educational attainment and
higher levels of income reporting a greater value in trusting one’s advisor. The mean ranking of the value
of investment performance did not vary significantly across any pf the grouping variables. This result
was surprising, I assumed those at higher income and asset levels would desire greater investment
performance. However, it is possible, that higher level of incomes value risk management over
performance.
An increase in access to more powerful technology had either no effect, or would increase the
likelihood that an individual would use a financial planner. This gives support to the notion that
technology can be viewed as a complement to, and not a substitute for, professional financial advice.
The defect of technology was evenly distributed among all grouping variables with the exception of
42

males, which showed a higher percentage selecting that an increase in access to technology would lead
to a decrease in the use of financial advice. Participants were fairly evenly distributed between choosing
yes (46.7%) or no (53.3%0 on the acceptance of a web-based financial management system.
Interestingly, there was no effect of age, gender, income, or asset levels. I had assumed younger
individuals would be more likely to choose yes, and that older and wealthier client would be more likely
to choose no. This provides a useful insight that perhaps each individual’s preference and acceptance of
technology does not fit exactly with or pre-determined notions based on demographics. For the
respondents who chose no, the statement receiving the highest mean ranking of agreement level was
feeling more confident dealing with a personal advisor, suggesting, again, that technology should be
viewed as a complement to, and not a replacement for, the services of a financial professional.
These conclusions are limited given the small sample size and potential bias given personal
relationships with many of the participants. Also, despite trying to assess individual’s propensity for
technological use in the financial services industry, the questions were difficult to phrase in a survey
format. It is possible that many respondents did not fully understand the questions. The data does give a
good starting point for future research into the role of technology in this relationship. A larger, unbiased
sample could provide intriguing results on the role of age, gender, and income on the decisions to use
software applications. A case study could be the best way to determine consumer’s technological
preferences. Actual simulations of both existing web-based applications and financial advisor portals
could address consumer’s attitudes toward each. Experiments into interface design and usability could
capture individual’s preference for certain features. At the present, it appears that a majority of
consumers view technology as a complement to meeting directly with a financial advisor. As technology
becomes stronger and more widely available, these results could possibly change dramatically.
43

7. References
Auh, S., Bell, S. J., McLeod, C. S. & Shih, E., 2007. Co-production and customer loyalty in financial services. Journal of Retailing, 83(3), pp. 359-370.
Barber, B. M. & Odean, T., 2001. Boys will be Boys: Gender, Overconfidence, and Common Stock Investmen. The Quarterly Journal of Economics, 116(1), pp. 261-292.
Bell, S. J. & Eisingerich, A. B., 2007. The Paradox of Customer Education. European Journal of Marketing, 41(5), pp. 466-486.
Benartzi, S., 2012. Behavioral Finance in Action: Psychological challenges in the financial advisor/ client relationship, and startegies to solve them, Los Angeles: Allianz Global Investors.
Bodnaruk, A. & Simonov, A., 2012. Do Financial Experts Make Better Investment Decisions. [Online] Available at: http://ssrn.com/abstract=2021501[Accessed 3 August 2014].
Bryman, A. & Bell, E., 2011. Business Research Methods. 3rd ed. Oxford: Oxford University Press.
Calcagno, R. & Monticone, C., 2014. Financial Literacy and the Demand for Financial Advice. Journal of Banking and Finance, Volume 2014, pp. 1-49.
Chalmers, J. & Reuter, J., 2012. What is the Impact of Financial Advisors on Retirement Portfolio Choices and Outcomes. [Online] Available at: http:/www.nber.org/papers/w18158[Accessed 2 August 2014].
Chang, M. L., 2005. With a Little Help from My Friends (and My Financial Planner). Social Forces, 83(4), pp. 1469-1497.
Cole, S. & Shastry, G. K., 2008. If Yoiu Are So Smart, Why Aren't You Rich? THe Effects of Education, Financial Literacy and Cognitive Ability on Financial Market Participation, Boston: Havard Business School.
Collins, J. M., 2010. A Review of Financial Advice Models and the Take-Up of Financial Advice. [Online] Available at: http://www.cfs.wisc.edu/papers/Collins2010_FinancialAdvicePaper.pdf[Accessed 22 August 2014].
Collins, J. M., 2012. Financial Advice: A Substitue for Financial Literacy. Financial Serives Review, 21(4), pp. 307-322.
44

DeBondt, W., Forbes, W., Hamlainen, P. & Muradoglu, Y. G., 2010. What can behaviourak finance teach us about finance?. Qualitative Research in Financial Markets, 2(1), pp. 29-36.
Edelman, 2012. Financial Sector Least Trusted. [Online] Available at: http://www.edelman.com/insights/intellectual-property/2012-edelman-trust-barometer/trust-in-institutions/financial-sector-least-trusted/[Accessed 25 August 2014].
Elmerick, S. A., Montalto, C. P. & Fox, J. J., 2002. Use of Financial Planner by U.S. Households. Financial Services Review, 11(3), pp. 217-231.
Eriksen, K. W. & Kvaloy, O., 2010. Do financial advisors exhibit myopic loss aversion. Finacial Markets and Portfolio Management, 24(2), pp. 159-170.
Fama, E. F., 1970. Efficient Capital Markets: A Review of Theory and Empirical Work. Journal of Finance, 25(2), pp. 383-417.
Fernandez-Sabiote, E. & Roman, S., 2012. Adding clicks to bricks: A study of the consequences on customer loyalty in a service context. Electronic Commerce Research and Applications, 11(2012), pp. 36-48.
Financial Planning Association, 2008. Consumers and Financial Planning. Journal of Financial Planning , 21(9), pp. 1-5.
Finke, M., Huston, S. & Waller, W., 2009. Do contracts influence comprehensive financial advice?. Fiancial Services Review, 18(2), pp. 177-193.
Finke, M. S., 2012. Financial Advice: Does it Make a Difference?. s.l.:Social Science Research Network.
FINRA Investor Education Foundation, 2009. Financial Capability in the United States, Washington: FINRA.
Fullerton, G., 2011. Creating advocates: The roles of satisfaction, trust, and commitment. Journal of Retailing and Consumer Services, 18(2011), pp. 92-100.
Gambetti, E. & Giusberti, F., 2012. The effecr of anger and anxiey traits on investment decisions. Journal of Economic Psychology, 33(2012), pp. 1059-1069.
Garling, T., Kirchler, E., Lewis, A. & van Raaij, F., 2009. Psychology, Financial Decision Making, and Financial Crises. Psychological Science in the Public Interest, 10(1), pp. 1-47.
Hackenthal, A., Haliassos, M. & Jappelli, T., 2012. Financial Advisors: A Case of Babysitters?. Journal of Banking & Finance, 36(2012), pp. 509-524.
Hamilton, A., 2012. Simulations For Financial Literacy, Orlando: University of Central Florida.
45

Hanna, S. D., 2011. The Demand for Financial Planning Services. Journal of Personal Finance, 10(1), pp. 36-62.
Harper, C., 2013. Finance Least-Tusted Industry for Third Year in Edelman Survey. [Online] Available at: http://www.bloomberg.com/news/2013-01-21/finance-least-trusted-industry-for-third-year-in-edelman-survey.html[Accessed 2014 28 July].
Hastings, J. S., Madrian, B. C. & Skimmyhorn, W. L., 2013. Financial Literacy, Financial Education and Economic Outcomes. Annual Review of Economics , 5(2013), pp. 347-373.
Hathaway, I. & Khatiwada, S., 2008. Do Financial Education Programs Work?, Cleveland: Federal Reserve Bank.
Hussey, J. & Hussey, R., 1997. Business Research: A pratical guide for undergraduate and postgraduate students. 1st ed. Basingstoke: Palgrave .
Klement, J. & Miranda, R. E., 2012. Kicking the Habit: How Experience Determines Fianncial Risk Preferences. Journal of Wealth Management, 15(2), pp. 10-25.
Kramer, M. M., 2012. Financial Advice and Individual Investor Portfolio Performance. Financial Management, Summer(2012), pp. 395-428.
Krishnan, M. S., Ramaswamy, V., Meyer, M. C. & Damien, P., 1999. Customer Satisfaction for Financial Services. The Role of Products, Services, and Information Technology. Management Science, 45(9), pp. 1194-1209.
Lachance, M.-E. & Tang, N., 2012. Financial Advice and Trust. Financial Services Review, 21(3), pp. 209-226.
Llewellyn, D. T., 2005. Trust and Confidence in Financial Services: A Strategic Challange. Journal of Financial Regulation and Compliance, 13(4), pp. 333-346.
Lusardi, A. & Mitchell, O. S., 2007. Financial Literacy and Retirment Planning: New Evidence from the Rand American Life Pannel , Frankfurt: Center for Financial Studies, Goethe University.
Lusardi, A. & Mitchell, O. S., 2014. The Economic Importance of Financial Literacy: Theory and Evidence. Journal of Economic Literature, 52(1), pp. 5-44.
Mardsen, M., Zick, C. D. & Mayer, N. R., 2011. The Value of Seeking Financial Advice. Journal of Economics, 32(2011), pp. 625-643.
Monroe, M. C. & Adams, D. C., 2012. Increasing Response Rates to Web-Based Surveys. [Online] Available at: http://www.joe.org/joe/2012december/tt7.php[Accessed 23 August 2014].
46

Mullainathan, S., Noeth, M. & Schoar, A., 2012. The Market for Financial Advice: An Audit Study. [Online]
Available at: htp://www.nber.org/papers/w17929[Accessed 30 July 2014].
Perry, V. G. & Morris, M. D., 2005. Who Is in Control? The Role of Self-Perception, Knowledge, and Income in Explaining Consumer Financial Behavior. The Journal of Consumer Affairs, 39(2), pp. 299-313.
Rasmussen, E., 2014. The Rise of the Robo Advisors. [Online] Available at: http://www.fa-mag.com/news/the-rise-of-the-robo-advisors-17370.html[Accessed 22 August 2014].
Robb, C. A., Babiarz, P. & Woodyard, A., 2012. The demand for financial professionals' advice: The role of financial knowledge, satisfaction, and condifence. Financial Services Review, 21(4), pp. 291-305.
Roman, S., 2003. The Impact of Ethical Sales Behaviour on Customer Satisfaction, Trust and Loyalty to the Company: An Empirical Study in the Financial Services Industry. Journal of Marketing Management , 19(2003), pp. 915-939.
Saunders, M., Lewis, P. & Thornhill, A., 2003. Research Methods for Business Students. 3rd ed. Harlow: Pearson Education Limited.
Savikhin, A. C., 2011. The Application of Visual Analytics to Financial Decision-Making and Risk Management: Notes from Behavioral Economics, Chicago: Becker Friedman Institute, The University of Chicago.
Savikhin, A., Lam, H. C., Fisher, B. & Ebert, D. S., n.d. An Experimental Study of Financial Portfolio Selection with Visual Analytics for Decision Support, s.l.: s.n.
Savikhin, A., Maciejewski, R. & Ebert, D. S., 2008. Applied Visual Analytics for Economic Decision-Making. Columbus, IEEE Symposium on Visual Analytics Science and Technology.
Scott-Brown, K. C. et al., 2010. Making a fincnail Time Machine: A Multi-Touch application to enable interactive 3-D Visualization of distant savings goals. Dundee, UK, University of Abertay, Dundee.
Shih, T.-Y. & Ke, S.-C., 2014. Determinants of financial behavior: insights into consumer money attitudes and financial literacy. Service Business, 8(2014), pp. 217-238.
Shiller, R. J., 2003. From Efficient Markets Theory to Behavioral Finance. The Journal of Economic Perspectives, 17(1), pp. 83-104.
Siebenmorgen, N. & Weber, M., 2003. A behavioral model for asset allocation. Financial Markets and Portfolio Management, 17(1), pp. 15-42.
47

Sillence, E. & Briggs, P., 2007. Please Advise: Using the Internet for Health and Fiancial Advice. Computers in Human Behavior, 23(2007), pp. 727-748.
Sodberg, I.-J., Sallis, J. E. & Eriksson, K., 2014. The dark side of trust and the light side of working alliances in financial services. International Journal of Bank Marketing, 32(3), pp. 245-263.
State Street Global Advisors, 2006. Bridging the Trust Divide: The Financial Advisor-Client Relationship, Philadelphia: Wharton: The University of Pennsylvania.
Trahan, E. A., Gitman, L. J. & Trevino, M. D., 2012. Virtual Financial Planners: Product, Market, and Challanges. Financial Services Review, 21(2), pp. 95-129.
Tversky, A. & Khanemen, D., 1974. Judgement Under Uncertainty: Heuristics and Biases. Science, 185(4157), pp. 1124-1131.
Warschauer, T. & Sciglimpaglia, D., 2012. The Economic Benefits of Personal Financial Planning: An Empirical Analysis. Financial Services Review, 21(2012), pp. 195-208.
Way, W. L. & Wong, N., 2010. Harnessing the Power of Technology to Enhance Financial Literacy Education and Personal Financial Well-Being: A Review of the Literature, Proposed Model, and Action Agenda, Madison: Center for Financial Security.
Willis, L. E., 2008. Against Financial Literacy Education, Philadelphia: University of Pennsylavia Law School.
Willis, L. E., 2011. The Financial Education Fallacy. American Econiomic Review: Papers and Proceeding , 101(3), pp. 429-434.
Winchester, D. D., Huston, S. J. & Finke, M. S., 2011. Investor Prudence and the Role of Financial Advice. Journal of Financial Services Professionals, July(2011), pp. 43-51.
48