DISSERTATION DOCTEUR DE L UNIVERSITÉ DU LUXEMBOURG EN ...
138
PhD-FSTC-2015-29 The Faculty of Sciences, Technology and Communication DISSERTATION Defense held on 02/06/2015 in Luxembourg to obtain the degree of DOCTEUR DE L’UNIVERSITÉ DU LUXEMBOURG EN INFORMATIQUE by Maximilien MOUTON Born on 19 Decenber 1987 in Bar-le-Duc, (France) OPTIMIZATION OF HANDOVER PROCEDURE BETWEEN IEEE 802.11 ACCESS POINTS UNDER VEHICULAR MOBILITY IN AN URBAN ENVIRONMENT Dissertation defense committee Dr. Francesco Viti, Chairman Associate Professor, Université du Luxembourg Dr. Jérôme Härri, Vice Chairman Professor, Eurecom, France Dr. Thomas Engel, dissertation supervisor Professor, Université du Luxembourg Dr. Nicolas Montavont Researcher, Télécom Bretagne, France Dr. Raphael Frank Researcher, Université du Luxembourg Dr. Mario Gerla, Advisory Expert Professor, University of California Los Angeles, USA
Transcript of DISSERTATION DOCTEUR DE L UNIVERSITÉ DU LUXEMBOURG EN ...

PhD-FSTC-2015-29 The Faculty of Sciences, Technology and Communication
DISSERTATION
Defense held on 02/06/2015 in Luxembourg
to obtain the degree of
DOCTEUR DE L’UNIVERSITÉ DU LUXEMBOURG
EN INFORMATIQUE
by
Maximilien MOUTON Born on 19 Decenber 1987 in Bar-le-Duc, (France)
OPTIMIZATION OF HANDOVER PROCEDURE BETWEEN
IEEE 802.11 ACCESS POINTS UNDER VEHICULAR MOBILITY IN AN URBAN ENVIRONMENT
Dissertation defense committee Dr. Francesco Viti, Chairman Associate Professor, Université du Luxembourg
Dr. Jérôme Härri, Vice Chairman Professor, Eurecom, France
Dr. Thomas Engel, dissertation supervisor Professor, Université du Luxembourg
Dr. Nicolas Montavont Researcher, Télécom Bretagne, France
Dr. Raphael Frank Researcher, Université du Luxembourg
Dr. Mario Gerla, Advisory Expert Professor, University of California Los Angeles, USA

i
Acknowledgments
I would like to express my appreciation to my supervisors, Dr. German Castignani andDr. Raphael Frank who has supported me over the last almost four years.
I would like to thank also my thesis director, Prof. Dr. Thomas Engel for his trustfrom the first day.
I wish to extend my gratitude to Dr. Nicolas Montavont, Dr. Jérôme Härri, Prof.Francesco Viti and Prof. Mario Gerla for accepting to give me the honour to be partof this Ph.D jury.
I would like to say a particularly friendly thank to my collegues PhD student,research associate and master student in particular Ismail Yildiz who helped me duringsix month in my researches.
Special thanks go to my wife and her familly who has always supported me.


Contents
1 Introduction 11.1 Motivation and objectives . . . . . . . . . . . . . . . . . . . . . . . . . . 11.2 Thesis contribution . . . . . . . . . . . . . . . . . . . . . . . . . . . . . . 31.3 Outline . . . . . . . . . . . . . . . . . . . . . . . . . . . . . . . . . . . . 5
2 Related work 72.1 Connecting vehicles to IEEE 802.11 networks . . . . . . . . . . . . . . . 8
2.1.1 Vehicular communications: usage and network architectures . . . 82.1.2 Connecting vehicles to wireless networks . . . . . . . . . . . . . . 92.1.3 Exploiting wireless network heterogeneity in urban environments 152.1.4 Vehicular communications through IEEE 802.11 networks . . . . 17
2.2 L2 handover optimization . . . . . . . . . . . . . . . . . . . . . . . . . . 262.2.1 IEEE 802.11 discovery and association . . . . . . . . . . . . . . . 262.2.2 Scanning optimization . . . . . . . . . . . . . . . . . . . . . . . . 282.2.3 Scanning inaccuracy . . . . . . . . . . . . . . . . . . . . . . . . . 342.2.4 Predictive handover . . . . . . . . . . . . . . . . . . . . . . . . . 352.2.5 Reassociation optimization . . . . . . . . . . . . . . . . . . . . . 362.2.6 Discussion . . . . . . . . . . . . . . . . . . . . . . . . . . . . . . . 37
3 Enhancing the efficiency of IEEE 802.11 networks under vehicularmobility 393.1 Introduction . . . . . . . . . . . . . . . . . . . . . . . . . . . . . . . . . . 40
3.1.1 Context . . . . . . . . . . . . . . . . . . . . . . . . . . . . . . . . 403.1.2 Objectives . . . . . . . . . . . . . . . . . . . . . . . . . . . . . . . 443.1.3 Propositions . . . . . . . . . . . . . . . . . . . . . . . . . . . . . 45
3.2 Introducing a second interface: evaluation of a make-before-break ap-proach in vehicular communication . . . . . . . . . . . . . . . . . . . . . 463.2.1 The make-before-break approach . . . . . . . . . . . . . . . . . . 463.2.2 Implementation . . . . . . . . . . . . . . . . . . . . . . . . . . . . 523.2.3 Scanning inaccuracy under vehicular mobility . . . . . . . . . . . 52
3.3 Replacing scanning with prior knowledge of the network . . . . . . . . . 533.3.1 Basic principles . . . . . . . . . . . . . . . . . . . . . . . . . . . . 533.3.2 Building prior knowledge of the network . . . . . . . . . . . . . . 543.3.3 MROAD AP selection . . . . . . . . . . . . . . . . . . . . . . . . 573.3.4 Implementation . . . . . . . . . . . . . . . . . . . . . . . . . . . . 613.3.5 Improving MROAD . . . . . . . . . . . . . . . . . . . . . . . . . 62

iv Contents
3.4 Adding vehicle mobility to the AP selection process . . . . . . . . . . . 633.4.1 Basic principles . . . . . . . . . . . . . . . . . . . . . . . . . . . . 633.4.2 CDB construction . . . . . . . . . . . . . . . . . . . . . . . . . . 633.4.3 Direction detection module . . . . . . . . . . . . . . . . . . . . . 653.4.4 COPER AP selection . . . . . . . . . . . . . . . . . . . . . . . . 703.4.5 Connection module . . . . . . . . . . . . . . . . . . . . . . . . . . 73
3.5 Conclusion . . . . . . . . . . . . . . . . . . . . . . . . . . . . . . . . . . 74
4 Evaluation 754.1 Introduction . . . . . . . . . . . . . . . . . . . . . . . . . . . . . . . . . . 754.2 Testbed description . . . . . . . . . . . . . . . . . . . . . . . . . . . . . . 764.3 Using a second interface: the make-before-break approach . . . . . . . . 78
4.3.1 Experimental setup . . . . . . . . . . . . . . . . . . . . . . . . . . 784.3.2 Evaluation of throughput and connected time . . . . . . . . . . . 794.3.3 Impact of handovers on performance . . . . . . . . . . . . . . . . 80
4.4 Replacing scanning by prior knowledge of the network . . . . . . . . . . 834.4.1 MROAD . . . . . . . . . . . . . . . . . . . . . . . . . . . . . . . 834.4.2 COPER . . . . . . . . . . . . . . . . . . . . . . . . . . . . . . . . 90
4.5 Discussion . . . . . . . . . . . . . . . . . . . . . . . . . . . . . . . . . . . 96
5 Conclusion and perspectives 995.1 Concluding remarks . . . . . . . . . . . . . . . . . . . . . . . . . . . . . 995.2 Future work . . . . . . . . . . . . . . . . . . . . . . . . . . . . . . . . . . 101
5.2.1 Using coper with other IEEE 802.11 networks . . . . . . . . . . 1015.2.2 Providing long-term AP selection . . . . . . . . . . . . . . . . . . 1045.2.3 Providing coper with dynamic network knowledge . . . . . . . . 1055.2.4 Using COPER with a second interface . . . . . . . . . . . . . . . 110
5.3 Perspectives . . . . . . . . . . . . . . . . . . . . . . . . . . . . . . . . . . 110
Bibliography 113

List of Figures
1.1 The network ecosystem of an MS in urban environment . . . . . . . . . 21.2 Contributions description . . . . . . . . . . . . . . . . . . . . . . . . . . 3
2.1 Entry, production and exit phases . . . . . . . . . . . . . . . . . . . . . 172.2 Example of the distribution of BSSIDs sensed in an urban environ-
ment [Mota 2013] . . . . . . . . . . . . . . . . . . . . . . . . . . . . . . 182.3 The handover process in an open IEEE 802.11 network . . . . . . . . . . 27
3.1 Comparison of mobility patterns . . . . . . . . . . . . . . . . . . . . . . 413.2 Changes in RSS under vehicular mobility . . . . . . . . . . . . . . . . . 423.3 Mean throughput for different RSS handover thresholds . . . . . . . . . 433.4 Downlink throughput . . . . . . . . . . . . . . . . . . . . . . . . . . . . 443.5 Implementation of static and dynamic algorithms . . . . . . . . . . . . . 483.6 Handover using the static algorithm . . . . . . . . . . . . . . . . . . . . 503.7 Handover using the dynamic algorithm . . . . . . . . . . . . . . . . . . . 513.8 Changes in RSS under vehicular mobility . . . . . . . . . . . . . . . . . 543.9 The three stages of modeling the RSS of IEEE 802.11 APs . . . . . . . . 563.10 RSS modeling of a HotCity AP . . . . . . . . . . . . . . . . . . . . . . . 563.11 Handover location computation for APi and APj . . . . . . . . . . . . . 573.12 Relationship between RSS, data rate and dropped packets . . . . . . . . 583.13 Distribution of score(EN ) . . . . . . . . . . . . . . . . . . . . . . . . . . 613.14 Description of the three main coper modules . . . . . . . . . . . . . . . 643.15 AP density heatmap based on the Context DataBase (CDB) . . . . . . 663.16 Model of angular displacement during a turn. . . . . . . . . . . . . . . . 673.17 CDF of anticipation distance . . . . . . . . . . . . . . . . . . . . . . . . 693.18 Sample of simulated and sensed RSS . . . . . . . . . . . . . . . . . . . . 713.19 Different cases handled by the AP Selection Module (ASM) . . . . . . . 72
4.1 HotCity deployment characteristics . . . . . . . . . . . . . . . . . . . . . 774.2 HotCity deployment characteristics (cont.) . . . . . . . . . . . . . . . . . 774.3 CDF of the number of APs per RS and mean data rate per RSS . . . . 784.4 General results . . . . . . . . . . . . . . . . . . . . . . . . . . . . . . . . 804.5 A representative single run . . . . . . . . . . . . . . . . . . . . . . . . . 814.6 Experimental route with shortest and longest sequences . . . . . . . . . 834.7 Changes in signal strength and download rate . . . . . . . . . . . . . . . 854.8 Download data rate vs. associated time . . . . . . . . . . . . . . . . . . 864.9 Signal strength distribution . . . . . . . . . . . . . . . . . . . . . . . . . 88

vi List of Figures
4.10 Disconnection duration distribution . . . . . . . . . . . . . . . . . . . . . 884.11 CDF of ShS and ShS/R . . . . . . . . . . . . . . . . . . . . . . . . . . . 914.12 CDF of the data rate . . . . . . . . . . . . . . . . . . . . . . . . . . . . . 924.13 CDF of the disconnected time . . . . . . . . . . . . . . . . . . . . . . . . 934.14 CDF of the sensed RSS . . . . . . . . . . . . . . . . . . . . . . . . . . . 944.15 CDF of the handover phase duration . . . . . . . . . . . . . . . . . . . . 95
5.1 Hotspot and residential networks RSS in the experimental path . . . . . 1035.2 Information exchange in the proposed IEEE 802.21-based solution . . . 1075.3 Scenario 1: Externalization of COPER . . . . . . . . . . . . . . . . . . . 1085.4 Scenario 2: Externalization of AP selection alone . . . . . . . . . . . . . 109
List of Tables
2.1 Comparison of candidate networks1 . . . . . . . . . . . . . . . . . . . . . 132.2 Comparison of tested network deployments . . . . . . . . . . . . . . . . 202.3 Comparison of tested network deployments . . . . . . . . . . . . . . . . 242.4 Comparison of handover phases . . . . . . . . . . . . . . . . . . . . . . . 25
3.1 Sequence of APs in ten experiments using a single interface . . . . . . . 533.2 Turn detection performance of Direction Detection Module (DDM) and
DDM with Fuzzy-based Turning Detector (FTD) . . . . . . . . . . . . 69
4.1 Experimental handover sequences . . . . . . . . . . . . . . . . . . . . . . 844.2 Distribution of ∆S when ∆S > 0 . . . . . . . . . . . . . . . . . . . . . 904.3 Comparative performance of handover solutions with confidence intervals†. 92
5.1 Dynamic information about APs . . . . . . . . . . . . . . . . . . . . . . 105


Chapter 1
Introduction
Contents1.1 Motivation and objectives . . . . . . . . . . . . . . . . . . . . . . 11.2 Thesis contribution . . . . . . . . . . . . . . . . . . . . . . . . . . 31.3 Outline . . . . . . . . . . . . . . . . . . . . . . . . . . . . . . . . . . 5
1.1 Motivation and objectives
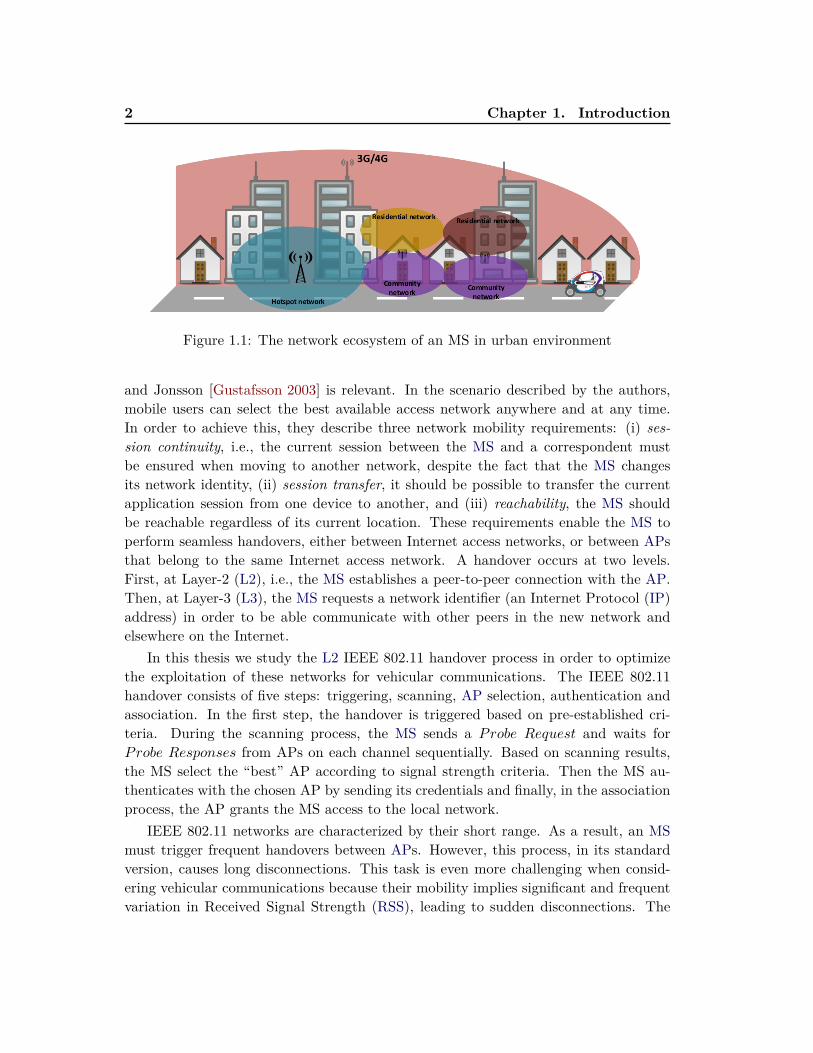
In the urban environment, a Mobile Station (MS) often has access to multiple networks.In addition to high-speed, high-bandwidth cellular (3G/4G) networks with wide cov-erage, a tissue of IEEE 802.11 networks have been deployed in the past decade, whichprovide fairly high bandwidth over a short range (cf. Figure 1.1). There are three kindsof IEEE 802.11 networks, with different characteristics and usages. First, residentialnetworks provide a Wireless Local Area Network (WLAN) that extends personal DigitalSubscriber Line (xDSL) wired Internet access. Second, Community Networks (CNs)are open to any member of the community, i.e., clients of the same Internet ServiceProvider (ISP), or users that have agreed to collaborate. Finally, hotspot networksare larger, outdoor deployments provided by a public authority or an ISP, which areintended to provide Internet connectivity over larger areas. Residential and commu-nity networks are characterized by their very dense, uncoordinated deployment, unlikehotspot networks where deployment is optimized to maximise coverage with a mini-mum number of Access Points (APs). Nowadays, almost all public urban areas arecovered by IEEE 802.11 networks [Castignani 2012a, Farshad 2014].
This thesis focuses on the optimization of vehicular communications in urban en-vironments. Although most such communications are Peer to Peer (P2P), many ap-plications (e.g., navigation and entertainment) require that at least some vehicles haverobust and stable Internet access [Gerla 2011]. In order to judiciously exploit theseheterogeneous networks, an MS should take advantage of IEEE 802.11 networks anduse them as a complement to, or a substitute for, other Internet access networks. Asthe context consists of multi-homed mobile devices that are able to dynamically selectdifferent access networks, the always-best-connected paradigm proposed by Gustafsson
2 Chapter 1. Introduction
Figure 1.1: The network ecosystem of an MS in urban environment
and Jonsson [Gustafsson 2003] is relevant. In the scenario described by the authors,mobile users can select the best available access network anywhere and at any time.In order to achieve this, they describe three network mobility requirements: (i) ses-sion continuity, i.e., the current session between the MS and a correspondent mustbe ensured when moving to another network, despite the fact that the MS changesits network identity, (ii) session transfer, it should be possible to transfer the currentapplication session from one device to another, and (iii) reachability, the MS shouldbe reachable regardless of its current location. These requirements enable the MS toperform seamless handovers, either between Internet access networks, or between APsthat belong to the same Internet access network. A handover occurs at two levels.First, at Layer-2 (L2), i.e., the MS establishes a peer-to-peer connection with the AP.Then, at Layer-3 (L3), the MS requests a network identifier (an Internet Protocol (IP)address) in order to be able communicate with other peers in the new network andelsewhere on the Internet.
In this thesis we study the L2 IEEE 802.11 handover process in order to optimizethe exploitation of these networks for vehicular communications. The IEEE 802.11handover consists of five steps: triggering, scanning, AP selection, authentication andassociation. In the first step, the handover is triggered based on pre-established cri-teria. During the scanning process, the MS sends a Probe Request and waits forProbe Responses from APs on each channel sequentially. Based on scanning results,the MS select the “best” AP according to signal strength criteria. Then the MS au-thenticates with the chosen AP by sending its credentials and finally, in the associationprocess, the AP grants the MS access to the local network.
IEEE 802.11 networks are characterized by their short range. As a result, an MSmust trigger frequent handovers between APs. However, this process, in its standardversion, causes long disconnections. This task is even more challenging when consid-ering vehicular communications because their mobility implies significant and frequentvariation in Received Signal Strength (RSS), leading to sudden disconnections. The

1.2. Thesis contribution 3
(a) Introducing a second inter-face
(b) Bringing prior knowledge ofthe network characteristics
(c) Including vehicular mobilityprediction
Figure 1.2: Contributions description
objective of this thesis is to identify the limitations and propose optimizations for thedifferent phases of the handover in order to eliminate L2 transition latency in the con-text of vehicular mobility in an urban environment. This work is a first step in theglobal improvement of the handover process, where the intention is to provide the MSwith seamless session continuity consistent with the always-best-connected paradigm.
1.2 Thesis contribution
In this thesis, we investigate the specific characteristics of vehicular mobility and itsimpact on vehicular communications. First, we highlight that vehicular mobility leadsto a significant instability in RSS and draw some conclusions regarding the inabilityof scanning to provide reliable information to the MS, leading to inappropriate APselection. Next, we show that vehicular mobility is often predictable as it is constrainedby the road infrastructure and regulations, and suggest that this characteristic couldbe used to improve vehicular communications.
In light of these investigations, we formulate two objectives depicted in Figure 1.2.The first is to eliminate the disconnection period created by the IEEE 802.11 handover,such that mobile users remain fully associated while in their range. The second is tooptimize the AP selection process by identifying the best APs and handover location(consistent with the always-best-connected paradigm). We argue that a focus on la-tency reduction is not enough to provide seamless vehicular communications, becauseof the frequent RSS variations encountered by an MS.
This thesis addresses the two objectives presented above. Its contribution (shownin Figure 1.2) can be summarized as follows:
Introducing a second interface for seamless handovers This approach relo-cates the handover process, and the resulting disconnections, to a second interface(cf. Figure 1.2(a)). It is described in the literature [Brik 2005, Ramachandran 2006,Annese 2011], and addresses the first objective of this thesis. Therefore, it is presented
4 Chapter 1. Introduction
as a preliminary approach, with the aim of evaluating: (i) the potential gain (in termsof association time) that can be achieved, and (ii) the negative impact of a scanning-based AP selection. This approach was implemented in a city-wide hotspot network.Its results were presented in [Mouton 2013a]. To our knowledge this is the first studyof such an approach under these conditions.
Replacing scanning by prior knowledge of network characteristics In orderto mitigate RSS instability and optimize the AP selection process, the MS needs toanticipate changes in RSS such that it is able to prevent any potential sudden disruptionto the connection. The MS should also be able to detect which candidate AP providessuitable RSS (and should be selected) at an early stage. Our investigations show thatthe scanning process is unable to do this; thus, we consider it unsuitable for vehicularcommunications and argue that it can be removed.
Instead, we propose replacing it with prior knowledge of the road topology, thelocation of APs and a model of the RSS in nearby IEEE 802.11 networks (cf. Fig-ure 1.2(b)). This knowledge allows the MS to forecast the RSS of the current AP in allof the directions the vehicle can take, and choose the best candidate AP and the bestlocation to perform the handover. The results of the field tests of this approach werepresented in [Mouton 2013b].
Including vehicular mobility prediction in AP selection The choice of the bestAP depends on the route taken by the vehicle. Except in cases where the driver is guidedby a GPS system, it is impossible to know the vehicle’s route in advance. However,for optimal AP selection, it must be possible to predict the vehicle’s direction. Theprediction is necessary every time the driver can choose between several options.
Therefore, we propose a vehicle direction prediction system that relies on a simpleanalysis of the vehicle’s trajectory (cf. Figure 1.2(c)). This knowledge is computed inreal time and provided to the AP selection process. This, in turn assesses the modeledRSS in the predicted direction in order to select the best AP. An evaluation of thisapproach was published in a journal paper [Mouton 2015].
In this thesis we propose to evaluate the impact of handover triggering and APselection based on prior knowledge of the road topology, the location of APs and amodel of the RSS and compare it with legacy handover technique.
Several principles guide this research.
• Existing standards: The work is based on technologies that are already de-ployed in the field; the intention to make them usable with no delay.
1.3. Outline 5
• Off-the-shelf hardware: All network interfaces used during our experimentswere commercial, off-the-shelf hardware.
• Client-based approach: The network protocol improvements that are proposedonly imply client-side modifications, such that the solution can be applied in thecontext of the standard network infrastructure.
• Field-test validation: All the proposed solutions have been validated in thefield in real-life conditions.
Despite this pragmatic approach, we were aware that future, new technologies mustbe taken into account in order to make the proposed solutions sustainable. We, there-fore dedicated part of our work to studying the extension of our proposals in othercontexts. In particular, we examined the feasibility of our solutions in IEEE 802.11pnetworks.
1.3 Outline
This thesis is organized as follows. In Chapter 2 we present the state-of-the-art invehicular communications and IEEE 802.11 networks. Our proposals are outlined indetail in Chapter 3. This chapter first introduces the two objectives of the thesis,before then describing its three contributions. Chapter 4 shows the results of the fieldexperiments performed to evaluate our contributions. Finally, Chapter 5 concludes thethesis by discussing future work and perspectives.

Chapter 2
Related work
Contents2.1 Connecting vehicles to IEEE 802.11 networks . . . . . . . . . . 8
2.1.1 Vehicular communications: usage and network architectures . . . . 82.1.2 Connecting vehicles to wireless networks . . . . . . . . . . . . . . . 92.1.3 Exploiting wireless network heterogeneity in urban environments . 152.1.4 Vehicular communications through IEEE 802.11 networks . . . . . 17
2.1.4.1 Urban IEEE 802.11 network deployment . . . . . . . . . 182.1.4.2 Vehicular communications using IEEE 802.11 networks . 22
2.2 L2 handover optimization . . . . . . . . . . . . . . . . . . . . . . 262.2.1 IEEE 802.11 discovery and association . . . . . . . . . . . . . . . . 262.2.2 Scanning optimization . . . . . . . . . . . . . . . . . . . . . . . . . 28
2.2.2.1 Selective scanning . . . . . . . . . . . . . . . . . . . . . . 282.2.2.2 Periodic scanning . . . . . . . . . . . . . . . . . . . . . . 292.2.2.3 Synchronizing beacons . . . . . . . . . . . . . . . . . . . . 302.2.2.4 Reducing scanning timers . . . . . . . . . . . . . . . . . . 312.2.2.5 Introducing a second network interface . . . . . . . . . . 322.2.2.6 Using RSS trends . . . . . . . . . . . . . . . . . . . . . . 332.2.2.7 Scanning avoidance . . . . . . . . . . . . . . . . . . . . . 33
2.2.3 Scanning inaccuracy . . . . . . . . . . . . . . . . . . . . . . . . . . 342.2.4 Predictive handover . . . . . . . . . . . . . . . . . . . . . . . . . . 352.2.5 Reassociation optimization . . . . . . . . . . . . . . . . . . . . . . 36
2.2.5.1 IEEE 802.11f . . . . . . . . . . . . . . . . . . . . . . . . . 362.2.5.2 IEEE 802.11r . . . . . . . . . . . . . . . . . . . . . . . . . 362.2.5.3 AP management centralization . . . . . . . . . . . . . . . 37
2.2.6 Discussion . . . . . . . . . . . . . . . . . . . . . . . . . . . . . . . . 37
The first part of this chapter outlines how vehicular networks are currently used, andhighlights the need for communication with infrastructure networks. Next, it presentsexisting networks that offer access to the Internet, and some potential ways to exploit

8 Chapter 2. Related work
wireless network heterogeneity in the urban environment. Finally, it describes thespecific case of urban IEEE 802.11 networks, and reviews the performance of vehicularcommunications in these networks.
The second part focuses on handover optimization (i.e. the process that allowsan MS to change AP) in IEEE 802.11 networks. It describes the standard handoverprocess and its impact on MS communications. Next, a classification of handover opti-mization methods is presented. This classification distinguishes between scanning andreassociation optimization approaches, and highlights the lack of information providedby scanning with regard to vehicular mobility requirements. Finally it introduces anumber of handover schemes specifically designed for vehicular communications.
2.1 Connecting vehicles to IEEE 802.11 networks
2.1.1 Vehicular communications: usage and network architectures
Since the late 1990’s, the development of cheap wireless network interfaces has led tothe emergence of an increasing number of mobile devices. Nowadays, these wirelessinterfaces are an important feature of new vehicles and open up the possibility of newmobile communication paradigms. Consequently, vehicular communications has beensubject of intense research over the past decade.
In their state-of-the-art review, Gerla and Klienrock [Gerla 2011] outline the maincharacteristics of vehicular networks and applications from a historical perspective.The authors show that new wireless technologies are unlike earlier developments incellular phones (which became widely used in the mid 1980s), and wireless Local AccessNetwork (LAN) networks (which began in the late 1990s). While the latter can beconsidered as a one-hop extension of a network infrastructure, vehicular networks findtheir origin in the first wireless network, Packet Radio NETwork (PRNET) that wasdeveloped by the Defense Advanced Research Projects Agency (DARPA). PRNETwas designed for military purposes. There was a requirement for autonomous andportable P2P communications in order for it to be operational in any terrain. Gerlaand Kleinrock state that vehicular networks are similar to PRNET in that they can beset up autonomously and spontaneously. This characteristic is particularly useful indisasters, when infrastructure is damaged or rendered inoperable. Using an autonomous(time limited) power source provided by vehicles, Vehicle Ad-hoc NETworks (VANETs)can continue to run, self-configure and transmit the critical information necessary forrecovery. Beyond this extreme case, the authors highlight that P2P communications arean important dimension of vehicular communications and identify seven applicationsthat are under active investigation:
• Navigation safety: collision avoidance, road conditions (construction work,accidents), etc.
2.1. Connecting vehicles to IEEE 802.11 networks 9
• Navigation efficiency: traffic congestion avoidance, serious games
• Entertainment: multimedia, multiuser games
• Vehicle monitoring: Controller Area Network (CAN) bus interconnection,driver profiling, reduced carbon emissions
• Urban sensing: pollution, forensics
• Social networking: connecting drivers based on proximity or motion correla-tions
• Emergency: post-crisis communications
All of these applications rely on the concept of the Intelligent Transportation Sys-tem (ITS) and Vehicle-to-Vehicle (V2V) communication is a key enabler. Vehicleswould use V2V exchanges to evaluate traffic density [Nadeem 2004, Garelli 2011],avoid hazards (imminent collision with another vehicle, obstacle on the road, etc.)with very short delays [Biswas 2006, Taleb 2010], or to share files with another vehi-cle [Nandan 2005] that is part of the VANET. Whereas VANETs can be considered tobe a member of the Mobile Ad-Hoc NETwork (MANET) family, they differ from thelatter in many ways. The density and node mobility of the network in VANETs aremuch higher and more variable than in typical MANETs. Therefore, many elementsof the network architecture, its organization and packet routing strategy have to beadapted to VANETs specificities.
Although vehicular applications rely on P2P communications, Gerla and Klienrock[Gerla 2011] argue that infrastructure also plays an important supporting role (with theexception of emergency applications). For example, it offers access to servers that storethe content of entertainment and advertising applications. It also parses data collectedby vehicles in order to provide the driver with useful information and enable classicalInternet usage (web-browsing, email, etc.). As a result, a significant proportion of thevehicles in the network must have access to fast, short-delay and reliable infrastructure.
2.1.2 Connecting vehicles to wireless networks
The following section describes the three different technologies that can be used by avehicle to access the Internet.
Cellular networks Cellular networks are the oldest and most widely-deployed wire-less access networks. After a decade in development the first generation of such net-works, Global System for Mobile communications (GSM), began to be deployed in theearly 1990s. Initially they were used for cell phones. In 1995, they were extended to
10 Chapter 2. Related work
support data communication. The following generations of cellular networks can beidentified:
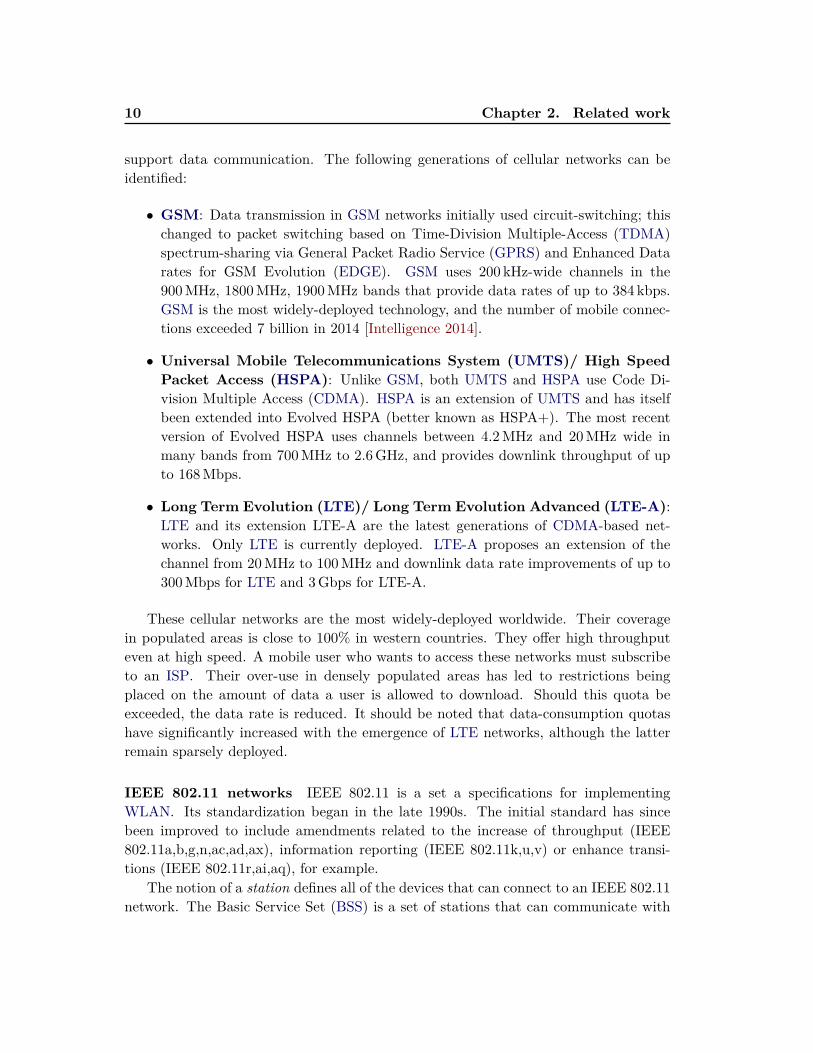
• GSM: Data transmission in GSM networks initially used circuit-switching; thischanged to packet switching based on Time-Division Multiple-Access (TDMA)spectrum-sharing via General Packet Radio Service (GPRS) and Enhanced Datarates for GSM Evolution (EDGE). GSM uses 200 kHz-wide channels in the900MHz, 1800MHz, 1900MHz bands that provide data rates of up to 384 kbps.GSM is the most widely-deployed technology, and the number of mobile connec-tions exceeded 7 billion in 2014 [Intelligence 2014].
• Universal Mobile Telecommunications System (UMTS)/ High SpeedPacket Access (HSPA): Unlike GSM, both UMTS and HSPA use Code Di-vision Multiple Access (CDMA). HSPA is an extension of UMTS and has itselfbeen extended into Evolved HSPA (better known as HSPA+). The most recentversion of Evolved HSPA uses channels between 4.2MHz and 20MHz wide inmany bands from 700MHz to 2.6GHz, and provides downlink throughput of upto 168Mbps.
• Long Term Evolution (LTE)/ Long Term Evolution Advanced (LTE-A):LTE and its extension LTE-A are the latest generations of CDMA-based net-works. Only LTE is currently deployed. LTE-A proposes an extension of thechannel from 20MHz to 100MHz and downlink data rate improvements of up to300Mbps for LTE and 3Gbps for LTE-A.
These cellular networks are the most widely-deployed worldwide. Their coveragein populated areas is close to 100% in western countries. They offer high throughputeven at high speed. A mobile user who wants to access these networks must subscribeto an ISP. Their over-use in densely populated areas has led to restrictions beingplaced on the amount of data a user is allowed to download. Should this quota beexceeded, the data rate is reduced. It should be noted that data-consumption quotashave significantly increased with the emergence of LTE networks, although the latterremain sparsely deployed.
IEEE 802.11 networks IEEE 802.11 is a set a specifications for implementingWLAN. Its standardization began in the late 1990s. The initial standard has sincebeen improved to include amendments related to the increase of throughput (IEEE802.11a,b,g,n,ac,ad,ax), information reporting (IEEE 802.11k,u,v) or enhance transi-tions (IEEE 802.11r,ai,aq), for example.
The notion of a station defines all of the devices that can connect to an IEEE 802.11network. The Basic Service Set (BSS) is a set of stations that can communicate with

2.1. Connecting vehicles to IEEE 802.11 networks 11
each other. IEEE 802.11 defines two modes of communication: ad-hoc or infrastructure.Ad-hoc mode provides a flat network structure based on P2P communication. Ininfrastructure mode, there are two types of stations: the AP and clients. The AP isthe network’s base station, i.e., a transceiver connecting a number of other clients toone another. Clients can be any type of mobile of fixed device. Here, the term MobileStation (MS) is used to refer to devices embedded in a vehicle.
There are several different existing IEEE 802.11 standards released since 1999:
• IEEE 802.11a: Released in 1999, it uses Orthogonal Frequency-Division Multi-plexing (OFDM) and several combinations of keying techniques (BPSK, QPSK,16-QAM, 64-QAM) and Forward Error Correction (FEC) rates in 20MHz-widechannels in the 5GHz band that provide data rates of up to 54Mpbs.
• IEEE 802.11b: Also released in 1999, it uses Direct-Sequence Spread Spectrum(DSSS) and Complementary Code Keying (CCK) in 22MHz-wide channels in the2.4GHz band that provide data rates of up to 11Mpbs.
• IEEE 802.11g: Released in 2003, it uses OFDM and CCK in 20MHz-widechannels in the 2.4GHz band that provide data rates of up to 54Mpbs.
• IEEE 802.11n: Released in 2009, it introduces the Multiple-Input and Multiple-Output (MIMO) technology and Spatial Division Multiplexing (SDM) and usesup to 40MHz-wide channels in the 2.4GHz and 5GHz band that provide datarates of up to 135Mpbs.
• IEEE 802.11ac: Released in 2013, it uses the MIMO technology and SDM inup to 160MHz-wide channels in the 5GHz band that provide data rates of up to600Mpbs.
• IEEE 802.11ad: Released in 2012, it uses the single carrier mode with PSK/QAMmodulation or the MIMO technology and SDM in up to 2160MHz wide channelsin the 60GHz band that provide data rates of up to 6.77Gpbs.
IEEE 802.11 became popular in the early 2000s. Since then, the number of domesticAPs has increased and they now colonize a quarter of households worldwide (and upto 80% in some western countries) [Watkins 2012]. A significant number of these APsbelong to CNs. The term CN refers to a set of APs shared by a community for Internetaccess. A community typically consists of people registered with the same ISP. Mostof these APs broadcast far beyond the walls of individual houses into public areas andcan be used by mobile devices. However, as these networks have been deployed fordomestic use it is obvious that their location and transmission power are not optimizedfor outdoor communications. As a result, their range is limited. Moreover, multipleISPs, sometimes supported by municipalities, have deployed large hotspot networks for

12 Chapter 2. Related work
nomadic users. These networks are often deployed outdoors and provide wider coverageand higher transmission power. In addition, hotspot networks can significantly reducethe latency of transitions between APs, because the MS may be not required to renewits IP configuration (IP address, default gateway, DNS) after a handover.
IEEE 802.11p IEEE 802.11p Wireless Access in Vehicular Environments (WAVE) isan amendment to IEEE 802.11 that is specifically designed to support high-speed V2Vand Vehicle-to-Infrastructure (V2I) communications. Its main characteristic is thatauthentication and association phases are not used, as communication between mobilevehicles (or with the infrastructure) may be very short. Therefore, communicationbetween two devices using IEEE 802.11p can start immediately. IEEE 802.11p useschannels of 10MHz in the 5.9GHz band with doubled symbol length (8µs vs 4µs forother IEEE 802.11 amendments) in order to make the signal more robust to fading. Inaddition, the IEEE 1609.4 multi-channel architecture specifies extensions to the IEEE802.11p MAC for multichannel operations. It defines two kinds of channels: controlchannels (CCH) and service channels (SCH). The control channel is use to carry controland safety messages, while all others messages are exchanged in the service channel.In order to provide Internet access to vehicles, the ITS paradigm defines the so-calledRoad Side Unit (RSU), which is an AP dedicated to vehicular communications. Inthe ITS paradigm, the MS is called an On-Board Unit (OBU)[ETSI 2004]. AlthoughIEEE 802.11p has been designed specifically for vehicular communications and is, thus,the most appropriate access technology for V2V and V2I communications, there iscurrently no production deployment of this technology.
Comparison of network characteristics Table 2.1 compares the technical char-acteristics of cellular, IEEE 802.11 and IEEE 802.11p networks. Currently, cellularnetworks (UMTS, HSPA, LTE) are the most widely deployed and provide almost uni-versal Internet access to users. In addition, since the development of new standards,they offer short latency (comparable to IEEE 802.11). However, access to these net-works comes at a cost. There are still cases where mobile user fees are proportionalto the amount of data consumed in a given period. In addition, even if the client’smobility is managed by the infrastructure, mobile users still experience disconnection,in particular in case of hard handover, i.e., when the old radio links in the client areremoved before the new radio links are established.
IEEE 802.11 network density is high in urban environments and can provide highthroughput, but their coverage is low compared to cellular networks. Although speedtheoretically implies higher packet loss with IEEE 802.11 networks than with cellularnetworks, there is no significant impact on communications given speed limits in urbanenvironments (up to 50 km/h)[Gass 2005].
In conclusion, the networks that can be used by a vehicle to access the Internet

2.1.Connecting
vehiclesto
IEEE802.11
networks
13Cellular networks IEEE 802.11 IEEE
GSM UMTS /HSPA LTE LTE-A IEEE
802.11aIEEE802.11b
IEEE802.11g
IEEE802.11n
IEEE802.11ac
IEEE802.11ad 802.11p
Standardization 1991between2001 and2010
2009 Inprogress 1999 1999 2003 2009 2013 2012 2010
Penetration Very high High Low Not yetdeployed Low High (urban) Low Not yet deployed
Coverage up to35 km 1.5 km 1.5Km N/A 100m to 300m (outdoor) ∼10m up to
900m
Frequency900MHz,1800MHz,1900MHz
850MHzto
2.1GHz
700MHzto
2.6GHz
700MHzto
2.6GHz5GHz 2.4GHz 2.4GHz 2.4GHz &
5GHz2.4GHz &5GHz 60GHz 5.9GHz
Data rate 384 kbps
Downlink168MbpsUplink23,Mbps
Downlink300MbpsUplink75Mbps
Downlink3 Gbps
Uplink 1.5Gbps
54Mbps 11Mbps 54Mbps 135Mbps 600Mbps 6.77Gbps 27Mbps
Bandwidth 200 kHz 4.2 to20MHz
1.4 to20MHz
1.4 to100MHz 20MHz 22MHz 22MHz up to
40MHzup to
160MHz 2160MHz 10MHz
Delay < 500ms from 50 to200ms 5ms N/A 0.5 to 50ms
Speed tolerance Very high Good N/A High
Table 2.1: Comparison of candidate networks1
0[Strobel 2013, Holma 2011, Ott 2004, Sun 2014, González 2008]1[Strobel 2013, Holma 2011, Ott 2004, Sun 2014, González 2008]

14 Chapter 2. Related work
are heterogeneous. In this context, the challenge is to find a connection strategy thatefficiently exploits this heterogeneity.

2.1. Connecting vehicles to IEEE 802.11 networks 15
2.1.3 Exploiting wireless network heterogeneity in urban environ-ments
In an urban environment, a mobile device often has access to multiple infrastructurenetworks. In this heterogeneous context, cellular networks and 802.11 networks themost widely deployed in urban environments.
Due to discontinuity of IEEE 802.11 coverage, data offloading from cellular networksto IEEE 802.11 networks has been a natural solution to efficiently exploit this networkheterogeneity[Balasubramanian 2010]. However, increasing IEEE 802.11 network den-sity makes it possible for a vehicle to remain connected for longer periods. This maylead to a paradigm change in the definition of IEEE 802.11 networks in the urban envi-ronment. Rather than networks that can temporarily be used for delay-tolerant flows,they are now be seen as networks that can provide good Quality of Service (QoS) overthe long term.
A further concern is the introduction of multihoming, i.e. the ability to connectthrough multiple interfaces, which has led to major issues regarding session continuityand toggling between interfaces.
Evolution of IEEE 802.11 network usage Based on the characteristics of cellularand IEEE 802.11 networks, several studies have proposed the default use of cellular net-works and data offloading to IEEE 802.11 networks when possible. In [Balasubramanian 2010],the authors propose an approach that relies on the fact that although available IEEE802.11 networks are sparse, they occur in bursts. They propose a twofold approachthat schedules the transmission of delay-tolerant data in the near future and providesfast switching to cellular networks (3G) for delay-sensitive data. This solution takesas input the size of the transfer, the delay tolerance and an application-specific QoSmetric. Based on these characteristics, it decides how to distribute the data across 3Gand IEEE 802.11 networks. It relies on a prediction of IEEE 802.11 network through-put and a fast IEEE 802.11 to 3G transition. As APs occur in bursts, when the MSis within range of multiple APs, it is likely to quickly discover them. According to thepredicted amount of data that can be offloaded through IEEE 802.11 networks, the MSdecides whether to delay the sending of delay-tolerant data until it finds a potentialAP or to send it directly over 3G. When the MS is connected to an AP, all data (in-cluding delay-sensitive information) transits it. Under these conditions, delay-sensitivedata is more likely to experience transmission losses. In this case, the authors proposetoggling to 3G when the link layer fails to deliver the packet within a delay threshold(e.g. 50ms, proposed in [Balasubramanian 2010]).
The statistical study presented in [Watkins 2012] highlights increased AP density inurban environments. The area covered by CNs and hotspots is constantly expanding,providing Internet access to mobile users over a large part of their journey. In this

16 Chapter 2. Related work
context, it may be possible to use IEEE 802.11 networks as the default Internet accessnetwork. Cellular networks would only be used when there is no IEEE 802.11 networkor potentially, concurrently with IEEE 802.11 networks. However, the nature of IEEE802.11 networks (low coverage, no communication between APs) makes this changechallenging. In order to provide Internet connectivity to an MS when it is in an areacovered by a IEEE 802.11 network, there must be seamless transitions between APs.In other words, when the MS hands-off to an AP, the entry phase must be transparent.In particular, the most time-consuming steps must be improved: scanning and Layer-3 (L3) configuration.
Aggregating links: from multihoming to multipath The connection strate-gies described above imply that the MS has multiple interfaces and is multihomed.The term multihoming refers to the potential for an MS to have multiple addresses.In [Balasubramanian 2010] the MS uses one of its addresses at a time as it switchesbetween cellular and IEEE 802.11 networks. On the Internet, a device is identified byits IP address. As a result, its identity changes over time according to the networkit is connected to. However, in order to keep the current session alive, the MS needsto maintain its identity. The solution proposed in [Balasubramanian 2010] is for allapplications to provide proxy support in order to keep the session alive when the MStoggles between networks. This requires establishing a proxy for each application, orin the Correspondent Node (CNo).
An alternative to this solution is to introduce a shim sub-layer between networkand transport layers as in Mobile IP (MIP) or Host Identity Protocol (HIP). Thissub-layer provides mobility support by distinguishing the identifier and the locator ofthe MS, which are currently both linked to the IP address. By storing the identity ofthe MS on top of its IP address, the shim sub-layer not only allows the same MS tohave multiple locations, but also to transmit flows through all of them. A survey ofthe different protocols using the shim sub-layer is available in [Addepalli 2013].
Rather than simply toggling between cellular and IEEE 802.11 networks, a mo-bile user may use both networks simultaneously. The term multipath refers to thisconnection strategy that consists in simultaneously using multiple available networks.An example of a protocol that relies on the multipath concept is MultiPath TCP(MPTCP) [Handley 2013]. MPTCP is a set of extensions to regular TCP that enableit to run across multiple paths simultaneously. MPTCP introduces the concept of sub-flows (which are regular TCP sessions) managed by the sublayer MPTCP on top ofthem. An MPTCP session can be set up with one or several subflows. If extra pathsare available, a new subflow is created and if a path is disconnected, the correspondingsubflow(s) is(are) discarded. In the same manner, mobility protocols provide multipathsupport.
Multipath enables a broad range of connection strategies. The most obvious con-

2.1. Connecting vehicles to IEEE 802.11 networks 17
sists in using IEEE 802.11 networks to augment continuous connections to cellularnetworks. In this case, MS throughput varies from a baseline that corresponds tothe throughput provided by cellular networks, to the sum of this baseline plus thethroughput provided by IEEE 802.11 network, which can be very high following thelatest IEEE 802.11 amendments (150Mbps with a single spatial stream). Since thecharacteristics of cellular networks and IEEE 802.11 networks differ, it would appearto be possible to send delay-tolerant flows through the link with the lowest latency (theremaining flows being sent through both networks at the same time). If the MS sendsflows through multiple links, it can simply split a flow into two equal parts (or not)and send it through both networks. Alternatively, it can encode all or part of the flowin order to create redundancy should one of the links be unreliable, or even duplicatethe transmission in both links.
2.1.4 Vehicular communications through IEEE 802.11 networks
This section has two goals: first, it outlines the main characteristics of urban IEEE802.11 networks and their evolution over the past decade; and, second, it demonstratesnetwork performance for vehicular communications based on tests performed between2004 and 2014 in various North American and European cities. It highlights the chal-lenges created when a vehicle uses IEEE 802.11 network for infrastructure access.
Sig
nal str
ength
Route of the vehicle
-78
Sig
nal str
ength
Route of the vehicle
Associationtriggering
Handovertriggering
Entry Production phase Entry Production phase Exit
Leavingcoveragerange
phase phase phase
Figure 2.1: Entry, production and exit phases

18 Chapter 2. Related work
2.1.4.1 Urban IEEE 802.11 network deployment
Much research has focused on evaluating the QoS available to vehicles using existingIEEE 802.11 networks, with the aim of determining the extent to which they canbe used in vehicular communications. We survey the performance of urban IEEE802.11 networks deployed over the past decade. This comparative study highlights theevolution of these networks in the past ten years and their shared characteristics.
First, we describe network deployments in terms of metrics such as AP density,channel allocation, QoS and the temporal distribution of users. Then, we focus on theimpact of vehicular speed by distinguishing between the entry phase (i.e. including dis-covery and connection setup), and the production phase (i.e. satisfactory connectivity)of vehicular communications (see Figure 2.1) as described in [Ott 2004, Hadaller 2007].The distinction is relevant because connectivity is often poor during the entry/ exitphases, compared to the production phase, which is mainly due to the fact that duringthe entry phase the MS has to initiate the connection using multiple administrativepackets. It should be noted that here we consider a vehicle that opportunistically con-nects to all available APs (unlike the studies previously mentioned, where the scenarioonly concerns a single AP). The goal is to stay connected for as long as possible by ini-tiating a connection to a new AP when it becomes a suitable alternative to the currentAP. As a result, only the entry and production phases are of interest.
Figure 2.2: Example of the distribution of BSSIDs sensed in an urban environ-ment [Mota 2013]

2.1. Connecting vehicles to IEEE 802.11 networks 19
Network density Table 2.2 shows the number of BSSID (note the a given AP canbroadcast one or several BSSID(s)), and coverage measured in various networks de-ployed between 2006 and 2014; it suggests significant growth in IEEE 802.11 networkdensity in public areas, reaching up to 75 BSSIDs per scan. As a result, the chance offinding a suitable AP in urban areas is relatively high. Note that it would be necessaryto compare the results collected in the same city at two different periods to definitivelyvalidate this trend. An example of the distribution of BSSIDs sensed is shown in Fig-ure 2.2. In contrast, the high density of APs implies that many of them transmit theirsignal in the same channel, leading to potential interference (see the next paragraph forfurther details). In terms of coverage, the results are very different; this is due to theuse of different evaluation methods. Bychkovsky et al. [Bychkovsky 2006] estimated arange of 96m; this could be considered as the best-case scenario as the authors config-ured network interfaces with the maximum allowed transmission power of 200mW. Thedifferent ranges observed in [Mota 2013] and [Castignani 2011b] are explained by thedefinition of a lower bound of −80dBm considered as the limit of the operative powerrange in the latter study. While it could be concluded that the average range of an APis around 50m, the acceptable range for an MS to communicate with the AP is only30m (i.e. 2.1 s at 50 km/h).
The development of public and private APs has meant that IEEE 802.11 networkscover a significant amount of urban public areas. Although coverage is close to completein some locations, areas where an MS can actually access the Internet are not asextensive as for cellular networks. This is, in part, because a significant number of theavailable APs are encrypted. The number of open networks is in the order of 20-30%according to [Mota 2013], [Farshad 2014] and [Castignani 2011b]. Other APs belongto CNs and consequently require the user to authenticate through a Hypertext TransferProtocol Secure (HTTPS) captive portal. However, although there are few APs thatprovide open Internet access, a user that belongs to a community such as Fon2, or issubscribed to an ISP could potentially use many different APs in different cities.
Mota et al. [Mota 2013] considered three CNs that represented more than 55%of the non-encrypted APs detected during their experiments. In order to show howmany APs overlap in these CNs, they built an AP graph for each CN. Two APs wereconsidered to be connected if they were scanned at the same time at least once. Thegraphs of two of these CNs were sparse, meaning that they were not able to providecontinuous connectivity to users by themselves. In contrast, the graph of the largest CN(27.9% of the overall number of APs) was dense, in the sense that it could potentiallyoffer continuous connectivity to mobile users.
2www.fon.com

20 Chapter 2. Related work
B20063 C20114 M20135 C20136 F20147Place Boston Rennes Paris Luxembourg Edinburgh
Mobility Car Pedestrian Bus Pedestrian Bus
Hardware Embeddedcomputer Smartphone Smartphone Smartphone Smartphone
Deployment All APs All APs All APs Hotspot All APs# BSSID/scanmin|median|max
mean
0|∼2.5|20N/A
0|22|75N/A
1|N/A|6627.5
0|∼2|7N/A
0|12|4513.4
AP coverage(m)
96(median) 32.3 (mean) 52.35
(mean) N/A N/A
Table 2.2: Comparison of tested network deployments
Channel allocation and potential interference Usually IEEE 802.11 networksuse 2.4GHz and 5GHz license-free bands. The IEEE 802.11 standard defines multipleamendments that either use one, or both (in the case of the latest amendments) (IEEE802.11n and IEEE 802.11ac). The experiments presented in [Farshad 2014] show thatcurrently, the 2.4GHz band is used far more than the 5GHz band (a ratio of 10:1).This observation is surprising as the penetration of IEEE 802.11n devices is very high,but it may be explained by historical factors. IEEE 802.11g (that only operates in the2.4GHz band) used to be the most popular amendment, thus, to maintain backwardcompatibility, IEEE 802.11n APs continue to use the 2.4GHz band.
IEEE 802.11g defined fourteen 20MHz wide channels from 2412MHz to 2484MHz.Note that the 14th is only used in Japan. Of these, only channels 1, 6 and 11 do notoverlap8. The work of [Eriksson 2008, Giordano 2010b, Castignani 2011b] shows thatthese non-overlapping channels represent between 78% and 83% of cases.
As mentioned before, AP density in urban environments can be very high. As mostAPs are distributed over three channels, this is where most interference occurs and itcan significantly impact link performance. In [Castignani 2011b], a single scan showedan average of 7 APs operating in the same channel, up to a maximum of 41. In addition,APs deployed in overlapping channels, i.e. with a channel separation of less than five,interfered with each other. The number of APs affected by inter-channel interference
3[Bychkovsky 2006]4[Castignani 2011b]5[Mota 2013]6[Castignani 2013]7[Farshad 2014]8For channels available in the United States. In Europe, other combinations are possible such as 1,
5, 9 and 13

2.1. Connecting vehicles to IEEE 802.11 networks 21
was estimated to be approximatively 20% in [Castignani 2011b].The impact of inter- and intra-channel interference is evaluated in [Villegas 2007],
which shows that the interference generated by an IEEE 802.11 device mainly dependson the channel separation with other devices (AP or MS). The worst case is observedwith a separation of one, two, zero and three channel(s) respectively (with between25% and 75% of packets lost). With four channel separation, the impact of interferenceon received throughput is not significant. Finally, five channel separation has almostno impact on link quality. In [Niculescu 2007] the authors define three ranges: thecommunication range where two nodes can decode a given fraction of frames; the carriersensing range where two nodes can sense each other but cannot send frames; and theinterference range where two nodes cannot sense each other but can still interfere. Theinterference range leads to the notion of a hidden terminal or interferer which negativelyimpacts its neighbours’ communication, while it remains undetectable. Note that theinterference described in [Villegas 2007, Niculescu 2007] was evaluated in an indoorenvironment (offices or labs).
One of the side effects of inter-channel interference is that an MS is able to scanAPs that are operating outside the current channel. The probability that such an eventoccurs is estimated to be 0.38 in [Castignani 2011a].
RSS distribution The RSS distribution in an urban deployment reflects the ”true“coverage of IEEE 802.11 networks, i.e., the area where an MS can communicate withthe AP without high packet loss.
Experiments performed in urban environments in [Castignani 2012a, Farshad 2014]have shown that RSS is usually distributed over a range of 25 dB. The distributiondiffers according to the device used to sense the network. When using a smartphone(e.g. the Samsung Galaxy S, Galaxy S3 and HTC Nexus One in the experiment citedhere), the lower 15 dB limit represents between 80% and 90% of the sensed RSS andthe median is under −80dBm. In contrast, the RSS distribution is smoother and themedian value is around −75dBm when the same experiments were performed using alaptop, probably because the laptop was equipped with a high gain antenna.
The correlation between RSS and throughput has been the subject of much research.Zhong et al. [Zhang 2008] state that hardware-based RSS measures are not often cal-ibrated, and that packet delivery predictions based on RSS are often overestimates.However, although the RSS distribution is sometimes not a good indicator of the QoSprovided by an IEEE 802.11 network, [Aguayo 2004, Mhatre 2006, Castignani 2012a]confirm that there is a correlation between RSS distribution, Signal-to-Noise Ratio(SNR) and throughput received by the MS (similar to the packet loss rate). Thesestudies also showed that there is a RSS threshold below which throughput begins todegrade and packet loss increases. These observations allow us to define empirical cri-teria that an IEEE 802.11 network must meet if it is to provide a suitable QoS to an

22 Chapter 2. Related work
MS.
2.1.4.2 Vehicular communications using IEEE 802.11 networks
This section focuses on the impact of vehicular mobility on MS communications usingIEEE 802.11 networks. First, we study the impact of speed on IEEE 802.11 communi-cations. Then we review various studies that evaluate the production and entry phasesusing IEEE 802.11 networks. As described earlier, the production phase as definedin [Ott 2004, Hadaller 2007] and corresponds to the period when the MS has reliableInternet access. It ends when the link quality deteriorates or when the MS triggers anew AP discovery phase and toggles to a new entry phase. The term ”entry phase“refers to the entry into the range of an AP. Both studies observed the connectionbetween one MS and a single AP. Here, we consider the scenario where an MS op-portunistically connects to dense IEEE 802.11 networks. In this case, the entry phasedefines the handover, i.e., the time that elapses between the start of AP discovery andthe first packet that is successfully exchanged between the MS and the Internet.
Effect of speed on link quality Gass et al. [Gass 2005] performed a set of experi-ments to quantify link quality using an IEEE 802.11b AP at different speeds (rangingfrom 5 to 75mph or 8 to 120 km/h). The study looked at the network range, associatedtime, association time and packet loss, but did not find any significant impact of speedon the signal strength received by an MS even at relatively high speeds. Bychkovsky etal. [Bychkovsky 2006] found similar results. Due to the limited range of IEEE 802.11APs, the association time is short. In both studies, the authors pointed out that thisphenomenon is critical for vehicular mobility. When the vehicle speed reaches 50 km/h,an MS remains associated with an AP for only a few seconds. In these conditions, asmooth handover becomes critical in ensuring the association time is a long as possible.
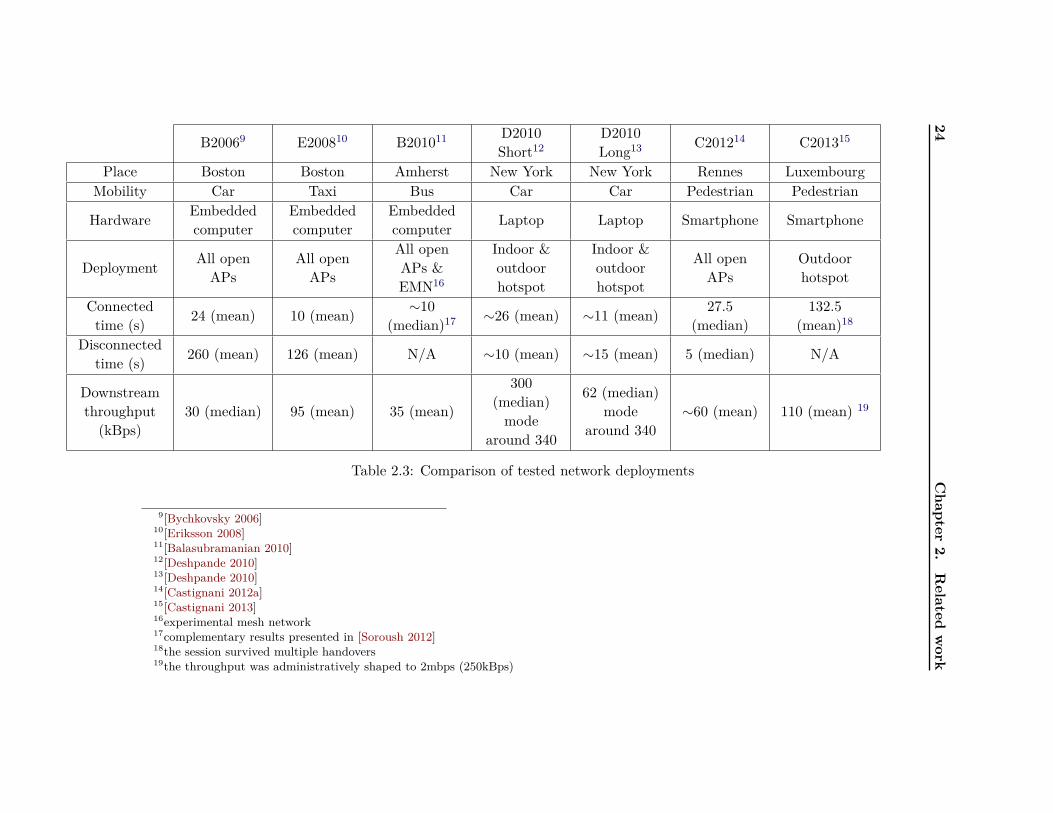
Evaluation of connection time Table 2.3 is a comparison of connection time, i.e.,the duration of the connection to the Internet, based on six studies published between2006 and 2013.
Table 2.3 shows that these times are of the same order (between 10 s and 27.5 s) forall studies except one. This could be explained by two factors. First, the range of APs inthe different types of networks (IEEE 802.11b/g/n) is roughly the same. As mentionedearlier, most networks operate at the same frequency (2.4GHz). In addition, the sameclass of hardware with roughly the same sensitivity was used in all experiments (exceptfor the last two). The network configuration allowed layer-2 roaming (the MS keeps thesame IP after a transition) only in [Deshpande 2010] and [Castignani 2013]. Otherwise,the connection was limited to the coverage of one AP. Note that in [Deshpande 2010]there is no significant gain in terms of connection time, contrary to [Castignani 2013].

2.1. Connecting vehicles to IEEE 802.11 networks 23
However, the disconnection time shown in Table 2.3 suggests that the network thatwas tested in the latter study was much denser. Table 2.3 also shows a significantincrease in throughput. This could be explained by the emergence of new IEEE 802.11amendments and high AP density. Outdoor hotspots, included in [Castignani 2013]do not correspond to high throughput due to administrative restrictions. In contrast,disconnection time was significantly lower in the more recent studies, despite an increasein APs requiring authentication through captive portals, which significantly delay theconnection. This change in disconnection time highlights that the density of IEEE802.11 networks has significantly increased (which confirms the findings reported inSection 2.1.4.1) allowing the MS to find a suitable AP more easily.
These studies show that a moving vehicle that opportunistically connects to avail-able IEEE 802.11 networks can enjoy high throughput for a significantly long period.In addition, most disconnections correspond to a handover. Therefore, it seems that itwill soon be possible to use IEEE 802.11 networks to continuously connect an MS inurban areas assuming that the remaining white areas (i.e. areas where there is no IEEEIEEE 802.11 connectivity) can be covered and if disconnections due to AP discoveryand transitions can be overcome.
24Chapter
2.Related
work
B20069 E200810 B201011 D2010Short12
D2010Long13 C201214 C201315
Place Boston Boston Amherst New York New York Rennes LuxembourgMobility Car Taxi Bus Car Car Pedestrian Pedestrian
Hardware Embeddedcomputer
Embeddedcomputer
Embeddedcomputer Laptop Laptop Smartphone Smartphone
Deployment All openAPs
All openAPs
All openAPs &EMN16
Indoor &outdoorhotspot
Indoor &outdoorhotspot
All openAPs
Outdoorhotspot
Connectedtime (s) 24 (mean) 10 (mean) ∼10
(median)17 ∼26 (mean) ∼11 (mean) 27.5(median)
132.5(mean)18
Disconnectedtime (s) 260 (mean) 126 (mean) N/A ∼10 (mean) ∼15 (mean) 5 (median) N/A
Downstreamthroughput(kBps)
30 (median) 95 (mean) 35 (mean)
300(median)mode
around 340
62 (median)mode
around 340∼60 (mean) 110 (mean) 19
Table 2.3: Comparison of tested network deployments
9[Bychkovsky 2006]10[Eriksson 2008]11[Balasubramanian 2010]12[Deshpande 2010]13[Deshpande 2010]14[Castignani 2012a]15[Castignani 2013]16experimental mesh network17complementary results presented in [Soroush 2012]18the session survived multiple handovers19the throughput was administratively shaped to 2mbps (250kBps)

2.1. Connecting vehicles to IEEE 802.11 networks 25
[Bychkovsky 2006] [Eriksson 2008] [Castignani 2012a]Place Boston Boston Rennes
Mobility Car Taxi Pedestrian
Hardware Embeddedcomputer
Embeddedcomputer Smartphone
Deployment All APs All APs All APsScanning 750ms 306ms (expected) 2 s
Association 560ms 25ms medianDynamic HostConfiguration
Protocol (DHCP)1800ms 197ms 3 s
L3 connectiondelay N/A20 ∼35ms median
Table 2.4: Comparison of handover phases
The impact of handovers Table 2.4 shows the duration of the various steps in thehandover, which is composed of:
1. Scanning: the MS probes nearby APs and selects the best one.
2. Association: the MS sends authentication and association requests to the APin accordance with IEEE 802.11 standards.
3. L3 configuration: the network grants an IP configuration to the MS throughDHCP.
4. L3 connection delay: the time that elapses before receipt of the first packetfrom the Internet. It includes the Address Resolution Protocol (ARP) andDomain Name System (DNS) request/ response exchange and the sending ofa packet to a test server.
5. Authentication to a CN: through a captive portal (not always required).
Scanning and association correspond to the layer-2 handover, while the other stepsare related to the layer-3 handover and above.
The results of the three studies presented in Table 2.4 show that the time requiredfor the handover is in the order of several seconds. The difference between the ∼3 sin [Bychkovsky 2006] and the ∼5 s in [Castignani 2012a] could be explained by theextra time spent by the MS for captive portal authentication. On the other hand,[Eriksson 2008] attempted to optimize the first three steps of the handover. Scanning
20The results suggest that the layer-3 connection delay lasts a few seconds.

26 Chapter 2. Related work
optimization consists of scheduling each channel’s probes according to the probabilitythat there is an AP in this channel (more details in Section 2.2.2.1). Associationis optimized by sending the association request immediately after the authenticationrequest (without waiting for the authentication response). Finally, the IP configurationretrieval using DHCP is optimized by reducing timeouts. This results in a significantreduction in the overall duration of the handover although it is still too long to providea seamless connection between two APs.
In all of these studies, retrieving the IP configuration through DHCP is one of themost time-consuming steps, and there are few workable solutions. In addition to themethod proposed in [Eriksson 2008], an IP configuration caching system is describedin [Bychkovsky 2006]; however, this solution has a limited impact on DHCP delay. Theemergence of IPv6 may reduce the time for IP configuration thanks to the StatelessAddress Autoconfiguration (SLAAC) [Narten 2007].
The layer-2 handover is also slow, particularly the scanning phase, which needs tobe optimized. As shown in the previous section, IEEE 802.11 networks can potentiallyprovide a good QoS to vehicles over long periods. The challenge is to speed up thelayer-2 handover in order to make it transparent for the mobile user.
2.2 L2 handover optimization
2.2.1 IEEE 802.11 discovery and association
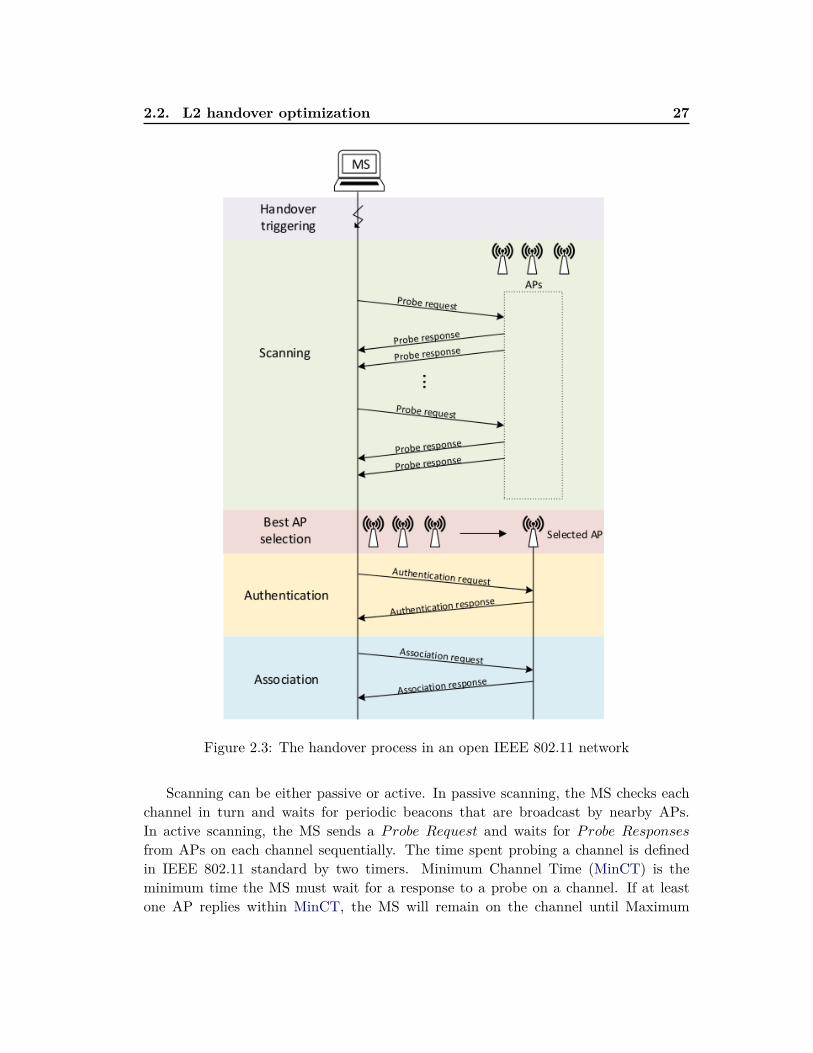
Description In IEEE 802.11 networks the handover takes place client side and iscomposed of five phases (see Figure 2.3):
• Triggering: The MS decides when to start the handover process.
• Scanning: The MS probes for APs in the different channels.
• AP selection: The MS select the “best” AP according to signal strength criteria.
• Authentication: The AP checks the MS’s identity.
• Association: The AP grants the MS access.
The IEEE 802.11 standard defines scanning and authentication/ association proce-dures.
2.2. L2 handover optimization 27
Figure 2.3: The handover process in an open IEEE 802.11 network
Scanning can be either passive or active. In passive scanning, the MS checks eachchannel in turn and waits for periodic beacons that are broadcast by nearby APs.In active scanning, the MS sends a Probe Request and waits for Probe Responsesfrom APs on each channel sequentially. The time spent probing a channel is definedin IEEE 802.11 standard by two timers. Minimum Channel Time (MinCT) is theminimum time the MS must wait for a response to a probe on a channel. If at leastone AP replies within MinCT, the MS will remain on the channel until Maximum

28 Chapter 2. Related work
Channel Time (MaxCT) has expired. Once the MS has selected an AP from the APsthat were discovered during scanning, it starts the association procedure. This be-gins with the authentication phase in which the identity of the MS is verified by anyof the protocols used by the AP. If the AP is open, authentication is limited to anauthentication request/response message exchange. It ends when the AP grants net-work access to the MS. This is done by the exchange of association request/responsemessages.
Although there is no specific rule to trigger the handover, network managers areusually configured to stay connected to the same AP until the link is disconnected,as they are not designed to handle mobility. Similarly, there is no specific rule withrespect to AP selection and the usual solution is to select the AP with the highest RSS.
In the remainder of this manuscript, the term scanning will refer to active scanning,as described above. As the range of IEEE 802.11 APs is short (see the description inSection 2.1.4.1), MS handovers between APs are frequent. During the handover, theMS cannot send or receive data frames, because the wireless interface does not work onthe same channel as the current AP. In practice, this means that the MS is disconnectedduring the whole handover process. The duration of the handover depends on multiplefactors, such as the number of channels to scan, channel timers, the time taken for APselection, or the packet loss rate (high packet loss increases the association time due toretransmissions).
The previous section showed that the native handover scheme is inefficient for out-door mobility. In all of the studies presented, the handover process takes several sec-onds. Prior studies of the standard IEEE 802.11 handover mechanism [Park 2004,Mishra 2004, Velayos 2004, Teng 2009, Castignani 2011a] identified the scanning phaseas the most costly, accounting for up to 90% of the time taken for the whole handoverprocedure.
The following sections present several handover optimizations that have been pro-posed over the past decade, in particular regarding scanning. These enhancements havebeen designed for different mobility contexts (indoor, pedestrian, vehicular, etc.).
2.2.2 Scanning optimization
As mentioned before, scanning is the most time-consuming phase of the handover.Consequently scanning optimization has been the focus of a large number of studiesinto handover optimization. Here, we present a survey of the most relevant scanningoptimizations.
2.2.2.1 Selective scanning
Kim et al. [Park 2004] propose an extension to the Neighbor Graphs (NGs) used tooptimize the association described by Mishra et al. [Mishra 2004], by including data
2.2. L2 handover optimization 29
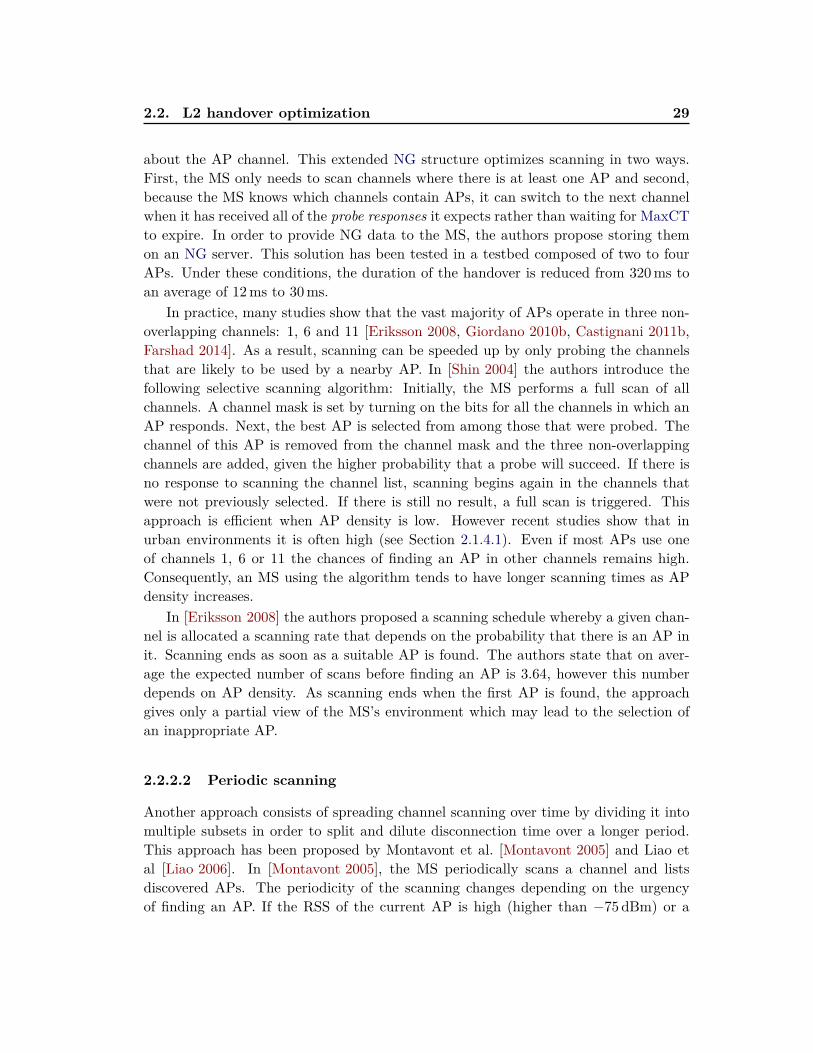
about the AP channel. This extended NG structure optimizes scanning in two ways.First, the MS only needs to scan channels where there is at least one AP and second,because the MS knows which channels contain APs, it can switch to the next channelwhen it has received all of the probe responses it expects rather than waiting for MaxCTto expire. In order to provide NG data to the MS, the authors propose storing themon an NG server. This solution has been tested in a testbed composed of two to fourAPs. Under these conditions, the duration of the handover is reduced from 320ms toan average of 12ms to 30ms.
In practice, many studies show that the vast majority of APs operate in three non-overlapping channels: 1, 6 and 11 [Eriksson 2008, Giordano 2010b, Castignani 2011b,Farshad 2014]. As a result, scanning can be speeded up by only probing the channelsthat are likely to be used by a nearby AP. In [Shin 2004] the authors introduce thefollowing selective scanning algorithm: Initially, the MS performs a full scan of allchannels. A channel mask is set by turning on the bits for all the channels in which anAP responds. Next, the best AP is selected from among those that were probed. Thechannel of this AP is removed from the channel mask and the three non-overlappingchannels are added, given the higher probability that a probe will succeed. If there isno response to scanning the channel list, scanning begins again in the channels thatwere not previously selected. If there is still no result, a full scan is triggered. Thisapproach is efficient when AP density is low. However recent studies show that inurban environments it is often high (see Section 2.1.4.1). Even if most APs use oneof channels 1, 6 or 11 the chances of finding an AP in other channels remains high.Consequently, an MS using the algorithm tends to have longer scanning times as APdensity increases.
In [Eriksson 2008] the authors proposed a scanning schedule whereby a given chan-nel is allocated a scanning rate that depends on the probability that there is an AP init. Scanning ends as soon as a suitable AP is found. The authors state that on aver-age the expected number of scans before finding an AP is 3.64, however this numberdepends on AP density. As scanning ends when the first AP is found, the approachgives only a partial view of the MS’s environment which may lead to the selection ofan inappropriate AP.
2.2.2.2 Periodic scanning
Another approach consists of spreading channel scanning over time by dividing it intomultiple subsets in order to split and dilute disconnection time over a longer period.This approach has been proposed by Montavont et al. [Montavont 2005] and Liao etal [Liao 2006]. In [Montavont 2005], the MS periodically scans a channel and listsdiscovered APs. The periodicity of the scanning changes depending on the urgencyof finding an AP. If the RSS of the current AP is high (higher than −75dBm) or a

30 Chapter 2. Related work
candidate AP has already been found, the interval between scans is set to a randomvalue between 1 s and 2 s. In contrast, if the RSS of the current AP is low, scans aretriggered at random intervals ranging from 200ms to 300ms. The selection is performedas follows: the MS takes the last entry on the candidate AP list and attempts to connectto it. After three failed attempts, it is considered out of range and the MS attemptsto connect with the next AP in the list. In [Liao 2006], the MS returns to the currentchannel for a given length of time between each group scan in order to send data framesthat could not be transmitted during scanning. In order to shorten the scanning phase,the authors propose a reassociation attempt if the MS finds a suitable AP after scanninga group of channels without scanning the rest. As the scanning process lengthens, thehandover is triggered earlier by defining a high RSS threshold. When the RSS dropsbelow this threshold, the MS triggers scanning. If all available APs’ RSSs are lowerthan this threshold, the threshold is decreased and another scan is triggered. If theMS still cannot find any APs with RSS above a given minimum threshold, it selectsthe best candidate AP. This approach reduces packet delay, jitter and packet loss. Inother words, it makes the handover smoother. Packet loss is reduced because the MSstops scanning when a good candidate is found, and buffer overflow is limited as theMS transmits data frames buffered during the scan between each channel sub-scan.The time interval between each group scan is estimated according to the mobility ofthe MS. For instance for a MaxCT of 50ms, an interval of 50ms leads to a maximumscanning duration of 1.1 s which is appropriate to an indoor mobility scenario (i.e.walking speed).
2.2.2.3 Synchronizing beacons
The IEEE 802.11 standard requires APs to periodically broadcast a beacon frame.Typically, this happens at fixed intervals of 100ms. Ramani et al. [Ramani 2005],propose SyncScan, a modification to the infrastructure where all APs in the samechannel broadcast beacon frames at the same time. Moreover, the schedule of groupbroadcasts (corresponding to all the APs in a channel) is staggered across channels.Clients can passively scan by switching channels when a beacon is about to arrive. Thissolution has several advantages. First, scanning can be spread across beacon listeningperiods. This significantly reduces latency as, when a handover must be triggered,the MS can immediately choose a candidate AP and switch to the authentication/association phases. In addition, periodic scanning improves AP selection as the MSdiscovers candidate APs with good RSS before the RSS of the current AP becomestoo low. However, this solution requires that APs have accurate clocks and use a timesynchronization protocol. Furthermore, the authors highlight another issue caused bysynchronization. If there are multiple APs in the same channel and they broadcasttheir beacon at exactly the same time, there will be signal collision, although the

2.2. L2 handover optimization 31
problem could be mitigated by simply adding a random transmission delay to each AP.Finally, frequent channel switching, even for a short period, implies a per-scan overheadexpressed in Equation 2.1.
Overhead = ChannelNum ∗ (2 ∗ SwitchT ime+WaitT ime) (2.1)
Where ChannelNum is the number of channels to be scanned, SwitchT ime is thetime the network interface takes to switch channel, and WaitT ime the time the MSwaits for beacons. Given a potentially large number of available channels, this overheadcould be significant.
2.2.2.4 Reducing scanning timers
The IEEE 802.11 standard does not suggest any value for MinCT and MaxCT. Con-sequently, IEEE 802.11 interface drivers are free to set any value, resulting in differentscanning durations. If the setting is too conservative, the MS may have to wait for along time in order to ensure that all nearby APs are found. Therefore, reducing thetimer is one option that may shorten the handover. On the other hand, the modifica-tion may reduce AP detection efficiency, as a low value of MinCT may be too short forthe first AP to respond and lead to the mistaken conclusion that the channel is empty.In the same way, a low MaxCT may not allow all APs to respond in time. In this case,the MS only obtains a partial view of the network environment.
In [Velayos 2004] the authors proposed theoretical best values for MinCT taking intoaccount optimal channel conditions (the channel is idle and propagation time and proberesponse generation are not considered). According to the Distributed CoordinationFunction (DCF), under these conditions, MinCT is the sum of the DCF InterframeSpace (DIFS) and the maximum number of slots in the minimum contention window,multiplied by the length of a slot. This results in a minimum value of 670µs. Theoptimal value of MaxCT is obtained by simulation. Although their results show thatthis value is not bounded because it depends on the number of stations operating inthe same channel, the authors suggest 10TU (1 TU = 1024µs) in order to avoidoverlapping responses from APs.
The empirical values for AP response time reported in [Castignani 2011a] are fairlydifferent from the theoretical results presented earlier. The authors’ observations ledthem to conclude that AP response time varies with the hardware used and that dis-covery time increases proportionally with the number of APs operating in the samechannel. They found a minimum mean time of 1.28ms for indoor deployment. How-ever, outdoor deployment showed significantly higher response times (mean values upto 8ms). Again, channel concurrency is the main explanation for this observation.In addition, the authors show that the AP response inter-arrival time is stable forup to six responses at around 3ms on average. This means that timers can be set

32 Chapter 2. Related work
dynamically according to the overall target number of responses. The results of thisstudy tend to suggest a minimum value for these timers of around 10ms due to therisks mentioned earlier. This study showed that the overall scanning duration can besignificantly reduced, compared to the results found in urban networks discussed inSection 2.4.
2.2.2.5 Introducing a second network interface
Another interesting way to achieve fast and smooth handovers in IEEE 802.11 networksuses a second radio. Brik et al. [Brik 2005] and Ramachandran et al. [Ramachandran 2006]describe two strategies that can by applied using this principle. A first, naive approachconsists in giving a fixed role to each interface. In other words, one interface is assignedthe scanning role and the other is assigned the data-connection role. The scanninginterface continuously scans nearby APs and, at the end of each scan, feeds the infor-mation to the MS that performs AP selection and triggers the handover. The MS theninforms the data-connection interface that it must handover to the candidate AP. Thisapproach significantly improves handover latency as the data-connection interface onlyperforms the authentication/ association phase.
A second, more efficient approach consists in allowing the scanning interface to asso-ciate with the candidate AP while the data-connection interface is still connected to thecurrent AP. If there is a successful connection, the interfaces exchange roles. In this ap-proach, the whole handover process (and its cost) is transferred to the second interfaceand the data-connection interface stays reachable during the transition. In order to keepthe same layer-3 configuration for MS handovers within the same IEEE 802.11 network,the role transition between interfaces should be transparent for the corresponding APs.To achieve this, both interfaces must have the same Medium Access Control (MAC)address. Experimental work consists of a comparison of the cross correlations betweenthe original and the received audio signal in a Skype21 call in [Brik 2005] and an eval-uation of the inter-arrival time and packet loss in [Ramachandran 2006]. The resultsof these experiments reveal that the handover is completely seamless with the secondmethod. Although these studies provide a real-life proof of concept, their relativelysimple testbeds that rely on short-distance indoor mobility do not fit vehicular mobil-ity patterns. More recently, Annese et al. [Annese 2011] proposed BATMAN, whichis a routing protocol designed for vehicular communications. The layer-2 implementa-tion of this protocol provides seamless connectivity during a handover using a secondradio but focuses mainly on layer-3 issues. In the same context, Ivov et al. [Ivov 2005]propose an optimization of MIPv6, opening up the possibility of using two interfacessimultaneously. The MS uses the second approach described above. Here, when thesecond interface is connected to the candidate AP, and in order to increase the chance
21http://skype.com

2.2. L2 handover optimization 33
that the MS receives all the packets from the HA, the authors propose that the HAbi-casts the stream to both interfaces. Bi-casting lasts until the RSS received fromthe new AP is high enough. Their simulation of the duration of the reconnection pro-cess shows that the approach is suitable if both the current and the candidate AP arereachable within a period of at least 510 ms.
2.2.2.6 Using RSS trends
In order to provide dynamic knowledge of nearby APs, Mhatre et al. [Mhatre 2006]propose exploiting the broadcast nature of the wireless medium by performing contin-uous passive scans in the current and overlapping channels (i.e., taking into account allincoming beacons). Based on this continuous information, the MS computes smoothedRSS trends using the Exponential Weighted Moving Average (EWMA) filter. Then, itpredicts the RSS in the next time interval based on these smoothed trends using theLeast Squares Estimator (LSE). This means that the AP selection process does notselect the best candidate at a given time; instead it selects the AP that will durablyoutperform the current AP (based on short-term RSS changes). As a result, the han-dover paradigm changes from a negative statement: avoiding poor connectivity andpacket loss; to a positive one: selecting an AP that is more likely to provide good RSSin the near future. A similar approach is proposed by Sadiq et al. [Sadiq 2012].
Nevertheless, the capability of such an approach to select the most suitable AP islimited as the probability that a scan finds an AP operating outside the current chan-nel is only 38% in [Castignani 2011a] and the maximum channel distance observed isthree. As a result, the MS only has a partial view of the environment, which signifi-cantly reduces the chances of finding the most sustainable AP. In addition, this kind ofprediction is only useful in the short term as it does not take into account any informa-tion about the user’s motion. This is a critical issue when the MS is in a vehicle. Forinstance, the MS will not be able to predict a sudden signal decrease when the vehicleleaves the Line of Sight (LoS) of the AP after turning at an intersection.
2.2.2.7 Scanning avoidance
In addition to the interleaved scanning strategy proposed by [Montavont 2005], theauthors suggest that the MS builds a list of the characteristics of target APs (MAC ad-dress, channel and SSID) and attempts a positive association (or reassociation) request.In this scenario, the MS can skip the discovery phase described earlier, and instead usesthe list of AP targets. Another approach that attempts to avoid scanning is proposedin [Khan 2012b] using the IEEE 802.21 Media-Independent Handover (MIH) standard.The standard defines data structure and communication resources intended to helpMIH users in network discovery.
IEEE 802.21 is usually used to manage vertical handovers from one type of access

34 Chapter 2. Related work
network to another, but it can also be used for transitions between the same typeof network. The handover procedure is started when the MS receives the MIH LinkGoing Down (LGD) signal from Layer-2 (L2). At that stage the MS sends a MIH GetInformation Request (GIR) message to the Media Independent Information Service(MIIS) including its current GPS location and a custom field that tells the MIIS thatthe MS is looking for the identity of the next AP (Basic Service Set ID (BSSID) andchannel). Upon reception of a GIR, the MIIS computes, for all nearby APs, a fitnessscore based on the distance from the MS, the current load and the authenticationmethod. Next, the MIIS communicates the selected AP to the MS, which can eitherdirectly attempt a connection, or scan its channel in order to make sure it is operating(as described in [Khan 2012a]).
Another infrastructure-based AP selection scheme is proposed in [Berezin 2011].This approach relies on the concept of the Virtual Access Point (VAP) presentedin [Grunenberger 2010]. The AP selection process starts when the AP detects thatthe RSS of the MS has dropped below a given threshold. The current AP startslooking for an alternative AP among its neighbours by sending them a ScanRequestmessage. Upon reception of this message, the nearby APs switch to the MS’s channeland listen to MS’s packets for a certain length of time. APs that could receive packetsfrom the MS reply to the current AP with a ScanResponse message including theRSS of the MS. The current AP chooses the AP with the highest signal and sends it aStationMove to designate it as the selected AP. Next, the current AP sends a messageto the MS stating that it has to switch its channel to the channel of the new AP. Thehandover is transparent for the MS. The major limitation of this approach is that itassumes that AP are VAP; if not, the MS performs the costly IEEE 802.11legacy han-dover. It also assumes that all VAPs are connected to their neighbours, which makesthis solution unrealistic for vehicular communications.
In general, these approaches suffer from a failure to take into account the motion ofthe MS in AP selection. For instance, the handover scheme described in [Khan 2012b]only requires the actual location of the MS while no information is required about itsmotion. It is reasonable to assume that AP selection will be different according to thedirection of the MS.
2.2.3 Scanning inaccuracy
Although the impact of scanning on the duration of the handover can be significantlyreduced and even eliminated, it still suffers from inaccurate results and partial infor-mation. There are multiple reasons for this. First, scanning is an instantaneous sensingof the network at one particular time, thus, it does not always reflect reality. Beaconloss can lead to the scan missing an available AP, especially in dense deployments, likethose discussed in [Castignani 2012b, Arcia-Moret 2014]. Moreover, multiple empirical

2.2. L2 handover optimization 35
studies show that RSS changes appreciably from one probe to the next [Aguayo 2004].In order to build a reliable picture of nearby APs’ RSS it is necessary to take multiplesamples and smooth the distribution. If the MS is moving, this method can also showRSS trends in the short term as described in [Mhatre 2006]. However, it requires theMS to spend a lot of time on each channel leading to long disconnections, or a focuson the current channel to the exclusion of others. In fact, the snapshot of the currentnetwork configuration provided by scans reflects reality only for a given period, whichdepends on MS mobility. In the case of a vehicle moving at 50 km/h the MS leaves therange of an AP in a few seconds. In addition, the MS can suddenly leave the LoS ofthe current AP (e.g. when the MS is hidden by a roadside artefact or a building, orwhen the vehicle turns). This makes scanning inefficient because it does not provideany information that could help to prevent such events.
In conclusion, as stated in [Mhatre 2006], the handover paradigm must shift froma negative definition (avoid imminent disconnection) to a positive one (selecting theAP that is most likely to provide good RSS in the near future). With this aim, otherways need to be found to provide information about the network environment to theMS. In addition, vehicular mobility characteristics such as trajectory limitations withindefined areas (streets, car parks, etc.) can significantly ease predictions of location.
2.2.4 Predictive handover
In order to allow the MS to anticipate the short-term evolution of the network, it iscritical to provide vehicle mobility information. Based on the fact that people usuallydrive on known routes, Deshpande et al. [Deshpande 2009] propose replacing scanningwith AP selection using historical information. While driving, the MS learns and cachesinformation about nearby APs (Extended Service Set ID (ESSID), BSSID, channel) byfrequently probing networks during inactive periods. This information is used to scriptthe handover location in advance such that the MS is always connected to the bestcandidate AP. Another approach is proposed by Kwak et al. [Kwak 2009], who suggestmaintaining the vehicle’s trajectory and neighbour information in order to select APsalong the vehicle’s path and predict an optimal handover location. This approach wasinvestigated by Montavont et al. [Montavont 2006] who propose extending the MobileIPv6 (MIPv6) architecture with a new component, a GPS server that is periodicallyupdated with the location of the MS. Based on changes in the location of the MSand prior knowledge of AP locations, channels, BSSIDs and Internet Protocol version6 (IPv6) prefixes, the GPS server triggers a handover to the closest AP when the MS isabout to leave the range of the current AP by sending it a handover indication packet.

36 Chapter 2. Related work
2.2.5 Reassociation optimization
2.2.5.1 IEEE 802.11f
The IEEE 802.11f trial-use standard, proposed in 2004 by the IEEE consortium rec-ommends practices for multi-vendor AP interoperability. With this aim, IEEE 802.11fproposes the Inter-Access Point Protocol (IAPP). The main objective is to maintainan association between an MS and a single AP during handover. At the first associa-tion, the MS sends an association request to the candidate AP. When the MS and theAP are associated, the AP broadcasts an Add-Notify message notifying the associationwith the MS. Upon reception of the Add-Notify, other APs clear any stale associations.When the MS hands-off to another AP, the MS sends a reassociation message contain-ing the identity of the current AP to the candidate AP. The candidate AP sends aMove-Notify message to the current AP requesting the MS context and notifying thenew association. The current AP replies with a Move-Response message.
Mishra et al. [Mishra 2004] observe that in the IEEE 802.11f context the transfer isperformed reactively, which delays the association phase. In order to reduce this delay,the authors propose pro-actively sending the MS context to neighbouring APs. Theseare selected using NG, which capture the reassociation relationship, i.e. a potentialhandover from one AP to another, between access points. The NG is automaticallygenerated by APs over time when they receive a reassociation request from an MS ora Move-Notify from another AP. The experiments conducted in this paper show thatassociation latency is reduced from 15.37ms to 1.7ms. An improved version is proposedby Park et al. [Pack 2005] that attempts to reduce data overheads caused by sendingthe MS context to all neighbours. With this aim, the authors suggest evaluating theprobability of possible transitions and sending the MS context only to those APs forwhich the association probability is higher than a given threshold.
2.2.5.2 IEEE 802.11r
IEEE 802.11r, otherwise known as Fast Basic Service Set Transition (FBSST) is appliedwhen the network uses secure authentication. In IEEE 802.11 standards, during thehandover, the MS reauthenticates and reassociates with the candidate AP. Thus, whenIEEE 802.1x is used to secure communications, the MS is required to renegotiate itskeys with the authentication server (e.g. a RADIUS server) at each handover. Thiskey negotiation procedure significantly delays the handover. In order to reduce this,IEEE 802.11r allows the AP to cache the key from the server in order to avoid the fullauthentication process and only exchange the classic authentication request/ responsemessages. Bangolae et al. [Bangolae 2006] evaluate IEEE 802.11r in a basic setup oftwo APs. Their results show that the duration of the IEEE 802.11r handover is 42msversus 525ms in a legacy implementation.

2.2. L2 handover optimization 37
2.2.5.3 AP management centralization
The adoption of the Lightweight Access Point Protocol (LWAPP) by the IETF inFebruary 2010 highlights the trend of centralizing IEEE 802.11 network management.Proposed by Airespace (subsequently purchased by Cisco), this protocol is available inall Cisco IEEE 802.11 networks. LWAPP proposes the transfer of multiple features fromAPs to an Access Controller (AC), which becomes responsible for bridging, forwarding,authentication, policy enforcement and optionally, encryption of user traffic on thenetwork. The goal of LWAPP is to facilitate network management based on a singlestorage point for the network configuration (e.g. MAC lists, QoS allocation, AESauthentication keys), decision-making and more efficient use of the computing powerof APs.
During the handover, authentication and association requests are forwarded by theAP to the AC. Authentication/ association responses are sent by either the AP orthe AC but the AC is always in charge of negotiating the key in a secure connection.The QoS provided to the MS is also negotiated by the AC. Therefore, unlike IEEE802.11f-compliant networks, there is no need to transfer the MS context. To the bestof our knowledge there is no publicly-available evaluation of the impact of LWAPP onthe association/ reassociation delay.
2.2.6 Discussion
Vehicular communications rely on the potential of at least some vehicles to have Inter-net access. Currently, a vehicle can use either cellular or IEEE 802.11 networks thatare densely deployed in urban areas. Although IEEE 802.11 networks provide highthroughput and can respond to the speed of a vehicle, their range is short, leading tofrequent and costly handovers between APs. This impact must be reduced in orderto provide a continuous connection. Furthermore, as stated by [Mhatre 2006], thehandover paradigm must change from a negative definition (avoid imminent disconnec-tion) to a positive one (selecting an AP that is more likely to provide good RSS in thenear future). This can be achieved by using other criteria to trigger the handover andoptimizing the scanning phase. The scanning phase is the typical target of handoveroptimization; firstly because it is the most time-consuming, and secondly because itonly provides a snapshot of nearby networks when mobile vehicles need data about theirshort-term evolution. In order to enable a predictive handover that can pro-activelyselect and associate with the best AP as soon as it become available (and not when thelink with the current AP goes down), the MS must be provided with extra informationabout nearby networks.


Chapter 3
Enhancing the efficiency of IEEE802.11 networks under vehicular
mobility
Contents3.1 Introduction . . . . . . . . . . . . . . . . . . . . . . . . . . . . . . 40
3.1.1 Context . . . . . . . . . . . . . . . . . . . . . . . . . . . . . . . . . 403.1.2 Objectives . . . . . . . . . . . . . . . . . . . . . . . . . . . . . . . . 443.1.3 Propositions . . . . . . . . . . . . . . . . . . . . . . . . . . . . . . 45
3.2 Introducing a second interface: evaluation of a make-before-break approach in vehicular communication . . . . . . . . . . . 46
3.2.1 The make-before-break approach . . . . . . . . . . . . . . . . . . . 463.2.2 Implementation . . . . . . . . . . . . . . . . . . . . . . . . . . . . . 523.2.3 Scanning inaccuracy under vehicular mobility . . . . . . . . . . . . 52
3.3 Replacing scanning with prior knowledge of the network . . . 533.3.1 Basic principles . . . . . . . . . . . . . . . . . . . . . . . . . . . . . 533.3.2 Building prior knowledge of the network . . . . . . . . . . . . . . . 543.3.3 MROAD AP selection . . . . . . . . . . . . . . . . . . . . . . . . . 573.3.4 Implementation . . . . . . . . . . . . . . . . . . . . . . . . . . . . . 613.3.5 Improving MROAD . . . . . . . . . . . . . . . . . . . . . . . . . . 62
3.4 Adding vehicle mobility to the AP selection process . . . . . . 633.4.1 Basic principles . . . . . . . . . . . . . . . . . . . . . . . . . . . . . 633.4.2 CDB construction . . . . . . . . . . . . . . . . . . . . . . . . . . . 633.4.3 Direction detection module . . . . . . . . . . . . . . . . . . . . . . 65
3.4.3.1 Description . . . . . . . . . . . . . . . . . . . . . . . . . . 653.4.3.2 How far can the DMM predict? . . . . . . . . . . . . . . 69
3.4.4 COPER AP selection . . . . . . . . . . . . . . . . . . . . . . . . . 703.4.5 Connection module . . . . . . . . . . . . . . . . . . . . . . . . . . . 73
3.5 Conclusion . . . . . . . . . . . . . . . . . . . . . . . . . . . . . . . 74
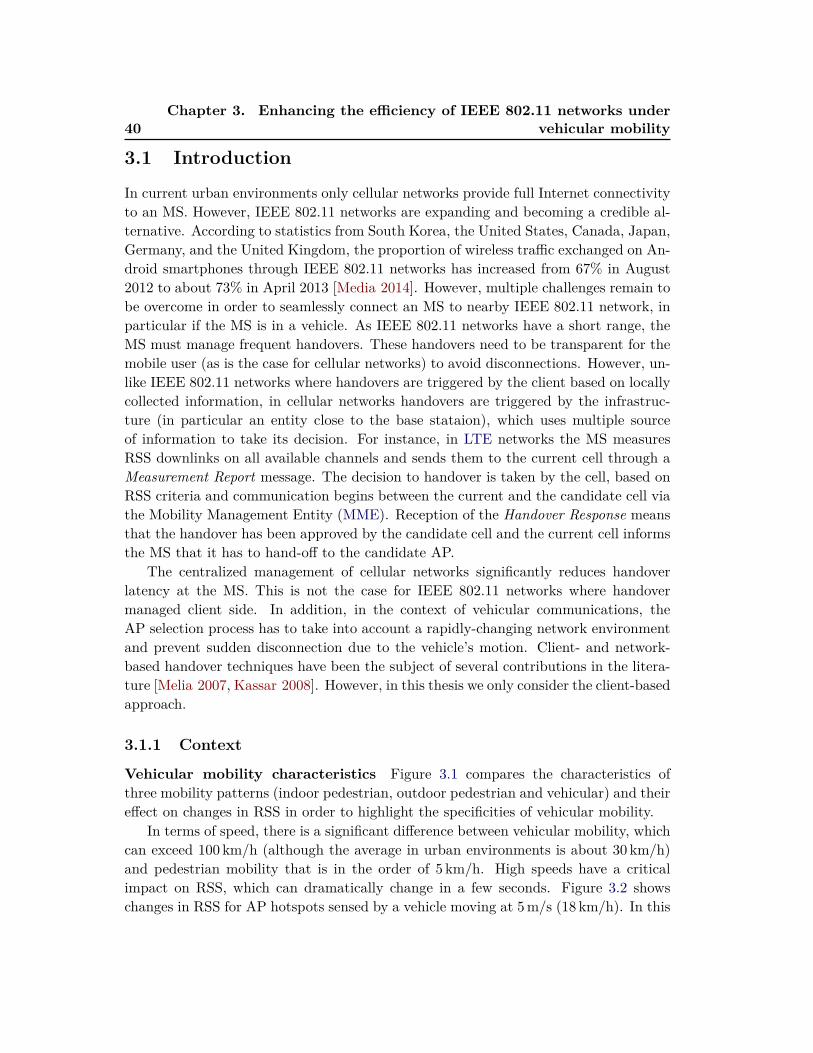
40Chapter 3. Enhancing the efficiency of IEEE 802.11 networks under
vehicular mobility
3.1 Introduction
In current urban environments only cellular networks provide full Internet connectivityto an MS. However, IEEE 802.11 networks are expanding and becoming a credible al-ternative. According to statistics from South Korea, the United States, Canada, Japan,Germany, and the United Kingdom, the proportion of wireless traffic exchanged on An-droid smartphones through IEEE 802.11 networks has increased from 67% in August2012 to about 73% in April 2013 [Media 2014]. However, multiple challenges remain tobe overcome in order to seamlessly connect an MS to nearby IEEE 802.11 network, inparticular if the MS is in a vehicle. As IEEE 802.11 networks have a short range, theMS must manage frequent handovers. These handovers need to be transparent for themobile user (as is the case for cellular networks) to avoid disconnections. However, un-like IEEE 802.11 networks where handovers are triggered by the client based on locallycollected information, in cellular networks handovers are triggered by the infrastruc-ture (in particular an entity close to the base stataion), which uses multiple sourceof information to take its decision. For instance, in LTE networks the MS measuresRSS downlinks on all available channels and sends them to the current cell through aMeasurement Report message. The decision to handover is taken by the cell, based onRSS criteria and communication begins between the current and the candidate cell viathe Mobility Management Entity (MME). Reception of the Handover Response meansthat the handover has been approved by the candidate cell and the current cell informsthe MS that it has to hand-off to the candidate AP.
The centralized management of cellular networks significantly reduces handoverlatency at the MS. This is not the case for IEEE 802.11 networks where handovermanaged client side. In addition, in the context of vehicular communications, theAP selection process has to take into account a rapidly-changing network environmentand prevent sudden disconnection due to the vehicle’s motion. Client- and network-based handover techniques have been the subject of several contributions in the litera-ture [Melia 2007, Kassar 2008]. However, in this thesis we only consider the client-basedapproach.
3.1.1 Context
Vehicular mobility characteristics Figure 3.1 compares the characteristics ofthree mobility patterns (indoor pedestrian, outdoor pedestrian and vehicular) and theireffect on changes in RSS in order to highlight the specificities of vehicular mobility.
In terms of speed, there is a significant difference between vehicular mobility, whichcan exceed 100 km/h (although the average in urban environments is about 30 km/h)and pedestrian mobility that is in the order of 5 km/h. High speeds have a criticalimpact on RSS, which can dramatically change in a few seconds. Figure 3.2 showschanges in RSS for AP hotspots sensed by a vehicle moving at 5m/s (18 km/h). In this
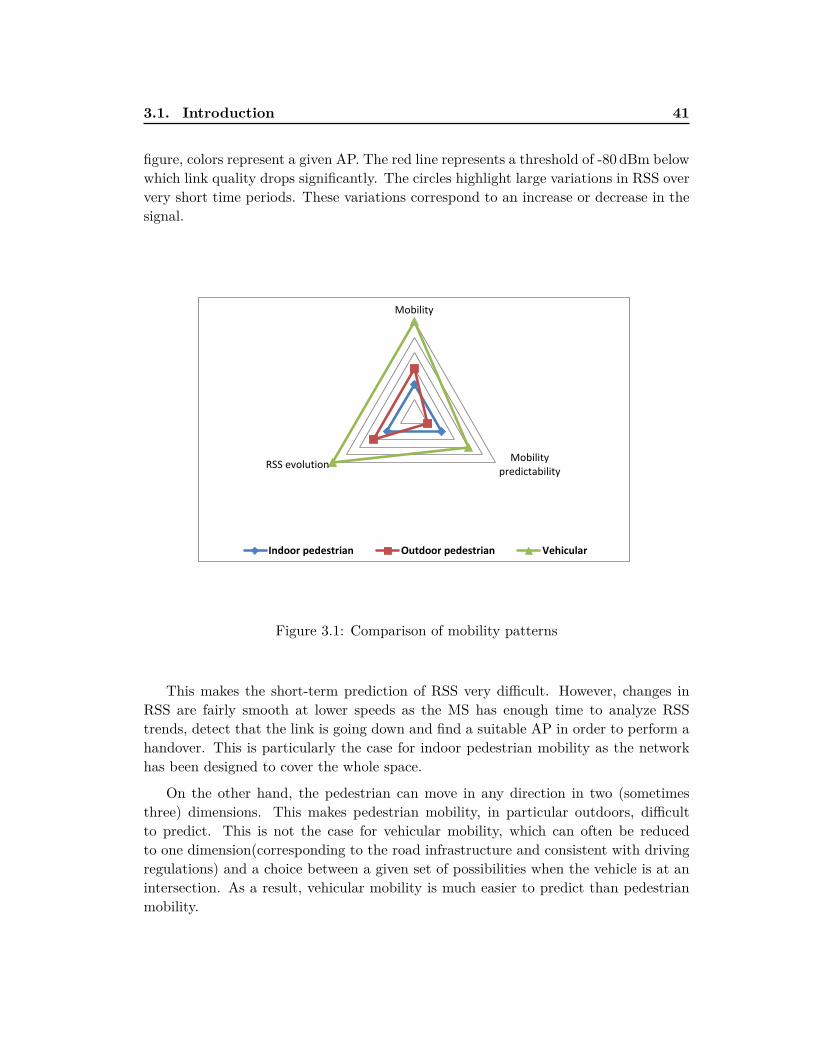
3.1. Introduction 41
figure, colors represent a given AP. The red line represents a threshold of -80 dBm belowwhich link quality drops significantly. The circles highlight large variations in RSS oververy short time periods. These variations correspond to an increase or decrease in thesignal.
Mobility
Mobilitypredictability
RSS evolution
Indoor pedestrian Outdoor pedestrian Vehicular
Figure 3.1: Comparison of mobility patterns
This makes the short-term prediction of RSS very difficult. However, changes inRSS are fairly smooth at lower speeds as the MS has enough time to analyze RSStrends, detect that the link is going down and find a suitable AP in order to perform ahandover. This is particularly the case for indoor pedestrian mobility as the networkhas been designed to cover the whole space.
On the other hand, the pedestrian can move in any direction in two (sometimesthree) dimensions. This makes pedestrian mobility, in particular outdoors, difficultto predict. This is not the case for vehicular mobility, which can often be reducedto one dimension(corresponding to the road infrastructure and consistent with drivingregulations) and a choice between a given set of possibilities when the vehicle is at anintersection. As a result, vehicular mobility is much easier to predict than pedestrianmobility.

42Chapter 3. Enhancing the efficiency of IEEE 802.11 networks under
vehicular mobility
-100
-90
-80
-70
-60
-50
0 20 40 60 80 100 120
Sig
na
l str
en
gth
[d
Bm
]
Time [s]
High RSS variation
Figure 3.2: Changes in RSS under vehicular mobility
Legacy IEEE 802.11 handover under vehicular mobility We conducted a setof preliminary experiments to evaluate how standard IEEE 802.11 handovers in urbannetworks perform when used in vehicular mobility conditions. This preliminary study(i) provides a baseline for the legacy solution that can be compared with the solutionspresented later in this section, (ii) evaluates the impact of vehicular mobility on MScommunication, and (iii) evaluates the impact of the handover in the particular networkconsidered in our work. Experiments were based on a commercial metro-scale IEEE802.11 deployment (HotCity) in the city of Luxembourg. A detailed description ofthe HotCity network can be found in the next chapter. We used a WPA-supplicant(v0.73), which is a widely-used wireless connection daemon. As mentioned earlier, thetrigger for the handover and AP selection are not defined in IEEE 802.11. In the caseof a WPA-supplicant the handover is triggered when the RSS of the current AP dropsbelow a given threshold. The WPA-supplicant selects the AP having the highest RSSas a candidate AP.
The following scenario was used: A vehicle moves at various constant speeds (15, 30and 50 km/h) along an 875m straight road. It accelerates, reaches its maximum speedand maintains this speed throughout the experiment. In order to mitigate the effects ofother users at the same location accessing the network, we performed the experimentat night. The Internet connection was tested using an intensive TCP download from aweb server.
Effect of speed and RSS handover threshold We conducted a comparativestudy of the duration of the connection and the data collected using various thresholdsto trigger the handover. Figure 3.3 illustrates the mean throughput of the MS for

3.1. Introduction 43
different RSS thresholds (from −60dBm to −85dBm) at different speeds. This figureshows that vehicle speed has a critical impact on mean throughput. This is becausethe duration of the handover does not depend on the mobility of the MS when the timespent in the range of an AP is short. In addition, the trigger for the handover has asignificant impact on received throughput. It appears that there is a trade-off betweenhigh RSS thresholds that produce too-frequent handovers, and low RSS thresholds thatleave the MS connected to the current AP even when its RSS is too low to providegood link quality. As a result, we concluded that an RSS threshold of −75dBm offersbetter average throughput along the path at all speeds.
400
600
800
1000
1200
1400
1600
1800
2000
-60 -65 -70 -75 -80 -85
Me
an
th
rou
gh
pu
t (K
bp
s)
RSSI threshold (dBm)
15km/h 30km/h 50km/h
Figure 3.3: Mean throughput for different RSS handover thresholds
Handover duration Figure 3.4 shows the downstream TCP throughput of arepresentative run at 30 km/h. The color of the lines indicates the AP the MS is con-nected to. The vertical dashed lines illustrate instants when the vehicle passes closestto a given AP. Note that TCP throughput can be clustered into two distinct categories:high values (between 1500 and 3000Kbps) and very low values (lower than 500 kbps).In all experiments, low values are observed almost exclusively when the handover isexecuted. After performing 15 experimental runs, we observed that an average of 3.6handovers are executed during an average experiment lasting 105 s. The client remainsconnected to the same AP for 21 s and disconnected for 6.7 s on average. These re-

44Chapter 3. Enhancing the efficiency of IEEE 802.11 networks under
vehicular mobility
sults are consistent with related work [Deshpande 2010, Castignani 2012a]. Finally,the reconnection period was the main source of low throughput in our experiments.
0
500
1000
1500
2000
2500
3000
3500
0 20 40 60 80 100
AP1 AP2 AP3 AP4 AP5 AP6 AP7
Th
rou
gh
pu
t (K
bp
s)
Time (s)
Figure 3.4: Downlink throughput
Our measurements show that handovers account for between 15 % and 30 % of theduration of the experiment. Moreover, we measured the contribution of the scanningprocess for each handover. This was calculated as the average time that elapsed betweenwhen the handover was triggered (i.e., current AP RSS lower than −75dBm) and thebeginning of the authentication phase, which here represents 75% of the duration ofthe handover. This result is consistent with previous studies [Park 2004, Mishra 2004,Velayos 2004, Teng 2009, Castignani 2011a].
3.1.2 Objectives
These experiments highlight two ways to optimize vehicular communication in IEEE802.11 networks. Firstly, a seamless MS handover and, secondly, the considerationof vehicular mobility during AP selection. In both cases, the scanning phase is thecentral element as it is the most time-consuming aspect of the handover, and becauseAP selection relies on the information provided by it.

3.1. Introduction 45
Seamless handovers In order to optimize vehicular communications through IEEE802.11 networks, the first objective is to eliminate the impact of the handover suchthat mobile users remain fully connected. This thesis focuses on the optimizationof the Layer-2 (L2) handover. The most time-consuming phase of this handover isscanning, during which the MS periodically switches to all available channels to probefor nearby APs. Its duration depends on the number of channels and the time spentscanning each channel. The IEEE 802.11g standard specifies up to 14 channels. ForIEEE 802.11n, which operates in both 2.4GHz and 5GHz channels, this number raisesto 30 [FCC 2014]. As a result, the legacy scanning procedure leads to long delays thatare not compatible with the objective of seamless transitions. Eliminating its impactis, thus, a priority.
Efficient AP selection In current urban environments, the density of IEEE 802.11APs is high enough for the MS to frequently be within the range of multiple APs [Mota 2013,Castignani 2013]. The MS needs to find the one that performs best based on the alwaysbest connected paradigm [Gustafsson 2003]. This task is difficult to achieve if we onlyconsider scanning information. The RSS snapshot of nearby APs is only valid for avery short time if the vehicle is moving. In order to select the best AP, i.e., the APproviding the highest RSS in the near future, it is necessary to have information aboutshort-term changes in RSS of nearby APs. Based on this information, the MS shouldbe able to select a candidate AP as soon as this AP becomes the best option. Thisleads to a change in the handover paradigm. Rather than triggering the handover whenthe MS considers that it is necessary due to an imminent disconnection, it occurs whena new best AP is detected. The aim of this approach is to optimally exploit nearbyIEEE 802.11 networks by maximizing the RSS of the MS.
3.1.3 Propositions
In this thesis we make three proposals intended to make the handover seamless and tooptimize the AP selection process.
A second interface for seamless handovers The introduction of a second in-terface has been proposed before in the literature. Some of this work is described inSection 2.2.2.5. The approach makes it possible to achieve the first objective of thiswork i.e., remove the impact of the handover by handling the scanning and authen-tication/ association in the second interface while the first remains connected to thenetwork. However, this does not enhance AP selection policy. Therefore, althoughit is a suitable approach for vehicular communication, it does not alone fulfil all therequirements. The implementation of the approach is used to evaluate on the onehand, gains in terms of connection time, and on the other hand, the negative impact

46Chapter 3. Enhancing the efficiency of IEEE 802.11 networks under
vehicular mobility
of scanning-based AP selection.
Replacing scanning by prior knowledge of network characteristics As men-tioned earlier, the scanning process slows down the handover significantly and does notprovide enough information to allow the MS to choose the best AP. To overcome theseissues, we propose removing scanning from the handover process. It is replaced byprior knowledge of the network topology and a simulated RSS. Based on this informa-tion, the MS can deduce from its current location the most suitable AP in all possibledirections. In out work, this happens when a vehicle approaches an intersection andthe AP chooses the best APs in the available directions.
Including vehicular mobility predictions in AP selection In most cases, onlythe driver of the vehicle knows the destination and the route that will be taken. This isan issue for AP selection since, even if the MS has prior knowledge of the location andRSS of all of the APs along the entire route, the best AP depends on the direction takenat an intersection. In order to provide optimal AP selection, there is a need to predictthis direction. This must be performed on the fly since the MS has no informationabout the vehicle’s route. The method proposed in this thesis is based on an analysisof the vehicle’s trajectory. Knowledge acquired on the fly allows the MS to choose thebest possible APs, based on prior knowledge of network topology and a simulated RSS,which corresponds to the direction taken by the vehicle.
3.2 Introducing a second interface: evaluation of a make-before-break approach in vehicular communication
An MS using the standard IEEE 802.11 handover process needs to perform severalactions outside the channel of the current AP in order to be granted access to thecandidate AP. Although they are necessary, there is no requirement for them to beperformed by the interface connected with the current AP. Therefore, it is possible torelocate them to a second interface. As there are no space or energy constraints invehicles, a second radio may be a suitable solution for vehicular communications. Inthis case, the handover to the candidate takes place before the link is broken with thecurrent AP; this is called the make-before-break approach.
3.2.1 The make-before-break approach
The solution considered in this thesis is based on the algorithms proposed by Ra-machandran et al. [Ramachandran 2006]. The authors propose a make-before-breakmechanism relying on a second IEEE 802.11 radio. Two L2 roaming algorithms aredescribed: a two-card static algorithm (referred to here as static, indicating the “static

3.2. Introducing a second interface: evaluation of a make-before-breakapproach in vehicular communication 47
roles” algorithm), and a two-card dynamic algorithm (referred to here as dynamic,indicating the “dynamic roles” algorithm).
The static algorithm The static algorithm completely decouples scanning and thedata-connection roles and creates separate interfaces (namely, the scanning interfaceand the data-connection interface respectively). As depicted in Figure 3.5(a), thescanning interface continuously probes all channels, gathers information about nearbyAPs and decides whether one of the candidate APs is better than the current AP interms of RSS. We refer to this candidate AP as the best AP. The scanning interfaceshares information about the best available APs with the data-connection interfacethrough a common resource, a description file located in the user space. The data-connection interface first tries to associate to the best AP. If the connection attemptfails, it rechecks the common resource for a new best AP and attempts a new connection.On the other hand, if the connection succeeds, the MS performs data communicationthrough the new AP. The data-connection interface continues to make periodic checksof the best AP information on the common resource. When the best AP changes,it tries to roam to it. The message exchange during the handover using the staticalgorithm is depicted in Figure 3.6.
During the handover, the data-connection interface simply performs authenticationand association with the best AP discovered by the scanning interface. This reduces thelength of the handover to authentication and association latency. It also provides betterknowledge of nearby APs, since the scanning interface can retrieve AP informationmore often without caring about the impact of scanning. However, as the algorithmis based on a break-before-make handover approach the MS can still be disconnected,even if for a much shorter time.
The dynamic algorithm The dynamic algorithm aims to completely eliminate dis-connection during handover (see Figure 3.5(b)). For the first connection, the scan-ning interface provides the best AP information to the common resource. Then, thedata-connection interface attempts an association with the best AP. If this connectionsucceeds, the data-connection interface keeps exchanging data until the scanning in-terface performs a new connection to a different AP. This occurs because the scanninginterface will continuously look for a new best AP and attempt the connection by itself,without asking the data-connection interface to attempt the new connection. Note thatat this particular moment, the interfaces switch roles. If the scanning interface failsin attempting the new connection, it will first perform a new scan before trying againto associate. When the roles of the interfaces are exchanged, Layer-3 (L3) settings (IPaddressing and the routing table) are transferred from the former data-connection in-terface to the new one. The message exchange during the handover using the dynamicalgorithm is depicted in Figure 3.7.

48Chapter 3. Enhancing the efficiency of IEEE 802.11 networks under
vehicular mobility
Start
Connect to best AP
Connection succeeded?
Best AP changed?
Start
Set best AP
Scan
YES
YES
NO
NO
Data-connection interface Scanning interface
Check best AP
Best AP
Check best AP
(a) Static algorithm
Start
Connect to best AP
Connection succeeded?
Is scanning interface
connected?
Start
Set best AP
Scan
Best AP changed?
Connect to best AP
Connection succeeded?
Take role Scanning
Take role Data Connection
Disconnect
Take role Scanning
Notify connection
YES
YES
YES
YES
NO
NO
NO
NO
Check scanning interface is connected
Data connection role Scanning role
Best AP
Check best AP
Take role Data Connection
(b) Dynamic algorithm
Figure 3.5: Implementation of static and dynamic algorithms

3.2. Introducing a second interface: evaluation of a make-before-breakapproach in vehicular communication 49
Unlike the static algorithm, if there is a good candidate AP to roam to, the MSwill no longer be disconnected, and the handover has no effect on client connectivity.However, the algorithm implies that the MS is simultaneously connected to the samenetwork through two different interfaces. This issue requires important changes eitheron the client or the network side. The scanning interface can connect to the networkat the same time as the data-connection interface if and only if one of the two followingconditions is met. First, the network allows two simultaneous connections with twointerfaces from the same client and allocates them the same IP address. Second, theclient hides the fact that it has two interfaces by assigning them the same MAC ad-dress. As we used a commercial network for our experiments, we were not allowed tointroduce the first modification. Thus, we decided to use the same MAC address forboth interfaces.

50Chapter 3. Enhancing the efficiency of IEEE 802.11 networks under
vehicular mobility
Figure 3.6: Handover using the static algorithm

3.2. Introducing a second interface: evaluation of a make-before-breakapproach in vehicular communication 51
Figure 3.7: Handover using the dynamic algorithm
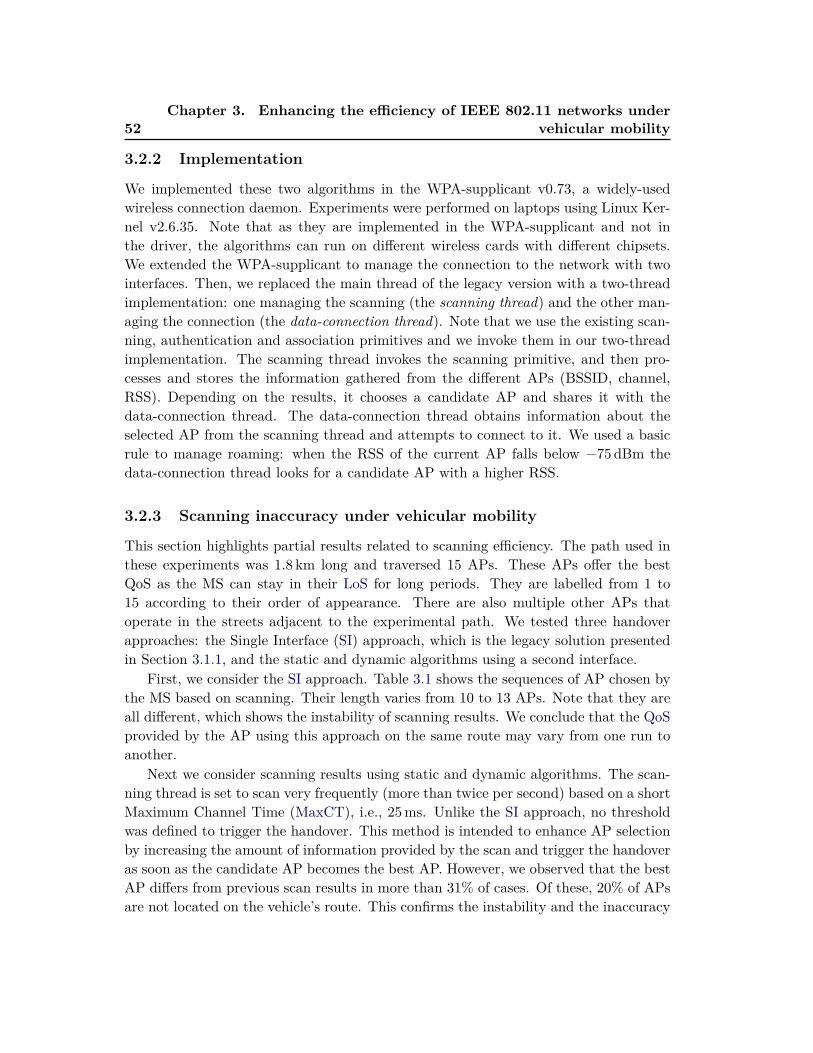
52Chapter 3. Enhancing the efficiency of IEEE 802.11 networks under
vehicular mobility
3.2.2 Implementation
We implemented these two algorithms in the WPA-supplicant v0.73, a widely-usedwireless connection daemon. Experiments were performed on laptops using Linux Ker-nel v2.6.35. Note that as they are implemented in the WPA-supplicant and not inthe driver, the algorithms can run on different wireless cards with different chipsets.We extended the WPA-supplicant to manage the connection to the network with twointerfaces. Then, we replaced the main thread of the legacy version with a two-threadimplementation: one managing the scanning (the scanning thread) and the other man-aging the connection (the data-connection thread). Note that we use the existing scan-ning, authentication and association primitives and we invoke them in our two-threadimplementation. The scanning thread invokes the scanning primitive, and then pro-cesses and stores the information gathered from the different APs (BSSID, channel,RSS). Depending on the results, it chooses a candidate AP and shares it with thedata-connection thread. The data-connection thread obtains information about theselected AP from the scanning thread and attempts to connect to it. We used a basicrule to manage roaming: when the RSS of the current AP falls below −75dBm thedata-connection thread looks for a candidate AP with a higher RSS.
3.2.3 Scanning inaccuracy under vehicular mobility
This section highlights partial results related to scanning efficiency. The path used inthese experiments was 1.8 km long and traversed 15 APs. These APs offer the bestQoS as the MS can stay in their LoS for long periods. They are labelled from 1 to15 according to their order of appearance. There are also multiple other APs thatoperate in the streets adjacent to the experimental path. We tested three handoverapproaches: the Single Interface (SI) approach, which is the legacy solution presentedin Section 3.1.1, and the static and dynamic algorithms using a second interface.
First, we consider the SI approach. Table 3.1 shows the sequences of AP chosen bythe MS based on scanning. Their length varies from 10 to 13 APs. Note that they areall different, which shows the instability of scanning results. We conclude that the QoSprovided by the AP using this approach on the same route may vary from one run toanother.
Next we consider scanning results using static and dynamic algorithms. The scan-ning thread is set to scan very frequently (more than twice per second) based on a shortMaximum Channel Time (MaxCT), i.e., 25ms. Unlike the SI approach, no thresholdwas defined to trigger the handover. This method is intended to enhance AP selectionby increasing the amount of information provided by the scan and trigger the handoveras soon as the candidate AP becomes the best AP. However, we observed that the bestAP differs from previous scan results in more than 31% of cases. Of these, 20% of APsare not located on the vehicle’s route. This confirms the instability and the inaccuracy

3.3. Replacing scanning with prior knowledge of the network 53
Experiment # Sequences of APs1 1 3 5 6 7 8 10 11 13 14 152 1 2 3 4 6 8 10 12 13 14 153 1 2 3 4 6 7 8 10 11 13 154 1 3 4 5 6 7 9 10 12 13 14 155 1 3 4 5 6 8 10 11 12 13 14 156 1 3 5 6 7 8 10 12 13 14 157 1 3 4 5 6 7 8 11 0 13 14 158 1 3 4 5 6 7 8 10 11 12 13 14 159 1 3 4 6 7 8 11 12 13 14 1510 1 3 5 6 7 10 11 12 13 14 15
Table 3.1: Sequence of APs in ten experiments using a single interface
of scanning shown in SI results. In addition, this phenomenon implies an increase inthe number of handovers (3.5 times higher compared to the SI approach). Note thatthis number could be partially reduced by introducing regulation mechanisms such asa hysteresis process.
In conclusion, scanning instability means that AP selection cannot be based on rawresults. Although filtering would rule out some APs that do not provide a reliably highRSS, the approach does not prevent sudden variations in RSS, as depicted in Figure 3.2.
3.3 Replacing scanning with prior knowledge of the net-work
3.3.1 Basic principles
Vehicular communications suffer from frequent disconnections when using IEEE 802.11networks. In the literature, several solutions have shown how to significantly reducethe impact of the handover in terms of disconnection time, like the make-before-breakapproach presented in the previous section. However, these solutions, when they rely onscanning, do not address the issue of inefficient AP selection under vehicular mobility.In order to reduce the impact of the handover and improve the AP selection process, wepropose mroad, a Model-based ROaming Decision technique. mroad is intended toprovide always-best connected wireless access without scanning during the handover.Instead, it uses prior knowledge of IEEE 802.11 AP RSS along the vehicle’s route,obtained through simulation. The approach provides an optimal handover sequence tothe MS. Specifically, with this new source of information, the MS is able to select the APwith the highest RSS at any place along the route. This solution allows the handover
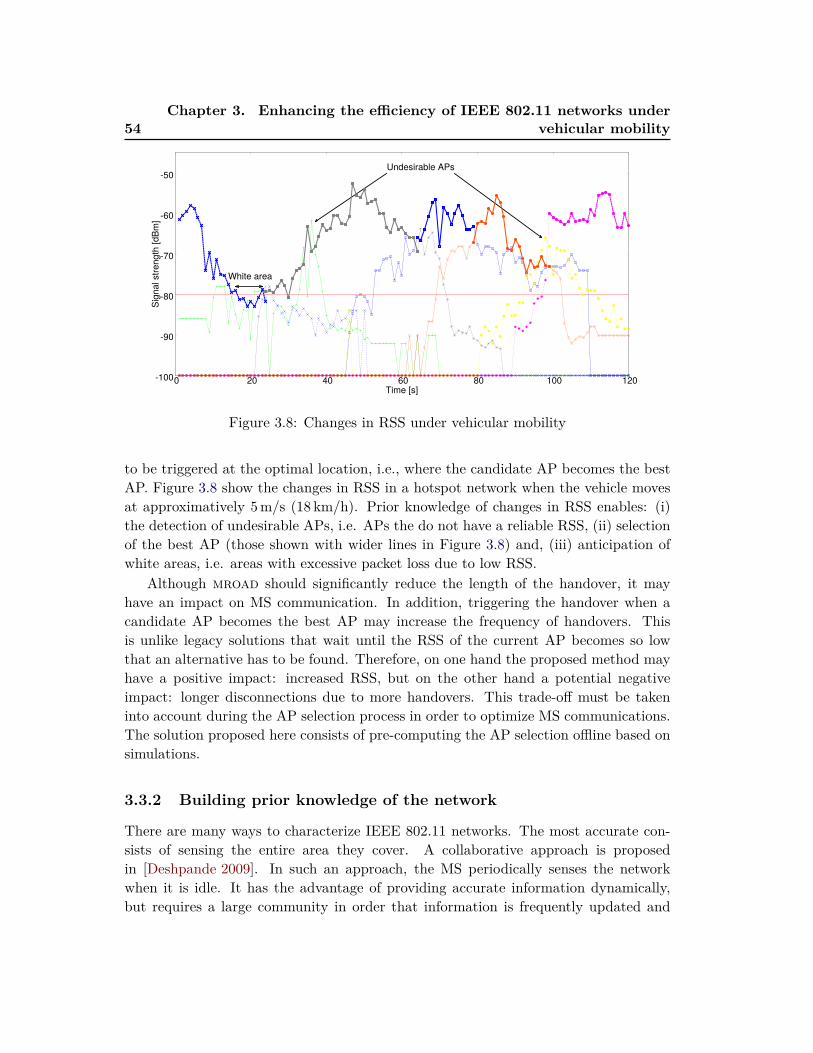
54Chapter 3. Enhancing the efficiency of IEEE 802.11 networks under
vehicular mobility
-100
-90
-80
-70
-60
-50
0 20 40 60 80 100 120
Sig
na
l str
en
gth
[d
Bm
]
Time [s]
White area
Undesirable APs
Figure 3.8: Changes in RSS under vehicular mobility
to be triggered at the optimal location, i.e., where the candidate AP becomes the bestAP. Figure 3.8 show the changes in RSS in a hotspot network when the vehicle movesat approximatively 5m/s (18 km/h). Prior knowledge of changes in RSS enables: (i)the detection of undesirable APs, i.e. APs the do not have a reliable RSS, (ii) selectionof the best AP (those shown with wider lines in Figure 3.8) and, (iii) anticipation ofwhite areas, i.e. areas with excessive packet loss due to low RSS.
Although mroad should significantly reduce the length of the handover, it mayhave an impact on MS communication. In addition, triggering the handover when acandidate AP becomes the best AP may increase the frequency of handovers. Thisis unlike legacy solutions that wait until the RSS of the current AP becomes so lowthat an alternative has to be found. Therefore, on one hand the proposed method mayhave a positive impact: increased RSS, but on the other hand a potential negativeimpact: longer disconnections due to more handovers. This trade-off must be takeninto account during the AP selection process in order to optimize MS communications.The solution proposed here consists of pre-computing the AP selection offline based onsimulations.
3.3.2 Building prior knowledge of the network
There are many ways to characterize IEEE 802.11 networks. The most accurate con-sists of sensing the entire area they cover. A collaborative approach is proposedin [Deshpande 2009]. In such an approach, the MS periodically senses the networkwhen it is idle. It has the advantage of providing accurate information dynamically,but requires a large community in order that information is frequently updated and

3.3. Replacing scanning with prior knowledge of the network 55
remains accurate. In contrast, our approach consists of modeling the RSS through asimulation platform. However, it has multiple drawbacks. First, it requires knowingthe location and characteristics of APs. Second it offers a static view of the networkthat may become obsolete if an AP is down or if its configuration is dynamic (e.g. dueto automatic channel allocation). On the other hand, it has the advantage of simplic-ity. It can quickly provide results with no need for a community that must frequentlysense the network, and it is scalable. The accuracy of the RSS model depends on theaccuracy of the information and the model used. The method used in our research isshown in Figure 3.9 and described hereafter. First, the map of the experimental route isextracted from OpenStreetMap 1. OpenStreetMap is a collaborative project that aimsto map the world. Its web interface provides links for downloading a detailed map of anarea selected by the user. Beyond a description of the road network, OpenStreetMapprovides information about all other transport infrastructure (e.g., train, bus, bicy-cles), a description of the urban topology (e.g., buildings, parks, pedestrian areas), andpoints of interest (PoI). In addition, we obtained a list of APs and their locations froman open database provided by the local administration 2. The mobility scenario is thensimulated with sumo [DLR ], a urban mobility simulator. The OpenStreetMap map isconverted into sumo files by the netconvert tool provided in the sumo suite of tools.Finally, the scenario is exported to Qualnet [Networks ], a network simulator, using theVergilius framework [Giordano 2010a]. We use Qualnet to simulate the RSS of APsalong the vehicle’s route. RSS is computed using corner [Giordano 2010b], an urbanpropagation model based on knowledge of the road topology. corner computes signalattenuation taking into account three situations: (i) the AP is in the LoS of the MS,(ii) the AP is separated from the LoS of the MS by a corner, or (iii) the AP is separatedfrom the LoS of the MS by two corners. The model provides a good trade-off betweenaccuracy and computational cost. The MS splits the vehicle’s route into small segmentsand uses the simulated RSS to compute the average signal quality on each segment.In our experiments, the size of the road segment is set to 5m, which is the highestpossible accuracy from a GPS location update. A model of the RSS for a HotCity APis shown as an example in Figure 3.10. The MS then runs the AP selection algorithmdescribed in the following section.
1http://openstreetmap.org2http://www.topographie.lu/
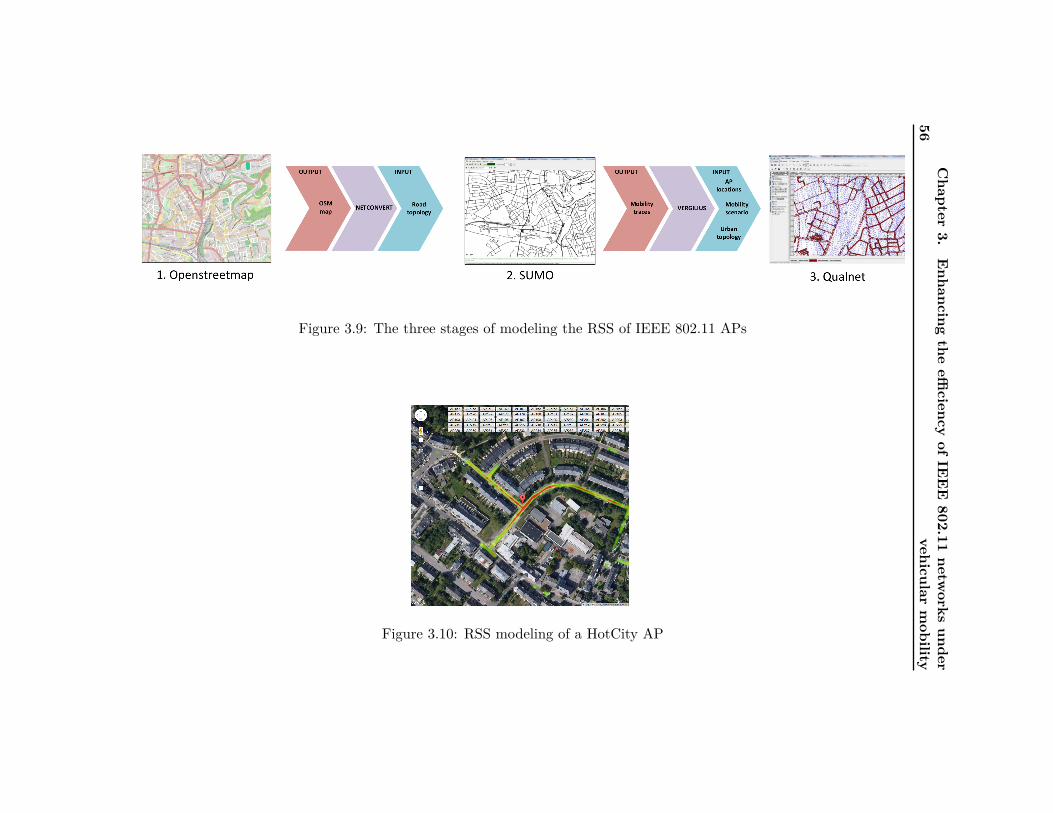
56Chapter
3.Enhancing
theeffi
ciencyof
IEEE802.11
networks
undervehicular
mobility
Figure 3.9: The three stages of modeling the RSS of IEEE 802.11 APs
Figure 3.10: RSS modeling of a HotCity AP

3.3. Replacing scanning with prior knowledge of the network 57
3.3.3 MROAD AP selection
mroad is based on two assumptions: (i) the MS knows the vehicle’s route and thelocation of APs in advance; and (ii) the vehicle does not pass the same place twice.The first assumption makes it possible to pre-compute roaming locations but impliesprior knowledge of the vehicle’s destination. The second assumption was includedto simplify the implementation and evaluation of the solution and could be removedwithout impacting the principle of the approach. AP selection is performed in twosteps. First, mroad builds an overlapping AP graph using the simulated AP RSSs.This overlapping graph provides all of the possible sequences of feasible candidate APsfor a given scenario. For each sequence, mroad uses the graph to find the best handoverlocation, i.e. where a candidate AP provides a better RSS than the current one. Then,mroad selects the best AP sequence from all of those available (where the time theMS has Internet access under good conditions is highest). When the vehicle is on theroad, the handover is triggered based on its location.
PAPiP Hφ(e) PAPj
Sig
nal str
ength
Route of the vehicle (road segments)
Ovφ(e)
PAPiP Hφ(e) PAPj
Sig
nal str
ength
Route of the vehicle (road segments)
Sig(APj)P
Sig(APi)P
Hsigφ(e)
signal strengths of APi signal strengths of APj
= minSig(i,j,P)
Figure 3.11: Handover location computation for APi and APj
Overlapping AP graph mroad creates an overlapping AP graph based on pre-dicted signals in order to compute sequences of APs that are able to provide IEEE802.11 connectivity along the vehicle’s route. Let the 3-tuple G = (V,E, φ(E)) be anoverlapping AP graph based on simulated AP RSS where:
• V is the set of vertices of G, i.e., the set of APs on the vehicle’s path.

58Chapter 3. Enhancing the efficiency of IEEE 802.11 networks under
vehicular mobility
0
0.5
1
1.5
2
2.5
3
-90 -80 -70 -60 -50 0
0.05
0.1
0.15
0.2
0.25
0.3
Da
ta r
ate
[M
bp
s]
Dro
pp
ed
RX
pa
cke
t ra
tio
Signal strength [dBm]
Data rateDropped packet ratio
Figure 3.12: Relationship between RSS, data rate and dropped packets
• E is the set of edges of G, i.e., the set of connections in the graph between twooverlapping APs on the vehicle’s path.
• φ is the incidence function of G
Let V = {AP1, AP2, ..., APn} be the vertex sequence of all APs in the vehicle’spath sorted by order of appearance, PAPi is the road segment where APi is located,Sig(APi)P is the RSS of APi in the road segment P and minSens is the networkinterface sensitivity. The two elements of φ(e) = {APi, APj}, for any e ∈ E, are thevertices of the edge e, i.e., the overlapping APs linked in the graph by the edge e.Figure 3.11 is an example of the received RSS for the transition from APi to APj .In this figure, we can see PAPi , PAPj and for the road segment P , Sig(APi)P andSig(APj)P . mroad considers that there is an edge from APi to APj in the overlappingAP graph if there is connectivity continuity from APi to APj . As a result,for i, j ∈ [1, n], i < j, e = φ−1({APi, APj}) ∈ E if
∃ P where
{Sig(APi)P > minSens
Sig(APj)P > minSens(3.1)
Eq. 3.1 requires that the range of the APs linked in the graph overlap, i.e., at a givenplace, the MS is able to detect signals from both APs. As stated above, the vehicle doesnot pass the same place twice. Therefore, in order to simplify the AP selection process,we define the overlapping AP graph as an oriented graph such that the connection fromAPi to APj is possible only if APj follows APi in order of appearance.
Handover location computation We define the handover location as the roadsegment Hφ(e) that provides the best conditions in terms of RSS to perform a handover.

3.3. Replacing scanning with prior knowledge of the network 59
In this work, we consider that the best conditions are met when the RSS of bothAPs are highest levels. This choice was based on the observations in [Aguayo 2004,Mhatre 2006, Castignani 2012a] and confirmed by our experiments. Figure 3.12 showsthat there is a correlation between RSS and the MS downlink. Similarly, Figure 3.12shows that packet loss decreases as RSS increases.
As a result, although the candidate AP is known and may provide satisfactory RSSfrom a given moment, it is optimal to perform the handover only when the current APprovides higher RSS. This allows the MS to benefit from the best available RSS andthe association with the candidate AP to be performed under the best conditions, i.e.when packet loss is lowest. This approach should mitigate impacts on MS throughput.
Giving the preceding arguments, we force handovers to occur in locations where theRSS of both the current and candidate APs are highest. Note that the word locationrefers here to Road Segment (RS) of around 5m defined during the simulations. Thehandover location is computed offline, based on simulated RSSs. It consists of threesteps. The first is the definition of the overlapping area, i.e., the area where the MS isable to receive a signal from both potential APs. Let Ovφ(e) be the overlapping area ofthe set of road segments P that satisfy Eq 3.1. In Figure 3.11, the overlapping area isillustrated by a green line. The second step is the selection of the lower RSS for eachroad segment in the overlapping area from the potential APs. This is performed oneach road segment in the overlapping area. Let minSig(i, j, P ) be the lowest signalfunction such that for P ∈ Ovφ(e)
minSig(i, j, P ) = min(Sig(APi)P , Sig(APj)P ) (3.2)
In Figure 3.11, for the road segment P , minSig(i, j, P ) is Sig(APj)P . The set of all theelements with the lowest signal function is shown by the curve surrounding the bluearea. The final step is the selection of the handover location as the road segment thatmaximizes the lowest signal function. Let Hφ(e) ∈ Ovφ(e) be the handover location, i.e.,the location in the overlapping area in which the handover signal quality Hsigφ(e), is:
Hsigφ(e) = maxP ∈ Ovφ(e)(minSig(i, j, P )) (3.3)
Figure 3.11 shows the handover signal quality Hsigφ(e) as the maximum of the curvesurrounding the blue area and the handover location Hφ(e), which is the road segmentcorresponding to Hsigφ(e).
Computation of optimal sequences The AP selection graph provides the MSwith a list of APs with continuous connectivity. Therefore, starting from the firstelement of the graph, the MS has several possible transition sequences that lead to thefinal AP. We evaluated these sequences in order to select those with best connectivity.This evaluation took into account the handover trade-off discussed above: namely

60Chapter 3. Enhancing the efficiency of IEEE 802.11 networks under
vehicular mobility
increased RSS and longer disconnections. Therefore, we evaluated sequences based ontwo parameters. The first is the signal quality of each handover. This parameter is agood indicator of overall RSS as it is a local minimum that takes into account the RSSof successive APs. The second parameter is the length of the sequence, i.e. the numberof handovers.
The aim was to compute a score for all handover sequences that combined these twoparameters. This score is a bi-objective optimization problem, described below. LetEN ⊆ E be a handover sequence, where N is the index of the sequence. We evaluatethis sequence by calculating score(EN ). Let score(EN ) be the sequence score of EN ,|EN | the sequence length of EN and Trans(EN ) a metric of the quality of transitionsbetween the different elements of EN .
score(EN ) = {|EN |;Trans(EN )}
We define Trans(EN ) as the average handover signal quality of transitions in thesequence:
Trans(EN ) =∑e∈EN
Hsigφ(e)|EN |
(3.4)
These two parameters highlight two, opposing trends. When sequence length is theonly consideration, an optimal sequence contains APs that are as far from each otheras possible in order to decrease the number of handovers. However, this may havean impact on RSS and performance (e.g., low throughput and multiple association at-tempts due to frame loss). On the other hand, when APs are closer to each other, thequality of the handover improves but disconnections are more frequent. Consequently,the trade-off between the number of handovers and signal quality must be managed.We introduce Trans(EN ) to handle this. The bi-objective function, score(EN ) is op-timized by minimizing |EN | and maximizing Trans(EN ). In order to reformulate theoptimization problem into a pure minimization problem, we apply the duality princi-ple [Deb 2001] and consider −Trans(EN ). Now, the bi-objective problem optimizingscore(EN ) consists of minimizing |EN | and −Trans(EN ). Figure 3.13 shows the set offeasible solutions for this problem. In particular, we consider the Pareto-optimal front,which is composed of seven handover sequences (from E09 to E15), with different val-ues for score(EN ). The experiment compared the performance of each Pareto-optimalfront sequence. First, it focused on the relevance of the parameters involved in thecomputation of score(EN ). It then evaluated the trade-off between minimizing thenumber of handovers and maximizing their quality.

3.3. Replacing scanning with prior knowledge of the network 61
54
56
58
60
62
64
66
68
9 10 11 12 13 14 15
-Tra
ns(E
N)
Len(EN)
Pareto front
E09
E10
E11
E12
E13E14
E15
Figure 3.13: Distribution of score(EN )
3.3.4 Implementation
In order to evaluate the handover sequences, we implemented connection software. Ourimplementation is based on the WPA-supplicant architecture and uses Linux WirelessEXTensions (WEXT)3 as an interface to the kernel space. It is composed of a set ofprimitives responsible for probing, connecting and performing the roaming decision.The roaming decision primitive is the main component of mroad. It takes as inputa list of road segments for the route in question, the handover sequence with corre-sponding handover locations, and the current state of the MS (location and connectionstatus). The roaming decision primitive processes these inputs by selecting the APcorresponding to the location of the vehicle and decides if a handover needs to beexecuted.
Its output is connection primitive information used to connect to the selected AP.The location of the vehicle is provided by an external USB GPS receiver placed insideit, close to the windscreen. This receiver provides a location update with an accuracyof 5 to 10m every second. As the vehicle can reach speeds of up to 50 km/h, it cantravel up to 13.9m in 1 s. Consequently, it is necessary to update the vehicle’s locationmore frequently in order to obtain more accurate location information. To this end, weimplemented a prediction mechanism that approximated the vehicle’s location whenthe roaming decision primitive has no recent GPS fix. This simple mechanism takes thevehicle’s speed and direction over the past second and computes the current locationby multiplying the elapsed time since the last GPS fix by the vehicle’s speed over the
3http://wireless.kernel.org/en/developers/Documentation/Wireless-Extensions

62Chapter 3. Enhancing the efficiency of IEEE 802.11 networks under
vehicular mobility
past second. We assume that vehicle speed does not vary significantly from one secondto the next. Knowing the vehicle’s location, the roaming decision primitive uses the listof road segment locations to determine in which road segment the vehicle is located.It then uses the handover sequence to check if the vehicle has reached a handoverlocation. If it has, the primitive has two options. Either the MS is already connectedto the AP corresponding to the current location in the handover sequence. In thiscase, the roaming decision primitive ends. Alternatively, the MS is not connected tothe AP corresponding to the current location in the handover sequence, because it isstill connected to the previous AP in the list or it is disconnected. In this case, theprimitive runs a pre-connection mechanism consisting of probing the selected AP. Ifthere is no answer after three Probe Requests, the primitive stops probing and waits for20ms (a reasonable bound for the Probe Response delay). If the MS receives a ProbeResponse from the selected AP, the primitive calls the connection primitive, whichtriggers the roaming process. This mechanism is used because the MS does not performAP scanning, and thus the MS does not know if the selected AP is reachable when itdecides that the handover needs to be triggered. If the selected AP cannot be reached,the roaming process will disconnect from the current AP without attempting a re-connection. The probability of such event seems negligible but as shown by Mahajan etal. [Mahajan 2007], there are numerous obstacles and sources of temporary interference(such as heavy vehicles) in the urban environment that can cause “grey periods”, i.e.,short periods of very poor RSS. The notion of the grey period should be distinguishedfrom the notion of“white areas” which correpond to areas that are not covered by anyAP.
3.3.5 Improving MROAD
mroad addresses the following two objectives: (i) reducing handover impact, and (ii)improving AP selection. Reducing handover impact is achieved by eliminating thescanning phase known to be the most time-consuming phase of the handover. Inaddition, AP selection is improved with the help of prior knowledge of the networkthat allows the MS to trigger the handover as soon as the candidate AP becomes thebest AP. However, as there is no scanning, the MS must rely on static informationfor AP selection. Consequently, it does not take into account changes in the networkdeployment. For instance, mroad does not offer any solution if the AP changes itschannel or becomes unavailable. In addition, it relies on the unrealistic assumptionthat the vehicle’s route is known in advance in order to pre-compute the handoverlocation.
Nevertheless, mroad suggests that it is possible to eliminate scanning and that ascan-free handover technique can be efficient in selecting an AP.

3.4. Adding vehicle mobility to the AP selection process 63
3.4 Adding vehicle mobility to the AP selection process
3.4.1 Basic principles
The solution described here overcomes the main drawback of mroad, as it does not re-quire prior knowledge of the vehicle’s route. The COntext-aware Predictive handovER(coper) technique includes an AP selection module that predicts vehicular mobilityin the near future such that the MS is able to use prior knowledge of the network toperform the handover at the most appropriate location. Mobility prediction is providedby a Direction Detection Module (DDM) that analyzes the trajectory of the vehicle. Itremoves the need for scanning even when the driver does not provide his/ her destina-tion nor the route he/ she plans to take. In order to detect direction and select APs,coper uses the same information as mroad with the exception of the vehicle’s route:road topology, the location of APs and their modeled RSS are all stored in a ContextDataBase (CDB).
Like mroad, coper is based on a roaming decision technique that always providesthe best connection but avoids scanning. Selection is based on prior knowledge of theroad topology, the locations of APs and a model of their RSSs. Using this information,the MS is able to determine its location on the road network and use the modeled RSSsof nearby APs to choose the one that provides the best signal in the new location.
As illustrated in Figure 3.14, coper is composed of three main modules intended toprovide seamless transitions between the best candidate APs regardless of the vehicle’sroute. To this end, the DDM anticipates the direction of the vehicle using a fuzzy logic-based trajectory analysis that takes into account road characteristics that have beenstored in a pre-computed CDB. To predict direction, the AP Selection Module (ASM)uses the simulated AP RSS stored in the CDB in order to identify the best APs andthe best locations to trigger handovers. Finally, the Connection Module (CM) detectswhen the vehicle is entering a handover area and attempts a connection by probing theselected AP and associating with it. The following sections describe the constructionof the CDB and the coper modules.
3.4.2 CDB construction
coper decisions are based on road topology and the modeled RSSs that are stored ina CDB. To build this CDB, we need to gather multiple, publicly-available sources ofinformation and organize them. In this work we use two notions to characterize roadtopology. The first is the Road Portion (RP) defined as the portion of road boundedby two intersections or a dead end. An RP is characterized by an azimuth α and thecoordinates of the starting point D and the ending point E. The second notion is theRoad Segment (RS), which is a sub-section of the RP. Each RP is composed of a setof RSs with equal size (around 5m). Note that both RP and RS are oriented, meaning

64Chapter 3. Enhancing the efficiency of IEEE 802.11 networks under
vehicular mobility
Figure 3.14: Description of the three main coper modules

3.4. Adding vehicle mobility to the AP selection process 65
that a two-way street is composed of two RPs. The CDB structure consists of fivetables. Three describe road topology: the first lists RPs including their boundaries(in terms of GPS coordinates), size and RSs; the second lists the RSs including theirboundaries, size and the RP they belong to; and the third lists the relations betweenRPs. The AP table stores AP locations, SSIDs, frequencies and the RP it belongs to.Finally, the last table contains the RSSs of the listed APs on each RS obtained throughsimulation.
To build the CDB, coper uses the same source of information and simulationframeworks as mroad. Road topology is extracted from the OpenStreetMap4 databaseand the list of APs and their locations from an open database provided by the localadministration. Note that we also extracted the urban topology for coper. Next, weused sumo and Qualnet with the Vergilius framework [Giordano 2010a] to computeRSSs. In addition to corner, Qualnet takes into account urban topology in the signalpropagation computation, in order to provide more realistic RSS simulations. Thedatabase contains the name and the GPS coordinates of each AP in the municipalnetwork. It is used to feed a website that maps the different facilities provided by themunicipality5. The complete list of SSIDs was provided by the network operator.
A partial visualization of the CDB is shown in Figure 3.15. Based on signal propaga-tion modeling, the CDB can provide information about the number of APs broadcastingwith a minimum required RSS (-85 dBm in Figure 3.15).
3.4.3 Direction detection module
3.4.3.1 Description
coper relies on the characteristics of vehicular mobility as described in Section 3.1.1.In particular, the vehicle’s trajectory is guided by the road infrastructure and drivingregulations, which makes predictions much easier. Based on this, and the notion ofthe RP previously defined, coper considers the following mobility scenario. When avehicle has been located in a RP, coper assumes that the vehicle continues on thisRP until it reaches the next intersection i.e., the intersection that ends the current RP.coper then considers the RSS of nearby APs in the current RP and beyond, in theRPs accessible at the next intersection. Direction predictions are performed when thevehicle approaches the next intersection. This attempts to establish as soon as possiblewhich RP the vehicle is entering, based on its trajectory.
The DDM has two roles: (i) it locates the vehicle in an RP, and (ii) attemptsto predict the RP the vehicle is about to enter. It relies on GPS location updatesand the road topology provided by the CDB. This information is critical in order totrigger the handover at the right location; in particular, when the vehicle turns at
4http://openstreetmap.org5http://www.topographie.lu

66Chapter 3. Enhancing the efficiency of IEEE 802.11 networks under
vehicular mobility
Figure 3.15: AP density heatmap based on the CDB

3.4. Adding vehicle mobility to the AP selection process 67
An
gu
lar
dis
pla
ce
me
nt
[°]
An
gu
lar
ve
locity [°/s
]
Time [s]
Phase I
Phase II
γ
γ'
Figure 3.16: Model of angular displacement during a turn.
an intersection and is about to leave the LoS of the current AP. This situation oftenleads to a significant decrease of RSS from the current AP, causing packet loss or evencomplete disconnection. The DDM distinguishes between a vehicle that continues inthe same direction from one that turns at an intersection. The first case correspondsto only one candidate RP. Therefore, we consider that the vehicle continues straighton from the current RP to a candidate RP, if the azimuth difference between RPsis less than 10 ◦. Otherwise, the candidate RP implies that a turn has been made.This threshold issues from the observation that intersections always comprise only oneadjacent RP with an azimuth difference lower than 10 ◦ which is not the case if oneconsiders higher thresholds. The next direction is found by comparing the currenttrajectory with the characteristics of the candidate RPs (i.e., the RPs starting at thenext intersection). The current trajectory is defined by the two most recent vehiclelocations lt and lt−1, and its bearing β. The next direction detection starts when thevehicle enters the direction detection area (15m before the end of the current RP).During this phase, the DDM computes the angular shift γ such that γ = |β − α|.The DDM concludes the vehicle has entered a new RP when γ falls below 20 ◦ and thedistance between the vehicle and the RP entry point decreases (Equation 3.5). Thisthreshold has been empirically obtained during a preliminary study. It results from atrade-off between the risk of a wrong detection and the objective of early detection.
{γ < 20◦ (a)
d(lt, D) < d(lt−1, D) (b) (3.5)
If the DDM has not detected any turning 10m after the end of the current RP, itconcludes that the vehicle has continued straight ahead. On the one hand, this rulenegatively impacts the performance of the DDM in terms of detection anticipation but,

68Chapter 3. Enhancing the efficiency of IEEE 802.11 networks under
vehicular mobility
on the other hand, it allows the DDM to detect a greater number of turning events. Inaddition, the early detection that the vehicle has not turned is considered less criticalthan the detection of a turning event, due to the fact that the MS is more likely to staylonger in the Line of Sight (LoS) of the current AP when it does not turn.
Note that as the vehicle turns, its bearing starts to coincide with the azimuth ofthe next RP, and it is thus too late to make any predictions. Therefore, in orderto better anticipate the turn, we augment the DDM with an Fuzzy-based TurningDetector (FTD). The FTD uses a fuzzy logic system to evaluate the probability thatthe vehicle is initiating a turn. The FTD relies on a simple model that characterizes aturn based on the angular displacement γ. In our model, γ is characterized by a two-phase change (phase I: initialization; phase II: stabilization) as depicted in Figure 3.16.Initially, both γ and the angular velocity γ′ are zero, i.e. the vehicle is moving in thesame direction as the current RP. In phase I, γ increases from zero until it reachesa maximum, when the turning phase is initiated. In phase II, the angular velocitydecreases until there is no more angular displacement. Entering phase II initiatestrajectory stabilization.
The input variables of the fuzzy system are: vehicle speed, its acceleration (com-puted as the speed first derivative) γ, and its angular velocity γ′ as the derivative ofγ. In all cases, we consider trapezoidal membership functions. The output variable,the turning metric, is a value in the interval [−180; 180] interpreted as the most likelyangle of the vehicle’s trajectory. We define seven linguistic variables for the turningmetric: one for the non-turning case, and three (low, medium and high) for each turn-ing direction (i.e., negative values imply a left turn, while positive values imply a rightturn). The FTD considers a set of rules that can be summarized as follows: (i) thereis no turn (i.e., the turning metric equals zero) if γ is low or vehicle speed is high; (ii)if vehicle speed is low and there is negative acceleration, the turning likelihood is high;(iii) if the angular rate is non-zero and γ is increasing, the turning likelihood is high(phase I in Figure 3.16); (iv) if the angular rate is null or γ is decreasing, the turninglikelihood decreases (phase II in Figure 3.16); and finally, (v) if the vehicle acceleratesquickly from a low speed, the turning likelihood increases. Note also that the angularrate is used here as a filter, as it indicates whether or not the turning manoeuvre con-tinues (see fourth and fifth rules). In order to select the candidate RPs we evaluate therelative angle between the azimuth of the current AP and each candidate. We defineseven groups: one for the RP that implies the vehicle is continuing straight on (relativeangle below 10 ◦), and three groups (for turning right and left) for RPs that are linkedto a low, medium or high turn for relative angles between 10 ◦ and 45 ◦, 45 ◦ and 110 ◦and higher than 110 ◦ respectively. Note that the case of two candidate RPs that areclassified in the same group is infrequent and considered out of the scope of this study.Unlike the previous approach, the FTD can anticipate the vehicle’s direction. However,it can only be used to detect turning; thus, the DDM combines these two approaches
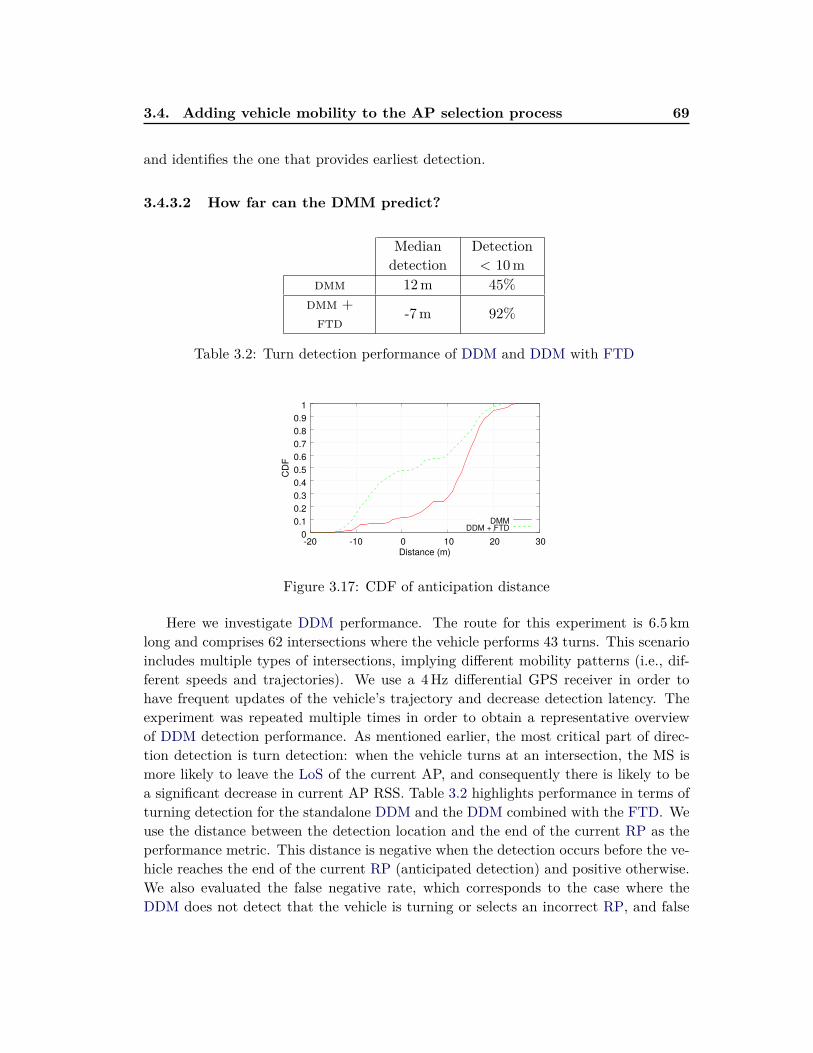
3.4. Adding vehicle mobility to the AP selection process 69
and identifies the one that provides earliest detection.
3.4.3.2 How far can the DMM predict?
Mediandetection
Detection< 10m
dmm 12m 45%dmm +
ftd -7m 92%
Table 3.2: Turn detection performance of DDM and DDM with FTD
0
0.1
0.2
0.3
0.4
0.5
0.6
0.7
0.8
0.9
1
-20 -10 0 10 20 30
CD
F
Distance (m)
DMMDDM + FTD
Figure 3.17: CDF of anticipation distance
Here we investigate DDM performance. The route for this experiment is 6.5 kmlong and comprises 62 intersections where the vehicle performs 43 turns. This scenarioincludes multiple types of intersections, implying different mobility patterns (i.e., dif-ferent speeds and trajectories). We use a 4Hz differential GPS receiver in order tohave frequent updates of the vehicle’s trajectory and decrease detection latency. Theexperiment was repeated multiple times in order to obtain a representative overviewof DDM detection performance. As mentioned earlier, the most critical part of direc-tion detection is turn detection: when the vehicle turns at an intersection, the MS ismore likely to leave the LoS of the current AP, and consequently there is likely to bea significant decrease in current AP RSS. Table 3.2 highlights performance in terms ofturning detection for the standalone DDM and the DDM combined with the FTD. Weuse the distance between the detection location and the end of the current RP as theperformance metric. This distance is negative when the detection occurs before the ve-hicle reaches the end of the current RP (anticipated detection) and positive otherwise.We also evaluated the false negative rate, which corresponds to the case where theDDM does not detect that the vehicle is turning or selects an incorrect RP, and false

70Chapter 3. Enhancing the efficiency of IEEE 802.11 networks under
vehicular mobility
positives that correspond to the case where the system detects a turn but the vehicleis not turning. From 11 experiments, we obtained seven false positives and seven falsenegatives compared to 129 successful detections (95%) for both standalone DDM andDDM augmented with FTD. This suggests that the addition of the FTD does nothave an impact on the detection success of the DDM. However, FTD enhances mediandetection anticipation by 19m. In addition, 92% of detections occur within 10m versus45% for the standalone DDM. If we focus on overall direction detection (straight RPsand turns), as depicted in Figure 3.17, we observe a median detection anticipation of10m when DDM is augmented with FTD (3m vs. 13.2m).
The Direction Detection Module (DMM) predicted vehicle direction at half of theintersections and early detection otherwise. This ability to anticipate allows the ASMto adapt AP selection to the vehicle’s route in real time, in particular when the vehicleis about to turn. In turn, the ASM can detect when the RSS of the current AP maydecrease in the short term and anticipate the selection of the next AP such that thehandover is triggered before the current AP’s RSS falls dramatically.
3.4.4 COPER AP selection
The ASM tries to find the AP that provides the best network connectivity based on thevehicle’s direction. As mentioned earlier, the MS does not know the complete route inadvance. This mean that AP selection must be triggered every time it enters a new RP.The MS first evaluates possible handovers to candidate APs located in the current RP.It then evaluates handovers to APs located in the next RPs and makes an anticipatedhandover decision if possible. The selected APs are then stored in the candidate APlist used by the connection module (cf. Figure 3.14).
Handover evaluation and localization The ASM uses the same handover evalua-tion methods as mroad. For each candidate AP it builds the handover quality metricthat is used in AP selection. Figure 3.18(a) shows the handover signal quality QS as themaximum of the curve delimiting the pattern-filled area and the handover location HS
(the RS corresponding to HSS). In addition, it computes the handover location as thelocation where the RSSs of both the current and the candidate AP are simultaneouslymaximized. A detailed description of the handover location computation can be foundin Section 3.3.3.
AP selection process Figure 3.18(a) shows a sample of simulated and real RSSs oftwo APs called respectively APi (current AP) and APj (candidate AP). Note that theCDB only provides the modeled RSS to the ASM, while the sensed RSS is only usedto evaluate ASM performance.
AP selection is triggered every time a new RP is detected by the DDM. The ASM

3.4. Adding vehicle mobility to the AP selection process 71
P
Sig
nal str
ength
[dB
m]
Road segments
APAP
QS
QR
S(APj)P
S(APi)P
= minS(P)
ShS
ShS/R
S1-2S1-3
P
Sig
nal str
ength
[dB
m]
Road segments
APAP
QR
S(APi)P
P
Sig
nal str
ength
[dB
m]
Road segments
APAP
QR
S(APi)P
Simulated signalSensed signal
P
Sig
nal str
ength
[dB
m]
Road segments
APAP
QR
S(APi)P
HS
1
Sig
nal str
ength
[dB
m]
Road segments
APAP
QR
S(APi)P
HR
3
Sig
nal str
ength
[dB
m]
Road segments
APAP
QR
S(APi)P
H
2
Sig
nal str
ength
[dB
m]
Road segments
APAP
QR
S(APi)P
(a) Case 1
Sig
nal str
ength
[dB
m]
Road segments
APAP
QR
QS
ShS
ShS/RS1-2S1-3
Sig
nal str
ength
[dB
m]
Road segments
APAP
QR
QS
ShS
ShS/RS1-2S1-3
Simulated signalSensed signal
Sig
nal str
ength
[dB
m]
Road segments
APAP
QR
QS
ShS
ShS/RS1-2S1-3
HS
1
Sig
nal str
ength
[dB
m]
Road segments
APAP
QR
QS
ShS
ShS/RS1-2S1-3
HR
3
Sig
nal str
ength
[dB
m]
Road segments
APAP
QR
QS
ShS
ShS/RS1-2S1-3
H
2
Sig
nal str
ength
[dB
m]
Road segments
APAP
QR
QS
ShS
ShS/RS1-2S1-3
(b) Case 2
Figure 3.18: Sample of simulated and sensed RSS

72Chapter 3. Enhancing the efficiency of IEEE 802.11 networks under
vehicular mobility
(a) Case 1 (b) Case 2A
(c) Case 2B (d) Case 3
Figure 3.19: Different cases handled by the ASM

3.4. Adding vehicle mobility to the AP selection process 73
automatically selects the APs in this new RP and explores potential handovers to anAP located in the next potential RPs. The ASM classifies the network beyond theselected RP into three groups that cover all possible scenarios. These scenarios aredepicted in Figure 3.19. First, the ASM looks for a single AP that is shared with thenext RPs (Figure 3.19(a)). If such an AP is found, it is selected, the handover locationis computed and AP selection is resumed the next time the DDM detects a new RP.If not, the ASM analyzes the RSS of the current AP. If this RSS remains sufficientlyhigh to the end of the RP, AP selection ends (Figure 3.19(b) and Figure 3.19(c)). Ifnot, the ASM forces the selection of another AP located in the next RPs (e.g., AP2or AP3 in Figure 3.19(d)). Note that when an AP is selected, the ASM computesthe handover location (HS) as described before and provides the CM with the 3-tuple{APfrom, APto, HS} where APfrom is the currently selected AP and APto is the nextselected AP.
A comparison of the AP selection processes of coper and mroad shows that re-moving the assumption that the MS knows the vehicle’s route significantly increasescomplexity. However, it does not mean that AP selection in coper is suboptimalcompared to mroad.
We can identify two situations where the MS is not associated with the best AP.The first is due to an incorrect estimate of RSS, leading to situations where a handoverlocation that is based on the simulated RSS (HS) does not correspond to the optimalhandover location in reality (HR). The spatial shift between those two handover loca-tions is represented by ShS/R (see Figures 3.18(a) and 3.18(b)). ShS/R is consideredpositive if HR is located after HS and negative otherwise. For a given period, the RSSof the current AP is lower than the RSS of the best AP. This RSS difference is called∆S1−3. The second suboptimal AP selection case is due to short-term predictions ofvehicle’s direction. As the DDM often detects the next RP at the end of current RP, ifthe current AP provides a good signal, the ASM delays AP selection until the end ofthe current RP. This sometimes leads to suboptimal AP selection. In case 3 shown inFigure 3.19(c), AP2 and AP3 provide higher RSS at the end of the current RP. In thiscase, AP selection is suboptimal as the ASM does not select the best available AP. Thissituation is shown in Figures 3.18(a) and 3.18(b)), where the actual handover locationH does not correspond to best option HS . The spatial shift between the two is denotedShS and the RSS difference as ∆S1−2. ShS is always positive as H can never be aheadof HS .
3.4.5 Connection module
The CM triggers a new association with the selected AP at the handover locationgiven by the ASM. This module only takes as input the selected AP list and thecurrent vehicle location without performing any AP scanning. Figure 3.14 describes

74Chapter 3. Enhancing the efficiency of IEEE 802.11 networks under
vehicular mobility
the connection procedure and the CM. First, the CM parses the selected AP list bycomparing the selected AP handover location with the current location of the vehicle. Ifthe handover location of a selected AP is reached or has been passed, the CM starts theprocedure for connection to this AP. The connection procedure consists of two phases.First, since the CM does not perform any scanning, it does not know if the selected APis actually available or not (as the fact that the selected AP is listed in the CDB doesnot guarantee it is the case). As a result, the CM sends it a Probe Request. If the CMdoes not receive a Probe Response after three attempts, the selected AP is consideredunavailable. The ASM then begins AP selection again, ignoring this unavailable AP. Onthe other hand, if a Probe Response is received from the selected AP, the CM initiatesthe association process. This process is the standard IEEE 802.11 authentication andassociation, i.e., the exchange of four messages (authentication request/ response andassociation request/ response) with the selected AP. If this phase fails, the CM retriesa connection to the selected AP.
3.5 Conclusion
Based on the study of IEEE 802.11 communications under vehicular mobility, we identi-fied two main improvements to vehicular communications. The first reduces the lengthof the handover (where scanning latency is the main problem); the second enhancesAP selection which can cause sudden link disruption.
As a first step, we studied an optimized scanning-based approach that consistedin using a second interface base on the make-before-break paradigm. Although thisscanning-based approach successfully addressed the first issue, it did not provide enoughinformation to improve AP selection.
Next, we proposed mroad, a scan-free approach based on prior knowledge of net-work topology and the location and RSS of APs. By removing the scanning phase, thisapproach significantly decreased the length of the handover based on prior knowledgeof the network and enables the MS to select the best APs on its route.
Finally, we proposed coper that extends mroad by introducing vehicular mobilityin the AP selection and avoids the need to have prior knowledge of the vehicle’s route.
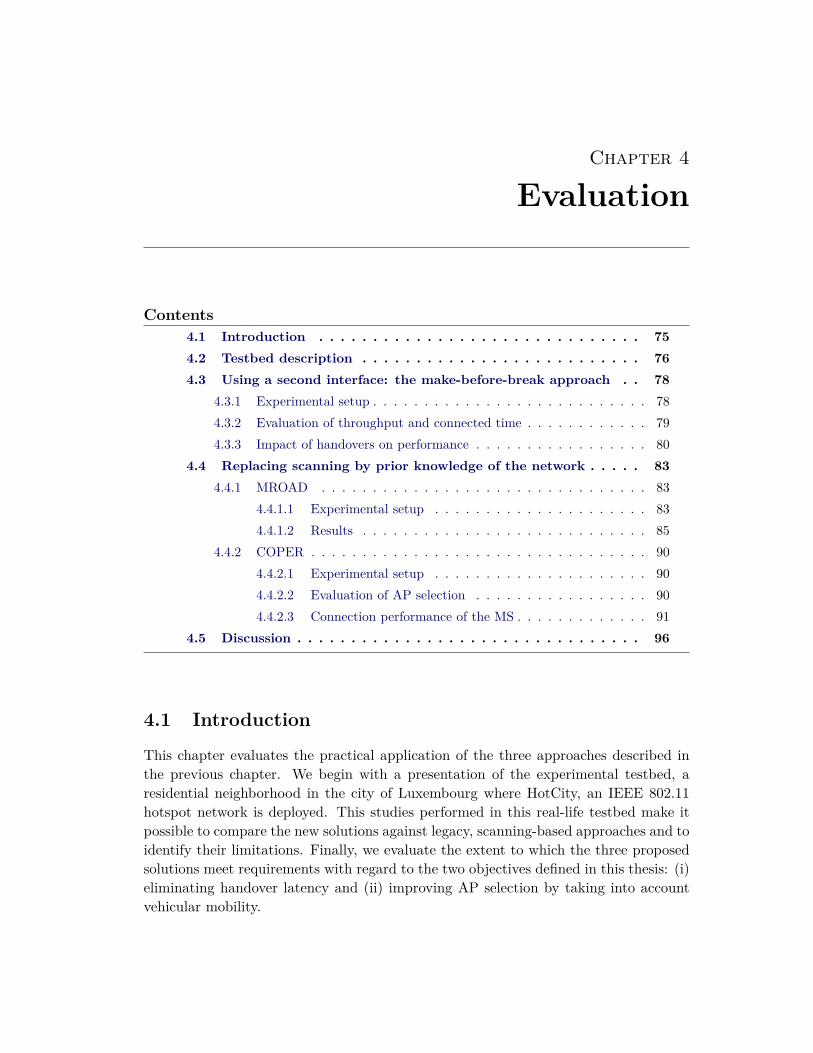
Chapter 4
Evaluation
Contents4.1 Introduction . . . . . . . . . . . . . . . . . . . . . . . . . . . . . . 754.2 Testbed description . . . . . . . . . . . . . . . . . . . . . . . . . . 764.3 Using a second interface: the make-before-break approach . . 78
4.3.1 Experimental setup . . . . . . . . . . . . . . . . . . . . . . . . . . . 784.3.2 Evaluation of throughput and connected time . . . . . . . . . . . . 794.3.3 Impact of handovers on performance . . . . . . . . . . . . . . . . . 80
4.4 Replacing scanning by prior knowledge of the network . . . . . 834.4.1 MROAD . . . . . . . . . . . . . . . . . . . . . . . . . . . . . . . . 83
4.4.1.1 Experimental setup . . . . . . . . . . . . . . . . . . . . . 834.4.1.2 Results . . . . . . . . . . . . . . . . . . . . . . . . . . . . 85
4.4.2 COPER . . . . . . . . . . . . . . . . . . . . . . . . . . . . . . . . . 904.4.2.1 Experimental setup . . . . . . . . . . . . . . . . . . . . . 904.4.2.2 Evaluation of AP selection . . . . . . . . . . . . . . . . . 904.4.2.3 Connection performance of the MS . . . . . . . . . . . . . 91
4.5 Discussion . . . . . . . . . . . . . . . . . . . . . . . . . . . . . . . . 96
4.1 Introduction
This chapter evaluates the practical application of the three approaches described inthe previous chapter. We begin with a presentation of the experimental testbed, aresidential neighborhood in the city of Luxembourg where HotCity, an IEEE 802.11hotspot network is deployed. This studies performed in this real-life testbed make itpossible to compare the new solutions against legacy, scanning-based approaches and toidentify their limitations. Finally, we evaluate the extent to which the three proposedsolutions meet requirements with regard to the two objectives defined in this thesis: (i)eliminating handover latency and (ii) improving AP selection by taking into accountvehicular mobility.
76 Chapter 4. Evaluation
4.2 Testbed description
In order to evaluate the performance of the solutions presented in this thesis, we per-formed a set of experiments using the HotCity network, a metropolitan IEEE 802.11network deployed over a large part of the city of Luxembourg. HotCity is composed ofaround 500 Cisco Aironet APs1 for outdoor use, each embedding an IEEE 802.11b/g/nradio for client wireless access and an IEEE 802.11a radio for mesh interconnectionbetween APs. In order to guarantee fair usage of the available bandwidth, the per-client downlink data rate was limited to 2Mbps until 2014. Since then the limit hasbeen raised to 25Mbps. The testbed was the Gasperich neighborhood, a residentialarea of Luxembourg city. We choose this area, rather than the city center in order tohave a more fluid vehicular mobility pattern, without being affected by traffic jams. Inthis area, the speed limit is 30 km/h and vehicles have to give way to other vehiclescoming from the right. Hence, during the experiments the car often stopped. Althoughtraffic varied during the day it remained fluid. A map of the hotcity AP deployment isavailable online2.
In order to characterize the testbed, we used Wi2Me [Castignani 2012b], an An-droid wireless network analyzer for IEEE 802.11 and 3G networks. Wi2Me gathers theRSS of nearby APs, their channel and their capabilities in terms of security. We showin Figure 4.1(a) the Cumulative Distribution Function (CDF) of the number of APsper scan both for all the discovered networks and for HotCity APs. The distributionof the discovered APs reveals a median of 9 APs per scan, denoting very dense deploy-ment. This high density is mainly caused by residential IEEE 802.11 APs belonging topersonal networks. It is important to note that for all scan results, at least one HotCityAP was discovered, which means that HotCity completely covers the path considered inthis study. This is the case in all the experiments presented in this section. RegardingAP quality, the CDF of the RSS in Figure 4.1(b) shows that HotCity APs have a higherRSS than other APs (e.g., they provide a median of −82dBm against −87dBm for allAPs). This difference in RSS is due to the fact that personal IEEE 802.11 networksare indoor whereas HotCity has been designed for outdoor wireless access. Note that,as shown in Figure 4.2(a), an RSS lower than −80dBm significantly degrades the QoS.As a result, mobile users may encounter poor connectivity. Note also that in roughly10% of scans, only one HotCity AP is discovered. This may lead to low throughput ifthe MS only considers the HotCity network.
Finally, the channel distribution in Figure 4.2(b) shows that APs are mainly dis-tributed over channels 1,6, and 11, which are three non-overlapping 2.4GHz chan-nels. This is a typical configuration in current urban deployments [Eriksson 2008,Giordano 2010b, Castignani 2011b].
1http://www.cisco.com/c/en/us/products/wireless/access-points/index.html2https://www.hotcity.lu/www_laptop_en/about/wifi_coverage

4.2. Testbed description 77
0
0.1
0.2
0.3
0.4
0.5
0.6
0.7
0.8
0.9
1
0 2 4 6 8 10 12 14 16 18 20 22 24 26
CD
F
Number of APs per scan
CDF (All) CDF (HOTCITY)
(a) Number of APs per scan
0
0.1
0.2
0.3
0.4
0.5
0.6
0.7
0.8
0.9
1
-100 -95 -90 -85 -80 -75 -70 -65 -60 -55
CD
F
RSSI (-dBm)
CDF (All) CDF (HOTCITY)
(b) CDF of RSS
Figure 4.1: HotCity deployment characteristics
0
0.5
1
1.5
2
2.5
3
-90 -80 -70 -60 -50 0
0.05
0.1
0.15
0.2
0.25
0.3
Data
rate
[M
bps]
Dro
pped R
X p
acket ra
tio
Signal strength [dBm]
Data rateDropped packet ratio
(a) Relationship between RSS, data rate anddropped packets
0
5
10
15
20
25
30
35
1 2 3 4 5 6 7 8 9 10 11 12 13
Ch
an
ne
l D
istr
ibu
tio
n (
%)
Channel Number
34.14
1.11 1.11 0.932.41
32.10
1.48 1.86
5.75
2.04
14.47
0.372.23
(b) Channel distribution
Figure 4.2: HotCity deployment characteristics (cont.)
The experimental route was chosen such that the mobile user always receives asufficiently high RSS. For instance, Figure 4.3 highlights the number of APs and themaximum RSS detected along the experimental path used in coper. The distributionof the number of APs shows that there is no disconnected area. Also, in all casesthe highest RSS is always greater than −80 dBm. Consequently, if the MS efficientlyselects APs, it will always be associated with a HotCity AP and have Internet con-nectivity. Note that a detailed characterization of the HotCity network is availablein [Castignani 2012a].

78 Chapter 4. Evaluation
0
0.1
0.2
0.3
0.4
0.5
0.6
0.7
0.8
0.9
1
0 1 2 3 4 5 6
CD
F
Number of APs per RS
0
0.1
0.2
0.3
0.4
0.5
0.6
0.7
0.8
0.9
1
-80 -75 -70 -65 -60 -55 -50
CD
F
Max RSS per RS [dBm]
Figure 4.3: CDF of the number of APs per RS and mean data rate per RSS
4.3 Using a second interface: the make-before-break ap-proach
4.3.1 Experimental setup
In order to analyze the performance of the static and dynamic algorithms we performeda set of experiments to quantify the performance of a second interface (used to optimizethe handover) compared to a legacy, single-interface handover implementation. To thisend, we configured a laptop embedding two IEEE 802.11 USB interfaces (EdimaxEW-7711USn) connected to two 3 dBi gain external antennas placed on the roof ofa Renault Twizy electric car. We placed the two antennas more than 80 cm apartin order to avoid interference that occurs when two IEEE 802.11 interfaces that arelocated close to each other are used simultaneously. This issue has been studied in[Nachtigall 2008, Robinson 2005]. The laptop implemented the Wireless Extensions(WEXT) interface for Linux over the rt2680 driver in the kernel space. For the dynamicalgorithm, we modified the laptop configuration in order to assign the same MACaddress to both interfaces.
The path taken for the experiments was 1.8 km long and included several intersec-tions, one roundabout, and one traffic signal.
The experimental scenario is as follows. At the point of departure, while the car isstill stationary, a 500 kpbs User Datagram Protocol (UDP) flow download is initializedfrom a remote server located on the campus of the University of Luxembourg. Theexperiment starts when the car starts moving. During the experiment, we recordedpackets received using tcpdump, the output of the WPA-supplicant debug, and theGPS location of the car. Note that we use DHCP to obtain an initial IP configuration

4.3. Using a second interface: the make-before-break approach 79
before the experiment began and retained it for the duration of the experiment. Whenusing the dynamic algorithm, we recorded received packets on both interfaces. Thetwo traces were merged and results were analyzed offline. We used editcap, part of thewireshark suite3, to remove duplicate packets observed when using the dynamic algo-rithm. Duplicate packets occur because both interfaces have the same MAC address.It is important to remove them during the evaluation in order to measure the actualpacket delivery ratio.
4.3.2 Evaluation of throughput and connected time
In this section we analyze the connectivity performance of the MS. We consider threedifferent handover approaches: a Single Interface (SI) approach, and the static anddynamic algorithms implementing a second interface. First, we focus on Layer-2 (L2)connectivity duration, i.e., how long the MS is associated with an AP. For the SI ap-proach, we consider the connected time as the time that elapses between MS associationand when a scan is triggered due to low RSS. When the MS uses two interfaces and im-plements the static algorithm, the connected time is the time that elapses between theinstant the MS is successfully associated, and the instant it triggers a new associationto the candidate AP. In the case of the dynamic algorithm, the MS is considered tohave L2 connectivity if at least one of its interfaces is associated to an AP. Figure 4.4(a)shows the minimum, average and maximum percentages of the time the MS remainsconnected at L2. With the SI approach, the L2 connection lasted between 52.3% and69.7% of the time, with an average of 62.5%. Compared to the SI approach, we findthat the additional interface offers a significant improvement in terms of L2 connectiv-ity. The static algorithm provides L2 connectivity between 71.3% and 84.7% of thetime, with an average of 79.2%, which is 17% higher than the SI algorithm on average.Finally, the dynamic algorithm outperforms both SI and the static algorithm. It isconnected at L2 for an average of 97.9% of the time (i.e., between 95% and 99.3%).The dynamic algorithm achieves almost continuous connectivity in all experiments.The second metric we propose is the Packet Delivery Ratio (PDR), (i.e., the numberof packets successfully received by the MS) for a 500 kpbs UDP downlink flow. This isshown in Figure 4.4(b), and allows us to estimate the quality of Layer-3 (L3) connec-tivity while moving. The downlink flow used was not particularly intense, but ratherillustrates loads produced by a typical multimedia connection. Figure 4.4(b) shows theminimum, average and maximum PDR for each handover algorithm. The same trendsare found as for the L2 connection: the SI approach has the lowest PDR (68.89% onaverage), while the two-interface approach outperforms it with 79.9% for the staticalgorithm, and 95% for the dynamic algorithm.
3https://www.wireshark.org/docs/man-pages/
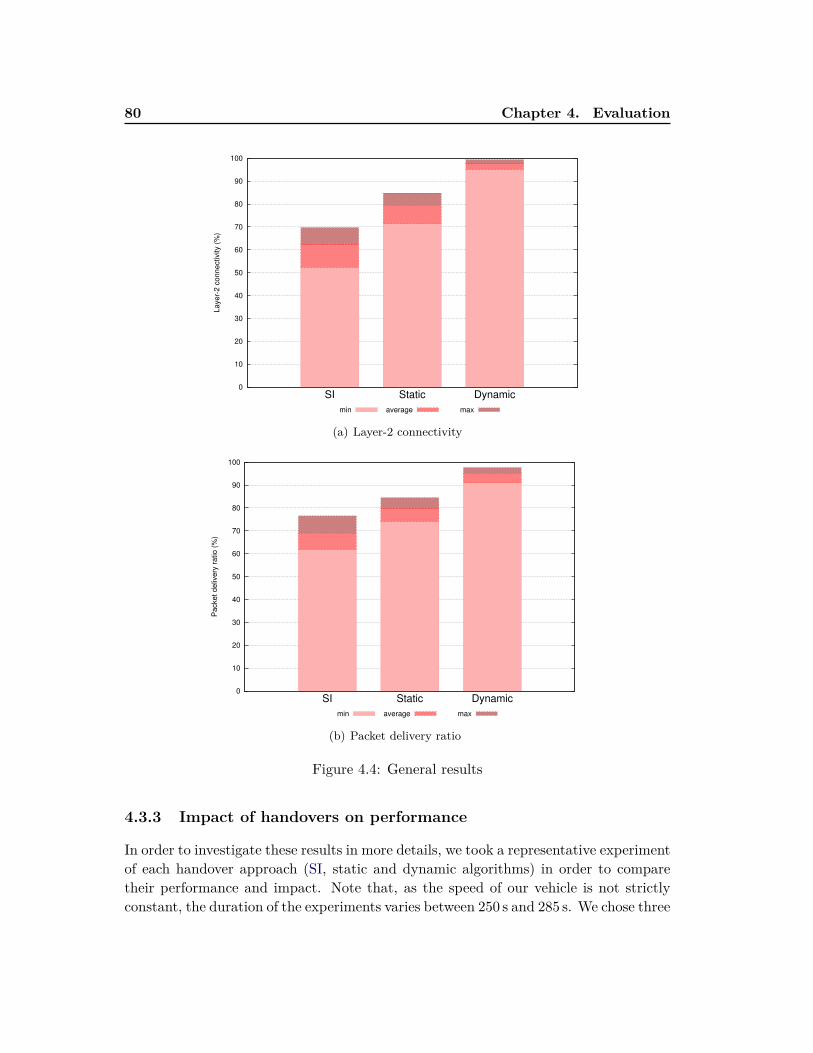
80 Chapter 4. Evaluation
0
10
20
30
40
50
60
70
80
90
100
SI Static Dynamic
Layer-
2 c
onnectivity (
%)
min average max
(a) Layer-2 connectivity
0
10
20
30
40
50
60
70
80
90
100
SI Static Dynamic
Packet deliv
ery
ratio (
%)
min average max
(b) Packet delivery ratio
Figure 4.4: General results
4.3.3 Impact of handovers on performance
In order to investigate these results in more details, we took a representative experimentof each handover approach (SI, static and dynamic algorithms) in order to comparetheir performance and impact. Note that, as the speed of our vehicle is not strictlyconstant, the duration of the experiments varies between 250 s and 285 s. We chose three

4.3. Using a second interface: the make-before-break approach 81
0
2
4
6
8
10
12
14
16
18
0 50 100 150 200 250 300
Bitra
te [M
Byte
s]
Time [s]
SI Static Dynamic
(a) Cumulative downloaded data
0
5
10
15
20
25
30
35
0 50 100 150 200 250 300
Bitra
te [M
Byte
s]
Time [s]
SI Static Dynamic
(b) Cumulative number of handovers
Figure 4.5: A representative single run
experiments lasting approximately the same amount of time. Figure 4.5(a) shows thechanges in the number of bytes downloaded for the three approaches for the durationof the experiment. Note that for all the approaches, throughput is identical for thefirst 25 seconds. The first handover occurs at time 25 s. The change in the numberof downloaded bytes observed for SI and the static algorithm differ from observations

82 Chapter 4. Evaluation
for the dynamic algorithm. This is because the SI and the static algorithms lead to adisconnection during the handover. However, over the long term, the static algorithmdownloaded more bytes than SI. When we look at these two curves in detail, it isclear that throughput in the SI approach suddenly falls to zero several times; thesame phenomenon is seen for the static algorithm, but lasts for less time. In contrast,throughput growth for the dynamic algorithm is relatively uniform, although there areshort interruptions at times 50 s, 160 s, and 230 s.
Figure 4.5(b) illustrates the cumulative number of handovers for each of the threealgorithms, and is used to analyze the impact of handovers on connectivity perfor-mance. It makes it possible to measure the reactivity of the different algorithms withregard to changes in topology and shows that periods of low SI throughput (shown inFigure 4.5(a)) match the triggering of handovers. We can conclude that the handoverimpacts the SI approach much more than the static and dynamic algorithms, althoughthe number of handovers is substantially higher for the static and dynamic algorithms.Two reasons can be put forward to explain this: First, note that the implementationdoes not take into account the “ping-pong” effect, which produces several handoversbetween the current and the candidate AP when their signal strength is similar. Fig-ure 4.5(b) highlights this ping-pong effect as the number of handovers abnormallyincreases at certain moments (50s and 120s for the static algorithm, and 220s for bothstatic and dynamic algorithms). A detailed study of these short periods reveals thatthey correspond to specific locations where there are two HotCity APs providing similarRSS, which is below −75dBm. The small connection interruptions experienced withthe dynamic algorithm are explained by handovers that are triggered close in time dueto this ping-pong effect. Liao et al. [Liao 2006] suggest that the hysteresis process canbe used to avoid this. Second, since our approach uses a second radio that is contin-uously scanning, nearby AP information is more frequently updated. This allows thealgorithms to rapidly react to changes in topology, i.e., candidate APs are discoveredmore frequently. The fact that there are more handovers using the static algorithmcompared to the SI approach partially explains the fact that the L2 connectivity (seeFigure 4.4(a)) of the static algorithm is not as high as expected. However, even thissimple solution outperformed the SI approach.

4.4. Replacing scanning by prior knowledge of the network 83
4.4 Replacing scanning by prior knowledge of the network
4.4.1 MROAD
4.4.1.1 Experimental setup
Figure 4.6: Experimental route with shortest and longest sequences
In this section, we evaluate mroad. mroad, presented in Chapter 3, Section 3.3,proposes a novel AP selection approach that relies on prior knowledge of the RSSof IEEE 802.11 APs all along the vehicle’s route (obtained through simulation) inorder to predict optimal handover locations. The experimental route comprises severalAPs with overlapping coverages. Therefore, the MS has several possible sequencesof transitions. In order to identify the sequence with the highest PDR, we considerthe trade-off between the impact of increasing the RSS and increasing the length ofdisconnections (due to more handovers). We formulate this issue as a bi-objectiveoptimization problem (described in Chapter 3, Section 3.3.3).
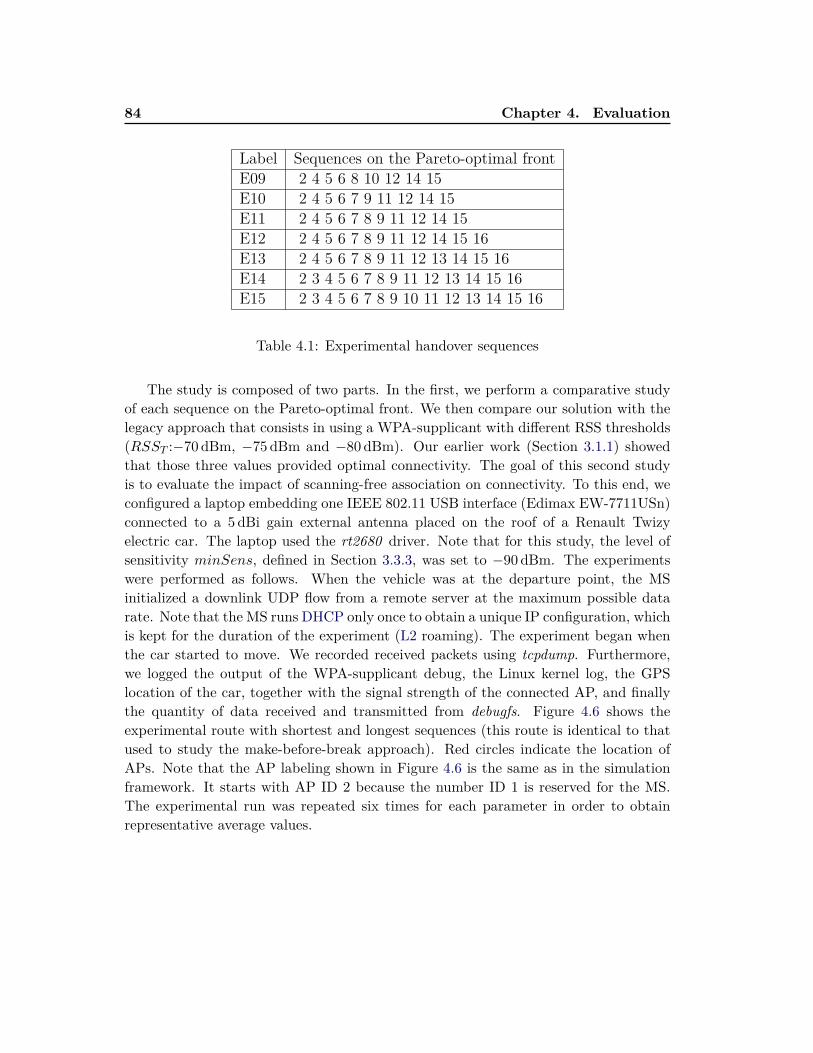
84 Chapter 4. Evaluation
Label Sequences on the Pareto-optimal frontE09 2 4 5 6 8 10 12 14 15E10 2 4 5 6 7 9 11 12 14 15E11 2 4 5 6 7 8 9 11 12 14 15E12 2 4 5 6 7 8 9 11 12 14 15 16E13 2 4 5 6 7 8 9 11 12 13 14 15 16E14 2 3 4 5 6 7 8 9 11 12 13 14 15 16E15 2 3 4 5 6 7 8 9 10 11 12 13 14 15 16
Table 4.1: Experimental handover sequences
The study is composed of two parts. In the first, we perform a comparative studyof each sequence on the Pareto-optimal front. We then compare our solution with thelegacy approach that consists in using a WPA-supplicant with different RSS thresholds(RSST :−70 dBm, −75dBm and −80 dBm). Our earlier work (Section 3.1.1) showedthat those three values provided optimal connectivity. The goal of this second studyis to evaluate the impact of scanning-free association on connectivity. To this end, weconfigured a laptop embedding one IEEE 802.11 USB interface (Edimax EW-7711USn)connected to a 5 dBi gain external antenna placed on the roof of a Renault Twizyelectric car. The laptop used the rt2680 driver. Note that for this study, the level ofsensitivity minSens, defined in Section 3.3.3, was set to −90dBm. The experimentswere performed as follows. When the vehicle was at the departure point, the MSinitialized a downlink UDP flow from a remote server at the maximum possible datarate. Note that the MS runs DHCP only once to obtain a unique IP configuration, whichis kept for the duration of the experiment (L2 roaming). The experiment began whenthe car started to move. We recorded received packets using tcpdump. Furthermore,we logged the output of the WPA-supplicant debug, the Linux kernel log, the GPSlocation of the car, together with the signal strength of the connected AP, and finallythe quantity of data received and transmitted from debugfs. Figure 4.6 shows theexperimental route with shortest and longest sequences (this route is identical to thatused to study the make-before-break approach). Red circles indicate the location ofAPs. Note that the AP labeling shown in Figure 4.6 is the same as in the simulationframework. It starts with AP ID 2 because the number ID 1 is reserved for the MS.The experimental run was repeated six times for each parameter in order to obtainrepresentative average values.

4.4. Replacing scanning by prior knowledge of the network 85
4.4.1.2 Results
(a) Legacy solution (RSST −75dBm)
(b) mroad (sequence length 9)
(c) mroad (sequence length 15)
Figure 4.7: Changes in signal strength and download rate
In this section we analyze several connectivity metrics. As described above, we considerten cases: the seven handover sequences that appear on the Pareto-optimal front ofthe two-objective optimization shown in Table 4.1 and the three legacy solutions. Formroad, handover sequences have different lengths (from 9 to 15 APs) and are calledE09 to E15 respectively. For the legacy solutions, the WPA-supplicant was set withthree different RSST : −70dBm, −75dBm, and −80 dBm. These cases are called L-70,L-75, and L-80 respectively.

86 Chapter 4. Evaluation
1
1.2
1.4
1.6
1.8
2
L-70 L-75 L-80 E09 E10 E11 E12 E13 E14 E15 0.5
0.6
0.7
0.8
0.9
1
Me
an
da
ta-r
ate
[M
bp
s]
Re
lative
asso
cia
ted
tim
e
Experiments
Mean data-rateRelative associated time
Figure 4.8: Download data rate vs. associated time
Network performance comparison Figures 4.7(a), 4.7(b) and 4.7(c) show repre-sentative results of changes in RSS and download rate for the legacy solutions with anRSST set to −75dBm (L-75), and mroad with the shortest and longest sequences (E09and E15). The vertical red lines represent disconnections, and vertical green lines showreassociation with a candidate AP whose identifier is indicated above the line. Notethat when the AP does not belong to the set of APs in the overlapping AP graph, itis noted as O. We observe that the amount of data downloaded grows faster and moresteadily for mroad compared to L-75, which experienced three plateaus (i.e., zero-throughput periods lasting longer than 5 s). After 110 s, mroad was able to downloadroughly 27MB compared to only 22MB with the legacy solution. Despite an additionalhandover (7 vs. 6), the MS was disconnected for less time using sequence E15 thanlegacy solution L-75. Using the legacy solution there were three handovers that lastedlonger than 5 s, whereas for mroad, the MS was disconnected for, at most, 3 s. Notethat in Figure 4.7(a) when using legacy solution L-75, the MS once associated with anAP that was not on the experimental route. However, although it provided high signalstrength at a given moment, it did not offer good connectivity. Finally, changes in sig-nal strength show that mroad experienced higher signal strengths from the beginningof the experiment until around time 70 s when there were two long periods where theRSS dropped below −80dBm. Note that the amount of data received significantly de-creased when the received signal dropped below −80dBm. These observations confirmthe results shown in Figure 4.2(a) and the study conducted in [Castignani 2012a].
Figure 4.8 shows the mean data rate of the intensive UDP flow and the correspond-ing associated time with a 99 % confidence interval for each scenario. The mean data

4.4. Replacing scanning by prior knowledge of the network 87
rate is computed as the ratio of the amount of data downloaded over a complete runand the overall experimental time. We consider the associated time to be the timefrom when the MS associates with an AP until the beginning of the scan that precedesthe next handover. With a maximum data rate of 1.5Mbps, legacy solutions providedlower data rates than mroad, which reached up to 1.8Mbps (bandwidth limited to2Mbps). We observe that the MS was associated up to 90 % of the time with mroad(E15), compared to up to 72 % with the legacy solutions (L-75). Note here that theassociated time and the mean data rate follow the same trend. We can explain thisby the fact that the server was continuously sending packets such that when the linkbetween the MS and the AP was up, the MS would immediately receive packets. How-ever, this assumption is not verified for E09 to E11. An explanation of this anomaly isproposed at the end of this section.
Next, we investigate disconnection duration and signal strength distribution. Fig-ure 4.10 illustrates the distribution of the disconnection duration for all experimentalruns. The disconnection time of the legacy solutions shows a bimodal distribution. Thefirst mode was between 0.7 s and 1 s, which includes 48 % of cases in L-70. The secondmode was between 7 s and 8 s, with a probability of 13 %. In contrast, a disassociationtime of 0.2 s was most frequently observed with mroad. Two factors may explain this.First, legacy solutions performed a full active scan, i.e., they looked for APs on allchannels before initiating the handover to the next AP. This scan was costly in termsof time and caused long disconnections. mroad, on the other hand, only needed toprobe an AP that already been selected by the AP selection algorithm. The differencebetween the disconnection experienced with mroad and the legacy solutions suggeststhat mroad probes of the selected AP do not have a significant impact on disconnectionduration. Second, mroad always chooses the most appropriate location to perform thehandover. This is unlike legacy solutions, which triggered a handover based only on theRSS of the current AP, and sometimes chose APs that were not on the experimentalroute, leading to poor connectivity (see Figure 4.7(a)). Finally, Figure 4.9 shows thedistribution of the signal strength received by the MS and the average signal strengthrecorded over all experiments for each scenario. Although the median signal strengthof the E15 and legacy solutions were similar, the legacy solutions had a higher signalstrength on average. This is because in the legacy handover approach the MS remainsdisconnected for longer periods (compared to mroad), which prevents it from sensingvery low RSS (see Figure 4.7(a) and Figure 4.7(c)).
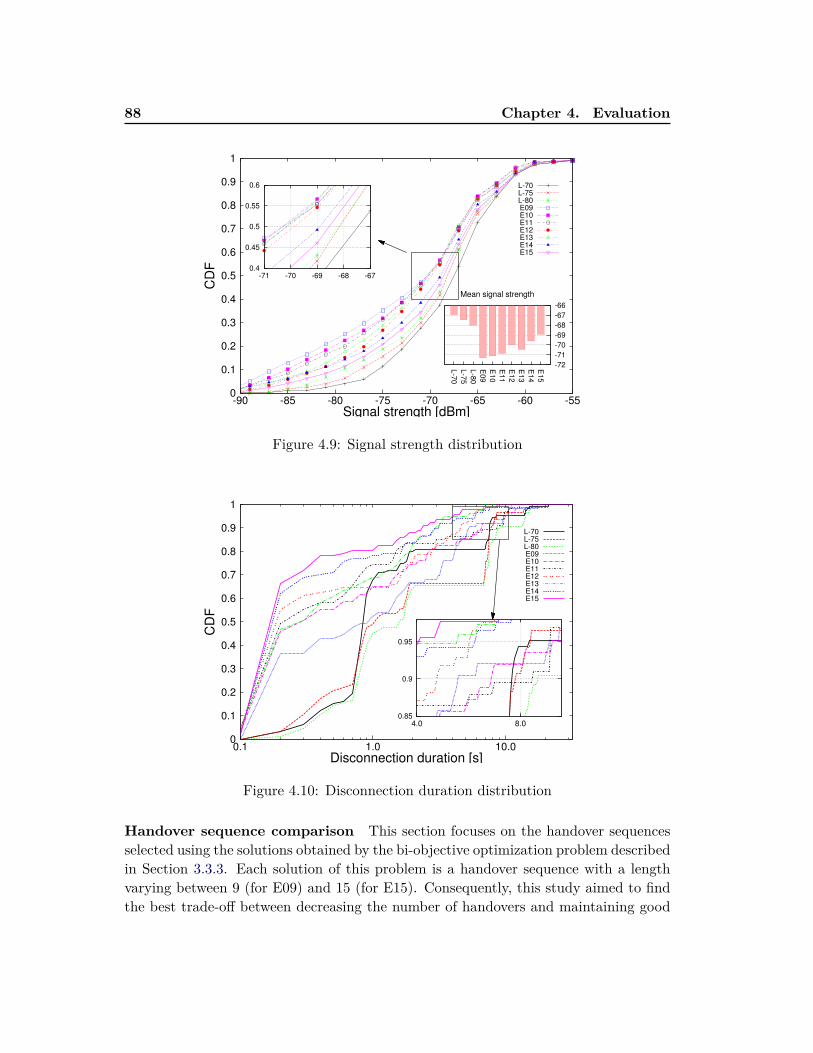
88 Chapter 4. Evaluation
0
0.1
0.2
0.3
0.4
0.5
0.6
0.7
0.8
0.9
1
-90 -85 -80 -75 -70 -65 -60 -55
CD
F
Signal strength [dBm]
L-70L-75L-80E09E10E11E12E13E14E15
0.4
0.45
0.5
0.55
0.6
-71 -70 -69 -68 -67
L-7
0
L-7
5
L-8
0
E09
E10
E11
E12
E13
E14
E15
-72
-71
-70
-69
-68
-67
-66
Mean signal strength
Figure 4.9: Signal strength distribution
0
0.1
0.2
0.3
0.4
0.5
0.6
0.7
0.8
0.9
1
0.1 1.0 10.0
CD
F
Disconnection duration [s]
L-70L-75L-80E09E10E11E12E13E14E15
0.85
0.9
0.95
4.0 8.0
Figure 4.10: Disconnection duration distribution
Handover sequence comparison This section focuses on the handover sequencesselected using the solutions obtained by the bi-objective optimization problem describedin Section 3.3.3. Each solution of this problem is a handover sequence with a lengthvarying between 9 (for E09) and 15 (for E15). Consequently, this study aimed to findthe best trade-off between decreasing the number of handovers and maintaining good

4.4. Replacing scanning by prior knowledge of the network 89
signal quality (even if this implies more disconnections).
First, we compare two samples of a representative run of the shortest and the longestsequence for mroad (Figure 4.7(b) and Figure 4.7(c)). The downloaded data rate (redline) increased more rapidly for the E15 sequence than for the E09 sequence. The datarate of E09 experienced four plateaus vs. three for E15. Moreover, E09 plateaus lastedbetween 5 s and 10 s whereas those of E15 lasted between 2 s and 5 s. In the first 95 sof the experiment, the MS performed 7 handovers for E15 for a mean connection timeof 13.6 s per AP, while for E09 it performed 5 handovers in 205 s for a mean connectiontime of 21 s per AP. The fact that the MS stayed connected longer to the same APhad an impact on the RSS, which dropped below −80dBm for 20 s for E09 comparedto 5 s for E15.
Figure 4.8 shows that the associated time and the download data rate increase asthe length of the handover sequence increases. In particular, we observed two possiblescenarios: those with best performance (from E12 to E15); and those offering worstperformance (from E09 to E11). The data rate and relative association time of thefirst group followed the same trend, whereas in the second group the data rate signif-icantly decreased as the sequence length decreased even if they remained associatedfor approximately the same length of time. Although Figure 4.9 shows similar meansignal strengths for scenarios E09 to E13, the distribution of these strengths revealsa clue about the difference between E11 and E12. The distribution of the lowest sig-nal strengths for the group providing the worst performance was higher than for theother scenarios. The representative samples of changes in RSS and download datarate shown in Figure 4.7 highlights that such low signal strengths were not able toprovide good connectivity at L3. This is because the packets error rate is high underthese conditions. Although the number of disconnections decreased when the sequencelength decreased, Figure 4.10 confirms that the shortest sequences have longer overalldisconnection times. In particular, note that there is the same division into two groups.In scenarios E12 to E15, the MS was not disconnected for longer than 8 s, comparedto scenarios E09 to E11, where 7 % and 10.5 % of disconnections were longer than 8 s(see zoom in Figure 4.10).
Note that these results are specific to the network studied because they depend onnetwork density. In fact, municipal hotspot networks are usually sparse because therange of an outdoor AP is large (up to 300m) and they are expensive to deploy. Incontrast, CNs, which are usually very dense, would lead to a different trade-off favoringa lower number of handovers as the coexistence of multiple APs providing similar RSSwould lead to the ping-pong effect and reduce connection stability.

90 Chapter 4. Evaluation
4.4.2 COPER
4.4.2.1 Experimental setup
As for earlier studies, the experiment presented here were performed in the Gasperichneighborhood of Luxembourg. However, the route was 2.6 km long and comprised 18roadside APs. Road furniture included one traffic light, multiple stop signs, and variousintersections. However, as the speed limit was low (i.e., 30 km/h) for almost all theroute, the duration of each individual experiment was roughly constant. The averageduration of a single experiment was 353 s with a standard deviation of 14 s.
In order to provide meaningful results, the performance of coper is compared toother solutions: (i) a network manager4 (netMan), (ii) a modified version of the WPA-supplicant with an RSS threshold of −75dB, and (iii) mroad. We carried out thiscomparative study of netMan and the WPA-supplicant in order to evaluate how legacyscanning-based approaches perform compared to coper and mroad, which are specif-ically designed for vehicular communications. The comparison of coper and mroadexamines the potential impact of the direction detection process on MS communica-tion. The experiments are performed as follows. The MS obtains an IP address throughDHCP and retains it for the duration of the experiment, as the HotCity network sup-ports L2 handovers. When the vehicle is at the departure point, the MS initializes a2.5Mbps downlink UDP flow from a remote server in our laboratory. During the ex-periment, we captured received packets using tcpdump and recorded the Linux kernellog, the GPS location of the vehicle, and network interface statistics (e.g., RSS of thecurrent AP, amount of data received and transmitted, packet loss). The experimentswere repeated five times for each potential solution in order to obtain representativeaveraged values.
4.4.2.2 Evaluation of AP selection
Overall% of RS
Medianvalue(dB)
Relative % ofRS where∆S < 5dB
Relative % ofRS RSS <−80dBm
19.3 2.6 70.1 2.8
Table 4.2: Distribution of ∆S when ∆S > 0
In this section, we focus on the COPER AP selection process. As previously men-tioned, AP selection is suboptimal when the handover decision is delayed until the nextpredicted direction is taken, or when the handover is misplaced due to an incorrect RSSestimate. The spatial shifts caused by these two issues are analyzed in Figure 4.11,which shows that the handover location shifts due to a lack of information about the
4https://wiki.gnome.org/Projects/NetworkManager

4.4. Replacing scanning by prior knowledge of the network 91
0
0.1
0.2
0.3
0.4
0.5
0.6
0.7
0.8
0.9
1
0 10 20 30 40
CD
F
Distance [m]
ShS 0
0.1
0.2
0.3
0.4
0.5
0.6
0.7
0.8
0.9
1
-40 -20 0 20 40
CD
F
Distance [m]
ShS/R
Figure 4.11: CDF of ShS and ShS/R
vehicle’s direction (ShS) are much shorter than those caused by an erroneous RSS esti-mate (ShS/R). ShS is equal to zero in almost 79% of cases compared to 21% for ShS/R.Moreover, ShS is, in general, below 20m whereas ShS/R is uniformly distributed in therange [−40m; 40m]. We conclude that handover misplacements are mainly due to thedifference between the simulated RSS (stored in the CDB) and the real RSS. The dis-tribution of RSS differences between the current and best AP (see Table 4.2) revealsthat the RSS of the current AP is the best available in more than 80% of RSSs onthe run. Therefore, the misplacement of the handover has a negligible impact on RSS.Indeed, the median RSS difference relative to the best AP is only 2.8 dB and in 70.1%of the cases is under 5 dB. In addition, there are not many cases where suboptimal APselection implies a critically low RSS (i.e., below −80dBm): we observed ∆S > 0 inonly 2.8% of RS. As a result, we conclude that corner modeled RSSs are realisticenough to be used for AP selection.
4.4.2.3 Connection performance of the MS
In this section we analyze several metrics related to MS connectivity: the data rate ofthe downlink UDP flow at the MS, MS disconnection time, and the RSS of the currentAP.
Network performance comparison Figure 4.12 shows the distribution of the meandata rate of the downlink UDP flow. This shows that the total time during which theMS does not receive any data from the network is much longer for both netMan andthe WPA-supplicant-based handover (around 20%) than for mroad and coper (lessthan 1%). Table 4.3 shows that mroad and coper have both high association time

92 Chapter 4. Evaluation
0
0.1
0.2
0.3
0.4
0.5
0.6
0.7
0.8
0.9
1
0 0.5 1 1.5 2 2.5 3 3.5 4
CD
F
Data rate [Mbps]
COPERMROAD
WPA sup -75Network manager
Figure 4.12: CDF of the data rate
EstimatedPDR Associated time Number of AP
association per run
Distinct APassociated(outsideroadside)
Mean connectedtime
NetMan 0.79 ± 0.05 88.2 ± 0.68 15.4 ± 1.17 15 (3) 23.79 ± 13.25WPA sup -75 0.80 ± 0.02 78.8 ± 0.47 39.7 ± 3.12 25 (6) 7.15 ± 0.87
mroad 0.97 ± 0.03 99.06 ± 0.17 19 ± 0.00 18 (0) 15.25 ± 1.43coper 0.95 ± 0.02 99.08± 0.14 19 ± 0.00 18 (0) 17.17 ± 1.33
†Corresponding to a confidence level of 95% assuming a normal distribution
Table 4.3: Comparative performance of handover solutions with confidence intervals†.
(above 99%) and high PDR (above 95%). Similarly, netMan and the WPA-supplicanthave approximatively the same PDR (around 80%). Note that the PDR is an estimate,as in our experiments the server the MS connects to sends a flow of 2.5Mbps, which ishigher than the capacity of the network.
Figure 4.13 shows the distribution of the disconnection time for all approaches.The median value is around 1200ms (maximum 5385ms) for the WPA-supplicant and1300ms (maximum 7684ms) for netMan, versus around 100ms (maximum 2277ms and1325ms) for mroad and coper respectively. This is explained by the fact that theWPA-supplicant and netMan trigger AP scanning at each handover, which could alsopartially explain why the MS receives no data for around 20% of the time using thesesolutions (see Figure 4.12). We conclude that avoiding the scan significantly reducesdisconnection periods.
Furthermore, the RSS distribution (Figure 4.14) again shows a large difference

4.4. Replacing scanning by prior knowledge of the network 93
0
0.1
0.2
0.3
0.4
0.5
0.6
0.7
0.8
0.9
1
0 1000 2000 3000 4000 5000
CD
F
Disconnected time [ms]
COPERMROAD
WPA sup -75Network manager
Figure 4.13: CDF of the disconnected time
between the two sets of solutions. RSS was under −80dBm in 21% and 33% of casesfor the WPA-supplicant and netMan respectively, while such a low signal level was onlyobserved in 3.3% and 2.8% of cases for mroad and coper respectively. Moreover, themedian observed RSS is around −64dBm for mroad and coper versus −67dBmfor the WPA-supplicant and −71 dBm for netMan. Again, the RSS distributions formroad and coper are similar and close to the distribution of the maximum RSS sensedover the experimental path (Figure 4.3). Figure 4.2(a) shows that when the RSS dropsbelow −80dBm, the data rate decreases significantly.
In contrast, the distributions for netMan and the WPA-supplicant differ signifi-cantly. Although NetMan is more affected by low RSS than the WPA-supplicant, thisseems to have no impact on the data rate nor on the PDR. The RSS distributionfor values greater than −65dBm for coper and mroad are not equal. This couldbe because AP selection for coper can be delayed compared to mroad (cf. Section4.4.2.2). Nevertheless, this has no significant impact on the data rate because, dueto ISP bandwidth capping, all RSS above −77dBm provide equivalent data rates (cfFigure 4.2(a)).
Next we consider association time, the number of successful associations, and themean association time (see Table 4.3). Association time starts when the MS associateswith an AP and ends at the beginning of the scan that precedes the next handover.These results show that, using mroad and coper, the MS is almost always associ-ated with an AP (99% of the tune), while this is the case for only 88.2% and 78.8%of the time with netMan and the WPA-supplicant respectively. We observe a signif-icant difference in mean connected time with these two solutions. The MS remainsconnected with an AP for an average of 23.79 s for NetMan and 7.15 s for the WPA-

94 Chapter 4. Evaluation
0
0.1
0.2
0.3
0.4
0.5
0.6
0.7
0.8
0.9
1
-100 -90 -80 -70 -60 -50
CD
F
Signal strength [dBm]
COPERMROAD
WPA sup -75Network manager
Figure 4.14: CDF of the sensed RSS
supplicant versus 15.25 s and 17.17 s for mroad and coper respectively. In the caseof the WPA-supplicant, the higher re-connection frequency leads to shorter connec-tion duration, which reduces the stability of the MS connection - unlike netMan thatis even more durably connected than mroad and coper. Figure 4.13 shows that theWPA-supplicant causes long disconnections due to scanning, thus, this solution is moreimpacted by disconnections than netMan because it triggers handovers much more of-ten. Note that netMan and the WPA-supplicant are affected by different factors: poorlink quality during long periods for the first; and frequent disconnections for the sec-ond. These two factors seem to have a similar impact, as both have the same data ratedistribution and PDR. These results also show that mroad and coper offer long andstable associations (the sequence of selected APs remains the same over the differentruns).
We note that AP selection becomes unstable when it is only based on instantaneousscanning results. Both netMan and the WPA-supplicant select between three and eightAPs that are not on the vehicle’s route; these APS are unable to provide a sustainableRSS. Also, roadside APs are not always selected in their order of appearance. Incontrast, mroad and coper only selected the 18 APs that provided the best signal allalong the path.
Note that coper slightly outperforms mroad in terms of disconnection time. Threefactors may explain this difference. The first is handover spatial shifts caused by thelack of information about the vehicle’s direction (highlighted in the previous section). Itmay also be due to the fact that the experimental conditions were not exactly the samewhen evaluating mroad and coper, and because the performance of a given solutioncan vary slightly from one run to another. Nevertheless, we can conclude that coper

4.4. Replacing scanning by prior knowledge of the network 95
0
0.1
0.2
0.3
0.4
0.5
0.6
0.7
0.8
0.9
1
1 10 100 1000
CD
F
Duration [ms]
ASM AP selectionCM list parsingCM AP probingCM Association
Figure 4.15: CDF of the handover phase duration
performs as well as mroad with the advantage that it requires no prior knowledge ofthe vehicle’s path, which greatly increases flexibility.
Impact of AP selection and the handover process Finally, we study the impactof the AP transition process on MS connectivity. We distinguish between the APselection phase, which involves the offline computation to find the best AP, and theexecution of the handover, where the CM parses the handover list, probes the selectedAP and associates to it. Figure 4.15 illustrates the duration of the different elementsthat make up these two phases.
The need for offline computation implies that AP selection is performed by theASM and the candidate AP list is parsed by the CM before a handover is attempted.The median duration of ASM AP selection and candidate AP list parsing are 340msand 27ms respectively. This is a long time compared to the time taken to execute thehandover, which takes a median of 98ms for AP probing and 12ms for authenticationand association. However, as AP selection is performed offline, its median duration(under 400ms) only reflects the reaction time of coper when a new RP is discovered.We can, thus, conclude that even in the worst case, AP selection only slightly delayshandover.
During the probing phase in coper, the MS sends a broadcast Probe Requeston the channel where the selected AP is operating and waits for Probe Responsesfrom all APs in this channel for a fixed time. On the other hand, in the standardhandover, the MS repeats the same process on all channels. This results in a muchshorter median duration for coper (98ms) compared to the standard handover usedby netMan (1143ms). Note that the AP probing duration distribution has three modesthat correspond to: (i) the case where the MS retrieves the selected AP from recently-
96 Chapter 4. Evaluation
stored scan results (∼20ms); (ii) the MS received a Probe Response from the selectedAP after the first attempt (∼100ms); and (iii) the MS needs several attempts to probethe selected AP (longer than 200ms).
The handover phase of coper uses probing and association methods available inthe existing Linux kernel module, which could be optimized. For instance, probingcould be improved by specifically targeting the Service Set ID (SSID) of the selectedAP, sending multiple probes within a short time interval or timing out more quicklywhile waiting for Probe Responses.
4.5 Discussion
In this section we discuss the performance of the proposed solutions with respect tothe two objectives proposed in this thesis.
Using a second interface In Section 4.3 we showed that using a second interfacewith the dynamic algorithm significantly reduces handover latency and could eveneliminate it. In addition, although beyond the scope of this thesis, this solution couldalso be used to reduce handover latency if the transition is performed at the L3. Themake-before-break approach potentially allows a mobile user to experience seamlesshandovers though networks other than the hotspot network studied here (in particularCNs). As a result, the approach is very effective with regard to the first objective ofthis thesis. However, as we showed in Section 3.2.3, the AP selection process consideredhere relies on scanning and is vulnerable to the detection of undesirable APs and suddendisconnections due to the loss of the LoS. A second interface only provides a partialresponse to this issue. Consequently, it needs to be implemented alongside anothersolution intended to optimize AP selection (like mroad and coper) in order to fulfillthe requirement.
MROAD and COPER Both mroad and coper rely on the principle of removingscanning and replacing it with prior knowledge of road topology, the location of APs,and RSS simulations. By removing the need to scan, these solutions significantlydecrease handover latency compared to legacy scanning-based solutions (from morethan 1 s to around 100ms). Although improvements to the driver may reduce thislatency even further, it is impossible to remove it completely due to candidate APprobing and the IEEE 802.11 standard association process. As a result, the make-before-break approach performs better than mroad and coper in reducing handoverlatency. In contrast, AP selection was improved by introducing prior knowledge of thenetwork and road topology. Consequently, mroad and coper successfully address thesecond objective of this thesis (see Section 4.4.2.2). We also highlighted that the impactof handover location shifts due to the lack of information about the vehicle’s direction

4.5. Discussion 97
is negligible. Nevertheless, AP selection could still be improved by introducing moredynamic network information so that candidate APs are chosen with respect to theiractual state (including load balancing, temporary sources of interference, etc.). Thisconcern is an element of the discussion presented in the next chapter.
In conclusion, both mroad and coper, which were designed to meet the objectivesof handover latency reduction and improved AP selection lead to a significant improve-ment in vehicular communications through IEEE 802.11 networks (99% L2 connectiv-ity and a PDR of 95%). Although similar network performance was achieved with themake-before-break approach, connections are less stable and cannot anticipate futurenetwork conditions. In contrast, the approaches proposed in this thesis offer short-term prediction of network conditions that make it possible, among other advantages,to predict white areas and anticipate connection loss by switching to another network.


Chapter 5
Conclusion and perspectives
5.1 Concluding remarks
Currently, a large part of mobile communications are provided by cellular networks(UMTS, HSPA, LTE, and in the near future LTE-A). These wide area networksprovide high throughput and support high-speed mobility. At the same time, IEEE802.11 network density has grown significantly over the past decade, particularly inurban areas. Although their deployment is unsystematic, they are able to provide highthroughput in almost all public urban areas. In order to obtain maximum benefitfrom these heterogeneous networks, an MS must be able to make efficient connections.However, as handovers lead to frequent disconnections, the optimization of mobilecommunications though IEEE 802.11 networks remains challenging.
This thesis focuses on the optimization of vehicular communications through IEEE802.11 networks. As handover latency is fixed, the impact of the handover increaseswith speed, which has a major impact on vehicular communications. In addition, ve-hicular mobility creates large variations in RSS due to high speeds and urban topology.The analysis of the legacy IEEE 802.11 handover under vehicular mobility showed thatthe discovery phase, i.e. scanning, is the main contributor to latency. Furthermore, ithighlighted the inability of scanning to provide accurate information on nearby APs,leading to an inefficient AP selection policy. We therefore identified two objectivesintended to reduce the impact of the handover, namely: (i) reduced handover latency,and (ii) improved AP selection that takes into account short-term changes in the net-work. The first objective aims to make handovers smoother, while the second changesthe handover paradigm from a negative statement (avoid imminent disconnection) to apositive one (select a candidate AP as soon as it becomes the best AP). This change ofparadigm corresponds to the Always Best Connected concept proposed by Gustafssonand Jonsson [Gustafsson 2003]. This paradigm aims not only to avoid sudden dis-connections due to vehicular mobility, but also to optimize RSS, and thus, receivedthroughput.
The first approach used a legacy scanning-based handover technique with the in-troduction of a second interface to connect to an IEEE 802.11 hotspot urban networkconsistent with the make-before-break principle. This purpose of this approach (whichhas been tested in the literature but only in indoor scenarios) was to study the negativeimpact of scanning-based AP selection and show that it was possible for an MS to be

100 Chapter 5. Conclusion and perspectives
seamlessly connected to IEEE 802.11 networks. The results of experiments performedin a residential area highlighted the instability of AP selection (10 different AP se-quences were selected in 10 experiments), while scanning results were also inconsistent.In addition, a naive, scanning-based approach often selected APs that were not on thevehicle’s route and which were not able to provide good RSS over long periods due tothe rapid loss of the LoS. Although AP selection was unstable, using a second interfaceto anticipate the new connection allowed the MS to remain connected on average 98%of the time with a PDR of 95%. Disconnections were mainly due to handovers that weretriggered too close together in time. These results suggest that the make-before-breakapproach is very efficient with regard to the first objective of this thesis. Furthermore,although it was not shown here, it is likely that it can also reduce (or even eliminate)L3 handover latency. However, it does not address the second objective of this thesis.
Unlike the make-before-break approach, the main goal of the second approach wasto optimize AP selection. This consists in providing prior knowledge of the networktopology, the location of APs, and their simulated RSS to the MS (rather than scanningto obtain results). This allows the MS to select APs based on an accurate prediction ofchanges in the network. Consequently, the MS can select the AP providing the highestRSS for a given period, and identify the best location to perform the handover. Thiswas determined as the location where the RSS of both current and candidate APs aresimultaneously maximized. The first proposed solution was mroad. mroad assumesthat the vehicle’s route is known on departure, which makes the prior selection of APspossible. Handovers are triggered based only on the current location of the vehicle, asthe MS knows about candidate APs in advance and the best handover location. Theanalysis of the various possible AP sequences on the experimental route highlighted abi-objective optimization problem; between RSS maximization on the one hand, andthe minimization of handovers (implying disconnections) on the other. We identifiedthe set of sequences making up the Pareto optimal front and tested them. By avoidingscanning latency, disconnections were reduced to such an extent that priority couldbe given to the solution that maximised RSS. However, this result is only useful in alow-density network such as the hotspots considered in our experiments. The secondcontribution was coper. This solution relies on the same principles as mroad exceptthat it does not require prior knowledge of the vehicle’s route. Instead, it implementsa direction detection module that analyses the vehicle’s trajectory in real time. Itassumes that the vehicle trajectory can often be predicted as it follows that road layout,while uncertainty only occurs at an intersection. Field experiments concluded that theresults from coper and mroad were similar, although with coper vehicle directionwas detected in real time, connection time was 99%, and PDR was over 95%.
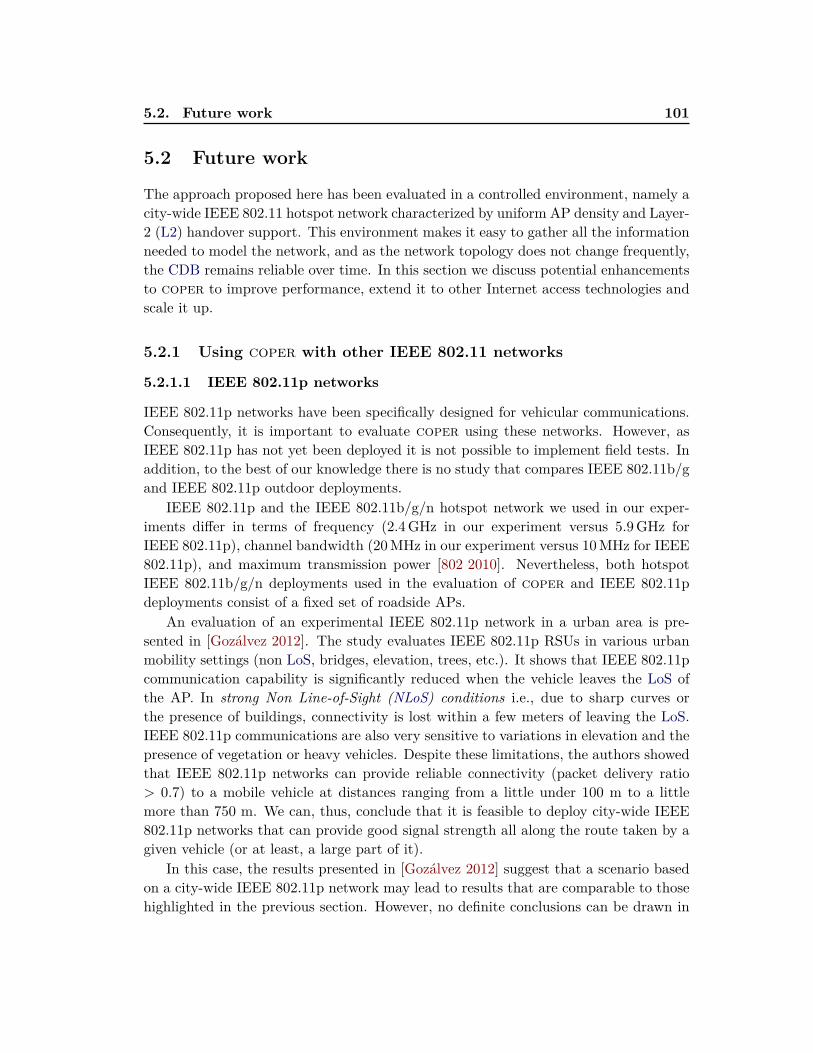
5.2. Future work 101
5.2 Future work
The approach proposed here has been evaluated in a controlled environment, namely acity-wide IEEE 802.11 hotspot network characterized by uniform AP density and Layer-2 (L2) handover support. This environment makes it easy to gather all the informationneeded to model the network, and as the network topology does not change frequently,the CDB remains reliable over time. In this section we discuss potential enhancementsto coper to improve performance, extend it to other Internet access technologies andscale it up.
5.2.1 Using coper with other IEEE 802.11 networks
5.2.1.1 IEEE 802.11p networks
IEEE 802.11p networks have been specifically designed for vehicular communications.Consequently, it is important to evaluate coper using these networks. However, asIEEE 802.11p has not yet been deployed it is not possible to implement field tests. Inaddition, to the best of our knowledge there is no study that compares IEEE 802.11b/gand IEEE 802.11p outdoor deployments.
IEEE 802.11p and the IEEE 802.11b/g/n hotspot network we used in our exper-iments differ in terms of frequency (2.4GHz in our experiment versus 5.9GHz forIEEE 802.11p), channel bandwidth (20MHz in our experiment versus 10MHz for IEEE802.11p), and maximum transmission power [802 2010]. Nevertheless, both hotspotIEEE 802.11b/g/n deployments used in the evaluation of coper and IEEE 802.11pdeployments consist of a fixed set of roadside APs.
An evaluation of an experimental IEEE 802.11p network in a urban area is pre-sented in [Gozálvez 2012]. The study evaluates IEEE 802.11p RSUs in various urbanmobility settings (non LoS, bridges, elevation, trees, etc.). It shows that IEEE 802.11pcommunication capability is significantly reduced when the vehicle leaves the LoS ofthe AP. In strong Non Line-of-Sight (NLoS) conditions i.e., due to sharp curves orthe presence of buildings, connectivity is lost within a few meters of leaving the LoS.IEEE 802.11p communications are also very sensitive to variations in elevation and thepresence of vegetation or heavy vehicles. Despite these limitations, the authors showedthat IEEE 802.11p networks can provide reliable connectivity (packet delivery ratio> 0.7) to a mobile vehicle at distances ranging from a little under 100 m to a littlemore than 750 m. We can, thus, conclude that it is feasible to deploy city-wide IEEE802.11p networks that can provide good signal strength all along the route taken by agiven vehicle (or at least, a large part of it).
In this case, the results presented in [Gozálvez 2012] suggest that a scenario basedon a city-wide IEEE 802.11p network may lead to results that are comparable to thosehighlighted in the previous section. However, no definite conclusions can be drawn in

102 Chapter 5. Conclusion and perspectives
the absence of field tests.In addition, IEEE 802.11p differs from other IEEE 802.11 networks as it does not
define an association procedure between the MS and the AP. Furthermore, the IEEE802.11p WAVE extension [IEE 2011] and ITS G5 [ETSI 2010] permit the use of asecond radio dedicated to communication on the Service Channel (SCH) that can beused to scan nearby RSUs (amongst other things). This completely removes the impactof the handover on vehicular communications, which was one of the goals of coper.However, the scanning-based AP selection approach that is proposed in IEEE 802.11pis potentially inefficient (as shown here for IEEE 802.11 networks). As a result, copercould also be used with IEEE 802.11p networks in order to improve AP selection bytaking into account vehicular mobility.
5.2.1.2 Community networks
Residential and community networks provide households with Internet access and arecharacterized by their unsystematic deployment. However, the ever-growing number ofcommunity networks offers widespread coverage in urban and suburban environments,which could be used by coper. In this section we discuss the potential gains and theissues raised when using IEEE 802.11 community networks with coper.
Figure 5.1(a) shows some interesting results. First, RSS is more uniformly dis-tributed in the residential AP network than the HotCity network. Second, areas wherethe RSS is lowest (shown in orange) are wider for residential APs than for HotCityAPs. In general, HotCity APs provide higher RSS than residential APs (between -84 dBm and -50 dBm versus -88 dBm to -56.5 dBm). Nevertheless, we note that evenin some residential areas RSS is high(shown in green). This phenomenon occurs in themost populated areas (the large, inhabited buildings shown at top of the figure versusgreater numbers of individual houses in other areas). Finally, it is important to notethat both networks cover the entire experimental path.
Regarding AP selection, the high density of APs in community networks in certainareas implies that the AP selection process designed for lower-density networks must beadapted. In a context of high AP density, the trade-off between minimizing the numberof handovers, and maximizing their quality (studied in Chapter 3, Section 3.3.3) tendsto favor handover quantity (at the expense of quality). This is because the probabilityof having multiple APs with similar RSS is much higher than for hotspot networks.This phenomenon leads to situations where a given AP remains the best AP only in avery small area, forcing the MS to perform too-frequent handovers. Therefore, the bestAP should be defined as the AP that is able to provide good RSS over a sufficientlylong period, even if it does not always provide the highest RSS.
Unlike the IEEE 802.11 hotspot network studied in this thesis, or IEEE 802.11pnetworks, CNs do not provide mobility support. An MS must renew its IP configu-

5.2. Future work 103
(a) Residential APs’ highest RSS distribution
(b) HotCity APs’ highest RSS distribution
Figure 5.1: Hotspot and residential networks RSS in the experimental path
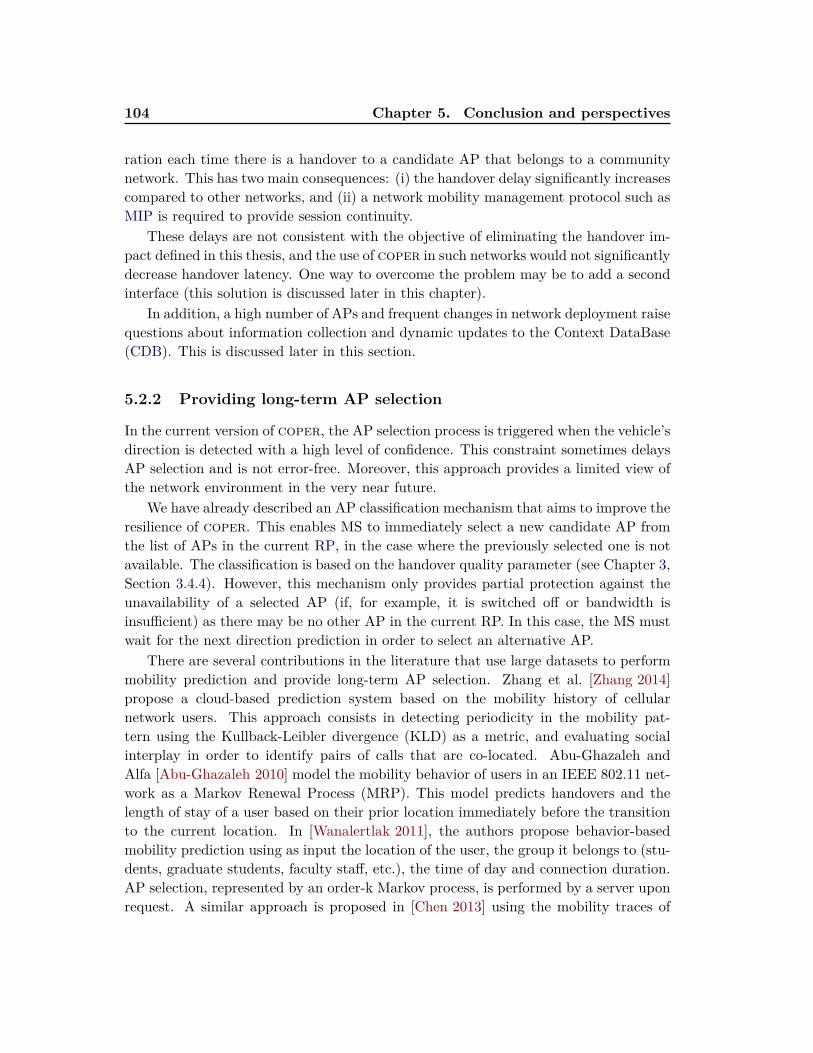
104 Chapter 5. Conclusion and perspectives
ration each time there is a handover to a candidate AP that belongs to a communitynetwork. This has two main consequences: (i) the handover delay significantly increasescompared to other networks, and (ii) a network mobility management protocol such asMIP is required to provide session continuity.
These delays are not consistent with the objective of eliminating the handover im-pact defined in this thesis, and the use of coper in such networks would not significantlydecrease handover latency. One way to overcome the problem may be to add a secondinterface (this solution is discussed later in this chapter).
In addition, a high number of APs and frequent changes in network deployment raisequestions about information collection and dynamic updates to the Context DataBase(CDB). This is discussed later in this section.
5.2.2 Providing long-term AP selection
In the current version of coper, the AP selection process is triggered when the vehicle’sdirection is detected with a high level of confidence. This constraint sometimes delaysAP selection and is not error-free. Moreover, this approach provides a limited view ofthe network environment in the very near future.
We have already described an AP classification mechanism that aims to improve theresilience of coper. This enables MS to immediately select a new candidate AP fromthe list of APs in the current RP, in the case where the previously selected one is notavailable. The classification is based on the handover quality parameter (see Chapter 3,Section 3.4.4). However, this mechanism only provides partial protection against theunavailability of a selected AP (if, for example, it is switched off or bandwidth isinsufficient) as there may be no other AP in the current RP. In this case, the MS mustwait for the next direction prediction in order to select an alternative AP.
There are several contributions in the literature that use large datasets to performmobility prediction and provide long-term AP selection. Zhang et al. [Zhang 2014]propose a cloud-based prediction system based on the mobility history of cellularnetwork users. This approach consists in detecting periodicity in the mobility pat-tern using the Kullback-Leibler divergence (KLD) as a metric, and evaluating socialinterplay in order to identify pairs of calls that are co-located. Abu-Ghazaleh andAlfa [Abu-Ghazaleh 2010] model the mobility behavior of users in an IEEE 802.11 net-work as a Markov Renewal Process (MRP). This model predicts handovers and thelength of stay of a user based on their prior location immediately before the transitionto the current location. In [Wanalertlak 2011], the authors propose behavior-basedmobility prediction using as input the location of the user, the group it belongs to (stu-dents, graduate students, faculty staff, etc.), the time of day and connection duration.AP selection, represented by an order-k Markov process, is performed by a server uponrequest. A similar approach is proposed in [Chen 2013] using the mobility traces of

5.2. Future work 105
16000 taxis to perform mobility prediction using an order-k Markov process.The proposed approaches need to be analyzed and compared in order to identify
which one provides the most accurate results. Beyond long-term mobility prediction,the AP selection can be improved by including other contextual information (discussedin next section).
5.2.3 Providing coper with dynamic network knowledge
5.2.3.1 Towards a collaborative approach
coper uses a Context DataBase (CDB) containing the modeled RSSs of potentialAPs. This knowledge reflects the RSS of the entire network coverage, but only takesinto account communication between the MS and the AP.
However, in the urban environment there are multiple temporary or permanentsources of interference that can alter the RSS of the MS. First, the 2.4GHz band isoften crowded due to the high density of APs in urban areas, as shown in Section 2.1.4.Next, the urban topology features many obstacles that can impact communicationbetween the MS and the AP. The results presented in [Gozálvez 2012] show that IEEE802.11p communications are significantly affected by loss of LoS and elevation (seeSection 5.2.1.1). This study also shows that many of the sources of interference arenot static. The two main dynamic sources cited by the author are vegetation (whichchanges according to the season) and heavy vehicles (depending on road traffic). Notethat communications in the 2.4GHz band are affected in the same way.
In addition, the presence of an AP in the CDB does not guarantee that this APcan actually be used by the MS. It could, for example, be switched off or overloadedand unable to provide sufficient bandwidth. In order to improve the AP selection ofcoper, the process should take into account changes in the network in question. Thisraises two challenges related to: (i) the collection of information, and (ii) the storageof this information in the CDB.
Information Frequency ofchange Durability How to get this
informationChange in
network topologyNew AP Not frequent Long term ISP & auto
detectionAP removal Mid / Long term
AP load / Bandwidth allocation Very frequent Short term IEEE 802.11k &RSVP
Dynamic sources Trees &Vegetation Not frequent Long term Model
of interferences Mobile obstacles Very frequent Short term /
Table 5.1: Dynamic information about APs

106 Chapter 5. Conclusion and perspectives
Collecting dynamic information The network information that can be usedby the MS, described in Table 5.1, should be categorized according to the way the MScan retrieve it. The first type of information is change in the network or road topologythat can be either positive (the implementation of a new AP or the construction of anew road), negative (the removal of an AP, or a road closure) or neutral (a change inAP configuration or modifications to a road). Such events are usually infrequent andlast for a long time, except in the case where an AP is temporary switched off (forinstance during construction work). Only the entity that maintains the network or theroad, i.e. the ISP or the municipality, are aware of these topology changes. However, itis possible for an MS to detect a new AP if it continues to scans, so longer as it not is amatter of AP selection, but of AP discovery (for instance when the interface is idle). Inthe same manner, AP removal can also be detected after a number of failed connectionsby different MSs, although this is not the case for road topology changes. The secondtype of information is AP load and the bandwidth allocated by it. Depending on thetime of day, this setting can vary widely, and frequently. This information can beretrieved from the AP itself using the IEEE 802.11k protocol, which provides a sitereport describing the use rate of nearby APs. Resource reSerVation Protocol (RSVP)can be used to allocate a given bandwidth to the selected AP before the transitionto ensure satisfactory QoS. Finally, the third type of information is dynamic sourcesof interferences (highlighted in [Gozálvez 2012]). Here, a distinction has to be madebetween the two main sources; vegetation and heavy mobile obstacles. In the firstcase, variation is often seasonal and thus predictable. As a result, it can be takeninto account while modeling the network. On the other hand, the impact of mobileobstacles is sudden and difficult to predict. It appears infeasible to collect and includesuch events in the CDB. Nevertheless, the probable occurrence of these events shouldbe taken into account by coper. The selection of the AP that provides the best signalis a way to mitigate the impact of such events, as the probability of communicationdisruption is higher if the signal is low. If the impact on the RSS is too high, and if theMS is multihomed, a resilience mechanism is needed to trigger a fast-switch to anotheraccess network.
Dynamic information storage The dynamic storage of information in a databasedoes not present any technical problem. However, modification of the network or roadtopology require the re-modeling of the RSS in the area in question. The requirementfor the MS to create a new model upon receipt of an update to the network or roadtopology adds a significant amount of complexity to coper. In addition, such a com-putation is not always feasible in an embedded device. Furthermore, allowing the MSto update the CDB would lead to a situation in which the CDB shared by several MSswould diverge depending on the information provided by each station. Finally, thecontent of the CDB would quickly become out-of-date.

5.2. Future work 107
Figure 5.2: Information exchange in the proposed IEEE 802.21-based solution
A collaborative approach could overcome this problem. Here, the aim is to improvethe knowledge of each MS individually by sharing knowledge with other MSs. Thiscollaboration is possible for all dynamic information that varies over the long term(network topology changes and seasonal changes in RSS). Short-term changes, such asAP load cannot be shared by MSs as it very quickly becomes out-of-date. Collaborationbetween MSs implies a that there is a place to share all of the information that hasbeen gathered. Cloud computing technology could provide such a shared space. coperwould, then, turn into an Mobile CrowdSourcing (MCS) application [Ganti 2011]. Inaddition to updating the CDB, the information provided by MSs to the cloud could beused to evaluate changes in the network in order, for instance, to detect faulty APs, orfor studies of user behavior based on data-mining techniques. Cloud-based technologieswould also allow coper to be used on a larger scale, as it would not be possible tostore a CDB that gathers information related to a very wide area on a mobile device.Nevertheless, even if only the master version of the CDB is stored in the cloud, thisraises new challenges with regard to the retrieval of a partial dataset. Therefore, theCDB structure should allow the MS to extract only the information it requires, whichis limited to an area around a given location.
5.2.3.2 Using the standard IEEE 802.21 structure
In this section, we discuss the potential modification of the IEEE 802.21 MIH standardin order to integrate coper. The IEEE 802.21 standard defines a data structureand different types of communication (event, information and control) between IEEE802.21-enabled elements. It also describes an MIIS server that gathers and diffuses, on

108 Chapter 5. Conclusion and perspectives
Figure 5.3: Scenario 1: Externalization of COPER
demand, useful network information.A schme of the information exchange in the proposed solution is depicted in Fig-
ure 5.2. Consistent with the solutions already presented, we consider a wide-scalescenario where the CDB is too large to be stored locally. In addition, it is frequentlyupdated with dynamic information. coper could be integrated into this structure bystoring the CDB in the MIIS server and/ or another coper module. The MIIS prim-itives are used to feed the CDB through: (i) a scanning report sent by the MS thatprovides updates of the RSS along the route taken by the vehicle; and (ii) samples ofthe CDB that are sent to the MS depending on their location, as shown in Figure 5.3.As mentioned earlier, scanning is not used for AP selection, but in order to provide ac-curate information to the CDB. In order to avoid any impact on MS communications,scanning could made be passive while the MS is in use and active otherwise. Note thatif APs are IEEE 802.21-enabled, they could provide real-time dynamic informationabout load and available bandwidth to the CDB.
Three coper integration scenarios can be envisaged: (i) both coper and the CDBare located in the MIIS server (see Figure 5.3); (ii) the ASM module and the CDB arelocated in the MIIS server (see Figure 5.4); and (iii) only the CDB is located in theMIIS server.
In the first case, direction detection and AP selection are performed by the MIISserver. The MS continuously sends GPS location updates to the MIIS server, whichprocesses the trajectory of the vehicle and selects APs accordingly. When the vehiclereaches a handover location, the MIIS server sends a handover command to the MS, asshown in Figure 5.3. Such a solution is suitable if the MS is a very lightweight terminal,as no computation is required.
In the second case, only AP selection is performed by the MIIS server. In this case
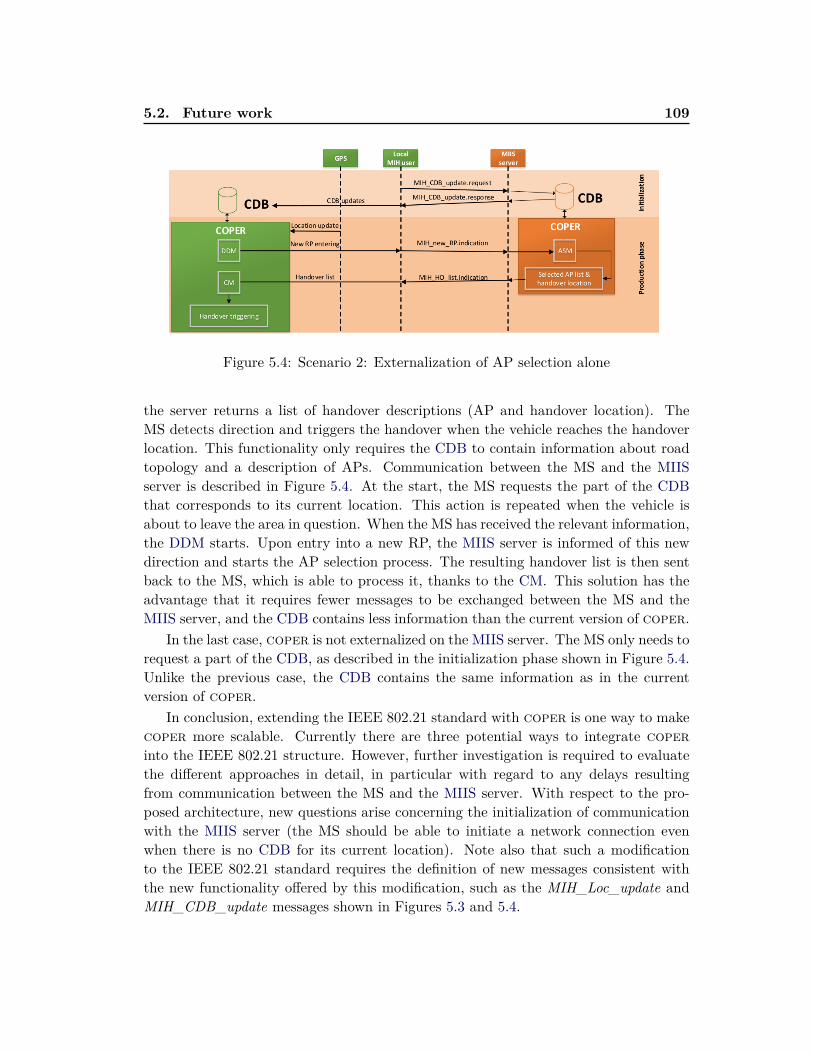
5.2. Future work 109
Figure 5.4: Scenario 2: Externalization of AP selection alone
the server returns a list of handover descriptions (AP and handover location). TheMS detects direction and triggers the handover when the vehicle reaches the handoverlocation. This functionality only requires the CDB to contain information about roadtopology and a description of APs. Communication between the MS and the MIISserver is described in Figure 5.4. At the start, the MS requests the part of the CDBthat corresponds to its current location. This action is repeated when the vehicle isabout to leave the area in question. When the MS has received the relevant information,the DDM starts. Upon entry into a new RP, the MIIS server is informed of this newdirection and starts the AP selection process. The resulting handover list is then sentback to the MS, which is able to process it, thanks to the CM. This solution has theadvantage that it requires fewer messages to be exchanged between the MS and theMIIS server, and the CDB contains less information than the current version of coper.
In the last case, coper is not externalized on the MIIS server. The MS only needs torequest a part of the CDB, as described in the initialization phase shown in Figure 5.4.Unlike the previous case, the CDB contains the same information as in the currentversion of coper.
In conclusion, extending the IEEE 802.21 standard with coper is one way to makecoper more scalable. Currently there are three potential ways to integrate coperinto the IEEE 802.21 structure. However, further investigation is required to evaluatethe different approaches in detail, in particular with regard to any delays resultingfrom communication between the MS and the MIIS server. With respect to the pro-posed architecture, new questions arise concerning the initialization of communicationwith the MIIS server (the MS should be able to initiate a network connection evenwhen there is no CDB for its current location). Note also that such a modificationto the IEEE 802.21 standard requires the definition of new messages consistent withthe new functionality offered by this modification, such as the MIH_Loc_update andMIH_CDB_update messages shown in Figures 5.3 and 5.4.

110 Chapter 5. Conclusion and perspectives
5.2.4 Using COPER with a second interface
In Chapter 3, Section 3.2 we described a make-before-break approach where the MSuses a second interface to perform the handover to a candidate AP before disconnectingwith the current AP. In Chapter 4, Section 4.3 we showed that such a solution, despitethe fact that it uses scanning-based AP selection, could potentially remove handoverlatency, even if the handover was also performed at Layer-3 (L3) (IP configurationrenewal using the DHCP protocol). On the other hand, in the current version of coperthere is still a short disconnection when the MS hands off to the selected AP (medianvalue of 100ms). Using coper in an encrypted network will create (incompressible)longer disconnections due to encryption key renegotiation that can only be reduced (butnot eliminated) by the use of IEEE 802.11r. Therefore, using coper with a secondinterface is an easy way to meet the first objective.
Furthermore, in a multipath scenario (as described in Chapter 2, Section 2.1.3), asecond interface allows the MS to be connected to two APs at the same time (exceptduring handovers) leading to an increase in send/ receive throughput.
5.3 Perspectives
In recent years, the emergence of a multitude of new wireless communication standardssuch as IEEE 802.11ac/ad/af/ah, in addition to the release of new frequency bands of-fers an opportunity to use a wider spectrum for wireless communication. The downsideof this is that each new standard requires a specific radio for each available technology.Cognitive radio mitigates this problem by using a new generation of large-spectrumradios in which link layers can be quickly reprogrammed. This technology also offersnew opportunities with respect to peer-to-peer communications as they can negotiatephysical and link layer parameters (e.g., channel, band size, encoding technique, mul-tiplexing mode) depending on network conditions. This technology can be used forInternet connection sharing, among other applications.
The expanding range of Internet access networks offers the potential for ubiquitousnetwork connection. Although this is a challenging objective, here we try to show thattechnical solutions exist that can efficiently provide seamless Internet connections tomobile users. However, they involve an information exchange between the MS and itsenvironment in order to allow the MS to anticipate future changes in the network. Inparticular, collaboration with ISPs is required in order to provide the MS with holisticknowledge of nearby networks. Like data roaming in cellular networks (which will betransparent and free in European countries from 2016), collaboration between ISPsand community networks must also be established in order to facilitate the transitionbetween APs that belong to different CNs. The purpose of this collaboration would beto standardize and simplify user credential management in order to reduce handover

5.3. Perspectives 111
latency. However, network handovers remain inevitable as each ISP must grant networkaccess to the MS.
This raises the possibility of the emergence of a new sort of service provider thataims to always provide the best connection, through the use of multiple simultaneousInternet access points (provided by legacy ISPs). Another possibility is that the always-best-connection would become an extra service provided by existing ISPs. In anycase, a cross-layer approach should be implemented in order to provide an always-best-connected service. With respect to layer-1 (L1), cognitive radio allows the dynamicselection of the spectrum according to needs in terms of coverage, bandwidth, andnearby networks. With respect to the L2, mobility is handled by protocols such asIEEE 802.21 MIH. The proposals put forward in this thesis are part of this L2 mobilitymanagement framework. With respect to the upper layer, network mobility protocolsare used to guarantee session continuity, while session transfer and reachability areensured by application layer solutions.
One potential use case, that may be considered as a priority, is providing seamlessInternet access to emergency services such as ambulances, fire-fighters or the police.This would allow the exchange of critical information between personnel located atthe site of the intervention and others in a command center (e.g., a hospital or policeheadquarters). This would make it possible to evaluate the gravity of the situation,prepare the materials necessary for a quick intervention, or provide advice to personnelin the field. Although this use case seems realistic in urban areas, emergency vehiclesintervene in all parts of a country. In areas with a very sparse population, the qualityof networks providing Internet access can be poor, leading to potential white areas.In this case, data communication continuity may be provided by satellite networksand cognitive radio that enable long-range communication through specific frequencybands.


Bibliography
[802 2010] IEEE Standard for Information technology– Local and metropolitan areanetworks– Specific requirements– Part 11: Wireless LAN Medium Access Con-trol (MAC) and Physical Layer (PHY) Specifications Amendment 6: WirelessAccess in Vehicular Environments. IEEE Std 802.11p-2010, pages 1–51, July2010. (Cited on page 101.)
[Abu-Ghazaleh 2010] Haitham Abu-Ghazaleh and Attahiru Sule Alfa. Application ofmobility prediction in wireless networks using markov renewal theory. VehicularTechnology, IEEE Transactions on, vol. 59, no. 2, pages 788–802, 2010. (Citedon page 104.)
[Addepalli 2013] Sateesh Addepalli, Henning G Schulzrinne, Amandeep Singh and Gas-ton Ormazabal. Heterogeneous Access: Survey and Design Considerations. 2013.(Cited on page 16.)
[Aguayo 2004] Daniel Aguayo, John Bicket, Sanjit Biswas, Glenn Judd and RobertMorris. Link-level measurements from an 802.11 b mesh network. In ACM SIG-COMM Computer Communication Review, volume 34, pages 121–132. ACM,2004. (Cited on pages 21, 35 and 59.)
[Annese 2011] Stefano Annese, Claudio Casetti, C Chiasserini, Nazario Di Maio, An-drea Ghittino and Massimo Reineri. Seamless connectivity and routing in ve-hicular networks with infrastructure. Selected Areas in Communications, IEEEJournal on, vol. 29, no. 3, pages 501–514, 2011. (Cited on pages 3 and 32.)
[Arcia-Moret 2014] A Arcia-Moret, L. Molina, N. Montavont, G. Castignani andA Blanc. Access Point Discovery in 802.11 Networks. In Network Games,Control and Optimization (NetGCooP), 2012 6th International Conference on,Nov 2014. (Cited on page 34.)
[Balasubramanian 2010] Aruna Balasubramanian, Ratul Mahajan and ArunVenkataramani. Augmenting mobile 3G using WiFi. In Proceedings ofthe 8th international conference on Mobile systems, applications, and services,pages 209–222. ACM, 2010. (Cited on pages 15, 16 and 24.)
[Bangolae 2006] Sangeetha Bangolae, Carol Bell and Emily Qi. Performance Studyof Fast BSS Transition Using IEEE 802.11R. In Proceedings of the 2006 In-ternational Conference on Wireless Communications and Mobile Computing,IWCMC ’06, pages 737–742, New York, NY, USA, 2006. ACM. (Cited onpage 36.)
114 Bibliography
[Berezin 2011] Maria Eugenia Berezin, Franck Rousseau and Andrzej Duda. Multi-channel virtual access points for seamless handoffs in IEEE 802.11 wirelessnetworks. In Vehicular Technology Conference (VTC Spring), 2011 IEEE 73rd,pages 1–5. IEEE, 2011. (Cited on page 34.)
[Biswas 2006] Subir Biswas, Raymond Tatchikou and Francois Dion. Vehicle-to-vehiclewireless communication protocols for enhancing highway traffic safety. Commu-nications Magazine, IEEE, vol. 44, no. 1, pages 74–82, 2006. (Cited on page 9.)
[Brik 2005] Vladimir Brik, Arunesh Mishra and Suman Banerjee. Eliminating handofflatencies in 802.11 WLANs using multiple radios: Applications, experience, andevaluation. In Proceedings of the 5th ACM SIGCOMM conference on InternetMeasurement, pages 27–27. USENIX Association, 2005. (Cited on pages 3and 32.)
[Bychkovsky 2006] Vladimir Bychkovsky, Bret Hull, Allen Miu, Hari Balakrishnan andSamuel Madden. A measurement study of vehicular internet access using in situWi-Fi networks. In Proceedings of the 12th annual international conference onMobile computing and networking, pages 50–61. ACM, 2006. (Cited on pages 19,20, 22, 24, 25 and 26.)
[Castignani 2011a] G. Castignani, A. Arcia and N. Montavont. A Study of the Dis-covery Process in 802.11 Networks. ACM SIGMOBILE Mobile Computing andCommunications Review, vol. 15, no. 1, pages 25–36, 2011. (Cited on pages 21,28, 31, 33 and 44.)
[Castignani 2011b] German Castignani, Lucien Loiseau and Nicolas Montavont. Anevaluation of IEEE 802.11 community networks deployments. In InformationNetworking (ICOIN), 2011 International Conference on, pages 498–503. IEEE,2011. (Cited on pages 19, 20, 21, 29 and 76.)
[Castignani 2012a] G. Castignani, A. Blanc, A. Lampropulos and N. Montavont. Ur-ban 802.11 Community Networks for Mobile Users: Current Deployments andProspectives. Mobile Networks and Applications, pages 1–12, 2012. (Cited onpages 1, 21, 24, 25, 44, 59, 77 and 86.)
[Castignani 2012b] G. Castignani, A. Lampropulos, A. Blanc and N. Montavont.Wi2Me: A Mobile Sensing Platform for Wireless Heterogeneous Networks. InDistributed Computing Systems Workshops (ICDCSW), 2012 32nd Interna-tional Conference on, pages 108–113, June 2012. (Cited on pages 34 and 76.)
[Castignani 2013] German Castignani, Juan Monetti, Nicolas Montavont, AndrésArcia-Moret, Raphaël Frank and Thomas Engel. A study of urban IEEE 802.11

Bibliography 115
hotspot networks: towards a community access network. In Wireless Days (WD),2013 IFIP, pages 1–8. IEEE, 2013. (Cited on pages 20, 22, 23, 24 and 45.)
[Chen 2013] Siyu Chen, Yong Li, Wenyu Ren, Depeng Jin and Pan Hui. Locationprediction for large scale urban vehicular mobility. In Wireless Communicationsand Mobile Computing Conference (IWCMC), 2013 9th International, pages1733–1737. IEEE, 2013. (Cited on page 104.)
[Deb 2001] Kalyanmoy Deb and Deb Kalyanmoy. Multi-Objective Optimization UsingEvolutionary Algorithms. Wiley, 1st édition, June 2001. (Cited on page 60.)
[Deshpande 2009] Pralhad Deshpande, Anand Kashyap, Chul Sung and Samir R. Das.Predictive Methods for Improved Vehicular WiFi Access. In Proceedings ofthe 7th international conference on mobile systems, applications, and services,MobiSys ’09, pages 263–276, New York, NY, USA, 2009. ACM. (Cited onpages 35 and 54.)
[Deshpande 2010] Pralhad Deshpande, Xiaoxiao Hou and Samir R Das. Performancecomparison of 3G and metro-scale WiFi for vehicular network access. In Pro-ceedings of the 10th ACM SIGCOMM conference on Internet measurement,pages 301–307. ACM, 2010. (Cited on pages 22, 24 and 44.)
[DLR ] DLR. Simulation of Urban MObility, [online] Available.http://sumo.sourceforge.net/. (Cited on page 55.)
[Eriksson 2008] Jakob Eriksson, Hari Balakrishnan and Samuel Madden. Cabernet:vehicular content delivery using WiFi. In Proceedings of the 14th ACM inter-national conference on Mobile computing and networking, pages 199–210. ACM,2008. (Cited on pages 20, 24, 25, 26, 29 and 76.)
[ETSI 2004] EN ETSI. EN 300 674-1: Electromagnetic compatibility and Radio spec-trum Matters (ERM); Road Transport and Traffic Telematics (RTTT); Dedi-cated Short Range Communication (DSRC) transmission equipment (500 kbit/s/ 250 kbit/s) operating in the 5,8 GHz Industrial, Scientific and Medical (ISM)band; Part 1: General characteristics and test methods for Road Side Units(RSU) and On-Board Units (OBU). Rapport technique, Tech. Rep, 2004. (Citedon page 12.)
[ETSI 2010] EN ETSI. 302 663: Draft V1. 3.2, ITS; Access Layer Specification forIntelligent Transport Systems operating in the 5 GHz frequency band. Rapporttechnique, Tech. Rep, 2010. (Cited on page 102.)

116 Bibliography
[Farshad 2014] Arsham Farshad, Mahesh K Marina and Francisco Garcia. Urban WiFicharacterization via mobile crowdsensing. In Network Operations and Man-agement Symposium (NOMS), 2014 IEEE, pages 1–9. IEEE, 2014. (Cited onpages 1, 19, 20, 21 and 29.)
[FCC 2014] FCC. 15.407 General technical requirements., [online] Avail-able. http://www.hallikainen.org/FCC/FccRules/2013/15/407/section.pdf,2014. (Cited on page 45.)
[Ganti 2011] Raghu K Ganti, Fan Ye and Hui Lei. Mobile crowdsensing: current stateand future challenges. Communications Magazine, IEEE, vol. 49, no. 11, pages32–39, 2011. (Cited on page 107.)
[Garelli 2011] Laura Garelli, Claudio Casetti, C Chiasserini and Marco Fiore. Mob-sampling: V2V communications for traffic density estimation. In VehicularTechnology Conference (VTC Spring), 2011 IEEE 73rd, pages 1–5. IEEE, 2011.(Cited on page 9.)
[Gass 2005] Richard Gass, James Scott and Christophe Diot. Measurements of in-motion 802.11 networking. In Mobile Computing Systems and Applications,2006. WMCSA’06. Proceedings. 7th IEEE Workshop on, pages 69–74. IEEE,2005. (Cited on pages 12 and 22.)
[Gerla 2011] Mario Gerla and Leonard Kleinrock. Vehicular networks and the futureof the mobile internet. Computer Networks, vol. 55, no. 2, pages 457–469, 2011.(Cited on pages 1, 8 and 9.)
[Giordano 2010a] E. Giordano, E. De Sena, Giovanni Pau and M. Gerla. VERGILIUS:A Scenario Generator for VANET. In Vehicular Technology Conference (VTC2010-Spring), 2010 IEEE 71st, pages 1–5, 2010. (Cited on pages 55 and 65.)
[Giordano 2010b] Eugenio Giordano, Raphael Frank, Giovanni Pau and Mario Gerla.CORNER: a realistic urban propagation model for VANET. In Wireless On-demand Network Systems and Services (WONS), 2010 Seventh InternationalConference on, pages 57–60. IEEE, 2010. (Cited on pages 20, 29, 55 and 76.)
[González 2008] Víctor González, Alberto Los Santos, Carolina Pinart and FranciscoMilagro. Experimental demonstration of the viability of IEEE 802.11 b basedinter-vehicle communications. In Proceedings of the 4th International Confer-ence on Testbeds and research infrastructures for the development of networks &communities, page 1. ICST (Institute for Computer Sciences, Social-Informaticsand Telecommunications Engineering), 2008. (Cited on page 13.)
Bibliography 117
[Gozálvez 2012] Javier Gozálvez, Miguel Sepulcre and Ramon Bauza. IEEE 802.11 pvehicle to infrastructure communications in urban environments. Communica-tions Magazine, IEEE, vol. 50, no. 5, pages 176–183, 2012. (Cited on pages 101,105 and 106.)
[Grunenberger 2010] Yan Grunenberger and Franck Rousseau. Virtual access pointsfor transparent mobility in wireless LANs. In Wireless Communications andNetworking Conference (WCNC), 2010 IEEE, pages 1–6. IEEE, 2010. (Citedon page 34.)
[Gustafsson 2003] Eva Gustafsson and Annika Jonsson. Always best connected. Wire-less Communications, IEEE, vol. 10, no. 1, pages 49–55, 2003. (Cited on pages 2,45 and 99.)
[Hadaller 2007] David Hadaller, Srinivasan Keshav, Tim Brecht and Shubham Agar-wal. Vehicular opportunistic communication under the microscope. In Proceed-ings of the 5th international conference on Mobile systems, applications andservices, pages 206–219. ACM, 2007. (Cited on pages 18 and 22.)
[Handley 2013] M Handley, O Bonaventure and U catholique de Louvain. InternetEngineering Task Force (IETF) A. Ford Request for Comments: 6824 CiscoCategory: Experimental C. Raiciu. 2013. (Cited on page 16.)
[Holma 2011] Harri Holma and Antti Toskala. Lte for umts: Evolution to lte-advanced.John Wiley & Sons, 2011. (Cited on page 13.)
[IEE 2011] IEEE Standard for Wireless Access in Vehicular Environments (WAVE)–Multi-channel Operation. IEEE Std 1609.4-2010 (Revision of IEEE Std 1609.4-2006), pages 1–89, Feb 2011. (Cited on page 102.)
[Intelligence 2014] GSMA Intelligence. Measuring mobile penetration, [online]Available. https://gsmaintelligence.com/analysis/2014/05/measuring-mobile-penetration/430/, 2014. (Cited on page 10.)
[Ivov 2005] Emil Ivov and Thomas Noel. Soft Handovers over 802.11 b with MultipleInterfaces. In Proceedings of the 2nd International Symposium on WirelessCommunication Systems (ISWCS’05), pages 549–554, 2005. (Cited on page 32.)
[Kassar 2008] Meriem Kassar, Brigitte Kervella and Guy Pujolle. An overview of ver-tical handover decision strategies in heterogeneous wireless networks. ComputerCommunications, vol. 31, no. 10, pages 2607–2620, 2008. (Cited on page 40.)
[Khan 2012a] Muhammad Qasim Khan and Steinar Hidle Andresen. Poa selection in802.11 networks using media independent information server (miis). In Ad-vanced Information Networking and Applications Workshops (WAINA), 2012

118 Bibliography
26th International Conference on, pages 454–459. IEEE, 2012. (Cited onpage 34.)
[Khan 2012b] Muhammad Qasim Khan and Steinar Hidle Andresen. Zero scanningtime for 802.11 networks by using media independent information server (miis).In Advanced Information Networking and Applications (AINA), 2012 IEEE 26thInternational Conference on, pages 467–473. IEEE, 2012. (Cited on pages 33and 34.)
[Kwak 2009] Daehan Kwak, Jeonghoon Mo and Moonsoo Kang. Investigation of hand-offs for IEEE 802.11 networks in vehicular environment. In Ubiquitous andFuture Networks, 2009. ICUFN 2009. First International Conference on, pages89–94, June 2009. (Cited on page 35.)
[Liao 2006] Yong Liao and Lixin Gao. Practical schemes for smooth MAC layer handoffin 802.11 wireless networks. In Proceedings of the 2006 International Sympo-sium on on World of Wireless, Mobile and Multimedia Networks, pages 181–190.IEEE Computer Society, 2006. (Cited on pages 29, 30 and 82.)
[Mahajan 2007] Ratul Mahajan, John Zahorjan and Brian Zill. Understanding WiFi-based connectivity from moving vehicles. In Proceedings of the 7th ACM SIG-COMM conference on Internet measurement, pages 321–326. ACM, 2007. (Citedon page 62.)
[Media 2014] Informa Telecoms & Media. Understanding today’s smartphoneuser: An updated and expanded analysis of data-usage patterns insix of the world’s most advanced 4G LTE markets, [online] Avail-able. http://www.informatandm.com/wp-content/uploads/2013/06/Mobidia-ITM-June-2013.pdf, 2014. (Cited on page 40.)
[Melia 2007] Telemaco Melia, Antonio de la Oliva, Ignacio Soto, Pablo Serrano andR Aguiar. Network controlled handovers: challenges and possibilities. Wire-less Personal Communications, vol. 43, no. 3, pages 959–974, 2007. (Cited onpage 40.)
[Mhatre 2006] Vivek Mhatre and Konstantina Papagiannaki. Using Smart Triggersfor Improved User Performance in 802.11 Wireless Networks. In Proceedings ofthe 4th international conference on Mobile systems, applications and services,pages 246–259. ACM, 2006. (Cited on pages 21, 33, 35, 37 and 59.)
[Mishra 2004] Arunesh Mishra, Minho Shin and WA Arbaush. Context caching usingneighbor graphs for fast handoffs in a wireless network. In INFOCOM 2004.Twenty-third AnnualJoint Conference of the IEEE Computer and Communica-tions Societies, volume 1. IEEE, 2004. (Cited on pages 28, 36 and 44.)
Bibliography 119
[Montavont 2005] J. Montavont, N. Montavont and T. Noel. Enhanced Schemes forL2 Handover in IEEE 802.11 Networks and Their Evaluations. In IEEE 16thInternational Symposium on Personal, Indoor and Mobile Radio Communica-tions, 2005. PIMRC 2005., volume 3, pages 1429–1434. IEEE, 2005. (Cited onpages 29 and 33.)
[Montavont 2006] J. Montavont and T. Noel. IEEE 802.11 Handovers Assisted by GPSInformation. In Wireless and Mobile Computing, Networking and Communica-tions, 2006. (WiMob’2006). IEEE International Conference on, pages 166–172,June 2006. (Cited on page 35.)
[Mota 2013] Vinicius FS Mota, Daniel F Macedo, Yacine Ghamri-Doudane and JoséMarcos S Nogueira. On the feasibility of WiFi offloading in urban areas: TheParis case study. In Wireless Days (WD), 2013 IFIP, pages 1–6. IEEE, 2013.(Cited on pages v, 18, 19, 20 and 45.)
[Mouton 2013a] Maximilien Mouton, German Castignani, Raphael Frank, Lara Codecaand Thomas Engel. On the Evaluation of Make-Before-Break Handovers inUrban WiFi Networks for Moving Vehicles. In Proceedings of IEEE WONS2013 10th International Conference on Wireless On-demand Network Systemsand Services, 2013, 2013. (Cited on page 4.)
[Mouton 2013b] Maximilien Mouton, German Castignani, Raphaël Frank and ThomasEngel. MROAD: Scanning-free model-based roaming for 802.11 networks undervehicular mobility. In Wireless Days (WD), 2013 IFIP, pages 1–8. IEEE, 2013.(Cited on page 4.)
[Mouton 2015] M Mouton, G Castignani, R Frank and T Engel. Enabling vehicularmobility in city-wide IEEE 802.11 networks through predictive handovers. Ve-hicular Communications, vol. 2, no. 2, pages 59–69, 2015. (Cited on page 4.)
[Nachtigall 2008] Jens Nachtigall, Anatolij Zubow and J-P Redlich. The impact of ad-jacent channel interference in multi-radio systems using ieee 802.11. In WirelessCommunications and Mobile Computing Conference, 2008. IWCMC’08. Inter-national, pages 874–881. IEEE, 2008. (Cited on page 78.)
[Nadeem 2004] Tamer Nadeem, Sasan Dashtinezhad, Chunyuan Liao and Liviu Iftode.TrafficView: traffic data dissemination using car-to-car communication. ACMSIGMOBILE Mobile Computing and Communications Review, vol. 8, no. 3,pages 6–19, 2004. (Cited on page 9.)
[Nandan 2005] Alok Nandan, Shirshanka Das, Giovanni Pau, Mario Gerla andMY Sanadidi. Co-operative downloading in vehicular ad-hoc wireless networks.

120 Bibliography
In Wireless On-demand Network Systems and Services, 2005. WONS 2005. Sec-ond Annual Conference on, pages 32–41. IEEE, 2005. (Cited on page 9.)
[Narten 2007] Thomas Narten, Susan Thomson and Tatuya Jinmei. IPv6 statelessaddress autoconfiguration. 2007. (Cited on page 26.)
[Networks ] Scalable Networks. Qualnet Network Simulator, [online] Available.http://www.scalable-networks.com. (Cited on page 55.)
[Niculescu 2007] Dragoş Niculescu. Interference map for 802.11 networks. In Proceed-ings of the 7th ACM SIGCOMM conference on Internet measurement, pages339–350. ACM, 2007. (Cited on page 21.)
[Ott 2004] Jörg Ott and Dirk Kutscher. Drive-thru Internet: IEEE 802.11 b for"automobile" users. In INFOCOM 2004. Twenty-third AnnualJoint Conferenceof the IEEE Computer and Communications Societies, volume 1. IEEE, 2004.(Cited on pages 13, 18 and 22.)
[Pack 2005] Sangheon Pack, Hakyung Jung, Taekyoung Kwon and Yanghee Choi. Snc:a selective neighbor caching scheme for fast handoff in ieee 802.11 wireless net-works. ACM SIGMOBILE Mobile Computing and Communications Review,vol. 9, no. 4, pages 39–49, 2005. (Cited on page 36.)
[Park 2004] Sang-Hee Park, Hye-Soo Kim, Chun-Su Park, Jae-Won Kim and Sung-JeaKo. Selective channel scanning for fast handoff in wireless LAN using neighborgraph. In Personal Wireless Communications, pages 194–203. Springer, 2004.(Cited on pages 28 and 44.)
[Ramachandran 2006] Kishore Ramachandran, Sampath Rangarajan and John C Lin.Make-before-break MAC layer handoff in 802.11 wireless networks. In Commu-nications, 2006. ICC’06. IEEE International Conference on, volume 10, pages4818–4823. IEEE, 2006. (Cited on pages 3, 32 and 46.)
[Ramani 2005] Ishwar Ramani and Stefan Savage. SyncScan: practical fast handofffor 802.11 infrastructure networks. In INFOCOM 2005. 24th Annual JointConference of the IEEE Computer and Communications Societies. ProceedingsIEEE, volume 1, pages 675–684. IEEE, 2005. (Cited on page 30.)
[Robinson 2005] Joshua Robinson, Konstantina Papagiannaki, Christophe Diot, Xin-gang Guo and Lakshman Krishnamurthy. Experimenting with a multi-radiomesh networking testbed. In Proc. of WinMee, volume 5, 2005. (Cited onpage 78.)
Bibliography 121
[Sadiq 2012] Ali Safa Sadiq, Kamalrulnizam Abu Bakar, Kayhan Zrar Ghafoor, JaimeLloret and SeyedAli Mirjalili. A smart handover prediction system based oncurve fitting model for fast mobile ipv6 in wireless networks. International Jour-nal of Communication Systems, 2012. (Cited on page 33.)
[Shin 2004] Sangho Shin, Andrea G Forte, Anshuman Singh Rawat and HenningSchulzrinne. Reducing MAC layer handoff latency in IEEE 802.11 wirelessLANs. In Proceedings of the second international workshop on Mobility manage-ment & wireless access protocols, pages 19–26. ACM, 2004. (Cited on page 29.)
[Soroush 2012] Hamed Soroush, Nilanjan Banerjee, Mark Corner, Brian Levine andBrian Lynn. A retrospective look at the UMass DOME mobile testbed. ACMSIGMOBILE Mobile Computing and Communications Review, vol. 15, no. 4,pages 2–15, 2012. (Cited on page 24.)
[Strobel 2013] Otto Strobel and IGI Global. Communication in transportation systems.Information Science Reference, 2013. (Cited on page 13.)
[Sun 2014] Weiping Sun, Okhwan Lee, Yeonchul Shin, Seongwon Kim, ChangmokYang, Hyoil Kim and Sunghyun Choi. Wi-Fi could be much more. Communica-tions Magazine, IEEE, vol. 52, no. 11, pages 22–29, 2014. (Cited on page 13.)
[Taleb 2010] Tarik Taleb, Abderrahim Benslimane and Khaled Ben Letaief. Toward aneffective risk-conscious and collaborative vehicular collision avoidance system.Vehicular Technology, IEEE Transactions on, vol. 59, no. 3, pages 1474–1486,2010. (Cited on page 9.)
[Teng 2009] Jin Teng, Changqing Xu, Weijia Jia and Dong Xuan. D-scan: Enablingfast and smooth handoffs in ap-dense 802.11 wireless networks. In INFOCOM2009, IEEE, pages 2616–2620. IEEE, 2009. (Cited on pages 28 and 44.)
[Velayos 2004] Héctor Velayos and Gunnar Karlsson. Techniques to reduce the IEEE802.11 b handoff time. In Communications, 2004 IEEE International Conferenceon, volume 7, pages 3844–3848. IEEE, 2004. (Cited on pages 28, 31 and 44.)
[Villegas 2007] Eduard Garcia Villegas, Elena Lopez-Aguilera, Rafael Vidal and JosepParadells. Effect of adjacent-channel interference in IEEE 802.11 WLANs.In Cognitive Radio Oriented Wireless Networks and Communications, 2007.CrownCom 2007. 2nd International Conference on, pages 118–125. IEEE, 2007.(Cited on page 21.)
[Wanalertlak 2011] Weetit Wanalertlak, Ben Lee, Chansu Yu, Myungchul Kim, Seung-Min Park and Won-Tae Kim. Behavior-based mobility prediction for seamless

122 Bibliography
handoffs in mobile wireless networks. Wireless networks, vol. 17, no. 3, pages645–658, 2011. (Cited on page 104.)
[Watkins 2012] Watkins. Strategy Analytics: A Quarter of HouseholdsWorldwide Now Have Wireless Home Networks, [online] Available.http://www.businesswire.com/news/home/20120404006331/en/Strategy-Analytics-Quarter-Households-Worldwide-Wireless-Home, 2012. (Cited onpages 11 and 15.)
[Zhang 2008] Jiansong Zhang, Kun Tan, Jun Zhao, Haitao Wu and Yongguang Zhang.A practical SNR-guided rate adaptation. In INFOCOM 2008. The 27th Confer-ence on Computer Communications. IEEE. IEEE, 2008. (Cited on page 21.)
[Zhang 2014] Daqiang Zhang, Min Chen, Mohsen Guizani and Haoyi Xiong. Mobilityprediction in telecom cloud using mobile calls. Wireless Communications, IEEE,vol. 21, no. 1, pages 26–32, 2014. (Cited on page 104.)

Bibliography 123
Acronyms
AC Access Controller
AES Advanced Encryption Standard
AP Access Point
ARP Address Resolution Protocol
ARPANET Advanced Research Projects Agency NETwork
ASM AP Selection Module
BATMAN Better Approach To Mobile Ad-hoc Networking
BBM Break-Before-Make
BSS Basic Service Set
BSSID Basic Service Set ID
CAN Controller Area Network
CCH Control Channel
CCK Complementary Code Keying
CDB Context DataBase
CDF Cumulative Distribution Function
CDMA Code Division Multiple Access
CM Connection Module
CN Community Network
CNo Correspondent Node
CTP Cabernet Transport Protocol
DAD Duplicate Address Detection
DARPA Defense Advanced Research Projects Agency
DCF Distributed Coordination Function
DDM Direction Detection Module

124 Bibliography
DHCP Dynamic Host Configuration Protocol
DIFS DCF Interframe Space
DMM Direction Detection Module
DNS Domain Name System
DSSS Direct-Sequence Spread Spectrum
EDGE Enhanced Data rates for GSM Evolution
ESSID Extended Service Set ID
EWMA Exponential Weighted Moving Average
FBSST Fast Basic Service Set Transition
FEC Forward Error Correction
FTD Fuzzy-based Turning Detector
GIR MIH Get Information Request
GPRS General Packet Radio Service
GSM Global System for Mobile communications
HA Home Agent
HIP Host Identity Protocol
HSPA High Speed Packet Access
HTTP Hypertext Transfer Protocol
HTTPS Hypertext Transfer Protocol Secure
IAPP Inter-Access Point Protocol
ICMP Internet Control Message Protocol
IP Internet Protocol
IPv6 Internet Protocol version 6
ISP Internet Service Provider
ITS Intelligent Transportation System
Bibliography 125
L2 Layer-2
L3 Layer-3
LAN Local Access Network
LGD MIH Link Going Down
LoS Line of Sight
LSE Least Squares Estimator
LTE Long Term Evolution
LTE-A Long Term Evolution Advanced
LWAPP Lightweight Access Point Protocol
MAC Medium Access Control
MAG Mobility Anchor Gateway
MANET Mobile Ad-Hoc NETwork
MaxCT Maximum Channel Time
MBB Make-Before-Break
MCS Mobile CrowdSourcing
MIH Media-Independent Handover
MICS Media Independent Command Service
MIES Media Independent Event Service
MIIS Media Independent Information Service
MIHF Media-Independent Handover Function
MIMO Multiple-Input and Multiple-Output
MinCT Minimum Channel Time
MIP Mobile IP
MIPv6 Mobile IPv6
MME Mobility Management Entity

126 Bibliography
MPTCP MultiPath TCP
MS Mobile Station
NEMO Network Mobility
ND Neighbor Discovery
NG Neighbor Graph
NLoS Non Line-of-Sight
OBU On-Board Unit
OFDM Orthogonal Frequency-Division Multiplexing
P2P Peer to Peer
PDR Packet Delivery Ratio
PER Packet Error Rate
PMIPv6 Proxy Mobile IPv6
PRNET Packet Radio NETwork
PSK Phase-Shift Keying
QAM Quadrature Amplitude Modulation
QoS Quality of Service
RADIUS Remote Authentication Dial-In User Service
RP Road Portion
RS Road Segment
RSRP Reference Symbols Received Power
RSS Received Signal Strength
RSU Road Side Unit
RSVP Resource reSerVation Protocol
SCH Service Channel
SDR Software-Defined Radio

Bibliography 127
SI Single Interface
SDM Spatial Division Multiplexing
SLAAC Stateless Address Autoconfiguration
SNR Signal-to-Noise Ratio
SSID Service Set ID
TCP Transmission Control Protocol
TDMA Time-Division Multiple-Access
UDP User Datagram Protocol
UMTS Universal Mobile Telecommunications System
V2I Vehicle-to-Infrastructure
V2V Vehicle-to-Vehicle
VANET Vehicle Ad-hoc NETwork
VAP Virtual Access Point
WAVE Wireless Access in Vehicular Environments
WLAN Wireless Local Area Network
xDSL Digital Subscriber Line


Optimization of handover procedure between IEEE 802.11 accesspoints under vehicular mobility in an urban environment.
Abstract: This thesis presents investigations performed on the IEEE802.11 handover process in order to optimize the exploitation of ex-isiting IEEE 802.11 networks in vehicular communications. As IEEE802.11 networks operate over a short range, a mobile station embeddedin a vehicle faces frequent handovers leading to long disconnections.This work focused on two objectives. The first was reducing the IEEE802.11 handover impact such that mobile users are allowed to be fullyconnected while they stay within the area covered by IEEE 802.11 net-works. The second was optimizing the AP selection process in orderto comply with the always best connected paradigm by identifying thebest access points and the best handover location. These researcheslead to the development of a context-based predictive handover mech-anism that considers vehicle’s trajectory, road topology, and networkdeployment information to decide the best handover location and can-didate access points.
Keywords: IEEE 802.11, vehicular communications, handover opti-mization, predictive handover, context-awareness, simulation, experi-mental evaluation