Dissertation Course Name Hylobates klossii ) in the ... · Vocal Diversity of The Kloss’s gibbon,...
59
Dissertation Course Name Title: Vocal diversity of the male Kloss’s gibbon (Hylobates klossii) in the Mentawai Islands, Indonesia Student Number 04055442 Surname: Waller Other Names: Melissa Susan Course for which acceptable: MSc Primate Conservation Date of Submission: 31 st October 2005 This dissertation is submitted in part fulfilment of the regulations for an MSc degree. Oxford Brookes University
Transcript of Dissertation Course Name Hylobates klossii ) in the ... · Vocal Diversity of The Kloss’s gibbon,...

Dissertation Course Name
Title: Vocal diversity of the male Kloss’s gibbon (Hylobates klossii) in the Mentawai
Islands, Indonesia
Student Number 04055442 Surname: Waller
Other Names: Melissa Susan
Course for which acceptable: MSc Primate Conservation
Date of Submission: 31st October 2005
This dissertation is submitted in part fulfilment of the regulations for an MSc degree.
Oxford Brookes University

ii
Statement of originality
Except for those parts in which it is explicitly stated to the contrary, this project is my
own work. It has not been submitted for any degree at this or any other academic or
professional institution.
……………………………………………. …………………
Signature Date
Regulations Governing the Deposit and Use of Oxford Brookes University Projects/
Dissertations
1. The “top” copies of projects/dissertations submitted in fulfilment of programme requirements shall normally be kept by the School.
2. The author shall sign a declaration agreeing that the project/ dissertation be available for reading and photocopying at the discretion of the Head of School in
accordance with 3 and 4 below.
3. The Head of School shall safeguard the interests of the author by requiring persons who consult the project/dissertation to sign a declaration acknowledging
the author’s copyright.
4. Permission for any one other then the author to reproduce or photocopy any part of the dissertation must be obtained from the Head of School who will give
his/her permission for such reproduction on to an extent which he/she considers
to be fair and reasonable.
I agree that this dissertation may be available for reading and photocopying at the
discretion of my Head of School in accordance with regulations 3 and 4 above.*
……………………………………………. …………………
Signature Date
*The underlined words may be deleted by the author if he/she so wishes.
iii
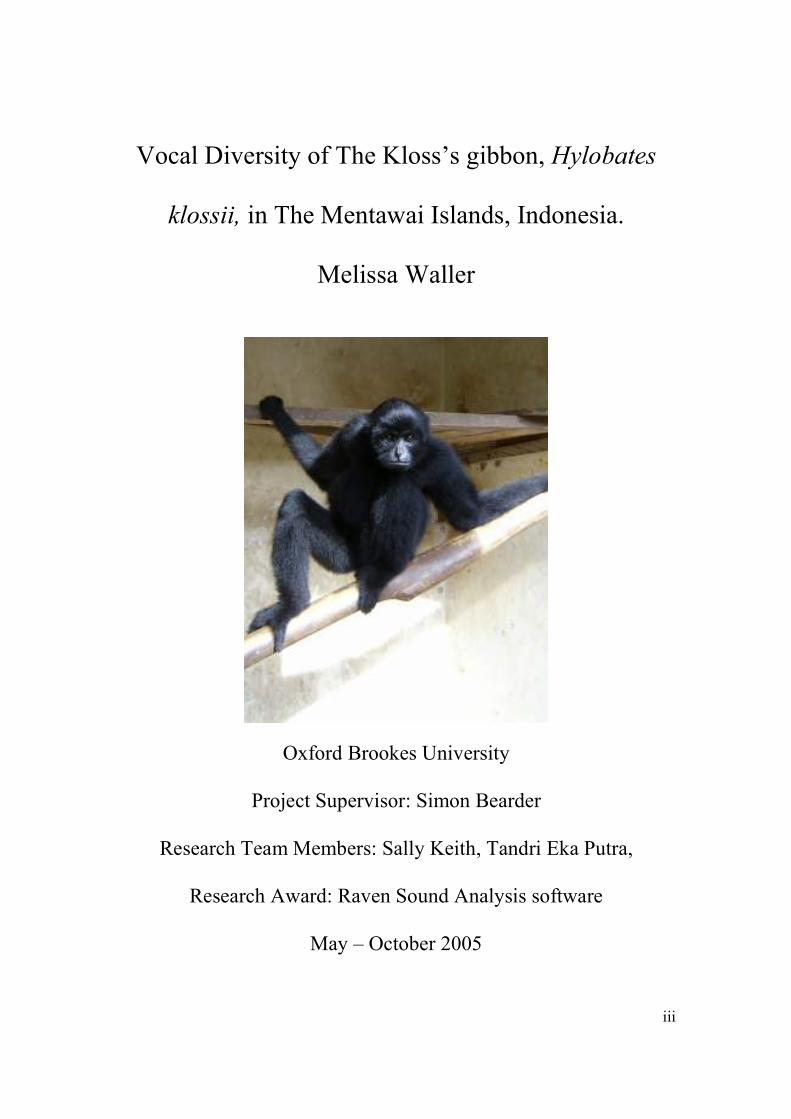
Vocal Diversity of The Kloss’s gibbon, Hylobates
klossii, in The Mentawai Islands, Indonesia.
Melissa Waller
Oxford Brookes University
Project Supervisor: Simon Bearder
Research Team Members: Sally Keith, Tandri Eka Putra,
Research Award: Raven Sound Analysis software
May – October 2005

iv
ABSTRACT
This is the first study to examine the vocal diversity of the male Kloss’s
gibbon (Hylobates klossii) endemic to the Mentawai Islands, Indonesia. The Kloss’s
gibbon is unusual because it is the only species that does not produce duets, with the
exception of the silvery gibbon (H. moloch). Three other species of monkey are endemic
to the islands and each has been classified into two subspecies; one on Siberut and the
second spread over the three southern islands. This is based on morphological and some
genetic differences, with the Siberut subspecies exhibiting a darker colouration. The
Kloss’s gibbon is completely black and exhibits no variation in pelt, so no subspeciation
has previously been demonstrated. However, studies on the silvery and crested gibbons
(Nomascus sp.) have shown that subspecies can be determined through examining vocal
variation. Therefore Kloss’s males were tape-recorded in four different locations;
Simabuggai and Sikabae on Siberut island, Sipora and South Pagai islands. A total of 244
trill phrases from 27 individuals were examined using sonographic analysis (Raven 2.1)
and non-parametric statistical tests (SPSS). The degree of variability was examined at the
following levels; intra-individual, intra-population, intra-island and inter-population.
Results from a Kruskal-Wallis one way ANOVA and post-hoc test indicated that the two
populations within Siberut are significantly different to one another and that they are both
significantly different to the Southern island populations, Sipora and South Pagai, which
are very similar to one another. It was an unexpected result to find that Siberut contains
two subspecies and this is most likely due to the prevention of dispersal by the numerous
rivers, mountains and forest fragmentation. This division into three distinct units is
supported by results from the discriminant function analysis; individuals can be classified
back into their correct populations with an accuracy of 92.6%. Therefore, on the basis of
male vocalisations it is concluded that the Kloss’s gibbon is composed of three
subspecies.

v
ACKNOWLEDGEMENTS
I am grateful to the Indonesian Institute of Sciences (LIPI) and the government of The
Republic of Indonesia for granting permission for this research.
Thank you to my dissertation supervisor Simon Bearder for all his advice, time and
support. Many thanks to Sally Keith for being an excellent co-researcher and for her
support throughout the various stages of this research and ability for humour even when it
seemed like the rain would never stop!
Thanks to the following people for advice in planning the research: Dr Thomas
Geissmann, Danielle Whittaker who answered our endless logistical questions, and to Jo
Buerling and the keepers at Twycross Zoo for assistance in the pilot study.
Thanks to Noviar Andayani of Universitas Indonesia, Dr Mansyurdin and all the staff and
students, in the biology department at Universitas Andalas, Deri and Riazaldi for their
translation skills in Padang, Taman Nasional Siberut, Pak Sahruhidin, PT Minas Lumber
Corporation, Kepala Desa of Saurineau, Reni at Conservation International for letting us
use her house and sampling her mothers wonderful cooking, and Koen Meyers of
UNESCO.
Special thanks to Tandri Eka Putra for all his help, guidance and humour in Indonesia and
also to the following people who helped in the field: Riki, Ogo, Pak Ajomar, Langot,
Baja, Al Hadi, Bohenson, Bisol, Albinus and Ibu Rijal.
A huge thank you to Matt for his statistical advice and to my mum, and David Bridge for
their reading and advising on the numerous drafts. This project would have impossible
without the support from my family and friends.
Thanks also to Tim and the Raven Awards team for a free Raven software licence.

vi
TABLE OF CONTENTS
TITLE PAGE I
ABSTRACT IV
ACKNOWLEDGEMENTS V
TABLE OF CONTENTS VI
LIST OF FIGURES VII
LIST OF TABLES VIII
1. INTRODUCTION 1-12
1.1 Research aims & objectives 1
1.2 Gibbon taxonomy & distribution 2
1.3 Gibbon behaviour & morphology 3
1.3.1 Gibbons 3
1.3.2 Kloss’s gibbon 4
1.4 Vocalisation research 5
1.4.1 Primates 5
1.4.2 Gibbons 5
1.4.3 Kloss’s gibbon 6
1.5 West Sumatra 8
1.6 Geological history & climate changes 9
1.7 Identifying subspecies of the Mentawai primates 10
1.8 Report Structure 12
2. METHODS 13-22
2.1 Pilot study 13
2.2 Complimentary research 13
2.3 Acoustic terms & definitions 14
2.4 Location of field sites in the Mentawai 14
2.5 Data collection 16
2.5.1 Data collection method 16

vii
2.5.2 Alterations to data collection method 17
2.6 Materials 17
2.7 Sonographic analysis 18
2.7 Sample size 19
2.9 Statistical analysis 20
2.9.1 Intra-individual vocal variation 20
2.9.2 Intra-population vocal variation 21
2.9.3 Intra-island vocal variation 21
2.9.4 Inter-population vocal variation 21
2.9.5 Discriminant function analysis 22
3. RESULTS 23-34
3.1 Qualitative description of the male Kloss’s trill phrase 23
3.2 Intra-individual vocal variation 25
3.3 Intra-population vocal variation 28
3.4 Intra-island vocal variation 28
3.5 Inter-population vocal variation 30
3.6 Discriminant function analysis 31
4. DISCUSSION 35-43
4.1 Intra-individual vocal variation 35
4.2 Intra-population vocal variation 37
4.3 Intra-island vocal variation 38
4.4 Inter-population vocal variation 39
4.5 Discriminant function analysis 40
4.6 Other evidence of Kloss’s subspeciation 42
5. CONCLUSION 44
5.1 Conclusion 44
5.2 Further Research 44

viii
REFERENCES 45
APPENDIX
1– Average figures for every variable of each Kloss’s male sampled 50
LIST OF FIGURES
1.1 Phylogenetic tree of all the gibbon species 2
1.2 Map of the distribution of the gibbon genera Hylobates 3
1.3 Sonogram of male & female Kloss’s vocalisations 7
1.4 Sonogram of the progressive stages of the male Kloss’s song 8
1.5 Map with fault lines and subduction zones in Sunda shelf area 9
2.1 Map of the Mentawai Islands, Indonesia showing the location of field sites 15
2.2 Sonogram of the male Kloss’s trill phrase 18
3.1 Sonograms of the male Kloss’s trill phrase from each population sampled 24
3.2 Bar chart of the coefficient of variation of every variable for all 28
the populations
3.3 Chart of discriminance scores for each Kloss’s male 33
LIST OF TABLES
2.1 Acoustic terms & definitions 14
2.2 Variables measured in the male Kloss’s trill phrase 19
2.3 Song bouts analysed for each Kloss’s male sampled 20
3.1 Coefficient of variation values for every variable of each male 26-27
Kloss’s sampled
3.2 Results of the Mann-Witney U test between Simabuggai & Sikabae 29
3.3 Results of the Mann-Witney U test between Sipora & South Pagai 29
3.4 Significant results between all populations from Kruskal-Wallis test 30
3.5 Results of a post-hoc analysis 31
3.6 Variables used in discriminant function analysis at each step 32
3.7 Standardised canonical discriminant function coefficient for each function 32
3.8 Classification results of DFA 34
Cover photo of Kloss’s gibbon by M. Waller, August 2005, Siberut.

1
1. INTRODUCTION
This introductory chapter is composed of background information essential to the
research aims outlined below; first a brief introduction to the currently accepted form of
gibbon taxonomy, distribution, behaviour and morphology are explained and then key
points in primate and gibbon vocalisation research are described, followed by information
specific to Kloss’s gibbon vocalisations. Next a brief description of the Mentawai islands,
their geological history, climatic changes and local subspecies are given.
1.1 Research aims & objectives
The central aim is to determine the degree of vocal diversity in the male Kloss’s gibbon
(Hylobates klossii) and therefore whether subspecies exist, because it has been shown in
the other species of endemic monkeys that they are composed of two subspecies (Groves,
2001; Roos et al. 2003; IUCN, 2003). Few studies have looked at the vocal diversity of
gibbons (Haimoff & Gittins, 1985; Haimoff & Tilson, 1985) and the Kloss’s gibbon is
the least known of the gibbon species, which makes this a unique and interesting topic. In
addition, the determination of whether subspecies occur has vital consequences for local
threat evaluation and conservation management strategies.
The objective is to find out 1, whether there are significant differences in male
vocalisations between localities; 2, whether vocal differences between islands are larger
than differences between localities of the same island; 3, whether these differences can be
used to predict provenience of singing gibbons and the percentage of correct
identification; and 4, whether differences exist that allow discrimination by trained
observers without using statistics.
To establish the degree of vocal variation the following levels will be examined; intra-
individual, intra-population, intra-island and inter-population, using sound analysis and
statistical tests. If inter-population vocal variability is greater than intra-island variability,
it will support the idea that subspeciation has occurred.

2
1.2 Gibbon taxonomy & distribution
Gibbons are small apes found only in the tropical forests of south and southeast Asia. The
family Hylobatidae consists of twelve species, see figure 1.1. Research shows that
differences in molecular distance between them supports a split into four main
monophyletic genera, based on a similar range to that between Pan and Homo
(chimpanzees and humans) (Geissmann, 2002b; Roos & Geissmann, 2001; Brandon-
Jones et al. 2004; Whittaker, 2005).
Note that the Kloss’s gibbon and Javan silvery gibbon are sister taxa (Geissmann, 2002c).
Previously the Kloss’s was placed between Symphalangus and Hylobates because it is
completely black like the siamang, but smaller like other hylobatids (Chivers, 1977;
Geissmann, 2003b).
Fig. 1.1 A phylogenetic tree of gibbon species; from a combination of trees based on
vocal and molecular data. (Geissmann, 2002b; Roos & Geissmann, 2001)
Evidence from the mitochondrial DNA D-loop supports the idea that the Kloss’s gibbon
is closest overall to the agile gibbon and the silvery gibbon (Whittaker, 2005), both of
which are the closest species geographically (Fig. 1.2).

3
Species can be identified by differences in pelt colouration, vocalisation and location.
Other morphological differences include cranial shape, number of chromosomes and
body size (Geissmann, 2002b). Most species are allopatric but the siamang, agile and lar
gibbons are exceptions with areas of sympatric living, as shown in figure 1.2.
Fig. 1.2 A map showing the distribution of the gibbon genera Hylobates (Chivers &
Gittins, 1978; Geissmann, 1991). Numbers 1 – 3 are areas of sympatry and hybridisation.
1.3 Gibbon behaviour & morphology
1.3.1 Gibbons
Gibbons are characterised by a ‘socially monogamous’ lifestyle, where a family group
consists of an adult male and female and up to four offspring (Chivers, 1984). Gibbons

4
are mainly frugivorous, but will also consume varying amounts of insects, buds, leaves
and eggs (Rowe, 1996; Whitten 1982a, 1984a). Gibbons play an important role in
rainforest regeneration because their consumption of fruits and movement around
territories results in the wide dispersal of seeds (McConkey et al. 2000).
They are diurnal and arboreal and their form of locomotion is brachiation, this is rapid
swinging underneath the branches of trees, and running along the top of branches.
Gibbons have small bodies, extremely long arms and no tail (Chivers, 1977). Most
species exhibit sexual dichromatic pelage but little difference in size. Changes in pelt
colouration can be shown during ontogeny such as in the agile gibbon. Females usually
have their first birth at about nine years old, gestation takes seven months and generally
there is only one offspring per litter, which can be every three years (Gittins, 1978).
1.3.2 Kloss’s gibbon
The Kloss’s gibbon (Miller, 1903) is stated as vulnerable, VU A1c + 2c, B1 + 2ac,
(IUCN, 2003) on the redlist, and is under Hylobatidae species in appendix 1 on CITES
(2003).
The Kloss’s gibbon is completely black and has no facial markings in either sex, unlike
other gibbon species. It has several features that are considered to be ‘primitive’, these
are webbing between the second and third toes (Chivers, 1977), smaller cranial
measurements and capacity, reduced hair density (Whitten, 1984a), longer limbs, more
vertebrae and comparatively long thumbs and great toes (Schultz, 1933; Whittaker,
2005).
Kloss’s gibbons are unusual because they sleep in groups, it has been found that they
show a 91% preference for sleeping in trees without lianas and this is probably because
of an increased risk from nocturnal predators, such as snakes and humans (Tenaza &
Tilson, 1985; Tilson & Tenaza, 1982) and also due to the potential increase in biting ants
(Whittaker, 2005). Usually gibbons exhibit a monogamous social system (Brockelman et
al. 1998; Bernstein & Schusterman, 1964) but larger groups have been recorded for the

5
Kloss’s, ranging from 4-15 individuals and an average of 10 in North Pagai (Whittaker,
2005).
1.4 Vocalisation research
1.4.1 Primates
Singing is a rare quality in mammals and only four genera of primates exhibit this
(Geissmann, 2000b), these are the indri (Indri), titi monkey (Callicebus), gibbon
(Hylobates) and tarsier (Tarsius) (Nietsch & Kopp, 1998). In addition, the vocalisations
of orang-utans (Pongo pygmaeus), gorillas (Gorilla spp.) and chimpanzees (Pan
trogloydytes) reflect similarities to gibbons in factors such as volume, acceleration of
note rhythm and locomotor displays (Geissmann, 2000b). Variation in the pant-hoots
(long distance call) produced by male chimpanzees (P. t. schwienfurthii) was examined
using principle components analysis (PCA) by Notman and Rendall (2005). They found
that the variation in pant-hoots related to specific conditions such as abundant food
sources or social contexts such as travelling in small groups before meeting with the rest
of the community. Research also showed that there is geographic variation in the quality
of pant-hoots (Mitani et al., 1999), particularly in note length and rate. Discriminant
function analysis showed that it was possible to assign individuals to their correct
population based on vocal characteristics.
1.4.2 Gibbons
All gibbon species are characterised by producing loud and long bouts of song in the
morning, these are species and sex-specific songs (Konrad & Geissmann, 2004), and they
are also repetitive and stereotyped (Brockelman, 1984). The accepted definition of a song
is “a series of notes, generally of more than one type, uttered in succession and so relates
as to form a recognisable sequence or pattern in time” as described by Thorpe (1961) in
relation to birds. However, the term song can be applied to gibbons too when they
produce loud, long and complex vocalisations (Haimoff, 1984). Acoustic analysis and
playback experiments have shown that variation in male songs exists between species and
that they are able to discriminate individuals, as neighbours or strangers, by their
vocalisations (Mitani, 1987). However, the same vocalisation can mean different things

6
depending on who is hearing it, for example in birds the male robin can discourage other
males entering the territory whilst simultaneously attract females (Gittins, 1978) and it is
likely that gibbons do this too.
All species produce a duet, consisting of mated male-female pairs (Cowlishaw, 1992)
who “combine their sex-specific repertoire in a relatively rigid, precisely timed and
complex vocal interaction” (Geissmann, 2000a), with the exception of the Javan silvery
(H. moloch) and Kloss’s gibbon (Gittins, 1984; Geissmann, 1993). Although duet
splitting is demonstrated in the silvery and Kloss’s gibbon, males of the first sing far less
frequently than the latter (Geissmann & Nijman, 1999) and the female silvery gibbons are
believed to compensate for this (Kappeler, 1984). The function of duets is to maintain
pair-bonds (Geissmann, 2000b; Geissmann & Orgeldinger, 2000); however the lack of
duetting in Kloss’s and Javan silvery gibbons does not denote a lack of pair-bonding, just
that the function of singing differs between species (Geissmann & Orgeldinger, 2000;
Geissmann, In press). Male gibbons are known for using singing as a form of territorial
advertisement, mate attraction, and defence (Ahsan, 2001; Haimoff & Tilson, 1985;
Tenaza, 1975; Whitten, 1982a, 1984b) of areas typically between 20-40 hectares
(Geissmann, 1993). Whereas female songs indicate that the male has already formed a
pair-bond (Whitten, 1982a).
Immature gibbons also join in with the singing, especially the females and their ability to
match the adult female develops with age. Young males are thought to be discouraged
from joining in because it indicates they are developing to an age where it is possible for
them to set up territories and attract mates of their own, which obviously conflicts with
the adult male’s own territory (Gittins, 1978).
1.4.3 Kloss’s gibbon
Kloss gibbons are particularly interesting because unlike other gibbon species they do not
duet and it is proposed that this is a derived trait (Geissmann, 2002a). There are different
types of vocalisations produced by the Kloss’s gibbon which relate directly to the
environment and changing stimuli. These include ‘hoo’ and ‘howl’ which indicate the

7
detection of other primates, a ‘whup’ is found during a females song bout, a ‘whistle’ can
occur before male songs and within the female song, a ‘whoo’ precedes the female song,
‘sirening’ and ‘alarm trill’ indicate the presence of humans, ‘quivering squeals’ and
‘whistle-howls’ are produced by males and females respectively during male fighting
(Tenaza & Tilson, 1977). Finally, there are the male and female songs. Production of any
one type of vocalisation is independent of any other vocalisation (Whitten, 1982a).
Females sing every 3-4 days post-dawn and it includes an energetic visual display
(Whitten, 1982a, c) where they move rapidly around the trees. They produce a short
introductory phrase with simple single-pitched hoots (0.7 kHz) and complex hoots (oo-
wa) and no trills. Then the great call, see figure 1.3, has an acceleration-type climax (0.6-
1.0 kHz), similar to muelleri (H. muelleri), with fast bubbling notes (1.0-1.2 kHz). The
last phase is the interlude with slower falling notes (1.0-0.4 kHz) at the end. Kloss’s great
calls are longer than in other species. It has been shown that the duration and number of
notes in the different phases of great calls are quite variable and can indicate individuals
(Haimoff & Tilson, 1985) and in the wild this aids identification of neighbours (Haimoff
& Gittins, 1985). The duration of female song bouts is about 20 minutes (Cowlishaw,
1992).
Fig. 1.3 Sonograms of a) male kloss’s short phrases (Twycross, 02/10/1988) and b)
female Kloss’s great call (South Pagai, 27/11/1987, Tilson) (Taken from Geissmann,
2005).
Males sing pre-dawn on average every 2 days (Whitten, 1984b) and in a study by Whitten
(1982a) the modal time class for singing was 05.00-05.15 when 20% of the songs began.
They produce songs in three parts; short phrases with simple hoots at the start of a song

8
(+ 0.7 kHz), more complex hoots (ow-oo), and finally short trilling phrases (0.6-1.0 kHz)
with 3-4 terminal notes, as shown in figures 1.3 and 1.4 .
Fig. 1.4 Sonograms of the progressive stages in the male kloss’s song (Whitten, 1982a).
No codas (Table 2.1) are performed at the end of a female’s great call (Geissmann, 1993,
2002a 2005; Haimoff, 1984; Tenaza & Hamilton, 1971; Whitten, 1982a). Whitten
(1982a) found that the median length of a male’s song was 44 minutes with a range of 3-
108 minutes. The interval between the stages of the song becomes shorter as it increases
in complexity (Whitten, 1984b).
Male Kloss’s gibbons often sing at the same time as those in neighbouring territories, this
countersinging is a form of competition (Whitten, T., 1982a). If there is rain during the
night or temperatures reach below a threshold of 21.5 0C singing is often inhibited
(Ahsan, 2001). It is has also been shown that males are recognisable by their songs alone
because there are obvious variations in the species-typical song (Tenaza, 1976).
1.5 West Sumatra
The Mentawai Islands are positioned 85-135km off the west coast of Sumatra (Fuentes,
1996/1997; Whitten, 1982a) and consist of Siberut, the largest and most northern, Sipora,
North Pagai and South Pagai (Chasen & Kloss, 1927). They lie between 0055’ to 3020’
South and 98031’ to 100040 East, see figure 2.1. The major forest types present are

9
primary dipterocarp, primary mixed forest, secondary regenerating logged dipterocarp
forest, and other types present include mangrove, freshwater and sago swamps, and west
coast beach vegetation (Whittaker, 2005).
1.6 Geological history & climate changes
Approximately two hundred million years ago the Mentawai Islands were formed due to
the collision of the Indian plate into the Asian (Eurasion) plate. Therefore, causing an
upward shift and the formation of a chain of volcanic mountains along Sumatra, and also
causing submergence which created the deep sea trenches, about 1000 fathoms (Chasen
& Kloss, 1927), to the west of Sumatra. Further west this caused a smaller uplift thus
creating a chain of islands, including the Mentawai (Whitten, T., 1982b) see figure 1.5.
Figure 1.5 Map showing fault lines (purple) and the subduction zones around the Sunda
shelf area (Anon., 2005)

10
Changes in climate and cycles of glaciation and deglaciation during the Pleistocene are
responsible for significant changes in sea levels, which affect the degree of separation
between land masses (Chivers, 1977; Voris, 2000), especially in the Sunda Shelf region.
The consequences of climate change were apparent through habitat loss and
fragmentation (Cowlishaw & Dunbar, 2000). These cycles of genetic isolation can
explain the high number of phenotypically distinct gibbon populations and possibly
genotypically distinct (Fleagle, 1999). The Mentawai have been separated from mainland
Sumatra by the deep sea trenches for approximately 500,000 years (Whittaker et al.
2004), whereas Sumatra and the rest of Southeast Asia were joined till about 10, 000
years ago. Thus, the biodiversity of the Mentawai is quite distinct from the mainland and
has a high degree of endemicity (Whitten, T., 1982b).
1.7 Identifying subspecies of the Mentawai primates
The taxon level subspecies is a lower division of species and the members of one
subspecies differ morphologically and/or genetically from members of other subspecies
belonging to the same species (Wikipedia, 2005; O’Brien & Mayr, 1991). Members of a
subspecies share a unique geographic range or habitat, allopatric, but they are still
reproductively compatible with other subspecies (Avise & Ball, 1991), and share a
unique natural history relative to other subspecies of the species. It is important to
acknowledge subspecies levels because of their potential to possess unique characteristics
and therefore, their contribution to biological diversity and influence on conservation
management units (Stanford, 2001).
It is possible that subspeciation has taken place in the Kloss’s gibbon because the three
other species of endemic primates, Mentawai macaque (Macaca pagensis & M. siberu),
Mentawai langur (Presbytis potenziani & P. siberu) and the pig-tailed langur (Simias
concolor concolor & S. c. siberu) (Groves, 2001; Roos et al. 2003; Whittaker, 2005)
exhibit 2 subspecies; one on Siberut and a second on the three southern islands. These
subspecies are easy to identify due to differences in pelt colouration (Groves, 2001) for
example the Siberut forms are darker than on the southern islands. Additional differences
between the southern islands of Sipora and the Pagais have been suggested for the

11
Mentawai langur (Brandon-Jones, 1993). However, no such variation in morphology is
present in the Kloss’s, so vocal diversity is the key non-invasive determinant.
Previous studies have shown that gibbon vocalisations are ideal for analysing
phylogenetic relationships among taxa, because specific characteristics of songs are
inherited, not learnt (Brockelmann & Schilling, 1984; Cheyne & Brule, 2004;
Geissmann, 1984, 1993, 2002b, 2005; Marshall & Sugardjito, 1986; Tenaza, 1985). It has
been shown that individuals can produce their species-specific songs even when reared in
isolation (Geissmann, 1984; Tenaza, 1985). In addition, evidence from hybridisation in
zoos and the wild support this; for example the hybrids of Hylobates pileatus and H. lar
showed elements of both parents species specific song, even though it was only exposed
to the song of one species relevant to it is own gender. Therefore the intermediate version
must be a result of inheritance rather than learning (Brockelman & Schilling, 1984;
Geissmann, 1984; Tenaza, 1985; Short, 2004). Vocalisations can also be used to analyse
inter-individual and inter-population variability (Dallmann & Geissmann, 2001a, b;
Haimoff & Gittins, 1985; Haimoff & Tilson, 1985).
It is important to note that whilst some aspects of a vocalisation are the same amongst all
individuals of a population, species or sex, that there are also aspects which are highly
variable. It is therefore important to determine which factors are constant within the
population but vary between populations, and also at the species or sex level, for efficient
identification. Determining specific subspecies vocal characteristics can aid accurate
identification and therefore greatly influence conservation programmes.
Gibbons, unlike macaques and langurs, are known to show avoidance of all water bodies,
such as streams (Marshall & Sugardjito, 1986; Morris, 1943; Parsons, 1940, 1941), and
they rarely come to the ground (Whittaker, 2005). It is geographical barriers such as these
which have the potential to prevent dispersal and thus allow allopatric subspeciation to
take place. Differences can also evolve by random historical mechanisms such as genetic
drift, bottlenecks, hybridisation, environmental effects and social adaptation (Dallmann &
Geissmann, 2001b).

12
1.8 Report structure
This report is split into five chapters, each with a summary at the start and subdivisions
that proceed logically through the topics. The first chapter describes the aims and all
relevant background information to the research. Chapter 2 is the methods; this is
composed of details about the field sites, data collection, sonographic analysis and
statistical analysis at different levels. The different levels are intra-individual, intra-
population, inter-island and inter-population. The results, chapter 3, first of all contains a
qualitative description of the male Kloss’s trill phrase vocalisation, then the statistics are
split into sections corresponding to the levels that variation was examined in. The
discussion, chapter 4, follows the same order of levels used in the results section and
additional evidence of subspeciation is presented in order to answer the objectives
described in chapter 1. Finally the fifth chapter contains the central conclusions and ideas
for extended research.

13
2. METHODS
This chapter explains the methods used to obtain and analyse vocalisation data,
exploiting sonographic and statistical software, from the male Kloss’s gibbon. A
comprehensive review of features such as the pilot study, complimentary research,
acoustic terms and definitions, field site locations, materials and recording techniques are
also included.
2.1 Pilot study
The only captive Kloss’s gibbon outside of Southeast Asia is a single adult male held at
Twycross Zoo, England. Observations over four mornings in January 2005 provided a
familiarity with the species; such as forms of locomotion, morphology and ethology.
Recordings of several different gibbon species, including the Kloss’s, were taken, thus
allowing researchers to gain experience of using different combinations of equipment.
Potential sources of error were recognised, for example excess background noise can be
minimised by holding the microphone very still and through using wind shields. The
procedure for recording was also established, such as the use of verbalising important
notes onto the tape between song bouts and the use of standardised phrases by both
researchers to avoid confusion.
2.2 Complimentary research
Recordings of female Kloss’s gibbons were collected from each of the field sites in the
Mentawai using the same methods, to be analysed by Miss Sally Keith as a
complimentary project. Therefore both researchers collected data on both sexes using
identical equipment and adhering to the same protocol before exchanging recordings later
for analysis. The focus of the female vocalisations is the great call and a slightly different
set of variables were used to assess the degree of variability. It is important that both
sexes were researched because it has been found that females exhibit more variation in
their songs and individuality than males (Dallmann & Geissmann, 2001b) but male
Kloss’s gibbons sing more regularly so it is easier to get a larger sample size.
14
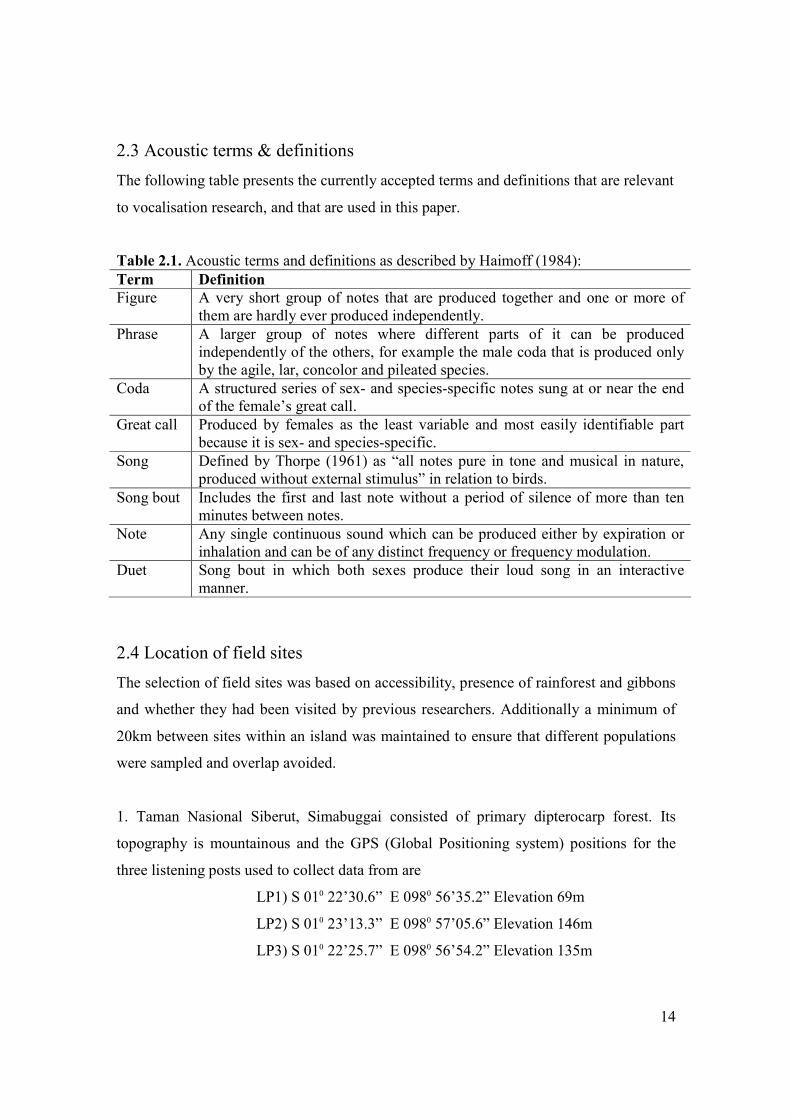
2.3 Acoustic terms & definitions
The following table presents the currently accepted terms and definitions that are relevant
to vocalisation research, and that are used in this paper.
Table 2.1. Acoustic terms and definitions as described by Haimoff (1984):
Term Definition
Figure A very short group of notes that are produced together and one or more of
them are hardly ever produced independently.
Phrase A larger group of notes where different parts of it can be produced
independently of the others, for example the male coda that is produced only
by the agile, lar, concolor and pileated species.
Coda A structured series of sex- and species-specific notes sung at or near the end
of the female’s great call.
Great call Produced by females as the least variable and most easily identifiable part
because it is sex- and species-specific.
Song Defined by Thorpe (1961) as “all notes pure in tone and musical in nature,
produced without external stimulus” in relation to birds.
Song bout Includes the first and last note without a period of silence of more than ten
minutes between notes.
Note Any single continuous sound which can be produced either by expiration or
inhalation and can be of any distinct frequency or frequency modulation.
Duet Song bout in which both sexes produce their loud song in an interactive
manner.
2.4 Location of field sites
The selection of field sites was based on accessibility, presence of rainforest and gibbons
and whether they had been visited by previous researchers. Additionally a minimum of
20km between sites within an island was maintained to ensure that different populations
were sampled and overlap avoided.
1. Taman Nasional Siberut, Simabuggai consisted of primary dipterocarp forest. Its
topography is mountainous and the GPS (Global Positioning system) positions for the
three listening posts used to collect data from are
LP1) S 010 22’30.6” E 0980 56’35.2” Elevation 69m
LP2) S 010 23’13.3” E 0980 57’05.6” Elevation 146m
LP3) S 010 22’25.7” E 0980 56’54.2” Elevation 135m

15
2. South Siberut, Sikabae was comprised of a mixture of mangrove and dipterocarp
forest. The majority was primary forest with patches of secondary forest on hilly terrain.
The GPS positions for the three listening posts were
LP1) S 010 37’04.3” E 0990 15’09.4” Elevation 39m
LP3) S 010 37’20.0” E 0990 15’41.5” Elevation 26m
LP4) S 010 26’44.8” E 0990 15’00.1” Elevation 120m
Fig. 2.1 Map of the Mentawai Islands, Indonesia showing the location of field sites,
numbers 1 to 4 and the 183 meter isobath - - - - - (Taken from Fuentes, 1996).
3. North Sipora, Saureinu consisted of primary, dipterocarp forest in extremely
mountainous topography. The GPS positions for the three listening posts were

16
LP1) S 020 07’15.5” E 0990 38’04.1” Elevation 97m
LP3) S 020 07’52.0” E 0990 37’33.7” Elevation 140m
LP4) S 020 07’49.2” E 0990 37’01.7” Elevation 145m
4. South Pagai, Malakopa contained mostly secondary, regenerating logged dipterocarp
forest at a high elevation with hilly topography. The four listening posts used for data
collection were LP1) S 020 58’00.9” E 1000 17’15.5” Elevation 215m
LP2) S 020 58’06.1” E 1000 18’12.6” Elevation 221m
LP4) S 020 57’26.7” E 1000 18’35.6” Elevation 194m
LP5) S 020 57’54.3” E 1000 18’38.8” Elevation 231m
2.5 Data collection
2.5.1 Data collection method
All recordings were taken between May and September 2005 by M. Waller and S. Keith.
At each field site a point census technique was used to determine listening points,
however it was modified because listening posts could not be chosen randomly for the
following reasons. Some areas of the site were inaccessible because the terrain consists of
steep hills and mountains, dense vegetation, uncrossable rivers, mangrove forests and
peat swamps. Vocalisations were easiest to hear from the top of hills because Kloss’s
gibbons show a preference for using tall trees at the top of hills for singing from because
there are fewer obstructions. In addition, background noise from insects is minimised,
this is called the ‘sound window’ (Whitten, 1981). Vocalisations travel a long distance;
approximately 1km, so a minimum of 2km from other listening points should be ensured
to avoid recording the same individual twice (Geissmann, 2005). Listening points were
reached before the male starts singing (~4.00am) every morning and remained until about
10.00am because females sing post dawn (~7.00am onwards). Researchers aimed to
record seven individual males and females at each field site to provide an adequate
sample for statistical analysis and at least two recordings from an individual to determine
the degree of intra-individual variability (Geissmann, T., pers. comm.). Recordings of all
stages in the male’s song were taken, as shown in figure 1.4, and of the great call by
females.

17
Before vocalisations began the time, date, direction of sound (by compass bearing), and
researchers name and reference code were recorded onto the tape, as recommended by
Lehner (1996). In addition, notes of the weather (rainfall and temperature), GPS (Global
Positioning System) location, time vocalisation starts and ends, duration, and other
information were recorded into waterproof notebooks. Triangulation methods would have
been employed, as described by Buckley (2004), if GPS systems had failed.
2.5.2 Alterations to data collection method
It was not possible to obtain recordings from seven different males at each field site due
to excess rain inhibiting the chance of gibbons vocalising and by creating too much noise
for good quality recordings to be taken. Inaccessibility of the terrain prevented
researchers from maintaining a minimum distance of 2km between listening posts.
However, by thorough cross-checking of recordings any potential pseudo-replication was
eliminated if individual identity was uncertain. It was clear from personal observations
that song recordings of high quality were within 400m of the listening post and did not
disperse efficiently beyond 600m.
2.6 Materials
An ME66 Sennheiser shot gun microphone and K6 power module was used with a Sony
VOR cassette recorder TCM–450DV, as used in similar research on the Kloss’s gibbon
(Whittaker et al. 2004). The microphone was chosen for its high quality, durability, low
noise figure, relative immunity to high humidity and directionality which allow the
researcher to focus on vocalisations from a single direction (Geissmann, 2003a). To
minimise background noise, such as wind, rain and insects (Bearder, 2004; Geissmann,
2003a; Lehner, 1996) a rubber foam windscreen was placed over the directional
microphone. The recorder was chosen because it has a frequency range of 250 – 6300 Hz,
ability to take good quality recordings (Lehner, 1996), built in speaker for playback
(Geissmann, 2003a) and compact size which is favourable in field conditions. TDK 60
minute tapes were used because they are ‘more time accurate’ than longer tapes and have
a low signal to noise ratio (Geissmann, 2003a). The use of headphones whilst recording

18
allowed researchers to accurately aim the microphone towards the target gibbon. The
Garmin eTrex Global Positioning System (GPS) was chosen because it is particularly
durable, accurate and has memory adequate for this research.
2.7 Sonographic analysis
Only the last stage of a males song are analysed, this consists of the pre-trill, trill and
post-trill notes as defined in the sonogram below. All parts are analysed to maximise the
chance of finding differences between populations. Sonographic analysis is achieved
using ‘Raven 1.2.1’ on the variables described in table 2.2.
Fig. 2.2 Sonogram showing the three parts of a male trill phrase. (Kloss’s sampled from
Sipora, June 2005).
The sound material was digitised with a sample rate of 44100Hz and a sample size of 16
bit. Sonograms were constructed with a time versus frequency display. This software was
chosen for its ability to edit sounds efficiently without needing specialist training. It is an
updated version of the canary software used in similar research by Konrad and
Geissmann (2006).

19
Table 2.2 Variables to measure male Kloss’s gibbon trill phases (Haimoff & Tilson,
1985)
Variable Description
1. Duration of phrase Time in seconds from the start to the end of the phrase
2. Total number of notes in phrase Count of the number of notes in whole phrase
3. Minimum frequency of phrase Frequency measured in Hertz
4. Maximum frequency of phrase Frequency measured in Hertz
5. Number of notes pre trill Count of the number of notes pre trill
6. Duration of pre trill notes Time in seconds for duration of pre trill notes
7. Minimum frequency of pre trill
notes
Frequency measured in Hertz
8. Maximum frequency of pre trill
notes
Frequency measured in Hertz
9. Frequency modulation of second
note
The change in frequency of this note from start to end,
measured in Hertz.
10. Frequency modulation of third
note
The change in frequency of this note from start to end,
measured in Hertz.
11. Number of notes within trill Count of the number of notes within trill
12. Duration of trill Time in seconds for trill duration
13. Minimum frequency of trill Frequency measured in Hertz
14. Maximum frequency of trill Frequency measured in Hertz
15. Frequency modulation of first post
trill note
The change in frequency of this note from start to end,
measured in Hertz
16. Number of post trill notes Count of the number of notes post trill
17. Duration of post trill notes Time in seconds for post trill notes
18. Minimum frequency of post trill
notes
Frequency of post trill notes measured in Hertz
19. Maximum frequency of post trill
notes
Frequency of post trill notes measured in Hertz
2.8 Sample size
A total of 224 song bouts were analysed from 27 different males. Song bouts were
considered unsuitable for reliable measurements if recording quality was low, due to
noise or absence of notes, for example if no post trill notes were performed. The
measurements of song bouts taken from each individual were converted to mean values
for comparison, but variables which were counts, for example the number of notes per
phrase was converted to median values because it is clearly impossible to have 2.3 notes
in a phrase.

20
Table 2.3 Song bouts analysed for each male at all locations.
Location Individual Recorded bouts Analysed bouts
1 23 20
2 8 8
3 8 5
4 8 8
5 4 4
6 6 5
Simabuggai, Siberut
7 4 4
1 22 21
2 8 2
3 2 2
4 13 9
5 12 11
6 5 4
7 4 4
Sikabae, Siberut
8 22 19
1 9 6
2 21 18
3 19 5
4 13 13
5 17 6
6 9 6
Saurineau, Sipora
7 8 7
1 22 21
2 21 5
3 10 4
4 4 4
Malakopa, South Pagai
5 7 3
TOTAL 27 309 224
2.9 Statistical analysis
All tests used were non-parametric due to the non-random method of data collection,
small and unequal sample size. All tests were conducted using the statistical software
package SPSS 12.1. The variation of vocalisations was examined at the intra-individual,
intra- and inter-population and intra-island levels.
2.9.1 Intra-individual vocal variation
To look at how each variable varies within an individual, simple descriptive statistics
were used; the standard deviation is divided by the mean and multiplied by 100 so the

21
coefficient of variation is expressed as a percentage. This method is more reliable than
measures such as ‘variance’ because it allows the separate variables to be compared
despite their varying scales of measurement (Fowler et al. 1998). Those with low
coefficient values are considered as stable, whereas high values indicate a higher level of
variation.
2.9.2 Intra-population vocal variation
The coefficient of variation will be calculated using all the individuals within a
population to determine how much variation is shown in each variable of the trill phrase,
as detailed above.
2.9.3 Intra-island vocal variation
The Mann-Witney U test (Kranzler & Moursund, 1999) was used to determine whether
two populations within an island are significantly different to each other. The tests were
done between Simabuggai and Sikabae; both sites on Siberut island, and also on Sipora
and South Pagai; the southern islands. Therefore, the null hypothesis is: ‘there is no
difference in the vocalisation variables between the two populations’.
2.9.4 Inter-population vocal variation
To determine whether significant differences in male vocalisations exist between the four
populations sampled, a Kruskal-Wallis one way analysis of variance (ANOVA) was
conducted (Fowler et al. 1998). A significance level of 5% was used, as used by Haimoff
& Tilson (1985) in a similar study on Kloss’s gibbons. The null hypothesis is: ‘there is no
difference in vocalisation variables between the four populations of male Kloss’s gibbons
sampled’.
A post-hoc test will be used to show which pairs of populations differ from one another,
if significant differences are found in the Kruskal-Wallis test. This will be a pair wise
Mann-Witney U test with the Bonferroni adjustment (Scholfield, 2005)
.

22
2.9.5 Discriminant function analysis
This test determines the likelihood of the variables to be used as a model for placing
unknown individuals into their correct populations, other than by chance alone, based on
the characteristics of their vocalisation. DFA identifies differences in the vocalisations
amongst the four populations. A multivariate, stepwise approach using Wilks’ lambda
method will be used, as by Konrad & Geissmann (2006) in a similar study on Cambodian
gibbons. A tolerance test will be performed to measure the degree of linear association
between variables and therefore avoid redundancy amongst independent variables. The
probability of F will be used, therefore p entry = 0.05 and p to remove = 0.10, thus
screening out variables that are inefficient discriminators and identifying those which are
good discriminators.
The selected variables, functions, are used in the classification procedure that assigns
individual gibbons to their correct or incorrect populations. The percentage of correct
classifications can then be used to indicate the discriminability of populations, and by
calculating Cohen’s k (Siegel & Castellan, 1988) it is possible to determine whether the
classification differs significantly from chance. The model is then cross-validated using
the leaving-one-out method, this is where each of the cases are left out in turn, therefore
the functions are calculated on the rest of the cases and the one left out is classified.

23
3. RESULTS
The results chapter is divided into logical sections, first a description of the qualitative
characteristics of male Kloss’s gibbon songs is provided with some key findings about
the circumstances within which they sing. An examination of variation in the trill phase
at the following levels; intra-individual, intra-population, intra-island and finally inter-
population will be presented, plus results from the discriminant function analysis.
3.1 Qualitative description of the male Kloss’s trill phrase
As detailed in chapter 1, the song of male Kloss’s gibbons starts with the repetition of a
single long, descending note that is repeated for approximately half an hour, then it
gradually builds up to a three note phrase, then a five note phrase and finally the trill
phrase which often alternates with an identical phrase without the trill section. The gaps
between these stages become shorter as the singing progresses. Researchers described the
initial notes as haunting, particularly in reference to the Siberut populations.
As expected, the trill phrase consisted of the three parts; the number of pre trill notes vary
but they increase in speed to build up to the trill, which is a rapid succession of notes
alternating slightly in frequency and then ending in a few post trill notes that are longer
and slower. However, there appears to be a difference between Siberut and the two
southern islands; the post trill of Siberut males consists of notes which sound like they
are descending, whereas the Southern islands are more varied, sometimes ending with
ascending notes or notes with a greater frequency modulation such as awoo-oo that is
sung with an ascending and descending part, as shown in figure 3.1 c.

24
Fig. 3.1 Sonograms of the male trill phase from a) Simabuggai, Siberut; b) Sikabae,
Siberut; c) Sipora; d) South Pagai.
Kloss’s gibbons were observed singing at a variety of times during the daily cycle; the
peak time for males was between 05.00 and 07.00, which reinforces past research, as
described in the introduction. However, it is important to note that male Kloss’s gibbons
are also likely to sing at other times, such as between 09.00 and 11.00 after their first
feeding session, especially if there has been heavy rain earlier in the morning. The most
unusual finding was a bout of singing from 23.30 to 01.08 am, which is when gibbons
typically sleep (Whitten, 1982c). The cause of this is unknown but it is possible that the
session of female great calls that morning stimulated the males to sing.
It is also important to note that Kloss’s gibbons do sing in light rain and just after heavy
rain, despite findings from previous research. Although it is the norm for males to sing

25
before the females, on one occasion males were heard singing before and just after the
females great call bout.
3.2 Intra-individual vocal variation
This will be examined through calculating the coefficient of variation for all the phrases
that were measured for each individual. The coefficient allows all the variables to be
directly compared because it accounts for the different means of each variable.
The table shows the five most constant variables, therefore low in variation represented
by low coefficient values, for each individual in bold. The variables minimum and
maximum frequency of trill, notes per pre trill, duration of pre trill and maximum
frequency of whole phrase are constant in most of the individuals. Generally the
coefficient of variation is low, < 35%, amongst all the individuals, with only a few
exhibiting variables with values over 50%. The highly varied variables are the frequency
modulation of the third pre trill note and duration of the post trill and number of notes in
the post trill.
However, it is important to note that although all the variables of some individuals may
appear constant this is not necessarily accurate because the coefficient of variation may
have been based on a small sample of phrases, as exhibited in individuals Sikabae 1 and
2.

26
Table 3.1. Table showing the coefficient of variation for all the variables of each individual male gibbon sampled. The five most
constant variables for each individual are highlighted in bold. Variable No →
Individual ↓ 1 2 3 4 5 6 7 8 9 10 11 12 13 14
Simabuggai 1 23.57 11.01 5.24 8.85 8.48 10.14 19.09 16.90 19.19 30.18 16.11 14.44 12.55 9.39
Simabuggai 2 45.11 9.63 6.21 3.34 6.81 3.34 43.71 33.96 16.88 31.18 13.28 8.52 4.54 1.14
Simabuggai 3 27.52 6.98 2.99 2.69 5.17 2.69 34.46 4.08 19.86 22.31 5.13 10.31 4.11 3.22
Simabuggai 4 47.74 10.84 6.48 2.17 3.40 2.17 4.99 13.88 16.33 28.28 9.07 11.19 3.74 0.55
Simabuggai 5 20.76 21.13 4.86 8.72 4.56 8.72 13.59 16.15 17.43 14.97 39.37 16.69 8.30 5.22
Simabuggai 6 18.59 10.48 10.17 3.88 7.46 3.21 12.99 10.83 15.12 42.02 10.09 6.15 3.23 3.28
Simabuggai 7 3.76 4.03 13.42 7.82 4.81 7.82 13.30 22.48 8.60 7.40 16.11 18.62 3.57 2.36
Sikabae 1 22.31 8.29 8.57 7.39 6.91 7.34 13.25 25.59 19.35 38.69 15.71 12.50 5.78 3.00
Sikabae 2 25.78 8.91 7.14 5.55 5.83 5.55 11.52 36.67 0.00 39.24 16.33 7.15 3.97 3.22
Sikabae 3 16.20 7.44 8.88 2.19 7.51 1.91 7.20 9.28 10.56 25.17 15.95 10.51 4.38 11.33
Sikabae 4 25.89 4.56 16.33 0.89 8.66 0.89 0.87 8.26 0.00 14.59 15.71 30.51 4.20 2.60
Sikabae 5 6.16 8.32 0.41 2.98 1.46 2.98 2.56 6.18 12.86 17.85 15.71 10.07 0.00 3.40
Sikabae 6 16.38 0.00 4.70 6.71 1.81 6.71 9.95 17.71 12.83 11.20 7.41 11.00 0.99 2.29
Sikabae 7 30.11 7.04 10.41 5.81 5.88 5.81 12.18 13.62 17.35 45.34 12.90 15.88 2.25 2.21
Sikabae 8 20.29 6.63 11.47 1.71 4.54 1.56 12.61 6.60 13.64 31.75 13.26 17.41 3.75 2.69
Sipora 1 18.63 10.41 9.41 4.06 11.56 4.01 26.57 14.85 19.56 23.25 10.30 15.19 6.98 2.76
Sipora 2 15.87 7.45 10.63 5.00 2.46 5.93 32.62 12.48 36.45 31.21 15.80 19.45 3.55 3.13
Sipora 3 26.51 12.61 9.81 4.24 11.26 3.73 17.33 19.40 11.47 30.94 14.85 22.45 4.39 4.87
Sipora 4 20.27 7.30 14.67 4.17 24.81 13.97 29.56 33.93 47.71 39.27 13.43 25.53 6.51 2.29
Sipora 5 30.96 12.26 8.95 12.93 5.51 12.86 38.85 22.08 22.27 40.95 16.97 23.45 6.41 1.37
Sipora 6 13.41 15.54 9.98 1.79 11.09 1.79 30.74 19.24 15.94 30.81 17.11 11.96 8.43 5.95
Sipora 7 14.75 9.30 24.08 3.41 17.35 3.41 29.88 11.26 31.02 32.19 10.10 6.73 6.99 1.96
South Pagai 1 27.33 11.36 12.22 2.36 13.98 2.58 31.09 10.14 20.90 45.98 15.07 13.31 5.46 13.71
South Pagai 2 36.42 16.81 14.79 8.24 12.52 8.24 27.57 19.48 31.88 43.13 17.68 3.91 1.79 4.13
South Pagai 3 8.01 12.41 8.42 3.74 10.90 9.33 37.41 3.30 35.29 47.18 23.56 10.18 4.09 3.25
South Pagai 4 31.91 11.98 15.92 4.63 5.39 5.62 29.52 19.85 16.33 58.30 13.21 12.71 3.70 5.31
South Pagai 5 11.51 0.00 1.46 5.38 7.77 13.10 7.20 0.00 56.02 12.37 16.02 4.66 1.43

27
Table 3.1 cont. Table showing coefficient of variation for the variables of each individual male gibbon sampled. The five most
constant variables for each individual are highlighted in bold. Variable No→
Individual↓ 15 16 17 18 19
Simabuggai 1 44.85 72.04 4.91 18.66 37.37
Simabuggai 2 18.86 11.62 3.40 11.32 28.87
Simabuggai 3 55.92 62.61 3.86 6.67 20.58
Simabuggai 4 54.71 89.45 4.39 32.24 41.21
Simabuggai 5 46.48 44.49 4.80 21.36 40.03
Simabuggai 6 46.29 20.01 10.30 2.47 16.01
Simabuggai 7 34.23 23.56 10.27 2.09 21.69
Sikabae 1 41.92 37.73 7.45 19.76 38.01
Sikabae 2 28.57 28.40 6.15 8.19 21.78
Sikabae 3 32.27 31.57 9.68 18.76 31.65
Sikabae 4 47.14 63.85 13.21 4.23 8.31
Sikabae 5 0.00 4.72 7.07 14.38 5.55
Sikabae 6 28.57 33.45 3.26 20.15 46.78
Sikabae 7 35.90 36.69 10.34 12.89 22.00
Sikabae 8 42.43 38.65 8.07 23.17 45.72
Sipora 1 20.82 19.63 9.60 7.76 12.31
Sipora 2 33.47 44.44 18.00 15.11 34.46
Sipora 3 46.49 42.13 10.41 8.44 9.09
Sipora 4 45.53 55.74 16.74 18.53 23.99
Sipora 5 41.95 47.81 16.56 12.60 31.48
Sipora 6 45.25 33.23 20.99 9.04 18.17
Sipora 7 43.24 29.71 19.73 6.73 21.56
South Pagai 1 17.54 23.44 13.46 6.01 15.70
South Pagai 2 42.38 59.75 18.68 10.22 24.85
South Pagai 3 36.89 34.32 16.50 3.88 11.55
South Pagai 4 40.82 36.25 18.11 9.53 12.44
South Pagai 5 24.74 33.40 3.99 7.71 30.56

28
3.3 Intra-population vocal variation
To determine the degree of variation within a population the coefficient of variation can
be calculated using the average figures from each of the males in that population. The
most constant variables within each population are the shortest bars in figure 3.2.
The lowest coefficient values that occur in several of the populations are maximum
frequency of the whole phrase, the number of notes and duration of the pre trill,
minimum frequency of the trill and maximum frequency of the trill. All of these variables
were the most constant at the intra-individual level too. The variables which exhibit high
variation in more than one population are the maximum frequency of the pre trill,
frequency modulation of the third pre trill notes and the number of notes and duration of
the post trill. The last two of these were also the most diverse at the intra-individual level.
0
10
20
30
40
50
60
70
1 2 3 4 5 6 7 8 9 10 11 12 13 14 15 16 17 18 19
Variables of the trill phrase
Coefficient of variation %
Sikabae
Simabuggai
Sipora
South Pagai
Fig. 3.2 Bar chart showing the coefficient of variation within each population for every
variable of the male Kloss’s trill phrase.
3.4 Intra-island vocal variation
A Mann-Witney U test was conducted to look at the degree of variation between the two
populations on the same island, Siberut, and then between the two southern island
populations. The results show that for eight of the vocal variables measured there is a
significant difference (p<0.05) between the Simabuggai and Sikabae population, see table

29
3.2, and one highly significant difference (p<0.001). Therefore, the null hypothesis is
rejected and it can be concluded that these two populations are not the same vocally.
It was not expected that these two populations would be so distinctive from one another,
but some of the variables shown to be constant at the previous levels are shown here to be
different between the Siberut population, for example maximum frequency of the phase
and notes per pre trill. Thus they are effective discriminating variables. In addition
variables that were shown to be highly variable at the previous levels are also effective
discriminators, such as the maximum frequency of the pre trill and frequency modulation
of the third pre trill note, because their ranges of variation are significantly different.
Table 3.2 Table showing significant results, from a Mann-Witney U test, between
Simabuggai and Sikabae populations.
Test variable U value Asymp Sig
(2 tailed)
Exact Sig
Notes per phrase 8.5 0.023 0.021
Maximum frequency of phrase 2.0 0.003 0.010
Frequency modulation of third pre trill note 8.0 0.021 0.021
Notes per pre trill 9.0 0.019 0.029
Maximum frequency of pre trill 0.0 0.001 0.000
Notes per trill 9.5 0.027 0.029
Duration of trill 8.0 0.021 0.021
Maximum frequency of post trill notes 5.0 0.008 0.006
Frequency modulation of first note after trill 6.0 0.011 0.009
Table 3.3 Table showing variables with a significant difference, from a Mann-Witney U
test, between Sipora and South Pagai populations.
Test variable U value Asymp Sig
(2 tailed)
Exact Sig
Duration of the pre-trill 2.0 0.012 0.010
Only one variable was found to be significantly different between Sipora and South
Pagai, table 3.3, therefore there are less defining factors between them than there are
between the Siberut populations.

30
3.5 Inter-population vocal variation
The degree of vocal variation amongst all four populations was examined using the
Kruskal-Wallis test and the results (table 3.4) from this show that there is a significant
difference (p<0.05) between them for nine variables, a highly significant difference
(p<0.001) between them for six variables and no difference (p>0.05) for the duration of
the post trill or for the minimum frequency of the post trill. Thus, the null hypothesis is
rejected; the vocalisation variables are different between the four populations.
Table 3.4 Table showing variables which are significantly different between all
populations sampled, using a Kruskal-Wallis test at 3 degrees of freedom.
Test Variable H Stat P value
Duration of phrase 11.651 0.009
Total number of notes in phrase 9.804 0.020
Minimum frequency of phrase 8.644 0.034
Maximum frequency of phrase 8.654 0.034
Number of notes pre trill 10.95 0.012
Duration of pre trill notes 10.470 0.015
Minimum frequency of pre trill notes 15.691 0.001
Maximum frequency of pre trill notes 13.220 0.004
Frequency modulation of second note 11.905 0.008
Frequency modulation of third note 7.959 0.047
Number of notes within trill 8.346 0.039
Duration of trill 7.898 0.048
Minimum frequency of trill 16.153 0.001
Maximum frequency of trill 7.887 0.048
Frequency modulation of first post trill note 10.580 0.014
Number of post trill notes 8.857 0.031
Duration of post trill notes 7.019 0.071
Minimum frequency of post trill notes 6.947 0.074
Maximum frequency of post trill notes 14.293 0.003
The variable minimum frequency of the trill was identified at the intra-individual and
intra-population level as being low in variation, yet this test reveals it to also be different
between the populations. These qualities make it an effective tool for identifying the
origin of an individual by vocalisations alone. The maximum frequency of the pre trill is
a variable that showed high coefficient values but it is also shown to be significantly
different between the four populations and is therefore a good discriminator too.

31
Results from a post hoc test, see table 3.5, show which pairs of populations differ for the
variables found to be significant different in the previous test. Note that no significant
differences were found between Sipora and South Pagai for any of the variables
measured; it is clearly harder to discriminate between these two populations using vocal
characteristics, supporting results from the initial Mann-Witney U test.
These results agree with those from the intra-island level; again the maximum frequency
of the whole phrase and the pre trill are different between Sikabae and Simabuggai. As
expected the majority of significant differences are between Sikabae and the southern
islands, Sipora and South Pagai, or Simabuggai and the southern islands.
Table 3.5. Showing the results of a post hoc analysis with a pair wise Mann-Witney U
test using the Bonferroni correction (p x number of comparisons, therefore p x 6).
Site Site Variable U Stat p Value
Sikabae Simabuggai Max. freq. of phrase 2.0 0.018
Max. freq. of pre trill 0.0 0.006
Sikabae Sipora Duration of phrase 5.0 0.048
No. notes per phrase 4.0 0.030
Min. freq. of trill 0.0 0.006
Freq. modulation of 2nd note pre trill 2.0 0.018
No. notes per pre trill 3.0 0.080
Duration of pre trill 2.0 0.018
Min. freq. of pre trill 1.0 0.012
Sikabae South Pagai Freq. modulation of 2nd note pre trill 2.0 0.048
Min. freq. of pre trill 1.0 0.030
Min. freq. of trill 2.0 0.048
Simabuggai Sipora Duration of phrase 3.5 0.042
Max. freq. of post trill 0.0 0.012
Freq. modulation of 1st note post trill 2.0 0.024
Simabuggai South Pagai Max. freq. of post trill 0.0 0.024
3.6 Discriminant Function Analysis
Out of the 19 variables for male Kloss’s trill phases subjected to the DFA analysis, five
were included in the discriminant model by the stepwise method. These variables (table
3.6) were the most efficient at distinguishing between the songs sampled from the four
populations. The standardised canonical discriminant function coefficients for these
variables are shown in table 3.7. They estimate the relative contribution of a variable to

32
the three discriminant functions, therefore the reclassification of individual gibbons to the
correct population (Konrad & Geissmann, 2006). Low absolute values indicate a small
relative contribution.
Table 3.6 Table showing the variables used for the DFA at each step
Variable Step
Minimum frequency of the trill 1
Maximum frequency of the post trill 2
Maximum frequency of the pre trill 3
Number of notes per phase 4
Duration of the post trill notes 5
Table 3.7 Table showing the standardised canonical discriminant function coefficients
for each discriminant function.
Function
Variables 1 2 3
No. notes per phase -1.119 -0.719 -0.219
Max. freq. pre trill 0.912 -0.031 -0.883
Min. freq. trill 0.924 0.136 0.785
Duration of post trill 1.001 0.042 0.882
Max. Freq. post trill -0.772 1.058 0.042
The DFA created three discriminant functions (one less than the number of populations,
grouping variable) and they vary in their ability for group separation. The first function
contains the highest discriminatory power and the last the lowest power. This power to
discriminate can be shown by the percent of ‘between groups variability’ attributable to a
particular function. The first function makes the highest contribution to separating the
four gibbon populations, by explaining 78.7% of the variability, whereas function 2
contributed just 15.5% and function 3 only 5.9%.
The discriminance scores of every individual gibbon are shown in figure 3.3, based on
the first and second discriminant function. The chart illustrates the degree of separation
between the mean scores of each population. The Sikabae and Simabuggai populations
are clearly defined as populations using both functions, but to separate them from the
Sipora and South Pagai populations the first function contributes most. It is less easy to

33
differentiate between Sipora and South Pagai, but the second discriminant function is
more useful here.
-6 -4 -2 0 2 4 6
Minimum frequency of trill
-3
-2
-1
0
1
2
3
4
Ma
xim
um
fre
qu
en
cy o
f p
os
t tr
ill
1
2
3
4
Sikabae
Simabuggai
Sipora
South Pagai
Group Centroid
Fig. 3.3 Chart showing the discriminant scores for all individual male Kloss’s gibbons
with their population identity shown by the relevant symbol shapes.
The overall percentage of original gibbon groups correctly classified to their population is
92.6% (table 3.8). For both populations in Siberut, Sikabae and Simabuggai, and for
South Pagai 100% of the cases were correctly assigned. For Sipora 71.4% of cases were
classified correctly. Cohen’s k demonstrates that the classification achieved is
significantly different from chance (k = 0.901, p < 0.000). These results demonstrate that
each population has its own set of distinguishing vocal characteristics in the trill phase
that differ to one another. Only 2 cases, 28.6%, were classified wrongly, these were
individuals from Sipora being placed into the South Pagai population, thus demonstrating
that these two populations are more similar to each other than found within the Siberut
populations.

34
The accuracy of the cross-validation (table 3.8) produces an overall percentage of 77.8%,
which is 14.8% lower than the original classification. Cohen’s k again shows how the
assigned results differ from chance (k = 0.703, p < 0.000), despite a decrease in accuracy.
100% of cases were still correctly assigned for Sikabae, however the values for
classifying the other populations decreased. Simabuggai was 85.7% correct, Sipora
57.1% and South Pagai 60% correct, suggesting that Sipora is the least distinct and
Sikabae the most distinct.
Table 3.8 Classification results of discriminant analysis. The original classification was
obtained when groups were classified by the functions derived from all groups (n). The
cross-validation was achieved by classifying each group by the function derived from all
groups other than that group (n-1). Site 1, Sikabae; 2, Simabuggai; 3, Sipora and 4, South
Pagai.
Predicted Group membership
Site 1.00 2.00 3.00 4.00
Total
8 0 0 0 8
0 7 0 0 7
0 0 5 2 7
0 0 0 5 5
100.0 .0 .0 .0 100.0
.0 100.0 .0 .0 100.0
.0 .0 71.4 28.6 100.0
Original Count 1.00
2.00
3.00
4.00
% 1.00
2.00
3.00
4.00 .0 .0 .0 100.0 100.0
8 0 0 0 8
0 6 0 1 7
0 0 4 3 7
0 0 2 3 5
100.0 .0 .0 .0 100.0
.0 85.7 .0 14.3 100.0
.0 .0 57.1 42.9 100.0
Cross- validated Count 1.00
2.00
3.00
4.00
% 1.00
2.00
3.00
4.00 .0 .0 40.0 60.0 100.0

35
4. DISCUSSION
This chapter discusses the results of the previous chapter and places them into the context
of the background information in chapter 1, starting at the level of variation within
individuals, within populations, within islands and then between populations and
discriminant function analysis. The features described in the qualitative section of the
results highlight the importance of being prepared to sample vocalisations at different
points in the daily cycle, not just peak times, and even after periods of heavy rain because
the Kloss’s gibbon clearly does vocalise at unexpected times.
4.1 Intra-individual vocal variation
The descriptive statistics illustrate that the degree of variation is relatively low (< 35%)
within individuals for many of the variables measured in the trill phrase, yet there are
several variables which are consistently low (< 10%) in variation amongst most
individuals, these are detailed in the results section 4.2. The amount of vocal variation
within individuals reflects which aspects are under strict selection pressure; if variables
are constant, therefore low in variation, they are likely to be the factors that convey
particular information pertaining to species and sex specific qualities, that do not need to
change. Variables that exhibit low variation (< 35%) are more likely to convey
information regarding current circumstances, such as mate status, health, unique
individual identification and a degree of individuality. Unstable variables (> 35%) are
likely to be less efficient for use in individual identification unless their range does not
overlap with that of conspecifics.
The difference in the amount of variation shown between the variables of the trill phrase
reinforces the idea that they are under varying degrees of selection pressure. It is
therefore logical to propose that some parts of the song are under stricter genetic control
than others.
Only eight individuals have variables with coefficient of variation values that are over
50%, and they are equally distributed between the four populations. For six males high

36
variation is expressed in the post trill variables. Other studies (Dallmann & Geissmann,
2001a, b; Mather, 1992) found that in female agile, silvery, and muelleri (H. agilis, H.
moloch & H. muelleri) gibbons the most variable part of the great call are the terminal
notes, analogous to the post trill notes of a male. It was proposed that this is because the
terminal notes are under the least amount of selective pressure. It is possible that this
relates to the Kloss’s gibbon too, although support from female vocalisation analysis
would be more comparable and therefore reliable.
One problem with this research is that although the terminal and post trill notes may
appear to be the most variable this could simply be an erroneous feature resulting from
data that is not representing the whole truth. It was noted in the field that the notes that
were most likely to be missed during recording are the terminal notes because they are
quieter and usually of a lower frequency. Despite being heard by ear they were not
necessarily picked up by recording equipment and thereby post trill notes were often
misrepresented in the analysis. Another issue with the study comparing female
vocalisations (Dallmann & Geissmann, 2001b) of different species, is that the data is
from a very small sample size that is unequal; 4 Kloss’s, 8 agile and 8 moloch, which are
analysed using a Kruskal-Wallis one way ANOVA with the post hoc Nemenyi test that
are particularly susceptible to small sample sizes and therefore less reliable.
Initial observations of table 3.1 does not appear to show any pattern of intra-individual
variation between the populations, but without using a statistical test it is impossible to be
sure whether they are definitely the same or different. In a study on female silvery
gibbons (Dallmann & Geissmann, 2001a) it was shown that there are significantly
different amounts of intra-individual variation between the populations. They proposed
that this is a consequence of varying population densities; if the population is small then
there is more opportunity for individuality to be expressed because there are fewer
individuals to identify, so the songs do not need to be as stable. However, the study does
not have any relevant population density figures and it has not been shown that silvery
gibbons are able to identify other individuals by their vocalisations; therefore this
explanation is merely speculation.

37
In summary, it is clear that some parts of the trill phrase are more variable than others and
that this reflects the degree of selection pressure and their function. This emphasises the
importance of focusing on all parts of the phrase, because it is not known which section is
species, subspecies, sex or individually specific without examining their degree of intra-
individual variation first.
4.2 Intra-population vocal variation
The variation of vocal features within populations is quite low, reflecting the pattern
found at the within individual level. Three variables that were the most constant at the
previous level are also constant at this level and the post trill variables are again the most
unstable. The bar chart reveals that the South Pagai population is the most varied for
twelve variables, this could be due to the smaller sample size for this population, or
perhaps it is just more varied.
Clearly vocal characteristics vary between individuals of a population; one purpose of
this is to inform other gibbons about their personal qualities. For example it has been
shown that male Kloss’s sing about seven times more often than females. This allows
neighbouring males to assess their competition because the lowest pitch they achieve
relates to their body size and consequently can aid decisions regarding engagement in
conflict (Whitten, 1984b). Therefore vocal qualities relate directly to ‘fitness’ and males
which are larger are likely to have more success in defending their territory and mates,
thus resulting in higher reproductive success compared to smaller males.
It is important that males are able to differentiate between other individuals, by
vocalisations (Tenaza, 1976), because it allows them to make appropriate responses to
neighbours and strangers, and it may also be used as a mechanism to avoid inbreeding by
recognising specific factors in family vocalisations when choosing mates (Dallmann &
Geissmann, 2001).

38
Variables that were shown to be constant at the intra-individual level and the intra-
population level are important, because if they can be shown to differ between the
populations, then accurate identification is possible.
4.3 Intra-island vocal variation
The results (table 3.2) from the Mann-Witney U test support a rejection of the null
hypothesis, there is a significant difference between the vocalisations of Simabuggai and
Sikabae. It is expected that gene flow between populations within an island is greater
than between populations on different islands. However, results reveal that the Siberut
populations are easier to differentiate from one another, than the two southern islands,
where only one variable was found to be significantly different. This suggests that the
two Siberut populations have either undergone or are undergoing allopatric
subspeciation. It is obvious that the further the distance between populations the lower
the degree of gene flow between them simply because individuals are more likely to
breed with close neighbours than distant individuals, but this alone does not explain the
significant vocal differences. Therefore, some additional factors must be at work, such as
dispersal prevention, potential barriers include the numerous rivers and mountain ranges
that characterise Siberut. Additionally, factors such as discontinuous tracts of forest
isolating populations and pressure from hunting may limit dispersal. However, it is not
possible to determine which of these is responsible because no detailed maps for the
region can be accessed and none accurately display relevant geographic features
throughout their history. These findings were replicated in post-hoc tests from the inter-
population level, where two variables were again shown to be significantly different.
Two variables, maximum phrase frequency and notes per pre trill, which were illustrated
to be constant at the previous levels, are significantly different between the two Siberut
populations, which makes them efficient discriminators of individual origin. Thus
highlighting the importance of looking at the degree of vocal variation at all levels.
Only one significant vocal difference was found between the Sipora and South Pagai
populations, this indicates that there is still a degree of gene flow between the populations

39
or that there has been until quite recently. The reasons behind this are discussed fully in
the next section.
Overall the results illustrate that there is a clear difference between the vocalisations of
the two Siberut populations, and limited differences between the Southern islands. The
next step is to compare differences between all four populations.
4.4 Inter-population vocal variation
The results from the Kruskal-Wallis test for many of the variables are significant at the
0.05 level (table 3.4) therefore the null hypothesis of no difference in vocalisations
between the four populations is rejected. As expected there are major differences between
Siberut and the two southern island populations, this is caused by a lack of dispersal from
the most northern island to the southern islands. The straits of water between the
Mentawai islands are difficult to cross due to the strong currents, caused by the Indian
Ocean, thus making dispersal by rafting virtually impossible (Dring, 1990; Whittaker,
2005). Even people travelling between the Mentawai Islands return to mainland Sumatra
first, before going travelling back out to another island.
In a similar study it is proposed that the importance of vocal differences between
populations of female silvery gibbons (H. moloch) actually indicate subspecies. It was
found that variables in the first part of the great call were the most ideal for individual
identification (Dallmann & Geissmann, 2001b). Therefore it is possible to suggest that
the differences found between Siberut and the other islands are also indicative of a
subspecies division.
It is odd that the two southern populations are less different to one another than the two
Siberut populations. It suggests that there is a degree of gene flow between the southern
islands despite the large distance and barriers separating them, or that there has been until
very recently. Sea levels between the islands are approx 10-25m deep but 7000 years ago
sea levels were even lower between the four islands and they formed a single continuous
landmass, therefore it is possible that gene flow was maintained till then. However, this

40
does not explain why differences within Siberut should be greater than differences
between the southern islands. It is not a viable proposal that dispersal between these two
islands has been maintained by human intervention and the pet trade, because it is
notoriously difficult to release gibbons successfully back into the wild (Cheyne & Brule,
2004). Alternatively, it could just be due to the small sample size or that they differ in
characteristics not measured in this analysis.
Limitations of the Kruskal-Wallis test are that the different levels cannot be compared,
for example within and between individuals, within and between populations. This would
be desirable because it would allow researchers to identify whether vocal variation is
lower within populations than between populations, thus demonstrating that they are
different subspecies. One method that has been designed by Dallmann & Geissmann
(2001) to do this is the Mean Pairwise Difference (MPD) of scaled variables. It was
found that inter-individual variability is significantly higher than intra-individual
variability, and that intra-population variability is lower than inter-population variability
in the female silvery gibbon (H. moloch). This test could be applied to the Kloss’s
vocalisations in the future to support findings from this analysis.
Results from the Kruskal-Wallis and post hoc analysis show that there are three distinct
units; the Sikabae population, Simabuggai population and a Southern population covering
Sipora and South Pagai islands and each of them have a unique set of vocal
characteristics defining them from the other units. These groups must have arisen by
allopatric speciation; this is where populations can not interbreed with others due to an
inability or opportunity to disperse. In time the populations diverge genetically through
random genetic events and in relation to selection pressures and these differences are
reflected in their phenotypic traits such as vocalisations.
4.5 Discriminant function analysis
The discriminant function analysis demonstrates that it is possible to differentiate
between the four populations of Kloss’s gibbons sampled using the trill phrases of their
vocalisations at a highly accurate level of 92.6% (percentage of individuals correctly

41
classified to their populations). This suggests that there is a high degree of vocal diversity
amongst the sampled populations of male Kloss’s gibbons. Therefore, the populations
must differ in their expression of population-specific vocal characteristics.
The 7.4% which were wrongly assigned were all from the Sipora population and placed
into the South Pagai population, this could be due to the small sample size of South Pagai
which may be less representative of their variation and therefore more difficult to
distinguish between the two. This pattern is not however unexpected; it was anticipated
that the populations of Sipora and South Pagai would be more similar to each other, yet
easily differentiated from Siberut populations because this follows the pattern of other
endemic primate subspecies distributions. In contrast to expectations, the Simabuggai and
Sipora populations are more easily distinguished than expected, supporting results from
the Kruskal-Wallis and post-hoc test. Overall the results from the all the analysis support
a split of the Kloss’s gibbon into three distinct units; two in Siberut and one on Sipora
and South Pagai. It is unfortunate that no populations could be sampled in North Pagai,
but it is highly likely, due to its close proximity to South Pagai and Sipora that the vocal
characteristics are more similar to these populations than to Siberut’s populations.
Variation in vocalisations has also been successfully used to distinguish populations in
the gibbon genus Nomascus. It was found, through using discrimination analysis, that
there was a significant difference between populations in South and North Cambodia,
thereby resulting in a newly suggested taxonomic grouping with N. Gabrielle in the south
and N. l. siki in the North. In this example it is likely that dispersal between these
different populations is prevented by geographical barriers, such as the mountain range,
thus resulting in allopatric subspeciation (Konrad & Geissmann, 2006).
Discriminant analysis has also been used on vocalisations on the Thomas langur
(Presbytis thomasi) where researchers showed that 95.6% of individuals could be placed
into their correct populations (Wich et al. 2003). This evidence adds support to findings
from the male Kloss’s gibbon that vocal variation can be a valid discriminator of

42
population differences and subspecies distributions and confirms that the DFA is a valid
choice of statistical test.
4.6 Other evidence of Kloss’s subspeciation
Despite the lack of fur colour variation in the Kloss’s gibbon, other morphological
evidence supports the DFA results of a subspecies classification. Usually in gibbons the
hair on the outer side of the forearm flows towards the wrist except in siamangs where it
flows towards the elbow. Interestingly the hair of Kloss’s gibbons in Sipora flows to the
elbow but in Siberut it flows towards the wrist, this may be indicative of the subspecies
differences too (Chasen & Kloss, 1927; Groves, 2001).
Although vocal data supports a division of the Kloss’s into subspecies, it is uncertain
whether these phenotypic differences are supported by differences in their genotype.
Research (Whittaker et al. 2004; Whittaker, 2005) on the D-loop of mitochondrial DNA,
suggested that there are no subspecies divisions between the islands and that these
populations have not been separated long enough for lineage sorting to occur. However, a
small sample size was used and no comparative study was done on the other three
primate species to determine whether subspecies differences are shown in that area of
mtDNA. A study on a fragment from the mitochondrial cytochrome b gene of Mentawai
macaques supported the morphological evidence and separates it into two subspecies
because variation within the populations was low whilst variation between populations
was high (Roos et al, 2003). So perhaps there is genetic evidence yet to be analysed in a
region which highlights significant differences and subspecies divisions for the Kloss’s.
An alternative idea is that variation is not reflected in the genotypes of Kloss’s gibbons
yet because of the short time span allowed for genetic divergence. The average
generation time for macaque species is 54 months (Harvey et al 1987) whereas the
average generation time for hylobatids is 110 months. So, for every 1000 years of
separation this equals 222 generations for macaques and just 110 for gibbons and the
islands have been separated for approximately 7000 years (Whittaker, 2005). Therefore,
although these endemic primate species share the same biogeographical history, it is

43
possible that different degrees of lineage sorting have occurred and this is why no
significant differences in genetic material have been detected.
The differences that have been shown between the populations would not be suitable for
discriminating individual identity on the basis of just listening to the vocalisations; this is
because the most efficient functions are frequency based. However, individual
identification can be achieved by comparing vocalisations to the data already presented.
Although this is a lengthier process it is still a potentially important tool in conservation,
especially since there are no comparable morphological traits available that represent the
three different subspecies populations of the Kloss’s gibbon (Geissmann, 1995).
Based on their vocal diversity it is clear that there are three distinct units of the Kloss’s
gibbon, two within Siberut and the third on Sipora and South Pagai, this is demonstrated
by results from the post hoc test of Kruskal-Wallis and the discriminant function analysis.
Evidence from vocalisations of male Kloss’s gibbons therefore supports their division
into three distinct subspecies. Although, speculative, the most likely cause of this
variation are dispersal barriers leading to allopatric speciation.

44
5. CONCLUSION
5.1 Conclusion
In respect to the initial objectives formed in the introduction, 1, there are significant
differences in the trill phrase of the male’s vocalisation between Siberut and the southern
populations. 2 vocal differences within Siberut are equal to differences between Siberut
and the southern islands, and there are few differences between the southern islands. 3,
these vocal differences can be used to predict provenience of singing Kloss’s gibbons at
an accuracy of 92.6% using discriminant function analysis. 4, the vocal differences that
exist would not allow discrimination by trained observers without using sound and
statistical analysis because the best discriminators are frequency based measurements.
5.2 Further research
It is possible that other vocal differences exist between the populations that could be
exploited to allow discrimination simply by listening, only the last phrase of the males
vocalisations were analysed and there are potentially more differences in the initial
phrases.
It is clear that male Kloss’s gibbons exhibit some individuality in their vocalisations, but
it is not known whether they remain stable over time. Neither is it known if male Kloss’s
gibbons are able to differentiate between conspsecifics and strangers. Therefore, the
vocalisations that have already been collected could be used in playback experiments to
investigate both of these features and determine which constant variables are the sex and
species specific characteristics.
Alternatively, there is potential for vocalisations studies on the other Mentawai primates
with the aim of determining levels of diversity and therefore continuing the investigation
into the subspecies debate. Finally, a study of captive Kloss’s gibbons has the potential to
discover their subspecies origin, possibly looking at hybridisation and its effects on vocal
characteristics and to provide a comparison to their wild counterparts.

45
REFERENCES
Ahsan, M. F., (2001). Socio-ecology of the Hoolock Gibbon (Hylobates hoolock) in two
forests of Bangladesh. In: The Apes: Challenge for the 21st Century, Brookfield
Zoo, Chicago. Pp 286-299.
Anon, (2005). <www.tsunamirelief.org> Downloaded on the 04/01/2005.
Avise, J. C., & Ball, R. M., (1991). Principles of genealogical concordance in species
concepts and biological taxonomy. In: Subspecies, Populations & Gene flow;
Possible roles in the Conservation Management of the Florida Panther. Working
group meeting, 30th-31st May, 1991. National Zoo, Washington DC.
Bearder, S., (2004). MSc Methods (1) How to study calls. Information on a tape
regarding methods for recording.
Bernstein, I. S., & Schusterman, R. J., (1964). The activity of gibbons in a social group.
Folia Primatologica 2: 161–170.
Brandon-Jones, D., (1993). The taxonomic affinifties of the Mentawai Islands, Sureli,
Presbytis potenziani. Raffles Bulletin of Zoology 41 (2): 331-357.
Brandon-Jones, D., Eudey, A. A., Geissmann, T., Groves, C. P., Melnick, D. J., Shekelle,
M., & Stewart, C. B., (2004). Asian primate classification. International Journal
of Primatology 25 (1): 97-164.
Brockelman, W.Y., (1984). Social behaviour of gibbons. Edinburgh University Press,
Edinburgh. Pp 285-290.
Brockelman, W. Y., Reichard U., Treescon, U., & Raemakers, J. J., (1998). Dispersal,
pair formation and social structure in gibbons (Hylobates lar). Behaviour, Ecology
and Socio-biology 42:329-339.
Brockelman, W. Y., & Srikosamateras, (1993). Estimating density of gibbon groups by
use of the loud songs. American Journal of Primatology 29: 93-108.
Brockelman, W. Y., & Schilling, D., (1984). Inheritance of stereotyped gibbon calls.
Nature 312: 634-636.
Buckley, C., (2004). Survey of Hylobates agilis albibarbis in unprotected primary peat
swamp forest: Sebangau catchment area, Central Kalimantan. Unpublished.
Chasen, F. N., & Kloss, C. B., (1927). Spolia Mentawiensis – Mammals. Proceedings of
the Zoological society of London 1: 797-840.
Cheyne, S., & Brule, A., (2004). Adaptation of a captive-raised gibbon to the wild. Folia
Primatologica 75: 37-39.
Chivers, D. J., (1984). Feeding and ranging in gibbons: A summary. In: Preuschoft, H.
H., Chivers, D. J., Brockelman, W. Y., & Creel, N., (Eds.) The lesser apes:
evolutionary and behavioural ecology. Edinburgh University Press. Pp 267-281.
Chivers, D. J., (1977). The lesser apes. In: Prince Rainier and Bourne G.H. (Eds.) New
York Academic Press, NY, Primate Conservation. Pp 539-594.
Chivers, D. J., & Gittins, S. P., (1978). Diagnositic features of gibbon species.
International Zoo YB 18: 157-164.
CITES (2003). Appendix 1< www.cites.org >Downloaded on 16/10/2004.
Cowlishaw, G., (1992). Song functions in gibbons. Behaviour 121: 131-153.

46
Cowlishaw, G., & Dunbar, R., (2000). Primate conservation biology. The University of
Chicago Press.
Dallmann, R., & Geissmann, T., (2001a). Different levels of variability in the female
song of wild silvery gibbons (Hylobates moloch). Behaviour 138: 629-648.
Dallmann, R., & Geissmann, T. (2001b). Individuality in the female songs of wild silvery
gibbons (Hylobates moloch) on Java, Indonesia. Contributions to Zoology 70: 41-
50.
Dring, J. C., McCarthy, C. J., & Whitten, A. J., (1990). The terrestrial herptofauna of the Mentawai Islands, Indonesia. Indo-Malayan Zoology 6: 119-132.
Fleagle, J. G., (1999). Primate adaptation and evolution, 2nd edition. Academic Press,
San Diego & London.
Fowler, J., Cohen, L., & Jarvis, P., (1998). Practical statistics for field biology, 2nd
Edition. Wiley & Sons Ltd.
Fuentes, A., (1996). Feeding and Ranging in the Mentawai Island langur (Presbytis
potenziai). International Journal of Primatology 17 (4): 525-548.
Fuentes, A., (1996/1997). Current status and future viability for the Mentawai primates.
Primate Conservation 17: 11-116.
Geissmann, T., (In press). The male song of the Javan silvery gibbon (Hylobates moloch).
Contributions to Zoology (In press).
Geissmann, T., (2005). Hylobates klossi sonograms <www.gibbons.de> Downloaded on
the 04/09/2005.
Geissmann, T., (2003a). Tape recording primate vocalisations. In: Setchell, J. M., Curtis,
D. J., (Eds.) Field and Laboratory Methods in Primatology, A Practical Guide.
Cambridge, Cambridge University Press. Pp 228-238.
Geissmann, T., (2003b). Circumfacial markings in siamang and evolution of the face ring
in the hylobatidae. International Journal of Primatology 24 (1): 143-158.
Geissmann, T. (2002a). Duet-splitting and the evolution of gibbon songs. Biological
Reviews 77: 57-76.
Geissmann, T., (2002b). Gibbons: communication, radiation and conservation biology of
the forgotten apes. Habilitationsschrift zur Erlangung der venia legendi für das
Fachgebiet Zoologie an der Tierärztlichen Hochschule Hannover, Germany.
Geissmann, T., (2002c). Taxonomy and evolution of gibbons. In: Soligo, C.,
Anzenberger, G., & Martin, R. D., (Eds.) Anthropology and Primatology into the
third millennium: The Centenary Congress of the Zurich Anthropoligical Institute
(Evolutionary Anthropology Vol. 11, Supplement 1). Wiley-Liss, New York. Pp
28-31.
Geissmann, T., (2000a). Duet songs of the siamang, Hylobates syndactylus. 1. Structure
and organisation. Primate Report 56: 33-60.
Geissmann, T., (2000b). Gibbon songs and human music from an evolutionary
perspective. In: Wallin, N.L., Merker, B., & Brown, S. (Eds.) The origins of
music. MIT Press, Cambridge, Massachusetts. Pp 103-123.
Geissmann, T. (1993). Evolution of communication in gibbons (Hylobatidae), Ph.D.
thesis, Anthropological Institute, Philosoph. Faculty II, Zürich University.

47
Geissmann, T., (1984). Inheritance of song parameters in the gibbon song, analyzed in 2
hybrid gibbons (Hylobates pileatus x H. lar). Folia Primatologica 42: 216-235.
Geissmann, T., & Orgeldinger, M., (2000). The relationship between duet songs and pair
bonds in siamangs, Hylobates syndactylus. Animal Behaviour 60: 805-809.
Geissmann, T., & Nijman, V., (1999). Singing behaviour of the silvery gibbon
(Hylobates moloch) in Central Java, Indonesia. Primate Report 54: 18-19
(Abstract only).
Gittins, S. P., (1984). Territorial advertisement and defence on gibbons. In: Preuschoft,
H. H., Chivers, D. J., Brockelman, W. Y., & Creel, N., (Eds) The Lesser Apes:
evolutionary and behavioural ecology. Edinburgh University Press. Pp 420-424.
Gittins, S. P., (1978). Hark! The beautiful song of the gibbon. New Scientist 80: 832-834.
Groves, C. P., (2001). Primate taxonomy, Smithsonian Institution, Washington, D.C.
Haimoff, E. H., (1984). Chapter 29, Acoustic and organizational features of gibbon
songs. In: Preuschoft, H.H., Chivers, D. J., Brockelman, W. Y., & Creel, N.,
(Eds.) The lesser apes: evolutionary and behavioural ecology. Edinburgh
University Press.
Haimoff, E. H., & Gittins, S. P., (1985). Individuality in the songs of wild agile gibbons
(Hylobates agilis) of Peninsular Malaysia. American Journal of Primatology 8:
239-247.
Haimoff, E. H., & Tilson, R. L. (1985). Individuality in the female songs of wild Kloss'
gibbons (Hylobates klossii) on Siberut Island, Indonesia. Folia Primatologica 44:
129-137.
Harvey, P. H., Martin R. D., & Clutton-Brock, T. H., (1987). Life histories in
comparative perspective. In: Smuts, B. B., Cheney, D. L., Seyfarth, R. L.,
Wrangham, R. W., & Struhsaker, T, T., (Eds.) Primate Societies. University of
Chicago Press: 181-196.
IUCN, 2003. 2003 IUCN Red List of Threatened Species. <www.redlist.org>.
Downloaded on 11/10/2004.
Kappeler, M., (1984). Vocal bouts and territorial maintenance in the moloch gibbon. In:
Preuschoft, H., Chivers, D. J., Brockelmann, W. Y., & Creel, N., (Eds) The lesser
apes. Evolutionary and behavioural biology. Edinburgh, Edinburgh University
Press. Pp 376-389.
Konrad, R., & Geissmann, T., (2006). Vocal diversity and taxonomy of the crested
gibbons (Genus Nomascus) in Cambodia. International Journal of Primatology
27: In press.
Konrad, R., & Geissmann, T., (2004). Vocal diversity and taxonomy of crested gibbons
(Nomascus spp.) in Cambodia. Folia Primatologica 75, Supplement 1: 288-289
(Abstract only).
Kranzler, G., & Moursund, J., (1999). Statistics for the terrified, 2nd Edition. Prentice-
Hall Inc. Pp 125-130.
Lehner, P. N., (1996). Data collection equipment. In: Handbook of ethological methods,
2nd Edition. Cambridge University Press. Pp 267–284.
Marshall, J. T., and Sugardjito, J. (1986). Gibbon systematics. In Swindler, D. R., &
Erwin, J. (Eds.) Comparative primate biology, vol. 1: Systematics, evolution, and
anatomy, Alan R., Liss, New York, pp. 137-185.

48
Mather, R., (1992). A field study of hybrid gibbons in central Kalimantan, Indonesia.
PhD thesis, Cambridge University. Unpublished.
McConkey, K. R., (2000). Primary seed shadow generated by gibbons in the rainforests
of Barito Ulu, Central Borneo. American Journal of Primatology 52 (1): 13-29.
Mitani, J. C., Hunley, K. L., & Murdoch, M. E., (1999). Geographic variation in the calls
of wild chimpanzees: A reassessment. American Journal of Primatology 47: 133-
151.
Mitani, J. C., (1987). Species discrimination of male song in gibbons. American Journal
of Primatology 13: 413-423.
Morris, R. C., (1943). Rivers as barriers to the distribution of gibbons. Journal of the
Bombay Natural History Society 43: 656.
Nietsch, A., & Kopp, M., (1998). Role of vocalizations in species differentiation of
Sulawesi tarsiers. Folia Primatologica 69: 371-378.
Notman, H., & Rendall, D., (2005). Contextual variation in chimpanzee pant-hoots and
its implications for referential communication. Animal Behaviour 70: 177-190.
O’Brien, S. J., & Mayr, E., (1991). Bureaucratic Mischief: Recognising Endangered
Species and Subspecies. In: Subspecies, Populations & Gene flow; Possible roles
in the Conservation Management of the Florida Panther. Working group meeting,
30th-31st May, 1991. National Zoo, Washington DC.
Parsons, R. E., (1941). Rivers as barriers to the distribution of gibbons. Journal of the
Bombay Natural History Society 42: 926.
Parsons, R. E., (1940). Rivers as barriers to the distribution of gibbons. Journal of the
Bombay Natural History Society 42: 434.
Roos, C., & Geissmann, T., (2001). Molecular phylogeny of the major hylobatid
divisions. Molecular Phylogenetics and Evolution 19 (3): 486-494.
Roos, C., Ziegler, T., Hodges. J. K., Zischler, H., & Abegg, C., (2003). Molecular
phylogeny of Mentawai macaques. Taxonomic and biogeographic implications.
Molecular Phylogenetics and Evolution 29 (1):139-150.
Rowe, N., (1996). The Pictorial Guide to The Living Primates. Pogonias Press, East
Hampton, New York. Pp 210-211.
Scholfield, P., (2005). Statistics <privatewww.essex.ac.uk/~scholp/kw_posthoc.htm>
Downloaded on the 15/11/2005.
Schultz, A. H. (1933). Observations on the growth, classification and evolutionary
specialization of gibbons and siamangs. Human Biology 5: 212-255, 385-428.
Short, J. C., (2004) A preliminary study of the songs of hybrid gibbons (Hylobates agilis
x H. muelleri) in Kalimantan, Indonesia. Unpublished.
Siegel, S., & Castellan N. J., (1988). Nonparametric statistics for the Behavioural
Sciences, 2nd Edition. McGraw-Hill Book Co.
Stanford, C., (2001). The subspecies concept in primatology: The case of mountain
gorillas. Primates 42 (4): 309-318.
Tenaza, R., (1985). Songs of hybrid gibbons (Hylobates lar x H. muelleri). American
Journal Primatology 8: 249-253.
Tenaza, R., (1976). Songs, choruses and countersinging of Kloss gibbons (Hylobates
klossii) in Siberut Island, Indonesia. Zeitschrift Fur Tierpsychologie 40: 37-51.

49
Tenaza, R., (1975). Territory and monogamy among Kloss gibbons (Hylobates klossii) in
Siberut Island, Indonesia. Folia Primatologica 24: 60-80.
Tenaza, R. R., & Hamilton, W. J., (1971). Preliminary observations of the Mentawai
Islands gibbon, Hylobates klossii. Folia Primatologica 15: 201-211.
Tenaza, R., & Tilson, R. L., (1985). Human predation and Kloss’s gibbon (Hylobates
klossii) sleeping trees in Siberut Island, Indonesia. American Journal of
Primatology 8: 299-308.
Tenaza, R. R., & Tilson, R. L., (1977). Evolution of long-distance alarm calls in Kloss’s
gibbon. Nature, 268: 233-235.
Thorpe, W. H., (1961). Bird-song: the biology of vocal communication and expression in
birds, Cambridge University Press, Cambridge. Pg15
Tilson, R. L., & Tenaza, R. R., (1982). Interspecific spacing between gibbons (Hylobates
klossii) and langurs (Presbytis potenziani) on Siberut Island, Indonesia. American
Journal of Primatology 2: 355-361.
Voris, H. K., (2000). Maps of Pleistocene sea levels in Southeast Asia; shorelines, river
systems and time durations. Journal of Biogeography 27: 1153-1167.
Whittaker, D. J., (2005). Evolutionary genetics of Kloss’s gibbons (Hylobates klossii):
systematics, phylogeography and conservation. Dissertation <www.burroughs-
whittaker.com/danielle> Downloaded on the 01/10/2005
Whittaker, D. J., Morales, J. C., and Melnick, D. J., (2004). Phylogeographic structure of
Kloss's gibbon (Hylobates klossii) populations. Folia Primatologica 75,
Supplement 1: 113 (Abstract only).
Whitten, A. J., (1984a). Ecological comparisons between Kloss gibbons and other small
gibbons. In: Preuschoft, H., Chivers, D. J., Brockelman, W. Y., & Creel, N.,
(Eds.) The lesser apes. Evolutionary and behavioural biology, Edinburgh
University Press, Edinburgh, Pp. 219-227.
Whitten, A. J., (1984b). The trilling handicap in Kloss gibbons. In: Preuschoft, H.,
Chivers, D. J., Brockelman, W. Y., & Creel, N., (eds.), The lesser apes.
Evolutionary and behavioural biology, Edinburgh University Press, Edinburgh,
Pp 416-419.
Whitten, A. J., (1982a). Diet and feeding behaviour of Kloss gibbons on Siberut Island,
Indonesia. Folia Primatologica 37: 177-208.
Whitten, A. J., (1982c). A numerical analysis of tropical rainforest, using floristic and
structural data, and its application to an analysis of gibbon ranging behaviour.
Journal of Ecology 70: 249-271.
Whitten A. J., (1981). The ecology of singing in Kloss Gibbons (Hylobates klossii) on
Siberut Island, Indonesia. International Journal of Primatology 3 (1): 33–51
Whitten, T., (1982a). The ecology of singing in Kloss gibbons (Hylobates Klossii) on
Siberut Island, Indonesia. International Journal of Primatology 3: (1) 33–51.
Whitten, T., (1982b). The Gibbons of Siberut. Dent & Sons Ltd., London and Toronto.
Wich, S., Kosk, S., Vries, H., & Schaik, C. P., (2003). Individual and contextual variation
in Thomas langur male loud calls. Ethology 109 (1): 1-1.
Wikipedia, (2005). Free encyclopedia <www.en.wikipedia.org/wiki/subspecies>
Downloaded on the 16/09/2005

50
Appendix 1 – Table showing the average measurements for each variable for every male Kloss’s sampled
whole phase pre trill
Site Individual duration no notes
min freq
max freq
2nd freq mod
3rd freq mod
no notes duration
min freq
max freq
Sikabae m2 5.25 11.3 603.75 1645.39 911.06 802.71 3.6 2.82 686.95 1647.15
m4 5.69 10.8 595.08 1633.63 911.23 759.83 4.0 2.58 685.30 1633.63
m3 5.91 11.6 540.79 1700.27 1023.81 950.48 3.8 3.31 630.31 1695.41
bert 7.68 15.5 551.25 1685.60 889.95 950.95 5.0 3.64 734.60 1685.60
boris 9.89 17.0 676.55 1732.65 885.50 1005.45 5.5 4.19 727.10 1732.65
bob 5.61 13.0 548.98 1659.05 973.00 823.58 4.5 2.30 675.45 1659.05
basco 6.16 11.0 548.78 1662.50 864.56 850.06 3.7 3.83 699.96 1662.50
beck 5.39 10.7 618.66 1622.47 858.83 849.82 3.7 2.73 710.18 1618.62
Simabuggai s2 7.33 15.2 505.06 1635.49 943.00 856.06 4.6 3.28 608.62 1618.05
gerald 8.15 16.1 538.51 1597.56 586.19 718.94 5.3 5.57 647.25 1597.56
jim 8.07 18.5 641.95 1407.55 537.18 677.38 6.5 4.69 719.60 1407.55
a6 7.81 15.8 476.00 1532.95 874.80 848.55 5.0 3.20 616.95 1532.95
jon 7.19 16.6 560.70 1507.24 892.56 706.56 4.8 3.02 614.44 1507.24
tod 5.56 14.4 570.30 1567.93 818.28 700.93 5.0 2.72 716.80 1556.11
sid 5.44 13.6 563.56 1544.66 843.52 692.16 5.2 2.60 686.14 1544.66
Sipora male4 11.03 16.7 481.19 1529.52 696.77 837.84 6.2 6.60 499.13 1521.77
male9 11.49 17.4 458.74 1733.41 557.68 810.02 5.9 6.21 566.74 1568.91
male8 7.59 15.8 617.30 1499.33 693.85 732.00 5.5 3.85 647.35 1502.87
male7 10.47 18.8 525.87 1503.30 698.08 726.25 6.2 3.99 599.43 1503.30
male5 8.48 17.0 472.36 1503.38 806.70 813.44 6.2 4.53 538.34 1503.38
male2 8.15 18.5 513.82 1729.53 871.72 1108.10 5.7 4.48 547.82 1728.32
male6 8.53 15.8 454.80 1370.86 649.92 790.95 5.8 5.04 503.69 1366.14
South male9 6.64 9.0 594.70 1390.07 333.30 0.00 2.0 2.68 619.67 1274.30
Pagai male8 6.21 14.3 541.55 1479.50 630.00 590.90 5.0 3.31 661.63 1468.90
male5 8.34 15.3 524.70 1438.95 696.45 694.60 4.3 3.45 565.95 1396.55
male2 9.06 21.2 513.28 1506.14 810.98 752.50 6.8 3.83 572.24 1506.16
male1 10.58 18.3 429.73 1694.28 878.34 1085.30 4.8 4.18 502.28 1650.94

51
Appendix 1 Cont. – Table showing the average measurements for each variable for every male Kloss’s sampled
trill post trill
Site Individual no notes duration
min freq
max freq notes duration min freq max freq 1st note
Sikabae m2 6.0 0.80 783.54 1187.25 1.6 1.60 625.08 1341.40 696.27
m4 5.0 0.70 787.10 1165.65 1.8 2.37 640.90 1218.10 586.93
m3 6.2 0.83 760.07 1207.29 1.6 1.78 532.92 1341.55 751.47
bert 9.0 1.18 757.10 1221.85 1.5 2.90 562.20 1251.85 637.15
boris 9.0 1.03 749.60 1244.35 3.0 4.70 599.70 1318.20 764.60
bob 6.8 0.84 783.48 1147.00 1.8 2.49 564.23 1086.25 495.50
basco 5.8 0.80 796.75 1205.35 1.5 1.49 554.39 1136.28 538.22
beck 5.3 0.75 799.60 1172.72 1.7 1.84 646.33 1280.97 528.11
Simabuggai s2 8.8 1.17 708.16 1237.31 1.9 2.81 508.85 1104.01 518.88
gerald 9.0 1.19 742.88 1136.21 1.9 2.51 553.25 1018.93 427.24
jim 9.8 1.07 790.65 1179.90 2.3 2.30 649.35 1089.25 357.75
a6 9.0 1.10 714.40 1114.83 1.8 3.51 470.83 1099.95 520.20
jon 10.0 1.08 770.34 1163.38 1.8 3.17 564.68 1179.26 602.60
tod 7.4 0.93 767.70 1190.69 2.0 2.03 562.21 1063.55 394.91
sid 6.8 0.95 762.84 1161.18 1.6 1.89 555.84 1037.62 390.90
Sipora male4 8.0 1.28 663.91 1077.28 2.3 3.11 509.29 1261.18 668.68
male9 8.3 1.17 726.23 1177.76 3.3 3.99 522.60 1499.53 824.30
male8 7.8 1.02 725.87 1161.68 2.5 2.77 614.37 1273.75 552.83
male7 6.8 1.04 626.82 1139.60 5.8 5.55 467.18 1357.97 681.30
male5 7.0 0.90 679.34 1104.02 3.8 3.05 506.92 1280.58 580.84
male2 10.3 1.04 689.58 1170.42 2.5 2.63 564.50 1357.58 670.27
male6 7.5 0.84 615.38 1132.08 2.3 2.62 496.07 1219.32 631.78
South male9 4.7 1.25 669.63 1049.40 2.3 2.78 574.70 1214.37 486.43
Pagai male8 7.3 0.85 758.00 1168.75 2.0 2.02 524.73 1242.95 527.40
male5 7.3 0.95 722.13 1116.28 3.5 3.54 548.88 1295.15 644.65
male2 8.0 1.00 739.72 1206.18 4.6 4.26 476.76 1357.00 755.36
male1 7.2 1.08 674.08 1132.82 6.3 5.41 443.59 1659.36 1004.27