Disruption Response Support For Inland Waterway Transportation
223
University of Arkansas, Fayeeville ScholarWorks@UARK eses and Dissertations 8-2014 Disruption Response Support For Inland Waterway Transportation Jingjing Tong University of Arkansas, Fayeeville Follow this and additional works at: hp://scholarworks.uark.edu/etd Part of the Industrial Engineering Commons is Dissertation is brought to you for free and open access by ScholarWorks@UARK. It has been accepted for inclusion in eses and Dissertations by an authorized administrator of ScholarWorks@UARK. For more information, please contact [email protected], [email protected]. Recommended Citation Tong, Jingjing, "Disruption Response Support For Inland Waterway Transportation" (2014). eses and Dissertations. 2218. hp://scholarworks.uark.edu/etd/2218
Transcript of Disruption Response Support For Inland Waterway Transportation

University of Arkansas, FayettevilleScholarWorks@UARK
Theses and Dissertations
8-2014
Disruption Response Support For InlandWaterway TransportationJingjing TongUniversity of Arkansas, Fayetteville
Follow this and additional works at: http://scholarworks.uark.edu/etd
Part of the Industrial Engineering Commons
This Dissertation is brought to you for free and open access by ScholarWorks@UARK. It has been accepted for inclusion in Theses and Dissertations byan authorized administrator of ScholarWorks@UARK. For more information, please contact [email protected], [email protected].
Recommended CitationTong, Jingjing, "Disruption Response Support For Inland Waterway Transportation" (2014). Theses and Dissertations. 2218.http://scholarworks.uark.edu/etd/2218

Disruption Response Support For Inland Waterway Transportation

Disruption Response Support For Inland Waterway Transportation
A dissertation submitted in partial fulfillment of the requirements for the degree of Doctor of Philosophy in Engineering
by
Jingjing Tong Dalian Maritime University
Bachelor of Science in Transportation Management, 2007 Cardiff University
Master of Science in International Transport, 2009
August 2014 University of Arkansas
This dissertation is approved for recommendation to the Graduate Council. ________________________ Dr. Heather Nachtmann
Dissertation Director
________________________ ________________________ Dr. Justin Chimka Dr. Edward Pohl Committee Member Committee Member
________________________ Dr. Suzanna Long Committee Member

Abstract
Motivated by the critical role of the inland waterways in the United States’ transportation
system, this dissertation research focuses on pre- and post- disruption response support when the
inland waterway navigation system is disrupted by a natural or manmade event. Following a
comprehensive literature review, four research contributions are achieved. The first research
contribution formulates and solves a cargo prioritization and terminal allocation problem
(CPTAP) that minimizes total value loss of the disrupted barge cargoes on the inland waterway
transportation system. It is tailored for maritime transportation stakeholders whose disaster
response plans seek to mitigate negative economic and societal impacts. A genetic algorithm
(GA)-based heuristic is developed and tested to solve realistically-sized instances of CPTAP.
The second research contribution develops and examines a tabu search (TS) heuristic as an
improved solution approach to CPTAP. Different from GA’s population search approach, the TS
heuristic uses the local search to find improved solutions to CPTAP in less computation time.
The third research contribution assesses cargo value decreasing rates (CVDRs) through a Value-
focused Thinking based methodology. The CVDR is a vital parameter to the general cargo
prioritization modeling as well as specifically for the CPTAP model for inland waterways
developed here. The fourth research contribution develops a multi-attribute decision model based
on the Analytic Hierarchy Process that integrates tangible and intangible factors in prioritizing
cargo after an inland waterway disruption. This contribution allows for consideration of
subjective, qualitative attributes in addition to the pure quantitative CPTAP approach explored in
the first two research contributions.

Acknowledgments
I would like to acknowledge my advisor and mentor, Dr. Heather Nachtmann, for her
significant support and guidance from the very first day of my doctoral education. Thank you for
every opportunity you have given me to fulfill the goals that I could not imagine four years ago.
You are my role model in many aspects. I also would like to thank my dissertation committee
members, Dr. Justin Chimka, Dr. Edward Pohl, and Dr. Suzanna Long, for their vital
contribution to this dissertation and their tremendous support during my job search.
I would like to thank the faculty and staff of the Department of Industrial Engineering at
University of Arkansas. I also would like to thank my fellow graduate students for the laughter
they share with me and the encouragement they give to me.
I would like to thank my friends in China and U.S., my non-blood family, for their moral
support.
I would like to acknowledge my family, especially my grandparents and uncle in heaven
from whom I can still obtain strength.
I would like to give special thanks to Adam for his company in the last three years.
This dissertation is dedicated to my parents, Zhiling Wang and Yuan Tong, for their
unconditional love.

Table of Contents
1. INTRODUCTION ...................................................................................................................... 1
1.1 Research Motivation ............................................................................................................. 1
1.2 Research Objective ................................................................................................................ 4
1.3 Research Contributions ......................................................................................................... 5
1.4 Organization of Dissertation ................................................................................................. 7
References ................................................................................................................................... 8
2. LITERATURE REVIEW ......................................................................................................... 10
2.1 Literature Review on Inland Waterway Disruption Response ............................................ 10
2.2 A Review of Cargo Prioritization Techniques within Inland Waterway Transportation .... 13
2.3 Cargo Prioritization Factors ................................................................................................ 13
2.3.1 “Value/Cost/Revenue” Factors ..................................................................................... 13
2.3.2 “Time” Factors ............................................................................................................. 14
2.3.3 “Risk” Factors............................................................................................................... 14
2.3.4 “Weight” Factors .......................................................................................................... 15
2.3.5 “Quantity” Factor ......................................................................................................... 15
2.3.6 “Environmental” Factors .............................................................................................. 15
2.3.7 “Urgency” Factors ........................................................................................................ 16
2.3.8 “Importance” Factors .................................................................................................... 16
2.3.9 “Others” Factors ........................................................................................................... 17
2.4 Berth Allocation Problem (BAP) ........................................................................................ 22
2.5 Tabu Search (TS) Heuristic ................................................................................................. 23
2.6 Value-focused Thinking (VFT) ........................................................................................... 26
2.6.1 Literature Summary ...................................................................................................... 26
2.6.2 Literature Assessment ................................................................................................... 32
2.7 Analytic Hierarchy Process (AHP) ..................................................................................... 34
References ................................................................................................................................. 35
3. A REVIEW OF CARGO PRIORITIZATION TECHNIQUES WITHIN INLAND
WATERWAY TRANSPORTATION .......................................................................................... 42
Abstract ..................................................................................................................................... 42
1. Introduction ........................................................................................................................... 42
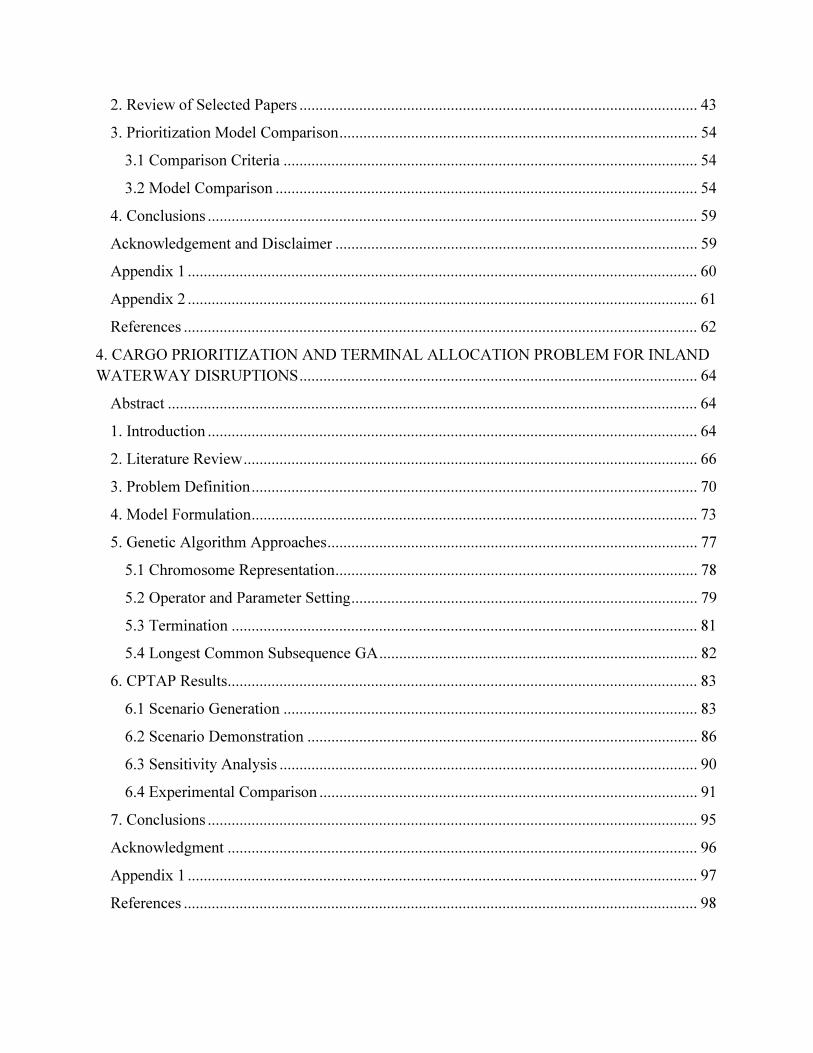
2. Review of Selected Papers .................................................................................................... 43
3. Prioritization Model Comparison .......................................................................................... 54
3.1 Comparison Criteria ........................................................................................................ 54
3.2 Model Comparison .......................................................................................................... 54
4. Conclusions ........................................................................................................................... 59
Acknowledgement and Disclaimer ........................................................................................... 59
Appendix 1 ................................................................................................................................ 60
Appendix 2 ................................................................................................................................ 61
References ................................................................................................................................. 62
4. CARGO PRIORITIZATION AND TERMINAL ALLOCATION PROBLEM FOR INLAND
WATERWAY DISRUPTIONS .................................................................................................... 64
Abstract ..................................................................................................................................... 64
1. Introduction ........................................................................................................................... 64
2. Literature Review .................................................................................................................. 66
3. Problem Definition ................................................................................................................ 70
4. Model Formulation ................................................................................................................ 73
5. Genetic Algorithm Approaches ............................................................................................. 77
5.1 Chromosome Representation ........................................................................................... 78
5.2 Operator and Parameter Setting ....................................................................................... 79
5.3 Termination ..................................................................................................................... 81
5.4 Longest Common Subsequence GA ................................................................................ 82
6. CPTAP Results ...................................................................................................................... 83
6.1 Scenario Generation ........................................................................................................ 83
6.2 Scenario Demonstration .................................................................................................. 86
6.3 Sensitivity Analysis ......................................................................................................... 90
6.4 Experimental Comparison ............................................................................................... 91
7. Conclusions ........................................................................................................................... 95
Acknowledgment ...................................................................................................................... 96
Appendix 1 ................................................................................................................................ 97
References ................................................................................................................................. 98

5. A TABU SEARCH APPROACH TO THE CARGO PRIORITIZATION AND TERMINAL
ALLOCATION PROBLEM ....................................................................................................... 102
Abstract ................................................................................................................................... 102
1. Introduction ......................................................................................................................... 102
2. CPTAP Description and Model Formulation ...................................................................... 105
3. Literature Review ................................................................................................................ 110
4. Tabu Search Heuristic for CPTAP ...................................................................................... 113
4.1 CPTAP Tabu Search Heuristic Flowchart ..................................................................... 113
4.2 Initial Solution ............................................................................................................... 114
4.3 Penalized Cost Function ................................................................................................ 115
4.4 Neighborhood Structure ................................................................................................ 117
4.5 Tabu Management and Aspiration Criterion ................................................................. 118
4.6 Post-optimization Step ................................................................................................... 120
5. Parameter Analysis .............................................................................................................. 120
5.1 Adjustment Factor ......................................................................................................... 121
5.2 Length of Tabu List ....................................................................................................... 122
5.3 Termination Condition .................................................................................................. 123
6. Computational Results ........................................................................................................ 125
7. CPTAP Strategy Comparison.............................................................................................. 131
8. Conclusions ......................................................................................................................... 134
Acknowledgment .................................................................................................................... 134
Appendix 1 .............................................................................................................................. 135
Appendix 2 .............................................................................................................................. 136
References ............................................................................................................................... 137
6. VALUE-FOCUSED ASSESSMENT OF CARGO VALUE DECREASING RATE ........... 140
Abstract ................................................................................................................................... 140
1. Introduction ......................................................................................................................... 140
2. Literature Review ................................................................................................................ 142
2.1 Literature Summary ....................................................................................................... 143
2.2 Literature Assessment.................................................................................................... 148
3. VFT Methodology for CVDR Assessment ......................................................................... 150

4. Practical Implications for Engineering Managers ............................................................... 173
5. Conclusions and Future Work ............................................................................................. 174
Acknowledgment .................................................................................................................... 175
Appendix 1 .............................................................................................................................. 176
References ............................................................................................................................... 177
7. MULTI-ATTRIBUTE DECISION MODEL FOR CARGO PRIORITIZATION WITHIN
INLAND WATERWAY TRANSPORTATION ........................................................................ 181
Abstract ................................................................................................................................... 181
1. Introduction ......................................................................................................................... 182
2. Literature Review ................................................................................................................ 183
3. Problem Description ............................................................................................................ 185
4. AHP Model ......................................................................................................................... 186
5. Case Study ........................................................................................................................... 190
6. Conclusions ......................................................................................................................... 196
Acknowledgement ................................................................................................................... 197
Appendix 1 .............................................................................................................................. 198
Appendix 2 .............................................................................................................................. 199
Appendix 3 .............................................................................................................................. 200
References ............................................................................................................................... 201
8. CONCLUSIONS AND FUTURE WORK ............................................................................. 203

List of Figures
Chapter 1
Figure 1 U.S. Navigable Inland Waterway System ........................................................................ 2
Figure 2 Total Waterborne Commerce by Commodity Group, 1993-2012 .................................... 2
Chapter 2
Figure 1 Step 1-3 of VFPE-based Supply Chain Risk Identification ........................................... 27
Figure 2 TRAVEL Development Process..................................................................................... 29
Figure 3 Operational Value Hierarchy .......................................................................................... 30
Figure 4 Operations Flight Value Hierarchy ................................................................................ 31
Chapter 4
Figure 1 Arkansas River Disruption ............................................................................................. 71
Figure 2 Graphical Representation of Actual Contributing Time ................................................ 75
Figure 3 GA Approach Pseudocode ............................................................................................. 78
Figure 4 GA Chromosome Representation ................................................................................... 79
Figure 5 GA Convergence Results for Small, Medium and Large Size Problems ....................... 82
Figure 6 Upper Mississippi River Disruption Pre- and Post- CPTAP Response ......................... 84
Figure 7 Cargo Prioritization Results at Each Terminal ............................................................... 89
Figure 8 Sensitivity Analysis ........................................................................................................ 91
Chapter 5
Figure 1 Arkansas River Disruption ........................................................................................... 107
Figure 2 CPTAP TS Flowchart ................................................................................................... 114
Figure 3 Sensitive Analysis Results of Adjustment Factor δ ...................................................... 122
Figure 4 Sensitive Analysis of the Length of Tabu List ............................................................. 123
Figure 5 Heuristic Termination Analyses ................................................................................... 124
Figure 6 Quality vs Time of GA and TS Heuristics for CPTAP ................................................ 131
Figure 7 Comparison of Multiple Strategies for Cargo Prioritization and Terminal Allocation 133
Chapter 6
Figure 1 Step 1-3 of VFPE-based Supply Chain Risk Identification ......................................... 144
Figure 2 TRAVEL Development Process................................................................................... 146
Figure 3 Operational Value Hierarchy ........................................................................................ 147
Figure 4 Operations Flight Value Hierarchy .............................................................................. 147
Figure 5 VFT Framework ........................................................................................................... 151
Figure 6 Graphical Description of Cargo Prioritization Problem ............................................... 152
Figure 7 Value Hierarchy for CVDR Assessment ...................................................................... 154
Figure 8 SDVFs for Constructed Evaluation Measures .............................................................. 165
Figure 9 SDVF for Natural Evaluation Measure ........................................................................ 166
Figure 10 Local and Global Weights for Inland Waterway Example ........................................ 167
Figure 11 Inland Waterway Disruption Example Results by Value ........................................... 171
Figure 12 Sensitivity Analysis of Value Weights on CVDR Results ......................................... 172

Chapter 7
Figure 1 Graphical Description of Cargo Prioritization Problem………………………………186
Figure 2 AHP Decision Hierarchy for Cargo Prioritization within Inland Waterway
Transportation ............................................................................................................................. 188

List of Tables
Chapter 2
Table 1 Publication Comparison Matrix ....................................................................................... 11
Table 2 Model(s) and Objective(s) Comparison Matrix ............................................................... 12
Table 3 Factor Matrix for Cargo Prioritization Methods .............................................................. 18
Table 4 Comparison of Select TS VRP Literature ........................................................................ 25
Table 5 Literature Assessment Matrix .......................................................................................... 32
Chapter 3
Table 1 Three Levels of UND ...................................................................................................... 45
Table 2 Five Levels of FAD ......................................................................................................... 45
Table 3 UMMIPS Priority Matrix................................................................................................. 46
Table 4 Priority Groups of UMMIPS ........................................................................................... 46
Table 5 EPA Factors and Criteria of VOC Regulation ................................................................. 48
Table 6 Assigning Priorities to Cargoes ....................................................................................... 51
Table 7 Comparison Matrix for Cargo Prioritization Methods .................................................... 57
Chapter 4
Table 1 Cargo Prioritization Factor Matrix .................................................................................. 68
Table 2 Fractional Factorial Design Results ................................................................................. 81
Table 3 Commodity Types and Tonnage Data on the Study Area ............................................... 86
Table 4 CPTAP River Scenario .................................................................................................... 87
Table 5 CPTAP Experimental Comparison .................................................................................. 94
Chapter 5
Table 1 Comparison of Select TS VRP Literature ...................................................................... 112
Table 2 Commodity Types, Tonnage Data and Market Price on the Study Region ................... 126
Table 3 Experimental Results of the Three TS Variants ............................................................ 129
Chapter 6
Table 1 Literature Assessment Matrix ........................................................................................ 149
Table 2 Evaluation Measure for Emergency Need Value .......................................................... 156
Table 3 Evaluation Measure for Response Need Value ............................................................. 158
Table 4 Evaluation Measure for Community Need Value.......................................................... 159
Table 5 Evaluation Measure for Military Need Value................................................................ 160
Table 6 Evaluation Measure for Local Priorities Value ............................................................. 161
Table 7 Evaluation Measure for Public Health Value ................................................................ 162
Table 8 Evaluation Measure for Environment Security Value ................................................... 162
Table 9 Evaluation Measure for Perishability Value .................................................................. 163
Table 10 Example Cargo Alternatives ........................................................................................ 168
Table 11 Example Alternative Constructed Measures Scoring .................................................. 169
Table 12 Inland Waterway Disruption Example CVDR Results................................................ 171
Chapter 7
Table 1 AHP Comparison Scale ................................................................................................. 192

Table 2 Attribute Priority Evaluation ......................................................................................... 192
Table 3 Subattribute Priority Evaluation .................................................................................... 193
Table 4 Alternative Priority Evaluation (EDD) .......................................................................... 194
Table 5 Alternative Priority Evaluation (Human Risk) .............................................................. 194
Table 6 Overall Alternative Priority ........................................................................................... 195

List of Papers
Chapter 3: Tong, J., & Nachtmann, H. (2012). A review of cargo prioritization techniques within inland waterway transportation. In Proceedings of the 2012 Industrial and Systems Engineering
Research Conference. Chapter 7: Tong, J., & Nachtmann, H. (2013). Multi-attribute decision model for cargo prioritization within inland waterway transportation. In Proceedings of the 2013 Industrial and Systems Engineering Research Conference.

1
1. INTRODUCTION
The research in this dissertation investigates appropriate response support for inland waterway
transportation stakeholders when the United States (U.S.) inland navigation system has been
disrupted due to a nature or manmade event. The contribution of this research primarily benefits
governmental maritime agencies such as the U.S. Coast Guard (USCG), U.S. Army Corps of
Engineers (USACE), and other maritime transportation decision makers to mitigate and reduce
the negative economic and societal impacts from disruptions to the inland waterway
transportation system.
1.1 Research Motivation
The commercially important U.S. inland waterway system is an open system comprised of
12,000 miles of navigable waterways managed by the USACE (Clark et al., 2005). Figure 1
displays the U.S. navigable inland waterway system of which the three largest river components
are the Mississippi River, Ohio River, and Illinois River (Henrickson and Wilson, 2007). As a
major component of the U.S. transportation system, the inland waterway system serves thirty-
eight States and carries one-twelfth of the overall national freight with nearly 200 commercially
active lock sites (Stern, 2012; USACE, 2009). Figure 2 presents the waterborne commerce by
commodity type from 1993 to 2012. The largest commodities by tonnage moved on the inland
waterways are petroleum, coal, food and farm products, crude materials, and chemicals (USACE,
2013). The Nation’s inland waterway system plays a vital role in transporting these commodities
such that approximately 20% of America’s coal, 22% of U.S. petroleum, and 60% of the
Nation’s farm exports rely on its normal operation (USACE, 2009). The inland waterway system

2
is also considered as a critical transportation mode for certain geographical regions that rely on
long distance transportation of bulk cargoes (Stern, 2012).
Figure 1 U.S. Navigable Inland Waterway System (USDOT, 2008)
Figure 2 Total Waterborne Commerce by Commodity Group, 1993-2012 (USACE, 2013)

3
In addition to benefiting the Nation’s economy as an important transportation corridor, inland
waterways also provide substantial societal benefits. Waterborne transportation reduces land
transportation congestion because barges have much larger cargo capacity than alternative modes
of land transportation (e.g. the capacity of one barge approximately equals sixty tractor trailers
and fifteen railcars). Barge transportation consumes significantly less fuel than rail or truck; one
gallon of fuel by barge enables one ton of freight to travel 514 miles, while only 202 miles for
rail and 58 miles for truck (Arkansas Waterways Commission, 2013). This energy efficiency
makes maritime transportation a “green” sustainable transportation mode such that its wide usage
can improve air quality and decrease energy consumption. Other societal benefits of barge
transportation include that it contributes low noise pollution and is the safest mode to move
hazardous materials (e.g. toxic cargo or chemicals) (Arkansas Waterways Commission, 2013).
Multiple natural and man-made events can lead to inland waterway disruptions such as ice,
droughts, or floods that can cause non-navigable water levels and earthquakes that can destroy
the infrastructure of the navigation system. In 2012, the Mississippi River, the Nation’s critical
inland waterway transportation corridor, suffered a record-breaking low water level and was very
close to being completely shut down. According to the USACE, drought cycles may last for
years and the low river level crisis might appear again in the near future (Schwartz, 2013).
Another cause of inland waterway disruptions are maintenance delays associated with the upkeep
of the aging infrastructure. Many locks and dams currently in use were built more than 50 years
ago and require timely maintenance for continuous future operations. New infrastructure
investments and operations and maintenance (O&M) funding have declined in recent decades,
which can lead to maintenance and repair postponements and unscheduled closures (Grier, 2009).

4
Other possible disruption causes include accidents such as vessel allision or collision,
mechanical vessel problems, and terrorist attacks (Grier, 2009).
Disruptions on the inland waterway system can have widespread economic and societal impacts,
and their consequences can be significant. For instance, the main lock chamber of the Greenup
lock and dam on the Ohio River was closed to navigation traffic for emergency repairs in 2003.
The closure lasted more than 52 days, resulting in approximately $41.9 million total cost
(USACE, 2005a) that included modal shift expense and delay costs. Another example is the
McAlpine Lock and Dam on the Ohio River, which was closed for 10 days to repair extensive
cracking in its miter gate. Although early notice was given to the shippers/carriers before the
closure, a $9 million total disruption cost was incurred by various stakeholders (USACE, 2005b).
The motivation of this dissertation research is driven by the need to mitigate potentially
substantial negative economic and societal impacts from inland waterway transportation
disruptions. Key stakeholders, including the USCG and USCAE, need pre- and post-disruption
response plans to provide decision support regarding how to respond to disruptive events along
the inland navigation system in order to alleviate significant impact to the Nation’s freight
transportation system and economy. We are interested in developing concrete operational
guidelines for these stakeholders to provide them with decision support tools and knowledge to
mitigate disruption impacts to inland waterway transportation.
1.2 Research Objective
The overall research goal of this dissertation research is to investigate appropriate response
support for inland waterway transportation stakeholders when the inland navigation system has
been disrupted due to a natural or manmade event. The primary contribution of this research is to

5
provide decision support to benefit governmental maritime agencies such as the USCG and
USACE and other maritime transportation decision makers to mitigate and reduce the negative
economic and societal impacts from disruptions to the inland waterway transportation system.
This is fulfilled through four research contributions. The first research contribution introduces
and models the cargo prioritization and terminal allocation problem (CPTAP) that minimizes
total value loss of the barge cargoes due to disruption on the inland waterway transportation
system and develops and tests a GA-based heuristic to solve realistically-sized problem instances.
The second research contribution provides solution improvements to the CPTAP model through
the development of a TS heuristic approach. The third research contribution provides a
methodology to determine cargo value decreasing rates (CVDRs) for transportation in general.
The fourth research contribution develops a multi-attribute decision model based on the Analytic
Hierarchy Process that integrates tangible and intangible factors to address the cargo
prioritization decision for inland waterway disruptions.
1.3 Research Contributions
This dissertation research provides practical decision support for transportation stakeholders
regarding inland waterway disruption response, which is primarily intended to assist
governmental maritime agencies. The work described in Chapter 2-3 contributes a current
knowledge base obtained through a comprehensive literature review that supports the research
contributions in Chapter 4-7.
The contribution in the Chapter 4 contains a thorough description of CPTAP as a novel research
problem to inland waterway disruption response, a mathematical model of CPTAP, and a GA-
based heuristic as an effective solution approach to CPTAP. The model output indicates the
6
terminal that each disrupted barge is assigned to for offloading and the prioritized turn each
barge takes at its assigned terminal while considering the availability and capacity of nearby
terminals and land-based freight infrastructure to receive and transport these cargoes. It assists
responsible parties in responding promptly to the disruption with system-level efficient barge-
terminal assignments that can consider both economic and societal impacts. In addition to
providing tactical disaster response for redirecting disrupted barges to alternative terminals, the
CPTAP model in Chapter 4 can be used to evaluate the resiliency of the inland waterway system
to handle hazardous and high volume cargo and guide investment towards increasing capacity at
key terminals.
The contribution of Chapter 5 is an improved CPTAP solution approach based on TS. The TS
heuristic obtains the best solutions found for all tested instances and results in lower total value
loss and computation time. Moreover, the CPTAP model is systematically evaluated through
comparison of the three cargo prioritization strategies (GA, TS, and a naïve minimize distance
approach).
The contribution of Chapter 6 is a step-by-step methodology to determine a cargo value
decreasing rate (CVDR) to measure the total value loss of the disrupted cargo as the component
of cargo prioritization models. This contribution provides a Value-focused Thinking (VFT)
based approach to support transportation decision makers in prioritizing cargo with a well-
constructed model parameter. The CVDR delivered by the developed methodology is applicable
to the CPTAP model as well as other cargo prioritization models designed for other
transportation modes.

7
The contribution of the Chapter 7 is a multi-attribute decision approach based on the Analytic
Hierarchy Process (AHP) that integrates qualitative and quantitative factors to assess the
prioritized ordering of the barge cargoes for maritime governmental agencies. The model output
in Chapter 7 indicates the priorities assigned to all the barge cargoes. Different from Chapters 4
and 5 that involve terminal selection as part of the decision making, Chapter 7 provides decision
support that informs the decision maker of the most important cargoes in terms of societal and
economic aspects but does not handle the rerouting decision.
1.4 Organization of Dissertation
Chapter 1 presents the motivation of conducting research on the disruption response for inland
waterway transportation, describes the four research objectives of the study, and summarizes the
resulting research contributions. Chapter 2-3 include a comprehensive literature review,
specifically, Chapter 3 is a conference paper published in the Proceedings of the 2012 Industrial
Engineering Research Conference titled “A Review of Cargo Prioritization Techniques within
Inland Waterway Transportation (Tong and Nachtmann, 2012).” Chapter 4 is a manuscript
entitled “Cargo Prioritization and Terminal Allocation Problem for Inland Waterway Disruptions”
that employs a mathematical model and a GA-based heuristic solution approach for the cargo
prioritization and terminal allocation problem. Chapter 5 provides a manuscript titled “A Tabu
Search Approach to the Cargo Prioritization and Terminal Allocation Problem” that contains a
TS heuristic to solve the CPTAP model. Chapter 6 presents a manuscript to be submitted to the
Engineering Management Journal titled “Value-Focused Assessment of Cargo Value Decreasing
Rate” aimed at providing a methodology to determine the value decreasing rate of the disrupted
cargo to support the first two chapters. It is an extension of a conference paper published at the

8
Proceedings of the American Society for Engineering Management 2013 International Annual
Conference (Tong et al., 2013). Chapter 7 is a conference paper published in the Proceedings of
the 2013 Industrial Engineering Research Conference titled “Multi-attribute Decision Model for
Cargo Prioritization within Inland Waterway Transportation” that involves subjective factors to
provide decision support for maritime transportation stakeholders (Tong and Nachtmann, 2013).
References
Arkansas Waterways Commissions. (2013). Retrieved from: http://waterways.arkansas.gov/education/Pages/whyWaterways.aspx Clark, C., Henrickson K. E., & Thoma, P. (2005). An overview of the U.S. inland waterway
system. (IWR Report 05_NETS-R-12). Institute for Water Resources, U.S. Army Corps of Engineers, Virginia. Grier, D. V. (2009). The declining reliability of the U.S. inland waterway system. Retrieved from: http://onlinepubs.trb.org/onlinepubs/archive/Conferences/MTS/4A%20GrierPaper.pdf
Henrickson, K. E., & Wilson, W. W. (2007). A description of the inland waterway system and planning models. Public Administration and Public Policy-New York-, 127, 53. Schwartz, J. (2013, Jan 18). Deep in keeping the boats moving along a Mississippi dwindled by drought. New York Times, p. A14. Retrieved from: http://www.nytimes.com/2013/01/18/us/mississippi-shipping-continues-despite-drought.html?_r=1& Stern, C. V. (2012). Inland waterways: Recent proposals and issues for congress. Retrieved from: http://www.fas.org/sgp/crs/misc/R41430.pdf Tong, J., & Nachtmann, H. (2012). A review of cargo prioritization techniques within inland waterway transportation. Proceedings of the 2012 Industrial Engineering Research Conference. Tong, J., & Nachtmann, H. (2013). Multi-attribute decision model for cargo prioritization within inland waterway transportation. Proceedings of the 2013 Industrial Engineering Research Conference. Tong, J., Nachtmann, H., & Pohl, E.A. (2013). Value-focused thinking for inland waterborne cargo prioritization. Proceedings of the American Society for Engineering Management 2013
International Annual Conference.

9
U.S. Army Corps of Engineers. (2005a). Shipper and carrier response to the September –
October 2003 Greenup main lock closure. (IWR Report 05-NETS-R-02). Retrieved from: http://planning.usace.army.mil/toolbox/library/IWRServer/05-NETS-R-02.pdf U.S. Army Corps of Engineers. (2005b). Event study of the August 2004 McAlpine lock closure.
(IWR Report 05-NETS-R-07). Retrieved from: http://planning.usace.army.mil/toolbox/library/IWRServer/05-NETS-R-07.pdf U.S. Army Corps of Engineers. (2009). Inland waterway navigation: Value to the Nation. Retrieved from: http://www.corpsresults.us/ U.S. Army Corps of Engineers. (2013). 2012 Waterborne commerce of the United States: Part 5
national summaries of domestic and foreign waterborne commerce. Retrieved from: http://www.navigationdatacenter.us/wcsc/pdf/wcusnatl12.pdf U.S. Department of Transportation. (2008). Impacts of climate change and variability on
transportation systems and infrastructure: Gulf coast study, Phase I. Washington, D.C.: U.S. Department of Transportation.

10
2. LITERATURE REVIEW
This literature review describes the motivation and background of our dissertation research and
is organized as follows: Section 2.1 investigates the literature related to inland waterway
disruption response, Section 2.2 reviews cargo prioritization techniques, Section 2.3 presents an
overview of cargo prioritization factors, Sections 2.4-2.7 describe the berth allocation problem,
tabu search heuristic, value-focused thinking, and analytic hierarchy analysis.
2.1 Literature Review on Inland Waterway Disruption Response
Nine publications most closely related to inland waterway disruption response are reviewed to
reveal the most current research in this area. The authors investigate disruptive scenarios from
many angles and provide recommendations and insights to improve pre-disaster preparation and
after-disaster response in order to mitigate the disruption impacts. Our review does not consider
the literature that strictly focuses on disruption due to one type of disruptive event such as the
work related to oil spill management (e.g. Camp et al., 2010) or flood management (e.g. Du
Plessis, 2004). Our review is focusing on all-hazard literature that provides decision support that
is applicable to disruptions caused by any type of event, manmade or natural disaster.
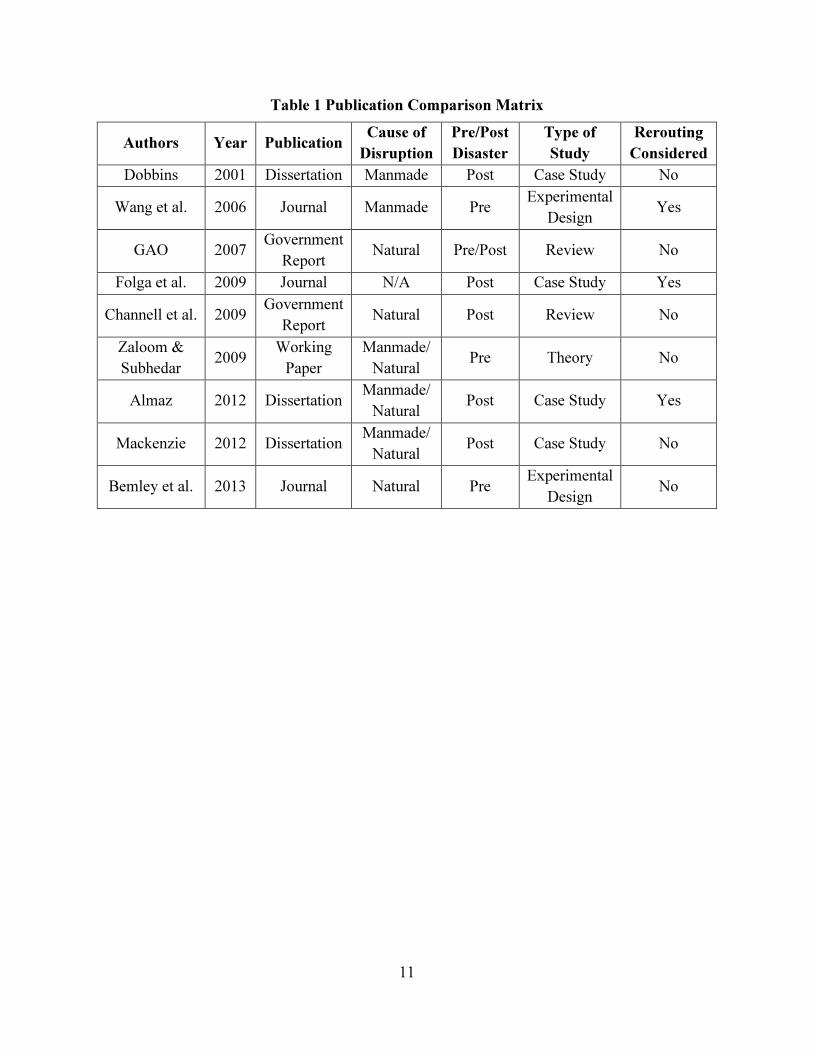
Tables 1 and 2 present two matrices to summarize these papers. Table 1 provides general
information of the select publications including publication year, publication type, cause of the
disruption, pre- or post-disaster focus, type of the study, and whether or not rerouting is
considered. Table 2 provides brief descriptions of the core model(s) and objective(s) of each
study.
11
Table 1 Publication Comparison Matrix
Authors Year Publication Cause of
Disruption
Pre/Post
Disaster
Type of
Study
Rerouting
Considered
Dobbins 2001 Dissertation Manmade Post Case Study No
Wang et al. 2006 Journal Manmade Pre Experimental
Design Yes
GAO 2007 Government
Report Natural Pre/Post Review No
Folga et al. 2009 Journal N/A Post Case Study Yes
Channell et al. 2009 Government
Report Natural Post Review No
Zaloom &
Subhedar 2009
Working
Paper
Manmade/
Natural Pre Theory No
Almaz 2012 Dissertation Manmade/
Natural Post Case Study Yes
Mackenzie 2012 Dissertation Manmade/
Natural Post Case Study No
Bemley et al. 2013 Journal Natural Pre Experimental
Design No

12
Table 2 Model(s) and Objective(s) Comparison Matrix
Model(s) Objective(s) Author(s)
Risk management information system
• Provide the Vessel Traffic Service (VTS) and U.S. Coast Guard (USCG) personnel with critical information related to the barges carrying hazardous materials, especially in the event of an accident
• Identify cargoes and vulnerable receptors before responders arrive at the accident scene
Dobbins (2001)
Waterway demand models
• Analyze changes in waterway traffic patterns due to lock service interruptions
• Suggest additional warning time to barges
Want et al. (2006)
Review of port preparation and mitigation methods
• Examine port disaster preparedness measures and the federal role in helping ports plan and recover from natural disaster impacts
• Make recommendations for utilizing existing forums to discuss the planning actions and developing communication strategies
GAO (2007)
System-level economic analysis methodology
• Rerouting analysis for disrupted commodity flow including waterway shipments
Folga et al. (2009)
Review of current debris management practice
• Develop recommendations based on the research gaps with the goal of improving disaster response
Channell et al. (2009)
Delphi method • Identify accidents that most likely occur in maritime domain and explore relevant recovery plans to alleviate the risks
Zaloom & Subhedar (2009)
Simulation based risk model
• Determine prioritization order to guide the vessels entering and leaving the disrupted river in order to achieve the optimum balance between security and resiliency
Almaz (2012)
Dynamic multiregional interdependency model
• Model and quantify actions of moving commodities by alternate modes of transportation during inland waterway port closures
Mackenzie (2012)
Stochastic facility location model
• Explore effectiveness of pre-positioning strategies for port recovery
Bemley et al. (2013)

13
2.2 A Review of Cargo Prioritization Techniques within Inland Waterway Transportation1
2.3 Cargo Prioritization Factors
From the literature we know that most cargo prioritization methods include one or more factors
to prioritize the commodities. In order to develop an integrated and effective approach for
determining which cargo should be prioritized to alternative modes if an inland waterway
transportation is disrupted, we look into each cargo prioritization method contained in the
selected literature, extract the factors considered in the method and establish a factor matrix that
describes and categorizes all these factors (see Table 3). The literature-based factor matrix
suggests the aspects one should recognize and contemplate in developing the cargo prioritization
model in an inland waterway transportation context. These factors were divided into nine groups
based on the type of criteria they evaluate.
2.3.1 “Value/Cost/Revenue” Factors
This group covers the prioritization factors that relate to pecuniary aspects of the commodities,
including the value of the commodity (Aragon, 2000), the revenue of transporting the commodity
(Lau et al., 2009), the profit of marketing the commodity (Bennett, 2002), the efficiency index
associated to the benefits of investing a commodity research program (Nagy & Quddus, 1998), the
marginal revenue costs of the commodity (Madden, 1995) and an implicit standard of the benefit
of the product which possibly refers to profit (EPA, 1999). Factors in this group more frequently
take the commodity’s inherent characteristics as the prioritization criteria, e.g. the valuable
products receive high priorities and the heavy products that receive more revenue are usually
prioritized.
1 See Chapter 3 for the published review article

14
2.3.2 “Time” Factors
Four factors are included in the group of time, which uses specific dates as the prioritization
criteria. They are the earliest due date (EDD) (Armstrong et al., 1983; Sinclair & Dyk, 1987;
Schank et al., 1991), latest arrival date (LAD) (Schank et al., 1991), ready to load date (RLD)
(Schank et al., 1991) and available to load date (ALD) (Schank et al., 1991). EDD is one of the
most popular prioritization criteria among the literature and three papers have referred to EDD.
The reason of EDD’s widely usage lies in its connection to the customer service level.
Prioritization based on EDD guarantees that the cargoes are sequenced and delivered to the
customers with the objective of minimizing the due date violation, which increases the total
customer satisfaction level. The remaining three factors within the time category come from the
same paper as one of the tasks of the strategic mobility model.
2.3.3 “Risk” Factors
The group of risk contains four factors focusing on risk and security. Human risk (Ibrahim and
Ayyub, 1992) and security risk (Ibrahim & Ayyub, 1992) are two example criteria mentioned in
prioritizing components for inspection purpose. The prioritization order should be decided in
order to decrease the risk related to the commodities. On the contrary, another two factors in this
group, the health and/ or safety function served by the product (EPA, 1999) and the security
status of the vessel (USDHS, 2007), prioritize the cargoes for the purpose of increasing the
security level associated with the commodity. All four factors covered in this group do not
provide detailed prioritization steps but propose that risk/security needs to be considered when
prioritizing the commodities.

15
2.3.4 “Weight” Factors
Two papers use cargo’s weight to determine the prioritization order. One paper employs the
cargo draft (MAR Inc., 1987) as the criterion which has not been defined explicitly but should
relate to cargo’s weight to some extent according to the definition of the vessel draft. Smallest
weight (SWT) (Armstrong et al., 1983) and largest weight (LWT) (Armstrong et al., 1983) prioritize
the commodities on the basis of their weight in increasing or decreasing order. The author has
not indicated when and why to adopt the increasing or decreasing order, however, we reckon that
this factor is necessary when the weight of commodity becomes a constraint of the facility
capacity to load/transport the commodity.
2.3.5 “Quantity” Factor
The weighted average of the percentage of the amount of cargoes transported in different
direction is the exclusive factor contained in this group (Ahanotu et al., 2007) indicating that
researchers usually do not take account of amount as an important factor to prioritize cargo.
Within this prioritization group, commodities are sequenced solely according to their amounts
rather than their characteristics. Thus the commodity type becomes insignificant in prioritization
process.
2.3.6 “Environmental” Factors
Among the four factors in this group, product’s loss of resources (Hansen & Cowi, 2003) and the
energy consumption (Hansen & Cowi, 2003) concentrate on the general consumption of resources
and energy. The remaining two factors (EPA, 1999) prioritize the commodities with
consideration of the environmental effects of the volatile organic compounds (VOC).

16
2.3.7 “Urgency” Factors
Three factors are included in the urgency group, among which, the urgency of need designator
(UND) (Grandjean & Newbury, 2001) and the force activity designator (FAD) (Grandjean &
Newbury, 2001) are the two factors constituting a priority system to prioritize materials. The
criterion of Emergency needs (USDHS, 2007) is one of the factors to assess the national
commodity priorities and it mainly refers to the emergency in saving human lives. The factors in
the group of urgency are defined from military or public perspective instead of private or
customer perspective. It is appropriate to have the urgency factors in mind in prioritizing the
military and strategic commodities.
2.3.8 “Importance” Factors
Six factors are sorted into this category. The factors of important for food security (Bennett,
2002) and traditionally important (Bennett, 2002) are the two example criteria to prioritize
commodities for marketing purpose. It reminds us that the traditional important cargoes in
various prioritization contexts should be assigned additional concern. Another four factors come
from the same paper: The factor of commodity needs for local prioritization (USDHS, 2007)
synthesizes the priorities on the national, regional and local levels; the remaining three factors
(USDHS, 2007) that relate to the national commodity priorities (response needs/community
needs/national security) identify and prioritize the essential cargoes for the various prioritization
objectives. For instance, the fire boats are necessary in response operations if a big fire breaks
out at an incident site and thus they are prioritized for the factor of response needs. Similarly,
cargoes that are important to community survival such as heating oil and national security such
as escort ships should be prioritized in accordance with the factor of the community needs.

17
2.3.9 “Others” Factors
This group includes the factors contained in the selected papers but cannot be classified into the
previous categories. It lists the supplemental aspects we need to consider in addition to the
discussed factors: whether to give extra priorities due to seasonal reason (seasonal advantage
(Bennett, 2002)); the availability of substitute commodities decreases the ranking position of the
commodity (the availability of substitute materials (EPA, 1999)); export or refrigerated cargoes
should be given priority in some cases (Sinclair & Dyk, 1987); commander’s determination
should be given priority in some cases (commander in chief (Schank et al., 1991)); the
capabilities of berth and port infrastructure should be taken into account if the commodities
require sea transportation (USDHS, 2007); priorities should be given to fuel oil in winter
(USDHS, 2006), and to gas, perishable cargo and assembly line components in both winter and
summer (USDHS, 2006).

18
Table 3 Factor Matrix for Cargo Prioritization Methods
Classification Ranking Factor Source
Value/Cost/
Revenue
Profitability: One of the example criteria to prioritize commodities that will get greater attention in the market
scoping process Bennett, 2002
Revenue: The cargoes are sorted on the basis of descending order of cargo revenue. When a customer wants to
transfer their cargoes to a foreign country, they employ the services of a freight forwarder who will charge the
customer for the cargo shipping cost (revenue) if the cargo is scheduled to be loaded. This charge is based on the
chargeable weight (i.e. the volume weight or actual weight) of each cargo, whichever is the larger. The revenue
for loading the cargo with respect to its volume:
��_� =�� ∙ �� ∙ ℎ�
6000∙ ���
∀� ∈ �
The revenue for loading the cargo with respect to its weight:
��_�� = �� ∙ ���∀� ∈ �
Lau et al., 2009
Efficiency Index: Net present value divided by the present value of research expenditure. It’s used to identify a
new research agenda with agricultural research priority setting. Nagy & Quddus, 1998
The use, benefit, and commercial demand for the product: Identify the products that contribute to ozone
formation EPA, 1999
Marginal Revenue Costs (MRC): Prioritize the goods in the context of the Ahmad-Stern model of indirect tax
reform including labor supply Madden, 1995
Value of production: One of the selected statistical parameters to prioritize commodities Aragon, 2000
Time
Earliest due date (EDD): Due date in non-decreasing order
Armstrong et al.,
1983;
Sinclair and Dyk,
1987;
Schank et al., 1991
Latest arrival date (LAD): One of the factors to prioritize cargoes in a step of the strategic mobility model Schank et al., 1991
Ready to load date (RLD): One of the factors to prioritize cargoes in a step of the strategic mobility model Schank et al., 1991
Available to load date (ALD): One of the factors to prioritize cargoes in a step of the strategic mobility model Schank et al., 1991
ℎ� Height of the cargo l
�� Length of the cargo l
�� Width of the cargo l
�� Weight of the cargo l
��� Cargo forwarding price

19
Table 3 Factor Matrix for Cargo Prioritization Methods (Cont.)
Classification Ranking Factor Source
Risk
Economic risk: One of the example criteria for prioritizing the components for inspection purposes Ibrahim & Ayyub, 1992
Human risk: One of the example criteria for prioritizing the components for inspection purposes Ibrahim & Ayyub, 1992
The health and/or safety function served by the product: Identify the products that contribute to ozone formation EPA, 1999
Local Prioritization for Commodity Movement-The security status of the vessel:
-Is the vessel cleared for entry into a United States seaport based on established or incident specific screening
procedures?
-Are resources available to inspect or otherwise clear the vessel for entry, if necessary?
-Is any of the cargo on the vessel suspect, or deemed ‘high risk’ by CBP’s ATS using any new revised risk
scoring based upon the incident?
-Are resources available to implement required security measures on the vessel’s inbound and outbound transit?
-Is the vessel operated by a trusted partner, such as a validated participant in the C-TPAT program?
USDHS, 2007
Weight
Cargo draft: No specific description & might be the distance from waterline to the bottom of cargo if it’s placed
in the sea. Cargoes are sequenced for loading and offloading on the basis of the cargo draft, e.g. the deep draft
cargo is loaded prior to the shallow draft cargo.
MAR Inc., 1987
Smallest weight (SWT): Weight in non-decreasing order. It’s one of the cargo priority dispatch rules. Armstrong et al., 1983
Largest weight (SWT): Weight in non-increasing order. It’s one of the cargo priority dispatch rules. Armstrong et al., 1983
Quantity Weighted average of the percentage of the amount of commodity transported in different directions: It is used to
prioritize which commodities should be included in the commodity database for the region of concern. Ahanotu et al., 2007
Environment
Product’s loss of resources: The quantity of materials in a commodity group that is not recycled, because the
materials end up as waste that is disposed of or incinerated, or because the materials during their use are spread
diffusely to the surroundings as a result of wear or corrosion.
Hansen & Cowi, 2003
The energy consumption: The energy consumption used for extraction, manufacture and processing of the
materials in the commodity group, plus the energy latent in these materials (if relevant), plus the energy
consumption during the use phase (if relevant), minus the amount of energy recovered by incineration of the loss
of resources.
Hansen & Cowi, 2003
Whether the product emits highly reactive volatile organic compounds (VOCs): Identify the products that
contribute to ozone formation EPA, 1999
The cost-effectiveness of VOC emission controls for the product: Identify the products that contribute to ozone
formation EPA, 1999

20
Table 3 Factor Matrix for Cargo Prioritization Methods (Cont.)
Classification Ranking Factor Source
Urgency
Urgency of Need Designator: The urgency of the material needed. It’s classified into three levels and it’s one of
the two factors that form the UMMIPS (Uniform Material Movement and Issue Priority System).
Grandjean & Newbury,
2001
Force Activity Designator: The military necessity of the force or activity. It’s a Roman numeral designator with
five levels that depend on activity or unit relative importance to national objectives. It’s one of the two factors
that form the UMMIPS (Uniform Material Movement and Issue Priority System).
Grandjean & Newbury,
2001
National Commodity Priorities: Emergency Needs (Goods necessary for the saving and continuation of life) USDHS, 2007
Importance
Important for food security: One of the example criteria to prioritize commodities that will get greater attention
in the market scoping process Bennett, 2002
Traditionally important: One of the example criteria to prioritize commodities that will get greater attention in
the market scoping process Bennett, 2002
Local Prioritization for Commodity Movement-Commodity needs:
-What are the national priorities?
-What are the regional priorities?
-What are the local priorities (seasonal, etc.)?
USDHS, 2007
National Commodity Priorities: Response Needs (Personnel and equipment necessary to conduct response
operations at the incident site, i.e. fire boats) USDHS, 2007
National Commodity Priorities: Community Needs (Examples are crude oil, heating oil and chemicals necessary
for industrial continuity, and drinking water.) USDHS, 2007
National Commodity Priorities: National Security (Specific coordination or prioritization of support assets, e.g.
small vessels to conduct escort duties) USDHS, 2007
Others
Seasonal advantages: One of the example criteria to prioritize commodities that will get greater attention in the
market scoping process. Bennett, 2002
The availability of substitute materials, considering utility, cost, safety, health, and environmental issues:
Identify the products that contribute to ozone formation EPA, 1999
One of the criteria of assigning priority to movement: Export movements have higher priorities than import
movements
Sinclair & Dyk, 1987
One of the criteria of assigning priority to movement: Refrigerated containers have the higher priority Sinclair & Dyk, 1987
Commander in chief (CINC): Priority is determined by the commander Schank et al., 1991

21
Table 3 Factor Matrix for Cargo Prioritization Methods (Cont.)
Classification Ranking Factor Source
Others
(Cont.)
Local Prioritization for Commodity Movement-The capacity of the port infrastructure to offload the cargo or
commodity and move it from the port:
-Are there labor issues?
-Are there inter-modal issues?
-Are there space or facility issues?
-Is there CBP resource availability to clear cargo or commodities once landed?
USDHS, 2007
Local Prioritization for Commodity Movement-The ability of vessels to transit to and from its berth:
-Are there berthing/space/facility issues?
-Are there waterway functionality issues (no obstructions, operating Aids to Navigation (ATON), etc.)?
USDHS, 2007
Local Cargo Priority: Vessels with fuel oil in winter USDHS, 2006
Local Cargo Priority: Vessels with gas & diesel in winter and summer USDHS, 2006
Local Cargo Priority: Vessels with perishable cargo in winter and summer USDHS, 2006
Local Cargo Priority: Vessels with assembly line components in winter and summer USDHS, 2006

22
2.4 Berth Allocation Problem (BAP)2
We identified that the proposed CPTAP model in Chapter 4 has similar structure to the berth
allocation problem (BAP). Imai et al. (1997) pioneered the static berth allocation problem
formulated as a bi-objective nonlinear integer program which minimizes total vessel staying time
and dissatisfaction with berthing order. Imai et al. (2001) later considered a dynamic berth
allocation problem (DBAP) where vessels may arrive to a single berth location during the
planning horizon, which they formulated as a mixed integer program and solved problems of
realistic size through Lagrangian relaxation. Nishimura et al. (2001) expanded DBAP to allow
each berth to accept multiple vessels within quay capacity limitations by employing a GA
approach. Imai et al. (2003) further extended DBAP to consider vessel size and cargo volume
service priority (referred to as PBAP), which they attempted to use Lagrangian relaxation
initially but the computational burden led them to adopt a GA approach. Cordeau et al. (2005)
proposed a new BAP formulation – the multi-depot vehicle routing problem with time windows
(MDVRPTW) which considers the weighted sum of the service times and time windows of the
berthing times. They employed a Tabu search heuristic which is capable of obtaining optimal
solutions for small size problems and improved solutions for large size problems over a truncated
branch-and-bound algorithm. Boile et al. (2006) reformulated the Imai et al. (2003) mixed
integer nonlinear program for PBAP as a mixed integer program and developed a heuristic to
solve the problem. Their linear reformulation is further considered in terms of its solution
approach by Theofanis et al. (2007). Imai’s group (2007) continued their work on BAP and
developed the bi-objective BAP which minimizes both delay time and service time and found
that a GA approach achieves better solutions than a subgradient optimization approach. The
2 Excerpted from Section 2 of Chapter 4

23
multi-objective BAP is further investigated by Golias et al. (2009) by employing a GA to
optimize conflicting objectives of minimizing service time for various vessel groups and
minimizing service time for all the vessels at the terminal. Other recent BAP extensions handle
uncertainty (Zhen and Chang, 2012), integrate quay crane allocation (Han et al., 2010; Raa et al.,
2011), consider water depth and tidal conditions (Xu et al., 2012), and address bulk cargo ports
(Umang et al., 2013) and environmental concerns (Golias et al., 2010; Du et al., 2011; Wang et
al., 2013).
2.5 Tabu Search (TS) Heuristic3
Tabu search (TS) heuristic is applied to solve CPTAP in Chapter 5. We investigated papers that
employ a TS heuristic to solve the Berth Allocation Problem (BAP) and Vehicle Routing
Problem (VRP). The BAP TS literature was most valuable in developing our TS heuristic since it
has the similar framework with CTPAP. However, since a limited number of BAP papers focus
on the TS heuristic, we extended our literature review to include the VRP literature because
considerable papers have investigated TS implementation in VRP.
TS in BAP
Cordeau et al. (2005) proposed a new formulation approach for the discrete berth allocation
problem (BAP) – the multi-depot VRP with time windows (MDVRPTW) formulation which
handles the weighted sum of the service times and the time windows of the berthing times. They
employed a TS heuristic to solve the discrete case with an extension for the continuous BAP,
which is capable of obtaining optimal solutions for small size instances and better solutions for
large size instances when compared to a truncated branch-and-bound algorithm. Meisel and
3 Excerpted from Section 3 of Chapter 5

24
Bierwirth (2009) integrated the BAP and crane assignment problem (BACAP) to provide an
integer linear program model that incorporates the practical impact of the crane resources on the
handling time. Both squeaky wheel optimization and TS heuristic are employed and compared in
solving a set of benchmark problems. Giallombardo et al. (2010) studied the BACAP as a mixed
integer linear program formulation where TS is used to solve their BAP decision (adapted from
Cordeau et al., 2005) and obtains good solutions within a satisfactory amount of time.
TS in VRP
A steady, thorough, and extensive evolution of VRP heuristics has been observed in the last forty
years, among which the TS heuristic is identified as one of the best metaheuristics for the VRP
(Cordeau and Laporte, 2005; Taillard et al., 2001). More than fifty papers have been published
on this topic since the first TS implementation to the VRP in 1989 (Laporte, 2009). Multiple
survey papers have summarized the TS literature in VRP (Eksioglu et al., 2009; Laporte, 2009;
Braysy and Gendreau, 2005; Cordeau, et al., 2002; Cordeau and Laporte, 2005) and identified
TS as a competitive metaheuristic method to solve VRP. Some researchers consider TS to be the
best metaheuristic method for solving the VRP (Cordeau, et al., 2002). Nine papers were found
to be the most informative to our work and are summarized in Table 4. Among these TS
heuristics, the Unified TS is chosen as the most suitable TS method for CPTAP due to its proved
efficiency, robustness (small number of parameters to be determined), and compatibility to our
CPTAP structure.

25
Table 4 Comparison of Select TS VRP Literature
TS Approach Author(s) Year VRP Type(s) Unique Feature(s)
Unified TS Cordeau et al. 1997 Periodic VRP & Multi-
depot VRP • Generate one initial solution irrespective of feasibility • Employ the penalized function with self-adjusting
coefficients
• Use limited user-controlled parameters
Cordeau et al. 2001 Multi-depot VRP with
Time Windows (VRPTW) • Apply a very simple exchange procedure for a
predetermined number of iterations
Cote and
Potvin
2009 VRP with Private Fleet
and Common Carrier
(VRPPC)
• Use a union of two neighborhoods as the neighborhood structure
Taburoute TS Gendreau et al. 1994 VRP • Include a generalized insertion routine procedure to periodically improve the tours of the solution in order to
decrease the chance of being trapped in a local optimum
Gendreau et al. 2008 Capacitated VRP with
Two-dimensional
Weighted Item (2L-
CVRP)
• Use constraints to express the two-dimensional loading
feature of the items
• Accept moves that cause the infeasibility of either weight
constraints or loading constraints
TS with
Adaptive
Memory
Procedure
Rochat and
Taillard
1995 Capacitated VRP (CVRP) • Generate multiple initial solutions to form a solution pool
which produces a number of tours
• Extract tours according to a probabilistic technique to form
a new solution
Tarantilis 2005 Capacitated VRP (CVRP) • Utilize the sequence of nodes to create the new solution instead of extracting and combining routes
• Select the elite parts according to deterministic selection
criteria rather than the probabilistic routes selection
Other TS Wassan et al. 2008 VRP with Pickups and
Deliveries (VRPPD) • Create an innovative procedure to check the feasibility of
the insertions without increasing the computational
complexity of the neighborhood search
Bolduc et al. 2010 VRP with Production and
Demand Calendars
(VRPPDC)
• Employ two new neighbor reduction strategies
• Include an improvement phase after the tabu iterations are
completed

26
2.6 Value-focused Thinking (VFT)4
In Chapter 6, we use value-focused thinking (VFT) methodology to develop the cargo value
decreasing rate (CVDR). Our previous work has investigated the related literature to provide a
sufficient knowledge base in the VFT application area (Tong et al., 2013). Since the appearance
of VFT by Ralph Keeney in 1992, a large number of papers have discussed or applied this
unique methodology in various decision making scenarios. According to the recently published
VFT survey (Parnell et al., 2013), there are eighty-nine journal papers that implemented VFT in
their analysis from 1992 to 2010. The number of studies is even larger if VFT books and
thesis/dissertations are included. In our review, we selected the literature whose application
context is closely related to our problem domain – the VFT papers that study transportation,
logistics, and supply chain (TLSC).
2.6.1 Literature Summary
The seven VFT papers within the TLSC field are reviewed, and a brief summary of each paper is
presented.
Supply Chain Risk Identification with Value-focused Process Engineering (Neiger et al.,
2009). This article proposes a novel supply chain risk identification methodology on the basis of
value-focused process engineering (VFPE), which integrates the principles from VFT and
extended-event-driven process chain (e-EPC). The contribution of VFT in this article is to
provide a unique perspective in which the supply chain is composed of multiple interconnected
value-adding processes and risk objectives (defined as “minimizing the chance of an adverse
event”) which are considered as the mean objectives that can fit into the VFT framework.
Together with e-EPC methodology, VFT aids the researchers to model the process-based risks
4 Excerpted from Section 2 of Chapter 6

27
with a thorough consideration of processes, objectives, and risk sources. Figure 1 displays the
first three steps of the VFPE-based risk identification process, which illustrate how VFT
functions in the scheme and how it interacts with other components. In Step One, functional risk
objectives are identified by providing each supply chain activity with a generic risk objective,
while in Step Two, VFT is used to generate value risk objectives through decomposing the
higher-level process objective of minimizing process failure risk. Based on the delivery from the
first two steps, a completely decomposed risk objectives structure is developed in Step Three.
Figure 1 Step 1-3 of VFPE-based Supply Chain Risk Identification (Neiger et al., 2009)

28
Value-focused Supply Chain Risk Analysis-Book Chapter (Olson & Wu, 2010). This
research investigates the plant location decision for the supply chain participant with
consideration of supply chain risk. VFT is mainly used to establish the value hierarchy for the
supply chain and to create the alternatives. The SMART technique is applied to conduct the
remaining multi-attribute decision analysis. The authors strengthen the importance of values in
structuring the value hierarchy – VFT aims to develop a hierarchy that gains a wide spectrum of
values. Beginning with searching for the overall values, the authors develop a three-level value
hierarchy for the supply chain risk and point out that every element in the hierarchy is able to be
used to locate the risks for any specific supply chain situation. It is also suggested that
alternatives should be generated in the hierarchical development process. In terms of the number
of alternatives that should be created, two to seven alternatives are recommended for multiple
attribute decision analysis.
A Value Focused Thinking Tutorial for Supply Chain Application (Jordan, 2012). This
research discusses the VFT application in supply chain decision making. According to the author,
various multi-criteria approaches are widely used to model supply chain and logistics problems.
However VFT is rarely considered in this field; thus the author presents a detailed VFT tutorial
and conducts VFT analysis on a common logistics problem – the supplier selection. The bottom-
up method is used to construct the supplier selection hierarchy, followed by a complete analysis
directed by the VFT methodology. Important strengths of VFT for supply chain problems are
that a VFT approach can reveal the true value that an alternative has for the decision and alert the
decision maker to derive better alternatives if the existing alternatives do not have a satisfying
value to the decision. It is a powerful feature for the supply chain problem which regularly has a

29
large number of alternatives. The new alternatives can be quickly valued and compared with the
others.
Transportation Readiness Assessment and Valuation for Emergency Logistics (Nachtmann
& Pohl, 2013). This article examines the readiness level of transportation considered by local
and state operation planners in their emergency preparedness plans. The transportation readiness
assessment and valuation for emergency logistics (TRAVEL) scorecard is developed to help the
operation planners identify the deficient areas in their emergency operations plans (EOP) and
improve them through evaluating the EOP quality with regards to transportation readiness. VFT
framework is applied in developing the TRAVEL tool and spreadsheet is used to provide
software platform for TRAVEL. Figure 2 shows the eight-step VFT processes that create
TRAVEL. The top-down method is employed to develop the value hierarchy in Step Two. Under
the fundamental problem of assessing transportation readiness of EOP, four supporting
objectives are placed at the second level, each of which further splits into several measurable
attributes. Three county-level EOPs are assessed by the authors to validate the TRAVEL
scorecard. The analysis results show that TRVEL can quickly identify the shortcomings of the
EOP with respect to transportation and enables the operation planners to revise the EOP
promptly.
Figure 2 TRAVEL Development Process (Nachtmann & Pohl, 2013)
Value Focused Thinking Analysis of the Pacific Theater’s Future Air Mobility En Route
System (Axtell, 2011). This study provides the decision makers in the Air Mobility Command

30
(AMC) with a validated decision tool to evaluate the locations in the future en route system in
the Pacific Theater. VFT methodology is used to analyze whether the proposed en route
locations have appropriate level of access in the Pacific Theater. A six-level value hierarchy with
twenty-seven attributes termed “En Route Base Selection Tactical Sub-model” developed by
previous researchers has been utilized as part of the overall value hierarchy (see Figure 3) in this
study. As can be seen in Figure 3, the tactical sub-model is included as one of the three
supporting objectives under the fundamental objective “Operational Value Score.” The case
study includes twenty current and eight future en route locations and evaluates each location
based on the operational value hierarchy. The author points out that the proposed VFT decision
analysis tool advocates replacing the existing en route linear system with a more integrated one.
Figure 3 Operational Value Hierarchy (Axtell, 2011)
Decision Analysis with Value-focused Thinking as a Methodology in Structuring the Civil
Engineering Operations Flight (Katzer, 2002). This study investigates how to help the
operations flight commander select the best organizational structure of the civil engineer
operations flight. The author believes that VFT methodology is one of the most ideally suited
approaches that can answer the two-fold questions regarding the selection decision – what values
are important to the decision and how the ranking of the alternatives changes with various
situations. Figure 4 displays operations flight value hierarchy. As described by the author, the
first-level fundamental objective is identified, followed by the brainstorming sessions of asking

31
“what does that mean” which further identifies four supporting values that are placed at the
second level. This question is asked repeatedly until the lowest level values are measurable. The
final alternative ranking reveals the extent to which the alternative meets the values from the
operations flight commander’s perspective in order to reach the fundamental objective.
Figure 4 Operations Flight Value Hierarchy (Katzer, 2002)
Technology Selection for the Air Force Research Laboratory Air Vehicles Directorate: An
Analysis Using Value Focused Thinking (Winthrop, 1999). This paper focuses on exploring
the technology direction that is most supportive to the U.S. Air Force values, which should be
given more consideration by the air vehicles directorate (VA) when they have sufficient funds.
Both VFT and optimization approaches are used in this analysis. Research and development
(R&D) literature are first reviewed to help identify the fundamental objective and supporting
objectives in the value hierarchy. In order to assure the value hierarchy represents the core values
of VA, a number of VA experts and leaders are involved in developing and confirming the value
definitions and the final hierarchy. Among over one hundred identified VA R&D programs, a
couple of them are selected in the case study. An additive value model is employed to evaluate
the overall score for each alternative, and sensitivity analysis is conducted at last.
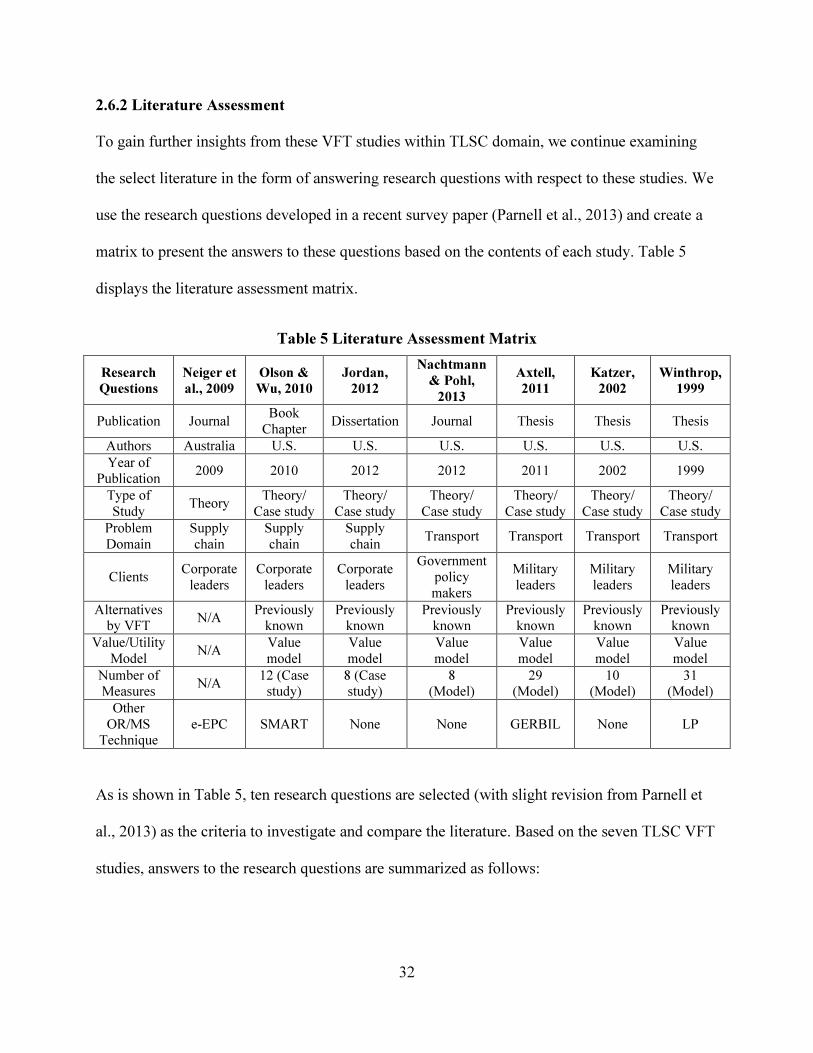
32
2.6.2 Literature Assessment
To gain further insights from these VFT studies within TLSC domain, we continue examining
the select literature in the form of answering research questions with respect to these studies. We
use the research questions developed in a recent survey paper (Parnell et al., 2013) and create a
matrix to present the answers to these questions based on the contents of each study. Table 5
displays the literature assessment matrix.
Table 5 Literature Assessment Matrix
Research
Questions
Neiger et
al., 2009
Olson &
Wu, 2010
Jordan,
2012
Nachtmann
& Pohl,
2013
Axtell,
2011
Katzer,
2002
Winthrop,
1999
Publication Journal Book
Chapter Dissertation Journal Thesis Thesis Thesis
Authors Australia U.S. U.S. U.S. U.S. U.S. U.S.
Year of
Publication 2009 2010 2012 2012 2011 2002 1999
Type of
Study Theory
Theory/
Case study
Theory/
Case study
Theory/
Case study
Theory/
Case study
Theory/
Case study
Theory/
Case study
Problem
Domain
Supply
chain
Supply
chain
Supply
chain Transport Transport Transport Transport
Clients Corporate
leaders
Corporate
leaders
Corporate
leaders
Government
policy
makers
Military
leaders
Military
leaders
Military
leaders
Alternatives
by VFT N/A
Previously
known
Previously
known
Previously
known
Previously
known
Previously
known
Previously
known
Value/Utility
Model N/A
Value
model
Value
model
Value
model
Value
model
Value
model
Value
model
Number of
Measures N/A
12 (Case
study)
8 (Case
study)
8
(Model)
29
(Model)
10
(Model)
31
(Model)
Other
OR/MS
Technique
e-EPC SMART None None GERBIL None LP
As is shown in Table 5, ten research questions are selected (with slight revision from Parnell et
al., 2013) as the criteria to investigate and compare the literature. Based on the seven TLSC VFT
studies, answers to the research questions are summarized as follows:

33
• Publication. Among the seven studies, we found that one is published as a book chapter,
two as journal articles, and four as a thesis or dissertation.
• Authors. All authors are from the U.S. except for one group of authors who are from
Australia.
• Year of Publication. Five out of seven studies are published within the past five years.
The other two studies are published in 2002 and 1999 respectively.
• Type of study. One research focuses mainly on building a theoretical model while the
others include both a theoretical methodology and a case study.
• Problem domain. Within TLSC, four studies are related to transportation, and three focus
on the supply chain.
• Clients. Corporate and military leaders are the two largest groups for which the select
VFT studies serve (each is involved in three papers). Only one study is conducted for
government policy makers.
• Alternatives by VFT. None of them actually use a VFT concept to design or improve the
alternatives. Alternatives are generated based on collected data/information.
• Value/Utility model. Not surprisingly, the value model dominates the utility model among
the literature. Six studies employ the additive value model.
• Number of measures. The number of measures in the value model range from eight to
thirty-one. Four papers determine the measures when the VFT framework is constructed.
Two publications identify the measures only in the case study.
• Other operations research or management science (OR/MS) technique. Four studies
integrate VFT and other OR/MS techniques in developing the methodology framework.
The techniques referred in these studies include extended-event-driven process chain (e-

34
EPC), simple multi-attribute rating theory (SMART), global en route basing
infrastructure location model (GERBIL), and linear programming (LP).
2.7 Analytic Hierarchy Process (AHP)5
Analytic Hierarchy Process (AHP) approach is employed to construct the multi-attribute decision
model in Chapter 7. AHP is widely used by decision makers and researchers to solve different
problems, and a large number of papers have been published relating to the AHP application.
Vaidya and Kumar (2006) classified the AHP papers according to the theme such as “selection,
evaluation, benefit-cost analysis, allocations, planning and development, priority and ranking,
and decision-making.” We primarily focus on the papers that fall into the “priority and ranking”
category which is more similar to our proposed cargo prioritization problem. Bandeira et al.
(2009) applied AHP technique to prioritize the maritime booking confirmations in the event of
the scarcity of the transportation supply. Financial, managerial and organizational factors are
incorporated in the evaluation process of the clients, which is on the consensus of both the sales
team and the top executives. Farhan and Fwa (2009) explored the AHP application on the
prioritization of the pavement maintenance activities with the objective of reflecting the
engineering opinions of a group of highway agencies and engineers. Three AHP forms are
considered and compared in terms of their suitability and effectiveness in the priority
assessments according to a direct assessment method. Modarres and Zarei (2002) examined the
city vehicle transport network for the earthquake crisis preparation, using an AHP model to
determine the trip priorities and the shortest path theory to identify the fastest and safest routes.
Hafeez et al. (2002) looked into how to determine a firm’s key capabilities in order to improve
its core competencies and adopted AHP to construct the evaluation framework. Contributions of
5 Excerpted from Section 2 of Chapter 7

35
firm capabilities are assessed for both financial and non-financial performances. An interesting
field in which AHP approach is also widely employed as the decision method is the sports
management. One example is Bodin and Epstein (2000)’s paper of using AHP to rank the players
in the professional baseball team for the expansion draft. Braglia (2000) explored the
effectiveness of AHP by proposing the multi-attribute failure mode analysis (MAFMA). It uses
an AHP-based method to prioritize failures identified in the reliability research in order to
determine the most appropriate corrective actions.
References
Ahanotu, D. N., Fischer, M. J., & Louch, H. W. (2003). Developing a commodity flow database from transearch data. Transportation Research Record: Journal of the Transportation Research Board, 1855(1), 14-21.
Almaz, O. (2012). Risk and performance analysis of ports and waterways: The case of Delaware river and bay. (Doctoral dissertation). Rutgers, the State University of New Jersey, New Brunswick. Aragon, C. T. (2000). Coconut program area research planning and prioritization. (No. DP 2000-31). Philippine Institute for Development Studies. Armstrong, G. R., Coleman, J. W., Hamilton, V. H., & Poe, J. W. (1983). Priority dispatch and aircraft scheduling: A study of strategic airlift scheduling. In Proceedings of the 15th conference on Winter Simulation-Volume 2 (pp. 579-588). IEEE Press. Axtell, P. G. (2011). Value focused thinking analysis of the Pacific Theater’s future air mobility en route system. (Master thesis). Air Force Institute of Technology, Wright-Patterson Air Force Base, Ohio. Bandeira, D. L., Becker, J. L., & Rocha, A. K. (2009). Applying AHP to the prioritization of maritime booking confirmation. In 2009 International Symposium on the Analytic Hierarchy/Network Process. Bemley, J., Davis, L., & Brock III, L. (2013). Pre-positioning commodities to repair maritime navigational aids. Journal of Humanitarian Logistics and Supply Chain Management, 3(1), 65-89.

36
Bennett, B. (2002). Market scoping: methods to help people understand their marketing environment. PLA Notes, 45, 71-75. Bodin, L., & Epstein, E. (2000). Who’s on first–with probability 0.4. Computers & Operations Research, 27(3), 205-215. Boile, M., Theofanis, S., & Golias, M. (2006). Berth allocation with service priorities: A linear reformulation. In Proceedings of the 5th WSEAS/IASME International Conference on System Science and Simulation in Engineering (ICOSSSE 2006), Tenerife, Canary Islands, Spain (pp. 16-18). Bolduc, M. C., Laporte, G., Renaud, J., & Boctor, F. F. (2010). A tabu search heuristic for the split delivery vehicle routing problem with production and demand calendars. European Journal of Operational Research, 202(1), 122-130. Braglia, M. (2000). MAFMA: Multi-attribute failure mode analysis. International Journal of Quality & Reliability Management, 17(9), 1017-1033. Bräysy, O., & Gendreau, M. (2005). Vehicle routing problem with time windows, Part II: Metaheuristics. Transportation science, 39(1), 119-139. Camp, J., Abkowitz, M., & LeBoeuf, E. (2010). Inland waterway resource and spill management needs in Southeastern USA. Disaster Prevention and Management, 19(4), 483-497. Channell, M., Graves, M., Medina, V., Morrow, A., Brandon, D., & Nestler, C. (2009). Enhanced tools and techniques to support debris management in disaster response missions. Retrieved from: http://acwc.sdp.sirsi.net/client/search/asset/1003216;jsessionid=25B198887FD8AD7064FE3BD066726326.enterprise-15000 Cordeau, J. F., Gendreau, M., & Laporte, G. (1997). A tabu search heuristic for periodic and multi-depot vehicle routing problems. Networks, 30(2), 105-119. Cordeau, J. F., Laporte, G., & Mercier, A. (2001). A unified tabu search heuristic for vehicle routing problems with time windows. Journal of the Operational research society, 52(8), 928-936. Cordeau, J. F., Gendreau, M., Laporte, G., Potvin, J. Y., & Semet, F. (2002). A guide to vehicle routing heuristics. Journal of the Operational Research society, 53(5), 512-522. Cordeau, J. F., & Laporte, G. (2005). Tabu search heuristics for the vehicle routing problem (pp. 145-163). Springer US. Cordeau, J. F., Laporte, G., Legato, P., & Moccia, L. (2005). Models and tabu search heuristics for the berth-allocation problem. Transportation science, 39(4), 526-538.

37
Côté, J. F., & Potvin, J. Y. (2009). A tabu search heuristic for the vehicle routing problem with private fleet and common carrier. European Journal of Operational Research, 198(2), 464-469. Dobbins, J. (2001). Development of an inland marine transportation risk management decision support system. (Doctoral dissertation). Vanderbilt University, Nashville. Du, Y., Chen, Q., Quan, X., Long, L., & Fung, R. Y. (2011). Berth allocation considering fuel consumption and vessel emissions. Transportation Research Part E: Logistics and Transportation Review, 47(6), 1021-1037. Du Plessis, L. (2004). A review of effective flood forecasting, warning and response system for application in South Africa. Water Sa, 28(2), 129-138. Environmental Protection Agency (EPA). (1995). Study of volatile organic compounds from consumer and commercial products. (EPA-453/R-94-066-A). Report to Congress. Environmental Protection Agency (EPA). (1999). Regulatory schedule for VOC-emitting consumer and commercial products revised. Air Pollution Consultant, 9(4), 2.26-2.27. Farhan, J., & Fwa, T. F. (2009). Pavement maintenance prioritization using analytic hierarchy process. Transportation Research Record: Journal of the Transportation Research Board, 2093(1), 12-24. Folga, S., Allison, T., Seda-Sanabria, Y., Matheu, E., Milam, T., Ryan, R., & Peerenboom, J. (2009). A systems-level methodology for the analysis of inland waterway infrastructure disruptions. Journal of Transportation Security, 2(4), 121-136. Gendreau, M., Hertz, A., & Laporte, G. (1994). A tabu search heuristic for the vehicle routing problem. Management science, 40(10), 1276-1290. Gendreau, M., Iori, M., Laporte, G., & Martello, S. (2008). A tabu search heuristic for the vehicle routing problem with two-dimensional loading constraints. Networks, 51(1), 4-18. Giallombardo, G., Moccia, L., Salani, M., & Vacca, I. (2010). Modeling and solving the tactical berth allocation problem. Transportation Research Part B: Methodological, 44(2), 232-245. Golias, M., Boile, M., Theofanis, S. (2009). Berth scheduling by customer service differentiation: A multi-objective approach. Transportation Research Part E: Logistics and Transportation Review, 45(6), 878-892. Golias, M., Boile, M., Theofanis, S., & Efstathiou, C. (2010). The berth-scheduling problem. Transportation Research Record: Journal of the Transportation Research Board, 2166(1), 20-27. Grandjean, P. J., & Newbury, C. J. (2001). An assessment of the World Wide Express (WWX) program and its effects on Customer Wait Time (CWT) and readiness. (Master thesis). Naval Postgraduate School, Monterey, CA.

38
Hafeez, K., Zhang, Y., & Malak, N. (2002). Determining key capabilities of a firm using analytic hierarchy process. International journal of production economics, 76(1), 39-51. Han, X. L., Lu, Z. Q., & Xi, L. F. (2010). A proactive approach for simultaneous berth and quay crane scheduling problem with stochastic arrival and handling time. European Journal of Operational Research, 207(3), 1327-1340. Hansen, E., & Cowi, A.S. (2003). Ranking of industrial products. Danish Environmental Protection Agency Environmental Project No.839. Ibrahim, A., & Ayyub, B. M. (1992). Multi-criteria ranking of components according to their priority for inspection. Fuzzy Sets and Systems, 48(1), 1-14. Imai, A., Nagaiwa, K. I., & Tat, C. W. (1997). Efficient planning of berth allocation for container terminals in Asia. Journal of Advanced Transportation, 31(1), 75-94. Imai, A., Nishimura, E., & Papadimitriou, S. (2001). The dynamic berth allocation problem for a container port. Transportation Research Part B: Methodological, 35(4), 401-417. Imai, A., Nishimura, E., & Papadimitriou, S. (2003). Berth allocation with service priority. Transportation Research Part B: Methodological, 37(5), 437-457. Imai, A., Zhang, J. T., Nishimura, E., & Papadimitriou, S. (2007). The berth allocation problem with service time and delay time objectives. Maritime Economics & Logistics, 9(4), 269-290. Jordan, J. D. (2012). A value focused thinking tutorial for supply chain application. In The average network flow problem: Shortest path and minimum cost flow formulations, algorithms,
heuristics, and complexity. (Doctoral dissertation). Air Force Institute of Technology, Wright-Patterson Air Force Base, Ohio. Katzer, D. J. (2002). Decision analysis with value-focused thinking as a methodology in structuring the civil engineering operations flight. (Master thesis). Air Force Institute of Technology, Wright-Patterson Air Force Base, Ohio. Laporte, G. (2009). Fifty years of vehicle routing. Transportation Science, 43(4), 408-416. Lau, H. C., Chan, T. M., Tsui, W. T., Ho, G. T., & Choy, K. L. (2009). An AI approach for optimizing multi-pallet loading operations. Expert Systems with Applications, 36(3), 4296-4312. Mackenzie, K. (2012). Interdependent impacts of disruption management: Risk-based applications to port closures, natural disasters, and oil spills. (Doctoral dissertation). University of Oklahoma, Norman. Madden, D. (1995). Labour supply, commodity demand and marginal tax reform. The Economic Journal, 485-497.
39
Mar Inc. (1987). Deployable waterfront transportability study using heavy lift submersible ships. NCEL Contract Report AD-A190 693. Meisel, F., & Bierwirth, C. (2009). Heuristics for the integration of crane productivity in the berth allocation problem. Transportation Research Part E: Logistics and Transportation Review, 45(1), 196-209. Modarres, M., & Zarei, B. (2002). Application of network theory and AHP in urban transportation to minimize earthquake damages. Journal of the Operational Research Society, 1308-1316. Nachtmann, H., & Pohl, E. A. (2013). Transportation readiness assessment and valuation for emergency logistics. International Journal of Emergency Management, 9(1), 18-36. Nagy, J.G., & Quddus, M. A. (1998). National agricultural commodity research priorities for Pakistan. Agricultural Economics, 19(3), 327-340. Neiger, D., Rotaru, K., & Churilov, L. (2009). Supply chain risk identification with value-focused process engineering. Journal of Operations Management, 27, 154-168. Nishimura, E., Imai, A., & Papadimitriou, S. (2001). Berth allocation planning in the public berth system by genetic algorithms. European Journal of Operational Research, 131(2), 282-292. Olson, D. L., & Wu, D. (2010). Enterprise Risk Management Models. Berlin Heidelberg: Springer-Verlag. Parnell, G. S., Hughes, D. W., Burk, R. C., Driscoll, P. J., Kucik, P. D., Morales, B. L., & Nunn, L. R. (2013). Survey of value-focused thinking: Applications, research development and areas for future research. Journal of Multi-criteria Decision Analysis, 20, 49-60. Raa, B., Dullaert, W., & Schaeren, R. V. (2011). An enriched model for the integrated berth allocation and quay crane assignment problem. Expert Systems with Applications, 38(11), 14136-14147. Rochat, Y., & Taillard, É. D. (1995). Probabilistic diversification and intensification in local search for vehicle routing. Journal of heuristics, 1(1), 147-167. Schank, J., Mattock, M., Sumner, G., Greenberg, I., Rothenberg, J., & Stucker, J. P. (1991). A review of strategic mobility models and analysis (No. RAND/R-3926-JS). Rand Corp, Santa Monica, CA. Sinclair, M., & Van Dyk, E. (1987). Combined routeing and scheduling for the transportation of containerized cargo. Journal of the Operational Research Society, 38(6), 487-498.

40
Taillard, É. D., Gambardella, L. M., Gendreau, M., & Potvin, J. Y. (2001). Adaptive memory programming: A unified view of metaheuristics. European Journal of Operational Research, 135(1), 1-16. Tarantilis, C. D. (2005). Solving the vehicle routing problem with adaptive memory programming methodology. Computers & Operations Research, 32(9), 2309-2327. Theofanis, S., Boile, M., & Golias, M. (2007). An optimization based genetic algorithm heuristic for the berth allocation problem. In Evolutionary Computation, 2007. CEC 2007. IEEE Congress on (pp. 4439-4445). IEEE. Tong, J., & Nachtmann, H. (2012). A review of cargo prioritization techniques within inland waterway transportation. Proceedings of the 2012 Industrial Engineering Research Conference. Tong, J., Nachtmann, H., & Pohl, E.A. (2013). Value-focused thinking for inland waterborne cargo prioritization. Proceedings of the American Society for Engineering Management 2013 International Annual Conference. Umang, N., Bierlaire, M., Vacca, I. (2013). Exact and heuristic methods to solve the berth allocation problem in bulk ports. Transportation Research Part E: Logistics and Transportation Review, 54, 14-31. U.S. Department of Homeland Security (USDHS). (2006). National strategy for maritime security: the maritime infrastructure recovery plan. Retrieved from: http://www.dhs.gov/xlibrary/assets/HSPD_MIRPPlan.pdf U.S. Department of Homeland Security (USDHS). (2007). Strategy to enhance international supply chain security. Retrieved from: http://www.dhs.gov/xlibrary/assets/plcy-internationalsupplychainsecuritystrategy.pdf U.S. Government Accountability Office (GAO). (2007). Port Risk Management: Additional Federal Guidance Would Aid Ports in Disaster Planning and Recovery. (GAO-07-412). Retrieved from: http://libinfo.uark.edu/reference/citations/apa.asp#conference Vaidya, O. S., & Kumar, S. (2006). Analytic hierarchy process: An overview of applications. European Journal of operational research, 169(1), 1-29. Wang, S., Meng, Q., & Liu, Z. (2013). A note on “Berth allocation considering fuel consumption and vessel emissions”. Transportation Research Part E: Logistics and Transportation Review, 49(1), 48-54. Wang, S., Tao, X., & Schonfeld, P. (2006). Modeling shipper response to scheduled waterway lock closures. Transportation Research Record: Journal of the Transportation Research Board, 1963(1), 33-43.

41
Wassan, N. A., Wassan, A. H., & Nagy, G. (2008). A reactive tabu search algorithm for the vehicle routing problem with simultaneous pickups and deliveries. Journal of combinatorial optimization, 15(4), 368-386. Winthrop, M. F. (1999). Technology selection for the air force research laboratory air vehicles directorate: An analysis using value focused thinking. (Master thesis). Air Force Institute of Technology, Wright-Patterson Air Force Base, Ohio. Xu, D., Li, C. L., & Leung, J. Y. T. (2012). Berth allocation with time-dependent physical limitations on vessels. European Journal of Operational Research, 216(1), 47-56. Zaloom, V., & Subhedar, V. (2009). Use of the Delphi Method to prioritize events impacting operations in the maritime domain. Lamar University. Working Paper. Retrieve from: http://dept.lamar.edu/industrial/ports/subhedar_041609_mdp_041709-r4_mdp_060609-r1.pdf Zhen, L., & Chang, D. F. (2012). A bi-objective model for robust berth allocation scheduling. Computers & Industrial Engineering, 63(1), 262-273.
42
3. A REVIEW OF CARGO PRIORITIZATION TECHNIQUES WITHIN INLAND
WATERWAY TRANSPORTATION6
Jingjing Tong, M.S.
Heather Nachtmann, Ph.D.
Abstract
In order to support the development of a cargo prioritization model for inland waterway
transportation and as part of ongoing research funded by the U.S. Department of Homeland
Security, the paper provides a vital knowledge base of existing cargo prioritization models by
reviewing twenty selected papers from governmental agencies and academic institutions. A
methodology comparison matrix is constructed based on three criteria that summarize features of
the cargo prioritization methods.
Key Words: Inland Waterways; Cargo Prioritization; Literature Review
1. Introduction
Inland waterways play an important role in the Nation’s transportation system. Disruption of the
inland waterway transportation system can have widespread economic and societal impacts. In
order to mitigate these impacts, ongoing research funded by the U.S. Department of Homeland
Security is developing a prototype decision support system to provide timely knowledge of what
barge cargoes should be prioritized for offloading in the event of a disruption while considering
the availability and capacity of nearby ports and land-based freight infrastructure to receive and
6 Published in Proceedings of the 2012 Industrial Engineering Research Conference

43
transport these cargoes. This paper establishes a knowledge base of exiting prioritization
methods to support cargo prioritization model development in our future research. A total of
twenty papers that include prioritization methods across a diverse set of application contexts are
selected for review.
2. Review of Selected Papers
2.1 “Market scoping: Methods to help people understand their marketing environment”
(Bennet, 2002)
Bennet (2002) develops multiple techniques to examine the marketing environment of rural
communities. One method prioritizes products based on their economic and social importance in
order to identify the products that should receive more attention in the analysis of market scoping.
Three steps are involved in Bennet’s prioritization process:
• Identify products that have been marketed before or have value to be marketed.
• Identify criteria by which to prioritize the products.
• Score each product for each criterion on a scale of one to three and calculate the total
score of the product.
2.2 “Multi-criteria ranking of components according to their priority for inspection”
(Ibrahim and Ayyub, 1992)
The authors propose a fuzzy multi-criterion risk-based prioritization method to determine the
order in which the critical components of the system are inspected in order to enhance the
inspection effectiveness. For the alternatives �� , � = ���: � = 1,2, … ,�� represents a fuzzy set
of criteria and ������ ∈ 0,1 indicates the extent to which the alternative satisfies the
corresponding criterion. Decision function R is shown as follows:

44
� = �� ∩ �� ∩ …∩ �� (1)
The m fuzzy sets of criteria are transformed into the decision fuzzy set by selecting the minimum
score assigned to the alternative among all the criteria. The alternative with the maximum score
in the decision fuzzy set is selected as the best candidate. In addition, through attaching a scalar
number α to each criterion, the authors address the issue of the different importance levels of the
criteria. The improvement is shown as follows:
� = ��
∝� ∩ ��
∝� ∩ …∩ ��∝� (2)
A number of criteria for prioritizing components are used in this paper, among which economic
and human risks are the factors that have potential to be used in cargo prioritization for inland
waterway transportation.
2.3 “Danish environmental protection agency environmental project No.839: Ranking of
industrial products” (Hansen and Cowi, 2003)
This report focuses on prioritizing industrial products in Denmark based on losses of resources
and energy consumption in order to identify the commodity groups that have the most negative
impact on the environment and should be considered first when the associated cleaner
technology is developed. The prioritization method is illustrated through the following formula:
P = PR + PE (3)
PR represents the prioritization criterion associated with loss of resources, which is the amount of
the non-recycled materials. PE represents the prioritization criterion associated with energy
consumption, which is defined as the amount of energy consumed in production phase minus the
amount of energy that is recycled from incinerating the materials that end up as waste. The
prioritization method is based on the integration of both criteria. The prioritized products
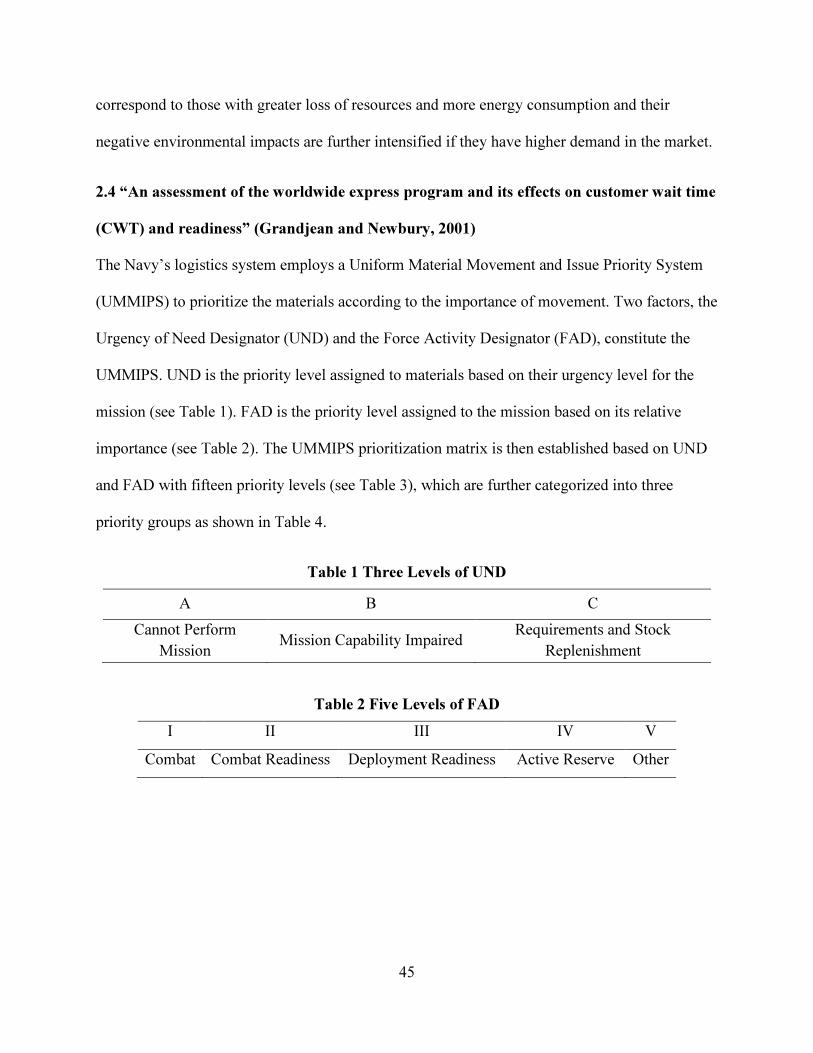
45
correspond to those with greater loss of resources and more energy consumption and their
negative environmental impacts are further intensified if they have higher demand in the market.
2.4 “An assessment of the worldwide express program and its effects on customer wait time
(CWT) and readiness” (Grandjean and Newbury, 2001)
The Navy’s logistics system employs a Uniform Material Movement and Issue Priority System
(UMMIPS) to prioritize the materials according to the importance of movement. Two factors, the
Urgency of Need Designator (UND) and the Force Activity Designator (FAD), constitute the
UMMIPS. UND is the priority level assigned to materials based on their urgency level for the
mission (see Table 1). FAD is the priority level assigned to the mission based on its relative
importance (see Table 2). The UMMIPS prioritization matrix is then established based on UND
and FAD with fifteen priority levels (see Table 3), which are further categorized into three
priority groups as shown in Table 4.
Table 1 Three Levels of UND
A B C
Cannot Perform Mission
Mission Capability Impaired Requirements and Stock
Replenishment
Table 2 Five Levels of FAD
I II III IV V
Combat Combat Readiness Deployment Readiness Active Reserve Other
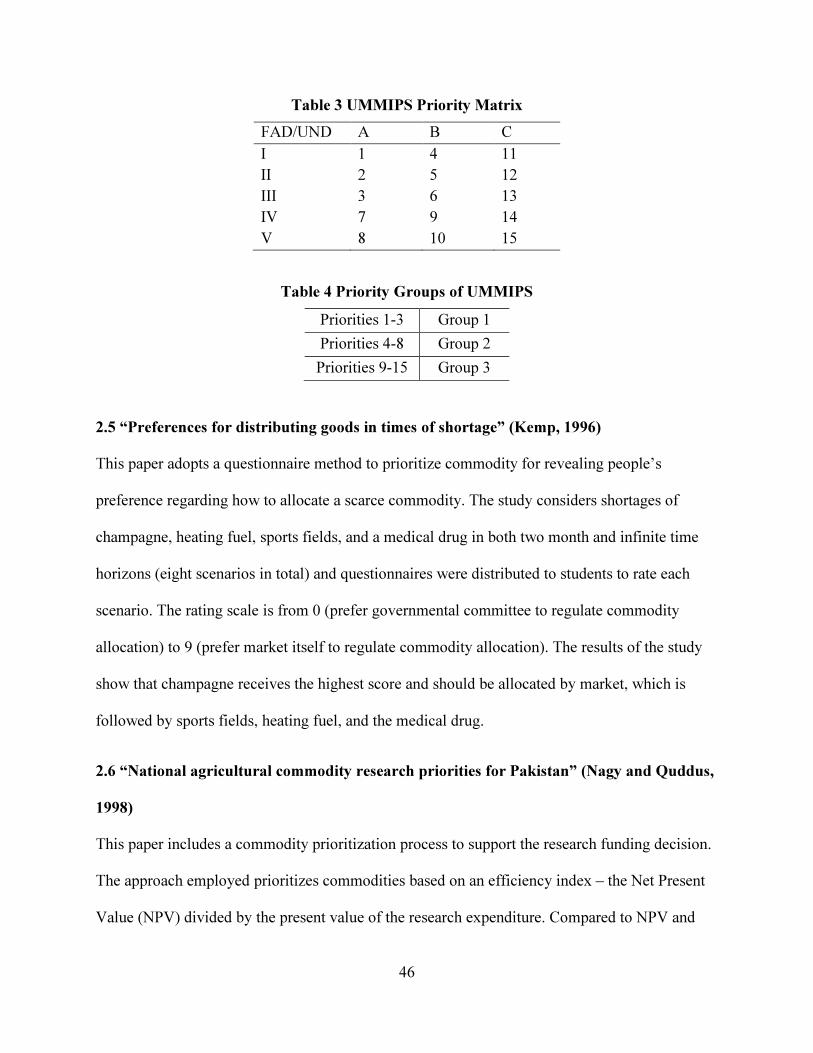
46
Table 3 UMMIPS Priority Matrix
FAD/UND A B C I 1 4 11 II 2 5 12 III 3 6 13 IV 7 9 14 V 8 10 15
Table 4 Priority Groups of UMMIPS
Priorities 1-3 Group 1
Priorities 4-8 Group 2
Priorities 9-15 Group 3
2.5 “Preferences for distributing goods in times of shortage” (Kemp, 1996)
This paper adopts a questionnaire method to prioritize commodity for revealing people’s
preference regarding how to allocate a scarce commodity. The study considers shortages of
champagne, heating fuel, sports fields, and a medical drug in both two month and infinite time
horizons (eight scenarios in total) and questionnaires were distributed to students to rate each
scenario. The rating scale is from 0 (prefer governmental committee to regulate commodity
allocation) to 9 (prefer market itself to regulate commodity allocation). The results of the study
show that champagne receives the highest score and should be allocated by market, which is
followed by sports fields, heating fuel, and the medical drug.
2.6 “National agricultural commodity research priorities for Pakistan” (Nagy and Quddus,
1998)
This paper includes a commodity prioritization process to support the research funding decision.
The approach employed prioritizes commodities based on an efficiency index – the Net Present
Value (NPV) divided by the present value of the research expenditure. Compared to NPV and
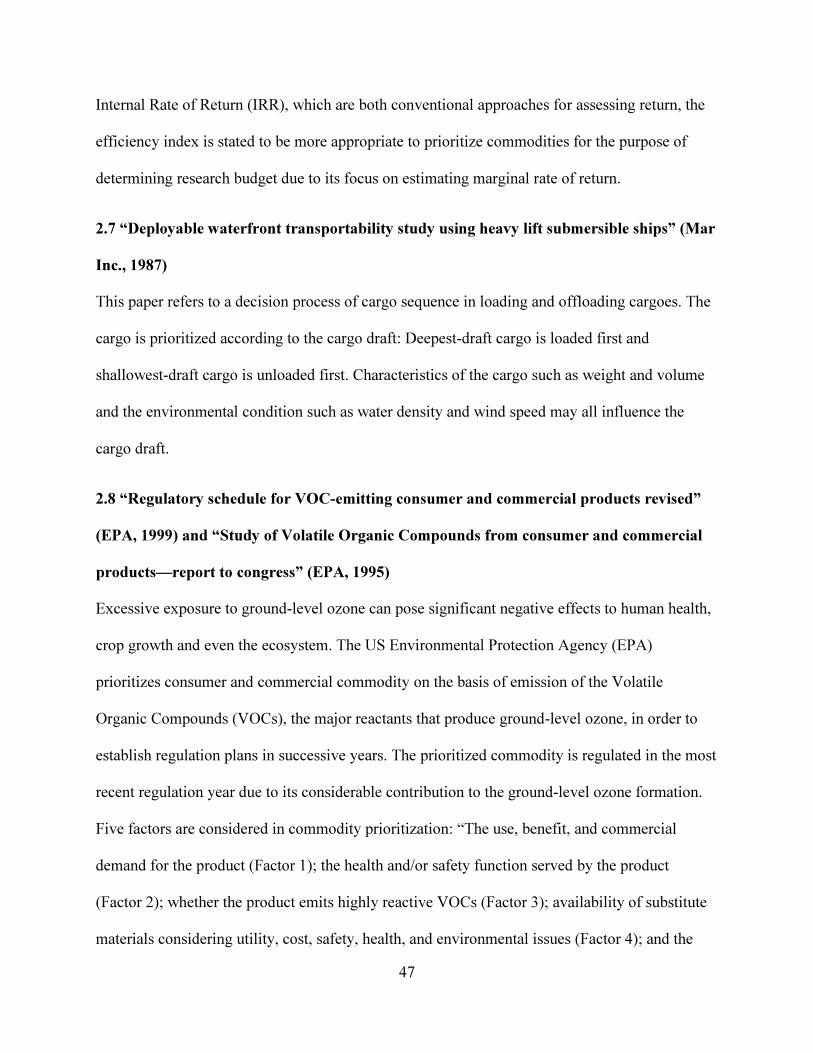
47
Internal Rate of Return (IRR), which are both conventional approaches for assessing return, the
efficiency index is stated to be more appropriate to prioritize commodities for the purpose of
determining research budget due to its focus on estimating marginal rate of return.
2.7 “Deployable waterfront transportability study using heavy lift submersible ships” (Mar
Inc., 1987)
This paper refers to a decision process of cargo sequence in loading and offloading cargoes. The
cargo is prioritized according to the cargo draft: Deepest-draft cargo is loaded first and
shallowest-draft cargo is unloaded first. Characteristics of the cargo such as weight and volume
and the environmental condition such as water density and wind speed may all influence the
cargo draft.
2.8 “Regulatory schedule for VOC-emitting consumer and commercial products revised”
(EPA, 1999) and “Study of Volatile Organic Compounds from consumer and commercial
products—report to congress” (EPA, 1995)
Excessive exposure to ground-level ozone can pose significant negative effects to human health,
crop growth and even the ecosystem. The US Environmental Protection Agency (EPA)
prioritizes consumer and commercial commodity on the basis of emission of the Volatile
Organic Compounds (VOCs), the major reactants that produce ground-level ozone, in order to
establish regulation plans in successive years. The prioritized commodity is regulated in the most
recent regulation year due to its considerable contribution to the ground-level ozone formation.
Five factors are considered in commodity prioritization: “The use, benefit, and commercial
demand for the product (Factor 1); the health and/or safety function served by the product
(Factor 2); whether the product emits highly reactive VOCs (Factor 3); availability of substitute
materials considering utility, cost, safety, health, and environmental issues (Factor 4); and the
48
cost-effectiveness of VOC emission controls for the product (Factor 5)”. EPA further extends the
five factors into eight criteria to establish regulation priorities (see Table 5). The prioritized
commodities are categorized into four groups with different regulation priority levels.
Table 5 EPA Factors and Criteria of VOC Regulation
Factor 1 • Criterion 1 – Utility
• Criterion 2 – Commercial demand
Factor 2 • Criterion 3 – Health or safety functions
Factor 3 • Criterion 4 – Emissions of “highly reactive” compounds
Factor 4 • Criterion 5 – Availability of alternatives
Factor 5 • Criterion 6 – Cost-effectiveness of controls
Additional Considerations • Criterion 7 – Magnitude of annual VOC emissions
• Criterion 8 – Regulatory efficiency
2.9 “An AI approach for optimizing multi-pallet loading operations” (Lau et al., 2009)
The paper develops a hybrid approach of heuristics and Genetic Algorithms (GAs) to solve the
multi-pallet loading problem. One step of the Profit-based Loading (PL) heuristic is to sort the
cargoes according to revenue – the shipping cost paid by cargo owners. This cost is determined
by the chargeable weight of the cargo – the volume weight or the actual weight. The cost is
estimated based on the larger amount of these two weights. The volume weight and the actual
weight are defined as follows:
���������ℎ� = ������
∀� ∈ � (4)
����������ℎ� = ��∀� ∈ � (5)
C is the index set of cargoes, C = {1, 2 …N};
��, ��, ℎ� are the width, length and height of the cargo � respectively;
6000 is the factor utilized in air transport to convert the volume to volume weight;
�� is the weight of the cargo �.

49
Revenue is calculated by multiplying the cargo forwarding price and the larger chargeable
weight. The cargo is prioritized according to its revenue.
2.10 “Priority dispatch and aircraft scheduling: A study of strategic airlift scheduling”
(Armstrong et al., 1983)
This paper put forth a methodology to evaluate algorithms for allocating strategic airlift
resources and rules for cargo priority dispatch. In order to assess the effectiveness of the
proposed methodology, five rules for prioritizing cargo for dispatch purposes are selected as the
test cases:
• Aircraft preference: Cargoes of the same type are assigned to an aircraft that has
preference on that type of cargoes.
• Earliest Due Date (EDD): Cargoes are prioritized by their due dates in increasing order.
• Smallest Weight (SWT): Cargoes are prioritized by their weights in increasing order.
• Largest Weight (LWT): Cargoes are prioritized by their weights in decreasing order.
• Slack per operation: It represents the remaining days before the due date divided by the
operation quantity.
A description of how to systematically prioritize cargo once the above factors are determined is
not provided in the paper.
2.11 “The International Institute of Tropical Agriculture's (IITA) experience in priority
assessment of agricultural research” (Manyong et al., 2009)
This paper consists of two prioritization approaches for identifying agricultural research
programs that should be carried out with high priority. The quantitative approach – Priority
Assessment Exercise (PAE) – determines which commodities should be researched first to best
contribute to decreasing poverty levels in Nigeria. In PAE, two sub-approaches are used. An

50
efficiency-based approach adopts the factors of Net Present Value (NPV) and Internal Rates of
Return (IRR) to assign priorities to the commodity research programs. An equity-based approach
allocates priorities to the commodities that can obtain the largest poverty decreases using a
function of poverty estimation.
2.12 “Developing a commodity flow database from transearch data” (Ahanotu et al., 2007)
This paper includes a commodity prioritization method to identify important non-manufactured
goods that should be filed in the Transearch database to modify the Transearch’s incompleteness.
The commodities are prioritized by the weighted average of the amount percentage of
commodity transported in different directions. The first four prioritized commodities will be
added to the database.
2.13 “Combined routing and scheduling for the transportation of containerized cargo”
(Sinclair and Dyk, 1987)
This paper develops an algorithm to solve a combined routing and scheduling tractor-trailer
problem. One aspect of the decision of movement priorities provides general qualitative
principles for cargo prioritization:
• Priority should be given to export movement as compared to the import movement since
the export cargoes must be loaded onto overseas vessels in time for departure.
• Priority should be given to movements that require execution time in commodity export.
• The highest priority should be given to the refrigerated containers in commodity import.
2.14 “Labor supply, commodity demand and marginal tax reform” (Madden, 1995)
This article employs labor supply to estimate the marginal revenue cost (MRC) for indirect and
direct taxation. There are three versions with respect to the calculation of the MRC: LESo1,

51
LESo2, and LESo3. Commodities are prioritized based on the MRC with varied LES systems.
The prioritization results are similar among the three LES systems with only slight differences.
Commodities of services, fuel and power, clothing and footwear are given higher priorities than
other commodities in all three systems. Alcohol is given the lowest priority in all three systems.
2.15 “A review of strategic mobility models and analysis” (Schank et al., 1991)
In RAND’s report of reviewing and comparing five strategic mobility models, one comparison
step is to prioritize cargo for shipping. The prioritization methods for the five models are shown
in Table 6.
Table 6 Assigning Priorities to Cargoes
Priority MIDAS RAPIDSIM TFE SEACOP FLOGEN
First RDD-time LAD LAD LAD-time LAD-time
Second RLD ALD Channel
Third CINC’s priority
Fourth Priority add-on
Option CINC’s priority
The MIDAS, SEACOP and FLOGEN models all prioritize cargo based on the predicted latest
shipping date by subtracting the estimated time for loading, travelling and offloading from the
Required Delivery Date (RDD) or the Latest Arrival Date (LAD). The RDD and LAD models
deliver very similar prioritization results since the two factors are highly interrelated with each
other. The FLOGEN model sometimes employs the Commander in Chief (CINC)’s priority
method instead of the LAD-time approach. In Table 6, RLD represents the “Ready to Load
Date” and ALD indicates the “Available to Load Date”.

52
2.16 “Coconut program area research planning and prioritization” (Aragon, 2000)
This paper contains a commodity prioritization method based on selected statistical parameters
by the Science and Technology Coordinating Council (STCC) in the Philippines to examine the
current research situation of its coconut industry. The authors assign a score to each commodity
for each statistical parameter and calculate the weighted average of the assigned scores to
prioritize commodity. Three groups of statistical parameters are selected to produce three
weighted averages of assigned scores for each commodity. The final prioritization decision is
made upon the prioritization results from the various statistical parameter groups.
2.17 “Who should set airlift priorities during foreign humanitarian assistance/disaster
relief operations and on what basis” (Weinberger, 2010)
The system of Department of Defense transportation movement priorities is introduced in this
paper. This system does not explicitly indicate which type of cargo or passenger should be
prioritized for transportation but determine the relative importance of the
missions/activities/programs/projects that the cargo or the passenger is involved with. The lift
manager needs to provide transportation resources to the cargo or the passenger associated with
missions of highest priority levels if the demand of transportation exceeds the available capacity.
In general, this priority system is a requirement-based operational guide rather than a cargo-
based prioritization approach.
2.18 “Strategy to enhance international supply chain security” (USDHS, 2007)
This report puts forth a strategic plan for international supply chain security. The plan includes
prioritizing commodities locally and nationally for transportation during the trade resumption
phase. The following issues are considered in prioritizing local commodity movement:

53
• Vessel security: whether the vessel is cleared for entry and whether it contains a high risk
commodity
• Berthing: whether the vessel can travel to or from its berth in terms of
berthing/space/facility availability and whether the waterway functionality places
detrimental impact to the vessel’s berthing activity
• Port infrastructure: whether the port infrastructure has sufficient capacity to unload and
transport the cargoes out of the port
• Commodity needs: demand level of the commodity is considered for this issue
• Commodity movement: whether the commodity should be moved out of the port to
prevent further disasters
The following goods are given priority in meeting national security requirements:
• Goods that are in emergency need to save lives
• Goods necessary to carry out response actions to the incident
• Goods that recover the immediate commodity shortage due to the incident
• Goods that are associated with national security influenced by the incident
In addition to the above general prioritization principles, a decision tree is utilized to prioritize
commodities and a scoring system to support rapid prioritization is recommended by the authors.
2.19 “National strategy for maritime security: The maritime infrastructure recovery plan”
(USDHS, 2006)
This report proposes a Maritime Infrastructure Recovery Plan (MIRP) to restore sea transport
capabilities and minimize negative effects of the Transportation Security Incident (TSI). When
considering TSI response and recovery, the authors state that the recovery stage should include a

54
step of setting priorities for passenger and cargo movements at the national, regional and local
levels. Several types of inbound transit cargo are prioritized including fuel oil (specific to cold
weather ports in winter), gas and diesel, perishable commodities, and assembly line components
(in winter and summer).
3. Prioritization Model Comparison
Among the reviewed papers, we did not observe a commonly agreed upon cargo prioritization
model for general application or specifically for inland waterway transportation. The
prioritization methods employed in the reviewed papers are usually simple or implicit
approaches without detailed methodology descriptions since the cargo prioritization decision
itself is not the main focus of the majority of these papers but simply a necessary step to support
their core models. Moreover, the existing cargo prioritization approaches are varied in technique
and associated factors due to their diverse application contexts. Table 7 summarizes the
collective features of the prioritization techniques found in the twenty selected papers.
3.1 Comparison Criteria
We select three criteria to compare the cargo prioritization techniques: “Prioritization
Technique”, “Specific Application Context”, and “Number of Factors”. Review of the
comparison matrix provides a high-level understanding of the basic prioritization approach each
paper employs, whether the method is used in a specific application context, and how many
factors the author considers in cargo prioritization.
3.2 Model Comparison
A summary description of the Table 7 model comparison based on each of the three criteria is
provided in this section:

55
• “Prioritization Technique”: Five papers provide a number of standards or guidelines one
should consider when prioritizing cargo without indicating an explicit assessment
methodology (EPA, 1999; Sinclair & Dyk, 1987; Weinberger, 2010; USDHS, 2007;
SUDHS, 2006). Another six papers include both criteria and prioritization technique in
their approaches, either quantitatively or qualitatively (Bennett, 2002; Ibrahim & Ayyub,
1992; Hansen & Cowi, 2003; Grandjean & Newbury, 2001; EPA, 1995; Aragon, 2000).
All of the six papers adopt a particular method to evaluate the criteria for each type of
cargo and synthesize the evaluation results of all criteria. A single paper utilizes the
questionnaire approach to prioritize cargo through information collection from the public
(Kemp, 1996). Papers not appearing in the category of “Prioritization Technique”
employ a simple prioritization approach – prioritizing cargo based on a single factor –
rather than a systematic technique.
• “Specific Application Context”: Although the reviewed papers consider a dozen of
diverse application contexts, environmental and military application contexts appear
more frequently than other application sectors. Three papers consider prioritization based
on environmental issues such as minimizing negative environmental impacts (Hansen &
Cowi, 2003; EPA, 1999; EPA, 1995). Four papers consider prioritization to satisfy
military objectives such as establishing the appropriate strategic plan for cargo movement
(Grandjean & Newbury, 2001; Armstrong et al., 1983; Schank et al., 1991; Weinberger,
2010).
• “Number of Factors”: The prioritization methods employed are almost evenly split
between utilizing single and multiple factors for prioritizing cargo. The six papers with a
single factor have the most straightforward prioritization approach by which the cargo

56
prioritization order is determined based on a single factor value (Nagy & Quddus, 1998;
Mar Inc., 1987; Lau et al., 2009; Armstrong et al., 1983; Ahanotu et al., 2007; Madden,
1995). For papers with multiple factors, either a prioritization technique is proposed to
synthesize the factor impacts and deliver the final prioritization order or the paper simply
provides a list of factors that influence the prioritization without explicitly indicating
prioritization approach. In total, there are three papers that consider two factors in their
prioritization approach (Hansen & Cowi, 2003; Grandjean & Newbury, 2001; Manyong
et al., 2009) and eight papers that utilize multiple factors (Bennett, 2002; Ibrahim &
Ayyub, 1992; EPA, 1999; EPA, 1995; Schank et al., 1991; Aragon, 2000; USDHS, 2007;
SUDHS, 2006).

57
Table 7 Comparison Matrix for Cargo Prioritization Methods
Reference
Prioritization Technique Specific Application Context Number of Factors
Stand
ards
Criteria
Assessment
Questio
nnaire Environmental Military Other Single Two Multiple
Bennett, 2002
-Assign score
to each
criterion
-Estimate the
total score
-Market scoping
-Profitability
-Traditionally
important
-Seasonal
advantage, etc.
Ibrahim and
Ayyub, 1992
-Fuzzy multi-
criterion risk-
based ranking
-Component
inspection
-Economic risk
-Human risk, etc.
Hansen and
Cowi, 2003
-Summation of
criteria values
-Negative
environmental
impact by industrial
products
-Loss of resources
-Energy
consumption
Grandjean,
and Newbury,
2001
-Uniform
Material
Movement and
Issue Priority
System
-Navy’s
logistics
system
-Urgency of Need
Designator
-Force Activity
Designator
Kemp, 1996
-Survey
from
students
-Scarce
commodity
allocation
Nagy and
Quddus, 1998
-Research
funding decision
-Net Present
Value (NPV)
MAR Inc.,
1987
-Cargo sequence
decision -Cargo draft
EPA, 1999 -Five
factors
-Volatile Organic
Compounds (VOC)
-The uses, benefits,
and commercial
demand of
consumer and
commercial product,
etc.
EPA, 1995 -Eight criteria -Volatile Organic
Compounds (VOC)
-Utility
-Commercial
demand, etc.
Lau et al.,
2009
-Multi-pallet
loading problem -Revenue

58
Table 7 Comparison Matrix for Cargo Prioritization Methods (Cont.)
Reference
Prioritization Technique Specific Application Context Number of Factors
Standards Criteria
Assessment
Questio
nnaire
Environ
mental Military Other Single Two Multiple
Armstrong
et al., 1983
-Strategic
airlift
scheduling
-Aircraft preference/
Earliest due date/
Smallest weight/
Largest weight/
Slack per operation
Manyong,
2009
-Agricultural
research
decision
-Net Present
Value (NPV)
-Internal Rates
of Return (IRR)
Ahanotu,
2007
-Database
modification
-Weighted average
of commodity
amount in different
directions
Sinclair
and Dyk,
1987
-Movement
priority criteria
-Tractor-trailer
problem
Madden,
1995
-Indirect and
direct taxation
-Marginal Revenue
Cost (MRC)
Schank,
1991
-Strategic
mobility
-Latest Arrival Date
-Commander in Chief
-Ready to Load Date,
etc.
Aragon,
2000
-Assign score
to varied
statistical
parameters
-Coconut
research
-Value of production
-Number of
beneficiaries, etc.
Weinberger
, 2010
-DOD
Transportation
Movement
Priorities
-Airlift
during
Foreign
Relief
Operations
DHS, 2007
-Guidelines for
commodity
movement
locally and
nationally
-International
supply chain
security
-Commodity needs
-Commodity
movement
-Port infrastructure,
etc.
DHS, 2006
-Priorities for
cargo
movements
-Maritime
security
-Gas and diesel
-Perishable
commodity, etc.

59
4. Conclusions
This paper reviews existing cargo prioritization techniques found in the literature and compares
technique features based on three selected criteria. It provides a useful knowledge base for the
development of a cargo prioritization model for inland waterway transportation. Our future
research focuses on formulating a deterministic mathematical programming model for cargo
prioritization in inland waterway transportation. This model will provide the authorities along
inland waterways as well as private industry with a decision support tool to prioritize cargo on
barges in the event of inland waterway disruption and transload them to other modes in an
efficient and rational manner.
Acknowledgement and Disclaimer
This material is based upon work supported by the U.S. Department of Homeland Security under
Grant Award Number 2008-ST-061-TS003. The work was conducted through the Mack-
Blackwell Rural Transportation Center at the University of Arkansas.
The views and conclusions contained in this document are those of the authors and should not be
interpreted as necessarily representing the official policies, either expressed or implied, of the
U.S. Department of Homeland Security.

60
Appendix 1
College of Engineering
Department of Industrial Engineering
To: University of Arkansas Graduate School
From: Heather Nachtmann, Ph.D.
Professor of Industrial Engineering
(479)575-5857
Date: June 26, 2014
Subject: Multi-author Documentation
This memorandum is to confirm that Jingjing Tong is the first author of the following article and
completed at least 51% of the work for the article.
“A review of cargo prioritization techniques within inland waterway transportation”

61
Appendix 2
Institute of Industrial Engineers
3577 Parkway Lane, Suite 200 · Norcross, GA 30092 · (770) 349-1110
June 23, 2014
Jingjing Tong, M.S.
Ph.D. Candidate
Graduate Assistant
Industrial Engineering
University of Arkansas
4122 Bell Engineering Center
Fayetteville, AR 72701
RE: COPYRIGHT PERMISSION
Dear Jingjing Tong:
The Institute of Industrial Engineers hereby grants permission to use material from its publication in your
dissertation, and warrants that it is the sole owner of the rights granted.
We ask that you note the following reprint lines respectively:
Copyright©2012. Reprinted with permission of the Institute of Industrial Engineers from the
Proceedings of the 2012 Industrial and Systems Engineering Research Conference. All rights
reserved.
Copyright©2013. Reprinted with permission of the Institute of Industrial Engineers from the
Proceedings of the 2013 Industrial and Systems Engineering Research Conference. All rights
reserved.
For: “A review of cargo prioritization techniques within inland waterway transportation”
For: “Multi-attribute decision model for cargo prioritization within inland waterway
transportation”
Authors: Jingjing Tong and Heather Nachtmann
Please fax this signed agreement to my attention at (770) 263-8532.
Regards,
Donna Calvert
Agreed and accepted
________________________________________ ________________________
Signature Date
62
References
Ahanotu, D. N., Fischer, M. J., & Louch, H. W. (2003). Developing a commodity flow database
from transearch data. Transportation Research Record: Journal of the Transportation Research
Board, 1855(1), 14-21.
Aragon, C. T. (2000). Coconut program area research planning and prioritization. (No. DP
2000-31). Philippine Institute for Development Studies.
Armstrong, G. R., Coleman, J. W., Hamilton, V. H., & Poe, J. W. (1983). Priority dispatch and
aircraft scheduling: A study of strategic airlift scheduling. In Proceedings of the 15th conference
on Winter Simulation-Volume 2 (pp. 579-588). IEEE Press.
Bennett, B. (2002). Market scoping: methods to help people understand their marketing
environment. PLA Notes, 45, 71-75.
Environmental Protection Agency (EPA). (1995). Study of volatile organic compounds from
consumer and commercial products. (EPA-453/R-94-066-A). Report to Congress.
Environmental Protection Agency (EPA). (1999). Regulatory schedule for VOC-emitting
consumer and commercial products revised. Air Pollution Consultant, 9(4), 2.26-2.27.
Grandjean, P. J., & Newbury, C. J. (2001). An assessment of the World Wide Express (WWX)
program and its effects on Customer Wait Time (CWT) and readiness. (Master thesis). Naval
Postgraduate School, Monterey, CA.
Hansen, E., & Cowi, A.S. (2003). Ranking of industrial products. Danish Environmental
Protection Agency Environmental Project No.839.
Ibrahim, A., & Ayyub, B. M. (1992). Multi-criteria ranking of components according to their
priority for inspection. Fuzzy Sets and Systems, 48(1), 1-14.
Kemp, S. (1996). Preferences for distributing goods in times of shortage. Journal of economic
psychology, 17(5), 615-627.
Lau, H. C., Chan, T. M., Tsui, W. T., Ho, G. T., & Choy, K. L. (2009). An AI approach for
optimizing multi-pallet loading operations. Expert Systems with Applications, 36(3), 4296-4312.
Madden, D. (1995). Labour supply, commodity demand and marginal tax reform. The Economic
Journal, 485-497.
Manyong, V.M., Sanogo, D., Alene, A.D. (2009). The International Institute of Tropical
Agriculture's (IITA) experience in priority assessment of agricultural research. In Raitzer, D.A.,
& Norton, G.W. (Ed.), Prioritizing Agricultural Research for Development (pp.44-63).
Oxfordshire: CABI.

63
Mar Inc. (1987). Deployable waterfront transportability study using heavy lift submersible ships.
NCEL Contract Report AD-A190 693.
Nagy, J.G., & Quddus, M. A. (1998). National agricultural commodity research priorities for
Pakistan. Agricultural Economics, 19(3), 327-340.
Schank, J., Mattock, M., Sumner, G., Greenberg, I., Rothenberg, J., & Stucker, J. P. (1991). A
review of strategic mobility models and analysis (No. RAND/R-3926-JS). Rand Corp, Santa
Monica, CA.
Sinclair, M., & Van Dyk, E. (1987). Combined routeing and scheduling for the transportation of
containerized cargo. Journal of the Operational Research Society, 38(6), 487-498.
U.S. Department of Homeland Security (USDHS). (2006). National strategy for maritime
security: the maritime infrastructure recovery plan. Retrieved from:
http://www.dhs.gov/xlibrary/assets/HSPD_MIRPPlan.pdf
U.S. Department of Homeland Security (USDHS). (2007). Strategy to enhance international
supply chain security. Retrieved from: http://www.dhs.gov/xlibrary/assets/plcy-
internationalsupplychainsecuritystrategy.pdf
Weinberger, S. N. (2010). Who should set airlift priorities during foreign humanitarian
assistance/disaster relief operations and on what basis. Naval War College, Newport, RI.
Retrieved from: http://www.dtic.mil/dtic/tr/fulltext/u2/a535096.pdf

64
4. CARGO PRIORITIZATION AND TERMINAL ALLOCATION PROBLEM FOR
INLAND WATERWAY DISRUPTIONS
Jingjing Tong, M.S.
Heather Nachtmann, Ph.D.
Abstract
To mitigate inland waterway disruption impacts, we introduce the cargo prioritization and
terminal allocation problem (CPTAP) to minimize the total value loss of disrupted barge cargoes.
CPTAP is formulated as a nonlinear binary integer program, and problems of realistic size can be
efficiently and effectively solved with a genetic algorithm approach. The final solution identifies
an accessible alternative terminal for each disrupted barge and the prioritized offload turn that
each barge takes at its assigned terminal. Implementation of CPTAP results in reduced cargo
value loss and response time when compared to a naïve minimize distance approach.
Key Words: Maritime Transportation; Inland Waterway; Freight; Cargo Prioritization; Integer
Programming; Genetic Algorithm
1. Introduction
The commercially important United States (U.S.) inland navigation system is comprised of
approximately twelve thousand miles of navigable waterways managed by the U.S. Army Corps
of Engineers (USACE) (Stern, 2010). This inland waterway system serves thirty-eight states
across the U.S. and carries one-twelfth of U.S. freight across nearly two hundred commercially
active lock sites (Stern, 2010; USACE, 2009). These marine highways are considered a critical
65
transportation mode for certain commodities and geographical regions as they transport
approximately twenty percent of coal, twenty-two percent of petroleum and sixty percent of the
farm exports in the U.S. (USACE, 2009). Unexpected disruptions to the system due to natural
disasters, vessel accidents, or terrorist attacks can cause non-navigable water levels or destroy
major navigation infrastructures (e.g. bridges, locks and dams), resulting in short or long term
closures of the inland waterway. During a long term closure event, barge cargoes need to be
offloaded from the waterway and transported to their final destination via an alternative land-
based transportation mode. This shift to land-based transportation is a challenging because the
existing capacity of accessible terminals and alternative modes of transportation may not be
sufficient to handle all of the disrupted cargo. Each barge tow commonly consists of a towing
vessel pushing nine to fifteen barges, and each barge has a much larger cargo capacity than
alternative land-based vehicles (i.e. the cargo capacity of a single barge is approximately equal to
sixty tractor trailers or fifteen railcars). As time elapses during a closure, the value of the
disrupted cargo decreases in terms of economic value, societal benefit, and customer satisfaction.
In order to mitigate negative disruption impacts, key maritime stakeholders including the U.S.
Coast Guard (USCG) and USACE need pre- and post- disruption response plans which support
prioritizing and redirecting disrupted barges in order to minimize the total value loss of the
impacted system.
This paper introduces the cargo prioritization and terminal allocation problem (CPTAP) which
minimizes the total value loss by optimally prioritizing disrupted barges through consideration of
multiple prioritization factors including commodity type, cargo value, terminal capacity, and
barge draft. The terminal allocation feature of CPTAP is similar to the berth allocation problem
(BAP) which seeks to assign vessels to the berths in order to minimize the total service time of

66
the vessels (see original work by Imai et al., 1997; Imai et al., 2001; Imai et al., 2003). CPTAP
and BAP are both three dimensional assignment problems that involve two decisions, the
barge/ship-to-terminal/berth assignment and the offload/service order at the terminal/berth. In
addition, the elapsed time of a barge/ship that is incorporated into the objective function partially
depends on its predecessors. Two primary differences between CPTAP and BAP are: 1) CPTAP
considers the type of cargo carried by the barges in its optimization, which is not considered in
BAP, and 2) CPTAP minimizes total value loss while most BAPs minimize total service time. In
order to handle problems of realistic size, we formulate CPTAP as a nonlinear binary integer
program and develop a genetic algorithm (GA) solution approach. The minimized CPTAP
solution indicates the terminal that each disrupted barge is assigned to and the prioritized turn
each barge takes at its assigned terminal.
This paper presents a literature review of relevant work focused on cargo prioritization and BAP
and then provides a problem definition to illustrate and further define CPTAP. The model
formulation is described next, followed by discussion of our GA approaches and CPTAP results.
The conclusions section summarizes the paper and discusses our future research directions.
2. Literature Review
To establish a knowledge base of existing cargo prioritization methods, we identified and
reviewed twenty papers that include prioritization methods across a diverse set of application
contexts (Manuscript Authors, 20XX). We selected three criteria to compare the cargo
prioritization techniques found in the literature:
• Prioritization Technique: Five papers provide standards and/or guidelines to consider
when prioritizing cargo (EPA, 1999; Sinclair and Dyk, 1987; Weinberger, 2010; USDHS,

67
2007; USDHS, 2006), another six papers include criteria and a prioritization technique
(Bennett, 2002; Ibrahim and Ayyub, 1992; Hansen and Cowi, 2003; Grandjean and
Newbury, 2001; EPA, 1995; Aragon, 2000), and one paper utilizes a questionnaire to
prioritize cargo through public information collection (Kemp, 1996).
• Application Context: Applying cargo prioritization within environmental and military
contexts appears more frequently than other application contexts. Three papers prioritize
based on environmental issues (Hansen and Cowi, 2003; EPA, 1999; EPA, 1995), and
four papers prioritize cargo to satisfy military objectives (Grandjean and Newbury, 2001;
Armstrong et al., 1983; Schank et al., 1991; Weinberger, 2010).
• Number of Factors Considered: Six papers employ a single factor cargo prioritization
approach (Nagy and Quddus, 1998; Mar Inc., 1987; Lau et al., 2009; Armstrong et al.,
1983; Ahanotu et al., 2003; Madden, 1995), three papers consider two prioritization
factors (Hansen and Cowi, 2003; Grandjean and Newbury, 2001; Manyong et al., 2009),
and eight papers utilize more than two factors (Bennett, 2002; Ibrahim and Ayyub, 1992;
EPA, 1999; EPA, 1995; Schank et al., 1991; Aragon, 2000; USDHS, 2007; USDHS,
2006).
The literature-based factor matrix shown in Table 1 suggests the aspects one should recognize
and contemplate during cargo prioritization.

68
Table 1 Cargo Prioritization Factor Matrix
Classification Prioritization Factor Source
Value/Cost/
Revenue
Profitability Bennett, 2002
Revenue Lau et al., 2009
Efficiency Index Nagy & Quddus, 1998
Commercial Demand EPA, 1999
Marginal Revenue Costs Madden, 1995
Value of Production Aragon, 2000
Time
Earliest Due Date Armstrong et al., 1983; Sinclair &
Dyk, 1987; Schank et al., 1991
Latest Arrival Date Schank et al., 1991
Ready to Load date Schank et al., 1991
Available to Load date Schank et al., 1991
Risk
Economic Risk Ibrahim & Ayyub, 1992
Human Risk Ibrahim & Ayyub, 1992
Health/Safety Function EPA, 1999
Security Status USDHS, 2007
Weight
Cargo Draft Mar Inc., 1987
Smallest Weight Armstrong et al., 1983
Largest Weight Armstrong et al., 1983
Quantity Commodity Transport Direction Volume Ahanotu et al., 2003
Environment
Product’s Loss of Resources Hansen & Cowi, 2003
Energy Consumption Hansen & Cowi, 2003
Volatile Organic Compound Emissions EPA, 1999
Urgency
Urgency of Need Grandjean & Newbury, 2001
Force Activity Grandjean & Newbury, 2001
National Commodity Priorities USDHS, 2007
Importance
Important for Food Security Bennett, 2002
Traditionally Important Bennett, 2002
Commodity Needs USDHS, 2007
National Security USDHS, 2007
Others
Seasonal Advantages Bennett, 2002
Availability of Substitute Materials EPA, 1999
Export vs. Import Movements Sinclair & Dyk, 1987
Refrigerated vs. Nonrefrigerated Sinclair & Dyk, 1987
Commander in Chief Priority Schank et al., 1991
Offload Capacity of Port Infrastructure USDHS, 2007
Vessels Transport Ability USDHS, 2007
Fuel Oil Presence USDHS, 2006
Presence of Perishable Cargo USDHS, 2006
Assembly Line Component Presence USDHS, 2006
As previously discussed, CPTAP has similar features to BAP. Imai et al. (1997) pioneered the
static berth allocation problem formulated as a bi-objective nonlinear integer program which
minimizes total vessel staying time and dissatisfaction with berthing order. Imai et al. (2001)
later considered a dynamic berth allocation problem (DBAP) where vessels may arrive to a

69
single berth location during the planning horizon, which they formulated as a mixed integer
program and solved problems of realistic size through Lagrangian relaxation. Nishimura et al.
(2001) expanded DBAP to allow each berth to accept multiple vessels within quay capacity
limitations by employing a GA approach. Imai et al. (2003) further extended DBAP to consider
vessel size and cargo volume service priority (referred to as PBAP), which they attempted to use
Lagrangian relaxation initially but the computational burden led them to adopt a GA approach.
Cordeau et al. (2005) proposed a new BAP formulation – the multi-depot vehicle routing
problem with time windows (MDVRPTW) which considers the weighted sum of the service
times and time windows of the berthing times. They employed a Tabu search heuristic which is
capable of obtaining optimal solutions for small size problems and improved solutions for large
size problems over a truncated branch-and-bound algorithm. Boile et al. (2006) reformulated the
Imai et al. (2003) mixed integer nonlinear program for PBAP as a mixed integer program and
developed a heuristic to solve the problem. Their linear reformulation is further considered in
terms of its solution approach by Theofanis et al. (2007). Imai’s group (2007) continued their
work on BAP and developed the bi-objective BAP which minimizes both delay time and service
time and found that a GA approach achieves better solutions than a subgradient optimization
approach. The multi-objective BAP is further investigated by Golias et al. (2009) by employing
a GA to optimize conflicting objectives of minimizing service time for various vessel groups and
minimizing service time for all the vessels at the terminal. Other recent BAP extensions handle
uncertainty (Zhen and Chang, 2012), integrate quay crane allocation (Han et al., 2010; Raa et al.,
2011), consider water depth and tidal conditions (Xu et al., 2012), and address bulk cargo ports
(Umang et al., 2013) and environmental concerns (Golias et al., 2010; Du et al., 2011; Wang et
al., 2013).

70
3. Problem Definition
CPTAP is graphically described in Figure 1 through the depiction of a recent inland waterway
disruption event. On January 20, 2014, a railroad bridge over the Arkansas River suffered a
mechanical failure which halted all barge traffic on that section of the river (Magsam and
McGeeney, 2014). Five locks and dams (L/Ds) serve that river section, and ten terminals are
located along both sides of the river (locations shown in Figure 1). Each terminal is capable of
offloading specific commodity types of cargo depending on its handling facilities. According to
the USACE Lock Performance Monitoring System (2014), eight barge tows, commonly
consisting of nine to fifteen barges each, are traveling up and down the disrupted river section at
the time of the event as shown in Figure 1. Since the disruption prohibits barge traffic at the
bridge location, the six barge tows (consisting of approximately 60 disrupted barges) that are
traveling towards and beyond the damaged bridge (shaded in black) are disrupted and need to be
prioritized and redirected through implementation of CPTAP. The two barge tows that have
already passed under the damaged bridge and are traveling away from the disruption point
(shaded in white) are not impacted. Since the disrupted barges are no longer able to travel to
their original designation along the disrupted inland waterway, CPTAP determines an accessible
terminal for offloading and rerouting the cargo on each disrupted barge and the barge’s offload
order at the designated terminal since more than one barge may be sent to a given terminal.
Because the disruption has effectively divided the inland waterway into two sections, CPTAP is
typically employed twice, once for disrupted barges located on the river above the disruption and
once for disrupted barges located on the river below the bridge.

71
Figure 1 Arkansas River Disruption
Several decision attributes are identified as important to CPTAP and are considered in our model:
• We achieve our objective to mitigate the total system disruption impacts by minimizing the
total value loss of all barge cargoes within the inland waterway system whose transport is
impacted by the disruption.
• The value loss of a barge’s cargo depends on the total value of the cargo when the disruption
occurs, the cargo volume, the total time it takes the cargo to reach its final destination, and
the value decreasing rate which represents the rate at which the cargo’s economic and

72
societal value diminishes as time elapses. This rate is determined by the decision maker(s)
and reflects the amount that the value of the cargo decreases per unit volume per unit time.
Higher rates decrease the cargo’s value more rapidly as response time elapses, and CPTAP
generally assigns earlier priority to cargo with a high decreasing rate in order to minimize
total value loss.
• Terminals have varying capacities for accepting different commodity types of cargo that are
transported along the inland waterway including the possibility of not accepting one or more
commodity types.
• Water depth of the terminal is considered when assigning barges to terminals because the
draft depth of a given barge cannot exceed its assigned terminal’s water depth. A safety level
is set as a buffer in CPTAP to achieve a desired distance gap between barge draft depth and
terminal water depth to ensure that the current water level allows barges to safely travel into
the terminal.
• The multiple barges in a single barge tow may be assigned to different terminals, and we
assume there are sufficient towing vessels to transport the individual barges to their assigned
terminals.
• Because barges can be anchored along the river bank, we assume there is no limit to the
number of barges that can be assigned to a given terminal. However, due to offload
equipment limitations, we assume that only one barge is offloaded at a terminal at a given
time.
• Given limited terminal offloading capacities and alternative land-based transportation modes
with relatively limited cargo volume capacity, the total time it takes to transport the cargo to
its final destination may be large resulting in an unacceptable value loss. Unacceptable value
73
loss is computed using a pre-defined sinking threshold which the allowable percent of value
loss that a barge’s cargo may diminish before the value loss is deemed unacceptable. When
this occurs, it is no longer prudent to redirect and offload this cargo with the assumption that
customer demands are met through another means and eventual salvage of the barge occurs.
In addition, there may be disrupted barge that cannot be offloaded by any terminal in the
response area due to water depth or terminal capacity limitations. In these cases, we assume
that these barges remain on the inland waterway which is represented in CPTAP by a dummy
terminal with unrestricted terminal water depth and cargo capacity to accept non-hazardous
cargoes.
• We assume that all barges carrying hazardous cargo are removed from the inland waterway
during the disruption response in accordance with USCG practice. Barges carrying
hazardous cargo are prohibited from dummy terminal assignment since these barges are not
permitted to remain on the waterway due to potential hazardous impacts on the environment
and population in the disruption vicinity.
4. Model Formulation
We define the following sets, variables and parameters for CPTAP formulation:
Sets
J – Set of barges with non-hazardous cargo
H – Set of barges with hazardous cargo
I – Set of real terminals
D – Set of dummy terminal (one)
K – Set of barge orders at a given terminal
N – Set of commodity cargo types

74
Decision variables ���� ∈ �0, 1� 1 if barge j is assigned to terminal i in the kth order; 0 otherwise
Parameters ��� Water transport time of barge j from its location at the time of disruption to terminal i
ℎ�� Handling time of barge j at terminal i
��� Actual contributing time of barge j that is assigned to terminal i in the kth order
��� Land transport time of barge j cargo from terminal i to its final destination by alternative
mode of transportation �� Value decreasing rate of barge j cargo per unit volume per unit time
��� Offload capacity for cargo n at terminal i during the disruption response � Cargo volume on barge j
� Water depth at terminal i �� Draft depth of barge j
��� 1 if barge j carries cargo n; 0 otherwise
Safety level �� Total value of barge j cargo
� Sinking threshold
Actual contributing time is defined as the amount of time it takes for a disrupted barge to be
transported by water to its assigned terminal, to incur any wait time until its prioritized offload
order is reached, and to have its cargo offloaded. As shown in Equation 1 and Figure 2, when a
barge is assigned the first offload turn, it incurs no waiting time and its actual contributing
time��� reduces to the sum of its water transport time ��� and its handling time ℎ��. Also
observed in Equation 1 and Figure 2, there are two cases for barges assigned to the second or
later offload turn at a given terminal: Case 1) when a barge arrives to its assigned terminal before
barges with earlier offload turns complete their water transportation and offloading, it must wait
until any barge(s) with higher priority (earlier offload turn) arrives and is offloaded before its
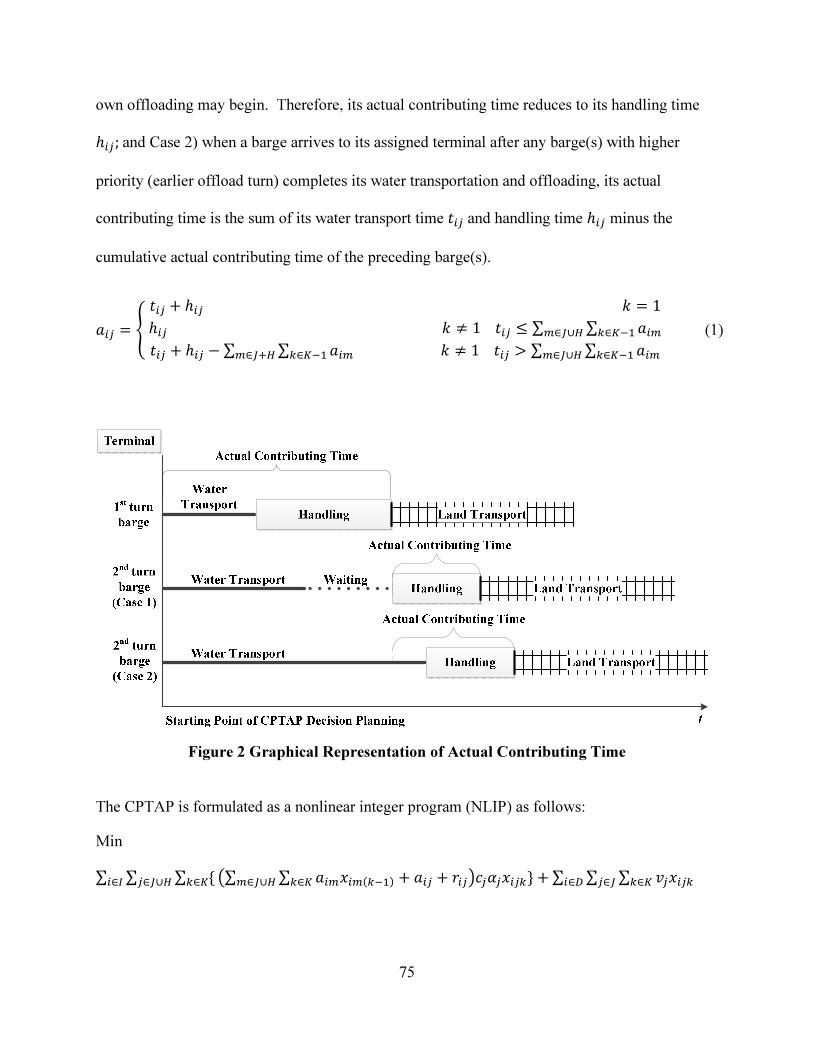
75
own offloading may begin. Therefore, its actual contributing time reduces to its handling time
ℎ��;and Case 2) when a barge arrives to its assigned terminal after any barge(s) with higher
priority (earlier offload turn) completes its water transportation and offloading, its actual
contributing time is the sum of its water transport time ��� and handling time ℎ�� minus the
cumulative actual contributing time of the preceding barge(s).
��� = � ��� + ℎ�� � = 1ℎ�� � ≠ 1��� ≤ ∑ ∑ ����∈����∈∪ ��� + ℎ�� − ∑ ∑ ����∈����∈� � ≠ 1��� > ∑ ∑ ����∈����∈∪
(1)
Figure 2 Graphical Representation of Actual Contributing Time
The CPTAP is formulated as a nonlinear integer program (NLIP) as follows:
Min
∑ ∑ ∑ {�∈��∈∪�∈� �∑ ∑ ������ �����∈� + ��� + ����∈∪ ��������} +∑ ∑ ∑ �������∈��∈�∈�

76
s.t.
∑ ∑ �����∈��∈�∪� = 1∀� ∈ � (2)
∑ ∑ �����∈��∈� = 1∀� ∈ � (3)
∑ ���� ≤ 1∀� ∈ �, � ∈ ��∈∪ (4)
∑ ���� ≥ ∑ ��� �����∈∪ ∀� ∈ � ∪ �, � ∈ �/|�|�∈∪ (5)
∑ ∑ �������� ≤ ���∀� ∈ � ∪ �,� ∈ ��∈��∈∪ (6)
∑ ∑ (� −�∈��∈� ��)���� ≥ ∀� ∈ � ∪ � (7)
∑ ∑ {(∑ ∑ ������ �����∈� + ��� + ���)�∈∪ �������}�∈��∈� ≤ ���∀� ∈ � ∪ � (8)
���� ∈ �0,1�∀� ∈ � ∪ �, � ∈ �, � ∈ � ∪ � (9)
The CPTAP objective function minimizes the total value loss of the disrupted barge cargoes
within the inland waterway response area. The first term of the objective function handles barge
cargoes that are offloaded and transported to the final destination through an alternative land-
based transportation mode. As described earlier, the value decreasing rate is used to represent
the rate at which the cargo’s economic and societal value decreases over time per unit volume
per unit time. In addition to the cargo’s value decreasing rate, the value loss is also associated
with the cargo volume and the total time it takes the cargo to reach its final destination. The
second term of the objective function considers the non-hazardous cargoes that remain on the
inland waterway and are assumed to lose total value. Constraint set (2) ensures that each barge
with non-hazardous cargo either transports for offloading at an alternative terminal in some
priority order or remains on the inland waterway (assigned to the dummy terminal). Constraint
set (3) guarantees that all barges with hazardous cargo must be offloaded at a terminal in some
priority order. Constraint set (4) assures that each terminal offloads no more than one barge at
each priority order (e.g. a terminal can only offload one barge at a time). Constraint sets (2-4)

77
are adapted from the original BAP work (Imai et al., 1997; Imai et al., 2001; Imai et al., 2003).
Constraint set (5) aesthetically ensures that the priority order at each terminal starts from the first
priority turn. While the priority order of the assigned barges remains unchanged, the first turn
may be skipped at the terminal and the highest priority barge may be assigned to the second or
later turns without this constraint set. Constraint set (6) indicates that the overall terminal
offload capacity for a particular cargo commodity type is not exceeded. Constraint set (7)
ensures that the barge draft plus the safety level cannot exceed the water depth at the terminal
(adapted from Nishimura et al., 2001). Constraint set (8) ensures that the total value loss of the
barge cargo that is transported for offloading to an alternative transportation mode is less than or
equal to the product of the sinking threshold and the total cargo value. For example, if a sinking
threshold of 90% is employed, the barge cargo will be assigned to a terminal as long as the value
loss of the cargo after it arrives to its final destination is less than 90% of its original value.
Barges whose total value loss exceeds 90% will remain on the waterway and are assumed to
incur a total value loss. Constraint set (9) defines the decision variables as binary variables.
5. Genetic Algorithm Approaches
Even for relatively short sections of the inland waterway system, solution strategies for CPTAP
will generally need to be capable of handling disruption scenarios of at least fifty barges and ten
or more terminals. Exact solution approaches to CPTAP can only solve problems of size
fourteen or less (where problem size equals the number of barges plus the number of terminals)
due to the computational demands associated with generating the actual contributing time of
every possible barge assignment order sequence. We adopted a GA approach because of GA’s
success in effectively solving BAP where again no exact approach can handle the problem in

78
polynomial time (Golias et al., 2010; Yang et al., 2012). The pseudocode of our GA approach is
summarized in Figure 3.
CPTAP GA Approach Pseudocode
1: READ data of general information of terminal, barge and cargo
2: FOR each chromosome in the initial population
3: WHILE the generated chromosome is not feasible
4: Generate a new chromosome
5: ENDWHILE
6: ENDFOR
7: SET m to 1
8: WHILE m < Iteration number
9: Conduct Tournament selection to select two parents
10: Conduct Crossover to produce two children
11: Conduct Mutation on the two children
12: Conduct Repair to produce two structurally feasiblea
children
13: CALL SolutionValue RETURNING objective function values of two children
14: IF the child does not share the same objective function value with chromosomes in population
15: IF the child performs better than the worst chromosome in the population
16: Include the child into the population
17: ENDIF
18: ENDIF
19: INCREMENT m
20: ENDWHILE
a: “structurally feasible” – chromosome has no duplicate natural numbers or redundant zeroes
Figure 3 GA Approach Pseudocode
5.1 Chromosome Representation
A popular chromosome representation found in the BAP literature is a numerical string that
represents berths and vessels (Nishimura et al., 2001; Golias et al., 2010). We employ a similar
representation in CPTAP where zeroes are used to distinguish the terminals with the dummy
terminal designated as the last terminal in the string and natural numbers indicate numbered
barges. Figure 4 presents an example CPTAP chromosome with two real terminals, a dummy
terminal, and ten barges. Each barge gene in the chromosome may store one or more digits that
represent the numbered barges up to the total number of disrupted barges. The sequence of the
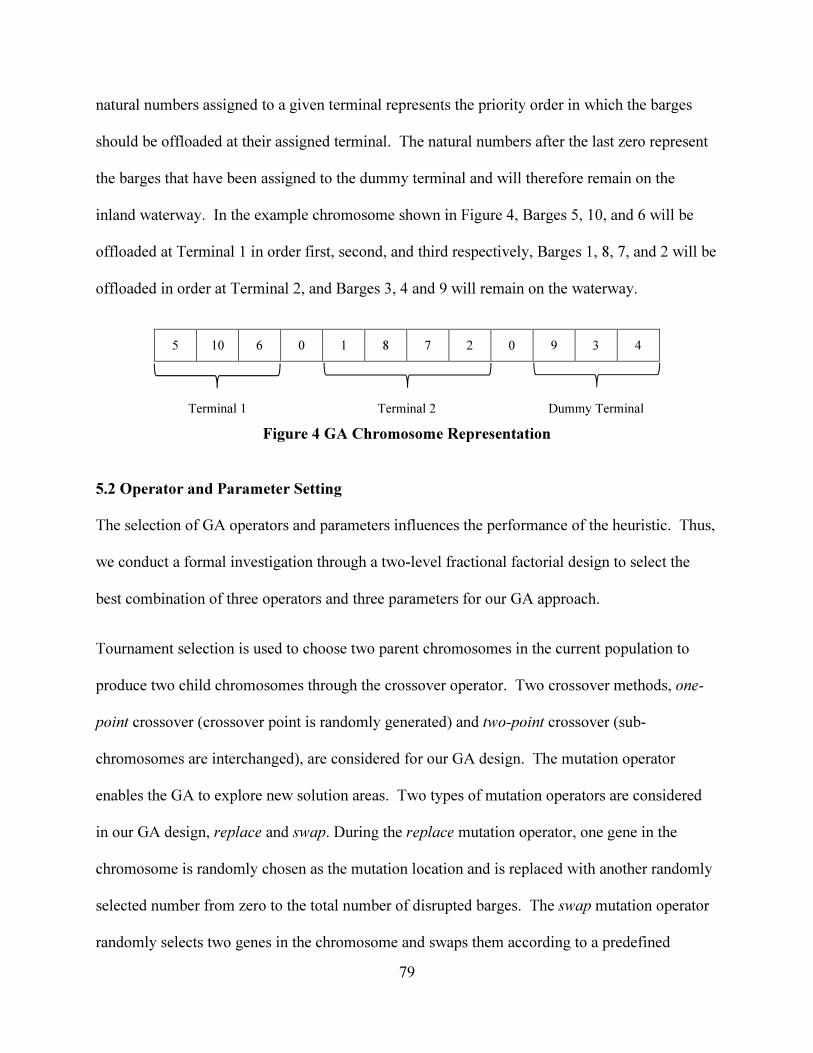
79
natural numbers assigned to a given terminal represents the priority order in which the barges
should be offloaded at their assigned terminal. The natural numbers after the last zero represent
the barges that have been assigned to the dummy terminal and will therefore remain on the
inland waterway. In the example chromosome shown in Figure 4, Barges 5, 10, and 6 will be
offloaded at Terminal 1 in order first, second, and third respectively, Barges 1, 8, 7, and 2 will be
offloaded in order at Terminal 2, and Barges 3, 4 and 9 will remain on the waterway.
5 10 6 0 1 8 7 2 0 9 3 4
Terminal 1 Terminal 2 Dummy Terminal
Figure 4 GA Chromosome Representation
5.2 Operator and Parameter Setting
The selection of GA operators and parameters influences the performance of the heuristic. Thus,
we conduct a formal investigation through a two-level fractional factorial design to select the
best combination of three operators and three parameters for our GA approach.
Tournament selection is used to choose two parent chromosomes in the current population to
produce two child chromosomes through the crossover operator. Two crossover methods, one-
point crossover (crossover point is randomly generated) and two-point crossover (sub-
chromosomes are interchanged), are considered for our GA design. The mutation operator
enables the GA to explore new solution areas. Two types of mutation operators are considered
in our GA design, replace and swap. During the replace mutation operator, one gene in the
chromosome is randomly chosen as the mutation location and is replaced with another randomly
selected number from zero to the total number of disrupted barges. The swap mutation operator
randomly selects two genes in the chromosome and swaps them according to a predefined

80
mutation rate. Duplicate genes are likely to appear in the child chromosomes after the crossover
and mutation operations. Therefore, the resulting structurally infeasible child chromosomes with
duplicate barge numbers or extra number of terminals in the chromosomes must be repaired
before their objective function values are evaluated. We repair the child chromosomes to
structurally feasible solutions by deleting the duplicate barge numbers and/or redundant zeroes
and adding in any missing barge numbers and/or zeroes. We considered two potential repair
operators in our GA design: ordered repair and random repair. After removing the redundant
barges and zeros, the ordered repair operator adds the missing natural numbers in increasing
order and then adds zeroes to the remaining vacant genes. In random repair, the order of the
missing numbers and zeros are scrambled at random before being inserted into the empty child
chromosome genes.
Two levels of each factor are considered as shown in Table 2. Problem instances of small (five
terminals and five barges), medium (ten terminals and thirty barges), and large (fifteen terminals
and fifty barges) size are considered. Resolution IV and ten replicates are employed in the
fractional factorial design, resulting in 160 factor combinations. Ten instances are generated for
each problem size, and the average objective function value for each factor combination is the
response. This two-level fractional factorial design is implemented in Minitab 16, and Table 2
summarizes the results. Small size problems are not sensitive to the various factor combinations.
Medium and large size problems perform better at the same levels for all six factors. Our GA
design is set to one-point crossover, swap mutation, random repair, population size of 50
chromosomes, 0.6 crossover rate, and 0.6 mutation rate.

81
Table 2 Fractional Factorial Design Results
Factors Levels Small Medium Large Final
Selection
Crossover
Operator
One-point − × × One-Point
Two-point − − −
Mutation
Operator
Replace − − − SWAP
SWAP − × ×
Repair
Operator
Ordered − − − Random
Random − × ×
Population
Size
30 − − − 50
50 − × ×
Crossover
Rate
0.2 − − − 0.6
0.6 − × ×
Mutation Rate 0.2 − − −
0.6 0.6 − × ×
5.3 Termination
The number of generations is another critical GA design parameter that we examine by studying
solution convergence. Figure 5 displays the convergence results for the same set of small,
medium, and large size problems. Based on these results, we set 20,000 generations as the
termination rule for our GA approach. Although the objective function value may further
improve after 20,000 generations, additional generations do not appear to result in practical
improvement of the objective function value.

82
Figure 5 GA Convergence Results for Small, Medium and Large Size Problems
5.4 Longest Common Subsequence GA
To avoid the necessary step of repairing structurally infeasible child solutions, we develop a
second GA approach that employs a Longest Common Subsequence (LCS) crossover operator to
prevent the occurrence of structurally infeasible chromosomes (Iyer and Saxena, 2004). All
other GA design operators and parameters are identical to our Traditional GA approach as
83
discussed earlier in this section. The LCS crossover operator preserves the relative positions of
the parents’ genes to generate structurally feasible child chromosomes. Our CPTAP
chromosome can easily consist of more than 70 genes, which makes it difficult to quickly
identify the LCS. Iyer and Saxena (2004) suggest a dynamic programming approach to identify
LCS efficiently, which is an exponential-time recursive algorithm developed by Cormen et al.
(2009). We construct and employ a recursive algorithm to compute the length and constitution
of the LCS of our parent chromosomes. The performance of our LCS GA approach is compared
to our Traditional GA approach in Section 6.4.
6. CPTAP Results
6.1 Scenario Generation
All experimental instances are systematically generated from freight data collected from the
Upper Mississippi River. Depicted in Figure 6, the study region is a 154-mile section of the
Upper Mississippi River, starting from L/D No. 14 near Davenport, Iowa to L/D No. 19 in
Keokuk, Iowa. This inland waterway segment includes six L/Ds, nine bridges, and nineteen
active terminals with offload capacity and railway access.

84
Figure 6 Upper Mississippi River Disruption Pre- and Post- CPTAP Response

85
Based on the number of terminals in the instances and their corresponding locations, barge
locations are uniformly distributed across the study region. The average barge speed is assumed
to be five miles per hour. Based on the barge and terminal locations and barge speed, we
calculate the water transport time of each barge from its current location to each terminal. The
offload time and land transport time which correspond to each pair of barge and terminal
assignments are uniformly distributed as five to ten hours and eighteen to ninety-six hours
respectively. Table 3 displays the two-digit USACE commodity type classification and their
2012 tonnage data for this region. The probability density function of the cargo commodity type
is estimated from this data and used to set the commodity type of the cargo carried by each barge.
We assume that 100% of the petroleum and 50% of the chemicals are hazardous cargoes as is
generally accepted. Cargo volume is assumed to be 1000 tons per barge, and terminal capacity is
assumed to be 5000 tons for each commodity type. The probability density function of barge
draft is estimated from the draft data of vessel trips published on the USACE Navigation Data
Center (USACE, 2012) and used to determine the draft depth for each barge in the scenario. The
barge draft generally ranges between six and fourteen feet. The safety level and sinking
threshold parameters are set to one foot and 90% respectively.
Given the barge volume of 1000 tons, we are able to calculate a value decreasing rate per 1000
tons per hour for each commodity type. Hazardous cargoes (Petroleum and Chemicals) are
given the highest value decreasing rates ($600 per 1000 tons per hour) which depict their high
economic value as well as their unstable and hazardous features which may negatively impact
society. Nonhazardous Chemicals and perishable products (Food and Farm Products) have the
second highest value decreasing rates ($400 per 1000 tons per hour), followed by Crude
Materials ($300 per barge per hour) and Primary Manufactured Goods ($300 per 1000 tons per

86
hour). Coal is assigned the lowest value decreasing rate ($100 per 1000 tons per hour) given its
comparatively stable value function. The total cargo value of each barge is estimated by
multiplying its cargo volume and an estimated market price of the cargo. The market prices are
assumed to be $403.39 for Petroleum, $36.29 per ton for Coal, $399.88 per ton for Chemicals,
$134.61 per ton for Crude Materials, $396.45 per ton for Primary Manufactured Goods, and
$164.52 per ton for Food and Farm Products, which are based on data from the International
Monetary Fund, U.S. Energy Information Administration, Alibaba.com and other multiple open
sources.
6.2 Scenario Demonstration
We apply CPTAP and our Traditional GA approach to the realistic scenario of an Upper
Mississippi River disruption shown in Figure 6. Six lock and dam systems and nineteen
accessible terminals are located on this 154-mile inland waterway section. Thirteen barge tows
are traveling along the river section as shown in Table 4. A disruption occurs at L/D No. 16, and
vessels can no longer travel up or down the river past this point. Eight of these barge tows
(shaded in white) are beyond and traveling away from the disruption point and are therefore not
impacted by the disruption. Five barge tows (shaded in black) consisting of forty-four barges in
total (twenty-six barges above the disruption and eighteen barges below the disruption) were
Table 3 Commodity Types and Tonnage Data on the Study Area (USACE, 2012)
Two-digit Code Cargo Commodity Type Tonnage Data
10 Coal, Lignite and Coal Coke 10288.25
20 Petroleum and Petroleum Products 1238.20
30 Chemicals and Related Product 18331.33
40 Crude Materials, Inedible, Except Fuels 11364.99
50 Primary Manufactured Goods 7843.58
60 Food and Farm Products 58670.63

87
traveling towards and beyond the disruption point and are relevant to the disruption response
effort. The other data inputs are discussed in Section 6.1.
Table 4 CPTAP River Scenario
Figure 6 displays barges on the disrupted river section pre- (on left) and post- (on right) response.
Since river traffic is halted at L/D No. 16 and no barge tows can travel beyond this point, the
decision becomes two separate CPTAP sub-problems, one above (Upper, shaded in light gray)
and one below (Lower, shaded in dark gray) the disruption point. To respond to the entire
disruption, CPTAP is applied independently to the Upper and Lower sub-problems. The barge
tows present at the time of disruption range from one to fifteen barges as shown on the left side
of Figure 6, and each barge is numbered, denoted as contained in the Upper (U) or Lower (L)
sub-problem, and underlined if the barge is carrying hazardous cargo. The right side of Figure 6
illustrates the river segment after CPTAP has been employed. Observing the post-response river
segment, we see that all barge tows are assigned and offloaded at terminals in the indicated
priority order with the exception of Barges L4 and L16 which remain on the waterway during the
Barge Tow
Number
Barge Tow
Location
(River Mile)
Number of
Barges Direction
1 427.628 10 up
2 373.287 7 up
3 461.480 1 up
4 469.610 5 up
5 422.644 1 up
6 476.220 2 up
7 454.999 15 down
8 416.198 15 down
9 455.260 15 down
10 478.187 11 down
11 502.731 15 down
12 415.752 12 down
13 427.778 15 down

88
response effort because their draft depth exceeds the accessible terminals’ water depths. The
barge terminal and offload order is further displayed in Figure 7. Here we observe that all
hazardous cargo is offloaded with early priority and non-hazardous cargo is offloaded in
accordance with their commodity-based value decreasing rate with high decreasing rate cargo
offloaded earlier than commodities with lower value decreasing rates. The total response time to
complete the water transport and cargo offloading in the Upper and Lower river sections are 39.3
and 25.5 hours respectively, by which time the unaffected barge tows (shaded in white) have
traveled outside of the response area and are no longer visible on the right side of Figure 6. The
combined objective function values of the Upper and Lower CPTAP sub-problems result a total
value loss of $0.84 million. To emulate a human decision surrogate solution, we employ a
minimum distance integer program solved in AMPL-CPLEX to assign barges to their nearest
feasible terminal. This naïve approach results in a higher total value loss of $1.34 million and a
greater response time.

89
Figure 7 Cargo Prioritization Results at Each Terminal

90
6.3 Sensitivity Analysis
To examine how the sinking threshold p and value decreasing rate α parameters impact the
CPTAP results, we conduct a sensitivity analysis on a realistic scenario with ten terminals and
thirty barges. Figure 8 shows how the total value loss and the number of barges that remain on
the waterway vary under three parameter settings of p (0.9, 0.8, and 0.7) and α (α × 1, α × 2, and
α × 3). We observe that the total value loss increases with each increase of the value decreasing
rate parameter setting, and while total value loss is the same for the 0.9 and 0.8 sinking threshold
settings, it is observed to increase when a lower sinking threshold of 0.7 is employed.
Regardless of the value of p, the number of barges that remain on the waterway does not change
for value decreasing rates of α × 1 and α × 2. However, we observe a sharp increase in the
number of barges that remain on the waterway when a high value decreasing rate of α × 3 is
employed. While initiatively a cargo owner or shipper may be in favor of a low sinking
threshold p assuming that more barge cargo will be offloaded and transported via an alternative
land-based mode, in contrast we observe that a lower sinking threshold leads to a higher total
value loss and more barges remaining on the waterway. When a lower sinking threshold is
employed, barge cargoes exceed their offloading opportunity more frequently resulting in more
barges remaining on the waterway and losing their total value since customer demand is met
through other means, which in turn increases the total value loss of the disruption.

91
Figure 8 Sensitivity Analysis
6.4 Experimental Comparison
Here we present and compare the experimental results of our CPTAP solution approaches. Our
Traditional and LCS GA approaches are executed and experimental instances are generated
using “C++” code. AMPL/Knitro is used to find the lower bound (LB) of relatively small size
problem instances. Both AMPL/Knitro and C++ are run on a Dell Intel Core i7 CPU with
4.00GB of RAM. We employ total enumeration through MATLAB R2011a and the high
performance computers of the ____ High Performance Computing Center at the University of
_____ to obtain optimal solutions of small problem instances. We define problem size as the
number of terminals plus the number of barges. Optimal solutions can be found for problems of
size thirteen or less through total enumeration before memory capacity problems occur. Because
the actual contributing time ��� of a given barge depends on any and all barges that are assigned
to the same terminal with an earlier priority, the complexity of CPTAP rapidly increases as the
0
1
2
3
4
5
6
7
8
9
10
0
2
4
6
8
10
12
14
16
18
0.9 0.8 0.7
# o
f B
arg
es
To
tal
Va
lue L
oss
x 1
00
00
0
Sinking Threshold
Sensitive Analysis − 10 × 30
Total Value Loss (alpha × 1)
Total Value Loss (alpha × 2)
Total Value Loss (alpha × 3)
# of Barges Remaining on
Waterway (alpha × 1)
# of Barges Remaining on
Waterway (alpha × 2)
# of Barges Remaining on
Waterway (alpha × 3)

92
problem size increases. By replacing the accurate ��� with an overestimated contributing time
equal to the sum of the barge’s water transport time, handling time, and land transport time, we
can generate the LB of the optimal solution of CPTAP model through a NLIP solved with
AMPL/Knitro for problems of size fourteen or less. A linearization of the problem is possible
for small size problems; however the necessity to generate the ��� matrix for all possible
prioritization assignment prohibits its use on problems that even begin to approach the size of a
real world disruption scenario.
Table 5 compares the numerical results for five problem sizes (number of terminals plus number
of barges): ten (5+5), twelve (5+7), fourteen (5+9), forty (10+30), and sixty-five (15+50). The
presented results include the optimal total value loss (Opt) found through total enumeration
(sizes ten and twelve), the LB found through NLIP (sizes ten, twelve, and fourteen) and the
average total value loss (Obj) of multiple runs consisting of the best solution obtained from
multiple instances within each run obtained by the Traditional GA (all sizes) and LCS GA (all
sizes).
The estimated gaps between the LB (��) and the optimal solution ���∗�, the GA solution �(��)
and the optimal solution, the GA solution and the LB, and the LCS GA solution�(���) and the
Traditional GA solution ������ are computed with Equations 10, 11, 12 and 13 respectively and
shown in Table 5.
� = ����∗�
�∗�× 100%. (10)
� = (��)��∗�
�∗�× 100%. (11)

93
� = �������
��× 100%. (12)
� = (���)������
����× 100%. (13)
Both GA approaches find the optimal solution in all size ten and twelve problem instances. For
size fourteen problem instances, the Traditional GA and LCS GA approaches result in a gap of
11.1% from the LB. The LCS GA approach results in a slightly worse average objective
function value (<1% gap) than the Traditional GA for size forty and sixty-five problems with a
longer CPU time. The LCS GA approach also exhibits a higher worst-case minimum objective
function value (1.5% gap) and larger standard deviation (15.5% gap) on average compared to
Traditional GA approach for size sixty-five problems. All CPU times shown fall well within an
acceptable time range for a real-life disruption scenario response. Based on the need to solve
problems much larger than size thirteen and slightly better performance, the Traditional GA
approach is selected as the recommended CPTAP solution approach.

94
Table 5 CPTAP Experimental Comparison
# of
Terminals
+ # of
Barges
Problem
Size
# of
instances/
runs
NLIP
GA Approach
Opt LB Gap Traditional GA
LCS GA
($) ($) (%) Obj Gap CPU
Obj Gap CPU
($) (%) (s) ($) (%) (s)
(5+5) 10 5/10 97969 93645 -4.4
97969 0 8.63
97969 0 10.22
(5+7) 12 5/10 105082 96558 -4.4
105082 0 9.34
105082 0 11.65
(5+9) 14 5/10 − 139196 − 154648 11.1 11.58 154648 11.1 12.68
(10+30) 40 10/10 − − 501801 − 37.57 503102 0.26 51.42
(15+50) 65 30/10 − − 817102 − 192.55 819048 0.24 208.38

95
7. Conclusions
The contributions of this paper to the literature include a systematic review of cargo
prioritization methods and factors and the first systematic approach to cargo prioritization and
terminal allocation during disruption response for the inland waterway navigation system. We
develop CPTAP to provide decision support for disruption response stakeholders in order to
minimize the total value loss of cargo disruptions on the inland waterways. In addition, CPTAP
can be employed in pre-event planning by assessing the resiliency of the inland waterway
transportation system to handle potentially disrupted cargo based on the existing commodity
capacity of the offload terminals and alternative modes of land-based transportation. The
CPTAP framework is established through literature review and frequent guidance from the
USCG and USACE. An important merit of CPTAP is that it considers several important factors
that influence the cargo prioritization decision such as terminal capacity and barge characteristics
in an objective and quantitative manner and handles the intricacies of the U.S. inland waterway
transportation system. Two GA approaches are developed and tested on small, medium, and
large problem instances that capture real-world data and features with respect to vessel location,
cargo, economic value, and terminals. The recommended Traditional GA approach obtains
prioritization decisions efficiently (in terms of CPU solution time) and effectively (in terms of
consistency with assumptions and optimality on small problems). A realistic disrupted river
scenario is tested, and the total value loss difference between CPTAP and a naïve minimum
distance approach is substantially less. CPTAP can assist responsible parties in responding
promptly to inland waterway disruptions with system-level efficient barge-terminal assignments
that consider economic and societal impacts.

96
The work presented here is part of a larger project conducted by the University _____ and
University _____ to develop a prototype decision support system for the U.S. Department of
Homeland Security that will integrate geographic information system technology with the overall
goal to provide timely knowledge and awareness of what cargoes should be prioritized for
offloading during disruption response and what infrastructure exhibits low resiliency in terms of
modal capacity to potential attacks or natural disasters against inland waterway transportation
systems. Future work includes: 1) involving additional real-world system attributes to the model,
e.g., time windows could be incorporated to consider expected cargo arrival dates; 2) examining
additional solution approaches for the CPTAP model such as Tabu Search, network
representation, and memetic algorithm approaches; 3) evaluating the resiliency of the inland
waterway system to handle hazardous and high volume cargo and guide investment towards
increasing capacity at key terminals by investigating where increased capacity of the terminals
best mitigates system value loss; and 4) developing a scalability plan for expanding the decision
support system throughout the U.S. inland waterway transportation system.
Acknowledgment
This material is based upon work supported by the U.S. Department of Homeland Security under
Grant Award Number ___. The views and conclusions contained in this document are those of
the authors and should not be interpreted as necessarily representing the official policies, either
expressed or implied, of the U.S. Department of Homeland Security.

97
Appendix 1
College of Engineering
Department of Industrial Engineering
To: University of Arkansas Graduate School
From: Heather Nachtmann, Ph.D.
Professor of Industrial Engineering
(479)575-5857
Date: June 26, 2014
Subject: Multi-author Documentation
This memorandum is to confirm that Jingjing Tong is the first author of the following article and
completed at least 51% of the work for the article.
“Cargo prioritization and terminal allocation problem for inland waterway disruptions”
98
References
Ahanotu, D. N., Fischer, M. J., & Louch, H. W. (2003). Developing a commodity flow database
from transearch data. Transportation Research Record: Journal of the Transportation Research
Board, 1855(1), 14-21.
Aragon, C. T. (2000). Coconut Program Area Research Planning and Prioritization. (No. DP
2000-31). Philippine Institute for Development Studies.
Armstrong, G. R., Coleman, J. W., Hamilton, V. H., & Poe, J. W. (1983). Priority dispatch and
aircraft scheduling: A study of strategic airlift scheduling. In Proceedings of the 15th conference
on Winter Simulation-Volume 2 (pp. 579-588). IEEE Press.
Bennett, B. (2002). Market scoping: methods to help people understand their marketing
environment. PLA Notes, 45, 71-75.
Boile, M., Theofanis, S., & Golias, M. (2006). Berth allocation with service priorities: A linear
reformulation. In Proceedings of the 5th WSEAS/IASME International Conference on System
Science and Simulation in Engineering (ICOSSSE 2006), Tenerife, Canary Islands, Spain (pp.
16-18).
Chang, D., Jiang, Z., Yan, W., & He, J. (2010). Integrating berth allocation and quay crane
assignments. Transportation Research Part E: Logistics and Transportation Review, 46(6), 975-
990.
Cordeau, J. F., Laporte, G., Legato, P., & Moccia, L. (2005). Models and tabu search heuristics
for the berth-allocation problem. Transportation science, 39(4), 526-538.
Cormen, T. H., Leiserson, C. E., Rivest, R. L., & Stein, C. (2001). Introduction to algorithms
(Vol. 2, pp. 531-549). Cambridge: MIT press.
Du, Y., Chen, Q., Quan, X., Long, L., & Fung, R. Y. (2011). Berth allocation considering fuel
consumption and vessel emissions. Transportation Research Part E: Logistics and
Transportation Review, 47(6), 1021-1037.
Environmental Protection Agency (EPA). (1999). Regulatory schedule for VOC-emitting
consumer and commercial products revised. Air Pollution Consultant, 9(4), 2.26-2.27.
Environmental Protection Agency (EPA). (1995). Study of volatile organic compounds from
consumer and commercial products. (EPA-453/R-94-066-A). Report to Congress.
Golias, M. M., Boile, M., & Theofanis, S. (2009). Berth scheduling by customer service
differentiation: A multi-objective approach. Transportation Research Part E: Logistics and
Transportation Review, 45(6), 878-892.
Golias, M., Boile, M., Theofanis, S., & Efstathiou, C. (2010). The berth-scheduling problem.
Transportation Research Record: Journal of the Transportation Research Board, 2166(1), 20-27.

99
Hansen, E. (2003). Ranking of industrial products. Miljøstyrelsen.
Grandjean, P. J., & Newbury, C. J. (2001). An assessment of the World Wide Express (WWX)
program and its effects on Customer Wait Time (CWT) and readiness. (Master thesis). Naval
Postgraduate School, Monterey, CA.
Han, X. L., Lu, Z. Q., & Xi, L. F. (2010). A proactive approach for simultaneous berth and quay
crane scheduling problem with stochastic arrival and handling time. European Journal of
Operational Research, 207(3), 1327-1340.
Hansen, E., & Cowi, A.S. (2003). Ranking of industrial products. Danish Environmental
Protection Agency Environmental Project No.839.
Ibrahim, A., & Ayyub, B. M. (1992). Multi-criteria ranking of components according to their
priority for inspection. Fuzzy Sets and Systems, 48(1), 1-14.
Imai, A., Nagaiwa, K. I., & Tat, C. W. (1997). Efficient planning of berth allocation for
container terminals in Asia. Journal of Advanced Transportation, 31(1), 75-94.
Imai, A., Nishimura, E., & Papadimitriou, S. (2001). The dynamic berth allocation problem for a
container port. Transportation Research Part B: Methodological, 35(4), 401-417.
Imai, A., Nishimura, E., & Papadimitriou, S. (2003). Berth allocation with service priority.
Transportation Research Part B: Methodological, 37(5), 437-457.
Imai, A., Zhang, J. T., Nishimura, E., & Papadimitriou, S. (2007). The berth allocation problem
with service time and delay time objectives. Maritime Economics & Logistics, 9(4), 269-290.
Iyer, S. K., & Saxena, B. (2004). Improved genetic algorithm for the permutation flowshop
scheduling problem. Computers & Operations Research, 31(4), 593-606.
Kemp, S. (1996). Preferences for distributing goods in times of shortage. Journal of economic
psychology, 17(5), 615-627.
Lau, H. C., Chan, T. M., Tsui, W. T., Ho, G. T., & Choy, K. L. (2009). An AI approach for
optimizing multi-pallet loading operations. Expert Systems with Applications, 36(3), 4296-4312.
Madden, D. (1995). Labour supply, commodity demand and marginal tax reform. The Economic
Journal, 485-497.
Magsam, J., & McGeeney, R. (2014). Haywire bridge stalls river, railroad traffic. Arkansas
Democrat Gazette.
Manuscript Authors. (20XX). XXXX. Proceedings of the XXXX Industrial Engineering
Research Conference.

100
Manyong, V.M., Sanogo, D., Alene, A.D. (2009). The International Institute of Tropical
Agriculture's (IITA) experience in priority assessment of agricultural research. In Raitzer, D.A.,
& Norton, G.W. (Ed.), Prioritizing Agricultural Research for Development (pp.44-63).
Oxfordshire: CABI.
Mar, Inc. (1987). Deployable waterfront transportability study using heavy lift submersible ships.
NCEL Contract Report AD-A190 693.
Nagy, J.G., & Quddus, M. A. (1998). National agricultural commodity research priorities for
Pakistan. Agricultural Economics, 19(3), 327-340.
Nishimura, E., Imai, A., & Papadimitriou, S. (2001). Berth allocation planning in the public
berth system by genetic algorithms. European Journal of Operational Research, 131(2), 282-292.
Raa, B., Dullaert, W., & Schaeren, R. V. (2011). An enriched model for the integrated berth
allocation and quay crane assignment problem. Expert Systems with Applications, 38(11), 14136-
14147.
Schank, J., Mattock, M., Sumner, G., Greenberg, I., Rothenberg, J., & Stucker, J. P. (1991). A
review of strategic mobility models and analysis (No. RAND/R-3926-JS). Rand Corp, Santa
Monica, CA.
Sinclair, M., & Van Dyk, E. (1987). Combined routeing and scheduling for the transportation of
containerized cargo. Journal of the Operational Research Society, 38(6), 487-498.
Stern, C. V. (2010). Inland Waterways: Recent Proposals and Issues for Congress. Congressional
Research Service, Library of Congress.
Theofanis, S., Boile, M., & Golias, M. (2007). An optimization based genetic algorithm heuristic
for the berth allocation problem. In Evolutionary Computation, 2007. CEC 2007. IEEE Congress
on (pp. 4439-4445). IEEE.
Umang, N., Bierlaire, M., & Vacca, I. (2013). Exact and heuristic methods to solve the berth
allocation problem in bulk ports. Transportation Research Part E: Logistics and Transportation
Review, 54, 14-31.
U.S. Army Corps of Engineers. (2014). Lock Performance Monitoring System, U.S. Army Corps
of Engineers. Retrieved from: http://corpslocks.usace.army.mil/
U.S. Army Corps of Engineers. (2012). Commodity classification list. Navigation Data Center,
US Army Corps of Engineers. Retrieved from:
http://www.ndc.iwr.usace.army.mil/wcsc/webpub10/pdfs/commodity.pdf
U.S. Army Corps of Engineers. (2009). Inland Waterway Navigation: Value to the Nation.
Retrieved from: http://www.corpsresults.us/
101
U.S. Department of Homeland Security. (2007). Strategy to enhance international supply chain
security. Retrieved from: http://www.dhs.gov/xlibrary/assets/plcy-
internationalsupplychainsecuritystrategy.pdf
U.S. Department of Homeland Security. (2006). National strategy for maritime security: the
maritime infrastructure recovery plan. Retrieved from:
http://www.dhs.gov/xlibrary/assets/HSPD_MIRPPlan.pdf
Wang, S., Meng, Q., & Liu, Z. (2013). A note on “Berth allocation considering fuel consumption
and vessel emissions”. Transportation Research Part E: Logistics and Transportation Review,
49(1), 48-54.
Weinberger, S. N. (2010). Who should set airlift priorities during foreign humanitarian
assistance/disaster relief operations and on what basis. Naval War College, Newport, RI.
Retrieved from: http://www.dtic.mil/dtic/tr/fulltext/u2/a535096.pdf
Xu, D., Li, C. L., & Leung, J. Y. T. (2012). Berth allocation with time-dependent physical
limitations on vessels. European Journal of Operational Research, 216(1), 47-56.
Yang, C., Wang, X., & Li, Z. (2012). An optimization approach for coupling problem of berth
allocation and quay crane assignment in container terminal. Computers & Industrial Engineering,
63(1), 243-253.
Zhen, L., & Chang, D. F. (2012). A bi-objective model for robust berth allocation scheduling.
Computers & Industrial Engineering, 63(1), 262-273.

102
5. A TABU SEARCH APPROACH TO THE CARGO PRIORITIZATION AND
TERMINAL ALLOCATION PROBLEM
Jingjing Tong, M.S.
Heather Nachtmann, Ph.D.
Abstract
To mitigate inland waterway disruption impacts, we develop a tabu search (TS) approach to
solve the cargo prioritization and terminal allocation problem (CPTAP) to minimize the total
value loss of disrupted barge cargoes. CPTAP is formulated as a nonlinear binary integer
program, and problems of realistic size can be efficiently and effectively solved with an efficient
heuristic approach. Given different neighborhood structures, multiple TS variants are attempted
and compared. Solving CPTAP with our TS heuristic leads to the lowest cargo value loss and the
shortest response time for the disrupted barges compared to a genetic algorithm approach and a
naïve minimize distance strategy.
Key Words: Maritime Transportation; Inland Waterway; Cargo Prioritization; Tabu Search
1. Introduction
Composed of waterways, rivers, locks and dams, canals, and bridges, the 12,000 navigable miles
of United States’ inland waterway system (USACE, 2012a) is a crucial transportation mode for
moving large quantities of bulk cargo to their destinations. The vast inland waterway
transportation system serves thirty-eight States with four major navigation channels –Mississippi
River, Ohio River, Gulf Intercoastal Waterway, and Pacific Coast System (ASCE, 2009). In

103
2013, a total of 2.3 billion tons of domestic and international freight was transported by water
(USACE, 2013). Measured by percent of total inland waterborne tonnage, the major
commodities transported on the inland waterways are petroleum (41%), coal (14%), and food
and farm products (12%) (USACE, 2013). In addition to its low transportation rate, barge
transportation is recognized as an environment-friendly and capacity-efficient transportation
mode that reduces surface transportation congestion and improves the air quality.
As described in Authors (20##), an unexpected disruption to the inland waterway transportation
system due to a natural disaster, vessel accident, or terrorist attack may result in a non-navigable
water level or destruction of major navigation infrastructure (e.g. bridges, locks and dams) that
shuts down the navigation channel and requires barge cargoes to be offloaded and transported to
their final destination via an alternative land-based transportation mode. A barge tow typically
consists of nine to fifteen barges, each with the capacity to carry approximately sixty truckloads
or fifteen railcar loads of cargo. The disrupted cargo may exceed the existing capacity of
accessible terminals and alternative modes of transportation, and the cargo’s value diminishes in
terms of economic value, societal benefit, and customer satisfaction as response time elapses.
This paper presents a tabu search (TS) approach to the cargo prioritization and terminal
allocation problem (CPTAP) which was introduced by Authors (20##) and minimizes the total
value loss by optimally prioritizing disrupted barges through consideration of multiple
prioritization factors including commodity type, cargo value, terminal capacity, and barge draft.
CPTAP is a combinatorial optimization problem that cannot be solved by an exact solution
approach under realistic problem size conditions. In our previous work, we formulated CPTAP
as a nonlinear binary integer program, and problems of realistic size were efficiently and
effectively solved with a genetic algorithm approach (Authors, 20##). The details of CPTAP and

104
its similarities to the berth allocation problem (BAP) (see original work by Imai et al., 1997; Imai
et al., 2001; Imai et al., 2003) are discussed in Authors (20##). CPTAP is a three dimensional
assignment problems that involves two decisions, barge/ship-to-terminal/berth assignment and
offload/service order at the terminal/berth, and the elapsed time of a barge/ship that is
incorporated into the objective function partially depends on its predecessors (Authors, 20##).
We were motivated to explore TS as a solution approach to CPTAP primarily for two reasons: 1)
two principles guide the development of metaheuristics, population search and local search
(Cordeau et al., 2002). Our prior work employed a population search strategy, a GA-based
heuristic that recombines a number of parent solutions to generate child solutions. The TS
heuristic is a local search strategy which obtains new solutions through a neighborhood search.
Our investigation of the CPTAP TS heuristic will reveal the performance of a local search
solution approach to CPTAP and enable us to compare these two principles for CPTAP in terms
of the solution quality, computational efforts and robustness, and 2) CPTAP has similarities to
BAP, and TS has been successfully applied to BAP as evidenced by the literature (Cordeau et al.,
2005; Meisel and Bierwirth, 2009; Giallombardo et al., 2010).
As a local search metaheuristic, TS examines the solution space by conducting a neighborhood
search based on the current solution, picking up the best found solution according to a penalized
cost function, and then searching the neighborhood of the new solution. The new solution may
not be a feasible solution but could be admitted to allow for exploration of its neighborhood
space. Cycling of a set of solutions may occur since the selection of current solution does not
follow a fixed path such as increasing/decreasing objective function values. Therefore, a tabu
mechanism is used to store the solution modifications in previous steps, and these modifications
are not allowed in the next couple of iterations in order to avoid exploring investigated space
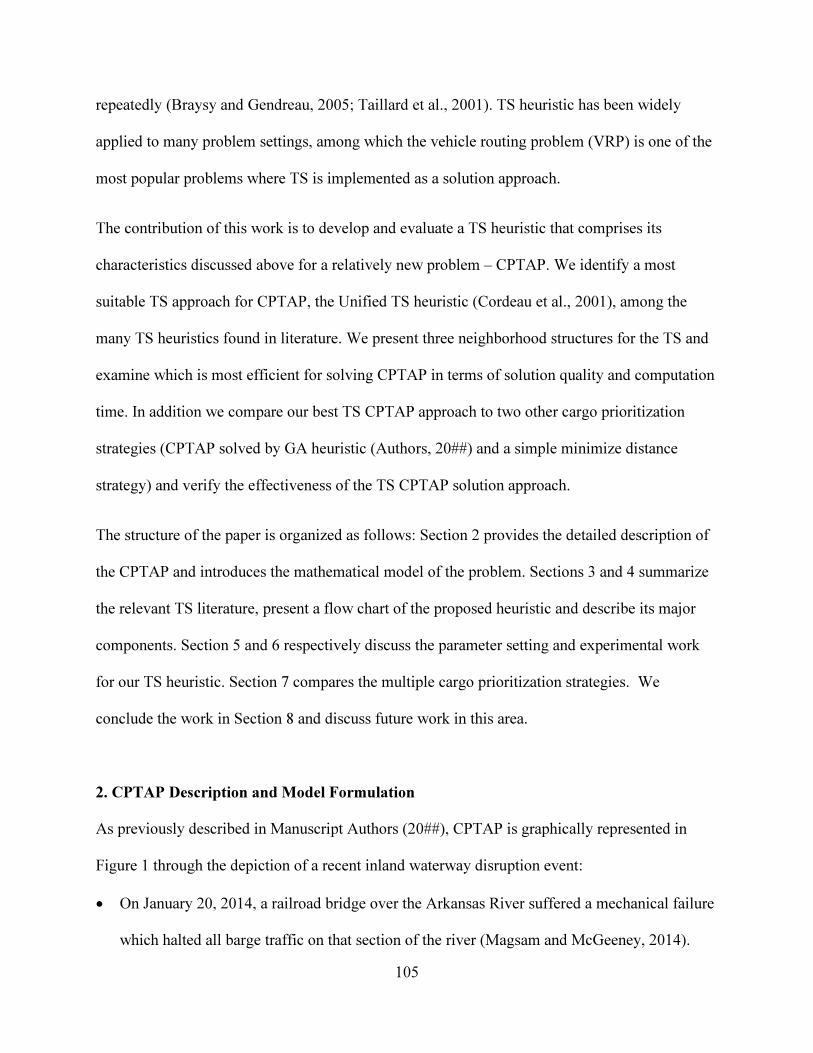
105
repeatedly (Braysy and Gendreau, 2005; Taillard et al., 2001). TS heuristic has been widely
applied to many problem settings, among which the vehicle routing problem (VRP) is one of the
most popular problems where TS is implemented as a solution approach.
The contribution of this work is to develop and evaluate a TS heuristic that comprises its
characteristics discussed above for a relatively new problem – CPTAP. We identify a most
suitable TS approach for CPTAP, the Unified TS heuristic (Cordeau et al., 2001), among the
many TS heuristics found in literature. We present three neighborhood structures for the TS and
examine which is most efficient for solving CPTAP in terms of solution quality and computation
time. In addition we compare our best TS CPTAP approach to two other cargo prioritization
strategies (CPTAP solved by GA heuristic (Authors, 20##) and a simple minimize distance
strategy) and verify the effectiveness of the TS CPTAP solution approach.
The structure of the paper is organized as follows: Section 2 provides the detailed description of
the CPTAP and introduces the mathematical model of the problem. Sections 3 and 4 summarize
the relevant TS literature, present a flow chart of the proposed heuristic and describe its major
components. Section 5 and 6 respectively discuss the parameter setting and experimental work
for our TS heuristic. Section 7 compares the multiple cargo prioritization strategies. We
conclude the work in Section 8 and discuss future work in this area.
2. CPTAP Description and Model Formulation
As previously described in Manuscript Authors (20##), CPTAP is graphically represented in
Figure 1 through the depiction of a recent inland waterway disruption event:
• On January 20, 2014, a railroad bridge over the Arkansas River suffered a mechanical failure
which halted all barge traffic on that section of the river (Magsam and McGeeney, 2014).

106
Five locks and dams (L/Ds) serve that river section, and ten terminals are located along both
sides of the river (locations shown in Figure 1). Each terminal is capable of offloading
specific commodity types of cargo depending on its handling facilities.
• According to the USACE Lock Performance Monitoring System (2014), eight barge tows,
commonly consisting of nine to fifteen barges each, were traveling up and down the
disrupted river section at the time of the event as shown in Figure 1. Since the disruption
prohibits barge traffic at the bridge location, the six barge tows (consisting of approximately
60 disrupted barges) that are traveling towards and beyond the damaged bridge (shaded in
black) are disrupted and need to be prioritized and redirected through implementation of
CPTAP. The two barge tows that have already passed under the damaged bridge and are
traveling away from the disruption point (shaded in white) are not impacted.
• Since the disrupted barges are no longer able to travel to their original designation along the
disrupted inland waterway, CPTAP determines an accessible terminal for offloading and
rerouting the cargo on each disrupted barge and the barge’s offload order at the designated
terminal since more than one barge may be sent to a given terminal. Because the disruption
has effectively divided the inland waterway into two sections, CPTAP is typically employed
twice, once for disrupted barges located on the river above the disruption and once for
disrupted barges located on the river below the bridge.

107
Figure 1 Arkansas River Disruption (Authors, 20##)
The widely-studied BAP shares a similar decision structure to our CPTAP, and the original work
in BAP supported the development of our model formulation (Imai et al., 1997; Imai et al., 2001;
Nishimura et al., 2001; Imai et al., 2003). The focus of CPTAP is to assign barges to terminals
with consideration of cargo offloading priorities at a terminal while BAP assign vessels to berths
with consideration of vessel ordering at a berth. We adopt the three dimensional decision
variable that is a common variable type in BAP papers and adapt some of the constraints found

108
in BAP literature (Imai et al., 1997; Imai et al., 2001; Nishimura et al., 2001; Imai et al., 2003) to
develop our CPTAP model formulation (constraint sets (2), (3), (4) and (7)).
The sets, variables and parameters of CPTAP formulation are described as follows (Authors,
20##):
Sets
J – Set of barges with non-hazardous cargo
H – Set of barges with hazardous cargo
I – Set of real terminals
D – Set of dummy terminal (one)
K – Set of barge orders at a given terminal
N – Set of commodity cargo types
Decision variables ���� ∈ �0, 1� 1 if barge j is assigned to terminal i in the kth order; 0 otherwise
Parameters ��� Water transport time of barge j from its location at the time of disruption to terminal i
ℎ�� Handling time of barge j at terminal i
��� Actual contributing time of barge j that is assigned to terminal i in the kth order
��� Land transport time of barge j cargo from terminal i to its final destination by alternative
mode of transportation �� Value decreasing rate of barge j cargo per unit volume per unit time
��� Offload capacity for cargo n at terminal i during the disruption response � Cargo volume on barge j
� Water depth at terminal i �� Draft depth of barge j ��� 1 if barge j carries cargo n; 0 otherwise Safety level

109
�� Total value of barge j cargo � Sinking threshold
��� = � ��� + ℎ�� � = 1ℎ�� � ≠ 1��� ≤ ∑ ∑ ����∈����∈∪ ��� + ℎ�� − ∑ ∑ ����∈����∈� � ≠ 1��� > ∑ ∑ ����∈����∈∪
(1)
The CPTAP is formulated as a nonlinear integer program (NLIP) as follows (Authors, 20##):
Min
∑ ∑ ∑ {�∈��∈∪�∈� �∑ ∑ ������ �����∈� + ��� + ����∈∪ ��������} +∑ ∑ ∑ �������∈��∈�∈�
s.t.
∑ ∑ �����∈��∈�∪� = 1∀� ∈ � (2) ∑ ∑ �����∈��∈� = 1∀� ∈ � (3)
∑ ���� ≤ 1∀� ∈ �, � ∈ ��∈∪ (4)
∑ ���� ≥ ∑ ��� �����∈∪ ∀� ∈ � ∪ �, � ∈ �/|�|�∈∪ (5)
∑ ∑ �������� ≤ ���∀� ∈ � ∪ �,� ∈ ��∈��∈∪ (6)
∑ ∑ (� −�∈��∈� ��)���� ≥ ∀� ∈ � ∪ � (7)
∑ ∑ {(∑ ∑ ������ �����∈� + ��� + ���)�∈∪ �������}�∈��∈� ≤ ���∀� ∈ � ∪ � (8)
���� ∈ �0,1�∀� ∈ � ∪ �, � ∈ �, � ∈ � ∪ � (9)
Constraints that are actively involved into the TS process are the capacity constraint set (6), draft
constraint set (7), and value loss constraint set (8). Additional explanation of the model and
associated assumptions can be found in Authors (20##).

110
3. Literature Review
We investigated papers that employ a TS heuristic to solve the BAP and VRP. The BAP TS
literature was most valuable in developing our TS heuristic since it has the similar framework
with CTPAP. However, since a limited number of BAP papers focus on the TS heuristic, we
extended our literature review to include the VRP literature because considerable papers have
investigated TS implementation in VRP.
TS in BAP
Cordeau et al. (2005) proposed a new formulation approach for the discrete berth allocation
problem (BAP) – the multi-depot VRP with time windows (MDVRPTW) formulation which
handles the weighted sum of the service times and the time windows of the berthing times. They
employed a TS heuristic to solve the discrete case with an extension for the continuous BAP,
which is capable of obtaining optimal solutions for small size instances and better solutions for
large size instances when compared to a truncated branch-and-bound algorithm. Meisel and
Bierwirth (2009) integrated the BAP and crane assignment problem (BACAP) to provide an
integer linear program model that incorporates the practical impact of the crane resources on the
handling time. Both squeaky wheel optimization and TS heuristic are employed and compared in
solving a set of benchmark problems. Giallombardo et al. (2010) studied the BACAP as a mixed
integer linear program formulation where TS is used to solve their BAP decision (adapted from
Cordeau et al., 2005) and obtains good solutions within a satisfactory amount of time.
TS in VRP
A steady, thorough, and extensive evolution of VRP heuristics has been observed in the last forty
years, among which the TS heuristic is identified as one of the best metaheuristics for the VRP
(Cordeau and Laporte, 2005; Taillard et al., 2001). More than fifty papers have been published

111
on this topic since the first TS implementation to the VRP in 1989 (Laporte, 2009). Multiple
survey papers have summarized the TS literature in VRP (Eksioglu et al., 2009; Laporte, 2009;
Braysy and Gendreau, 2005; Cordeau, et al., 2002; Cordeau and Laporte, 2005) and identified
TS as a competitive metaheuristic method to solve VRP. Some researchers consider TS to be the
best metaheuristic method for solving the VRP (Cordeau, et al., 2002). Nine papers were found
to be the most informative to our work and are summarized in Table 1. Among these TS
heuristics, the Unified TS is chosen as the most suitable TS method for CPTAP due to its proved
efficiency, robustness (small number of parameters to be determined), and compatibility to our
CPTAP structure.

112
Table 1 Comparison of Select TS VRP Literature
TS Approach Author(s) Year VRP Type(s) Unique Feature(s)
Unified TS Cordeau et al. 1997 Periodic VRP & Multi-
depot VRP • Generate one initial solution irrespective of feasibility • Employ the penalized function with self-adjusting
coefficients
• Use limited user-controlled parameters
Cordeau et al. 2001 Multi-depot VRP with
Time Windows (VRPTW) • Apply a very simple exchange procedure for a
predetermined number of iterations
Cote and
Potvin
2009 VRP with Private Fleet
and Common Carrier
(VRPPC)
• Use a union of two neighborhoods as the neighborhood structure
Taburoute TS Gendreau et al. 1994 VRP • Include a generalized insertion routine procedure to periodically improve the tours of the solution in order to
decrease the chance of being trapped in a local optimum
Gendreau et al. 2008 Capacitated VRP with
Two-dimensional
Weighted Item (2L-
CVRP)
• Use constraints to express the two-dimensional loading
feature of the items
• Accept moves that cause the infeasibility of either weight
constraints or loading constraints
TS with
Adaptive
Memory
Procedure
Rochat and
Taillard
1995 Capacitated VRP (CVRP) • Generate multiple initial solutions to form a solution pool
which produces a number of tours
• Extract tours according to a probabilistic technique to form
a new solution
Tarantilis 2005 Capacitated VRP (CVRP) • Utilize the sequence of nodes to create the new solution instead of extracting and combining routes
• Select the elite parts according to deterministic selection
criteria rather than the probabilistic routes selection
Other TS Wassan et al. 2008 VRP with Pickups and
Deliveries (VRPPD) • Create an innovative procedure to check the feasibility of
the insertions without increasing the computational
complexity of the neighborhood search
Bolduc et al. 2010 VRP with Production and
Demand Calendars
(VRPPDC)
• Employ two new neighbor reduction strategies
• Include an improvement phase after the tabu iterations are
completed

113
4. Tabu Search Heuristic for CPTAP
In this section, we describe our CPTAP TS heuristic. The general CPTAP TS framework is
developed from the Unified TS proposed by Cordeau et al. (2001). We adapt their heuristic
according to the characteristics of CPTAP and consider additional heuristic design components
including two potential initial solution generation approaches based on the CPTAP solution
structure, three possible neighborhood structures to select the best neighborhood scheme, two
alternative tabu management approaches, and possible incorporation of a post-optimization step
utilizing a local swap structure.
4.1 CPTAP Tabu Search Heuristic Flowchart
Figure 2 presents a flowchart of the CPTAP TS heuristic.

114
Figure 2 CPTAP TS Flowchart
4.2 Initial Solution
An initial solution is required to start the CPTAP TS search process. This initial solution may be
found to be infeasible since our heuristic explores feasible and infeasible solution spaces. Two

115
methods for generating an initial solution are developed and compared: Random Generation
(randomly produces a solution without any restriction on the solution structure) and Organized
Generation (attempts to find a “near-feasible” initial solution that meets the draft constraints
(constraint set (7)) and is not likely to violate the capacity constraints (constraint set (6)). The
Organized Generation approach is more likely to quickly generate a feasible initial solution and
is described below:
1. Record the acceptable barges for each terminal in terms of barge draft restriction:
• For each real terminal i, assign the barges that the terminal can accept according
to the draft constraint;
• For dummy terminal d, assign the barges that carry non-hazardous cargo to the
dummy terminal.
2. For i = 1, …, I – 1, conduct the following processes:
• Determine the type of cargo each barge carries;
• If adding the next barge will cause the capacity violation of a specific cargo type,
remove the barge from the assigned terminal; otherwise, keep the barge.
3. Delete the duplicate barges that have appeared in the previous terminals.
Preliminary experimentation indicated that the Random Generation produces better CPTAP
solutions compared to Organized Generation when controlling for the other TS constituents and
parameters. Therefore, we will select Random Generation as the initial solution generation
approach for our CPTAP TS heuristic.
4.3 Penalized Cost Function
In the Unified TS (Cordeau et al., 2001), a penalized cost function is used to evaluate solutions
as a replacement for the objective function. Solution x represents a decision result from CPTAP

116
that could be feasible or infeasible. ���� denotes the original objective function value (i.e. the
total value loss of the disrupted barge cargo); ����,���� and �(�) denote the total violation of
the constraint sets – capacity constraint (constraint set (6)), draft constraint (constraint set (7))
and value loss constraint (constraint set (8)). The violated amount of each constraint set is added
to the objective function to form the penalized cost function as follows:
���� = ����+ ���� + ���� + ��(�) (10)
Where
���� = ∑ ∑ ∑ {�∈��∈�∪��∈� �∑ ∑ ����������∈� + ��� + ����∈�∪� �������} + ∑ ∑ ∑ ����� ��∈��∈��∈ ;
��� = ∑ ∑ max{∑ ∑ �������� − ��� , 0}�∈��∈�∪��∈��∈�∪ ;
���� = ∑ max�� − ∑ ∑ (��� −�∈��∈� �� ���� , 0}�∈�∪� ;
��� = ∑ max{∑ ∑ {(∑ ∑ ����������∈� + ��� + ���)�∈�∪� �������}�∈��∈� − � ��, 0}�∈�∪� ;
, and � are positive self-adjusting parameters.
Functions ����,����, and �(�) assure that only the violated amounts of the infeasible constraints
are penalized in the cost function. The function values of ����,����, and �(�) for a feasible
solution are equal to zero. In order to diversify the search space, parameters , , and � are
updated by a positive factor δ according to the current solution. If the current solution is feasible
with respect to capacity/draft/value loss constraints, � ��� = � ���/(1 + δ); otherwise,
� ��� = � ��� × �1 + δ�. Explanation of this diversification step is that we tend to
penalize the constraint set lightly once a feasible constraint of that constraint set appears. This is
because we have reached a feasible area associated with the constraint set so we should extend
the search space by allowing the search to reach more infeasible space. On the other hand, if the
constraint is infeasible at a given iteration, it means we are already searching the infeasible space
relating to that constraint. To ensure we return to a feasible space to produce an acceptable

117
solution, we increase the penalty cost to force the search back to a feasible solution. This
updating process is carried out at the end of each iteration in order to adapt the search at the next
iteration.
4.4 Neighborhood Structure
Neighborhood search is an important step in any TS heuristic as it determines the transition
between the current solutions of different iterations (Ceschia et al., 2011). Several papers
employing the Unified TS incorporate an insertion step to complete their neighborhood search
(Cordeau et al., 1997; Cordeau et al., 2001). Based on the features of our CPTAP model, we
consider the following four neighborhood search methods:
a. Partial Shift (PS): This neighborhood move is defined by removing a barge j from the
current assigned terminal i and reinserting it to another terminal i* with a random
prioritization order k given at the terminal i*. New current solution candidate set includes
moving each barge j to each terminal i* (other than the original assigned terminal i). The
prioritized order at the new terminal is randomly generated in order to reduce the
computational effort. Barge j can be reinserted with any order at the last terminal (the
dummy terminal) because there is no actual prioritization for barges that stay on the
disrupted waterway.
b. Complete Shift (CS): The difference between CS and PS is the priority turn the barge
takes at the new assigned terminal i*. Instead of randomly generating the insertion
location in PS, the turn that barge j should take in CS is selected by comparing the
penalized cost function values for all the potential insertion locations at terminal i*.
Consequently, much more time will be consumed to find a new current solution (Cordeau
et al., 2001).

118
c. Blind SWAP Search (BS): This move takes a liberal perspective on neighborhood
search by randomly exchanging two genes in the solution chromosome irrespective of
their representation of barge or terminal. BS conducts the exchange on a predetermined
number of SWAP pairs.
d. Switch SWAP Search (SS): Adapted from BS Search, SS Search exchanges two barges
at two different terminals, and the two barges take each other’s priority turn as the
insertion location. SS conducts the exchange on a predetermined number of SWAP pairs.
Based on preliminary experimentation, we determined that the computational time of the CS may
exceed several hours for a realistic size CPTAP instance, which is not acceptable in a decision
scenario where prompt response is expected by the decision makers. Therefore we eliminate CS
as a viable neighborhood search method for the CPTAP TS heuristic and focus on the other three
neighborhood search methods as discussed in Section 6.
4.5 Tabu Management and Aspiration Criterion
In TS, solutions with certain attributes are prohibited from a certain number of iterations in order
to avoid cycling around a local minimum (Braysy and Gendreau, 2005). The selection of the
attribute (also called tabu management) is critical since it influences the solution selection. Two
tabu management approaches are considered in the development of our CPTAP TS heuristic:
Pair Attribute and Single Attribute:
a. Pair Attribute: Two elements are included in the Pair Attribute approach. The attribute
structures are different for the Shift (CS and PS) and SWAP (BS and SS) neighborhood
searches as follows:
• For PS and CS: A(x) = {(i, j): barge j is offloaded at terminal i}. When a
neighborhood move of removing barge j from terminal i and inserting j into terminal
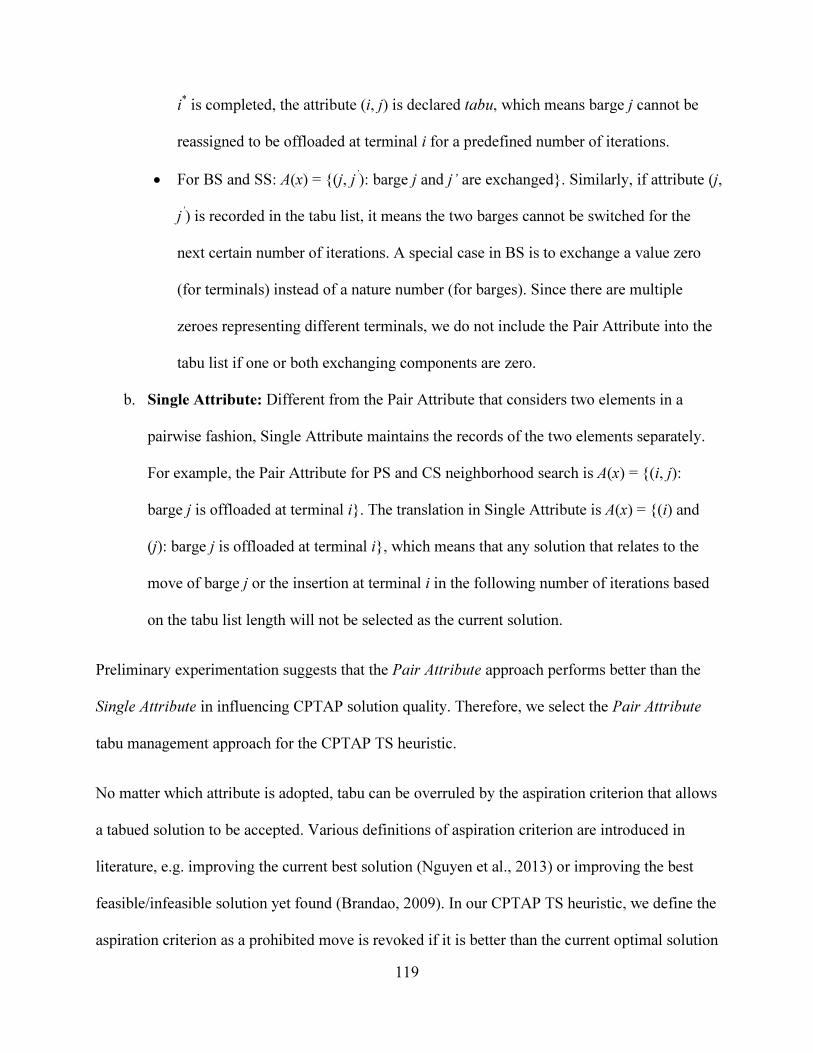
119
i* is completed, the attribute (i, j) is declared tabu, which means barge j cannot be
reassigned to be offloaded at terminal i for a predefined number of iterations.
• For BS and SS: A(x) = {(j, j’): barge j and j’ are exchanged}. Similarly, if attribute (j,
j’) is recorded in the tabu list, it means the two barges cannot be switched for the
next certain number of iterations. A special case in BS is to exchange a value zero
(for terminals) instead of a nature number (for barges). Since there are multiple
zeroes representing different terminals, we do not include the Pair Attribute into the
tabu list if one or both exchanging components are zero.
b. Single Attribute: Different from the Pair Attribute that considers two elements in a
pairwise fashion, Single Attribute maintains the records of the two elements separately.
For example, the Pair Attribute for PS and CS neighborhood search is A(x) = {(i, j):
barge j is offloaded at terminal i}. The translation in Single Attribute is A(x) = {(i) and
(j): barge j is offloaded at terminal i}, which means that any solution that relates to the
move of barge j or the insertion at terminal i in the following number of iterations based
on the tabu list length will not be selected as the current solution.
Preliminary experimentation suggests that the Pair Attribute approach performs better than the
Single Attribute in influencing CPTAP solution quality. Therefore, we select the Pair Attribute
tabu management approach for the CPTAP TS heuristic.
No matter which attribute is adopted, tabu can be overruled by the aspiration criterion that allows
a tabued solution to be accepted. Various definitions of aspiration criterion are introduced in
literature, e.g. improving the current best solution (Nguyen et al., 2013) or improving the best
feasible/infeasible solution yet found (Brandao, 2009). In our CPTAP TS heuristic, we define the
aspiration criterion as a prohibited move is revoked if it is better than the current optimal solution

120
(the current best feasible solution found). Our employed aspiration criterion ensures that we do
not miss a “good” feasible solution that may be hidden by the tabu scheme.
4.6 Post-optimization Step
After obtaining the best-found solution s* through TS procedures, we consider a post-
optimization Local SWAP step after the selection of parameter values and the best neighborhood
structure to potentially find a better feasible solution. For a best-found solution s* (which is
feasible), several pairs of barges at each terminal are interchanged to produce a new solution s’.
Since the assignment of barges to a terminal is not changed, the capacity and draft constraints are
guaranteed to be feasible. However, the new assignment may violate value loss constraints.
Therefore, the value loss constraints are checked for the new solution s’. If the solution is still
feasible and the new solution s’ produces better penalized cost function value, the original best-
found solution s* will be replaced by the new solution s’. Preliminary experimentation suggests a
very slight decrease of the objective function value which does not support further consideration
of incorporating a post-optimization step into the CPTAP TS heuristic.
5. Parameter Analysis
In this section we set the parameter values of our CPTAP TS heuristic systematically through a
one-way sensitive analysis in order to maximize the heuristic’s performance. Since the penalty
parameters , , and � will be modified frequently by adjustment factor δ, we focus the analysis
on the adjustment factor instead of the initial parameter values. Based on preliminary analysis,
the initial penalty parameters , , and � are set to 10, 100, and 10. A sequential parameter
determination approach is employed in the following sequence:
a. Adjustment factor δ of the penalty parameters

121
b. Length of tabu list
c. Number of iterations.
Once a parameter’s value is set, it is adopted for the reminder of the analysis. As we discussed in
Section 4, random generation and pair attribute are employed as the initial solution generation
approach and the tabu management method respectively. The size of CPTAP problem instances
are classified into small (five terminals and five/seven/nine barges), medium (ten terminals and
thirty barges), and large (fifteen terminals and fifty barges). Preliminary analysis indicates that
the CPTAP TS heuristic performance on small-sized problems is not sensitive to changes in the
parameter settings so we limit our discussion to our sensitivity analysis on medium and large size
problems.
5.1 Adjustment Factor
Based on our preliminary experiments and related literature (Cordeau, et al., 1997; Gendreau, et
al., 2008), the appropriate value of δ should vary within the range [0.01, 5]. If the value of δ is
too small, the heuristic cannot deliver a feasible solution if the search locates a good infeasible
area. On the other hand, if the value of δ is too large, the search jumps drastically around the
solution area and may prevent the search from investigating consecutive solutions. We consider
six values (0.01, 0.05, 0.1, 0.5, 1 and 5) within the interval [0.01, 5]. Ten medium size instances
are run ten times under each of the six values of δ, resulting in 100 solutions for each δ value.
Maximum, minimum, and average objective function (total value loss) results for each δ value
are summarized in the stock charts shown in Figure 3. The upmost point and the downmost point
of each vertical line indicate the maximum and minimum solutions among the 100 solutions,
while the marker in the middle represents the average solution result. According to Figure 3
results for the medium size instances, the average values obtained when δ is set at 1 or 5 is

122
undesirably higher than those found by the lower δ values. Therefore, we reduce the parameter
candidate pool to those that fall between 0.01 and 0.5. Appendix 1 displays detailed maximum,
minimum, and average objective function results of the medium size problem. When δ is set to
0.05, there are more instances that have the lowest minimum and average results (shaded cells in
Appendix 1). In addition, Figure 3 for the medium size instances shows that δ equal to 0.05
produces the smallest solution variance. Therefore, we select 0.05 as the adjustment factor value
for medium size problems. The same experiments were conducted on large size CPTAP
instances, and we draw the same conclusion that δ should be set to 0.05 (see large size results in
Figure 3 and Appendix 1).
0.01 0.05 0.1 0.5 1 5
4.0E5
6.0E5
8.0E5
1.0E6
1.2E6
1.4E6
Avg
Tota
l V
alue
Loss
($)
Adjustment Factor
Middle Size
0.01 0.05 0.1 0.5 1 55.0E5
1.0E6
1.5E6
2.0E6
2.5E6
3.0E6
Avg
Tota
l V
alue
Loss
($)
Adjustment Factor
Large Size
Figure 3 Sensitive Analysis Results of Adjustment Factor δ
5.2 Length of Tabu List
We also conduct a one-way sensitivity analysis on ten instances of medium and large size
problems to investigate the length of the tabu list that produces the best quality solutions. Based
on preliminary experimentation, we set the tabu list interval as [20, 80] and considered four
values as the candidate tabu list lengths (20, 40, 60, and 80). Each instance is run 10 times for
each tabu list length value. The average and minimum objective function results among ten runs

123
are calculated for each instance with each candidate value. Figure 4 summarizes the CPTAP TS
heuristic performance for each tabu list length. Because CPTAP is a minimization problem, we
want the parameter value that delivers the most instances with minimum objective function value
and the minimum average objective function value at the same time. We observe that 20, 40, and
60 tabu list lengths are on the pareto frontier for the medium size instances, and 20 is the only
pareto point for the large size instances. Combining the results from the two scenarios displayed
in Figure 4, a tabu list length of 20 is selected in order to find the best solution (minimum
objective function value) and stay robust (minimum average objective function value).
0 1 2 3 4 50
1
2
3
4
5
6
20
40
60
80
# o
f in
stan
ces
wit
h m
inim
um
obje
ctiv
e f
unct
ion v
alue
# of instances with minimum
average objective function value
Pair Attribute - Midum Size
Pareto Frontier
0 1 2 3 4 5 6
0
1
2
3
4
5
6
7
20
40
60
80
# o
f in
stan
ces
wit
h m
inim
um
obje
ctiv
e f
unct
ion v
alue
# of instances with minimum
average objective function value
Pair Attribute - Large Size
Pareto Point
Figure 4 Sensitive Analysis of the Length of Tabu List
5.3 Termination Condition
To determine the stopping rule of the CPTAP TS heuristic, we develop charts of the current and
best-found solution values versus the iteration number for one medium size instance and one
large size instance as shown in Figure 5. Interesting phenomena that are shown in both problem
sizes are: 1) the current solution is generally worse (larger penalized cost function value) than the
best solution found so far. It is likely that the current solution is frequently infeasible; therefore
its objective function is penalized and larger than the best-found solution, and 2) the best-found

124
solution is improved dramatically in the first several hundreds of iterations. Then the
improvement slows down with no practical improvement after 4,500 iterations. A number of
local optimum can be identified through the “big” steps of the best-found solutions. Based on the
results shown in both charts of Figure 5, we set the final number of iterations to 5,000 to ensure a
good-quality solution.
Figure 5 Heuristic Termination Analyses

125
6. Computational Results
In this section, we determine the best TS heuristic variant and compare the resulting CPTAP TS
heuristic with the benchmark results of the CPTAP GA method (Manuscript Authors, 20##). The
CPTAP TS heuristic is coded in C++ language and run on a Dell Intel Core i7 CPU with 4.00GB
of RAM.
In order to compare the two heuristics, we run the same instances that were generated previously
for CPTAP GA-based heuristic (Manuscript Authors, 20##). The instances are systematically
generated from a data set collected on the Upper Mississippi River (Authors, 20##). The study
area is a 154-mile river section of the Upper Mississippi River, starting from Lock and Dam
No.14 north of Davenport, Iowa (Moline, Illinois) to Lock and Dam No.19 at Keokuk, Iowa.
Barge locations are generated uniformly over the study region according to the number of the
terminals in the instance and the locations of the terminals. Water transport time of each barge
from its current location to each terminal is calculated based on barge location, terminal location,
and barge speed (assumed five miles per hour). With each pair of terminal and barge assignment,
the offload time and the land transport time are estimated over uniform distributions of five to
ten hours and eighteen to ninety-six hours respectively. We assume barge volume to be 1000 per
ton and the terminal capacity to be 5000 tons per commodity type. Two digit commodity type
classification by USACE (2012b) is used as the cargo types and their 2012 tonnage data for the
study region and the market price are displayed in Table 2. We set the cargo type for each barge
on the basis of the tonnage data and calculate the total cargo value on a barge by multiplying the
barge volume and the market price. 100% of the petroleum and 50% of the chemicals are
considered as the hazardous cargo. Barge draft (ranging from six to fourteen feet) is determined
according to its probability density function that is estimated from the draft data of vessel trips
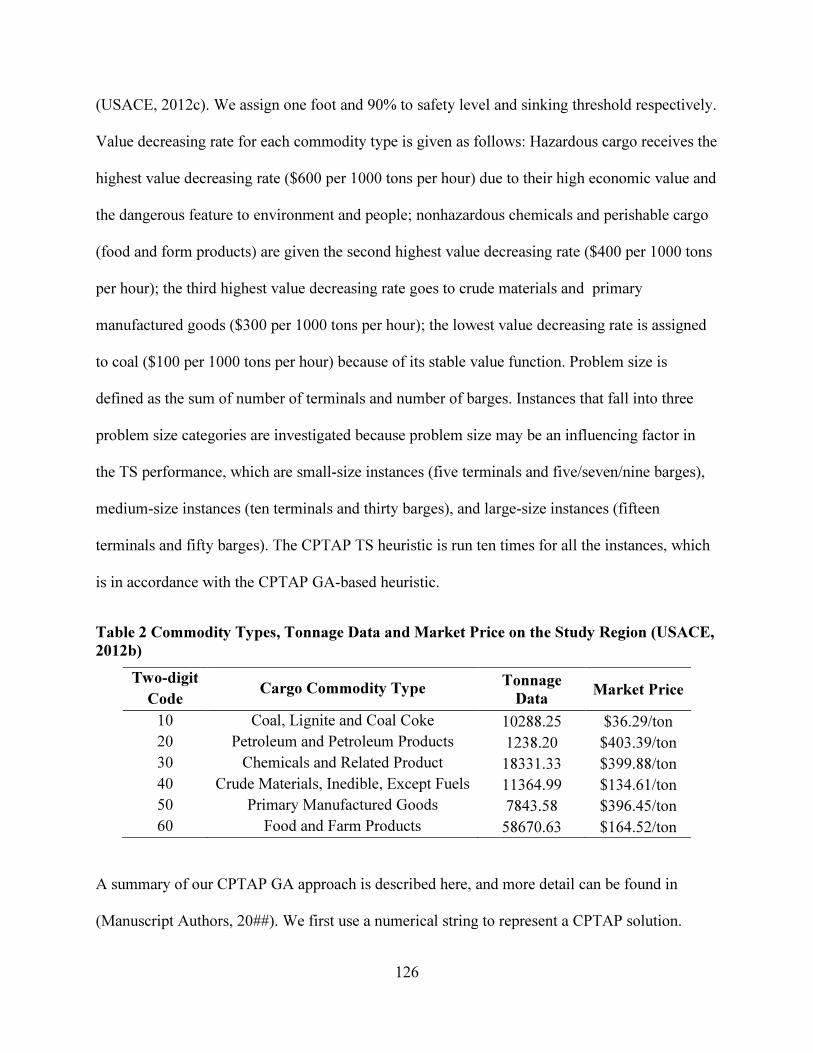
126
(USACE, 2012c). We assign one foot and 90% to safety level and sinking threshold respectively.
Value decreasing rate for each commodity type is given as follows: Hazardous cargo receives the
highest value decreasing rate ($600 per 1000 tons per hour) due to their high economic value and
the dangerous feature to environment and people; nonhazardous chemicals and perishable cargo
(food and form products) are given the second highest value decreasing rate ($400 per 1000 tons
per hour); the third highest value decreasing rate goes to crude materials and primary
manufactured goods ($300 per 1000 tons per hour); the lowest value decreasing rate is assigned
to coal ($100 per 1000 tons per hour) because of its stable value function. Problem size is
defined as the sum of number of terminals and number of barges. Instances that fall into three
problem size categories are investigated because problem size may be an influencing factor in
the TS performance, which are small-size instances (five terminals and five/seven/nine barges),
medium-size instances (ten terminals and thirty barges), and large-size instances (fifteen
terminals and fifty barges). The CPTAP TS heuristic is run ten times for all the instances, which
is in accordance with the CPTAP GA-based heuristic.
Table 2 Commodity Types, Tonnage Data and Market Price on the Study Region (USACE,
2012b)
Two-digit
Code Cargo Commodity Type
Tonnage
Data Market Price
10 Coal, Lignite and Coal Coke 10288.25 $36.29/ton 20 Petroleum and Petroleum Products 1238.20 $403.39/ton 30 Chemicals and Related Product 18331.33 $399.88/ton 40 Crude Materials, Inedible, Except Fuels 11364.99 $134.61/ton 50 Primary Manufactured Goods 7843.58 $396.45/ton 60 Food and Farm Products 58670.63 $164.52/ton
A summary of our CPTAP GA approach is described here, and more detail can be found in
(Manuscript Authors, 20##). We first use a numerical string to represent a CPTAP solution.

127
Natural numbers indicate the numbered barges and zeroes distinguish the terminals with the
dummy terminal located at the end of the string. We employ tournament selection to choose two
parent chromosomes in the population as the foundation to generate child chromosomes. The
major components of the CPTAP GA are a crossover operator that produces two child
chromosomes, a mutation operator that enables the GA to explore new solution areas, and a
repair operator that restores the structurally infeasible chromosome(s) caused by the first two
operators.
Table 3 exhibits our experimental results of the CPTAP TS heuristic under three different
neighborhood structures – Partial Shift (PS), Blind SWAP (BS) and Switch SWAP (SS). As
previously mentioned, random generation is used for initial solution generation, and pair attribute
is the tabu management scheme employed. Problem of sizes ten, twelve, and fourteen are
included in the small size problem experiments with five instances for each problem size.
Experiments on ten instances of medium and large size problem are conducted. The optimal
solutions (Opt) are presented in Table 3, which are found through the total enumeration program
run on the high performance computers of the ____ High Performance Computing Center at the
University of _____. We can only determine optimal solutions for small size problems of size
less than fourteen due to the memory limit. The total value loss (Min) and the CPU time (CPU)
of the CPTAP GA approach are expressed in dollars and seconds respectively in Table 3. Let
������ and �(���) denote the total value loss of the CPTAP GA solution��� and CPTAP TS
solution���. The estimated gap between the two heuristic results is given by
������ = ������������
������× 100% (11)
128
Similarly, we also calculate the CPU Gap of the two heuristics. TS-BS finds the same solution as
the CPTAP GA for all the small size instances (two thirds are optimal), and TS-PS obtains the
same solution as the CPTAP GA for thirteen out of fifteen small size instances. Both TS
heuristics require higher CPU time with average gap of 36.6% for TS-PS and 515.8% for TS-BS.
A dramatic deterioration of the solution quality can be observed from the TS-SS over small size
instances. TS-SS does not perform as well as the CPTAP GA on any of the fifteen small size
instances with a considerable higher total value loss of 10.73% on average. The poor
comparative performance is anticipated to continue as problem size increases, and therefore TS-
SS is excluded as a competitive alternative for the comparisons on medium and large size
instances. When comparing TS-PS and CPTAP GA results for medium and large size problems,
neither approach produces consistently better results than the other. On average, TS-PS yields
higher total value loss than CPTAP by 0.31% on medium size instances but lower than the
CPTAP GA on large size instances by 1.43%. The computation time of TS-PS is substantially
slower on average than the CPTAP GA for medium (784.95%) and large (1162.14%) size
instances. TS-BS improves the total value loss produced by the CPTAP GA on all twenty
instances of the medium and large size problems with 2.15% and 3.14% decreases on average.
The average CPU time of TS-BS is higher on average than the CPTAP GA for medium
(384.96%) and large (192.11%) size problem instances.
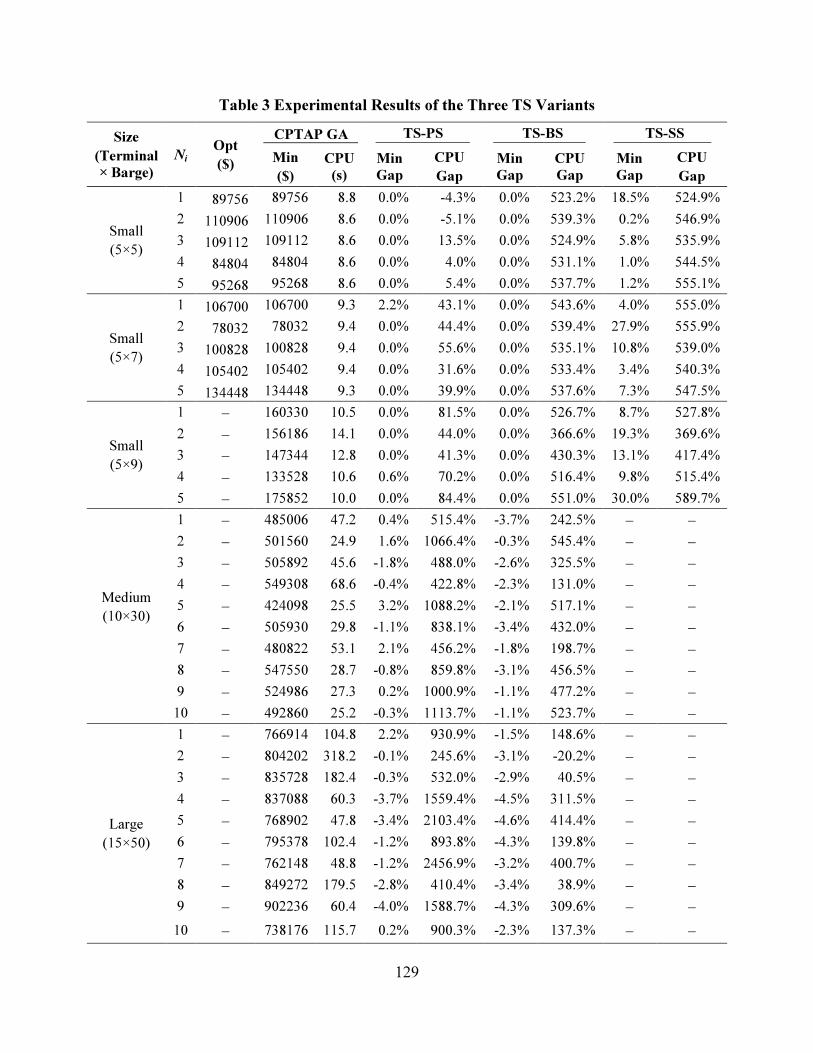
129
Table 3 Experimental Results of the Three TS Variants
Size
(Terminal
× Barge)
Ni Opt
($)
CPTAP GA TS-PS TS-BS TS-SS
Min
($)
CPU
(s)
Min
Gap
CPU
Gap
Min
Gap
CPU
Gap
Min
Gap
CPU
Gap
Small
(5×5)
1 89756 89756 8.8 0.0% -4.3% 0.0% 523.2% 18.5% 524.9%
2 110906 110906 8.6 0.0% -5.1% 0.0% 539.3% 0.2% 546.9%
3 109112 109112 8.6 0.0% 13.5% 0.0% 524.9% 5.8% 535.9%
4 84804 84804 8.6 0.0% 4.0% 0.0% 531.1% 1.0% 544.5%
5 95268 95268 8.6 0.0% 5.4% 0.0% 537.7% 1.2% 555.1%
Small
(5×7)
1 106700 106700 9.3 2.2% 43.1% 0.0% 543.6% 4.0% 555.0%
2 78032 78032 9.4 0.0% 44.4% 0.0% 539.4% 27.9% 555.9%
3 100828 100828 9.4 0.0% 55.6% 0.0% 535.1% 10.8% 539.0%
4 105402 105402 9.4 0.0% 31.6% 0.0% 533.4% 3.4% 540.3%
5 134448 134448 9.3 0.0% 39.9% 0.0% 537.6% 7.3% 547.5%
Small
(5×9)
1 − 160330 10.5 0.0% 81.5% 0.0% 526.7% 8.7% 527.8%
2 − 156186 14.1 0.0% 44.0% 0.0% 366.6% 19.3% 369.6%
3 − 147344 12.8 0.0% 41.3% 0.0% 430.3% 13.1% 417.4%
4 − 133528 10.6 0.6% 70.2% 0.0% 516.4% 9.8% 515.4%
5 − 175852 10.0 0.0% 84.4% 0.0% 551.0% 30.0% 589.7%
Medium
(10×30)
1 − 485006 47.2 0.4% 515.4% -3.7% 242.5% − −
2 − 501560 24.9 1.6% 1066.4% -0.3% 545.4% − −
3 − 505892 45.6 -1.8% 488.0% -2.6% 325.5% − −
4 − 549308 68.6 -0.4% 422.8% -2.3% 131.0% − −
5 − 424098 25.5 3.2% 1088.2% -2.1% 517.1% − −
6 − 505930 29.8 -1.1% 838.1% -3.4% 432.0% − −
7 − 480822 53.1 2.1% 456.2% -1.8% 198.7% − −
8 − 547550 28.7 -0.8% 859.8% -3.1% 456.5% − −
9 − 524986 27.3 0.2% 1000.9% -1.1% 477.2% − −
10 − 492860 25.2 -0.3% 1113.7% -1.1% 523.7% − −
Large
(15×50)
1 − 766914 104.8 2.2% 930.9% -1.5% 148.6% − −
2 − 804202 318.2 -0.1% 245.6% -3.1% -20.2% − −
3 − 835728 182.4 -0.3% 532.0% -2.9% 40.5% − −
4 − 837088 60.3 -3.7% 1559.4% -4.5% 311.5% − −
5 − 768902 47.8 -3.4% 2103.4% -4.6% 414.4% − −
6 − 795378 102.4 -1.2% 893.8% -4.3% 139.8% − −
7 − 762148 48.8 -1.2% 2456.9% -3.2% 400.7% − −
8 − 849272 179.5 -2.8% 410.4% -3.4% 38.9% − −
9 − 902236 60.4 -4.0% 1588.7% -4.3% 309.6% − −
10 − 738176 115.7 0.2% 900.3% -2.3% 137.3% − −

130
To summarize Table 3, TS-BS is identified as the best CPTAP TS heuristic. TS-BS is the only
CPTAP TS variant that produces either as good as or improved solutions in all thirty-five
experimental instances over the CPTAP GA. In fact, it produces the best-found result for all the
medium and large size instances where optimal solutions cannot be obtained. In terms of the
computational time, although TS-BS consumes more time than TS-PS for small size instances,
its actual CPU time is as small as approximately one minute which definitely falls within an
acceptable range. In medium and large size instances that more closely resemble realistic
decision scenarios, TS-BS requires quite a bit less time than the TS-PS approach.
If we consider solution quality and computation time to compare the heuristic results in Table 3,
the TS-BS and CPTAP GA do not dominate each other although TS-BS produces solutions with
lower objective function values. In Figure 6, we show summarized computational results when
reduce the number of iterations to 1000 for the three CPTAP TS heuristic variants (TS-PS, TS-
BS, and TS-SS) in order to make them comparable to the CPTAP GA (GA). For each heuristic
scheme, average total value loss and CPU time of five instances are presented for both medium
and large problem sizes. The best average total value loss is obtained by TS-BS in both problem
sizes, which is in accordance with the previous discussion. Moreover, this heuristic generates the
solution very quickly. For medium size instances, TS-BS computation time is slightly slower
than TS-SS (< 1s) and faster than the other two heuristic variants (+10s). Since TS-SS produces
much higher average total value loss (approximately $95,000 more than TS-BS), TS-BS is
considered an overall better choice than TS-SS. Moreover, TS-BS is the fastest approach for
solving large size problem instances. The other three heuristic variants require more time to
obtain worse solutions when compared to TS-BS.

131
30s 40s 50s 60s
$5.0E5
$5.5E5
$6.0E5
GA TS-PS
TS-SS
TS-BS
Aver
age
To
tal
Val
ue
Loss
Average CPU Time
Medium Size
50s 100s 150s 200s 250s
$8E5
$9E5
$1E6
GATS-PS
TS-SS
TS-BSAv
erag
e T
ota
l V
alue
Lo
ss
Average CPU Time
Large Size
Figure 6 Quality vs Time of GA and TS Heuristics for CPTAP
7. CPTAP Strategy Comparison
We further investigate the impact of applying CPTAP and its solution technique to realistic
inland waterway disruption scenario. A naive approach to inland waterway disruption response is
to assign the disrupted barge cargoes to their nearest feasible terminals. The objective function in
this approach is to minimize the total distance of all disrupted barges transport to their assigned
terminals. In this minimize distance (MD) approach, each terminal still serves one barge at a
time, and every disrupted barge must be handled by a terminal. Capacity and draft constraints
(constraint sets (6) and (7)) are again considered to ensure the barge can be accepted by the
terminal. However, cargo type is not a critical factor in the MD strategy. Hazardous cargo is not
being treated differently from nonhazardous cargo, and value loss does not influence the barge-
terminal assignments. An integer programming model with linear objective function and
constraints is developed to implement the MD approach and solved with AMPL-CPLEX. In
Figure 7, we show the comparative results of three cargo prioritization strategies (MD, CPTAP
TS, and CPTAP GA) for two performance measures – Total Value Loss and Response Time.
Total value loss is the objective function value for the CPTAP TS and CPTAP GA approaches.

132
For the MD approach, we calculate its total value loss after the optimal minimum distance barge-
terminal assignments are determined. We compute the Response Time, the total time to complete
water transport and cargo offloading of all disrupted barges, for all three approaches based on
their optimal/best solutions. In disruption response, a rapidly-cleared river reduces the chance of
secondary disaster and helps the maritime stakeholders resume transportation on the waterway as
soon as possible. Therefore, a smaller response time is preferred when we select a cargo
prioritization strategy. According to Figure 7, the greater total value loss and response time are
obtained when employing MD strategy as compared to CPTAP TS and GA strategies for all
medium size instances. The CPTAP TS heuristic again produces a lower total value loss than the
CPTAP GA-based heuristic in four out of the five medium instances and an equal value for the
one instance. Prioritization results from TS consumes less time than GA to transport all the
disrupted barge cargoes off the waterway in three out of five instances and equal time to the GA
in one instance. For large size instances, the TS results in the lowest total value loss and delivers
the quickest response time for all the five large size instances. Overall, the results in Figure 7
indicate that involving cargo, barge and terminal features to intelligently prioritize the barge
cargoes in CPTAP has a profound impact on the disruption response of inland waterway
transportation, which mitigates the negative impacts of the disruption and provides an improved
response towards waterway recovery, and the CPTAP TS method is again shown to perform
better than the CPTAP GA-based heuristic according to the required response time.

133
4E5
5E5
6E5
7E5
8E5
9E5
1E6
Value Loss (MD) Response Time (MD)
Value Loss (TS) Response Time (TS)
Value Loss (GA) Response Time (GA)
To
tal
Val
ue
Lo
ss (
$)
Medium Size
30
40
50
60
70
80
90
100
110
120
Instance 5Instance 4Instance 2 Instance 3
Res
pon
se T
ime
(ho
urs
)
Instance 1
0.0
2.0E5
4.0E5
6.0E5
8.0E5
1.0E6
1.2E6
1.4E6
1.6E6
1.8E6
Value Loss (MD) Response Time (MD)
Value Loss (TS) Response Time (TS)
Value Loss (GA) Response Time (GA)
Tota
l V
alu
e L
oss
($
)
Large Size
40
60
80
100
120
Instance 5Instance 4Instance 2 Instance 3
Res
po
nse
Tim
e (h
ou
rs)
Instance 1
Figure 7 Comparison of Multiple Strategies for Cargo Prioritization and Terminal
Allocation

134
8. Conclusions
This paper developed an TS heuristic for a novel problem – cargo prioritization and terminal
allocation problem (CPTAP), which prioritizes and reassigns cargo of a disrupted inland
waterway transportation system (Manuscript Authors, 20##). We implemented and tested
multiple TS variants on small, medium, and large size experimental instances and identified TS-
BS as producing the best-quality results in a fastest manner. The TS-BS heuristic outperforms
the previously recommended CPTAP GA approach, and our analysis indicates that CPTAP
solved by either heuristic approach significantly decreases total value loss and response time
compared to a naive prioritization strategy based simply on assigning disrupted barges to the
closest feasible terminal.
The contributions of this paper are twofold: 1) a robust TS heuristic that outperforms a
previously developed GA approach to find improved solutions for CPTAP within a satisfactory
amount of time; 2) the significance of applying CPTAP to disrupted inland waterway is
systematically validated. Both contributions are crucial steps that lead to our future research on
improving CPTAP model and solution methods. Planned future work includes: 1) application of
the CPTAP TS heuristic during a real world CPTAP decision scenario to assess its
implementation performance; 2) development of a heuristic that incorporates merits from both
population search (GA) and local search (TS); and 3) development of other potential solution
approaches to CPTAP such as column generation.
Acknowledgment
This material is based upon work supported by the U.S. Department of Homeland Security under
Grant Award Number ___. The views and conclusions contained in this document are those of

135
the authors and should not be interpreted as necessarily representing the official policies, either
expressed or implied, of the U.S. Department of Homeland Security.
Appendix 1
Sensitive Analysis of Adjustment Factor δ – Medium Size
δ Measure M1 M2 M3 M4 M5 M6 M7 M8 M9 M10
0.01 Min 468260 500262 502680 543066 417490 490974 471088 529108 525192 489976
Max 501994 540404 536826 564870 464320 522830 492974 588262 562880 1015100
Avg 478897 513601 513249 550386 430833 506982 478180 544279 539187 570917
0.05 Min 469292 498828 500042 535242 420566 492892 472560 529978 525638 486634
Max 499602 549956 610628 576392 448472 541750 512364 545672 563866 546172
Avg 475421 515212 532202 551445 430036 504842 485764 539817 539750 510955
0.1 Min 468566 499960 499902 539076 419826 489864 473718 531186 521474 492968
Max 501806 1034390 539228 568978 697284 539546 499744 581774 566688 626150
Avg 476438 564519 515414 550669 456380 505651 484981 547479 538989 523867
0.5 Min 467576 501084 500320 537338 420692 491610 471596 534374 522756 488680
Max 721930 542292 533818 553856 444786 528738 494876 551608 569246 596714
Avg 500057 516235 510592 543990 433158 510028 478182 545004 539802 506539
Sensitive Analysis of Adjustment Factor δ – Large Size
δ Measure L1 L2 L3 L4 L5 L6 L7 L8 L9 L10
0.01 Min 745988 790482 819916 809676 744606 781412 735530 824798 871038 734114
Max 821098 844952 923410 831460 795676 843334 1116330 913888 975758 820886
Avg 775654 808814 861995 819139 764411 814701 801249 865024 901020 766060
0.05 Min 750728 795806 807768 814862 746654 777466 755600 827902 867112 731990
Max 873062 873836 915014 860866 813458 831334 844802 901902 925860 821164
Avg 786841 817420 844974 835372 764812 799855 786603 854604 889624 760604
0.1 Min 759814 791476 823380 804048 747732 775898 738076 836572 872780 734944
Max 904902 830528 902392 854226 783476 851178 823522 903562 920554 786548
Avg 795840 806532 853423 826009 759188 804354 763340 859153 895221 751655
0.5 Min 747636 791158 832768 819180 742990 780546 749976 839644 873534 728932
Max 802270 843958 977614 1533170 798138 880738 769370 1036340 922444 821308
Avg 774637 814536 869909 929983 765973 816014 761511 897562 905384 758568
136
Appendix 2
College of Engineering
Department of Industrial Engineering
To: University of Arkansas Graduate School
From: Heather Nachtmann, Ph.D.
Professor of Industrial Engineering
(479)575-5857
Date: June 26, 2014
Subject: Multi-author Documentation
This memorandum is to confirm that Jingjing Tong is the first author of the following article and
completed at least 51% of the work for the article.
“A tabu search approach to the cargo prioritization and terminal allocation problem”

137
References
American Society of Civil Engineers (ASCE). (2009). Infrastructure fact sheet. Retrieved from: http://www.infrastructurereportcard.org/2009/sites/default/files/RC2009_inland_waterways.pdf Bolduc, M. C., Laporte, G., Renaud, J., & Boctor, F. F. (2010). A tabu search heuristic for the split delivery vehicle routing problem with production and demand calendars. European Journal of Operational Research, 202(1), 122-130. Brandão, J. (2009). A deterministic tabu search algorithm for the fleet size and mix vehicle routing problem. European Journal of Operational Research, 195(3), 716-728. Bräysy, O., & Gendreau, M. (2005). Vehicle routing problem with time windows, Part II: Metaheuristics. Transportation science, 39(1), 119-139. Ceschia, S., Di Gaspero, L., & Schaerf, A. (2011). Tabu search techniques for the heterogeneous vehicle routing problem with time windows and carrier-dependent costs. Journal of Scheduling, 14(6), 601-615. Cordeau, J. F., Gendreau, M., & Laporte, G. (1997). A tabu search heuristic for periodic and multi-depot vehicle routing problems. Networks, 30(2), 105-119. Cordeau, J. F., Laporte, G., & Mercier, A. (2001). A unified tabu search heuristic for vehicle routing problems with time windows. Journal of the Operational research society, 52(8), 928-936. Cordeau, J. F., Gendreau, M., Laporte, G., Potvin, J. Y., & Semet, F. (2002). A guide to vehicle routing heuristics. Journal of the Operational Research society, 53(5), 512-522. Cordeau, J. F., & Laporte, G. (2005). Tabu search heuristics for the vehicle routing problem (pp. 145-163). Springer US. Côté, J. F., & Potvin, J. Y. (2009). A tabu search heuristic for the vehicle routing problem with private fleet and common carrier. European Journal of Operational Research, 198(2), 464-469. Eksioglu, B., Vural, A. V., & Reisman, A. (2009). The vehicle routing problem: A taxonomic review. Computers & Industrial Engineering, 57(4), 1472-1483. Gendreau, M., Hertz, A., & Laporte, G. (1994). A tabu search heuristic for the vehicle routing problem. Management science, 40(10), 1276-1290. Gendreau, M., Iori, M., Laporte, G., & Martello, S. (2008). A Tabu search heuristic for the vehicle routing problem with two-dimensional loading constraints. Networks, 51(1), 4-18. Giallombardo, G., Moccia, L., Salani, M., & Vacca, I. (2010). Modeling and solving the tactical berth allocation problem. Transportation Research Part B: Methodological, 44(2), 232-245.

138
Imai, A., Nagaiwa, K. I., & Tat, C. W. (1997). Efficient planning of berth allocation for container terminals in Asia. Journal of Advanced Transportation, 31(1), 75-94. Imai, A., Nishimura, E., & Papadimitriou, S. (2001). The dynamic berth allocation problem for a container port. Transportation Research Part B: Methodological, 35(4), 401-417. Imai, A., Nishimura, E., & Papadimitriou, S. (2003). Berth allocation with service priority. Transportation Research Part B: Methodological, 37(5), 437-457. Laporte, G. (2009). Fifty years of vehicle routing. Transportation Science, 43(4), 408-416.
Magsam, J., & McGeeney, R. (2014). Haywire bridge stalls river, railroad traffic. Arkansas Democrat Gazette. Manuscript Authors. (20##). XXX Meisel, F., & Bierwirth, C. (2009). Heuristics for the integration of crane productivity in the berth allocation problem. Transportation Research Part E: Logistics and Transportation Review, 45(1), 196-209. Nguyen, P. K., Crainic, T. G., & Toulouse, M. (2013). A tabu search for time-dependent multi-zone multi-trip vehicle routing problem with time windows. European Journal of Operational
Research, 231(1), 43-56. Nishimura, E., Imai, A., & Papadimitriou, S. (2001). Berth allocation planning in the public berth system by genetic algorithms. European Journal of Operational Research, 131(2), 282-292. Rochat, Y., & Taillard, É. D. (1995). Probabilistic diversification and intensification in local search for vehicle routing. Journal of heuristics, 1(1), 147-167. Taillard, É. D., Gambardella, L. M., Gendreau, M., & Potvin, J. Y. (2001). Adaptive memory programming: A unified view of metaheuristics. European Journal of Operational Research, 135(1), 1-16. Tarantilis, C. D. (2005). Solving the vehicle routing problem with adaptive memory programming methodology. Computers & Operations Research, 32(9), 2309-2327. U.S. Army Corps of Engineers (USACE). (2012a). Inland Waterways and Export Opportunities. Retrieved from: http://www.lrd.usace.army.mil/Portals/73/docs/Navigation/PCXIN/Inland_Waterways_and_Export_Opportunities-FINAL_2013-01-03.pdf U.S. Army Corps of Engineers (USACE). (2012b). Commodity classification list. Navigation Data Center, US Army Corps of Engineers. Retrieved from: http://www.ndc.iwr.usace.army.mil/wcsc/webpub10/pdfs/commodity.pdf
139
U.S. Army Corps of Engineers (USACE). (2012c). Vessel Trips by Waterways. Retrieved from: http://www.navigationdatacenter.us/wcsc/webpub12/Part2_WWYs_Tripsbydraft_CY2012.HTM U.S. Army Corps of Engineers (USACE). (2013). The U.S. waterway system transportation facts
and information. Retrieved from: http://www.navigationdatacenter.us/factcard/factcard13.pdf U.S. Army Corps of Engineers (USACE). (2014). Lock Performance Monitoring System. Retrieved from http://corpslocks.usace.army.mil/ Wassan, N. A., Wassan, A. H., & Nagy, G. (2008). A reactive tabu search algorithm for the vehicle routing problem with simultaneous pickups and deliveries. Journal of combinatorial
optimization, 15(4), 368-386.

140
6. VALUE-FOCUSED ASSESSMENT OF CARGO VALUE DECREASING RATE
Jingjing Tong, M.S.
Heather Nachtmann, Ph.D.
Abstract
The transportation system is an essential component of any economy, and the disruption of cargo
transport can have substantial economic and societal impacts. These detrimental consequences
can be mitigated through quantitative assessment and prioritization of disrupted cargoes such that
the critical cargo is redirected intelligently. This paper presents a literature review of the value-
focused thinking (VFT) literature in transportation, logistics, and supply chain application areas
and a VFT approach to determine a value decreasing rate for disrupted cargoes in support of
efficient and effective transportation disruption response.
Key Words: Cargo Prioritization; Value-focused Thinking; Value Decreasing Rate; Disruption
Response; Transportation; Inland Waterways
1. Introduction
The freight transportation system is heavily utilized by the increasing economic activities
among/within countries as the result of product specialization and globalization (Chopra and
Meindl, 2007). Globally in 2008, more than $16 trillion cargoes are exported from the
manufacturing countries to the destination markets by maritime vessels, inland waterway barges,
airplanes, trucks, and trains (U.S. Department of Transportation (USDOT), 2010). As the leading
economy, the United States has the world’s largest transportation network including 25,000
141
miles of navigable waterways, 4 million miles of public roads, 140,000 miles of railways, and
considerable transportation infrastructure (USDOT, 2010). In 2012, the U.S. freight system
moved approximately 11.7 billion tons of cargo that as valued at $13.6 trillion (USDOT, 2013).
The majority of this cargo (86% of the total value and 96% of the total volume) was carried by a
single mode with highway dominating the other transportation modes with 74% of the value and
70% of the tonnage (USDOT, 2013). The freight transportation system is at risk of disruption
from natural disasters and manmade events. The high demand and frequency of cargo carried by
transportation system suggests the significant impacts that will result from disrupted freight
movement. The major 2007 bridge collapse in Minneapolis influenced approximately 140,000
daily vehicle trips and led to $400,000 daily cost to the commercial vehicles and road users for
rerouting (Zhu and Levinson, 2012). A series of events including gate failure and inspection
closed the Ohio River at Hannibal Locks and Dam for five days and resulted in a conservative
estimated cost $5.1 million (U.S. Army Corps of Engineers (USACE), 2006). To mitigate the
high cost of disruptive events, intelligent cargo prioritization techniques are needed to redirect
the disrupted cargo given that the value of these cargoes decreases in terms of economic value,
societal benefit, and customer satisfaction as time elapses during disruption response period. In
order to minimize the total value loss from the cargo disruption, there is a need for a
methodology to comprehensively assess the value decreasing rates of the disrupted cargoes in
support of efficient and effective disruption response planning by transportation stakeholders.
In this paper, we employ value-focused thinking (VFT) to develop a cargo value decreasing rate
(CVDR), the rate at which the cargo’s economic and societal value diminishes as time elapses.
VFT incorporates values into decision making because values are what decision makers are
concerned with and what should be the driving force in decision making (Keeney, 1992). VFT

142
can stimulate creativity in revealing hidden values (Shoviak, 2001). This is important for the
CVDR assessment because the CVDR is related to complex societal and economic issues, which
requires comprehensive assessment to identify all crucial values. The VFT methodology has
been successfully applied in a wide range of decision contexts (Braziel et al., 2007; Parnell et al.,
2013) and is well-suited to assessing a CVDR by evaluating and ranking all the involved cargo
types and translating the alternative VFT scores into numerical CVDRs.
Following a comprehensive literature review to describe existing relevant VFT analysis in
transportation, logistics, and supply chain, this paper demonstrates a systematic and step-by-step
VFT approach to generate CVDRs. An example based on barge cargoes transported on the
inland waterways is incorporated into the discussion to exemplify the developed method. The
major contribution of this work is to provide a rigorous method for CVDR assessment. The input
of the well-constructed CVDRs contributes to the better quality of the cargo prioritization
models. Moreover, if multiple stakeholders from different organizations with various interests
are involved into the CVDR assessment, the developed methodology can result in improved
communication and decision making as a group instead of individually prioritizing cargo based
strictly on their own experience and estimation. By detailing the values possessed in the decision
framework, the VFT methodology provides multiple decision makers with a basis to find the
common ground and to reach a consensus when assessing CVDRs.
2. Literature Review (Tong et al., 2013)
Our previous work has investigated the related literature to provide a sufficient knowledge base
in the VFT application area (Tong et al., 2013). Since the appearance of VFT by Ralph Keeney
in 1992, a large number of papers have discussed or applied this unique methodology in various

143
decision making scenarios. According to the recently published VFT survey (Parnell et al., 2013),
there are eighty-nine journal papers that implemented VFT in their analysis from 1992 to 2010.
The number of studies is even larger if VFT books and thesis/dissertations are included. In our
review, we selected the literature whose application context is closely related to our problem
domain – the VFT papers that study transportation, logistics, and supply chain (TLSC).
2.1 Literature Summary
The seven VFT papers within the TLSC field are reviewed, and a brief summary of each paper is
presented.
Supply Chain Risk Identification with Value-focused Process Engineering (Neiger et al.,
2009). This article proposes a novel supply chain risk identification methodology on the basis of
value-focused process engineering (VFPE), which integrates the principles from VFT and
extended-event-driven process chain (e-EPC). The contribution of VFT in this article is to
provide a unique perspective in which the supply chain is composed of multiple interconnected
value-adding processes and risk objectives (defined as “minimizing the chance of an adverse
event”) which are considered as the mean objectives that can fit into the VFT framework.
Together with e-EPC methodology, VFT aids the researchers to model the process-based risks
with a thorough consideration of processes, objectives, and risk sources. Figure 1 displays the
first three steps of the VFPE-based risk identification process, which illustrate how VFT
functions in the scheme and how it interacts with other components. In Step One, functional risk
objectives are identified by providing each supply chain activity with a generic risk objective,
while in Step Two, VFT is used to generate value risk objectives through decomposing the
higher-level process objective of minimizing process failure risk. Based on the delivery from the
first two steps, a completely decomposed risk objectives structure is developed in Step Three.

144
Figure 1 Step 1-3 of VFPE-based Supply Chain Risk Identification (Neiger et al., 2009)
Value-focused Supply Chain Risk Analysis-Book Chapter (Olson & Wu, 2010). This
research investigates the plant location decision for the supply chain participant with
consideration of supply chain risk. VFT is mainly used to establish the value hierarchy for the
supply chain and to create the alternatives. The SMART technique is applied to conduct the
remaining multi-attribute decision analysis. The authors strengthen the importance of values in
structuring the value hierarchy – VFT aims to develop a hierarchy that gains a wide spectrum of
values. Beginning with searching for the overall values, the authors develop a three-level value
hierarchy for the supply chain risk and point out that every element in the hierarchy is able to be
used to locate the risks for any specific supply chain situation. It is also suggested that

145
alternatives should be generated in the hierarchical development process. In terms of the number
of alternatives that should be created, two to seven alternatives are recommended for multiple
attribute decision analysis.
A Value Focused Thinking Tutorial for Supply Chain Application (Jordan, 2012). This
research discusses the VFT application in supply chain decision making. According to the author,
various multi-criteria approaches are widely used to model supply chain and logistics problems.
However VFT is rarely considered in this field; thus the author presents a detailed VFT tutorial
and conducts VFT analysis on a common logistics problem – the supplier selection. The bottom-
up method is used to construct the supplier selection hierarchy, followed by a complete analysis
directed by the VFT methodology. Important strengths of VFT for supply chain problems are
that a VFT approach can reveal the true value that an alternative has for the decision and alert the
decision maker to derive better alternatives if the existing alternatives do not have a satisfying
value to the decision. It is a powerful feature for the supply chain problem which regularly has a
large number of alternatives. The new alternatives can be quickly valued and compared with the
others.
Transportation Readiness Assessment and Valuation for Emergency Logistics (Nachtmann
& Pohl, 2013). This article examines the readiness level of transportation considered by local
and state operation planners in their emergency preparedness plans. The transportation readiness
assessment and valuation for emergency logistics (TRAVEL) scorecard is developed to help the
operation planners identify the deficient areas in their emergency operations plans (EOP) and
improve them through evaluating the EOP quality with regards to transportation readiness. VFT
framework is applied in developing the TRAVEL tool and spreadsheet is used to provide
software platform for TRAVEL. Figure 2 shows the eight-step VFT processes that create

146
TRAVEL. The top-down method is employed to develop the value hierarchy in Step Two. Under
the fundamental problem of assessing transportation readiness of EOP, four supporting
objectives are placed at the second level, each of which further splits into several measurable
attributes. Three county-level EOPs are assessed by the authors to validate the TRAVEL
scorecard. The analysis results show that TRVEL can quickly identify the shortcomings of the
EOP with respect to transportation and enables the operation planners to revise the EOP
promptly.
Figure 2 TRAVEL Development Process (Nachtmann & Pohl, 2013)
Value Focused Thinking Analysis of the Pacific Theater’s Future Air Mobility En Route
System (Axtell, 2011). This study provides the decision makers in the Air Mobility Command
(AMC) with a validated decision tool to evaluate the locations in the future en route system in
the Pacific Theater. VFT methodology is used to analyze whether the proposed en route
locations have appropriate level of access in the Pacific Theater. A six-level value hierarchy with
twenty-seven attributes termed “En Route Base Selection Tactical Sub-model” developed by
previous researchers has been utilized as part of the overall value hierarchy (see Figure 3) in this
study. As can be seen in Figure 3, the tactical sub-model is included as one of the three
supporting objectives under the fundamental objective “Operational Value Score.” The case
study includes twenty current and eight future en route locations and evaluates each location
based on the operational value hierarchy. The author points out that the proposed VFT decision
analysis tool advocates replacing the existing en route linear system with a more integrated one.

147
Figure 3 Operational Value Hierarchy (Axtell, 2011)
Decision Analysis with Value-focused Thinking as a Methodology in Structuring the Civil
Engineering Operations Flight (Katzer, 2002). This study investigates how to help the
operations flight commander select the best organizational structure of the civil engineer
operations flight. The author believes that VFT methodology is one of the most ideally suited
approaches that can answer the two-fold questions regarding the selection decision – what values
are important to the decision and how the ranking of the alternatives changes with various
situations. Figure 4 displays operations flight value hierarchy. As described by the author, the
first-level fundamental objective is identified, followed by the brainstorming sessions of asking
“what does that mean” which further identifies four supporting values that are placed at the
second level. This question is asked repeatedly until the lowest level values are measurable. The
final alternative ranking reveals the extent to which the alternative meets the values from the
operations flight commander’s perspective in order to reach the fundamental objective.
Figure 4 Operations Flight Value Hierarchy (Katzer, 2002)
148
Technology Selection for the Air Force Research Laboratory Air Vehicles Directorate: An
Analysis Using Value Focused Thinking (Winthrop, 1999). This paper focuses on exploring
the technology direction that is most supportive to the U.S. Air Force values, which should be
given more consideration by the air vehicles directorate (VA) when they have sufficient funds.
Both VFT and optimization approaches are used in this analysis. Research and development
(R&D) literature are first reviewed to help identify the fundamental objective and supporting
objectives in the value hierarchy. In order to assure the value hierarchy represents the core values
of VA, a number of VA experts and leaders are involved in developing and confirming the value
definitions and the final hierarchy. Among over one hundred identified VA R&D programs, a
couple of them are selected in the case study. An additive value model is employed to evaluate
the overall score for each alternative, and sensitivity analysis is conducted at last.
2.2 Literature Assessment
To gain further insights from these VFT studies within TLSC domain, we continue examining
the select literature in the form of answering research questions with respect to these studies. We
use the research questions developed in a recent survey paper (Parnell et al., 2013) and create a
matrix to present the answers to these questions based on the contents of each study. Table 1
displays the literature assessment matrix.

149
Table 1 Literature Assessment Matrix
Research
Questions
Neiger et
al., 2009
Olson &
Wu, 2010
Jordan,
2012
Nachtmann
& Pohl,
2013
Axtell,
2011
Katzer,
2002
Winthrop,
1999
Publication Journal Book
Chapter Dissertation Journal Thesis Thesis Thesis
Authors Australia U.S. U.S. U.S. U.S. U.S. U.S.
Year of
Publication 2009 2010 2012 2012 2011 2002 1999
Type of
Study Theory
Theory/
Case study
Theory/
Case study
Theory/
Case study
Theory/
Case study
Theory/
Case study
Theory/
Case study
Problem
Domain
Supply
chain
Supply
chain
Supply
chain Transport Transport Transport Transport
Clients Corporate
leaders
Corporate
leaders
Corporate
leaders
Government
policy
makers
Military
leaders
Military
leaders
Military
leaders
Alternatives
by VFT N/A
Previously
known
Previously
known
Previously
known
Previously
known
Previously
known
Previously
known
Value/Utility
Model N/A
Value
model
Value
model
Value
model
Value
model
Value
model
Value
model
Number of
Measures N/A
12 (Case
study)
8 (Case
study)
8
(Model)
29
(Model)
10
(Model)
31
(Model)
Other
OR/MS
Technique
e-EPC SMART None None GERBIL None LP
As is shown in Table 1, ten research questions are selected (with slight revision from Parnell et
al., 2013) as the criteria to investigate and compare the literature. Based on the seven TLSC VFT
studies, answers to the research questions are summarized as follows:
• Publication. Among the seven studies, we found that one is published as a book chapter,
two as journal articles, and four as a thesis or dissertation.
• Authors. All authors are from the U.S. except for one group of authors who are from
Australia.
• Year of Publication. Five out of seven studies are published within the past five years.
The other two studies are published in 2002 and 1999 respectively.
• Type of study. One research focuses mainly on building a theoretical model while the
others include both a theoretical methodology and a case study.
150
• Problem domain. Within TLSC, four studies are related to transportation, and three focus
on the supply chain.
• Clients. Corporate and military leaders are the two largest groups for which the select
VFT studies serve (each is involved in three papers). Only one study is conducted for
government policy makers.
• Alternatives by VFT. None of them actually use a VFT concept to design or improve the
alternatives. Alternatives are generated based on collected data/information.
• Value/Utility model. Not surprisingly, the value model dominates the utility model among
the literature. Six studies employ the additive value model.
• Number of measures. The number of measures in the value model range from eight to
thirty-one. Four papers determine the measures when the VFT framework is constructed.
Two publications identify the measures only in the case study.
• Other operations research or management science (OR/MS) technique. Four studies
integrate VFT and other OR/MS techniques in developing the methodology framework.
The techniques referred in these studies include extended-event-driven process chain (e-
EPC), simple multi-attribute rating theory (SMART), global en route basing
infrastructure location model (GERBIL), and linear programming (LP).
3. VFT Methodology for CVDR Assessment
In VFT, the values and preferences of the decision makers are structured into a holistic
framework to guide the decision process of ranking alternatives (Chambal, 2003). Figure 5
presents a widely-used VFT framework consisting of ten steps, which is developed by Shoviak
(2001) and Braziel et al. (2007) based on the seminal works of Keeney (1992) and Kirkwood

151
(1997). The first three steps (Steps 1-3) define the framework input including the decision
maker’s goal, values, and evaluation measures. Steps 4 to 7 constitute the decision model that
determines the framework output. The last three steps (Steps 8-10) function as the result analysis
process. In addition to describing each of the ten steps in detail, an example based on developing
the CVDRs of inland waterway barge cargoes is provided to demonstrate the CVDR assessment
application.
Figure 5 VFT Framework (Braziel et al., 2007)
The cargo prioritization problem for inland waterway disruptions is graphically shown in Figure
6 (Tong et al., 2013). One of the lock and dam (L/D) systems located along the river section is

152
disrupted and no longer functioning, which causes the inland waterway to close thus halting
traffic traveling up and down the river at the point of disruption. Other disruptions could include
non-navigable water level due to drought or flood, vessel allision or collision, and other
infrastructure disruptions. The barge tows (typically consisting of nine to fifteen barges each)
that are traveling in the direction away from the disruption are unaffected and able to continue
transport to their destination. Barge tows (depicted in bold) that are traveling towards and
beyond the disrupted L/D are affected and no longer able to travel to their destination via the
disrupted waterway. The cargo on the disrupted barges is the focus of the CVDR assessment
presented here.
Figure 6 Graphical Description of Cargo Prioritization Problem (Tong et al., 2013)
0
100
L/D
L/D
Bridge
L/D
L/D
Bridge
L/D or Bridge
Legend
Terminal
Hazardous cargo
Non-hazardous cargo
Riv
er M
ile
Disrupted L/D
Barge
tow
Barge tow direction

153
Step 1 Problem Identification
As discussed in the Section 1, the fundamental objective of this paper is to assess the value
decreasing rate of disrupted cargo. By establishing the qualitative value model to determine the
CVDRs of different cargo types, we can translate their relative importance into the numerical
values on the basis of a predefined mapping approach.
Step 2 Create Value Hierarchy
The value hierarchy serves as the foundational and essential stage in VFT framework that will
guide the analysis that determines the priorities of the CVDRs. Keeney (1992) points out that
substantial time, money, and effort is needed to evaluate the alternatives based on a value
hierarchy that includes all the important values to the decision maker. Therefore, decision
makers must take care to understand the values and spend sufficient time to structure the values
in the value model. Parnell (2008) recommends several data sources to derive values regarding
the decision scenario including existing documents (gold standard), interviews with senior
decision makers and stakeholders (platinum standard), and data from stakeholders’
representatives (silver standard). We use a combination of data sources that include both gold
standard and platinum standard sources. Two documents published by the Department of
Homeland Security (DHS) provide commodity import/export priorities in order to support
incident management activities (DHS, 2006; DHS, 2007). In addition, other values are identified
through interviews with transportation stakeholders including the USACE and U.S. Coast Guard.
The qualitative value modeling approach developed by Parnell (2008) is implemented to
establish the value hierarchy. An affinity diagram is used to group the values into a collectively
exhaustive and mutually exclusive hierarchical structure shown in Figure 7. The fundamental
objective is placed at the top level of the value hierarchy. According to the definition of CVDR,

154
the rate at which cargo’s economic and societal value diminishes as time elapses, two supporting
objectives are identified as the second-tier values (Societal Need and Economic Value) that have
positive relationship with the numerical values of CVDRs. Societal Need is further divided into
three elements due to its wide coverage of societal aspects (National Priorities, Local Priorities,
and Risk Minimization). National Priorities is broken down further into four societal needs at the
national level, which are Emergency Need, Response Need, Community Need, and Military
Need. To distinguish between the risk to harm people and the environment, Risk Minimization is
divided into Public Health and Environment Security. Economic Value is comprised of Market
Value and Perishability which influence cargo’s economic worth. Altogether there are nine
values evaluated at the lowest-tier of the hierarchy.
Figure 7 Value Hierarchy for CVDR Assessment
Step 3 Develop Evaluation Measures
The values in the value hierarchy do not directly connect to the alternatives. Evaluation measures
for all nine lowest-level values are developed to assess the alternatives with respect to their
degree of attainment on each value. Two approaches to construct the evaluation measure are
typically found in literature – natural scale and constructed scale (Sperling, 1999). A natural
scale uses a natural and quantitative attribute to evaluate the value directly, while a constructed

155
scale establishes the measure based on information/components that is/are closely related to the
value that is difficult to measure quantitatively. Eight out of nine values use a constructed scale
as their evaluation measure due to their qualitative characteristics. The natural scale is applied to
Market Value because of the availability of the quantitative data to directly assess the
alternatives on the value. We define the evaluation measure for each of the nine lowest-level
values as follows:
• Emergency Need Value
Emergency Need is defined as the value associated with the saving and continuation of life
during incident management (DHS, 2006; DHS, 2007). We construct the evaluation measure
for this value based on the disaster needs of multiple types of hazards published by the
International Federation of Red Cross and Red Crescent Societies (2000) and establish a
constructed scale from 1 to 5 as shown in Table 2. The decision maker assigns an appropriate
score to each alternative cargo type according to the disruption the cargo is associated with
and the count of emergency needs the cargo addresses.

156
Table 2 Evaluation Measure for Emergency Need Value
Essential Components
Hazard Environment
Food Shelter Search & Rescue
Equipment
Medical Care
Potable Water
Water Purification
Earthquakes × × × × ×
Mud and debris flows
× × ×
Landslides × ×
Volcanic eruptions
× × × × ×
Tsunamis × × × × ×
Droughts ×
Floods × × × × × ×
Tropical cyclones
× × × × ×
Chemical & industrial accidents
×
×
×
Score Description
5 Cargo addresses all emergency needs in a hazard environment
4 Cargo addresses most of the emergency needs in a hazard environment
3 Cargo addresses some of the emergency needs in a hazard environment
2 Cargo addresses few of the emergency needs in a hazard environment
1 Cargo addresses none of the emergency needs in a hazard environment
• Response Need Value
According to DHS (2006; 2007), equipment that is vital to disruption response operations
possess a high Response Need value. There are various guidelines and standards regarding
the equipment that is necessary when responding to different disaster scenarios (Fatah et al.,
2002; Lawson and Vettori, 2005). The Federal Emergency Management Agency (FEMA)

157
released an online catalogue of national resources, the Resource Typing Library Tool
(RTLT), which contains definitions of the equipment used prior to, during, and after an
incident (FEMA, 2014). We summarize the RTLT equipment to construct the evaluation
measure for the Response Need value in Table 3. The constructed scale is 1 or 2 with 2
assigned to cargo that is considered as equipment that supports incident response according
to the FEMA RTLT system and 1 otherwise.
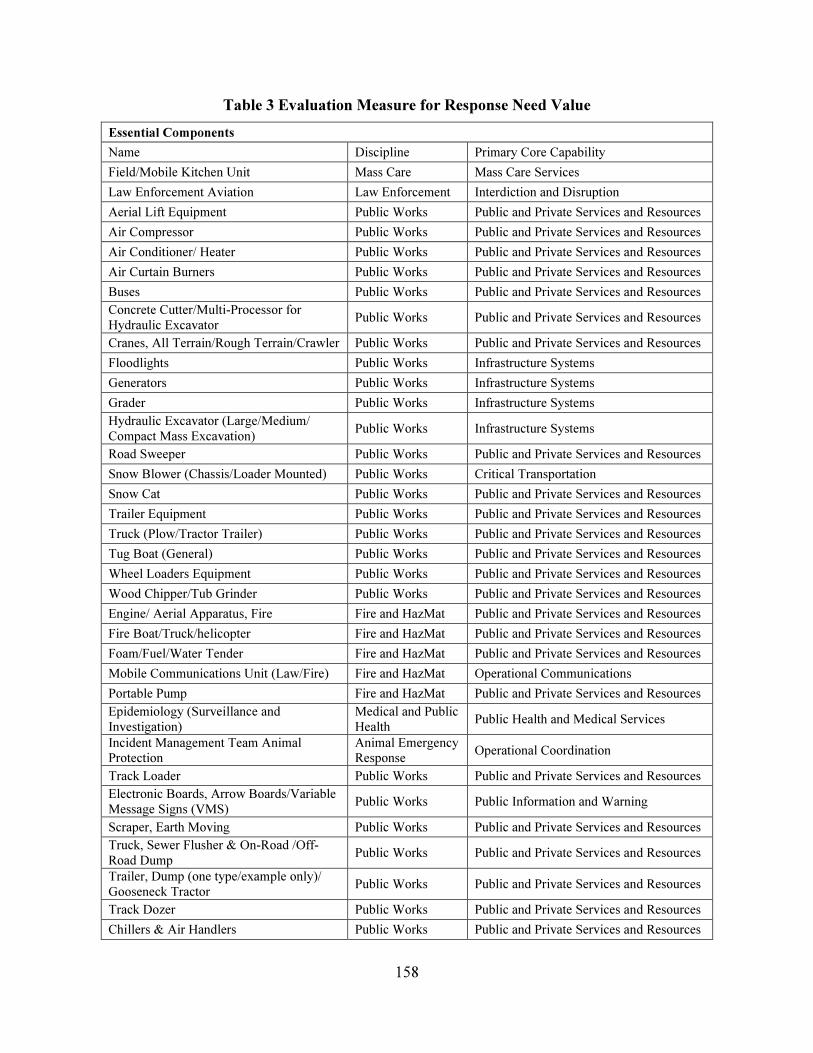
158
Table 3 Evaluation Measure for Response Need Value
Essential Components
Name Discipline Primary Core Capability
Field/Mobile Kitchen Unit Mass Care Mass Care Services
Law Enforcement Aviation Law Enforcement Interdiction and Disruption
Aerial Lift Equipment Public Works Public and Private Services and Resources
Air Compressor Public Works Public and Private Services and Resources
Air Conditioner/ Heater Public Works Public and Private Services and Resources
Air Curtain Burners Public Works Public and Private Services and Resources
Buses Public Works Public and Private Services and Resources
Concrete Cutter/Multi-Processor for
Hydraulic Excavator Public Works Public and Private Services and Resources
Cranes, All Terrain/Rough Terrain/Crawler Public Works Public and Private Services and Resources
Floodlights Public Works Infrastructure Systems
Generators Public Works Infrastructure Systems
Grader Public Works Infrastructure Systems
Hydraulic Excavator (Large/Medium/
Compact Mass Excavation) Public Works Infrastructure Systems
Road Sweeper Public Works Public and Private Services and Resources
Snow Blower (Chassis/Loader Mounted) Public Works Critical Transportation
Snow Cat Public Works Public and Private Services and Resources
Trailer Equipment Public Works Public and Private Services and Resources
Truck (Plow/Tractor Trailer) Public Works Public and Private Services and Resources
Tug Boat (General) Public Works Public and Private Services and Resources
Wheel Loaders Equipment Public Works Public and Private Services and Resources
Wood Chipper/Tub Grinder Public Works Public and Private Services and Resources
Engine/ Aerial Apparatus, Fire Fire and HazMat Public and Private Services and Resources
Fire Boat/Truck/helicopter Fire and HazMat Public and Private Services and Resources
Foam/Fuel/Water Tender Fire and HazMat Public and Private Services and Resources
Mobile Communications Unit (Law/Fire) Fire and HazMat Operational Communications
Portable Pump Fire and HazMat Public and Private Services and Resources
Epidemiology (Surveillance and
Investigation)
Medical and Public
Health Public Health and Medical Services
Incident Management Team Animal
Protection
Animal Emergency
Response Operational Coordination
Track Loader Public Works Public and Private Services and Resources
Electronic Boards, Arrow Boards/Variable
Message Signs (VMS) Public Works Public Information and Warning
Scraper, Earth Moving Public Works Public and Private Services and Resources
Truck, Sewer Flusher & On-Road /Off-
Road Dump Public Works Public and Private Services and Resources
Trailer, Dump (one type/example only)/
Gooseneck Tractor Public Works Public and Private Services and Resources
Track Dozer Public Works Public and Private Services and Resources
Chillers & Air Handlers Public Works Public and Private Services and Resources

159
Score Description
2 FEMA considers cargo to be equipment supporting incident response
1 FEMA does not consider cargo to be equipment supporting incident response
• Community Need Value
The Community Need value relates to the value of addressing the cargo shortage in a
community after the disaster occurs (DHS, 2006; DHS, 2007). Different from the Emergency
Need value concerned with immediate recovery, the Community Need value focuses on
long-term restoration of individuals and community activities that are impacted by a disaster.
The evaluation measure is thus constructed to consider the major components of the
Community Need value (Lindell, 2013; FEMA, 2011) as shown in Table 4. We use the scale
1 to 5 to assess the cargo alternatives.
Table 4 Evaluation Measure for Community Need Value
Essential Components
• Housing Recovery-Long-term housing including housing that recognizes the need for accessibility and affordability
• Psychological recovery-Long-term mental and behavioral health concerns for children and adults in relation to traumatic events induced or exacerbated by the disaster. Example cargoes are toys and clean clothes.
• Business recovery-Industry Continuity. Example cargoes are crude oil, heating oil, and chemicals.
• Rural/Urban recovery-Different commodity needs due to the community type
Score Description
5 Cargo addresses all four community need essential components
4 Cargo addresses three community need essential components
3 Cargo addresses two community need essential components
2 Cargo addresses one community need essential component
1 Cargo addresses none of the community need essential components

160
• Military Need Value
The Military Need value (DHS, 2006; DHS, 2007) highlights the cargo’s value in supporting
national security concerns. Its evaluation measure is constructed on the basis of the Uniform
Material Movement and Issue Priority System (UMMIPS) prescribed by Department of
Defense (DOD) in 2003 that determines the relative importance of the material movements in
military sector (Grandjean and Newbury, 2001; USAF, 2012). Two designators – Urgency of
Need Designator (UND) and Force Activity Designator (FAD) – constitute the UMMIPS.
Identified by letters A, B, and C, UND is the designator assigned to the cargo based on its
urgency level for a military mission. Using five Roman numbers, FAD is the designator
assigned to the mission based on its importance to DOD objectives. The UMMIPS
framework is established using both UND and FAD to create fifteen priority levels. We first
identify a cargo alternative with a proper requisition priority designator according to
UMMIPS and then use the constructed scale from 1 to 4 to score it as shown in Table 5.
Table 5 Evaluation Measure for Military Need Value
Essential Component
Force Activity Designator
Urgency of Need Designator
A: Cannot Perform Mission
B: Mission Capability Impaired
C: Requirements and Stock
Replenishment
Requisition Priority Designator
I: In Combat 01 04 11
II: Positioned for Combat 02 05 12
III: Positioned to Deploy 03 06 13
IV: Active Reserve 07 09 14
V: All other 08 10 15

161
Score Description
4 Cargo falls into Military Requisition Priority Designators 01-05
3 Cargo falls into Military Requisition Priority Designators 06-10
2 Cargo falls into Military Requisition Priority Designators 11-15
1 Cargo is not required by a military mission
• Local Priorities Value
We summarized the Local Priorities value listed in the DHS documents (2006 & 2007) as the
essential components to construct the evaluation measure in Table 6. A constructed scale
from 1 to 4 is used to score the alternatives.
Table 6 Evaluation Measure for Local Priorities Value
Essential Components
• Cargo that supports heating or cooling demand
• Cargo that relates to power generation
• Cargo that assures the assembly line continuity
Score Description
4 Cargo exhibits all three local priorities
3 Cargo exhibits two of the local priorities
2 Cargo exhibits one of the local priorities
1 Cargo exhibits none of the local priorities
• Public Health Value
Since risk of human casualty is a straightforward means of assessing value to Public Health,
we use a scale of 1 to 3 to construct an evaluation measure that addresses human casualty as
shown in Table 7. Individuals that may be injured from the disrupted cargo include staff
related to freight movement (e.g. crew members, port workers, and truck/train drivers),

162
passengers if affected vehicles carry passengers and cargo), and people in the vicinity of
incident site.
Table 7 Evaluation Measure for Public Health Value
Score Description
3 Cargo exhibits high potential to result in human casualty
2 Cargo exhibits low potential to result in human casualty
1 Cargo exhibits no potential to result in human casualty
• Environmental Security Value
The Environment Security value considers the risks to the environment after the
transportation disruption occurs. Prioritizing cargo that has potential to harm the environment
can mitigate environmental damage. Its evaluation measure is developed to assess
environmental risk (Mullai, 2006), and a scale from 1 to 5 is constructed to determine the
score of the cargo alternatives as shown in Table 8.
Table 8 Evaluation Measure for Environment Security Value
Essential Components
• Loss of wildlife
• Habitat degradation
• Geological and archaeological resources damages
• Damages to tourism and recreation
Score Description
5 Cargo has the potential to damage all four environmental security components
4 Cargo has the potential to damage three environmental security components
3 Cargo has the potential to damage two environmental security components
2 Cargo has the potential to damage one environmental security component
1 Cargo has no potential to damage any environmental security component

163
• Market Value
Average market price, as a natural evaluation measure, measures the Market Value of each
alternative. The decision makers are required to collect the relevant market price data for
each alternative.
• Perishability Value
The measure of the Perishability value is constructed to assess if the cargo is perishable or
not as shown in Table 9. The value of perishable cargo deteriorates with the changes in
temperature, humidity or other environmental condition (Kantola and Karwowski, 2012).
Typical perishable cargo includes fruit and vegetables, seafood and fish, fresh/frozen meat,
bakery, and plants. A constructed scale of 1 or 2 is established to score each alternative with
a 2 if the cargo is perishable and 1 otherwise.
Table 9 Evaluation Measure for Perishability Value
Step 4 Create Value Function
The evaluation measures are developed with various scales and units. In order to derive an
aggregate score for each cargo alternative, a single dimension value function (SDVF) is created
to unify the evaluation measures. There are multiple types of SDVF such as discrete, linear, or
monotonically increasing/decreasing exponential value functions (Braziel et al., 2007). We
employ the discrete SDVFs to translate the different scales and units into a normalized scale
from 0 to 1 with each measure’s highest raw score being 1 and its lowest raw score being 0. The
Score Description
2 Cargo exhibits certain level of perishable feature
1 Cargo exhibits no perishable feature

164
intermediate value units are selected by the research team according to the natural behavior of
the evaluation measure. Figure 8 contains recommended SDVFs for the eight constructed
evaluation measures, which can be adjusted as needed by the decision maker. For the Emergency
Need measure, addressing only one emergency need does not significantly contribute to the
disaster management operation. Thus its SDVF is set to be flat at first and then becomes steeper.
The measures for Response Need, Community Need, Local Priorities, and Perishability use a
linear SDVF because there is a steady linear relationship between the raw score of the evaluation
measure and the value unit in the value function. A large jump of value at the initial stage of the
SDVF for the Military Need measure indicates the increase in value if the cargo is involved into
a military mission. The value increment drops once the cargo is within the range of measure
scores associated with a certain level of contribution to its military mission. The research team
assigned minimal tolerance to the risk of harm to humans and the environment. Therefore, the
SDVFs for Public Health and Environment Security measures are initially steep.

165
1 2 3 4 50.0
0.2
0.4
0.6
0.8
1.0Value
Measure Score
Value
SDVF for Emergency Need Measure
1 20.0
0.2
0.4
0.6
0.8
1.0
Value
Measure Score
Value
SDVF for Response Need Measure
1 2 3 4 50.0
0.2
0.4
0.6
0.8
1.0
Value
Measure Score
Value
SDVF for Community Need Measure
1 2 3 40.0
0.2
0.4
0.6
0.8
1.0
Value
Measure Score
Value
SDVF for Military Need Measure
1 2 3 40.0
0.2
0.4
0.6
0.8
1.0
Value
Measure Score
Value
SDVF for Local Priorities Measure
1 2 30.0
0.2
0.4
0.6
0.8
1.0
Value
Measure Score
Value
SDVF for Public Health Measure
1 2 3 4 50.0
0.2
0.4
0.6
0.8
1.0
Value
Measure Score
Value
SDVF for Environment Security Measure
1 20.0
0.2
0.4
0.6
0.8
1.0
Value
Measure Score
Value
SDVF for Perishability Measure
Figure 8
SDVFs for
Constructed
Evaluation
Measures

166
Figure 9 shows the SDVF for Market Value, which is a step chart that represents the relationship
between market price and the value unit.
$0 $100 $200 $300 $4000.0
0.2
0.4
0.6
0.8
1.0
Value
Measure Score
Value
SDVF for Market Value Measure
Figure 9 SDVF for Natural Evaluation Measure
Step 5 Weight Value Hierarchy
The values may not be equally important to the decision maker, and therefore weights are
assigned to distinguish between any differences in importance. Local weights are first assigned
to each tier within a particular branch of the value hierarchy, and global weights are calculated
by multiplying the local weight of each value by the local weight(s) of the value(s) that is/are
above it successively in the hierarchy (Mills et al., 2009). Various weighting methods are found
in the literature including direct weighting, swing weighting, relative weighting, and “100 marble”
method (Sperling, 1999; Pruitt, 2003; Nachtmann and Pohl, 2013). The decision makers can
select the weighting method they are most comfortable with. The final weights may require
extensive discussion and recalculation if multiple decision makers are involved. We utilize the
“100 marble” method to assign local weights in the example presented here and then calculate
the global weights for each lowest-tier value as shown in Figure 10.

167
Figure 10 Local and Global Weights for Inland Waterway Example
Step 6 Alternative Generation
One notable advantage of VFT is that the values guide the creation of better alternatives (Keeney,
1996). However, in our CVDR assessment, the cargo alternatives are pre-determined as the cargo
types that are being transported on the disrupted transportation system during the decision period.
In our example, we have six two-digit commodity types (USACE, 2014) as the cargo alternatives
shown in Table 10, which provide a general coverage of all the cargo types that are transported
on the inland waterway system. In general, CVDR users determine the cargo alternatives based
on historical data or current information regarding the cargo types that travel along the disrupted
transportation segment.

168
Table 10 Example Cargo Alternatives (USACE, 2014)
Step 7 Alternative Scoring
Once the evaluation measures and cargo alternatives are determined, the alternatives are scored
with regards to each measure. Table 10 includes the market price data for each cargo type found
in our example from International Monetary Fund (IMF, 2014) and U.S. Energy Information
Administration (USEIA, 2014) to measure the Market Value. In order to assess the cargo
alternatives on the constructed evaluation measures, the research team conducted each scoring
process under careful assessment and consideration regarding the level at which each alternative
addresses components of constructed measures. Table 11 presents the scores given to the inland
waterway barge cargo alternatives on the eight constructed measures in our example.
Two-digit Code Cargo Type Market Price
10 Coal, Lignite and Coal Coke $36.29/ton
20 Petroleum and Petroleum Products $403.39/ton
30 Chemicals and Related Product $399.88/ton
40 Crude Materials, Inedible, Except Fuels $134.61/ton
50 Primary Manufactured Goods $396.45/ton
60 Food and Farm Products $164.52/ton

169
Table 11 Example Alternative Constructed Measures Scoring
Cargo
Type
Emergency
Need
Response
Need
Community
Need
Military
Need
Local
Priorities
Public
Health
Environment
Security Perishability
Coal 2 1 3 1 3 2 3 1
Petroleum 2 1 3 4 4 3 5 1
Chemicals 3 1 3 3 2 3 5 1
Crude
Materials 1 1 4 1 2 2 3 1
Primary
Mfd.
Goods
4 2 3 2 2 2 3 1
Food and
Farm
Products
3 1 2 4 1 1 3 2
Step 8 Deterministic Analysis
The immediate result we obtain in Step 8 is the aggregate score of each cargo alternative and
subsequently their overall ranking from the additive value function in Equation 1 (Dillon-Merrill,
2008):
���� = ∑ ����(��)�� � , where ∑ �� = 1�
� � (1)
where �� denotes the global weights developed in Step 5 for each value I and ������ denotes the
SDVF with measure score �� assigned in Step 7. Once the aggregate score of each cargo
alternative is estimated and the overall ranking is summarized, decision makers can derive the
CVDRs using a mapping system to convert the alternative overall score into the CVDR. The
decision makers first determine the estimated high and low CVDRs based on their expertise
regarding the features of cargoes transported on their applicable transportation system. As a rate
representing how much the cargo’s economic and societal value diminishes as time elapses,
decision makers must ensure that the CVDR takes time and volume into consideration and the
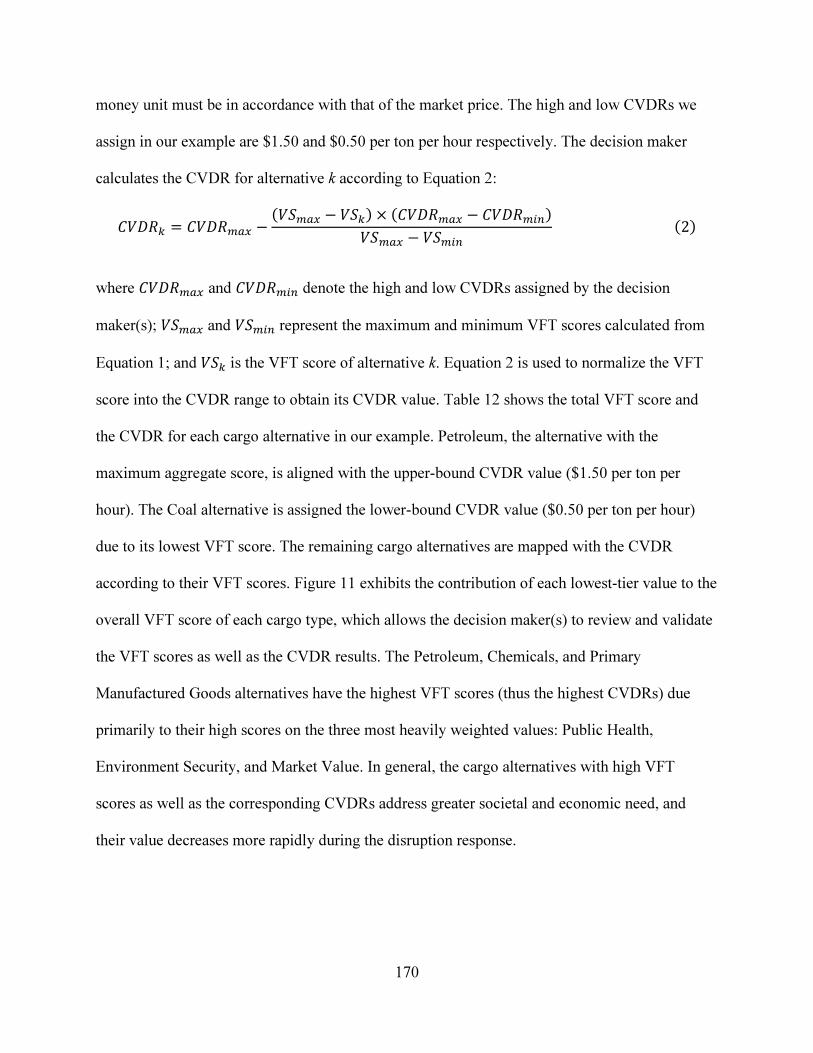
170
money unit must be in accordance with that of the market price. The high and low CVDRs we
assign in our example are $1.50 and $0.50 per ton per hour respectively. The decision maker
calculates the CVDR for alternative k according to Equation 2:
����� = ������� −������ − ���� × �������� − ��������
����� − ������2�
where ������� and ������� denote the high and low CVDRs assigned by the decision
maker(s); ����� and ����� represent the maximum and minimum VFT scores calculated from
Equation 1; and ��� is the VFT score of alternative k. Equation 2 is used to normalize the VFT
score into the CVDR range to obtain its CVDR value. Table 12 shows the total VFT score and
the CVDR for each cargo alternative in our example. Petroleum, the alternative with the
maximum aggregate score, is aligned with the upper-bound CVDR value ($1.50 per ton per
hour). The Coal alternative is assigned the lower-bound CVDR value ($0.50 per ton per hour)
due to its lowest VFT score. The remaining cargo alternatives are mapped with the CVDR
according to their VFT scores. Figure 11 exhibits the contribution of each lowest-tier value to the
overall VFT score of each cargo type, which allows the decision maker(s) to review and validate
the VFT scores as well as the CVDR results. The Petroleum, Chemicals, and Primary
Manufactured Goods alternatives have the highest VFT scores (thus the highest CVDRs) due
primarily to their high scores on the three most heavily weighted values: Public Health,
Environment Security, and Market Value. In general, the cargo alternatives with high VFT
scores as well as the corresponding CVDRs address greater societal and economic need, and
their value decreases more rapidly during the disruption response.

171
Table 12 Inland Waterway Disruption Example CVDR Results
Alternatives
VFT Score CVDR
($ per ton per hour)
Two-digit Code
Cargo Commodity Type
10 Coal, Lignite and Coal Coke 0.294 0.50
20 Petroleum and Petroleum Products 0.663 1.50
30 Chemicals and Related Product 0.636 1.43
40 Crude Materials, Inedible, Except Fuels 0.313 0.55
50 Primary Manufactured Goods 0.575 1.26
60 Food and Farm Products 0.450 0.92
Figure 11 Inland Waterway Disruption Example Results by Value
Step 9 Sensitivity Analysis
A sensitivity analysis is conducted to examine the influence of weights of the second-tier values
on the alternative VFT scores. Figure 12 displays the sensitivity analysis results when the
proportion of the second-tier values is varied from 0%/100% to 100%/0% (the weight proportion
is represented by “weight of Societal Need/weight of Economic Value”). The base weight
0 0.1 0.2 0.3 0.4 0.5 0.6 0.7
10
40
60
50
30
20
VFT Score
Carg
o T
ype
Emergency Need Response Need
Community Need Military Need
Local Priorities Public Health
Environment Security Market Value
Perishability

172
proportion (68%/32%) of the two second-tier values is represented as the vertical dashed line that
leads to the same results as shown in Table 12 and Figure 11. In general, all of the six
alternatives are sensitive to changes in the importance of the second-tier values since none of
them rank the same when weight proportion varies. However, we observe stability from the
alternatives if the weight changes within a certain range. For example, if the decision maker
attaches greater importance to Economic Value over Societal Need, Food and Farm Products
cargo dominates all of the other alternatives when the weight of Economic Value is larger than
65% (and Societal Need is less than 35%). If the decision maker stresses the importance of
Societal Need and increases its weight beyond 50%, three cargo alternatives, Petroleum,
Chemicals, and Primary Manufactured Goods, form a group dominating the other three cargo
alternatives and are insensitive to changes in the weights given to Societal Need and Economic
Value. Coal, Crude Materials, and Food and Farm Products cargoes still exhibit some sensitivity
within this range according to their changing priority orders. The sensitivity analysis provides
additional insight into the impact of the importance weights on the final alternative CVDR
results.
0/100 20/80 40/60 60/40 80/20 100/00.0
0.2
0.4
0.6
0.8
Tota
l V
FT
Score
Weight Proportion of Societal Need
& Economic Value (%/%)
Coal
Petroleum
Chemicals
Crude Materials
Primary MFD
Goods
Food and Farm
Products
Base Weight
Figure 12 Sensitivity Analysis of Value Weights on CVDR Results
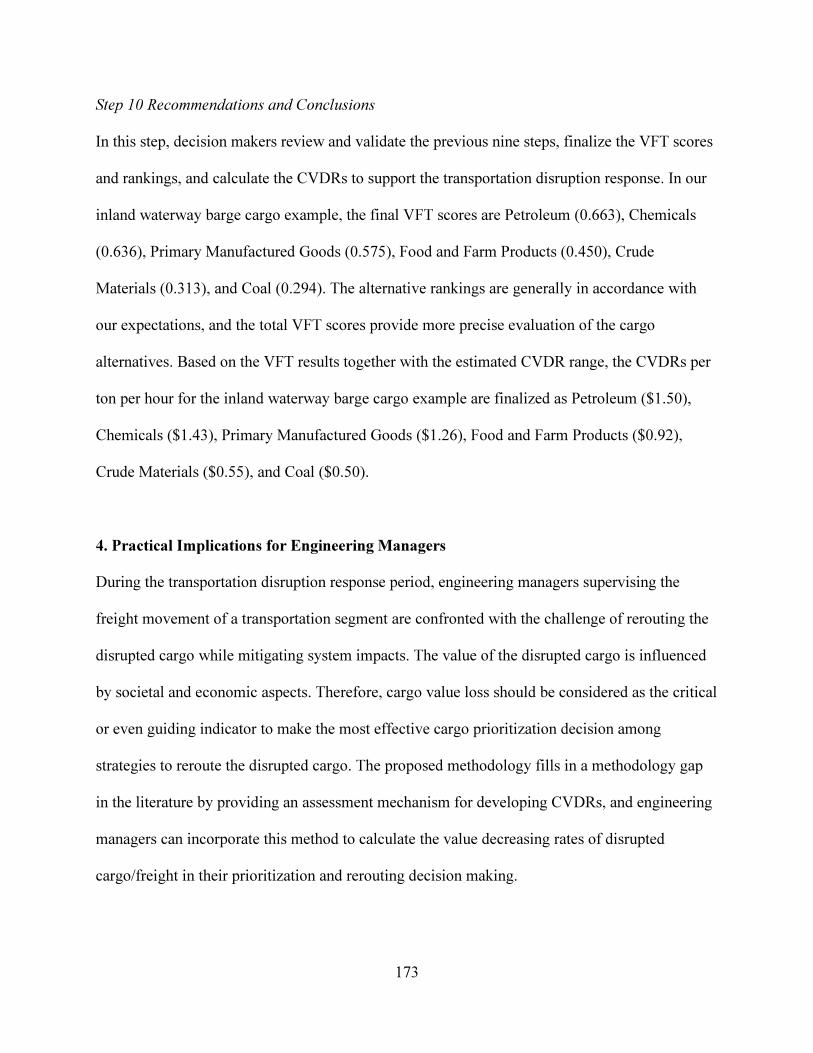
173
Step 10 Recommendations and Conclusions
In this step, decision makers review and validate the previous nine steps, finalize the VFT scores
and rankings, and calculate the CVDRs to support the transportation disruption response. In our
inland waterway barge cargo example, the final VFT scores are Petroleum (0.663), Chemicals
(0.636), Primary Manufactured Goods (0.575), Food and Farm Products (0.450), Crude
Materials (0.313), and Coal (0.294). The alternative rankings are generally in accordance with
our expectations, and the total VFT scores provide more precise evaluation of the cargo
alternatives. Based on the VFT results together with the estimated CVDR range, the CVDRs per
ton per hour for the inland waterway barge cargo example are finalized as Petroleum ($1.50),
Chemicals ($1.43), Primary Manufactured Goods ($1.26), Food and Farm Products ($0.92),
Crude Materials ($0.55), and Coal ($0.50).
4. Practical Implications for Engineering Managers
During the transportation disruption response period, engineering managers supervising the
freight movement of a transportation segment are confronted with the challenge of rerouting the
disrupted cargo while mitigating system impacts. The value of the disrupted cargo is influenced
by societal and economic aspects. Therefore, cargo value loss should be considered as the critical
or even guiding indicator to make the most effective cargo prioritization decision among
strategies to reroute the disrupted cargo. The proposed methodology fills in a methodology gap
in the literature by providing an assessment mechanism for developing CVDRs, and engineering
managers can incorporate this method to calculate the value decreasing rates of disrupted
cargo/freight in their prioritization and rerouting decision making.
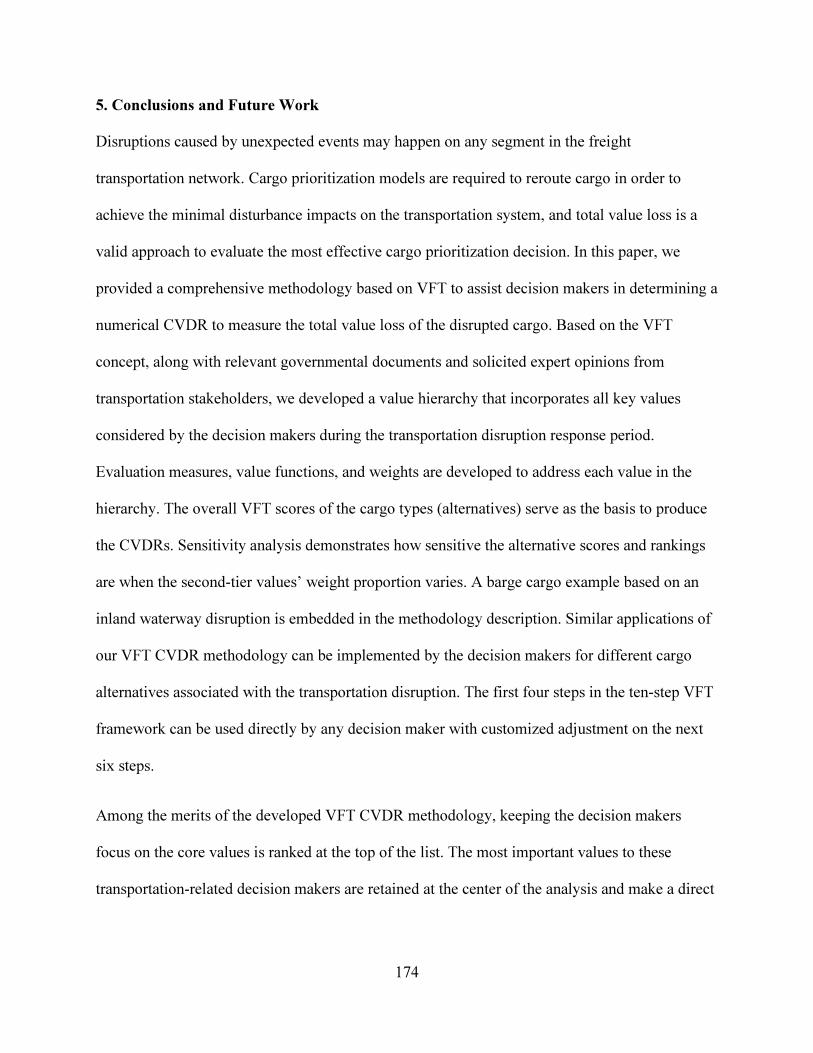
174
5. Conclusions and Future Work
Disruptions caused by unexpected events may happen on any segment in the freight
transportation network. Cargo prioritization models are required to reroute cargo in order to
achieve the minimal disturbance impacts on the transportation system, and total value loss is a
valid approach to evaluate the most effective cargo prioritization decision. In this paper, we
provided a comprehensive methodology based on VFT to assist decision makers in determining a
numerical CVDR to measure the total value loss of the disrupted cargo. Based on the VFT
concept, along with relevant governmental documents and solicited expert opinions from
transportation stakeholders, we developed a value hierarchy that incorporates all key values
considered by the decision makers during the transportation disruption response period.
Evaluation measures, value functions, and weights are developed to address each value in the
hierarchy. The overall VFT scores of the cargo types (alternatives) serve as the basis to produce
the CVDRs. Sensitivity analysis demonstrates how sensitive the alternative scores and rankings
are when the second-tier values’ weight proportion varies. A barge cargo example based on an
inland waterway disruption is embedded in the methodology description. Similar applications of
our VFT CVDR methodology can be implemented by the decision makers for different cargo
alternatives associated with the transportation disruption. The first four steps in the ten-step VFT
framework can be used directly by any decision maker with customized adjustment on the next
six steps.
Among the merits of the developed VFT CVDR methodology, keeping the decision makers
focus on the core values is ranked at the top of the list. The most important values to these
transportation-related decision makers are retained at the center of the analysis and make a direct

175
impact on all of the assessment steps. Our VFT CVDR method provides guidance to soliciting
expert opinions in an informative, rigorous, and structured way.
There are several opportunities related to the future extensions of this work. The first one is to
explore additional approaches to convert the final VFT scores into the CVDRs. Second
opportunity is to evaluate CVDRs based on VFT by applying them to the cargo prioritization
models as the model input. In our previous studies (Authors, 20##), we developed a model for
the cargo prioritization and terminal allocation problem (CPTAP) for inland waterway
disruptions, which presents an opportunity to implement the VFT CVDRs in practice and
examine their influence on the prioritization decision. We also would like to implement the VFT
CVDR methodology, together with the CPTAP model, during a real-world scenario in order to
examine the extent of its practical contributions. At last, we are interested in developing an Excel
VBA program to facilitate the application of the VFT CVDR methodology. This tool can be used
as part of disaster preparedness and response for which transportation engineering managers
estimate the regular cargo movement on their investigating transportation segment and derive the
CVDRs for future use.
Acknowledgment
This material is based upon work supported by the U.S. Department of Homeland Security under
Grant Award Number ___. The views and conclusions contained in this document are those of
the authors and should not be interpreted as necessarily representing the official policies, either
expressed or implied, of the U.S. Department of Homeland Security.

176
Appendix 1
College of Engineering
Department of Industrial Engineering
To: University of Arkansas Graduate School
From: Heather Nachtmann, Ph.D.
Professor of Industrial Engineering
(479)575-5857
Date: June 26, 2014
Subject: Multi-author Documentation
This memorandum is to confirm that Jingjing Tong is the first author of the following article and
completed at least 51% of the work for the article.
“Value-focused assessment of cargo value decreasing rate”

177
References
Axtell, P. G. (2011). Value focused thinking analysis of the Pacific Theater’s future air mobility
en route system. (Master thesis). Air Force Institute of Technology, Wright-Patterson Air Force Base, Ohio. Braziel, C., Thal, A. E., & Weir, J. D. (2007). Evaluating the effectiveness of utility privatization. Journal of Facilities Management, 5(2), 86-102. Chambal, S., Shoviak, M., & Thal Jr, A. E. (2003). Decision analysis methodology to evaluate integrated solid waste management alternatives. Environmental Modeling & Assessment, 8(1), 25-34. Chopra, S., & Meindl, P. (2007). Supply chain management: Strategy, planning & operation. (3rd ed.). Upper Saddle River, New Jersey: Pearson Prentice Hall. Department of Homeland Security (DHS). (2006). National strategy for maritime security: the
maritime infrastructure recovery plan. Retrieved from: http://www.dhs.gov/xlibrary/assets/HSPD_MIRPPlan.pdf
Department of Homeland Security (DHS). (2007). Strategy to enhance international supply chain security. Retrieved from: http://www.dhs.gov/xlibrary/assets/plcy-internationalsupplychainsecuritystrategy.pdf Dillon-Merrill, R. L., Parnell, G. S., Buckshaw, D. L., Hensley, W. R., & Caswell, D. J. (2008). Avoiding common pitfalls in decision support frameworks for Department of Defense analyses. Military Operations Research, 13(2), 19-31. Fatah, A. A., Barrett, J. A., Arcilesi, R. D., Scolla, P. S., Lattin, C. H., & Fortner, S. D. (2002). Guide for the selection of communication equipment for emergency first responders. Retrieved from: http://www.ece.vt.edu/swe/chamrad/ps/NIJ_104-00.pdf Federal Emergency Management Agency (FEMA). (2011). National disaster recovery
framework strengthening disaster recovery for the nation. Retrieved from: http://www.fema.gov/pdf/recoveryframework/ndrf.pdf Federal Emergency Management Agency (FEMA). (2014). Resource typing library tool. Retrieved from: https://rtlt.ptaccenter.org/Public Grandjean, P.J., & Newbury, C.J. (2001). An assessment of the worldwide express program and
its effects on customer wait time (CWT) and readiness. (Master thesis). Naval Postgraduate School, Monterey, CA. International Federation of Red Cross and Red Crescent Societies. (2000). Disaster emergency
needs assessment-disaster preparedness training programme. Retrieved from: http://www.ifrc.org/Global/Disemnas.pdf

178
International Monetary Fund. (2014). IMF primary commodity prices. Retrieved from: http://www.imf.org/external/np/res/commod/index.aspx Jordan, J. D. (2012). A Value Focused Thinking Tutorial for Supply Chain Application. In The average network flow problem: Shortest path and minimum cost flow formulations, algorithms,
heuristics, and complexity. (Doctoral dissertation). Air Force Institute of Technology, Wright-Patterson Air Force Base, Ohio.
Kantola, J., & Karwowski, W. (Eds.). (2012). Knowledge service engineering handbook. CRC Press. Katzer, D. J. (2002). Decision analysis with value-focused thinking as a methodology in
structuring the civil engineering operations flight. (Master thesis). Air Force Institute of Technology, Wright-Patterson Air Force Base, Ohio. Keeney, R.L. (1992). Value-focused thinking: A path to creative decisionmaking. Cambridge, Massachusetts: Harvard University Press. Keeney, R. L. (1996). Value-focused thinking: Identifying decision opportunities and creating alternatives. European Journal of operational research, 92(3), 537-549. Kirkwood, C. W. (1997). Strategic decision making. Belmont, CA: Duxbury Press. Lawson, J. R., & Vettori, R. L. (2005). The emergency response operations. US Department of Commerce, Technology Administration, National Institute of Standards and Technology. Lindell, M. K. (2013). Recovery and reconstruction after disaster. In Encyclopedia of Natural
Hazards (pp. 812-824). Netherlands: Springer. Manuscript Authors (20##). XXX Proceedings of the American Society for Engineering
Management 20## International Annual Conference.
Mills, C. E., Osgood, J. W., Thal Jr, A. E., & Havlicek, J. D. (2009). Development of a Value-Focused Architectural Scorecard for a Joint Force Protection System. In Proceedings of the 2009 Industrial Engineering Research Conference, Miami FL. Mullai, A. (2006). Maritime transport and risks of packaged dangerous goods. DaGoB (Safe and Reliable Transport Chains of Dangerous Goods in the Baltic Sea Region) Project Office, Turku School of Economics, Turku, Finland. Nachtmann, H., & Pohl, E. A. (2013). Transportation readiness assessment and valuation for emergency logistics. International Journal of Emergency Management, 9(1), 18-36. Neiger, D., Rotaru, K., & Churilov, L. (2009). Supply chain risk identification with value-focused process engineering. Journal of Operations Management, 27, 154-168.

179
Olson, D. L., & Wu, D. (2010). Enterprise Risk Management Models. Berlin Heidelberg: Springer-Verlag. Parnell, G.S. (2008). Value focused thinking. In Parnell, G.S., Driscoll, P.G. & Henderson, D.L. (Ed.), Decision making for systems engineering and management. Hoboken, New Jersey: John Wiley & Sons, Inc. Parnell, G. S., Hughes, D. W., Burk, R. C., Driscoll, P. J., Kucik, P. D., Morales, B. L., & Nunn, L. R. (2013). Survey of value-focused thinking: Applications, research development and areas for future research. Journal of Multi-criteria Decision Analysis, 20, 49-60. Pruitt, K. A. (2003). Modeling homeland security: A value focused thinking approach. (Master Thesis). Air Force Institute of Technology, Wright-Patterson Air Force Base, Ohio. U.S. Army Corps of Engineers (USACE). (2006). Hannibal locks and dam: Causes and
consequences of lock closures 21 October to 16 November 2005. Retrieved from: http://www.corpsnets.us/docs/EventHannibal/06-NETS-R-05.pdf U.S. Army Corps of Engineers (USACE). (2014). Commodity code cross reference. Retrieved from: http://www.navigationdatacenter.us/data/datacomm.htm U.S. Air Force (USAF). (2012). The uniform materiel movement and issue priority system in AFMAN 23-110 Volume 1 Part 1, Chapter 24. Retrieved from: http://static.e-publishing.af.mil/afman/23-110/PUBS/AF/23/23011001/010124/010124.pdf U.S. Department of Transportation (USDOT). (2010). Freight transportation: Global Highlights.
Retrieved from: http://www.rita.dot.gov/bts/sites/rita.dot.gov.bts/files/publications/freight_transportation/index.html U.S. Department of Transportation (USDOT). (2013). 2012 Commodity flow survey –
preliminary tables. Retrieved from: http://www.rita.dot.gov/bts/sites/rita.dot.gov.bts/files/publications/commodity_flow_survey/2012/united_states/index.html U.S. Energy Information Administration. (2014). Retrieved from: http://www.eia.gov/ Shoviak, M. J. (2001). Decision analysis methodology to evaluate integrated solid waste
management alternatives for a remote Alaskan air station. (Master thesis). Air Force Institute of Technology, Wright-Patterson Air Force Base, Ohio. Sperling, B. K. (1999). A value focused approach to determining the top ten hazards in army
aviation. (Master thesis). Air Force Institute of Technology, Wright-Patterson Air Force Base, Ohio.

180
Winthrop, M. F. (1999). Technology selection for the air force research laboratory air vehicles directorate: An analysis using value focused thinking. (Master thesis). Air Force Institute of Technology, Wright-Patterson Air Force Base, Ohio. Zhu, S., & Levinson, D. M. (2012). Disruptions to transportation networks: a review. In Network
Reliability in Practice (pp. 5-20). New York: Springer.

181
7. MULTI-ATTRIBUTE DECISION MODEL FOR CARGO PRIORITIZATION
WITHIN INLAND WATERWAY TRANSPORTATION7
Jingjing Tong, M.S.
Heather Nachtmann, Ph.D.
Abstract
Inland waterways are an integral part of the Nation’s transportation system. Disruption of the
inland waterways can have widespread economic and social impacts. These detrimental
consequences can be mitigated by prioritizing the barge cargoes for offloading to ensure that the
most essential cargoes are identified and moved from the inland waterway promptly. A number
of characteristics are attached to the cargoes, which enable the decision maker to prioritize
among them. For example, we want to prioritize removal of hazardous cargo to mitigate risk and
movement of essential cargoes for industry continuity. We present a multi-attribute decision
approach using the Analytic Hierarchy Process (AHP) that integrates multiple factors to indicate
the prioritized ordering of barge cargoes. Higher priority cargo is given the greatest consideration
for offloading, while the lower priority cargo is least preferred according to the model and may
be retained on the inland waterway.
Key Words: Inland Waterways; Cargo Prioritization; Multi-attribute Decision Making; Analytic
Hierarchy Process
7 Published in the Proceedings of the 2013 Industrial and Systems Engineering Research
Conference

182
1. Introduction
The commercially important U.S. inland waterway system is an open system consisting of
12,000 miles of navigable waterways managed by the U.S. Army Corps of Engineers (Clark et
al., 2005). Inland and intracoastal waterways serve thirty-eight States with nearly 200
commercially active lock sites (USACE, 2009). The Nation’s “marine highways” are an
important component of the nation’s transportation system and considered as a critical
transportation mode for certain commodities and geographical regions. Disruptions on the inland
waterway system can have widespread economic and societal impacts. In order to mitigate these
impacts, the research funded by the U.S. Department of Homeland Security has been conducted
to formulate and solve a nonlinear integer program of cargo prioritization and terminal allocation
problem (CPTAP) that minimizes the total value loss of the barge cargoes due to disruption on
the inland waterway transportation system (Tong and Nachtmann, 2012). Several important
attributes are identified as important to the CPTAP including hazardous cargo, terminal capacity,
barge draft, cargo value, and commodity type. However, there are additional qualitative factors
that can influence the offloading priority of barge cargoes. The objective of this paper is to
develop a multi-attribute decision model that integrates multiple tangible and intangible factors
to offer a new perspective to solve the cargo prioritization problem for inland waterway
disruptions. We employ the Analytic Hierarchy Process (AHP) approach to establish the multi-
attribute decision model. It was developed by Saaty in the middle of 1970s, which converts the
subjective evaluation for the intangible (qualitative) factors to numerical values and includes
both quantitative and qualitative factors to draw the final decision (Bandeira et al., 2009).
The remainder of this paper is organized as follows: Literature Review includes a concise
literature review of select papers focused on cargo prioritization as well as AHP application in
183
prioritization and ranking, Problem Description describes the cargo prioritization problem within
inland waterway transportation, the general model is constructed in AHP Model, the model
application is illustrated in Case Study, and the Conclusions summarizes the paper and discusses
our future research directions.
2. Literature Review
The literature contains cargo prioritization techniques in various application contexts (Tong and
Nachtmann, 2013). Lau et al. (2009) introduced a profit-based loading heuristic, one step of
which is sorting cargo based on shipping cost paid by the cargo owners as measured by the
chargeable weight of the cargo. Bennett (2002) examined the marketing environment for rural
communities and prioritizes products based on their economic and social importance in order to
identify products that should receive additional marketing attention. The U.S. Navy’s logistics
system employs a uniform material movement and issue priority system (UMMIPS) to prioritize
the materials according to movement importance (Grandjean and Newbury, 2001). Ibrahim and
Ayyub (1992) proposed a fuzzy multi-criterion risk-based prioritization method to determine the
order in which the critical components of a system are inspected for enhancing the inspection
effectiveness. A cargo prioritization and terminal allocation problem (CPTAP) model is
developed to provide decision support to disruption response stakeholders on how to respond to
the disruption and redirect affected barge traffic in order to minimize detrimental effects (Tong
and Nachtmann, 2013). The model delivery indicates the terminal that each disrupted barge is
assigned to for offloading and the prioritized turn each barge takes at its assigned terminal.
AHP is widely used by decision makers and researchers to solve different problems, and a large
number of papers have been published relating to the AHP application. Vaidya and Kumar (2006)

184
classified the AHP papers according to the theme such as “selection, evaluation, benefit-cost
analysis, allocations, planning and development, priority and ranking, and decision-making.” We
primarily focus on the papers that fall into the “priority and ranking” category which is more
similar to our proposed cargo prioritization problem. Bandeira et al. (2009) applied AHP
technique to prioritize the maritime booking confirmations in the event of the scarcity of the
transportation supply. Financial, managerial and organizational factors are incorporated in the
evaluation process of the clients, which is on the consensus of both the sales team and the top
executives. Farhan and Fwa (2009) explored the AHP application on the prioritization of the
pavement maintenance activities with the objective of reflecting the engineering opinions of a
group of highway agencies and engineers. Three AHP forms are considered and compared in
terms of their suitability and effectiveness in the priority assessments according to a direct
assessment method. Modarres and Zarei (2002) examined the city vehicle transport network for
the earthquake crisis preparation, using an AHP model to determine the trip priorities and the
shortest path theory to identify the fastest and safest routes. Hafeez et al. (2002) looked into how
to determine a firm’s key capabilities in order to improve its core competencies and adopted
AHP to construct the evaluation framework. Contributions of firm capabilities are assessed for
both financial and non-financial performances. An interesting field in which AHP approach is
also widely employed as the decision method is the sports management. One example is Bodin
and Epstein (2000)’s paper of using AHP to rank the players in the professional baseball team for
the expansion draft. Braglia (2000) explored the effectiveness of AHP by proposing the multi-
attribute failure mode analysis (MAFMA). It uses an AHP-based method to prioritize failures
identified in the reliability research in order to determine the most appropriate corrective actions.

185
3. Problem Description
The cargo prioritization problem for inland waterway disruptions is graphically shown in Figure
1. As an example, one of the lock and dam (L/D) systems located along the river section is
disrupted and no longer functioning, which causes the inland waterway to close thus halting
traffic traveling up and down the river at the point of disruption. Other disruptions could include
non-navigable water level due to drought or flood, vessel allision or collision, and other
infrastructure disruptions. The barge tows (typically consisting of five to twelve barges) that are
traveling in the direction away from the disruption are unaffected and able to continue transport
to their destination. Barge tows (depicted in bold) that are traveling towards and beyond the
disrupted L/D are affected and no longer able to travel to their destination via the disrupted
waterway. The cargo on the disrupted barges is the focus of our cargo prioritization model. We
aim to identify the most essential cargoes based on the select influencing factors and remove
these cargoes from inland waterway promptly. The higher priority cargoes are given the greatest
consideration for offloading (e.g. given the first order at the nearest capacity-allowed terminal);
while the lower priority cargoes are least preferred according to the model and may be retained
on the inland waterway.
We assume that there are sufficient towing vessels to transport the individual barges to their
redirected alternative terminals. Since the marine highway system is effectively divided into two
sections by the disrupted L/D, there are actually two cargo prioritization decisions to make; one
for the river section above the disruption and one for the river section below the disruption.

186
Figure 1 Graphical Description of Cargo Prioritization Problem
4. AHP Model
The basis of the cargo prioritization problem above is a set of prioritization factors associated
with the cargoes, which can assist the decision maker in distinguishing between the barge
cargoes and prioritize them in a desirable manner. A multi-attribute decision model that
integrates these multiple factors is a promising approach to assess the prioritized ordering of the
barge cargoes.
As a multi-attribute decision making tool, AHP was developed by Saaty in 1970s and has been
widely used in many fields. It successfully incorporates both qualitative and quantitative factors
Riv
er M
ile

187
to assess the multiple alternatives in a mathematically rigorous manner. It is a proven and
effective approach to weight multiple attributes, evaluate data describing the attributes and
alternatives, and check the comparison consistency of the decision makers. AHP relies on the
belief that an individual can reasonably perform the pairwise comparisons (Bandeira et al., 2009).
This technique is capable of synthesizing the subjective judgments of multiple individuals and
draws a reconciled conclusion. For the cargo prioritization problem we are investigating which
involves multiple attributes and alternatives, AHP is a simple, straightforward and effective
approach.
Figure 2 displays the four-level AHP decision hierarchy for the cargo prioritization problem in
the context of inland waterway transportation. At the top level is the overall goal: “How to
minimize the negative impacts of the inland waterway transportation disruption?” The attributes
and the subattributes are located at the second and the third levels respectively, and the bottom
level consists of the alternatives – the barge cargoes whose transportation is interrupted by the
disrupted inland waterway.

188
Figure 2 AHP Decision Hierarchy for Cargo Prioritization within Inland Waterway
Transportation
In terms of how to choose the attributes and subattributes, we rely on a systematic literature
review of existing cargo prioritization models, which was carried out in our preliminary research
(Tong and Nachtmann, 2012). In our review, twenty pertinent papers were selected including
publications from governmental agencies and academic institutions. The factors obtained from
the selected papers were organized in a factor matrix that describes and categorizes each factor.
The attributes and the subattributes are derived from carefully contemplating each factor in the
factor matrix and selecting the factors that best fit the inland waterway transportation disruption
context. The brief explanation of the attributes and subattributes is provided below:
• Time – A temporal attribute that is broken down into two subattributes:

189
o Earliest Due Date (EDD) (Armstrong et al., 1983) – EDD is one of the most popular
criteria in the cargo prioritization literature. The wide usage is due to its close
relevance to the quality of customer service. Prioritization based on EDD guarantees
that the cargoes are sequenced and delivered to the customers in order to minimize
the total due date violation, which correspondingly increases the total customer
satisfaction level. However, EDD may not be readily available for all the barge
cargoes.
o Seasonal Advantage (Bennett, 2002) – Since seasonal cargo is not consistently
available at all times of the year, it is assumed to have higher priority when it is
present on the inland waterway. For example, grain is generally transported during its
harvest season and prioritized to some extent due to its scarcity in other seasons.
When considering this factor, the perishability of certain cargo is accounted for at the
same time.
• Value (Aragon, 2000) – More valuable cargo receives higher priority.
• Risk – The cargo that exposes the relevant objects to potential harm is prioritized to be
offloaded from inland waterway. Hazardous cargo is given greater weight regarding to
this attribute and is usually prioritized due to its potential detrimental impact. Risk has
the following two subattributes:
o Human Risk (Ibrahim and Ayyub, 1992) – It is the risk to the humans on the barge
tow and in the vicinity of the nearby river section.
o Environment Risk (Hansen and Cowi, 2003) – It is the risk to the waterway and
surrounding land nearby.
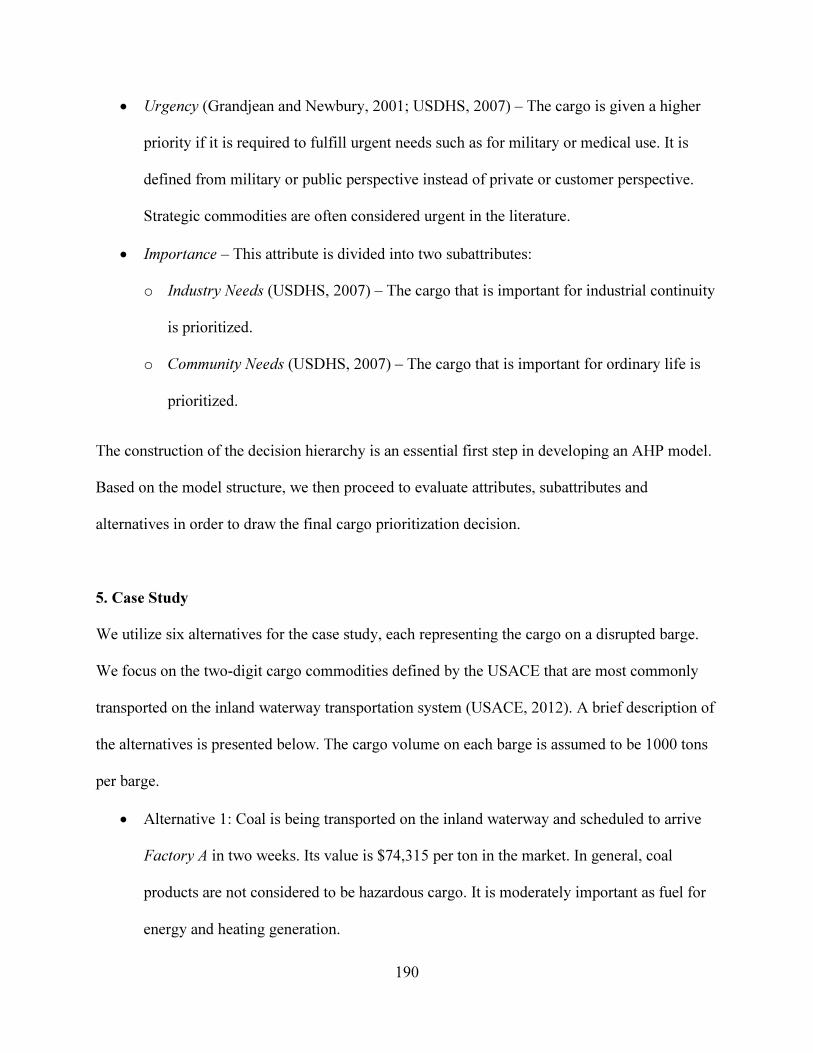
190
• Urgency (Grandjean and Newbury, 2001; USDHS, 2007) – The cargo is given a higher
priority if it is required to fulfill urgent needs such as for military or medical use. It is
defined from military or public perspective instead of private or customer perspective.
Strategic commodities are often considered urgent in the literature.
• Importance – This attribute is divided into two subattributes:
o Industry Needs (USDHS, 2007) – The cargo that is important for industrial continuity
is prioritized.
o Community Needs (USDHS, 2007) – The cargo that is important for ordinary life is
prioritized.
The construction of the decision hierarchy is an essential first step in developing an AHP model.
Based on the model structure, we then proceed to evaluate attributes, subattributes and
alternatives in order to draw the final cargo prioritization decision.
5. Case Study
We utilize six alternatives for the case study, each representing the cargo on a disrupted barge.
We focus on the two-digit cargo commodities defined by the USACE that are most commonly
transported on the inland waterway transportation system (USACE, 2012). A brief description of
the alternatives is presented below. The cargo volume on each barge is assumed to be 1000 tons
per barge.
• Alternative 1: Coal is being transported on the inland waterway and scheduled to arrive
Factory A in two weeks. Its value is $74,315 per ton in the market. In general, coal
products are not considered to be hazardous cargo. It is moderately important as fuel for
energy and heating generation.

191
• Alternative 2: The barge is transporting petroleum to the customer location B in four
weeks. The market value is $220,893 per ton. Due to its flammable nature, petroleum
products have great potential to cause severe harm to humans and environment.
• Alternative 3: Chemicals are being moved on the waterway transportation to reach
Company C in two weeks. The market value is $86,714 per ton. The chemicals being
carried by the barge are dangerous to humans and environment upon exposure, and they
are necessary commodities for the chemical industry.
• Alternative 4: Crude materials are transported by the barge for further processing
operation at Factory D. It is required to enter the production line by the end of next week.
Its value is $130,920 per ton in the market. These minimally processed products are
comparatively steady in state and have little negative impact on humans and the
environment. These crude materials are important raw materials for many industries.
• Alternative 5: This barge is transporting primary manufactured goods that are being
transported to Retailer E without any specific due date. Its market value is $271,830 per
ton. These are urgently needed products for the medical industry.
• Alternative 6: Food and farm products are being transported by barge to Community F
with a due date of four weeks. The products have a market value of $220,835 per ton.
They are important products for community continuity.
The six alternatives are indicated in the bottom level of the decision hierarchy in Figure 2,
forming an integrated AHP hierarchy for the case study. Then we determine the priorities of the
elements at each hierarchical level in regard to the each element at the higher hierarchical level
and calculate the overall priorities for alternatives. Table 1 is the nine-point comparison scale

192
that is used to carry out the pairwise comparisons of the elements in order to compute their
priorities.
Table 1 AHP Comparison Scale (Canada et al., 2005)
Definition Value
Equally important/preferred 1
Moderately more important/preferred 3
Strongly more important/preferred 5
Very strongly more important/preferred 7
Absolutely more important/preferred 9
Intermediate values 2, 4, 6, 8
Priority Evaluation of Attributes and Subattributes
Table 2 presented the relative importance of the attributes with respect to the overall goal. We
compare all possible attributes pairs using the comparison scale in Table 1. The last column
contains the computed priorities of each attribute: Risk has the highest priority (0.480), followed
by Urgency (0.233), Importance (0.146), Time (0.091) and Value (0.051). The consistency ratio
is 0.058 indicating that the judgmental consistency is acceptable. Table 3 indicates the relative
importance of the subattributes with respect to their associated attributes.
Table 2 Attribute Priority Evaluation
Attribute Time Value Risk Urgency Importance Priority
Time 1 3 1/7 1/3 1/2 0.091
Value 1/3 1 1/6 1/2 1/3 0.051
Risk 7 6 1 3 3 0.480
Urgency 3 5 1/3 1 2 0.233
Importance 2 3 1/3 1/2 1 0.146
Consistency Ratio = 0.058
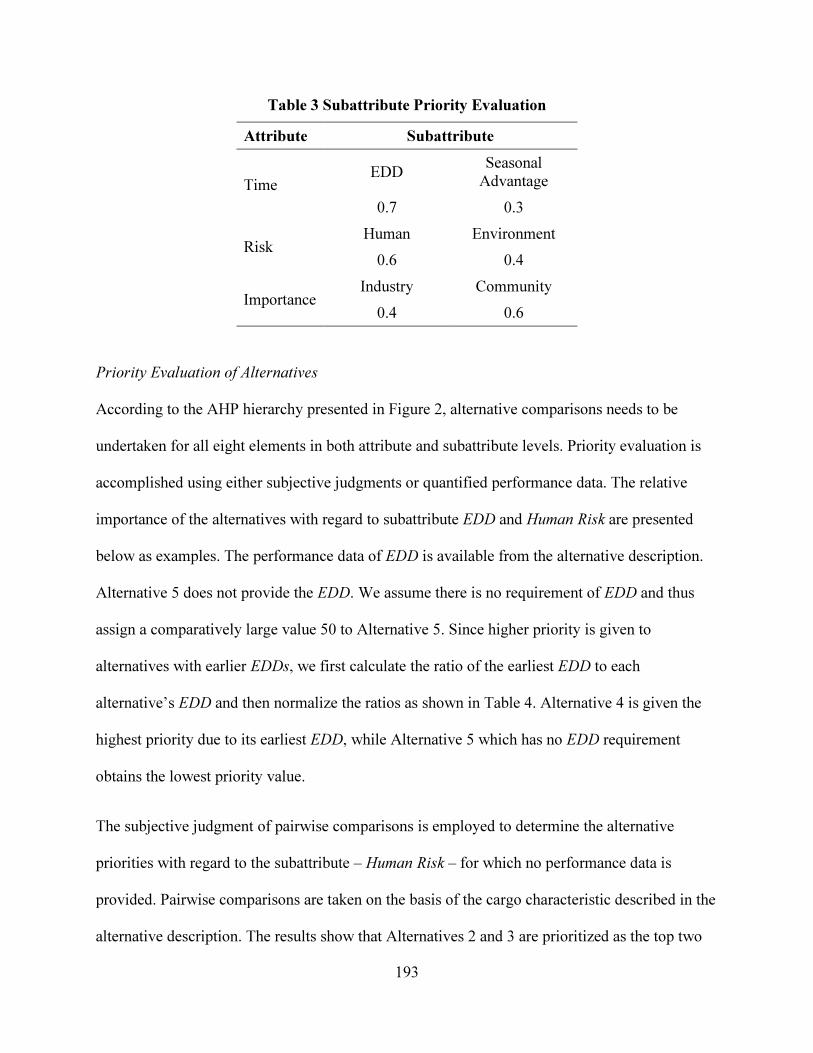
193
Table 3 Subattribute Priority Evaluation
Attribute Subattribute
Time EDD
Seasonal Advantage
0.7 0.3
Risk Human Environment
0.6 0.4
Importance Industry Community
0.4 0.6
Priority Evaluation of Alternatives
According to the AHP hierarchy presented in Figure 2, alternative comparisons needs to be
undertaken for all eight elements in both attribute and subattribute levels. Priority evaluation is
accomplished using either subjective judgments or quantified performance data. The relative
importance of the alternatives with regard to subattribute EDD and Human Risk are presented
below as examples. The performance data of EDD is available from the alternative description.
Alternative 5 does not provide the EDD. We assume there is no requirement of EDD and thus
assign a comparatively large value 50 to Alternative 5. Since higher priority is given to
alternatives with earlier EDDs, we first calculate the ratio of the earliest EDD to each
alternative’s EDD and then normalize the ratios as shown in Table 4. Alternative 4 is given the
highest priority due to its earliest EDD, while Alternative 5 which has no EDD requirement
obtains the lowest priority value.
The subjective judgment of pairwise comparisons is employed to determine the alternative
priorities with regard to the subattribute – Human Risk – for which no performance data is
provided. Pairwise comparisons are taken on the basis of the cargo characteristic described in the
alternative description. The results show that Alternatives 2 and 3 are prioritized as the top two

194
alternatives in terms of their potential risk to human, which is in accordance with the fact that
Alternatives 2 and 3 are the hazardous cargoes of petroleum products and chemicals. The
consistency ratio is within the acceptance level.
Table 4 Alternative Priority Evaluation Table 5 Alternative Priority Evaluation (EDD) (Human Risk)
Other calculations of alternative priority evaluation can be found in the Appendix 1. We assume
only Alternative 6 (farm and food products) is a seasonal cargo. The general guidelines of
carrying out the pairwise comparisons with respect to attributes/subattributes are described at the
beginning of Section 5. We did encounter the situation where the consistency ratio is larger than
0.1 and solved the inconsistent judgment issue by adjusting the entries for several pairwise
comparisons.
Alternative Priority
Once the priority assessments of the attributes, subattributes and alternatives are complete, we
derive the overall alternative priorities, which are shown in Table 6. Table 6 summarizes the
results of all priority evaluations and utilizes the following formula to calculate the overall
alternative priorities.
Alternative k priority = ∑all i subdivided attributes (priority weighti × ∑all j subattributes derived from i (priority
weightj × evaluation priorityijk)) + ∑all i attributes (priority weighti × evaluation priorityik)
EDD Ratio Priority
A1 2 0.5 0.198
A2 4 0.25 0.099
A3 2 0.5 0.198
A4 1 1 0.397
A5 50 0.02 0.008
A6 4 0.25 0.099
A1 A2 A3 A4 A5 A6 Priority A1 1 1/7 1/6 1 1 1 0.059
A2 7 1 3 7 7 7 0.480
A3 6 1/3 1 5 5 5 0.279
A4 1 1/7 1/5 1 1 1 0.061
A5 1 1/7 1/5 1 1 1 0.061
A6 1 1/7 1/5 1 1 1 0.061
Consistency Ratio = 0.0125

195
Table 6 Overall Alternative Priority
Alter-
natives
Time
(0.091)
Value
(0.051)
Risk
(0.480)
Urgency
(0.233)
Importance
(0.146) Overall
Alternative
Priority EDD
(0.7)
Seasonal
(0.3)
Human
(0.6)
Envir.
(0.4)
Industry
(0.4)
Comm.
(0.6)
A1 0.198 0.125 0.074 0.059 0.107 0.063 0.078 0.075 0.083
A2 0.099 0.125 0.220 0.480 0.453 0.392 0.144 0.148 0.359
A3 0.198 0.125 0.086 0.279 0.251 0.064 0.211 0.043 0.180
A4 0.397 0.125 0.130 0.061 0.048 0.068 0.465 0.044 0.109
A5 0.008 0.125 0.270 0.061 0.092 0.228 0.038 0.262 0.131
A6 0.099 0.375 0.220 0.061 0.048 0.185 0.064 0.429 0.139
The petroleum products in Alternative 2 obtain the highest priority (0.359) in large part due to
their high rankings with regard to the two most prioritized attributes – Risk and Urgency. The
chemicals in Alternative 3 have the second highest priority (0.180). The third to sixth priorities
are given to food and farm products in Alternative 6 (0.139), primary manufactured goods in
Alternative 5 (0.131), crude materials in Alternative 4 (0.109) and coal in Alternative 1 (0.083)
respectively. Among the last four alternatives, some of them have the highest priority with
respect to a particular attribute/subattribute, e.g. food and farm products in Alternative 6 ranks
highest on the subattribute “community needs”. However, the attribute/subattribute does not
contribute sufficiently to the overall goal.
After determining the overall alternative priorities we make transportation plans to move the
cargo alternatives with the highest priorities. For instance, in the case study, the petroleum
products in Alternative 2 are assigned to the nearest terminal that has the necessary conditions
and capacity to receive this barge. Planners would need to make sure that the terminal facilities
and laborers are ready to offload these barges. The second prioritized cargo, the chemicals in
Alternative 3, are assigned to the nearest capacity-allowed terminal for offloading under the

196
condition that they do not influence the handling operation for the cargo alternatives with higher
priorities. If they do, they are sent to the second-nearest feasible terminal, so on so forth for the
remaining alternatives. The lowest priority alternatives may need to remain on the inland
waterway instead of transporting to a terminal.
6. Conclusions
This paper has presented a multi-attribute decision making approach to tackle the cargo
prioritization problem within an inland waterway transportation disruption. AHP is selected as
the multi-attribute decision tool that can integrate both qualitative and quantitative factors to
determine the final alternative priorities. An AHP decision hierarchy is established for the inland
waterway disruption decision based on a literature review of existing cargo prioritization
research. We provide a case study of six alternatives barge cargoes to illustrate the AHP
application and derive a solid priority decision that is in accordance to the alternative
assumptions.
A forthcoming extension of this paper is to apply the presented AHP model to a realistic
waterway disruption scenario. Ho (2008) pointed out that the focus of AHP application has
transformed from stand-alone AHP to integrated AHP, which combines AHP with other
techniques such as mathematical programming, meta-heuristic and SWOT analysis. The
integrated AHP is another interesting direction for future work. One way is to use AHP to
prioritize the factors identified in the literature instead of the cargo alternatives and construct a
mathematical model to cover the most essential factors observed from the AHP results.

197
Acknowledgement
This material is based upon work supported by the U.S. Department of Homeland Security under
Grant Award Number 2008-ST-061-TS003. The work was conducted through the Mack-
Blackwell Rural Transportation Center at the University of Arkansas and the Center for
Transportation Safety, Security and Risk at Rutgers University. .
The views and conclusions contained in this document are those of the authors and should not be
interpreted as necessarily representing the official policies, either expressed or implied, of the
U.S. Department of Homeland Security.

198
Appendix 1
Alternative Priority Evaluation (Value) Alternative Priority Evaluation (Seasonal Advantage)
Value Priority
A1 74315 0.074
A2 220893 0.220
A3 86714 0.086
A4 130920 0.130
A5 271830 0.270
A6 220835 0.220
A1 A2 A3 A4 A5 A6 Priority
A1 1 1 1 1 1 1/3 0.125
A2 1 1 1 1 1 1/3 0.125
A3 1 1 1 1 1 1/3 0.125
A4 1 1 1 1 1 1/3 0.125
A5 1 1 1 1 1 1/3 0.125
A6 3 3 3 3 3 1 0.375
Consistency Ratio = 0
Alternative Priority Evaluation (Environment Risk) Alternative Priority Evaluation (Urgency)
A1 A2 A3 A4 A5 A6 Priority
A1 1 1/5 1/4 3 1 3 0.107
A2 5 1 3 7 5 7 0.453
A3 4 1/3 1 5 3 5 0.251
A4 1/3 1/7 1/5 1 1/2 1 0.048
A5 1 1/5 1/3 2 1 2 0.092
A6 1/3 1/7 1/5 1 1/2 1 0.048
Consistency Ratio = 0.026
A1 A2 A3 A4 A5 A6 Priority
A1 1 1/5 1 1 1/5 1/3 0.063
A2 5 1 7 6 2 2 0.392
A3 1 1/7 1 1 1/3 1/3 0.064
A4 1 1/6 1 1 1/4 1/2 0.068
A5 5 1/2 3 4 1 1 0.228
A6 3 1/2 3 2 1 1 0.185
Consistency Ratio = 0.011
Alternative Priority Evaluation (Industry Needs)
Alternative Priority Evaluation (Community Needs)
A1 A2 A3 A4 A5 A6 Priority
A1 1 1/3 1/5 1/7 3 2 0.078
A2 3 1 1/2 1/7 5 3 0.144
A3 5 2 1 1/3 5 3 0.211
A4 7 7 3 1 7 5 0.465
A5 1/3 1/5 1/5 1/7 1 2 0.038
A6 1/2 1/3 1/3 1/5 1/2 1 0.064
Consistency Ratio = 0.068
A1 A2 A3 A4 A5 A6 Priority
A1 1 1/3 3 2 1/5 1/7 0.075
A2 3 1 4 5 1/3 1/5 0.148
A3 1/3 1/4 1 1 1/5 1/7 0.043
A4 1/2 1/5 1 1 1/5 1/7 0.044
A5 5 3 5 5 1 1/2 0.262
A6 7 5 7 7 2 1 0.429
Consistency Ratio = 0.048

199
Appendix 2
College of Engineering
Department of Industrial Engineering
To: University of Arkansas Graduate School
From: Heather Nachtmann, Ph.D.
Professor of Industrial Engineering
(479)575-5857
Date: June 26, 2014
Subject: Multi-author Documentation
This memorandum is to confirm that Jingjing Tong is the first author of the following article and
completed at least 51% of the work for the article.
“Multi-attribute decision model for cargo prioritization within inland waterway transportation”

200
Appendix 3
Institute of Industrial Engineers
3577 Parkway Lane, Suite 200 · Norcross, GA 30092 · (770) 349-1110
June 23, 2014
Jingjing Tong, M.S.
Ph.D. Candidate
Graduate Assistant
Industrial Engineering
University of Arkansas
4122 Bell Engineering Center
Fayetteville, AR 72701
RE: COPYRIGHT PERMISSION
Dear Jingjing Tong:
The Institute of Industrial Engineers hereby grants permission to use material from its publication in your
dissertation, and warrants that it is the sole owner of the rights granted.
We ask that you note the following reprint lines respectively:
Copyright©2012. Reprinted with permission of the Institute of Industrial Engineers from the
Proceedings of the 2012 Industrial and Systems Engineering Research Conference. All rights
reserved.
Copyright©2013. Reprinted with permission of the Institute of Industrial Engineers from the
Proceedings of the 2013 Industrial and Systems Engineering Research Conference. All rights
reserved.
For: “A review of cargo prioritization techniques within inland waterway transportation”
For: “Multi-attribute decision model for cargo prioritization within inland waterway transportation”
Authors: Jingjing Tong and Heather Nachtmann
Please fax this signed agreement to my attention at (770) 263-8532.
Regards,
Donna Calvert
Agreed and accepted
________________________________________ ________________________
Signature Date

201
References
Aragon, C. T. (2000). Coconut Program Area Research Planning and Prioritization (No. DP 2000-31). Philippine Institute for Development Studies. Armstrong, G. R., Coleman, J. W., Hamilton, V. H., & Poe, J. W. (1983). Priority dispatch and aircraft scheduling: A study of strategic airlift scheduling. In Proceedings of the 15th conference on Winter Simulation-Volume 2 (pp. 579-588). IEEE Press. Bandeira, D. L., Becker, J. L., & Rocha, A. K. (2009). Applying AHP to the prioritization of maritime booking confirmation. In 2009 International Symposium on the Analytic
Hierarchy/Network Process. Bennett, B. (2002). Market scoping: methods to help people understand their marketing environment. PLA Notes, 45, 71-75. Bodin, L., & Epstein, E. (2000). Who’s on first–with probability 0.4. Computers & Operations
Research, 27(3), 205-215. Braglia, M. (2000). MAFMA: Multi-attribute failure mode analysis. International Journal of Quality & Reliability Management, 17(9), 1017-1033. Clark C., Henrickson, K. E., & Thomas, P. (2005). An overview of the U.S. inland waterway
system. (IWR Report 05_NETS-R-12). Institute for Water Resources, U.S. Army Corps of Engineers, Virginia. Farhan, J., & Fwa, T. F. (2009). Pavement maintenance prioritization using analytic hierarchy process. Transportation Research Record: Journal of the Transportation Research Board, 2093(1), 12-24. Grandjean, P. J., & Newbury, C. J. (2001). An assessment of the World Wide Express (WWX)
program and its effects on Customer Wait Time (CWT) and readiness. (Master thesis). Naval Postgraduate School, Monterey, CA. Hafeez, K., Zhang, Y., & Malak, N. (2002). Determining key capabilities of a firm using analytic hierarchy process. International journal of production economics, 76(1), 39-51. Hansen, E., & Cowi, A.S. (2003). Ranking of industrial products. Danish Environmental Protection Agency Environmental Project No.839. Ho, W. (2008). Integrated analytic hierarchy process and its applications–a literature review. European Journal of operational research, 186(1), 211-228. Ibrahim, A., & Ayyub, B. M. (1992). Multi-criteria ranking of components according to their priority for inspection. Fuzzy Sets and Systems, 48(1), 1-14.

202
Keeney, R. L. (1994). Creativity in decision making with value-focused thinking. Sloan Management Review, 35, 33-33. Lau, H. C., Chan, T. M., Tsui, W. T., Ho, G. T., & Choy, K. L. (2009). An AI approach for optimizing multi-pallet loading operations. Expert Systems with Applications, 36(3), 4296-4312. Modarres, M., & Zarei, B. (2002). Application of network theory and AHP in urban transportation to minimize earthquake damages. Journal of the Operational Research Society, 1308-1316. U.S. Department of Homeland Security. (2007). Strategy to enhance international supply chain security. Retrieved from: http://www.dhs.gov/xlibrary/assets/plcy-internationalsupplychainsecuritystrategy.pdf U.S. Army Corps of Engineers (USACE). (2009). Inland waterway navigation: value to the
nation. Retrieved from: http://www.corpsresults.us/ U.S. Army Corps of Engineers (USACE). (2012). Commodity classification list. Retrieved from: http://www.ndc.iwr.usace.army.mil/wcsc/webpub10/pdfs/commodity.pdf Vaidya, O. S., & Kumar, S. (2006). Analytic hierarchy process: An overview of applications. European Journal of operational research, 169(1), 1-29.

203
8. CONCLUSIONS AND FUTURE WORK
This chapter reviews the four main contributions of this dissertation, highlights the findings from
the dissertation research, and provides extensions for future work. All four contributions focus
on providing decision support for inland waterway stakeholders during disruption response.
Specifically, we emphasize our research on the management of disrupted cargoes in such
scenario; that is, how to handle cargoes being transported on the inland waterway when the
disruption occurs with the goal of minimizing their total value loss. By intelligently managing
this essential component of the inland waterway transportation, negative system impacts from
the interruptive events can be mitigated effectively.
In the first contribution of this dissertation (Chapter 4), we conduct a thorough literature review
regarding cargo prioritization methods and factors within general applications and reveal the lack
of a systematic cargo prioritization methodology for inland waterway disruption response. In
order to fill this gap, we first provide a detailed description of the identified Cargo Prioritization
and Terminal Allocation Problem (CPTAP) on the inland waterways when disruption happens.
Assumptions and influential factors for CPTAP are listed to clarify this novel problem that is
defined within the inland waterway context for the first time. We develop a binary nonlinear
integer program to model CPTAP with the objective function of minimizing total value loss of
the disrupted cargoes. The model takes important factors into consideration such as terminal
capacity, terminal water depth, barge volume, barge draft, cargo type, and cargo price. By
quantitatively considering and integrating the characteristics and restrictions from various
aspects associated to waterway freight movement, the CPTAP model delivers a cargo
prioritization decision that is both near optimized and applicable to real world decision scenarios.
We investigate two Genetic Algorithm (GA) approaches as part of our first endeavor to solve

204
CPTAP model. The test problem instances are carefully generated based on the real-world data
related to inland waterway terminals, barges, and cargoes. With experiments conducted on small,
medium, and large size instances, we find that both GA methods can obtain optimal solutions for
small size instances and our Traditional GA approach outperforms our LCS GA approach for
medium and large size instances since on average it produces better CPTAP results using less
computation time. We also test the model and our Traditional GA on a realistic disrupted river
scenario and find a substantial lower total value loss and response time compared to a naïve
minimize distance approach. To summarize, the first research contribution provides complete
disruption response guidance of what cargo should be prioritized for offloading and which
terminal the cargo should be assigned to for the inland waterway decision makers. The
achievement of the first contribution is threefold: a comprehensive definition of CPTAP, a well-
grounded optimization model for CPTAP, and a first effective solution approach to realistic
CPTAP decisions. Opportunities exist to expand the work in all of these three aspects. The
problem definition and model may be improved by including additional real-world system
attributes. Currently, we only prioritize cargo that is located on the river at the time of disruption.
However, barges may travel into the disrupted area during the response period due to the absence
of the available offloading terminals or the delayed disruption information. Further study on this
stochastic scenario is of interest to us. Other problem and model variants may be needed due to
additional restrictions or regulations in particular geographic regions, e.g. terminal labor limits
may be a constraint in some areas. We are interested in examining these additional factors for
potential inclusion in the model. Another extension opportunity is that additional solution
approaches that fit CPTAP structure can be explored for better model results. In the second
contribution, a Tabu search heuristic is examined with promising results for CPTAP. We believe

205
there may be classic optimization methods that are worth investigating including column
generation and memetic algorithms.
As previously mentioned, we develop a Tabu Search (TS) heuristic for the CPTAP model in
Chapter 5, which is the second major contribution. Though diversified in many aspects, heuristic
development is typically governed by one of two principles, population search or local search.
Since the GA method in Chapter 4 is a population search approach, examining the local-search
TS heuristic satisfies our curiosity in its performance in solving the CPTAP and provides the
opportunity to compare the two search principles for our problem. We first carry out a literature
review on TS applications and identify the most potential TS heuristic – Unified TS – from
multiple TS categories for CPTAP. Three TS variants are proposed based on different
neighborhood structures and then compared to each other as well as to the recommended GA
method presented in Chapter 4. We find that one of the three TS variants, TS with Blind Swap
(TS-BS), is the best choice among the multiple TS variants in terms of both solution quality and
computational efforts. Moreover, it also dominates the GA approach with smaller total value loss
and the CPU time results. Our more depth analysis further confirms the success of TS heuristic
as the second attempt on CPTAP solution method. It outperforms GA method with less response
time which is a critical evaluation measure of the CPTAP heuristic effectiveness. Five medium
and five large size instances are tested to compare cargo prioritization decisions based on
CPTAP and a naïve distance minimization approach. We find that the cargo prioritization
decision guided by CPTAP model solved by either GA or TS heuristic consistently and
significantly improves the prioritization decision over simply minimizing distance and assigning
disrupted cargoes to their nearest feasible terminals. In summary, the major achievement of the
second contribution is a new TS heuristic proposed as CPTAP solution method and proven to be

206
a better approach than our first attempt to solve the CPTAP using GA method. Several
opportunities exist for extending the work in Chapter 5. First, all experiments conducted in this
contribution use generated instances instead of real-world disruption cases. We recently
documented an inland waterway disruption event on the Arkansas River and are interested in
consolidating the collected data to develop a real-case data set to test the CPTAP TS heuristic.
Secondly, since local search has shown strong potential in solving the CPTAP model, other local
search heuristics could be investigated as alternative CPTAP solution approaches including
simulated annealing, hill climbing, and local beam.
Chapter 6 contains the third major contribution of this dissertation. During our research on the
first two contributions for CPTAP, we identified a need for a systematic methodology to
determine a value decreasing rate to measure the total value loss of disrupted cargo/freight. We
derive a comprehensive methodology employing Value-focused Thinking (VFT) to address this
need. Disruptive events happen on all modes of transportation, and the decision makers are
confronted with the challenge to develop a rigorous cargo prioritization decision models to
prioritize and reroute disrupted cargo/freight, in which the CVDR can be a crucial model
component. We create the CVDR value hierarchy to include all critical values that influence
cargo value loss to guide the evaluation process. One of the important advantages of our VFT
CVDR methodology lies in this value hierarchy that uses the values to guide the practice of
soliciting multiple expert opinions and integrating them to determine CVDRs. We provide the
methodology in a step-by-step manner and include an example based on disrupted inland
waterway barge cargo to clearly illustrate how the proposed methodology works. We develop a
function based on the estimated CVDR range provided by the decision makers to translate the
overall VFT scores to the CVDRs for each alternative and conduct a sensitivity analysis to
207
provide additional insights to the decision makers. To summarize, the third contribution is a
complete and concise methodology to determine CVDRs for transportation systems. It is
particularly helpful for our CPTAP model of the first two contributions that can now contain
well-defined value decreasing rate parameters. Future work related to this contribution is to
develop a more rigorous mapping system to convert the VFT scores directly to CVDRs. We
believe there are multiple ways to perform the conversion process, and it is of interest to
investigate and compare these to our current translation approach. Another opportunity to extend
this work is to apply the VFT CVDR method to cargo prioritization models and evaluate their
influences on the model output. Our developed cargo prioritization model for inland waterway
disruption will be the first attempt to assess VFT CVDRs, followed by applications to cargo
prioritization models in other transportation environments.
In Chapter 7, we present the fourth main contribution of this dissertation. The first three
contributions focus on developing and supporting the mathematical modeling of the cargo
prioritization for inland waterway disruption. However, there are intangible factors affecting the
prioritization decision that cannot be easily incorporated into the pure mathematical formulation.
Thus the fourth contribution contains our first attempt to investigate cargo prioritization problem
through a multi-attribute decision model – the Analytic Hierarchy Process (AHP) – that involves
both tangible and intangible attributes. The output of our AHP model is the prioritization ranking
of the disrupted barge cargo. We construct an AHP decision hierarchy that includes all the
attributes extracted from a literature review of the existing cargo prioritization models and
identified as a good fit to the inland waterway disruption context. A case study of six different
types of cargo carried by barge is used to illustrate the procedures of evaluating attributes and
alternatives in order to derive the cargo prioritization decision. Different from heavily relying on

208
the real-world barge, cargo, and terminal data to draw the prioritization conclusion, the AHP
methodology presented in Chapter 7 turns to the experienced experts (or decision makers) to find
the solution (although we incorporated a limited amount of real data). In addition to provide
another perspective to examine the cargo prioritization problem, the developed AHP
methodology for inland waterway cargo prioritization may be more applicable in some areas or
scenarios where data is not available, missing in large quantity, or cannot be collected in a short
amount of time. Opportunities for the future work exist in testing the developed AHP
methodology in a real waterway disruption response scenario, and developing terminal allocation
approach that assigns the prioritized barge cargo to different terminals.
In addition to the future work discussed above, there are additional extensions to this dissertation
research: 1) CPTAP model improvement. The primary reason that made the current CPTAP
model hard to be solved by an exact approach is the unfixed parameter, the actual contributing
time. By changing the decision variable and/or creating multiple time-related parameters to
replace the actual contributing time, there is the possibility of remove this parameter and
considerably reduces the model complexity. 2) CPTAP heuristic improvement. We have
investigated heuristics that fall into both population search (GA) and local search (TS) categories.
One direction that may further improve the solution is to combine these two search schemes
together, by which we develop a heuristic benefits from both search capabilities. 3) Comparison
of cargo prioritization decisions governed by CPTAP and AHP. Two completely different
theories are behind this two proposed cargo prioritization methods: one is a pure mathematical
model, and the other is a multi-attribute decision model. We are interested in comparing both
approaches and identifying if there is significant disparity between these two models and the
reasons such disparity may exist. One thing to note is that we need determine a solid terminal

209
allocation strategy for the AHP cargo prioritization method before conducting the comparison. (4)
Cargo prioritization decision in other context. All of the models and methods in this dissertation
research are developed under the assumption that public agencies (such as USCG and USACE)
have absolute authority during the disruption management period. In real world scenarios, there
are opportunities for the barge carriers/shippers to determine their actions once the inland
waterway is disrupted and cargo prioritization decision tools should consider the interests of the
carriers/shippers. We have developed a finite-horizon Markov decision process (MDP) model as
the preliminary work in this area, which we will expand in the future.