Displaying Data with Graphs Bar Graph Pi Charts. Categorical Data The values for a categorical...
17
Displaying Data with Graphs Bar Graph Pi Charts
-
Upload
scot-nichols -
Category
Documents
-
view
219 -
download
1
Transcript of Displaying Data with Graphs Bar Graph Pi Charts. Categorical Data The values for a categorical...

Displaying Data with Graphs
Bar Graph
Pi Charts

Categorical Data
The values for a categorical variable are the labels that you attach to it.
The distribution will show either the count or the percent of individuals who fall into each category.

Check your data for consistency!
The counts for each category should sum to be the total.
The percentages should sum to be 100%. Rounding Error – sometimes it’s off a little due to
rounding error.

Frequency Distribution - tells how many are in each category.
Article reported on the physical activity patterns in urban women.
W – Walking T – weight training C – cycling
G – gardening A - aerobics
W T A W G
T W W C W
T W A T T
W G W W C
A W A W W
W T W W T

Relative Frequency Distribution
Category Frequency Relative Freq.
Walking 15
Weight Tr 7
Cycling 2
Gardening 2
Aerobics 4Calculator: Put frequency in L1. Go to top of L2 and type L1/Sum(L1).

Let’s make a Bar Graph
Category Frequency
Walking 15
Weight Tr 7
Cycling 2
Gardening 2
Aerobics 4

What type of car do you drive?

Pi Chart – Circle Graph(Favorite Class)
frequency
Math 66
English 51
Science 45
History 38

Picking the Best Graph
Do the data tell you what you want to know?
Does the graph show what you wanted it to show?
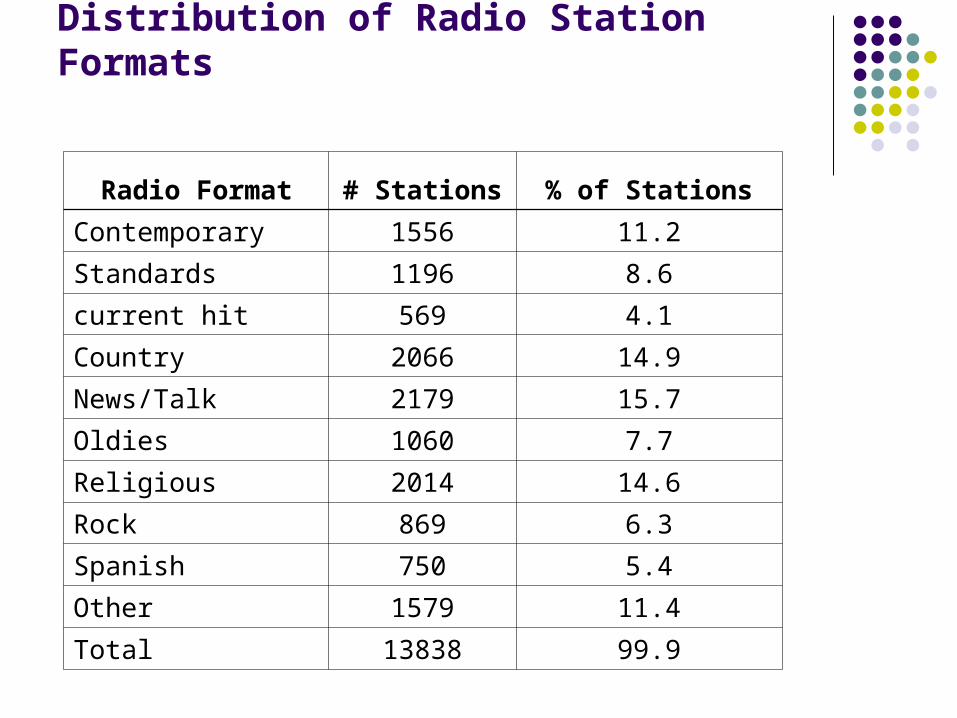
Distribution of Radio Station Formats
Radio Format # Stations % of Stations
Contemporary 1556 11.2
Standards 1196 8.6
current hit 569 4.1
Country 2066 14.9
News/Talk 2179 15.7
Oldies 1060 7.7
Religious 2014 14.6
Rock 869 6.3
Spanish 750 5.4
Other 1579 11.4
Total 13838 99.9

I want to buy radio time to advertise my web site for downloading MP3 music. Which graph is more helpful?
Contemporary
Standards
current hit
Country
New s/Talk
Oldies
Religious
Rock
Spanish
Other
0
500
1000
1500
2000
2500
Series1
You are more interested in counting listeners than # of stations. Thus these graphs are not good for our purpose.

Which graph should I use?
Use a pie graph only when you want to emphasize the category’s relation to the whole.
Otherwise…use a bar graph They are easier to make They are easier to read It’s easier to compare categories

Who owns an MP3 Player
Age Group
% own MP3
12 to 17 54
18 to 24 30
25 to 34 30
35 to 54 13
55 and older 5
Make a well labeled bar graph.
Describe what you see.

Who owns an MP3 Player
Age Group
% own MP3
12 to 17 54
18 to 24 30
25 to 34 30
35 to 54 13
55 and older 5
Would it be appropriate to make a pie chart for these data?
It is not appropriate to use a pie chart for this data since each percent in the table refers to a different age group, not to parts of a single whole.

Graphs: Good or Bad
Beware of pictographs….they can appear to be larger than they really are. Page 11 in book
Watch the scales…it can give a distorted impression of the relative percents. Page 12 in book.

Activity
You will be given data from our survey yesterday.
You need to choose the best graph to represent the data you have…. Dot Plot Bar Graph Pie Graph

Homework
Page 22 (9, 11, 13, 15, 17, 18)