Data Organization, Processing, and Display for a Robust Millimeter
Upload
vuongkhanhCategory
view
214download
0
Display Processing Assessment, Design and Demonstration,
Phase 2 Final Report
Provided to the FAA in response to TASK ORDER PCI CLIN 2005.1.10
June 21, 2001
Status: Final
Document Number: FAA-AP-2000-0615
Network location: \\atmsr15\deptjs11\data\CDGstudy\Phase2\Final Report\DPTO Final Report.doc
Lockheed Martin Air Traffic Management9211 Corporate Boulevard
Rockville, MD 20850

ii
PREFACE
The Phase 2 Final Report is prepared by Lockheed Martin Air Traffic Management (LMATM) for the Department of Transportation, Federal Aviation Administration (FAA), Display System Replacement Program Office. This report documents the results of Phase 2 of the Display Processing Assessment, Design and Demonstration Task Order funded under P3I CLIN 2005.1.10 (Ref. DSR Program Directive PM438B).
The Display Processing Assessment, Design and Demonstration Task Order is documented by the Phase 2 Final Report and the following preceding reports:
Display Processing Assessment, Design and Demonstration, Phase 1 Final Report, dated March 13, 2000.
Display Processing Assessment, Design and Demonstration Phase 2 Plan, dated March 13, 2000.
The Phase 2 Final Report display processing assessment report includes the following:
Description of task objectives
Brief summary of architecture and alternative architecture
Description of prototype development guidelines
Description of the methodology of the functional and the performance testing of the prototypes.
Description of results of the testing of the hardware and software. Evaluations and recommendations are made for the software development products, the hardware video switches and the graphic adapter cards.
Appendixes of objective evidence.
Copyright © Lockheed Martin Air Traffic Management. All rights reserved.

iii
Contents
1 EXECUTIVE SUMMARY........................................................................................ 1
2 INTRODUCTION...................................................................................................... 2
3 TASK OBJECTIVES................................................................................................. 3
3.1 ARCHITECTURE ...................................................................................................... 33.2 EVALUATION ACTIVITIES ....................................................................................... 4
4 PROTOTYPE DEVELOPMENT GUIDELINES .................................................. 6
4.1 TEAM STAFFING ..................................................................................................... 64.2 PROTOTYPE STARTING POINTS ............................................................................... 7
4.2.1 ViewMan ......................................................................................................... 84.2.2 InterMAPhics .................................................................................................. 84.2.3 ODS Toolbox................................................................................................... 8
4.3 DEVELOPMENT AND TEST ENVIRONMENT .............................................................. 94.3.1 Hardware ........................................................................................................ 94.3.2 Software Configuration Overview ................................................................ 104.3.3 Remote Development Methodology .............................................................. 12
4.4 FUNCTIONAL REQUIREMENTS FOR PROTOTYPES .................................................. 124.4.1 Initial DSR Functions ................................................................................... 134.4.2 Final DSR Functions..................................................................................... 15
5 SOFTWARE EVALUATION................................................................................. 16
5.1 PRODUCT USABILITY EVALUATION...................................................................... 165.1.1 Documentation.............................................................................................. 165.1.2 Training......................................................................................................... 175.1.3 Specialized Compilers................................................................................... 185.1.4 GUI Tools...................................................................................................... 195.1.5 Testing Methods ............................................................................................ 205.1.6 Performance Profiling .................................................................................. 215.1.7 Applicability to Real Time ............................................................................ 225.1.8 Preview Capabilities..................................................................................... 235.1.9 Application Modifications............................................................................. 245.1.10 Product Licensing ......................................................................................... 25
5.2 PRODUCT MAINTAINABILITY EVALUATION.......................................................... 265.2.1 Complexity .................................................................................................... 265.2.2 Symbolic Capabilities ................................................................................... 265.2.3 Operating System Porting............................................................................. 265.2.4 Platform Independence ................................................................................. 275.2.5 Availability of Source Code .......................................................................... 275.2.6 Standards Compliance .................................................................................. 275.2.7 Product Cycle................................................................................................ 285.2.8 Product Problem Resolution......................................................................... 295.2.9 Company Viability ........................................................................................ 30

iv
5.3 FUNCTIONAL TESTS.............................................................................................. 315.4 PERFORMANCE TESTS........................................................................................... 32
5.4.1 Timing Measurements................................................................................... 375.4.2 CPU and Memory Measurements................................................................. 435.4.3 Controller Observations ............................................................................... 445.4.4 Performance Test Results Summary ............................................................. 45
5.5 CODING EFFORT ................................................................................................... 465.5.1 DSR Baseline Coding Effort for Annotations and Range View .................... 475.5.2 Coding Effort Conclusions............................................................................ 49
5.6 ALTERNATIVE ARCHITECTURE PROTOTYPE.......................................................... 505.6.1 GUI Runtime Separate from Barco Card Platform ...................................... 515.6.2 GUI Runtime Separate from TechSource Card Platform............................. 535.6.3 Alternative Architecture Summary................................................................ 55
5.7 SOFTWARE EVALUATION SUMMARY .................................................................... 56
6 HARDWARE EVALUATION ............................................................................... 57
6.1 GRAPHICS CARDS ................................................................................................. 576.1.1 Evaluation Summary..................................................................................... 586.1.2 Recommendations ......................................................................................... 60
6.2 VIDEO SWITCHES.................................................................................................. 606.2.1 Evaluation Summary..................................................................................... 606.2.2 Recommendations ......................................................................................... 61
10 APPENDIX I: TEAM WORK EXPERIENCE................................................. 62
20 APPENDIX II: PERFORMANCE RUN MANUAL CHECK LIST .............. 65
30 APPENDIX III: TIMING MEASUREMENTS ................................................ 67
40 APPENDIX IV: TIMING MEASUREMENT STATISTICAL ANALYSIS . 77
50 APPENDIX V: CPU AND MEMORY MEASUREMENTS ........................... 84
60 APPENDIX VI: HARDWARE EVALUATION............................................... 94
60.1 INTRODUCTION ..................................................................................................... 9460.1.1 Support Equipment........................................................................................ 95
60.2 GRAPHICS ADAPTER CARD EVALUATION............................................................. 9660.2.1 Display driven by CDG................................................................................. 9660.2.2 Display driven by TechSource Graphics Adapter Card ............................... 9860.2.3 Display driven by Barco Graphics Adapter Card ...................................... 10060.2.4 Graphics Adapter Card Evaluation and Recommendation ........................ 101
60.3 VIDEO SWITCH EVALUATION ............................................................................. 10260.3.1 TechSource switch ...................................................................................... 10360.3.2 Extron switch .............................................................................................. 11560.3.3 Matrix switch .............................................................................................. 12060.3.4 Video Switch Evaluation Summary and Recommendation ......................... 134
60.4 GRAPHICS CARD ADAPTER MARKET SURVEY .................................................... 134

v
60.5 VIDEO/SERIAL SWITCH (VSS) MARKET SURVEY ............................................... 13860.6 HARDWARE CONFIGURATION............................................................................. 139
70 APPENDIX VII: ACRONYMS........................................................................ 140
vi
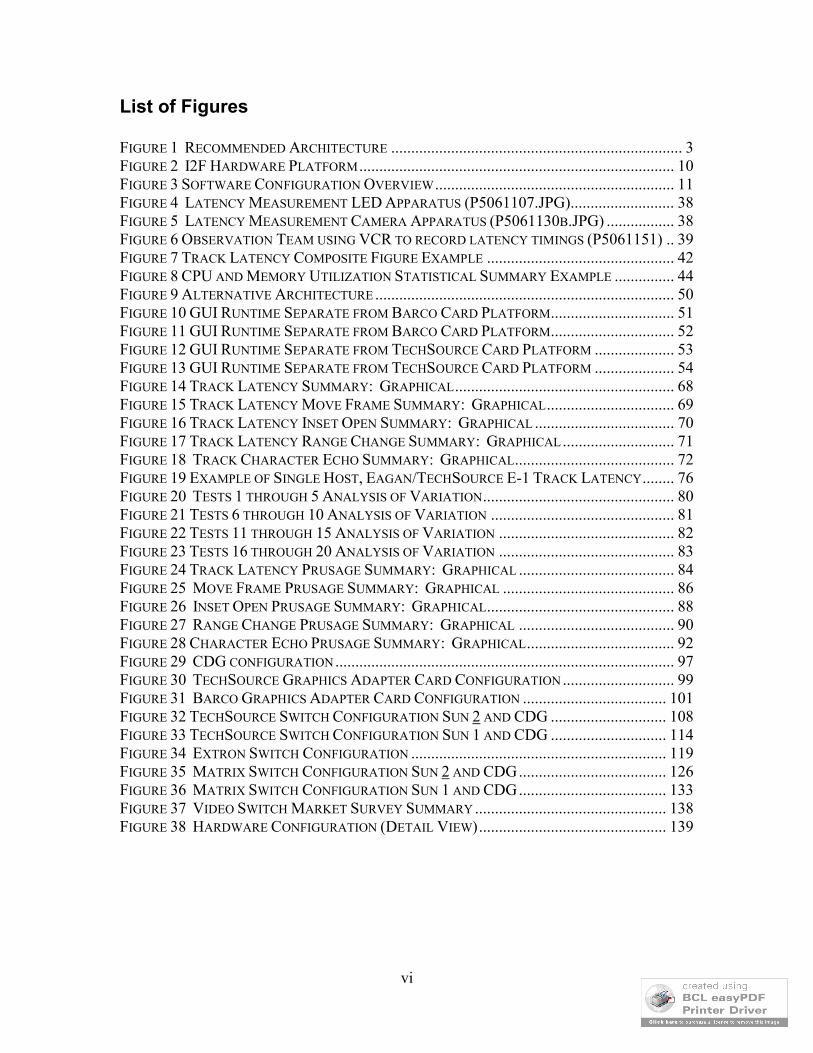
List of Figures
FIGURE 1 RECOMMENDED ARCHITECTURE ......................................................................... 3FIGURE 2 I2F HARDWARE PLATFORM............................................................................... 10FIGURE 3 SOFTWARE CONFIGURATION OVERVIEW............................................................ 11FIGURE 4 LATENCY MEASUREMENT LED APPARATUS (P5061107.JPG).......................... 38FIGURE 5 LATENCY MEASUREMENT CAMERA APPARATUS (P5061130B.JPG) ................. 38FIGURE 6 OBSERVATION TEAM USING VCR TO RECORD LATENCY TIMINGS (P5061151) .. 39FIGURE 7 TRACK LATENCY COMPOSITE FIGURE EXAMPLE ............................................... 42FIGURE 8 CPU AND MEMORY UTILIZATION STATISTICAL SUMMARY EXAMPLE ............... 44FIGURE 9 ALTERNATIVE ARCHITECTURE ........................................................................... 50FIGURE 10 GUI RUNTIME SEPARATE FROM BARCO CARD PLATFORM............................... 51FIGURE 11 GUI RUNTIME SEPARATE FROM BARCO CARD PLATFORM............................... 52FIGURE 12 GUI RUNTIME SEPARATE FROM TECHSOURCE CARD PLATFORM .................... 53FIGURE 13 GUI RUNTIME SEPARATE FROM TECHSOURCE CARD PLATFORM .................... 54FIGURE 14 TRACK LATENCY SUMMARY: GRAPHICAL....................................................... 68FIGURE 15 TRACK LATENCY MOVE FRAME SUMMARY: GRAPHICAL................................ 69FIGURE 16 TRACK LATENCY INSET OPEN SUMMARY: GRAPHICAL ................................... 70FIGURE 17 TRACK LATENCY RANGE CHANGE SUMMARY: GRAPHICAL............................ 71FIGURE 18 TRACK CHARACTER ECHO SUMMARY: GRAPHICAL........................................ 72FIGURE 19 EXAMPLE OF SINGLE HOST, EAGAN/TECHSOURCE E-1 TRACK LATENCY........ 76FIGURE 20 TESTS 1 THROUGH 5 ANALYSIS OF VARIATION................................................ 80FIGURE 21 TESTS 6 THROUGH 10 ANALYSIS OF VARIATION .............................................. 81FIGURE 22 TESTS 11 THROUGH 15 ANALYSIS OF VARIATION ............................................ 82FIGURE 23 TESTS 16 THROUGH 20 ANALYSIS OF VARIATION ............................................ 83FIGURE 24 TRACK LATENCY PRUSAGE SUMMARY: GRAPHICAL ....................................... 84FIGURE 25 MOVE FRAME PRUSAGE SUMMARY: GRAPHICAL ........................................... 86FIGURE 26 INSET OPEN PRUSAGE SUMMARY: GRAPHICAL............................................... 88FIGURE 27 RANGE CHANGE PRUSAGE SUMMARY: GRAPHICAL ....................................... 90FIGURE 28 CHARACTER ECHO PRUSAGE SUMMARY: GRAPHICAL..................................... 92FIGURE 29 CDG CONFIGURATION..................................................................................... 97FIGURE 30 TECHSOURCE GRAPHICS ADAPTER CARD CONFIGURATION ............................ 99FIGURE 31 BARCO GRAPHICS ADAPTER CARD CONFIGURATION .................................... 101FIGURE 32 TECHSOURCE SWITCH CONFIGURATION SUN 2 AND CDG ............................. 108FIGURE 33 TECHSOURCE SWITCH CONFIGURATION SUN 1 AND CDG ............................. 114FIGURE 34 EXTRON SWITCH CONFIGURATION ................................................................ 119FIGURE 35 MATRIX SWITCH CONFIGURATION SUN 2 AND CDG..................................... 126FIGURE 36 MATRIX SWITCH CONFIGURATION SUN 1 AND CDG..................................... 133FIGURE 37 VIDEO SWITCH MARKET SURVEY SUMMARY ................................................ 138FIGURE 38 HARDWARE CONFIGURATION (DETAIL VIEW)............................................... 139

vii
List of Tables
TABLE 1 INITIAL DEMONSTRATION FUNCTIONS................................................................. 14TABLE 2 FINAL DEMONSTRATION FUNCTIONS................................................................... 15TABLE 3 PERFORMANCE TEST VARIATIONS AND CONFIGURATIONS .................................. 34TABLE 4 TRACK LATENCY COMPOSITE TABLE EXAMPLE ................................................. 42TABLE 5 CODING EFFORT FOR THE THREE DEMONSTRATION APPLICATION PROTOTYPES. 46TABLE 6 DSR RANGE VIEW (RDB) METRICS AND NCNB/SLOC RATIO.......................... 47TABLE 7 DSR ANNOTATIONS METRICS AND NCNB/SLOC RATIO ................................... 48TABLE 8 DSR VERSUS APPLICATION PROTOTYPE NON-BLANK, NON-COMMENT LINES ... 48TABLE 9 ALTERNATIVE RESPONSE SUMMARY................................................................... 55TABLE 10 DISPLAY IMAGE QUALITY................................................................................. 58TABLE 11 MAXIMUM HEAP STORAGE USAGE................................................................... 59TABLE 12 TECHSOURCE SWITCH SUMMARY..................................................................... 60TABLE 13 EXTRON SWITCH SUMMARY ............................................................................. 61TABLE 14 MATRIX SWITCH SUMMARY ............................................................................. 61TABLE 15 TRACK LATENCY SINGLE HOST SUMMARY: TABULAR .................................... 73TABLE 16 TRACK LATENCY DUAL HOST SUMMARY: TABULAR ....................................... 74TABLE 17 TRACK LATENCY PRUSAGE SUMMARY: TABULAR........................................... 85TABLE 18 MOVE FRAME PRUSAGE SUMMARY: TABULAR................................................ 87TABLE 19 INSET OPEN PRUSAGE SUMMARY: TABULAR ................................................... 89TABLE 20 RANGE CHANGE PRUSAGE SUMMARY: TABULAR............................................. 91TABLE 21 CHARACTER ECHO SUMMARY: TABULAR......................................................... 93TABLE 22 COTS DISPLAY GENERATOR CHARACTERISTICS ............................................. 137
viii
This page intentionally left blank

1
1 Executive Summary
Software and Hardware alternatives for future use in the DSR R-Position were identified in a previous phase of this task order. Phase 2 studied 3 selected software candidates, 2 graphics cards and 3 video switches. The base capability demonstration was conducted in January 2001 and the final capability demonstration was in May 2001.
Three display application prototypes were developed to a DSR baseline specification subset by three independent LMATM teams: 1) Eagan (ViewMan), 2) Gallium (InterMAPhics), and 3) Orthogon (ODS Toolbox). Two graphics card candidates, each in a Sun processor, were used to with X Windows to replace the DCX with its RGL: 1) TechSource graphics card and 2) Barco graphics card. Three video switches were tested: 1) TechSource, 2) Matrix, and 3) Extron.
Each team developed its own application prototype from a subset of the DSR baseline specifications for the R-Position software. One or more expert consultants for each candidate product supported each team. Development environments used by each of the teams varied from a local environment with collocated team members to a widely distributed environment with team members widely scattered.
All the teams gathered at the I2F for final integration, test and demonstration of the system. The demonstrations conducted for the FAA were open for all teams throughout and were attended by Vendor executives and representatives. Each team (including the product vendor) participated in the verification of data collected on its own product. By the end of the study, each team had become an advocate for its own product.
Study Results: All products underlying the application prototypes are useable. Application prototypes built on any of the underlying products are maintainable. All application prototypes passed the functional tests and were stable throughout. All application prototypes met the performance and storage clip levels. The Eagan and Gallium prototypes demonstrated significantly better CPU utilization
performance than the Orthogon prototype. The Eagan and Gallium prototypes demonstrated good response times and small track
latency times compared with the Orthogon prototype. The Eagan prototype demonstrated the most consistent and smoothest response times. The coding efforts of each of the three candidates appear to be very close. The coding efforts of the candidates are not much better than for the DSR baseline. One application prototype cannot easily be ported from one product to another. Solutions were not sensitive to a single versus dual host environment. Solutions were not sensitive to which graphics card was used. Solutions were not sensitive to Sony MDM versus Barco ISIS flat panel. X Windows (versus RGL) provides an improved development environment. The Matrix and TechSource switches were acceptable; the Extron was not.
2
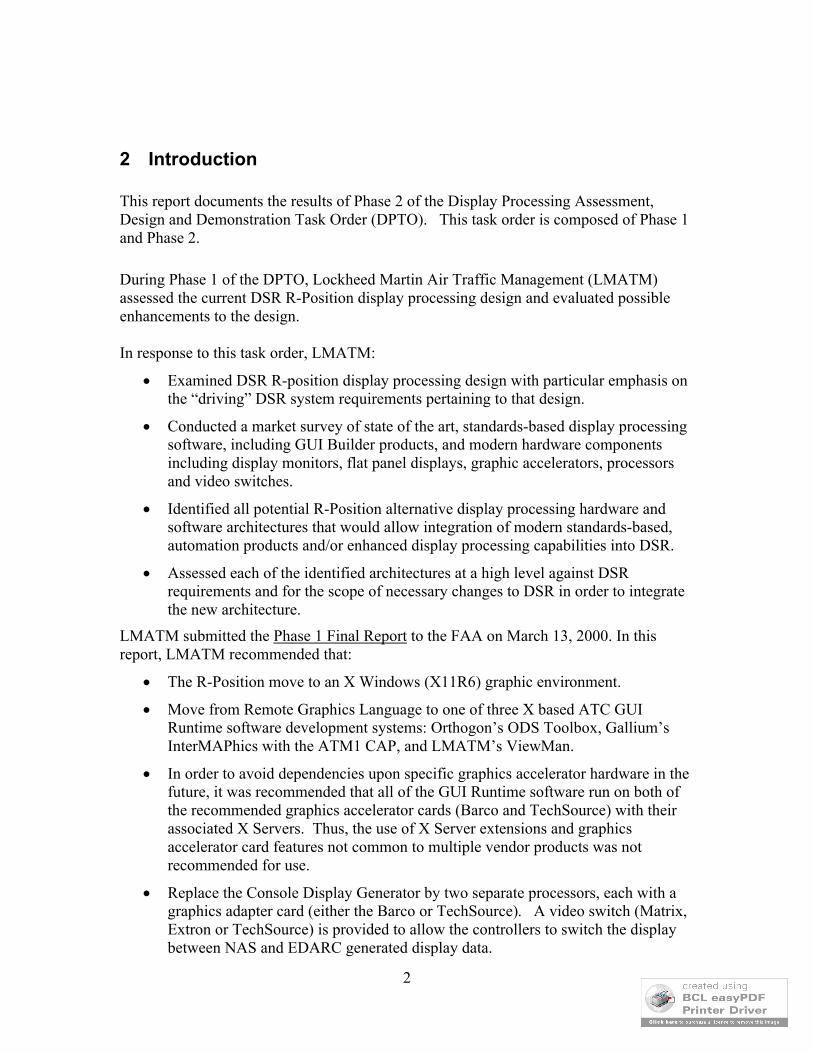
2 Introduction
This report documents the results of Phase 2 of the Display Processing Assessment, Design and Demonstration Task Order (DPTO). This task order is composed of Phase 1 and Phase 2.
During Phase 1 of the DPTO, Lockheed Martin Air Traffic Management (LMATM) assessed the current DSR R-Position display processing design and evaluated possible enhancements to the design.
In response to this task order, LMATM:
Examined DSR R-position display processing design with particular emphasis on the “driving” DSR system requirements pertaining to that design.
Conducted a market survey of state of the art, standards-based display processing software, including GUI Builder products, and modern hardware components including display monitors, flat panel displays, graphic accelerators, processors and video switches.
Identified all potential R-Position alternative display processing hardware and software architectures that would allow integration of modern standards-based, automation products and/or enhanced display processing capabilities into DSR.
Assessed each of the identified architectures at a high level against DSR requirements and for the scope of necessary changes to DSR in order to integrate the new architecture.
LMATM submitted the Phase 1 Final Report to the FAA on March 13, 2000. In this report, LMATM recommended that:
The R-Position move to an X Windows (X11R6) graphic environment.
Move from Remote Graphics Language to one of three X based ATC GUI Runtime software development systems: Orthogon’s ODS Toolbox, Gallium’s InterMAPhics with the ATM1 CAP, and LMATM’s ViewMan.
In order to avoid dependencies upon specific graphics accelerator hardware in the future, it was recommended that all of the GUI Runtime software run on both of the recommended graphics accelerator cards (Barco and TechSource) with their associated X Servers. Thus, the use of X Server extensions and graphics accelerator card features not common to multiple vendor products was not recommended for use.
Replace the Console Display Generator by two separate processors, each with a graphics adapter card (either the Barco or TechSource). A video switch (Matrix, Extron or TechSource) is provided to allow the controllers to switch the display between NAS and EDARC generated display data.
3
Just by completing the market surveys of these products, it was not clear that each of the recommended products could meet all DSR R-Position requirements. Accordingly, Phase 1 recommended that Phase 2 prototype and evaluate the architecture, software products and hardware products.
3 Task Objectives
Phase 2 of the Display Processing Task Order evaluated the viability of the recommended architecture and products documented in the Phase 1 Final Report. To accomplish this task, hardware components and GUI builder candidates were evaluated by performing a set of prototype development, demonstration and analysis activities using those products.
This section discusses the proposed system architecture and then summarizes the Phase 2 evaluation activities.
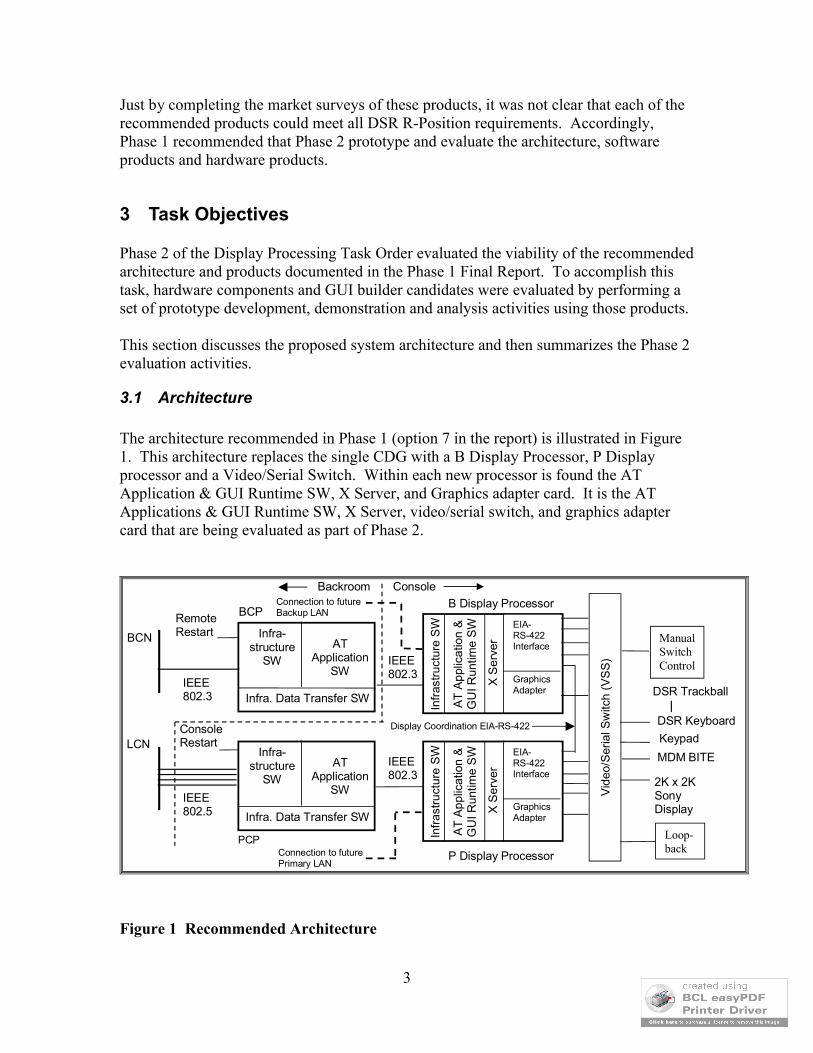
3.1 Architecture
The architecture recommended in Phase 1 (option 7 in the report) is illustrated in Figure 1. This architecture replaces the single CDG with a B Display Processor, P Display processor and a Video/Serial Switch. Within each new processor is found the AT Application & GUI Runtime SW, X Server, and Graphics adapter card. It is the AT Applications & GUI Runtime SW, X Server, video/serial switch, and graphics adapter card that are being evaluated as part of Phase 2.
IEEE802.3
BCP
PCP
LCN
BCN
IEEE802.3
B Display Processor
X S
erv
er
RemoteRestart
MDM BITE
Keypad
DSR Keyboard
2K x 2KSonyDisplay
ConsoleRestart
Backroom Console
DSR Trackball
EIA-RS-422Interface
GraphicsAdapter
AT
Ap
plic
atio
n &
GU
I Run
time
SW
Vid
eo/S
eria
l Sw
itch
(VS
S)
Display Coordination EIA-RS-422
Connection to futurePrimary LAN
Connection to futureBackup LAN
ManualSwitchControl
Loop-back
P Display Processor
IEEE802.3
Infr
astr
uctu
re S
W
ATApplication
SW
Infra-structure
SW
Infra. Data Transfer SW
ATApplication
SW
Infra-structure
SW
Infra. Data Transfer SW
X S
erv
er
EIA-RS-422Interface
GraphicsAdapter
AT
Ap
plic
atio
n &
GU
I Run
time
SW
Infr
astr
uct
ure
SW
IEEE802.5
Figure 1 Recommended Architecture

4
The key advantages of this option over the other options listed in Phase 1 report include:
Extensibility: When the BCN and LCN LANs are replaced, the BCP and PCPs are eliminated allowing the LAN to connect directly to the B or P Display Processor.
Reliability: The CDG single point of failure is eliminated. Using the predicted reliability for the DSR equipment and video switch and allocated values for the new processors, the overall predicted R position MTBF for interruptions greater than 6 minutes is 5,600 hours, which is less than the 7,500-hour MTBF DSR requirement. However, when the PCP and BCP connect directly to the new networks, the MTBF of the R position increases to 8,700 hours.
Ease of Transition: - Does not require porting of old infrastructure software to new processors - Does not require any new cabling of the network hardware
Hardware Cost: Only two new processors per console versus three in other options
The main disadvantage of this option is that the two display processors in this architecture would temporarily require more space in the console than the current design since one of the transitions retain the CDG for fallback to a baseline display channel configuration.
These advantages and disadvantages are described in detail in the section 7.2.1 of the Phase 1 Final Report.
3.2 Evaluation ActivitiesThe Phase 2 activities were:
GUI Builder Development Evaluations- Evaluate the three candidate GUI builder products (Gallium InterMAPhics,
Orthogon ODS Toolbox and LMATM ViewMan) in the context of developing baseline DSR CHI capabilities for the R-Position. Characteristics of the development environment for these products, such as ease of use, productivity, performance, testability, limitations, etc. were assessed.
- Evaluate the three GUI builder product candidates in the context of rapidly prototyping advanced CHI capabilities that build upon the base DSR R-Position CHI. Characteristics of the development environment for these products were assessed.
GUI Prototype Demonstrations- Evaluate the results of these development activities by performing
demonstrations of both existing DSR R-Position CHI capabilities (Initial Demo) as well as advanced CHI capabilities that extend the baseline DSR R-Position CHI (Final Demo).
- Evaluate the hardware-independence of the GUI builder products (all should depend solely on industry standard X Windows) by performing these
5
demonstrations using each of the three GUI builder products with each of the two candidate graphics adapters.
Hardware Component Evaluations- Evaluate each of the candidate graphics adapters and associated X Servers.
- Evaluate Video/Serial Switch (VSS) components.
- Display the output of both the Console Display Generator and graphic adapter cards on a Barco 20 x 20 ISIS flat panel. This activity was not originally planned for phase 2. Observations of the flat panel behavior are found in section 5.4.3.
System Measurements- Evaluate the performance and resource utilization characteristics by
performing a set of system measurements on each of the twenty configuration combinations for each of the three GUI builder candidates under stress scenario conditions.
Alternative Architecture Demonstration- Re-configure the demonstration environment to match the Option 9
architecture (refer to sections 8.2 of the Phase 1 report and 5.6 of the Phase 2 report). Perform a subset of the above demonstrations and system measurements on this configuration in order to obtain comparative data for the two architecture options.
Phase 2 of DPTO began on August 3, 2000 when Phase 2 of the task order was funded. LMATM procured the software and hardware and worked with the I2F Lab support staff to have them installed at the I2F facility in Atlantic City. The goal was to maintain the system at the I2F and work remotely from the various team sites.
In parallel with the installation effort, each of the three prototype teams was organized and began product training. In addition, the newly installed systems at the I2F were configured and the set of DSR requirements to be implemented for the January Demonstration by each team was identified.
Each prototype team worked to implement the requirements and demonstrate the basic DSR function at the I2F at an Initial Demonstration held January 24th to 26th, 2001. A functional test was performed to ensure that the each team provided the basic functions.
After the completion of the Initial Demonstration, a prioritized set of desired required functions for the Final Demonstration were agreed between the FAA and LMATM. In addition to these functions, a performance ‘clip level’ was identified that had to be achieved by each team for that product to remain in the evaluation.
The Final Demonstration was held at the I2F from May 1st to May 9th, 2001. On May 1st, the graphics cards and video switches were evaluated. Between May 3rd and May 6th, both functional and performance tests were performed on the prototypes. On May 8th and 9th, a demonstration of all three prototypes was provided to the FAA.

6
4 Prototype Development Guidelines
This section describes the mechanics of running the evaluations. The guidelines helped ensure a level playing field for each of the teams.
Team Staffing:This section discusses the staffing of each team and the relationship between the vendor and the team members.
Prototype Starting Point:This section considers the prototype starting point for each team. For example, did each team start with an existing prototype or was the prototype developed from ‘scratch’?
Development and Test EnvironmentThis section describes the development and test environment used by each team. In addition, this section describes the methods that the teams used to develop the prototypes remote from the actual hardware. Remote development was necessary since none of the team members were located at the I2F.
Functional Requirements for PrototypesThis section describes the methods that were used to identify functions and requirements for each prototype to implement. In addition, the set of requirements for the Initial and Final Demonstrations are described.
4.1 Team StaffingThe Phase 2 prototyping activities utilized a team of approximately 10 developers throughout the period of performance. Since some of the development activity was common to all three GUI builder environments, a Common Team was responsible for those tasks that involve cross-product applicability. The product-specific tasks were accomplished with independent teams of two to three developers plus a product consultant dedicated to each product. (See 10 Appendix I: Team Work Experience for information about the members of each team.)
1) Overall Lead: This person had the responsibility for cost, schedule and technical performance of all tasks associated with Phase 2 of the task order and acted as the primary liaison with the customer.

7
2) Software Chief Designer: This person worked with the four development teams and provided technical guidance for the development activities, ensuring consistency across the various demonstrations.
3) Common Team: This team developed the aprobes, data communications server and client, keyboard driver and the scenarios for functional and stress tests. The common team also provided support for performing system measurements, supported by each of the product teams.
4) InterMAPhics Team: This team developed, integrated, and demonstrated the R-Position Application Prototype using the Gallium Software InterMAPhics product.
5) ODS Toolbox Team: This team developed, integrated, and demonstrated the R-Position using the Orthogon ODS Toolbox product.
6) ViewMan Team: This team developed, integrated, and demonstrated the R-Position Application prototype using the LMATM Eagan ViewMan software.
During Phase 2, a weekly telecon was held to discuss issues that were of common interest to all of the teams. All team members and vendor consultants were invited to this telecon. In addition, there was a common repository for all shared information, such as DSR fonts, appropriate DSR code or question and answer information, located on shared drives in Rockville as well as on the Sun machines at the I2F.
System timing measurements for track latency and character echo response times were collected with assistance from Bill Bergman of LMATM Eagan. Mr. Bergman provided the equipment and expertise that resulted in the timing measurements discussed later in the report. In addition, John Trueblood, an independent consultant, provided expertise in the execution of the Final Demonstration, and the collection and analysis of the system timing data, CPU utilization data and report conclusions.
The expert support and assistance provided by the staff of the I2F was indispensable to the success of this project. Special thanks is due to Stephan Souder of the FAA and Tom Morell of LMATM for handling equipment configuration, system administration, liaison with hardware vendors to expedite emergency hardware repairs and for carrying out regular system backups of all our work. Special thanks also to Hilda DiMeo of the FAA for the excellent coordination and scheduling of laboratory facilities and equipment.
4.2 Prototype Starting PointsIt was planned that each team would start with an existing prototype on which to build the DSR Application prototype. By starting at this point, it was quite feasible to complete the basic functionality for the Initial Demonstration. However, this was not the case. Only InterMAPhics had a prototype product to start from, as discussed below.In all cases a new DPTO common front end was added that processed a subset of those messages that Host Format Conversion (HFC) processed.
8
4.2.1 ViewManThe ViewMan prototype was built from the ground up to satisfy the allocated DSR requirements. This prototype utilized a new multi-threaded design that was based on similar designs that are in use today. Both the ARTS Color Display and the MicroEARTS Controller Workstation utilize the ViewMan libraries and are used operationally throughout the FAA.
4.2.2 InterMAPhicsThe Civil Aeronautical Medical Institute (CAMI) demonstration prototype was used as the basis for the team. The CAMI prototype was an advanced DSR simulator that had much of the look and feel of the DSR system.
However, significant modifications to the CAMI prototype were made to conform to the DSR requirements. For example, target processing did not exist in the CAMI prototype and had to be implemented from scratch.
4.2.3 ODS ToolboxIt was planned that the Desiree demonstration prototype was to be used as the starting basis for this team. This FAA Human Factors Lab prototype was an advanced DSR simulator that had much of the look and feel of the DSR system.
However, the Desiree prototype was not made available for the team’s use. Thus the Orthogon team had to begin the program without a product to build upon. The following modifications to the Orthogon effort were made:
- The Orthogon training class period was increased from 2 weeks to 3 weeks
- A third LMATM person from the common team was assigned to work full time on the Orthogon team
- The level of effort purchased from Orthogon was increased from 1 month to 3 months.

9
4.3 Development and Test EnvironmentThe development and test demonstration environment was composed of hardware and software located at the Integration & Interoperability Facility (I2F). Most of the setup was accomplished at the beginning of Phase 2 and remained constant and stable throughout the entire development period including:- Hardware configuration,- Network connectivity, - COTS software installation and license management, - Periodic system backups,- Protection for each team’s work product.Once the hardware and software were installed at the I2F, that configuration supported both the development and demonstration activities without modification.
In addition, the methodology for remote access to the set of hardware and software at the I2F for development purposes is discussed in section 4.3.3.
4.3.1 Hardware The hardware configuration at the I2F, as illustrated in Figure 2, was used to develop and demonstrate the essential elements of the recommended architecture.
Three Sun hardware platforms were connected to one of the Primary Console Processors (PCP) and to each other by a 10 Mbps ethernet. Sun 1 had a TechSource graphics card and Sun 2 had a Barco graphics card installed. These graphics cards were connected to the Sony MDM via one of the candidate video switches. The Sun platforms were interconnected by fast (100 Mbps) ethernet. Both Sun 1 and 2 had dual EIA-RS232 interfaces that were used in conjunction with an RS232 to RS422 converter to attach a DSR keyboard/trackball.
Driven by local simulation data, the baseline DSR PCP hardware/software demonstrated DSR behavior on the left R console, using RGL on the DCX.
Recorded data was extracted from the PCP and sent to one or two Sun processors for display on the right R console. The new PCP/BCP application and GUI runtime software was run in the same processor with the graphics adapter card and X Server.
The configurations of the new hardware/software were demonstrated using the Sun platforms, the Sony MDM and Keyboard/Trackball R-position console on the right side of Figure 2 below. This approach allowed for side-by-side viewing of the baseline and new hardware and software.
Note that the serial connection between processors was not used by the software to demonstrate the coordination of display controls between the two processors.

10
VEM CDGPCP
Keyboard/Trackball
VEM CDGPCP
Keyboard/Trackball
MaintenanceLAN
LCN 4 TokenRings
RConsole
SonyMDM
SUN-1
Tech-Source
Graphics
New SystemDisplay
Runtime Data
RConsole
Fast Ethernet
BarcoGraphics
SonyMDM
Existing SystemDisplay
(for comparison)
SerialSwitch
VideoSwitch
SerialSwitch
VideoSwitch
SUN-2SUN-3serial connection
Figure 2 I2F Hardware Platform
4.3.2 Software Configuration Overview
Figure 3 maps the software for the demonstrations to the hardware configuration. New software that is not totally CAS or DSR baseline is shown with a bold outline. These new or modified components are:
SITS/DIT: This component injected commands and data into the Baseline DSR AT Application software in the PCP using the DSR baseline infrastructure software by processing scenario files. Only DIT (Data Injection Tool) was used.
Data Com Server: This component sent time stamped copies of Host Data to Data Com Clients. For the performance evaluations, Perfserver rather than Data Com Server was used to drive the system.

11
Data Com Client: This component routed Host Data and Commands received from a Data Com Server to one of the new AT applications/GUI run-time SW implementations. No commands were sent from the GUI components to the Host.
New AT Application: This component processed Host Data and Commands, replacing Host Format Conversion (HFC). HFC is the major DSR application that provides the R-Position functionality. The application did not include processing of WARP weather data, replacing WARP Display Application (WDA). An EDARC Format Conversion (EFC) replacement was not planned for the prototype.
GUI run-time SW: A candidate product was used in conjunction with one instance of the new AT Application software to meet the demonstration requirements. This largely replaced the DSR Display Services functionality.
Kbd driver: Software necessary to interface the DSR keyboard /trackball to the X Server in the SUN. The software did not determine the setting of the EIA-RS-422 loopback in the task order, per the original task order plan.
R Console
DCX
RGL Server
PCP
Infrastructure SW
Base ATapplication
SW
DisplayServices
SITS/DIT
DataCom
Server
Aprobes
SUN-2
BarcoGraphics Adapter
Xserver Kbd driver
RS422
Xlib
GUI Run-time SW
new AT Application
Data Com Client
SUN-1
Tech-SourceGraphics Adapter
Xserver Kbd driver
RS422
Xlib
GUI Run-time SW
new AT Application
Data Com Client
SUN-3
Xlib
GUI Run-time SW
new AT Application
Data Com Client
Video Sw
Sony MDMKeyboardTrackball
Serial SwR console
CDG replaced by Two Display Processors (Option 7)
IEEE802.3
BCP
PCP
LCN
BCN
IEEE802.3
B Display Processor
Xse
rver
RemoteRestart
MDM BITE
Keypad
DSR Keyboard
2K x 2KSonyDisplay
ConsoleRestart
Backroom Console
DSR Trackball
RS-422Interface
GraphicsAdapter
AT
App
licat
ion
&G
UI R
untim
e S
W
Vid
eo/S
eria
l Cha
nne
l Sw
itch
Display Coordination RS-422
Connection to futurePrimary LAN
Connection to futureBackup LAN
ManualSwitchControl
Loop-back
P Display Processor
IEEE802.3
Infr
astr
uctu
re S
WAT
ApplicationSW
Infra-structure
SW
Infra. Data Transfer SW
ATApplication
SW
Infra-structure
SW
Infra. Data Transfer SW
Xse
rver
RS-422Interface
GraphicsAdapter
AT
App
licat
ion
&G
UI R
untim
e S
W
Infr
astr
uctu
re S
W
IEEE802.5
Figure 3 Software Configuration Overview

12
4.3.3 Remote Development Methodology
The systems at the I2F were accessed remotely from Rockville MD, Vancouver Canada, Atlantic City NJ, Bremen Germany, Seattle WA and Eagan MN. The three prototype teams each used this equipment differently during development:
Eagan (ViewMan) team – developed their Application prototype on similar equipment in Eagan, Minnesota. Although the connections were available, the team seldom accessed the I2F Sun machines remotely from Eagan.
Gallium (InterMAPhics) team – developed their Application prototype on Sun3. Two team members accessed Sun3 remotely from desktops in Rockville, MD while the Gallium consultant used a remote dial-up connection from Vancouver Canada.
Orthogon (ODS Toolbox) team – developed their Application prototype on Sun3 and on similar equipment in Germany. Two team members accessed Sun3 remotely from desktops in Rockville, MD, another from his office at the WJHTC. The Orthogon consultants worked primarily in Germany, exchanging copies of prototype software daily between the I2F and Germany. HMI personnel in Smithville, NJ facilitated communications between the I2F and Germany.
A developer, working remote from the I2F, was able to develop and test on any of the Sun machines with the display exported back to the developer’s desktop. This method proved very satisfactory for testing of functionality, but obviously presented some performance problems during stress workload scenarios. A few weeks prior to each demonstration, team members traveled to the I2F to complete the integration and test of each prototype.
4.4 Functional Requirements for Prototypes
It was neither feasible nor necessary to build a prototype of all baseline DSR R-Position CHI capabilities during DPTO Phase 2. Instead, an appropriate subset of capabilities was identified, implemented and verified during the Initial Demonstration in January and again during the Final Demonstration in May.
Once the capabilities were identified, the set of B level Requirements associated with those capabilities was identified from the HFC System Requirement Specification, or in the case of the Final Demonstration, from DSR Change Requests or engineering white papers. The B levels were entered into a spreadsheet and kept constant for the period of implementation, with few exceptions. In preparation for the functional testing for both the Initial and Final Demonstrations, the test criteria for the requirements were identified and recorded in the spreadsheets.

13
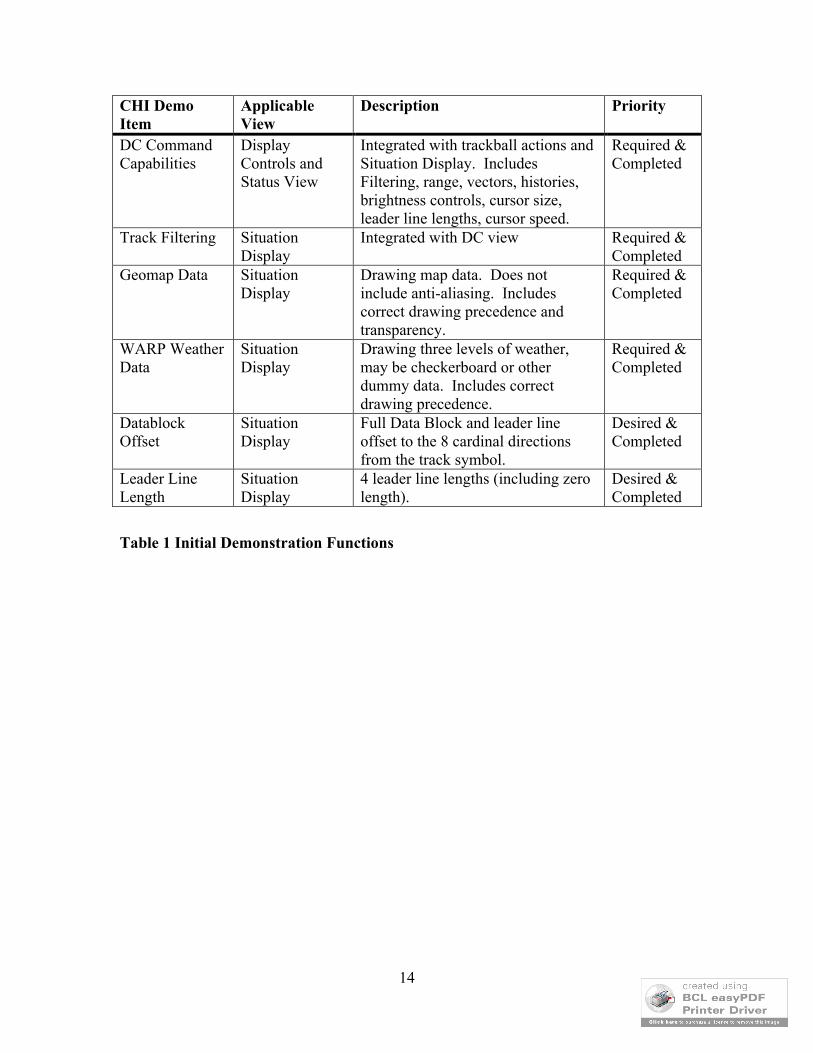
4.4.1 Initial DSR FunctionsThis set of capabilities for the Initial Demonstration is listed below in Table 1. Since the capabilities are similar between the Host and EDARC systems, only the Host side was included in the capability demonstrations.
CHI Demo Item
Applicable View
Description Priority
General Drawing Characteristics
All Draw all items so that they have the same appearance as their baseline DSR CHI counterparts. Includes fonts, line styles, fill patterns, color schemes, etc. but does not include anti-aliasing.
Required & Completed
Drawing Precedence and Transparency
All Draw all items opaque / transparent and above or below other types of data as appropriate.
Required & Completed
Basic View Manipulation
All Display views, Move, Expand / Collapse views as in DSR.
Required & Completed
Basic Trackball Capabilities
All Trackball cursor and button actions including wrapping, cursor size, shape, and placement in conjunction with key or button actions.
Required & Completed
Keyboard Inputs
R-CRD Keystroke echoing, key actions (cursor movement, etc.).
Required & Completed
Target Data Situation Display
Draw with correct symbols and placement.
Required & Completed
Target Histories and Aging
Situation Display
Draw with correct number of histories, aging.
Required & Completed
Track Data Situation Display
Draw with correct symbols and placement.
Required & Completed
Full Data Blocks (FDBs)
Situation Display
Three-line full data block content, leader lines to NE of track symbol.
Required & Completed
Basic Command Composition
R-CRD Message Composition Area, Keyboard inputs, Trackball Pick processing (partial).
Required & Completed
Basic Command Feedback
R-CRD Feedback Area and Response Area. Required & Completed
Pick Precedence All Implement trackball pick precedence rules as in the DSR CHI.
Required & Completed
Basic DC View Capabilities
Display Controls and Status View
Display DC View, including panels and buttons, panel display/removal management, button highlighting.
Required & Completed
14
CHI Demo Item
Applicable View
Description Priority
DC Command Capabilities
Display Controls and Status View
Integrated with trackball actions and Situation Display. Includes Filtering, range, vectors, histories, brightness controls, cursor size, leader line lengths, cursor speed.
Required & Completed
Track Filtering Situation Display
Integrated with DC view Required & Completed
Geomap Data Situation Display
Drawing map data. Does not include anti-aliasing. Includes correct drawing precedence and transparency.
Required & Completed
WARP Weather Data
Situation Display
Drawing three levels of weather, may be checkerboard or other dummy data. Includes correct drawing precedence.
Required & Completed
Datablock Offset
Situation Display
Full Data Block and leader line offset to the 8 cardinal directions from the track symbol.
Desired & Completed
Leader Line Length
Situation Display
4 leader line lengths (including zero length).
Desired & Completed
Table 1 Initial Demonstration Functions

15
4.4.2 Final DSR Functions
The functional content of the Final Demonstration was identified shortly after the Initial Demonstration completed. The selection criterion for these functions was based on the schedule and the anticipated direction of future DSR developed functionality. In general, the new functionality added data associated with track data blocks to the situation display. Also, since performance of the resulting system was important, functions such as LDBs and insets were added which created heavy additional system loading.
The implementation of the set of functions was prioritized to ensure that the most important functions were implemented first. This set, agreed to by both LMATM and the FAA, is listed in Table 2.
CHI Demo Item
View Description and Rationale for Inclusion Priority
Limited Data Blocks
SN All DSR LDB function.LDBs produce a significant load on the DSR system
(1 ) Required & Completed
Range Data Blocks(RDB)
SN A subset of RDB functions was required. A limited syntax to create and control the RDBs was implementedRDBs added data to the track data block and added a new view (RDB List)
(2) Required & Completed
FDBDwell
SN Track Data Block dwell, not user dwellDwell added features to the track data block
(3)Required & Completed
Insets SN A simple inset implementation was required. This inset was suppressible, movable, was opaque to data displayed on the situation display, and had pick and draw precedence. The inset was not resizable.Controllers desired insets and an inset can produce significant load on the DSR system
(4) Required & Completed
Annota-tions
SN A subset of Annotation function was required. Lines and rectangle annotations were not requiredAnnotation function added a toolbar and provided graphics functions to the SN view
(5)Required & Completed
Table 2 Final Demonstration Functions
The methods used to ensure that each team successfully implemented the functions are described in section 5.3 Functional Tests.

16
5 Software Evaluation
5.1 Product Usability EvaluationAt the end of the Phase 2 development and integration, a Vendor Questionnaire was distributed to the vendor teams, requesting summaries of the experiences with each Vendor’s product. The responses are summarized by questionnaire topic and vendor product.
5.1.1 DocumentationThe following characteristics each of the product’s documentation were evaluated: Online Searchable Cross-referenced Accuracy Completeness Clarity Currency Diagnostic Error Messages Multi-lingual capabilities
5.1.1.1 Eagan (ViewMan)Strengths – None.
Weaknesses – ViewMan documentation is sketchy, at best. Currently, a programmers user guide does not exist. A ViewMan Reference Manual exists that provides an alphabetized listing of each of the API calls. It refers to, but does not elaborate on the related type definitions. This is backed by a small set of power-point charts and an example program used in the training course. The existing documentation, though limited, is accurate and current. Sample code used in the training course serves as a minimal user’s guide. The documentation must be considered incomplete, not indexed and not cross-referenced.
5.1.1.2 Gallium (InterMAPhics)Strengths – Documentation is provided in PDF format on CDROM as well as in printed form. It serves as a well-organized excellent set of reference material. The PDF form is online searchable with some hyperlinks throughout to aid in navigation. The documentation is accurate, complete, clearly written and up-to-date for the release used on this project. The Sample Application User’s Guide introduces InterMAPhics. A series of Getting Started manuals introduce different parts of the product. Multi-lingual capabilities are available upon request.
Weaknesses – Indices would be a useful addition to the InterMAPhics API and DDL reference manuals. More hyperlinks would also be useful. The AirOps Programmer’s Guide is good as a reference manual but somewhat lacking as a Programmer’s Guide. Diagnostic error messages from compilations and from run-time execution could be improved.

17
5.1.1.3 Orthogon (ODS Toolbox)Strengths – Documentation is provided in machine format as well as in printed form. It serves as a well-organized excellent set of reference material. The machine form is online searchable. Very extensive hyperlinks occur throughout and the documentation browser has excellent features for qualified searches, bookmarks, cross-references and indices. The documentation is accurate, complete, clearly written and up-to-date for the release used on this project. The documentation is useful both as reference material and as a user’s guide. Diagnostic Messages for compilations and run-time facilities areexcellent. Multi-lingual capabilities are extensive.
Weaknesses – None.
5.1.2 TrainingThe following characteristics of each product’s training were evaluated:
Teaching staff knowledgeable in product and air traffic management Relevance of course content to air traffic management Relevance of class exercises to air traffic management Accuracy of course material Course availability.
5.1.2.1 Eagan (ViewMan)Strengths – Two members from the ViewMan prototype team were available to attend the two-day course for ViewMan. This is a new course and has been given twice in Eagan, MN. An instructor thoroughly familiar with ViewMan and its application to US ATM taught the course. The class materials and exercises were well organized and relevant to ATM. The course material was accurate.
Weaknesses – The course availability is minimal and needs to be expanded. ATM Course materials are limited, consisting of an API Reference Manual, the ViewMan API prototype definition code, a power-point slide presentation and small demo application program used as a tutorial basis.
5.1.2.2 Gallium (InterMAPhics)Strengths – A team of 3 attended a two-week class in Ottawa taught by Brad Jessup, an excellent instructor from Gallium. The instructor was thoroughly familiar with the product and with US ATM. The class materials and exercises were well organized and relevant to ATM. Hands-on tutorials were well paced providing a good match to the needs of the team members. Courses can be given at the customer’s site if needed but, to be effective, the product should be available at the training site.
Weaknesses – The only (minor) weakness was the large number of “typo” errors in the course materials.
18
5.1.2.3 Orthogon (ODS Toolbox)Strengths – A team of 4 attended a three-week class in Smithville, NJ, taught by Bernd Meyer, an excellent instructor from Orthogon. The instructor was thoroughly familiar with the product and with ATM. The class materials and exercises were well constructed and relevant to ATM. Courses can be given at the customer’s site if needed but, to be effective, the product should be available at the training site.
Weaknesses – Much greater emphasis is needed on data handling/formatting techniques, development of C/C++ extensions, and performance issues.
5.1.3 Specialized CompilersSpecialized compilers are intended to reduce the amount of work to be done, thereby increasing productivity and to reduce the amount of time required in the build process. During development, small changes can be made and tried out without requiring full system rebuilds.
The importance of the specialized compilers will be according to the amount of the implementation that used the compiler. Value is added where the amount of work required for a capability implementation is reduced and where build process timesavings occur. Value is lessened where compiler diagnostics are poor or compilers generate incorrect results.
5.1.3.1 Eagan (ViewMan)Strengths – No specialized compilers are required to build an application using the ViewMan library. The ViewMan library itself can be compiled and built with any COTS C compiler available. While ViewMan has no dependencies on specialized compilers, it is compatible with standard development, debug and support tools available for C and X-windows development.
Weaknesses – No value is added from any specialized compilers or tools.
5.1.3.2 Gallium (InterMAPhics)Strengths – InterMAPhics provides both a C/C++/Ada API as well as a Data Definition Language (DDL) used to define the look and feel of the entire application. DDL is an ASCII text language used to define the look of all graphics in the InterMAPhics application, all user interactions with graphical objects on the display, and the rules linking all application C++ classes. Four specialized compilers exist to compile each kind of DDL into binary datasets that are loaded by the application at runtime. This process facilitates rapid changes to the look and feel of the application.

19
Weaknesses – Each DDL has a slightly different structure that can be confusing. Compiler diagnostics could be improved. Errors in spacing in DDL statements can cause incorrect results with no compiler warnings. The first implementation of target processing in the Application prototype attempted to use the “Plot” facilities within AirOps (originally designed for Military Air Defense applications). These built-in classes did not match DSR functional requirements well enough to be used. To achieve DSR function and performance, target processing was re-coded in C++ using the InterMAPhics C-API and some STL (Standard Template Library) classes. This implementation worked very well.
5.1.3.3 Orthogon (ODS Toolbox)Strengths – The major productivity advantage of the ODS Toolbox is its multi-layered development model that is centered around a run-time kernel, off-line editors (the Interface Editor System (IES)) and a dedicated programming language. The ODS Toolbox rule language, loaded at runtime, can be interpreted or compiled to a binary form for faster loading and execution. The ODS Toolbox greatly simplifies the definition, creation, and configuration of dialog- and ATC-related objects and is well suited for an event-based system. The rule language supports modularization and is extensible with C, C++ or Ada. Also, this study chose C++ as the implementation language for the NAS interface and target processing.
The ODS Toolbox provides a rich C-API, allowing for easy translation of rule code into equivalent C/C++ for any areas identified as needing improved performance. Because this interface allows access to all the objects and services available to the rule language, such changes can typically be accomplished easily with minimal impact to other existing rule code.
The ODS Toolbox includes several compiler utilities that produce binary dialog files, interface files, or rule extenders. Compiler and run-time diagnostics from these specialized compilers were excellent.
Weaknesses – Execution of rule language statements is slower than execution of C/C++ code. While resultant performance is adequate for much of the deliverable DSR functionality and for rapid prototyping, selected time-critical and/or frequently executed functions need to be translated into C/C++.
In the application developed for this study, post-demonstration analysis by Orthogon has shown that a vast majority of the rules had adequate performance. For the rules requiring translation for performance, about half were done prior to the demonstration. The translation of the remaining half is a small effort that should yield significant performance improvements.
5.1.4 GUI ToolsThis criterion evaluates the applicability of the tools of the candidate product to visually develop and evaluate a problem solution. The solution developed using the GUI tools should carry over into the eventual final implementation.

20
5.1.4.1 Eagan (ViewMan)Strengths – ViewMan is a graphic library with a C API. ViewMan allows total control of the look and feel of the display by the developer. GUI tools can be helpful in prototyping display solutions, but for the development of ATC display applications, GUI tools used without considering performance and storage can be a hindrance to the developer. GUI tools have not been necessary for any of the products developed with ViewMan. However, because it is a powerful and efficient graphical library, a GUI tool built using ViewMan would be a possibility.
Weaknesses – ViewMan is a graphics library and currently provides no GUI Tools.
5.1.4.2 Gallium (InterMAPhics)Strengths – None.
Weaknesses – No GUI tools were found that were applicable to the prototype demo required functionality.
5.1.4.3 Orthogon (ODS Toolbox)Strengths – The ODS Toolbox consists of editors for the configuration of operational display systems and runtime kernel libraries to drive those systems. The only one used was the “IES” editor for layout and rules since the map editor and communication editors did not apply. Other visualization tools did not seem to be applicable.
Weaknesses – No GUI tools except IES were found that were applicable to the required prototype functionality. IES was used only in the beginning of development, not at all in the later phases.
5.1.5 Testing MethodsThis criterion evaluates the tools unique to the product that aid in testing, tracing and test coverage.
5.1.5.1 Eagan (ViewMan)Strengths – ViewMan is implemented in standard ANSI C and runs with standard X windows. All ViewMan API functions return an error code providing information about warnings and errors from calls to those functions. The ViewMan library may be compiled for debugging so COTS tools such as aprobe, dbx, etc. can be used for test and debug of the ViewMan library as well as the application. For the DPTO Application development, Quantify was used in performance optimization, as described in Section 5.1.6.1. The gdb and dbx tools were used in debugging of software during unit and integration testing. Xmond was used for gross checking of X protocol generated by the application.
Weaknesses – No tools are supplied with ViewMan to assist in test, trace and test coverage.

21
5.1.5.2 Gallium (InterMAPhics)Strengths – InterMAPhics provides syntactic and semantic checking of DDL in the DDL compilers. All InterMAPhics API functions return an error code providing information about warnings and errors from calls to those functions. All InterMAPhics API functions and run-time kernel can be traced with selectable levels of detail. There is also a basic record/playback capability to aid in testing.
Weaknesses – A version of InterMAPhics that is compiled for debugging is generally not available. Visibility to inner workings of InterMAPhics is limited to those trace features supplied with the product. It is unclear at present whether test coverage support is adequate to meet current DSR line/path coverage requirements for user-developed DDL.
5.1.5.3 Orthogon (ODS Toolbox)Strengths – Many features exist for test, trace and coverage including: SIGPROF profiling – for performance and coverage, Rule Debugger – for rule language debugging, Trace – for monitoring objects, rule language interpretation, drawing engine behavior IES Object Browser – for displaying GUI objects and interactive debugging. Stamping Mechanism – for performance tuning.In general, run-time failures resulted in excellent, coherent error messages that greatly assisted in locating problems. A version of the ODS Toolbox that is compiled for debugging is available with development licenses.
Weaknesses – Visibility to the inner workings of the ODS Toolbox is limited. It is unclear at present whether test coverage support is adequate to meet current DSR line/path coverage requirements for user-developed rule code.
5.1.6 Performance ProfilingTools that the product provides that aid in the optimization of the application were evaluated.
5.1.6.1 Eagan (ViewMan)Strengths – For the DPTO development, TOP, VMSTAT, and Quantify were all used to collect performance data during the optimization effort. The LM developed tool prusage was also used. Micro-EARTS and the DSR Service Request Generation program (srgen) were used to create scenarios for various load conditions. The application was built with a performance monitoring function that allowed developers to collect detailed performance data during run-time. These data included counts of Service Requests and drawing objects (e.g., FDBs, LDBs, targets, and target histories), drawing times for drawing objects, and keyboard echo times. The performance monitoring, when enabled, provided valuable data in evaluating display application performance.
Weaknesses – No profiling tools are provided with ViewMan.

22
5.1.6.2 Gallium (InterMAPhics)Strengths – Product features that provide the best possible performance include Double Buffering, Underlays, Planesets, Direct Draw, and User Input Priority Processing. The InterMAPhics BenchMark Tool (IMB) allows customers to characterize the performance of their display system using a number of different display parameters including map complexity, symbology, track update rates and so on.
Weaknesses – While the ‘clip level’ of performance for Tracks, LDBs and targets were achieved with relative ease, significant tuning in C++ was done to accomplish optimal levels of performance, particularly in target processing.
5.1.6.3 Orthogon (ODS Toolbox)Strengths – SIGPROF and the Stamping Mechanism provide for performance profiling. The Rule Language can be profiled down to sub-statement executable units. A C-API allows extension of rule profiling to the C/C++ level.
Weaknesses – For the Application prototype, additional effort is needed to achieve the performance and responsiveness levels of the other two candidates. Post-demonstration profiling analysis by Orthogon has identified a small number of rules which, if translated to C++, should significantly improve responsiveness and reduce the processing spikes.
5.1.7 Applicability to Real TimeThe ability of the application to determine the workload, overlap independent threads of work, prioritize the work and shed workload under heavy loads is desirable. Note that workload shedding was not provided by any of the products nor required for the demonstration. Also, for the performance measurements, each team had the choice of running the X-Server, Application, Keyboard Driver and all other processes in either real time or time-share mode.
5.1.7.1 Eagan (ViewMan)Strengths – The ViewMan library was designed with real-time ATC requirements as one of the primary objectives. It supports multi-threaded applications. The DSR prototype developed for the Display Processing Task Order incorporates three primary threads. The thread priorities result in an application that addresses latency and efficiency. The real-time multi-threaded design provides for: immediate response to lexical tasks (character echoing and view frame movements), quick response to display control operations (e.g., a range change), and small latency times for the display of tracks.
To measure the latencies and prove the thread implementation, the built-in performance monitoring function of the prototype was used extensively. It outputs the drawing times for the display objects and breaks them down by giving a snapshot of the entry and exit times to the major functions in the threads. These times were obtained using the high-resolution timer. Prusage was used after changes to improve latency times were incorporated to assure that processor utilization did not degrade.

23
To gain insight into the X server performance, Xmond and X11perf were used. Xmond was used to look at the details of the X protocol generated to assure the quantity and content was what was expected. X11perf was used to determine which functions were expensive for the application to use; the use of these functions was minimized.
Weaknesses – None
5.1.7.2 Gallium (InterMAPhics)Strengths – InterMAPhics is re-entrant. Internal checks in function calls ensure there are no re-entrance problems in a multi-threaded application. InterMAPhics provides automatic prioritization of user input processing over IPC message processing in its event loop. In the Gallium prototype, the internal prioritization was sufficient to achieve the required performance and responsiveness. Multi-threading increases complexity and was not necessary to accomplish these requirements.
Weaknesses – The X-Server, Application, Keyboard Driver and all other processes were run in time-share mode. This resulted in the priorities not being predictable. Even so, the performance was very good.
5.1.7.3 Orthogon (ODS Toolbox)Strengths – The ODS Toolbox can be used in a multi-threaded application environment. In the demo application a separate thread was employed for smooth drawing of user interactions, (e.g., for the outline frame of a window while it is moved). A separate thread might have been useful for the independent reception and conversion of LAN data.
Weaknesses – Although some multi-threading was employed and the application was run in real-time mode, lexical response and track latency not as good as the others. The initial Application prototype design did not adequately account for the data loading of the DSR maximum stress scenarios. Additional analysis and redesign were required, impacting schedule. The team’s analysis indicates that this is an application design problem and not a product deficiency. The changes necessary to get to the performance ‘clip level’ were implemented. The team believes that a small number of additional changes can significantly improve performance and responsiveness.
5.1.8 Preview Capabilities
This criterion evaluates the ability of the developer to preview the output of the GUI builder tool. It is preferable for the user to have a ‘WYSIWG’ (what you see is what you get) interface, versus a less desirable compile, bind and run test environment.
5.1.8.1 Eagan (ViewMan)Strengths – None.
Weaknesses – ViewMan does not provide a preview capability. Due to the ease of development, a preview capability has not been a high priority.

24
5.1.8.2 Gallium (InterMAPhics)Strengths – InterMAPhics has provided for several years an InterMAPhics Development Environment (IDE) that can be used to develop, preview and test the Graphical DDL.
Weaknesses – The IDE applicability was limited. The Gallium team instead relied on quick rebuilds for debug purposes.
5.1.8.3 Orthogon (ODS Toolbox)Strengths – The ODS Toolbox fosters an evolutionary approach to software development. Its set of editor tools – the IES (Interface Editor System) can be used to build the layout and the dynamic behavior of the display software at a very early stage of the development process.
Weaknesses – While the IES was useful at the beginning of the development, complexities were such that it was not usable by the end of the demo. However, since rebuilds were quick and the ODS Trace and Browser tools were easy to use for debug purposes, the team did not attempt to resolve the problems encountered in the IES.
5.1.9 Application ModificationsDuring this study, some vendor product upgrades and changes were made. Any upgrades that were part of the vendor’s standard COTS product were acceptable, but were noted. Any changes that would be considered to form a rogue product release for this study were not accepted.
5.1.9.1 Eagan (ViewMan)Strengths – Only two minor changes to the ViewMan library were required for this DSR prototyping effort: both were enhancements to provide support for DSR menu button specifics. These changes are part of release 1.10.0 of the ViewMan library, and all future releases. ViewMan is designed to make as few restrictions on the application developer as possible. ViewMan is in the FAA inventory, so enhancements developed for one FAA project are available to other FAA projects using ViewMan.
ViewMan is under configuration management, along with the LMATM products it supports. A program that uses the ViewMan library initiates development with a selected version (usually the current). The philosophy used by programs to determine when to step up to new ViewMan versions is similar to new releases of X libraries. As new versions become available, the program decides whether to step up to the new release, depending upon the enhancements or bug fixes in the release. Enhancements are added such that thenew version is backward compatible with previous versions. PTR fixes are accumulated for the next version. The severity of the problem(s) and the number of fixes accumulated dictate when the fixes will be released. The release is made available to all projects. Typically, the project that found the problem will step up right away. Other projects choose whether and when to step up.

25
Before a version of the ViewMan library is released, it is tested with a stand-alone driver that tests each of the library components to ensure the library has not degraded.
Weaknesses – None.
5.1.9.2 Gallium (InterMAPhics)Strengths – The standard InterMAPhics 4.7.PA3 release for Solaris was used for this project. No special upgrades or changes were made. No X-Windows Extensions were used. InterMAPhics has only a single development stream.
Weaknesses – None.
5.1.9.3 Orthogon (ODS Toolbox)Strengths – No modifications were made within the ODS Toolbox (Standard version 4.0.7, 12/1/2000) to meet the DSR requirements. However, the ODS Toolbox provides open extension interfaces. A customer may extend Presentation Object and Conceptual Object libraries. These extensions can be made at the customer level without changing the ODS Toolbox itself.
Weaknesses – None.
5.1.10 Product LicensingEagan (ViewMan) – There are no licensing requirements associated with ViewMan. Run-time licenses, development environment licenses, and license manager servers are not required.
Gallium (InterMAPhics) – There are no license fees for the InterMAPhics run-time kernel. Only the development environment DDL compilers are licensed.
Orthogon (ODS Toolbox) – The run-time and development environment tools are all licensed. The demo system was provided with licenses that work with a centralized (FLEXlm) server. For safety, in a delivered ATC system, FLEXlm allows licenses to be established so that each machine can operate on its own without being connected to a server. The mechanism works on a range of IP subnet addresses, avoiding license problems resulting from field replacement of CPUs and cards. This licensing system has been adopted by Airsys ATM for Austro Control, Eurocontrol and others.

26
5.2 Product Maintainability Evaluation
5.2.1 ComplexityWhat complexity measures, such as McCabe or Halstead tools, have been applied to the application code produced by your product? How complex is the code that is produced?
All Vendors – While we did use the McCabe tool to measure “c” code complexity, we did not attempt to measure complexity of all types of code for across all vendors. Samples of every kind of code for all three vendors were examined. Complexity levels of all were well within general DSR complexity measure guidelines. In general, all of the code was well structured, suitably indented, subdivided and modularized into small components. Meaningful names were used throughout. Directory structures, uses of prefixes and suffixes, hierarchical makefiles, etc. make it fairly easy to navigate the code for each prototype.
5.2.2 Symbolic Capabilities The use of named constants, rather than numerical constants, aid in the maintenance of software. Ada type-checked symbolic name capabilities represent the standard. Weaknesses occur when type checking is less strong, cross-referencing capabilities are more limited, compiler checking does not occur, or symbolics are not possible.
All Vendors – Good naming and coding conventions appeared to be used throughout all of the demo applications. Some adjustments to the demo code for specific standards would be needed to make it into production code. This would include standardized commentary, ‘magic number’ elimination, naming and capitalization conventions, etc. New standards would have to be established in some cases.
Compiler type checking depends mainly on the language(s) used with “c” being at the low end and “Ada” being at the high end. The Eagan (ViewMan) prototype was coded entirely in “c” and so has less compiler type checking done than the Gallium or Orthogon prototypes.
5.2.3 Operating System PortingIn order to have platform independence, it is desirable for the product to be ported to a variety of operating systems.
All Vendors – All vendor products have been ported to a variety of UNIX based operating systems and should have no difficulty in supporting whatever operating system is selected.

27
5.2.4 Platform IndependenceThe availability of the vendor’s products by platform and graphics card was evaluated. Product features that were dependent on X-Windows extensions not available from Barco and TechSource were not used. Hardware and Operating System features not available from multiple hardware manufacturers were avoided.
All Vendors – None of the demo applications made use of any special graphics card features or X Server extensions unique to a graphics card. As a consequence, all the demo applications were able to be displayed on the TechSource graphics card, Barco graphics card, the DCX running X, the Sun console graphics card, or a variety of PC graphics cards using Hummingbird Exceed X-Server or Linux based X-Servers. During development, all of these were used.
5.2.5 Availability of Source CodeThe accessibility of the product source code for debug purposes was considered.
Eagan (ViewMan) – The complete set of ViewMan source code is in possession of the FAA. The FAA and LMATM maintain ViewMan and control the changes to its baseline.
Gallium (InterMAPhics) – Source Code has been provided to customers in the past provided the appropriate license agreement has been signed. InterMAPhics is generally not compiled and released with the ‘-g’ C/C++ compiler option. However, any standard debugger provides function name accessibility, even without the ‘-g’ option. Also, InterMAPhics does provide tracing capability, as described previously, to show exactly how InterMAPhics is being called by the application.
Orthogon (ODS Toolbox) – The ODS Toolbox and IES provide rich built-in features for testing and debugging ODS Toolbox application code. A debug code version of the ODS Toolbox itself is available that contains source code references to the ODS Toolbox product source code which will help Orthogon staff in debugging. ODS Toolbox source code can be made available under specially negotiated escrow arrangements.
5.2.6 Standards ComplianceWhat standards are the tool compliant, such as POSIX, TCP/IP and coding standards?
Eagan (ViewMan) – The ViewMan library is coded in ANSI C, provides ‘C’ language bindings and supports multi-threaded applications. The design of the ViewMan prototype used POSIX threads to demonstrate the advantages of a multi-threaded graphics application.

28
Gallium (InterMAPhics) – InterMAPhics is fully POSIX compliant and uses standard UNIX TCP/IP sockets. InterMAPhics product development is ISO 9001 and TickIT certified. C code components of InterMAPhics use Kernighan and Ritchie coding style. C++ code style is based on Scott Meyer’s “Effective C++ Second Edition” and “More Effective C++”.
Orthogon (ODS Toolbox) – The ODS Toolbox supports existing standards both in the data processing and in the ATC domain (such as POSIX, X Window System, OSF/Motif, COPS/CWP, ODID, Asterix, ASN.1, CORBA etc.).
5.2.7 Product CycleAs any product evolves, upgrades occur. How often do releases occur? What is the vendor commitment to forward compatibility? How often to upgrades occur? Are back releases supported? How are problems found in the product identified and solved? How are problem fixes incorporated? If the product is licensed, how are the licenses affected by product upgrades?
Eagan (ViewMan) – ViewMan is already successfully fielded for the FAA on multiple projects. New developments on any one project are available to all projects. ViewMan is FAA code, so support is through standard FAA/LM System Trouble Report (STR) process. Back releases remain in the inventory and are supported through the same process. The FAA, together with LM, controls when new releases containing fixes and upgrades are made. An extensive regression test suite is run against the new ViewMan library prior to each release.
Gallium (InterMAPhics) – provides the following release structure for its InterMAPhics product line. Major releases represent a significant evolution of the product, and are made
available to all maintenance customers. Historically major releases have occurred about every four or five years over the life of the product. Forward compatibility for existing functionality is provided across major releases, but may require customer engineering to take full advantage of all new product capabilities.
Product update releases provide incremental increases in functionality, as well as consolidation of all patch releases since the preceding update release. These releases are provided to all maintenance customers on a yearly basis. Full forward compatibility is provided across product update releases.
Patch releases provide timely response to reported product problems. These are provided upon customer demand according to customer program schedule requirements.
Pre-releases are beta versions of major and update releases. These are provided on customer demand to hasten the introduction of new product capabilities as required by customer schedules.
Gallium supports all back releases throughout the lifecycle of all customer programs based on those releases. New product features will require upgrades to the appropriate release version to gain access to the new capabilities.

29
Orthogon (ODS Toolbox) – Release occurrences – major versions less than 1 per year, revisions less than 2 per
year, patches on a case-by-case basis. Forward compatibility – may only be broken with major version change. Obsolete
features will be supported within interim versions. Two back release support schema – Up-to-date scheme supports N/N-1 version of
ODS Toolbox, Frozen-Software scheme for long-term maintenance of systems in operational use.
Tests are regularly executed internally. All internal test procedures are based on well-documented Test Case Documents.
Licenses are upgraded with the creation of a new Revision, i.e. patches are not subject to new license keys.
5.2.8 Product Problem ResolutionHow are problems reported to the vendor? What problem tracking occurs? How solutions, workarounds, patches, … made? How are product licenses affected?
Eagan (ViewMan) – ViewMan is FAA code, so support is through standard FAA/LM STR (Software Trouble Report) process. These same processes are used to support and maintain Micro-EARTS and Common ARTS. The STR process is built upon COTS tools and databases that provide tracking of STRs and version control of the software releases.
Gallium (InterMAPhics) – Problem logging, tracking, and resolution follows Gallium’s ISO 9001/ TickIT certified process. Problems and product enhancement requests are submitted to Gallium’s customer support representatives via a toll-free customer service line. Each is entered into Gallium’s problem tracking database as a Gallium Change Request (GCR), and assigned a unique GCR index for tracking. The InterMAPhics Steering Committee (ISC) reviews GCRs on a continuous basis, and schedules resolutions into the product release cycle.
Upon submission of a GCR, whenever possible, a technical support representative will provide suggestions for immediate workarounds appropriate to the customers development requirements and schedule. For serious and major problems, immediate patch releases may be scheduled by the ISC. These are made available via FTP or through the same delivery mechanism as the original releases. Product licensing is unaffected by patch releases.

30
Orthogon (ODS Toolbox) – The Error Handling Guideline of the ODS Toolbox Development Guide specifies the following life cycle of an ODS Toolbox problem (abbreviated): A problem detected (by customer or internally) is reported to the help desk. During
the DPTO task, this was easily accessed via Email based Internet problem tracking system.
The help desk analyzes the problem, logging all customer communications and issues a trouble ticket.
If the problem is judged to be a Software or Documentation Bug, it is fed into the error-tracking database.
The bug is fixed on a customer specific branch of the software repository for the next patch release and in the main trunk of the repository for the next official release.
For each patch or release a test is performed according to the Test Phase Guideline. The depth of the test depends on the changes with respect to the previous version.
If the customer requires an immediate solution, a “wa patch” (workaround patch) may be delivered. These “wa” patches are only tested for the functionality of the fix, but not for any side effects. Integration of the fix into the next patch or release requires feedback of the customer.
All versions, i.e. patch and official releases, workaround patches and intermediate test versions are tagged in the repository so that it is possible to re-create a delivered or tested version any time.
Before a change is committed to the repository an inspector has to check the code for validity, possible side effects, and for compliance to the coding conventions.
5.2.9 Company ViabilityThe use of this product by other companies will be considered. Also, provisions for holding the code into escrow are considered.
Eagan (ViewMan) – Lockheed Martin Air Traffic Management has been in the ATC business with the FAA and other customers for over 40 years; we are committed to the FAA business area. Source code for ViewMan is already in the FAA’s possession on the Micro-EARTS and Common ARTS projects.
Gallium (InterMAPhics) – As a supplier of COTS Software Gallium for the past twenty years has acquired a long list of customers.
In several cases, InterMAPhics Software Source Code is held in escrow. Gallium is prepared to make the necessary provisions.
Orthogon (ODS Toolbox) – As a supplier of COTS ODS Toolbox software Orthogon has a long list of customers.
As it has for a number of other customers, Orthogon is prepared to put the source code of the ODS Toolbox into ESCROW either for LM, for the FAA or both. The availability of the source code without an escrow agreement is subject to negotiation.

31
5.3 Functional TestsEach of the prototypes was evaluated for the completion of functionality.
During the Initial Demonstration, basic DSR functionality was verified. See section “4.4.1 Initial DSR Functions” for a summary of the functions. To verify the implementation, test criteria were applied and evaluated as defined in spreadsheets. For functionality that was verified, the requirement test cases were marked as complete.
For functionality that failed verification, the need for the functionality in the prototype was considered. If the functionality was critical to the evaluation, then the teams were asked to fix the function before the Final Demonstration. If the function was not critical, then either the fix was not requested or the fix was requested as desired. By the time of the Final Demonstration, all of the teams completed fixing those failed functions that were required.
During the Final Demonstration, some of limited regression testing was done on the basic DSR functionality, especially in areas where fixes were required. The new functionality was verified in the same manner as for the Initial Demonstration. See section “4.4.2Final DSR Functions” for a summary of the final functions that were required. At the end of testing, all Application prototypes satisfactorily provided all required functionality.
There was some level of over-achievement in the functionality in each of the Application prototypes. The time view and “clear-all” were implemented by all. Although not formally tested, these operated satisfactorily and were a great help during performance testing. Test cases provided by the common team existed for many additional functions. These test cases were usable by all prototypes that reached additional levels of desired but not required functionality. These were used to informally test the additional functionality.
The Eagan prototype implemented all of the graphics features of annotations, the NAS weather features and some additional command composition syntaxes.
The Gallium prototype also implemented additional graphics features of annotations as well as some experimental elements of the inset view. Many additional command composition syntaxes were also done, many of which were previously developed as part of the CAMI prototype.
The Orthogon team implemented additional Annotations capabilities and a GUI interface for importing new map files.

32
5.4 Performance Tests
Two types of performance tests were run to measure the ability of the Application prototypes to meet performance requirements in different hardware configurations: Timing Measurements CPU and Memory Measurements
There were 2 types of Timing Measurements taken: Track Latency measurements – the time from the receipt of a track update message
into the system to time that the track update is displayed on the glass. The desired track latency time was 500 milliseconds or less under all loading situations.
Character Echo Response measurements – the time from the depression of a key on the keyboard until the keyed character is echoed on the display. The desired Character Echo Response time is 50 milliseconds (sometimes described as nearly imperceptible).
The CPU and Memory Measurements were taken for each of the significant running processes. The required ‘clip level’ is that the Application prototype and X Server together should use no more than 1/3 of the CPU cycles and consume no more than 1/3 of the real memory of a 44MHz Sun Ultra 10 with 512MB of memory. While these measurements were taken for all of the track latency test variations, the ‘clip level’ requirement was only applied to the most basic variation (inset closed, hands off).
The software performance and resource utilization characteristics of the system were evaluated by performing the following combinations of measurements (sixty in all):
- 3 products: InterMAPhics, ODS Toolbox, ViewMan
- 2 graphic adapter cards: Barco and TechSource
- 2 configurations: Application and X Server running either in the same processor or different processors. Running them on separate processors evaluates the alternate architecture (refer to section 5.6).
- 5 different test variations (see below)
In order to measure the system response, a 4-5 minute maximum stress scenario test was generated using the DSR Service Request Generation program (srgen). This same program is used for string and regression test in the baseline DSR system. A set of time-stamped track, target, LDB, weather and all other service requests that are part of the DSR maximum stress workload were stored into a binary file.
A program, Perfserver, was developed to read the data from this binary file and write each request to a TCP/IP socket to the application at the times specified in the binary file.The Perfserver program also was used to interleave special test track update messages at regular intervals. Each time the test track update was written to the TCP/IP socket, a message was also written to a parallel port causing an attached LED to be lit. The use of this feature is discussed in section 5.4.1 Timing Measurements below.
33
The conditions under which the maximum stress test was run were:
The X Server, keyboard driver, and product application were run in real time priority class unless directed by the product vendor not to run this way. ViewMan and Orthogon chose to run real time, while Gallium decided not to run real time.
Application startup and 60 seconds of target buildup occurred before measurements began.
Range was 400 nautical miles
Inset view was open in only 1 of the 5 cases. When open, it was also set at a 400 nautical mile range.
No data was filtered (e.g. target data)
Maximum histories were shown
FDB and RDB fonts were set to the maximum sizes.
FDB leader lengths were set to the maximum length.
Velocity vectors were set to the maximum length.
The Table 3 illustrates the complete combination of test variations that were recorded for the performance tests. Columns identify:
Test ID - a test identification used throughout the test measurements and analysis. Application – which prototype application was running: Eagan, Gallium or Orthogon. Graphics Card – TechSource or Barco Items on Sun1 (T) and Items on Sun2 (B) – specify which processes are running on
which machine (Prusage runs on both machines as needed): P – Perfserver A – Application X – X Server K – Keyboard Driver
LED (Light Emitting Diode) Port: P – driven by the Perfserver K – driven by the Keyboard Driver
Test Variation (All run the same maximum stress workload): Track Latency – inset closed, hands off Move Frame – inset closed, DC View frame continually being moved Inset Open – inset open, hands off Range Change – inset closed, alternate range between 250nm and 400nm 1/sec Character Echo – inset closed, type 1 character every 2-5 seconds.

34
Table 3 Performance Test Variations and Configurations
Test ID Applica-tion
Graphics Card
Items on Sun1 (T)
Items on Sun2 (B)
LED Port Test Variation
P A X K P A X K
E-1 Eagan TechSource P A X K P Track Latency
E-2 Eagan TechSource P A X K P Move Frame
E-3 Eagan TechSource P A X K P Inset Open
E-4 Eagan TechSource P A X K P Range Change
E-5 Eagan TechSource P A X K K Character Echo
E-6 Eagan Barco P A X K P Track Latency
E-7 Eagan Barco P A X K P Move Frame
E-8 Eagan Barco P A X K P Inset Open
E-9 Eagan Barco P A X K P Range Change
E-10 Eagan Barco P A X K K Character Echo
E-11 Eagan Barco P A X K P Track Latency
E-12 Eagan Barco P A X K P Move Frame
E-13 Eagan Barco P A X K P Inset Open
E-14 Eagan Barco P A X K P Range Change
E-15 Eagan Barco P A X K K Character Echo
E-16 Eagan TechSource X K P A P Track Latency
E-17 Eagan TechSource X K P A P Move Frame
E-18 Eagan TechSource X K P A P Inset Open
E-19 Eagan TechSource X K P A P Range Change
E-20 Eagan TechSource X K P A K Character Echo
G-1 Gallium TechSource P A X K P Track Latency
G-2 Gallium TechSource P A X K P Move Frame
G-3 Gallium TechSource P A X K P Inset Open
G-4 Gallium TechSource P A X K P Range Change
G-5 Gallium TechSource P A X K K Character Echo
G-6 Gallium Barco P A X K P Track Latency
G-7 Gallium Barco P A X K P Move Frame
G-8 Gallium Barco P A X K P Inset Open
G-9 Gallium Barco P A X K P Range Change
G-10 Gallium Barco P A X K K Character Echo
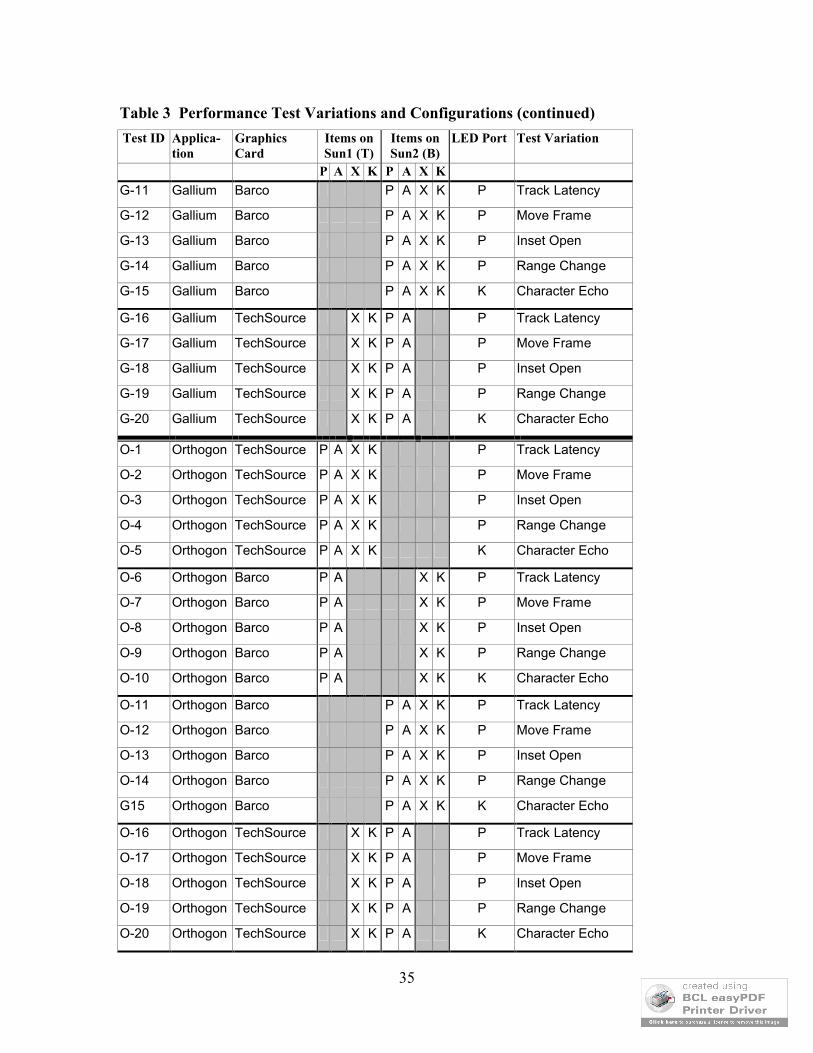
35
Table 3 Performance Test Variations and Configurations (continued)
Test ID Applica-tion
Graphics Card
Items on Sun1 (T)
Items on Sun2 (B)
LED Port Test Variation
P A X K P A X K
G-11 Gallium Barco P A X K P Track Latency
G-12 Gallium Barco P A X K P Move Frame
G-13 Gallium Barco P A X K P Inset Open
G-14 Gallium Barco P A X K P Range Change
G-15 Gallium Barco P A X K K Character Echo
G-16 Gallium TechSource X K P A P Track Latency
G-17 Gallium TechSource X K P A P Move Frame
G-18 Gallium TechSource X K P A P Inset Open
G-19 Gallium TechSource X K P A P Range Change
G-20 Gallium TechSource X K P A K Character Echo
O-1 Orthogon TechSource P A X K P Track Latency
O-2 Orthogon TechSource P A X K P Move Frame
O-3 Orthogon TechSource P A X K P Inset Open
O-4 Orthogon TechSource P A X K P Range Change
O-5 Orthogon TechSource P A X K K Character Echo
O-6 Orthogon Barco P A X K P Track Latency
O-7 Orthogon Barco P A X K P Move Frame
O-8 Orthogon Barco P A X K P Inset Open
O-9 Orthogon Barco P A X K P Range Change
O-10 Orthogon Barco P A X K K Character Echo
O-11 Orthogon Barco P A X K P Track Latency
O-12 Orthogon Barco P A X K P Move Frame
O-13 Orthogon Barco P A X K P Inset Open
O-14 Orthogon Barco P A X K P Range Change
G15 Orthogon Barco P A X K K Character Echo
O-16 Orthogon TechSource X K P A P Track Latency
O-17 Orthogon TechSource X K P A P Move Frame
O-18 Orthogon TechSource X K P A P Inset Open
O-19 Orthogon TechSource X K P A P Range Change
O-20 Orthogon TechSource X K P A K Character Echo
36
In order to more effectively run such an extensive performance test, an AIX test script was written that executed Perfserver, cleaned up the applications as necessary, recorded the Prusage data, and prompted the team running the test to change the configurations as necessary. In addition, the specific manual steps to take were recorded and then executed during the test (refer to 20 Appendix II: Performance Run Manual Check list).
There were two general types of performance tests run:- Timing Measurements- CPU and Memory Measurements
Timing MeasurementsTypically when one measures system timing, the event to measure is sandwiched with timers and samples of measurements are taken of the repeated event with a constant system load to obtain information about the duration of that event. That information, combined with other such event measurements, is then used to make inferences about overall system performance.
However, that is not the method employed by this study. Rather than measuring overall system performance, system response times over a variety of changing system loads was recorded. In an Air Traffic Control System, consistent and quick response of the system is important and may be required at any time during the normal display of radar data. It is undesirable for the system to appear to hesitate. This viewpoint of response as opposed to overall performance is key to the analysis and interpretation of the measurement data
While running the maximum stress scenario, two types of timing measurements were made using digital video recording equipment. Refer to section 5.4.1 for more details.
- Test Track Update Latency: The time between the introduction of the test track update message into the TCP/IP socket for the application and the display of the update of the test track on the display.
- Keystroke Echo Response Time: The time between the keyboard driver receiving a keystroke character and the display of the character in the preview area of the R-CRD.
CPU and Memory MeasurementsCPU and memory utilization of each process was measured and recorded once per second during the execution of each test variation. The measurement program (Prusage) measured the Application, X Server, Keyboard Driver, Perfserver and Prusage processes. Refer to section 5.4.2 for more details.
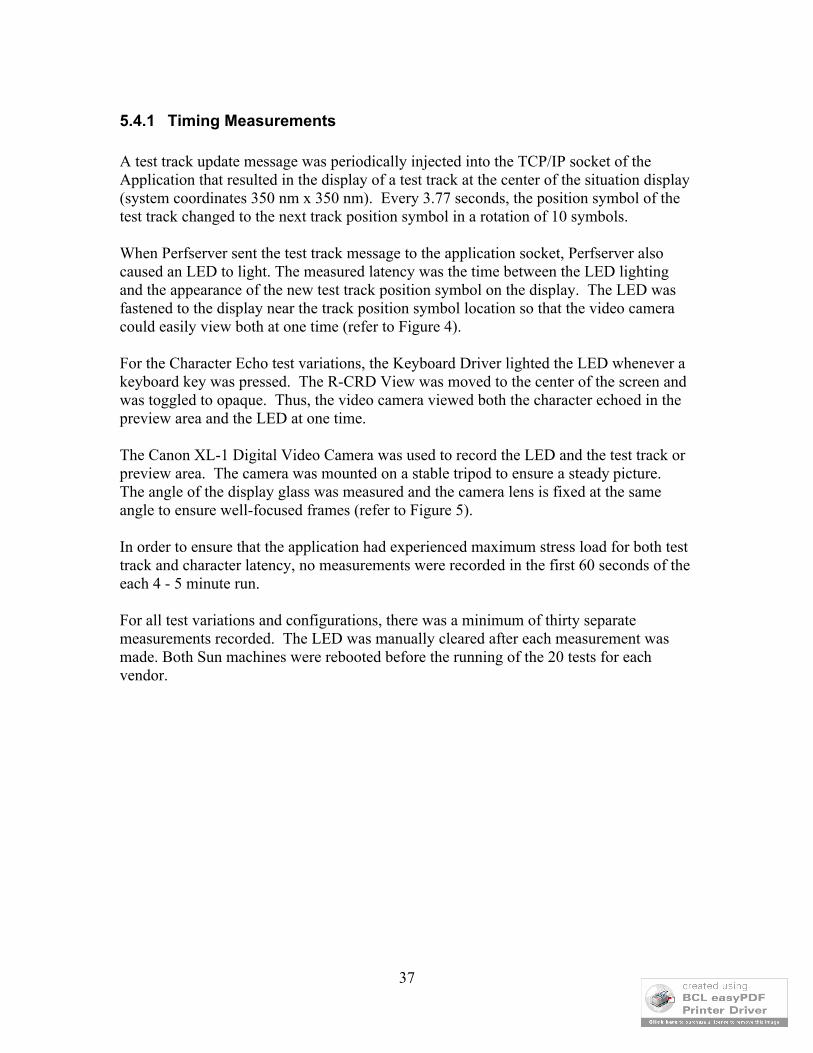
37
5.4.1 Timing Measurements
A test track update message was periodically injected into the TCP/IP socket of the Application that resulted in the display of a test track at the center of the situation display (system coordinates 350 nm x 350 nm). Every 3.77 seconds, the position symbol of the test track changed to the next track position symbol in a rotation of 10 symbols.
When Perfserver sent the test track message to the application socket, Perfserver also caused an LED to light. The measured latency was the time between the LED lighting and the appearance of the new test track position symbol on the display. The LED was fastened to the display near the track position symbol location so that the video camera could easily view both at one time (refer to Figure 4).
For the Character Echo test variations, the Keyboard Driver lighted the LED whenever a keyboard key was pressed. The R-CRD View was moved to the center of the screen and was toggled to opaque. Thus, the video camera viewed both the character echoed in the preview area and the LED at one time.
The Canon XL-1 Digital Video Camera was used to record the LED and the test track or preview area. The camera was mounted on a stable tripod to ensure a steady picture. The angle of the display glass was measured and the camera lens is fixed at the same angle to ensure well-focused frames (refer to Figure 5).
In order to ensure that the application had experienced maximum stress load for both test track and character latency, no measurements were recorded in the first 60 seconds of the each 4 - 5 minute run.
For all test variations and configurations, there was a minimum of thirty separate measurements recorded. The LED was manually cleared after each measurement was made. Both Sun machines were rebooted before the running of the 20 tests for each vendor.
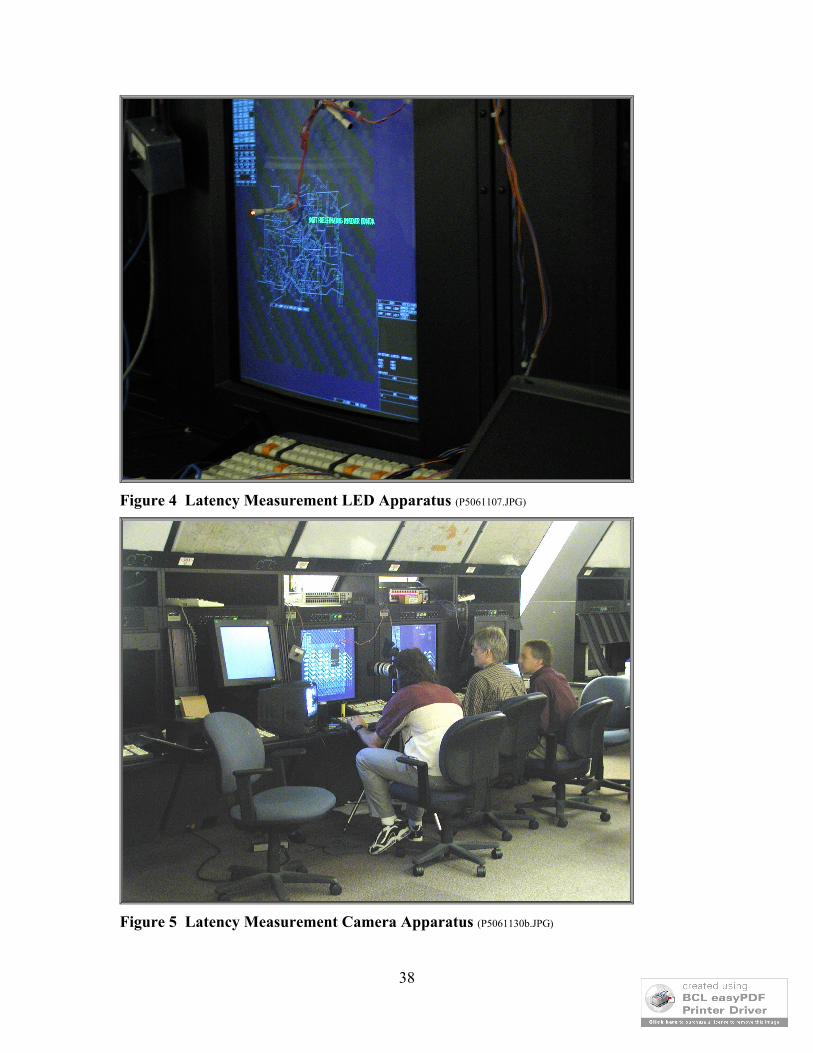
38
Figure 4 Latency Measurement LED Apparatus (P5061107.JPG)
Figure 5 Latency Measurement Camera Apparatus (P5061130b.JPG)

39
After the video measurements were recorded, the videotape was moved to a separate VCR that was used to manually step though the recorded data frame by frame. For each event, the frame number where the LED was lit was recorded and the frame number where either the track position symbol changed or the character echo first appeared (no matter how faintly) was recorded. These events were observed by rotating teams of 3: the first ran the VCR control, the second recorded observations on a printed spreadsheet and the third recorded observations on an electronic spreadsheet (refer to Figure 6). Thirty measurement pairs were recorded for each of the 60 tests, totaling 1,800 measurement pairs in all. Later, each team reviewed its own printed and electronic spreadsheets. The few discrepancies that occurred were resolved by re-viewing the videotape. Each team certified the completeness and accuracy of their own measurements.
For each measurement pair, the latency in frames is the difference of the two measurements plus 1. Therefore, the smallest value (of latency in frames) is 1. Occasionally during character echo measurements, the lighting of the LED and the appearance of the character on the display occurred in the same frame. This is counted as a latency of 1 frame.
The digital video camera recorded images 29.97002618 frames per second, which resulted in a frame period of 33.36667089 milliseconds/frame (1000ms / 29.97002618 frames). A frame number was recorded on each frame. Thus, if the LED lit in frame 24 and the new test track position symbol first appeared in frame 29, the latency in milliseconds was calculated to be:
(29 – 24 + 1) * 33.36667089 milliseconds/frame = 200.200 ms
Figure 6 Observation Team using VCR to record latency timings (P5061151)

40
Based on the methodology described above, measurements were collected for each of the 60 tests. Teams of counters entered the minute, second and frame number for the start and termination of each event into a spreadsheet. The spreadsheet program automatically calculated the Frames, Time (in milliseconds) and Standard Deviation (every five samples). An example of this spreadsheet is found in Figure 19 in the appendix.
This data was placed on a histogram and compared by Application, graphic adapter card and single/dual host. They are organized by the 5 test variations so that the results for each vendor, graphics card and ‘one or two CPU host configuration’ can be seen on a single page for easy comparison. One of these composite graphs is shown in Figure 7. The data is also displayed in tabular form (refer to Table 4).
As mentioned in the latency measurement overview, consistent and quick response of the system is important and may be required at any time during the normal display of radar data. It is undesirable for the system to appear to hesitate. Therefore, the standard deviation is an interesting attribute of the response time measurements, with small deviations indicating an even response time over a variety of system load conditions.
It was found that the Eagan system appears to clearly have the most consistent and smooth response times under the variety of system loads presented. The Gallium system ranks second for this set of tests, with the Orthogon system showing the widest variation and overall slowest response times, although it made a good showing on a few of the tests. The Eagan system appears to have a slightly slower mean response than Gallium for test 4 and slightly slower than Orthogon for tests 13 and 18. This relatively small difference is overshadowed by the consistency of response. See Appendix IV: TimingMeasurement Statistical Analysis.
Based on the observations from the Track Latency comparisons found in
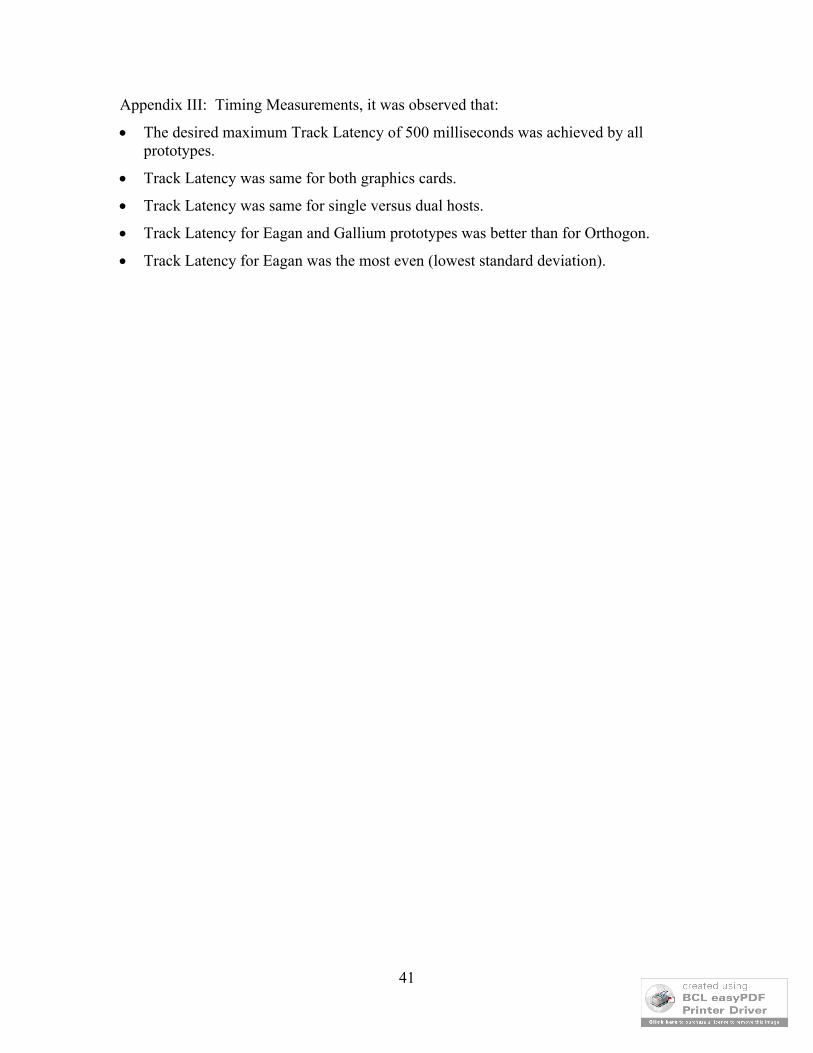
41
Appendix III: Timing Measurements, it was observed that:
The desired maximum Track Latency of 500 milliseconds was achieved by all prototypes.
Track Latency was same for both graphics cards.
Track Latency was same for single versus dual hosts.
Track Latency for Eagan and Gallium prototypes was better than for Orthogon.
Track Latency for Eagan was the most even (lowest standard deviation).

42
Table 4 Track Latency Composite Table Example
Figure 7 Track Latency Composite Figure Example
Single HostTrack Latency (milliseconds)
TechSource BarcoMin Avg Max Std Dev Min Avg Max Std Dev
E-1 133 181 300 33.6 E-11 133 167 300 38.2G-1 67 220 400 97.4 G-11 67 192 400 82.1O-1 67 217 400 89.3 O-11 67 235 767 161.9
Single HostEagan/TechSource E-1 Track Latency
-200400600800
1,000
1 4 7 10 13 16 19 22 25 28
Eagan/Barco E-11 Track Latency
-200400600800
1,0001 4 7 10 13 16 19 22 25 28
Gallium/TechSource G-1 Track Latency
0200400600800
1,000
1 4 7 10 13 16 19 22 25 28
Orthogon/TechSource O-1 Track Latency
0200400600800
1,000
1 4 7 10 13 16 19 22 25 28
Gallium/Barco G-11 Track Latency
0200400600800
1,000
1 4 7 10 13 16 19 22 25 28
Orthogon/Barco O-11 Track Latency
0200400600800
1,000
1 4 7 10 13 16 19 22 25 28

43
5.4.2 CPU and Memory MeasurementsIt was decided that the application process and X Server together should not consume more than 1/3 of the CPU cycles of the 440MHz Sun Ultra 10. This includes system and user time expended on behalf of specified processes. This ‘clip level’ was only applied to the track latency test variation (tests 1, 6, 11 and 16). CPU utilization was recorded for each process once per second, by the Prusage program, using the high-resolution clock and Solaris 8 microstate accounting.
In addition, it was decided that the Application and X Server together should not consume more than 1/3 of the memory of the 512 MBs of the Sun Ultra 10. The Prusage program also recorded the amount of Heap space used by each process.
Measurements of the Keyboard Driver, Perfserver and Prusage processes were also collected and shown to be negligible compared to the Application and X Server.
Figure 8 below shows an example spreadsheet for one of the 60 CPU Loading and Memory Utilization tests.
The table at the top of the figure shows the CPU Utilization for each second from 100 to 200 seconds in the test run. The histogram at the bottom shows details graphically. The tables and histograms for all 60 tests are shown in “Appendix V: CPU and Memory Measurement”. They are organized by the 5 test variations so that the results for each vendor, graphics card and one versus two CPU hosts configuration can be seen on a single page for easy comparison.
Observations from the CPU Utilization data for Track Latency comparisons are: CPU Utilization and Memory clip levels were achieved by all prototypes. CPU Utilization was nearly the same for both graphics cards. CPU Utilization was nearly the same for single versus dual hosts. CPU Utilization for Eagan and Gallium Applications was lower than for Orthogon. Eagan Application memory utilization was much lower than Gallium or Orthogon. Barco X Server Memory Utilization was higher than the TechSource X Server.
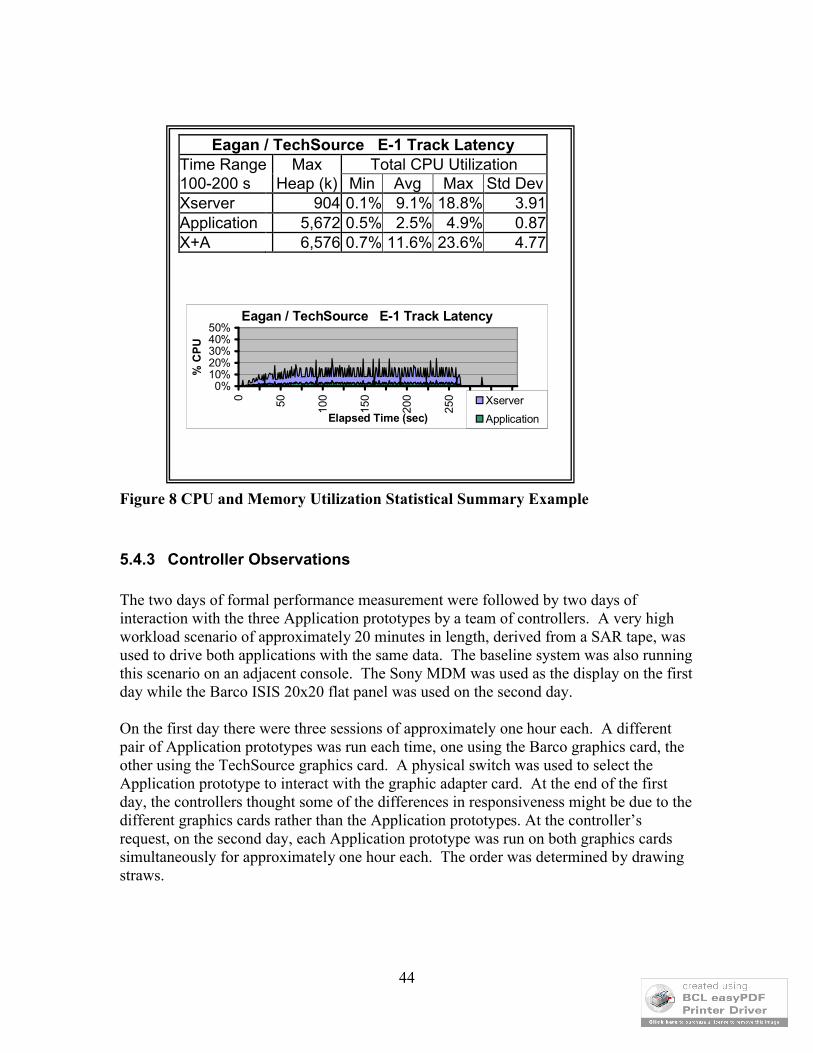
44
Figure 8 CPU and Memory Utilization Statistical Summary Example
5.4.3 Controller Observations
The two days of formal performance measurement were followed by two days of interaction with the three Application prototypes by a team of controllers. A very high workload scenario of approximately 20 minutes in length, derived from a SAR tape, was used to drive both applications with the same data. The baseline system was also running this scenario on an adjacent console. The Sony MDM was used as the display on the first day while the Barco ISIS 20x20 flat panel was used on the second day.
On the first day there were three sessions of approximately one hour each. A different pair of Application prototypes was run each time, one using the Barco graphics card, the other using the TechSource graphics card. A physical switch was used to select the Application prototype to interact with the graphic adapter card. At the end of the first day, the controllers thought some of the differences in responsiveness might be due to the different graphics cards rather than the Application prototypes. At the controller’s request, on the second day, each Application prototype was run on both graphics cards simultaneously for approximately one hour each. The order was determined by drawing straws.
Eagan / TechSource E-1 Track LatencyTime Range Max Total CPU Utilization100-200 s Heap (k) Min Avg Max Std DevXserver 904 0.1% 9.1% 18.8% 3.91Application 5,672 0.5% 2.5% 4.9% 0.87X+A 6,576 0.7% 11.6% 23.6% 4.77
Eagan / TechSource E-1 Track Latency
0%10%20%30%40%50%
0 50 100
150
200
250
300
Elapsed Time (sec)
% C
PU
Xserver
Application
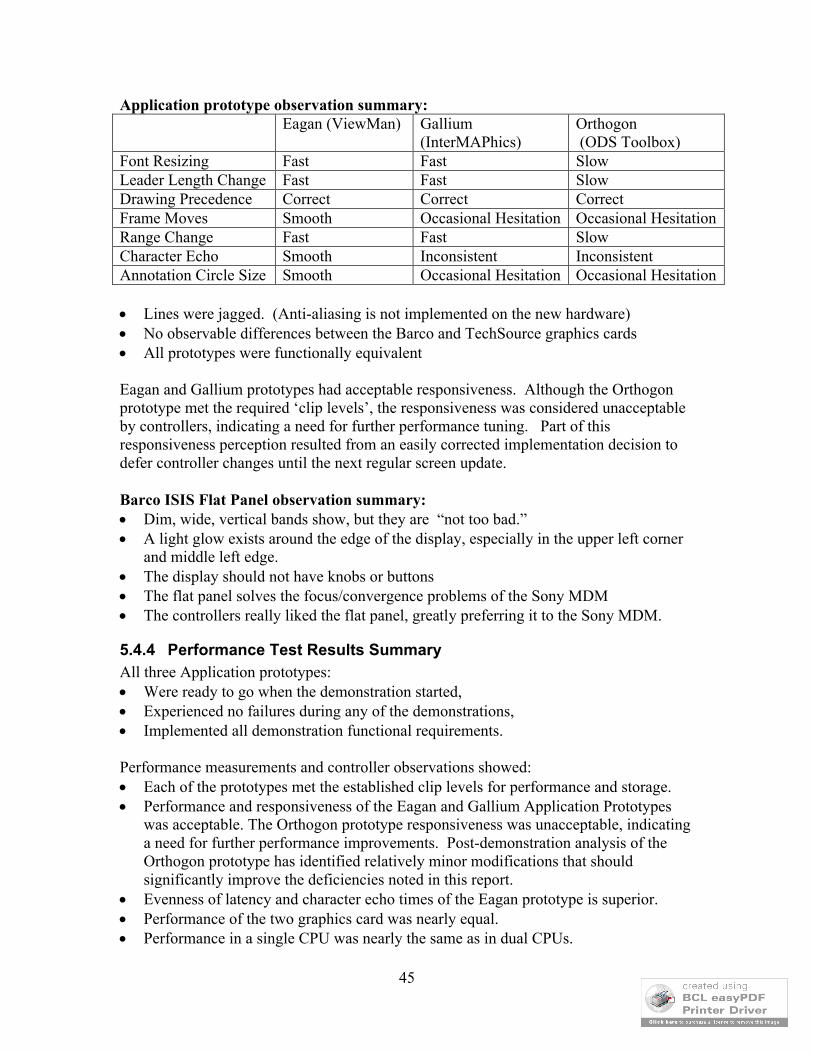
45
Application prototype observation summary:Eagan (ViewMan) Gallium
(InterMAPhics)Orthogon (ODS Toolbox)
Font Resizing Fast Fast SlowLeader Length Change Fast Fast SlowDrawing Precedence Correct Correct CorrectFrame Moves Smooth Occasional Hesitation Occasional HesitationRange Change Fast Fast Slow Character Echo Smooth Inconsistent InconsistentAnnotation Circle Size Smooth Occasional Hesitation Occasional Hesitation
Lines were jagged. (Anti-aliasing is not implemented on the new hardware) No observable differences between the Barco and TechSource graphics cards All prototypes were functionally equivalent
Eagan and Gallium prototypes had acceptable responsiveness. Although the Orthogon prototype met the required ‘clip levels’, the responsiveness was considered unacceptable by controllers, indicating a need for further performance tuning. Part of this responsiveness perception resulted from an easily corrected implementation decision to defer controller changes until the next regular screen update.
Barco ISIS Flat Panel observation summary: Dim, wide, vertical bands show, but they are “not too bad.” A light glow exists around the edge of the display, especially in the upper left corner
and middle left edge. The display should not have knobs or buttons The flat panel solves the focus/convergence problems of the Sony MDM The controllers really liked the flat panel, greatly preferring it to the Sony MDM.
5.4.4 Performance Test Results SummaryAll three Application prototypes: Were ready to go when the demonstration started, Experienced no failures during any of the demonstrations, Implemented all demonstration functional requirements.
Performance measurements and controller observations showed: Each of the prototypes met the established clip levels for performance and storage. Performance and responsiveness of the Eagan and Gallium Application Prototypes
was acceptable. The Orthogon prototype responsiveness was unacceptable, indicating a need for further performance improvements. Post-demonstration analysis of the Orthogon prototype has identified relatively minor modifications that should significantly improve the deficiencies noted in this report.
Evenness of latency and character echo times of the Eagan prototype is superior. Performance of the two graphics card was nearly equal. Performance in a single CPU was nearly the same as in dual CPUs.

46
5.5 Coding Effort The software developed for each of the three Application prototypes was analyzed to determine the amount of work involved. A script was developed which minimally recognized the structure of each of the languages and counted raw lines, Non-Blank (NB) Non-Comment (NC) lines and preprocessor lines. The results were entered into three spreadsheets, one for each prototype. These spreadsheets were then distributed to each of the three teams so they could assess which software applied to each category of required functionality (tracks, targets, etc.). The resulting summaries are provided in Table 5Coding Effort for the Three Demonstration Application Prototypes.Note: The table attempts to show the code that was produced to meet the demonstration requirements. Attempts were made by all teams to exclude any over-achievement code from the table. See section 5.3 “Functional Tests” for a description of over-achievements.
Table 5 Coding Effort for the Three Demonstration Application Prototypes
The Total number of Non-Blank, Non-Comment lines is about the same for all three prototypes. In the Gallium and Orthogon prototypes, nearly 50% of the software effort was in C++ code, the remainder in specialized languages. In areas where performance or response was critical, more C/C++ coding was generally needed.
Eagan NB, NC Lines by File Type vs. New and Baseline FunctionalityTarget Track LDB Dwell Annot Inset RDB DC RCRD NEXRAD Map Other Total
C 875 1481 801 202 2446 693 2655 1467 2266 198 673 4678 18434Include (.h) 222 431 212 0 370 0 335 262 280 104 128 1105 3450Include (.d) 18 94 18 0 70 0 25 1373 349 3 39 733 2721Total 1114 2006 1030 202 2886 693 3015 3102 2896 305 840 6516 24606
Gallium NB, NC Lines by File Type vs. New and Baseline FunctionalityTarget Track LDB Dwell Annot Inset RDB DC RCRD NEXRAD Map Other Total
C++ 772 1158 1173 169 1981 409 1674 637 1390 157 312 951 10783Include 151 216 154 6 36 29 96 27 116 11 0 263 1105Situation DDL 131 0 0 0 88 0 22 0 0 44 0 153 438Contact DDL 0 935 60 0 0 0 151 0 0 0 0 3 1149Tabular DDL 0 0 0 0 628 128 453 1825 663 0 0 171 3868Dialogue DDL 2 2 30 17 702 132 257 530 373 2 0 262 2311Function DDL 0 7 0 0 108 10 36 79 41 0 0 46 328GSL DDL 35 12 4 4 11 0 7 4 4 4 12 186 281Rules DDL 0 284 80 0 447 96 402 527 440 0 0 541 2817Data 0 0 0 0 0 0 0 0 0 0 180 0 180Total 1092 2614 1500 195 4001 804 3099 3629 3028 217 504 2576 23259
Orthogon NB, NC Lines by File Type vs. New FunctionalityTarget Track LDB Dwell Annot Inset RDB DC RCRD NEXRAD Map Other Total
C++ (.C, .c) 1615 3212 801 0 0 336 121 0 0 0 1080 3058 10222Include (.h) 226 672 72 0 0 83 13 0 0 0 297 305 1668module (.mod) 147 1244 243 158 2247 460 2373 1640 1598 171 152 2054 12486dialogue(.idm) 0 0 0 0 0 0 0 0 0 0 588 46 634Total 1988 5127 1116 158 2247 879 2507 1640 1598 171 2117 5462 25010

47
5.5.1 DSR Baseline Coding Effort for Annotations and Range View This section attempts to compare DSR versus Application prototype coding effort for the same functionality. The Range View and Annotations were selected as the functions to compare since current DSR metrics exist for the recent development of those functions.
This comparison is difficult and not very accurate because: Only a subset of the DSR Baseline functionality was implemented The prototype code was not required to be conform to production standards The prototype code was not subjected to process standards for design, code, test, etc.
The Range View implementation metrics were extracted from the BBC10 Fix Package for CR6493. The Annotation implementation metrics were extracted from the BCC20 Fix Package for CR6615. Only the Ada code was considered. Since the metric units were Source Lines of Code (SLOC), a method to determine Non-blank, Non-Comment (NBNC) lines for the Ada code was needed. The Ada code modules that contributed more than 100 SLOC were extracted and counted with the LMATM “sloctool”. Theresults were used to compute NBNC/SLOC ratios, separately for the Range View and Annotations as shown in Table 6 and Table 7 below.
Table 6 DSR Range View (RDB) Metrics and NCNB/SLOC Ratio
Range View (RDB) Module Name
CSS/ CSCI
NCSL MOD
NCSL ADD
NSCL DEL
d2vew00b.ada DSRV 17 107 7d2vew00s.ada DSRV 0 8 0
…Range View - CR6493 TOTALS 3676 393 3223 60
x 1.84Approx. NCNB lines for Range View 6754
Ref: \\atmsr23\cdr2data\Data\_sw\FixPackage\Bcc20\ Cr Fix Package Sloc Totals.xls, sheet CR6493Notes: 1, Only ada code included. 2. Imakefiles, scripts, tooling, adaptation, c-code not included. 3. NCSL is non-comment source lines of code also referred to as SLOC lines.
Range View (RDB) Sample Modules
Total Lines
Blank Lines
Comment Lines
SLOC Lines
NCNB Lines
NCNB/ SLOC
d2vew00b.ada 2426 482 550 816 1394 1.71d4hrg00b.ada 730 123 249 208 358 1.72d4htk00b.ada 3314 374 1229 1002 1711 1.71d4pnd00b.ada 1240 187 548 301 505 1.68d4ptd00b.ada 1498 225 595 348 678 1.95d4rvm00b.ada 5778 954 1855 1492 2969 1.99dlrpa00b.ada 541 123 103 149 315 2.11
15527 2468 5129 4316 7930 1.84
Sampled ada modules contributed more than 100 total SLOC lines each.

48
Table 7 DSR Annotations Metrics and NCNB/SLOC Ratio
Table 8 DSR versus Application Prototype Non-Blank, Non-Comment Lines
Annotations Module Name
CSS/ CSCI
NCSL MOD
NCSL ADD
NSCL DEL
dlbox00b.ada DSRV 12 52 2dlbox00s.ada DSRV 12 39 0
…Annotations - CR6615 TOTALS 7168 1455 5331 382
x 1.87Approx. NCNB lines for Annotations 13375
Ref: \\atmsr23\cdr2data\Data\_sw\FixPackage\Bbc10\ fixpackage_cr6615.doc, Table C. MetricsNotes: 1, Only ada code included. 2. Imakefiles, scripts, tooling, adaptation, c-code not included. 3. NCSL is non-comment source lines of code also referred to as SLOC lines.
Annotations Sample Modules
Total Lines
Blank Lines
Comment Lines
SLOC Lines
NCNB Lines
NCNB/ SLOC
d2cur00b.ada 1042 238 221 402 583 1.45d2dub00s.ada 1166 171 467 507 528 1.04d2duj00.ada 2471 559 489 1188 1423 1.20d2edt00b.ada 964 155 259 302 550 1.82d2lex00b.ada 1141 228 201 400 712 1.78d3mca00b.ada 3726 682 1113 949 1931 2.03d4avm00b.ada 5293 958 1382 1406 2953 2.10d4dcv00b.ada 6891 1111 2424 1596 3356 2.10d4hap00b.ada 4156 729 1342 1077 2085 1.94d4hap00s.ada 623 76 365 109 182 1.67d4rvm00b.ada 5917 971 1938 1503 3008 2.00d4snv00b.ada 5067 881 1799 1145 2387 2.08dledt00b.ada 1540 372 226 508 942 1.85dllex00b.ada 515 109 96 136 310 2.28
40512 7240 12322 11228 20950 1.87
Sampled ada modules contributed more than 100 total SLOC lines each.
DSR versus Application Prototype Coding Effort in NBNC Lines
DSR Baseline
Eagan (ViewMan)
Gallium (InterMAPhics)
Orthogon (ODS Toolbox)
Range View 6754 3015 3099 2507Annotations 13375 2886 4001 2247

49
A summary of the numbers is presented in Table 8 above.
For the Range View, the features yet to be added to the Application prototypes include: Many composition elements of the HMI Error detection, reporting and recovery Operation in different environments Affects on preference sets Performance Tuning, etc.
It is reasonable to assume that completion of an Application prototype would probably double the amount of code for the Range View.
Similarly, for Annotations, many features (more than for the Range View) were yet to be added to the Application prototypes including: Display as well as Map mode Deletion of individual annotations Line Annotations, etc.
The resulting code for annotations therefore could also be double or more when the full specifications are implemented. It was noted that the Gallium prototype code effort for annotations was higher than the others. Examination of this showed that the keystroke editing was re-implemented here and could easily have been factored out and combined with the R-CRD preview editor, bringing the code effort in line with the others.
5.5.2 Coding Effort Conclusions
The coding effort for each of the Application prototypes was remarkably similar. It does not appear that any of the three Application prototypes will yield a large
coding advantage over the current DSR approach. The Orthogon and Gallium implementations amount of C++ code grew as functional
accuracy and performance tuning progressed. Some Gallium and Orthogon product advantages may be masked by the fact that we
chose implement the most difficult performance elements of DSR first. However, performance is important since future functionality requirements are likely to be much more demanding than current DSR.
Using X Windows versus RGL allowed for a highly distributed, flexible development and test environment requiring less emphasis on large fixed lab environments.
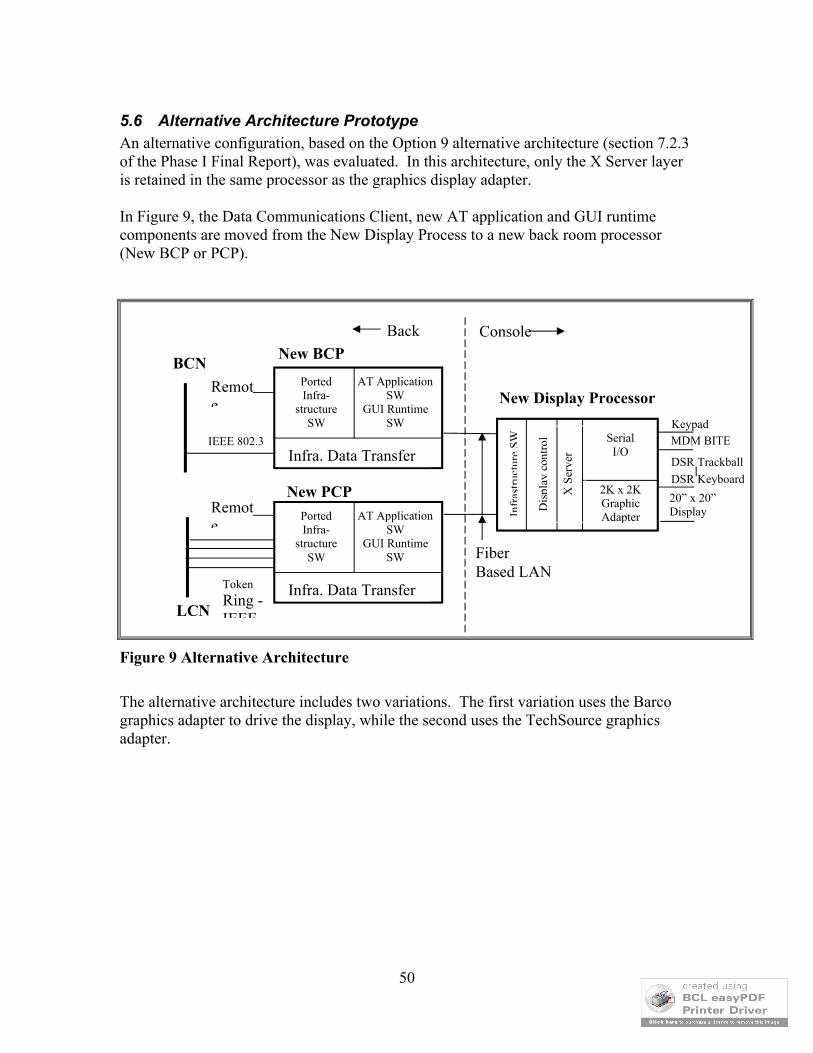
50
5.6 Alternative Architecture PrototypeAn alternative configuration, based on the Option 9 alternative architecture (section 7.2.3 of the Phase I Final Report), was evaluated. In this architecture, only the X Server layer is retained in the same processor as the graphics display adapter.
In Figure 9, the Data Communications Client, new AT application and GUI runtime components are moved from the New Display Process to a new back room processor (New BCP or PCP).
Figure 9 Alternative Architecture
The alternative architecture includes two variations. The first variation uses the Barco graphics adapter to drive the display, while the second uses the TechSource graphics adapter.
New BCP
LCNP
Token
Ring -IEEE
PortedInfra-
structureSW
AT Application SW
GUI Runtime SW Keypad
MDM BITE
20” x 20”Display
New PCPDSR Keyboard
New Display Processor
BCN
Back Console
Fiber Based LAN
Serial I/O
IEEE 802.3
2K x 2KGraphicAdapter
Dis
play
con
trol
Infr
astr
uctu
re S
W
Infra. Data Transfer
PortedInfra-
structureSW
AT Application SW
GUI Runtime SW
Infra. Data Transfer
DSR Trackball
Remote
Remote
X S
erve
r

51
5.6.1 GUI Runtime Separate from Barco Card PlatformThe hardware configuration was used to demonstrate elements of alternative hardware architecture Option 9. The new PCP/BCP application and GUI runtime software ran in a hardware platform separate from the X Server and graphics card platform.
The SUN-2 platform contained the single Barco graphics card. The keyboard/trackball was switched to the SUN-2 platform. The SUN-1 platform ran a copy of the new application together with its GUI runtime candidate.
The baseline PCP functionality was viewed on the R Console on the left. Runtime data from the PCP was sent to SUN-1 where the application is running. The application processed the messages and sent X messages to the Barco X Server and Barco graphics adapter card running on SUN–2.
VEM CDGPCP
Keyboard/Trackball
VEM CDGPCP
Keyboard/Trackball
MaintenanceLAN
LCN 4 TokenRings
RConsole
SonyMDM
SUN-1
Tech-Source
Graphics
New SystemDisplay
Runtime Data
RConsole
Fast Ethernet
BarcoGraphics
SonyMDM
Existing SystemDisplay
(for comparison)
SerialSwitch
VideoSwitch
SerialSwitch
VideoSwitch
SUN-2SUN-3
Figure 10 GUI Runtime Separate from Barco Card Platform

52
Figure 11 below illustrates the software configuration. When this configuration was tested, Sun-3 was not sent data from the Data Com Server. This meant that it was not possible to switch the MDM between inputs from Sun-3 and Sun-1. However it was possible to measure the CPU utilization of Sun-1 and Sun-2.
R Console
DCX
RGL Server
PCP
Infrastructure SW
Base ATapplication
SW
DisplayServices
SITS/DIT
DataCom
Server
Aprobes
SUN-2
BarcoGraphics Adapter
Xserver Kbd driverRS422
Xlib
GUI Run-time SW
new AT Application
Data Com Client
SUN-1
Tech-SourceGraphics Adapter
Xserver Kbd driverRS422
Xlib
GUI Run-time SW
new AT Application
Data Com Client
SUN-3
Xlib
GUI Run-time SW
new AT Application
Data Com Client
Video Sw
Sony MDMKeyboardTrackball
Serial SwR console
Console Processors & DCX Replaced WithNew Console & Display Processors (Option 9)
New BCP
LCNP
TokenRing -IEEE 802.5
PortedInfra-
structureSW
AT ApplicationSW
GUI RuntimeSW Keypad
MDM BITE
20” x 20”Display
Xse
rver
New PCPDSR Keyboard
New Display Processor
BCN
Back Room Console
Fast Ethernetor FDDIinterface
SerialI/O
IEEE 802.3
2K x 2KGraphicAdapter
Dis
play
con
trol
Infr
astr
uctu
re S
W
Infra. Data Transfer SW
PortedInfra-
structureSW
AT ApplicationSW
GUI RuntimeSW
Infra. Data Transfer SW
DSR Trackball
RemoteRestart
RemoteRestart
FiberbasedLan
Figure 11 GUI Runtime Separate from Barco Card Platform

53
5.6.2 GUI Runtime Separate from TechSource Card Platform
This second hardware configuration was also used to demonstrate elements of alternative hardware architecture Option 9. The difference between this configuration and that found in Figure 10 is that the application processed the messages from Sun-2 and sent X messages to the TechSource X Server and TechSource graphics adapter card running on SUN–1.
VEM CDGPCP
Keyboard/Trackball
VEM CDGPCP
Keyboard/Trackball
MaintenanceLAN
LCN 4 TokenRings
RConsole
SonyMDM
SUN-1
Tech-Source
Graphics
New SystemDisplay
Runtime Data
RConsole
Fast Ethernet
BarcoGraphics
SonyMDM
Existing SystemDisplay
(for comparison)
SerialSwitch
VideoSwitch
SerialSwitch
VideoSwitch
SUN-2SUN-3
Figure 12 GUI Runtime Separate from TechSource Card Platform
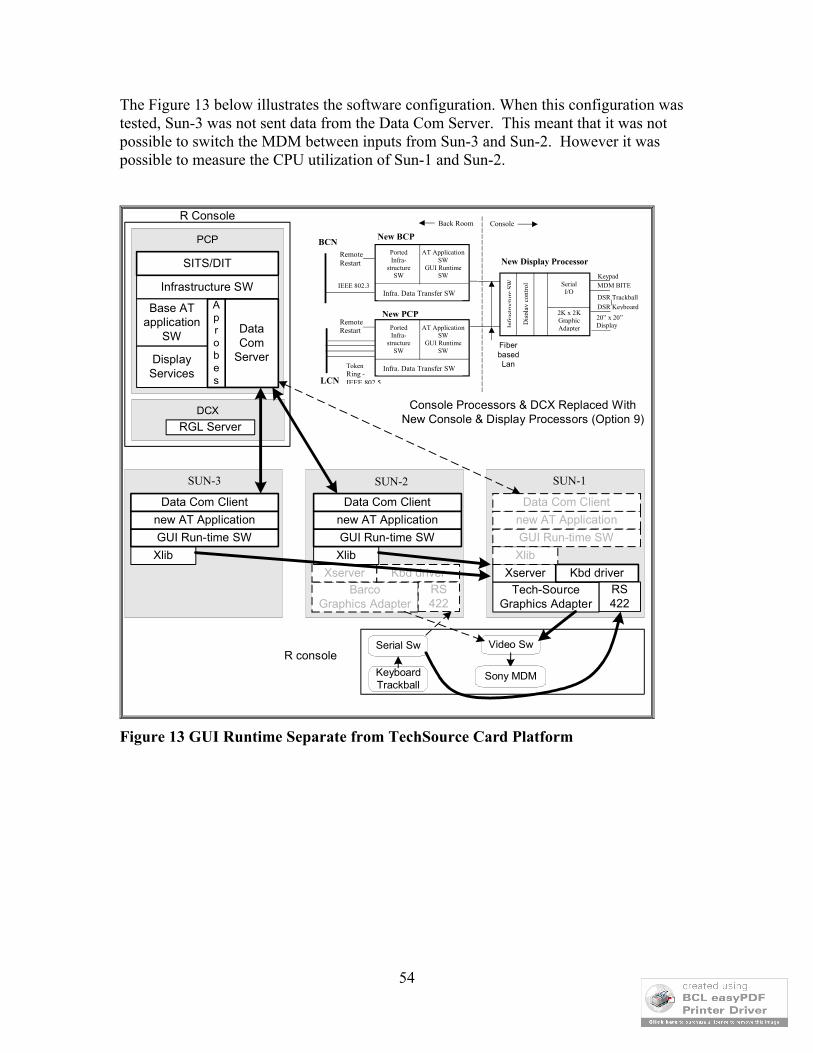
54
The Figure 13 below illustrates the software configuration. When this configuration was tested, Sun-3 was not sent data from the Data Com Server. This meant that it was not possible to switch the MDM between inputs from Sun-3 and Sun-2. However it was possible to measure the CPU utilization of Sun-1 and Sun-2.
R Console
DCX
RGL Server
PCP
Infrastructure SW
Base ATapplication
SW
DisplayServices
SITS/DIT
DataCom
Server
Aprobes
SUN-2
BarcoGraphics Adapter
Xserver Kbd driverRS422
Xlib
GUI Run-time SW
new AT Application
Data Com Client
SUN-1
Tech-SourceGraphics Adapter
Xserver Kbd driverRS422
Xlib
GUI Run-time SW
new AT Application
Data Com Client
SUN-3
Xlib
GUI Run-time SW
new AT Application
Data Com Client
Video Sw
Sony MDMKeyboardTrackball
Serial SwR console
Console Processors & DCX Replaced WithNew Console & Display Processors (Option 9)
New BCP
LCNP
TokenRing -IEEE 802.5
PortedInfra-
structureSW
AT ApplicationSW
GUI RuntimeSW Keypad
MDM BITE
20” x 20”Display
Xse
rver
New PCPDSR Keyboard
New Display Processor
BCN
Back Room Console
Fast Ethernetor FDDIinterface
SerialI/O
IEEE 802.3
2K x 2KGraphicAdapter
Dis
play
con
trol
Infr
astr
uctu
re S
W
Infra. Data Transfer SW
PortedInfra-
structureSW
AT ApplicationSW
GUI RuntimeSW
Infra. Data Transfer SW
DSR Trackball
RemoteRestart
RemoteRestart
FiberbasedLan
Figure 13 GUI Runtime Separate from TechSource Card Platform
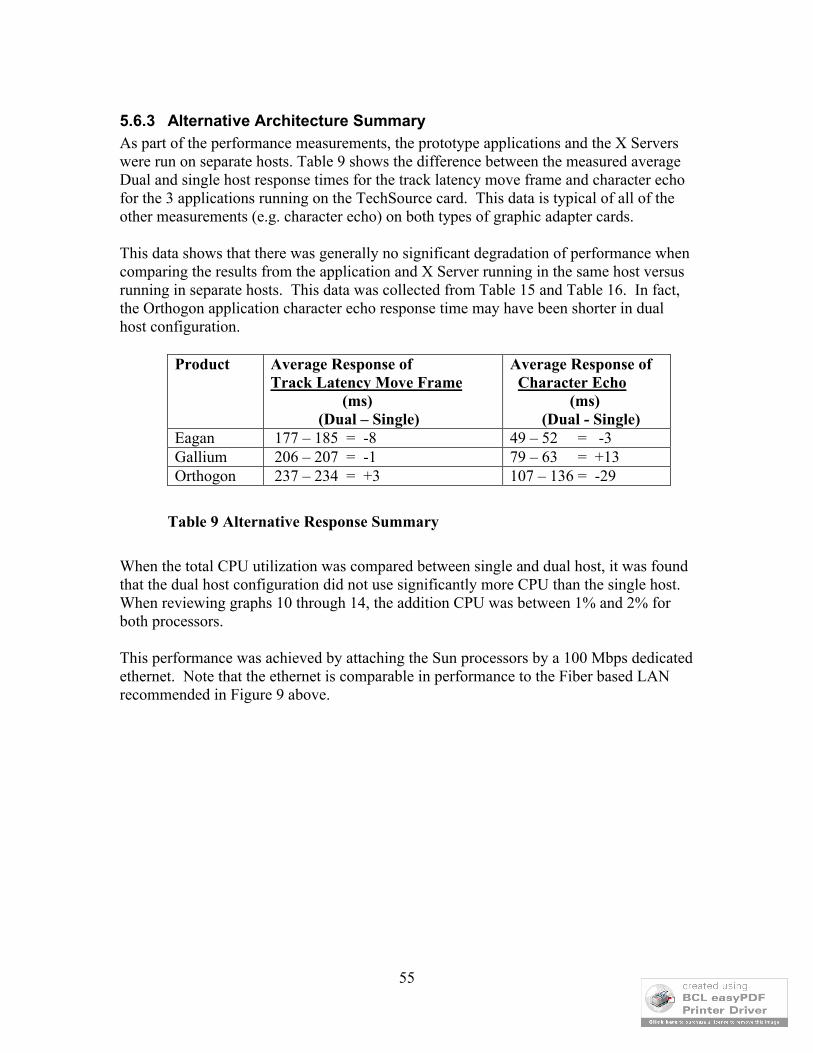
55
5.6.3 Alternative Architecture SummaryAs part of the performance measurements, the prototype applications and the X Servers were run on separate hosts. Table 9 shows the difference between the measured average Dual and single host response times for the track latency move frame and character echo for the 3 applications running on the TechSource card. This data is typical of all of the other measurements (e.g. character echo) on both types of graphic adapter cards.
This data shows that there was generally no significant degradation of performance when comparing the results from the application and X Server running in the same host versus running in separate hosts. This data was collected from Table 15 and Table 16. In fact, the Orthogon application character echo response time may have been shorter in dual host configuration.
Product Average Response ofTrack Latency Move Frame (ms) (Dual – Single)
Average Response of Character Echo (ms) (Dual - Single)
Eagan 177 – 185 = -8 49 – 52 = -3Gallium 206 – 207 = -1 79 – 63 = +13Orthogon 237 – 234 = +3 107 – 136 = -29
Table 9 Alternative Response Summary
When the total CPU utilization was compared between single and dual host, it was found that the dual host configuration did not use significantly more CPU than the single host. When reviewing graphs 10 through 14, the addition CPU was between 1% and 2% for both processors.
This performance was achieved by attaching the Sun processors by a 100 Mbps dedicated ethernet. Note that the ethernet is comparable in performance to the Fiber based LAN recommended in Figure 9 above.

56
5.7 Software Evaluation Summary
Study Results: All products underlying the application prototypes are useable. Application prototypes built on any of the underlying products are maintainable. All application prototypes passed their functional tests. All application prototypes were stable throughout all the demonstrations. All application prototypes met the performance and storage clip levels. The Eagan and Gallium prototypes demonstrated significantly better CPU utilization
performance than the Orthogon prototype. The Eagan and Gallium prototypes demonstrated good character echo response times
and small track latency times compared with the Orthogon prototype. The Eagan prototype demonstrated the most consistent and smoothest response times. The coding efforts of each of the three candidates appear to be very close. The coding efforts of the candidates are not much better than for the DSR baseline. One application prototype cannot easily be ported from one product to another. Solutions were not sensitive to single versus dual hosts. Solutions were not sensitive to which graphics card was used. Solutions were not sensitive to Sony MDM versus Barco ISIS flat panel. X Windows (versus RGL) provides an improved development environment.
The key product discriminators are performance and responsiveness. However, the significance of these discriminators in the near future may be tempered by the following: Hardware memory and performance will continue to increase. The responsiveness and performance of all Application prototypes could be
improved, given more time. All companies are working on product improvements.
Further study: Anti-aliasing needs graphics card and X Server support. Core device support for the DSR keyboard is needed in the X Servers. Sony MDM replacement issues need to be addressed.

57
6 Hardware EvaluationThe following hardware was evaluated:
Graphics accelerator cards
Evaluate the quality of picture produced by each card. Also evaluate and compare the performance of each of the new cards (and their associated X Servers). Examine the impact of host system loading on graphics card performance.
Video switches
Evaluate image quality with and without each of the candidate switches.
Serial switches
Demonstrate switching the keyboard/trackball between two different hardware platforms, each with a graphics card and X Server. The task order did not demonstrate the ability of a program to determine the switch position due to lack of time.
6.1 Graphics CardsPhase 1 of the task order recommended that the Extron, Matrix Systems and TechSource video switches be evaluated as part of the Phase 2 demonstration.
Each of the 3 video switches was evaluated by the following procedure.
Attach the Barco graphics adapter card and CDG as input to the video switch. Then:
- Observe the static displayed image from the Barco graphics card on the MDM display. Ignore the MDM display behavior during switch actuation.
- Observe the dynamic displayed image on the MDM display during switch actuation.
Attach the TechSource graphics adapter card and CDG as input to the video switch. Then:
- Observe the static displayed image from the TechSource graphics card on the MDM display. Ignore the MDM display behavior during switch actuation
- Observe the dynamic displayed image on the MDM display during switch actuation.
Refer to section 60.2 Graphics Adapter Card Evaluation for a description of the procedures used for the graphics card test.

58
6.1.1 Evaluation SummaryThe following sections summarize the evaluation findings.
Display image quality
The first observation was performed with the MDM display driven by the Raytheon CDG. This was done so that a comparison could be made between the existing image and the image generated by the candidate graphics adapter cards.
In Table 10, the results of the display image quality are summarized:
Paragraph Description Results
Video generators
60.2.1 Display driven by CDG
Observe the display with the pattern generated by a CDG.
Image characteristics are acceptable.
60.2.2 Display driven by TechSource Graphics Adapter Card
Observe the display with the pattern generated by a TechSource graphics adapter card.
Image characteristics are acceptable.
60.2.3 Display driven by Barco Graphics Adapter Card
Observe the display with the pattern generated by a Barco graphics adapter card.
Image characteristics are acceptable.
Table 10 Display Image Quality
Thus, each of the candidate video graphics cards provided a good image that was similar to the MDM display driven by the Raytheon CDG. The distortion that was observed in the lower left corner of the MDM display was attributed to the MDM display rather than the video cards since when the both of the video cards output was displayed on a second MDM, the distortion was not displayed.
It was found that the TechSource drew the image on the MDM display 3mm off center to the left. All of the data on the situation display, including the border, was visible. This shift was attributed to TechSource graphics adapter card since the shift was only observed when the TechSource adapter card was being used for display.
There are 3 options to resolve the minor shift of the display on the MDM:1. Do Nothing. This is the least expensive solution and may be acceptable.2. Require TechSource to adjust the timings of the card to resolve the shift.

59
3. Load the MDM with different alignment data. During transitions from the current architecture to the final architecture, there will be times when both a CDG and graphics cards will drive the display. Just prior to the graphics card starting to drive the MDM, a new set of alignment data could be loaded into the MDM. This solution is not feasible due to the relatively long time it takes for that data to be loaded.
Performance Running on the Host Processor
It was found that the Barco graphics adapter card consistently used more heap storage than the TechSource graphics adapter card. For example, Table 11 shows the approximate heap usage for each X Server plus application for all configurations. This data is derived from Table 17 to Table 21.
Application Max Heap with TechSource (Mb)
Max Heap with Barco (kb)
InterMAPhics ~1 ~13ODS Toolbox ~1 ~9ViewMan ~1 ~10
Table 11 Maximum Heap Storage Usage
This difference is not a discriminator between the two graphic adapter cards since the memory on the Sun Ultra 10 is 512 Mb and thus the difference between cards is relatively small.
In addition it was found that CPU usage by the X server was not significantly different between the graphic adapter cards. This data is derived from Table 17 to Table 21.
Ease of use with candidate GUI builders
Both graphics adapter cards easily integrated with each of the applications.
Impact on software development
Both graphic adapter cards did not adversely impact software development with one minor exception. When the TechSource card was used for display, there were minor instances of the incorrect font being displayed. This fault was not investigated due to time limitation.
Lexical and semantic response times
Both graphic cards provided similar lexical and semantic response times for each prototype (refer to Figure 18 Track Character Echo Summary: Graphical).

60
6.1.2 RecommendationsBoth products showed acceptable display quality, reliability and performance.
Before the products are procured, the following minor issues associated with the TechSource card need resolution:
- Analysis of the 3 mm display shift
- Analysis of the display of the incorrect font
6.2 Video SwitchesThe purpose of this section is to evaluate the operation of the graphics adapter cards with the output of the card displayed in the Sony MDM.
The graphic accelerators were evaluated for:
- display image quality
- performance running on the host processor
- ease of use with candidate GUI builders
- impact on software development
- lexical and semantic response times
Refer to section 60.3 Video Switch Evaluation for a description of the procedures used for the video switch card test.
6.2.1 Evaluation SummaryThe following tables summarize the switch behavior during the test.
60.3.1 TechSource switch
60.3.1.1 Barco graphics adapter card / CDG as the sources of the signal to be switched.
Observing the display with the switch in the static position resulted in an image of the same quality as observed in the previous test when the switch was not inserted.
During the period that the switch was changing from 1 source to the other there was no observed roll.
60.3.1.2 TechSource graphics adapter card / CDG as the sources of the signal to be switched.
Observing the display with the switch in the static position resulted in an image of the same quality as observed in the previous test when the switch was not inserted.
During the period that the switch was changing from 1 source to the other there was no observed roll.
Table 12 TechSource Switch Summary

61
60.3.2 Extron switch
60.3.2.1 Barco graphics adapter card / CDG as the sources of the signal to be switched.
Pattern was shifted 75 mm to the right. Switch will not be considered for use.
60.3.2.2 TechSource graphics adapter card / CDG as the sources of the signal to be switched.
Not performed
Table 13 Extron Switch Summary
60.3.3 Matrix switch
60.3.3.2 TechSource graphics adapter card / CDG as the sources of the signal to be switched.
Longer settling time than observed with the TechSource switch. Noticeable change in the pattern as the switch changed.
60.3.3.1 Barco graphics adapter card / CDG as the sources of the signal to be switched.
Longer settling time than observed 60.3.3.2. Noticeable change in the pattern as the switch changed.
Table 14 Matrix Switch Summary
6.2.2 Recommendations
The Extron switch was not acceptable because the video image was shifted right 75 mm when the video signal statically passed through the Extron switch.
The TechSource video switch was included in the evaluation for comparison and as a back-up alternative. While the switch behavior was acceptable, it only has 2 video inputs while 3 are needed for the proposed architecture. Accordingly, the switch is not recommended for use.
The Matrix switch was acceptable both during the static and the dynamic switch behavior. When the switch was actuated, there was a discernible change in pattern. However, this could be due to the rotary switch that was used to drive the Matrix video switch. In addition, there was a minor shift (~2mm) of the video picture to the right while using both the Barco graphics card (and TechSource graphics adapter card).
62
10 Appendix I: Team Work Experience
Eagan ViewManThe ViewMan team was composed of the following personnel:
Lead/Consultant: Jim BocchiMr. Bocchi, a senior system engineer of LMATM Eagan, has worked Air Traffic Control for the past 18 years. He has developed ATM CHI requirements in the display technology area. He has been the display architect on the ARTS Color Display (ACD), Remote ACD, and Micro-EARTS Controller Workstation. Mr. Bocchi is the original developer of the ViewMan Library and continues to support upgrades to the ViewMan Library.
Mr. Bocchi has the following pertinent domain experience: - System: UNIX, Solaris- Language: C- Tools: ViewMan
Programmer: Crystal DeRemerMs. DeRemer earned a B.S. in Applied Mathematics with a Computer Science minor in May of 1999. She joined Lockheed Martin Air Traffic Management in January of 1999 as a co-op and worked on Micro-EARTS (Micro-processor En Route Automate Radar Tracking System) doing Program Technical Reports for an off-line Windows based application. Ms. DeRemer next developed and executed of test procedures and performed code reviews for the Micro-EARTS program. In mid 2000 she began developing software for site adaptation and display processing.
Ms. DeRemer has the following pertinent domain experience: - System: DOS, AIX, and Solaris- Language: C, C++, Java languages- Hardware: Sun Sparc, Barco graphics card, DCX and RISC 6000- Tools: Little to no ViewMan
Programmer: David MannMr. Mann graduated from Valpariso University in December of 1999 with a B.S. in Computer Science. He joined Lockheed Martin Air Traffic Management in January of 2000. His first assignment was display development in URET and used X11, Motif and C. In October of 2000, Mr. Mann began work on the DPTO.
Mr. Mann has the following pertinent domain experience: - System: UNIX, Solaris, WinNT- Language: C, C++, Java, and OpenGL- Tools: No ViewMan

63
Gallium InterMAPhicsThe InterMAPhics team was composed of the following personnel:
Consultant: Brad JessupMr. Jessup, an employee of Gallium, has 11 years InterMAPhics software development experience in the Air Traffic Control, Air Defense and Command and Control domains. Major projects that he has worked are:
- DSR Simulation System for Civil Aeromedical Institute.- Canadian Automated Air Traffic System for Raytheon Systems
Canada.- Swiss Control ADAPT ATC System for Raytheon Systems Canada.- NERC Prototype for UK NATS.
Mr. Jessup has the following pertinent domain experience:- System: Unix, PCs, Solaris- Language: C, C++, Ada 83/95.- Tools: InterMAPhics
Lead Programmer: Pete LoevingerMr. Loevinger has 12 years experience in ATC software development. Major projects that he has worked are:
- Initial Sector Suite System (ISSS) NAS Modifications (4 years)- ISSS Display Recording Analysis (1 year)- Icelandic Air Defense System (1 year)- New En-Route Center (4 years)- DSR and User Request Evaluation Tool (URET) (2 years)
Mr. Loevinger has the following pertinent domain experience: - System: AIX, Unix, Solaris, DSR- Language: Ada, Jovial- Tools: No InterMAPhics
Programmer: Susan DickMs. Dick graduated from Lynchburg College in May of 2000 with a B.S. in Computer Science. Ms. Dick joined Lockheed Martin in May of 2000. Her initial assignment was unit testing for the URET program until she joined the DPTO study in October of 2000.
Ms. Dick has the following pertinent domain experience: - Language: C++ (2 years)- Tools: No InterMAPhics

64
Orthogon ODS ToolboxThe ODS Toolbox team was composed of the following personnel:
Consultant: Dr. Bernd MeyerDr. Meyer, an employee of Orthogon, has been a senior system developer, provided onsite and educational support for the ODS Toolbox since 1994. His onsite support experience is:
10-12/96: Siemens Plessey/AIRSYS, Chessington, UK2-3/97: Siemens Plessey, AustroControl, Vienna, Austria9/97: SsangYong, Seoul, Korea10/97 - 3/98: Raytheon, Marlborough, MA, USA4/99 – 8/99: Indra ATM, Madrid, Spain
Dr. Meyer has the following pertinent domain experience: - System: Unix, PC’s- Language: C, C++, Pascal, Visual Basic- Tools: X-Windows, OSF/Motif, GKS, XVT, ODS Toolbox
Lead Programmer: Mary Ellen McGloneMs. McGlone, a senior software engineer, has 30 years experience in a variety of military and government application areas, using high-level, assembler, and microprocessor level programming languages. She has six years experience in air traffic management, in radar, simulation, and integration test areas. Ms. McGlone has the following pertinent domain experience:
- System: AIX- Language: C, Ada- Tools: No ODS Toolbox experience.
Programmer: Doug MitchellMr. Mitchell has 8 years experience in air traffic control. During this period he maintained the PAMRI software and hardware, and more recently he has maintained DSR software for the last 5 years. Mr. Mitchell has a B.S. and M.S. in Computer Science.Mr. Mitchell has the following pertinent domain experience:
- System: PC, DSR- Language: C, C++, Pascal, Ada, Java and Visual Basic- Tools: No ODS Toolbox experience.
Programmer: Min GongMs. Gong graduated from Purdue University in May of 2000 majoring in Computer Science. Ms. Gong joined Lockheed Martin in May of 2000. Her initial assignment was string and unit test for the URET program until she joined the DPTO study in October of 2000.
Ms. Gong has the following pertinent domain experience: - Language: C++ (3 years), some C and Java. - Tools: No ODS Toolbox experience.

65
20 Appendix II: Performance Run Manual Check list
1. Latency Set FDB font size to maximum Reduce target brightness to 60 Set FDB and master brightness to maximum (100) Dwell cursor on test track or user dwell if implemented No keyboard entry during this test Start camera at 60 seconds after run starts (directed by script) For each test, display the test label (e.g. O-1) below LED, illuminated by
flashlight Take 35 measurements at 4 second intervals (driven by script) Clear each LED lighting with clear button press
2. Move Frame Apply dwell to the test track if user dwell implemented Start camera at 60 seconds after run starts (directed by script) For each test, display the test label (e.g. O-1) below LED, illuminated by
flashlight Select DC view frame and move continuously in circular motion. Take 35 measurements at 4 second intervals (driven by script) Clear each LED lighting with clear button press
Press keyboard cancel to clear move frame
3. Inset Show inset view Range inset to 250 NMI with default offset Dwell cursor on test track or user dwell if implemented Start camera at 60 seconds after run starts (directed by script) For each test, display the test label (e.g. O-1) below LED, illuminated by
flashlight Take 35 measurements at 4 second intervals Clear each LED lighting with clear button press Suppress inset view
4. Range Apply user dwell if implemented Start camera at 60 seconds after run starts (directed by script) For each test, display the test label (e.g. O-1) below LED illuminated by flashlight Change range with DC view toggling between 400 and 250 NMI at 1
cycle/second Take 35 measurements at 4 second intervals Clear each LED lighting with clear button press
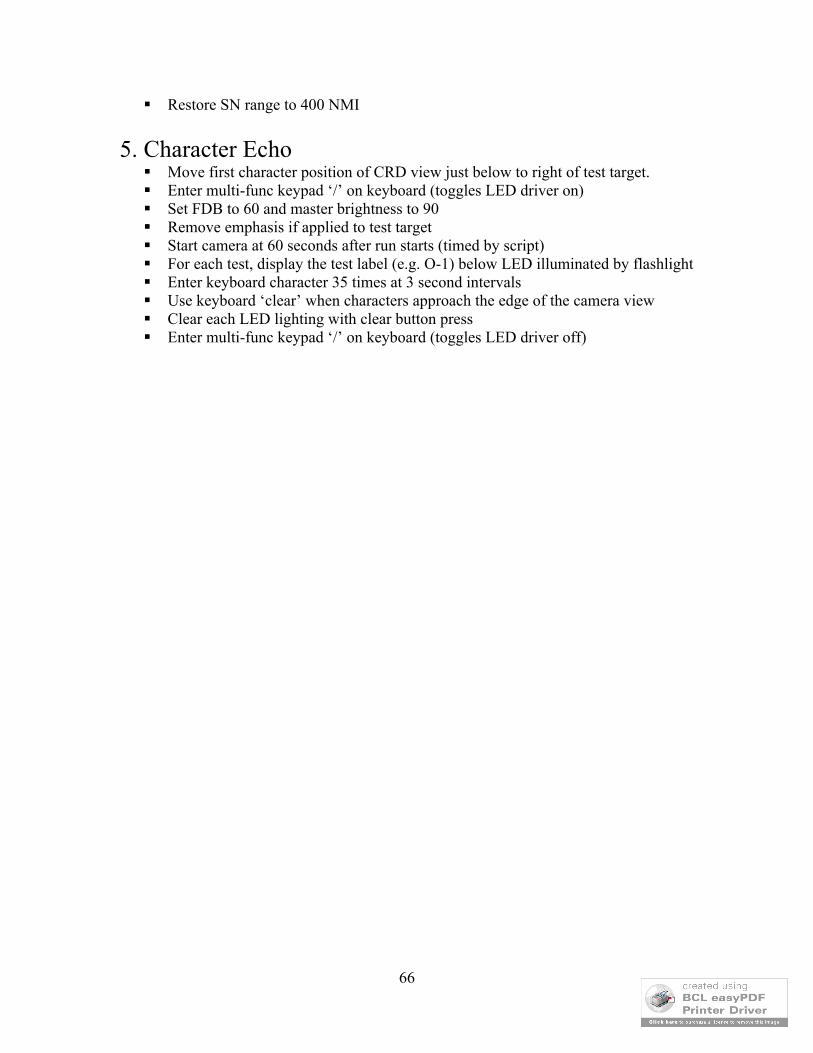
66
Restore SN range to 400 NMI
5. Character Echo Move first character position of CRD view just below to right of test target. Enter multi-func keypad ‘/’ on keyboard (toggles LED driver on) Set FDB to 60 and master brightness to 90 Remove emphasis if applied to test target Start camera at 60 seconds after run starts (timed by script) For each test, display the test label (e.g. O-1) below LED illuminated by flashlight Enter keyboard character 35 times at 3 second intervals Use keyboard ‘clear’ when characters approach the edge of the camera view Clear each LED lighting with clear button press Enter multi-func keypad ‘/’ on keyboard (toggles LED driver off)

67
30 Appendix III: Timing Measurements

68
Figure 14 Track Latency Summary: Graphical
Single Host
Dual Host
Eagan/TechSource E-1 Track Latency
-200400600800
1,000
1 4 7 10
13
16
19
22
25
28
Eagan/Barco E-11 Track Latency
-200400600800
1,000
1 4 7 10
13
16
19
22
25
28
Gallium/TechSource G-1 Track Latency
0200400600800
1,000
1 4 7 10
13
16
19
22
25
28
Orthogon/TechSource O-1 Track Latency
0200400600800
1,000
1 4 7 10
13
16
19
22
25
28
Gallium/Barco G-11 Track Latency
0200400600800
1,000
1 4 7 10
13
16
19
22
25
28
Orthogon/Barco O-11 Track Latency
0200400600800
1,000
1 4 7 10
13
16
19
22
25
28
Eagan/TechSource E-16 Track Latency
-200400600800
1,000
1 4 7 10
13
16
19
22
25
28
Gallium/TechSource G-16 Track Latency
0200400600800
1,000
1 4 7 10
13
16
19
22
25
28
Orthogon/TechSource O-16 Track Latency
0200400600800
1,000
1 4 7 10
13
16
19
22
25
28
Eagan/Barco E-6 Track Latency
-200400600800
1,000
1 4 7 10
13
16
19
22
25
28
Gallium/Barco G-6 Track Latency
0200400600800
1,000
1 4 7 10
13
16
19
22
25
28
Orthogon/Barco O-6 Track Latency
0200400600800
1,000
1 4 7 10
13
16
19
22
25
28
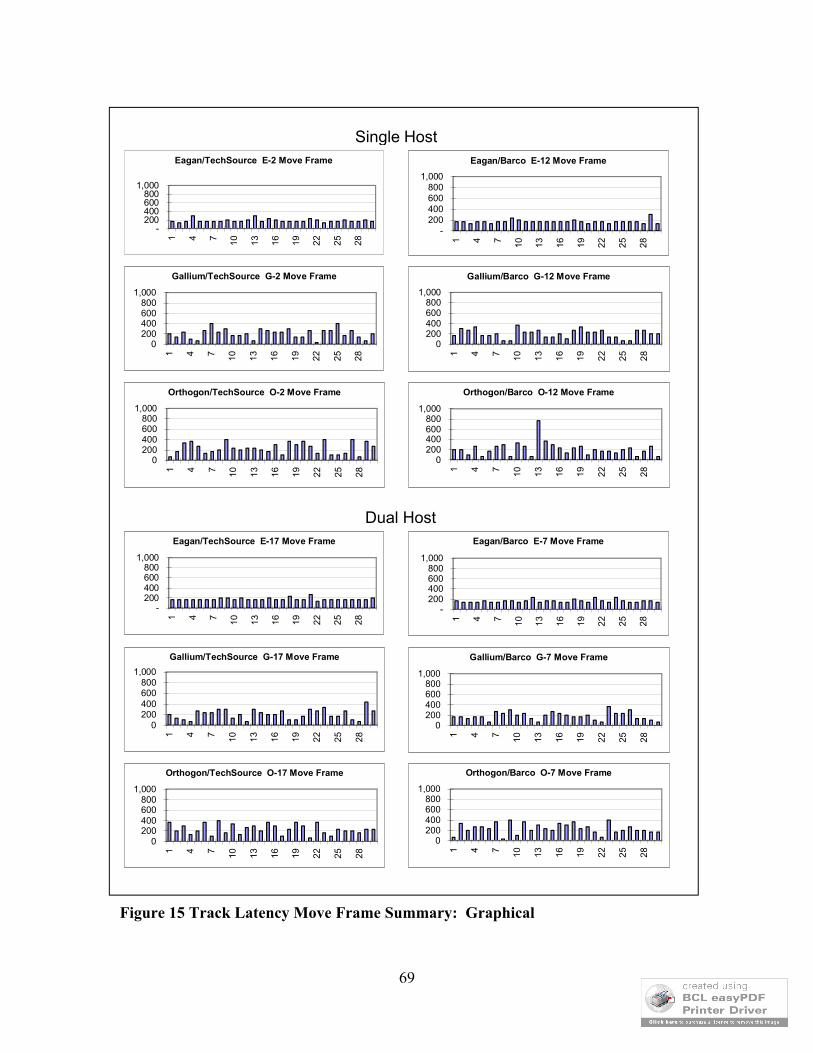
69
Figure 15 Track Latency Move Frame Summary: Graphical
Single Host
Dual Host
Eagan/TechSource E-2 Move Frame
-200400600800
1,000
1 4 7 10 13 16 19 22 25 28
Eagan/Barco E-12 Move Frame
-200400600800
1,000
1 4 7 10 13 16 19 22 25 28
Gallium/TechSource G-2 Move Frame
0200400600800
1,000
1 4 7 10 13 16 19 22 25 28
Gallium/Barco G-12 Move Frame
0200400600800
1,000
1 4 7 10 13 16 19 22 25 28
Orthogon/TechSource O-2 Move Frame
0200400600800
1,000
1 4 7 10 13 16 19 22 25 28
Orthogon/Barco O-12 Move Frame
0200400600800
1,000
1 4 7 10 13 16 19 22 25 28
Eagan/TechSource E-17 Move Frame
-200400600800
1,000
1 4 7 10 13 16 19 22 25 28
Eagan/Barco E-7 Move Frame
-200400600800
1,000
1 4 7 10 13 16 19 22 25 28
Gallium/TechSource G-17 Move Frame
0200400600800
1,000
1 4 7 10 13 16 19 22 25 28
Orthogon/TechSource O-17 Move Frame
0200400600800
1,000
1 4 7 10 13 16 19 22 25 28
Gallium/Barco G-7 Move Frame
0200400600800
1,000
1 4 7 10 13 16 19 22 25 28
Orthogon/Barco O-7 Move Frame
0200400600800
1,000
1 4 7 10 13 16 19 22 25 28

70
Figure 16 Track Latency Inset Open Summary: Graphical
Single Host
Dual Host
Eagan/TechSource E-3 Inset Open
-200400600800
1,0001 4 7 10
13
16
19
22
25
28
Eagan/Barco E-13 Inset Open
-200400600800
1,000
1 4 7 10
13
16
19
22
25
28
Gallium/TechSource G-3 Inset Open
0200400600800
1,000
1 4 7
10
13
16
19
22
25
28
Gallium/Barco G-13 Inset Open
0200400600800
1,000
1 4 7
10
13
16
19
22
25
28
Orthogon/TechSource O-3 Inset Open
0200400600800
1,000
1 4 7 10
13
16
19
22
25
28
Orthogon/Barco O-13 Inset Open
0200400600800
1,000
1 4 7
10
13
16
19
22
25
28
Eagan/TechSource E-18 Inset Open
-200400600800
1,000
1 4 7
10
13
16
19
22
25
28
Eagan/Barco E-8 Inset Open
-200400600800
1,000
1 4 7 10
13
16
19
22
25
28
Gallium/TechSource G-18 Inset Open
0200400600800
1,000
1 4 7 10
13
16
19
22
25
28
Orthogon/TechSource O-18 Inset Open
0200400600800
1,000
1 4 7 10
13
16
19
22
25
28
Gallium/Barco G-8 Inset Open
0200400600800
1,000
1 4 7 10
13
16
19
22
25
28
Orthogon/Barco O-8 Inset Open
0200400600800
1,000
1 4 7 10
13
16
19
22
25
28
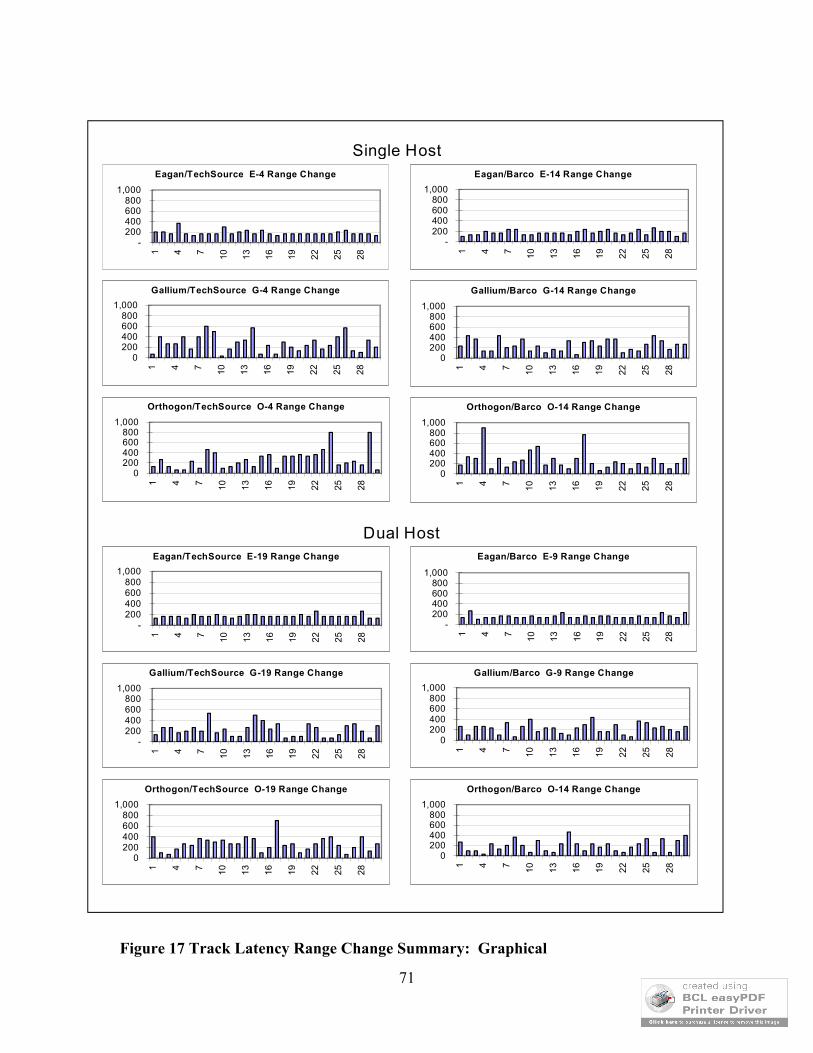
71
Figure 17 Track Latency Range Change Summary: Graphical
Single Host
Dual Host
Eagan/TechSource E-4 Range Change
-200400600800
1,000
1 4 7 10 13 16 19 22 25 28
Gallium/TechSource G-4 Range Change
0200400600800
1,000
1 4 7 10 13 16 19 22 25 28
Eagan/Barco E-14 Range Change
-200400600800
1,000
1 4 7 10 13 16 19 22 25 28
Gallium/Barco G-14 Range Change
0200400600800
1,000
1 4 7 10 13 16 19 22 25 28
Orthogon/TechSource O-4 Range Change
0200400600800
1,000
1 4 7 10 13 16 19 22 25 28
Orthogon/Barco O-14 Range Change
0200400600800
1,000
1 4 7 10 13 16 19 22 25 28
Eagan/TechSource E-19 Range Change
-200400600800
1,000
1 4 7 10 13 16 19 22 25 28
Eagan/Barco E-9 Range Change
-200400600800
1,000
1 4 7 10 13 16 19 22 25 28Gallium/Barco G-9 Range Change
0200400600800
1,000
1 4 7 10 13 16 19 22 25 28Gallium/TechSource G-19 Range Change
-200400600800
1,000
1 4 7 10 13 16 19 22 25 28
Orthogon/TechSource O-19 Range Change
0200400600800
1,000
1 4 7 10 13 16 19 22 25 28
Orthogon/Barco O-14 Range Change
0200400600800
1,000
1 4 7 10 13 16 19 22 25 28

72
Figure 18 Track Character Echo Summary: Graphical
Single Host
Dual Host
Eagan/TechSource E-5 Character Echo
-200400600800
1,000
1 4 7 10 13 16 19 22 25 28
Eagan/Barco E-15 Character Echo
-200400600800
1,000
1 4 7 10 13 16 19 22 25 28
Gallium/TechSource G-5 Character Echo
0200400600800
1,000
1 4 7 10 13 16 19 22 25 28
Gallium/Barco G-15 Character Echo
0200400600800
1,000
1 4 7 10 13 16 19 22 25 28
Orthogon/TechSource O-5 Character Echo
0200400600800
1,000
1 4 7 10 13 16 19 22 25 28
Orthogon/Barco O-15 Character Echo
0200400600800
1,000
1 4 7 10 13 16 19 22 25 28
Eagan/TechSource E-20 Character Echo
-200400600800
1,000
1 4 7 10 13 16 19 22 25 28
Gallium/TechSource G-20 Character Echo
-200400600800
1,000
1 4 7 10 13 16 19 22 25 28
Orthogon/TechSource O-20 Character Echo
0200400600800
1,000
1 4 7 10 13 16 19 22 25 28
Eagan/Barco E-10 Character Echo
-200400600800
1,000
1 4 7 10 13 16 19 22 25 28Gallium/Barco G-10 Character Echo
0200400600800
1,000
1 4 7 10 13 16 19 22 25 28
Orthogon/Barco O-10 Character Echo
0200400600800
1,000
1 4 7 10 13 16 19 22 25 28
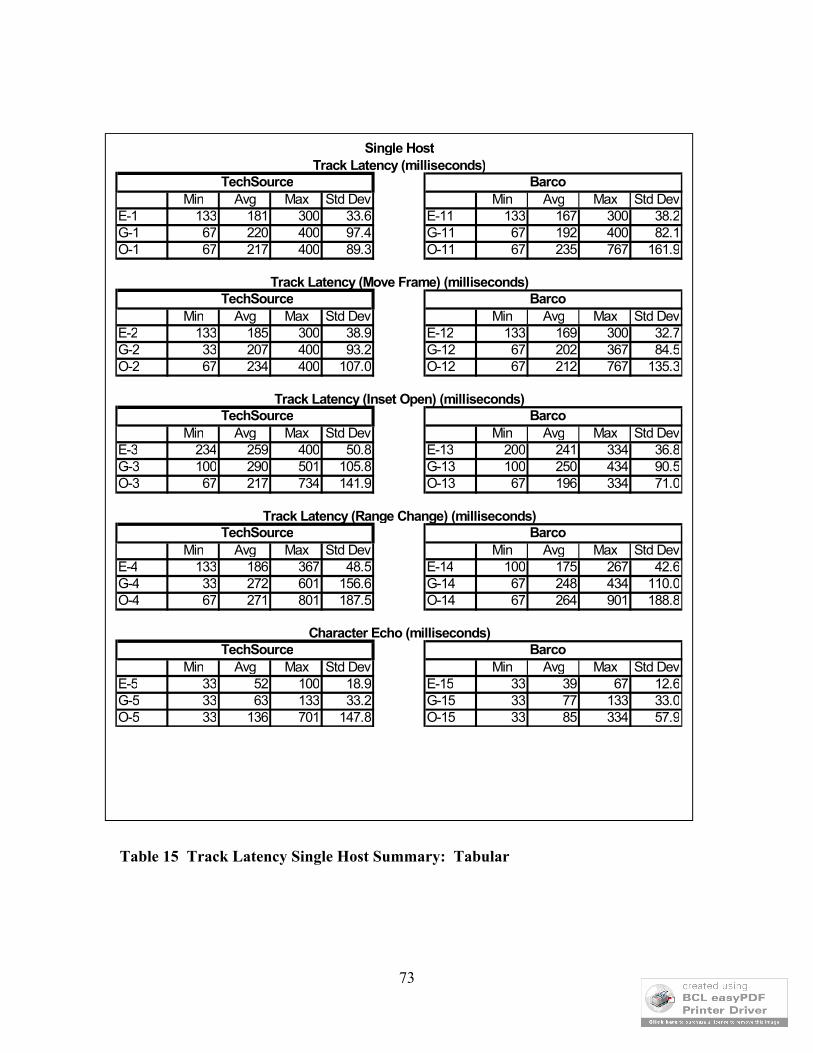
73
Table 15 Track Latency Single Host Summary: Tabular
Single HostTrack Latency (milliseconds)
TechSource BarcoMin Avg Max Std Dev Min Avg Max Std Dev
E-1 133 181 300 33.6 E-11 133 167 300 38.2G-1 67 220 400 97.4 G-11 67 192 400 82.1O-1 67 217 400 89.3 O-11 67 235 767 161.9
Track Latency (Move Frame) (milliseconds)TechSource Barco
Min Avg Max Std Dev Min Avg Max Std DevE-2 133 185 300 38.9 E-12 133 169 300 32.7G-2 33 207 400 93.2 G-12 67 202 367 84.5O-2 67 234 400 107.0 O-12 67 212 767 135.3
Track Latency (Inset Open) (milliseconds)TechSource Barco
Min Avg Max Std Dev Min Avg Max Std DevE-3 234 259 400 50.8 E-13 200 241 334 36.8G-3 100 290 501 105.8 G-13 100 250 434 90.5O-3 67 217 734 141.9 O-13 67 196 334 71.0
Track Latency (Range Change) (milliseconds)TechSource Barco
Min Avg Max Std Dev Min Avg Max Std DevE-4 133 186 367 48.5 E-14 100 175 267 42.6G-4 33 272 601 156.6 G-14 67 248 434 110.0O-4 67 271 801 187.5 O-14 67 264 901 188.8
Character Echo (milliseconds)TechSource Barco
Min Avg Max Std Dev Min Avg Max Std DevE-5 33 52 100 18.9 E-15 33 39 67 12.6G-5 33 63 133 33.2 G-15 33 77 133 33.0O-5 33 136 701 147.8 O-15 33 85 334 57.9

74
f
Table 16 Track Latency Dual Host Summary: Tabular
Dual HostTrack Latency (milliseconds)
TechSource BarcoMin Avg Max Std Dev Min Avg Max Std Dev
E-16 133 178 234 20.2 E-6 133 152 234 24.3G-16 33 208 434 93.7 G-6 33 182 334 81.1O-16 67 239 734 133.6 O-6 67 260 834 160.2
Track Latency (Move Frame) (milliseconds)TechSource Barco
Min Avg Max Std Dev Min Avg Max Std DevE-17 133 177 267 25.0 E-7 133 159 234 31.2G-17 67 206 434 91.4 G-7 67 182 367 76.3O-17 67 237 400 95.6 O-7 33 236 400 98.3
Track Latency (Inset Open) (milliseconds)TechSource Barco
Min Avg Max Std Dev Min Avg Max Std DevE-18 200 239 400 47.2 E-8 167 216 334 31.3G-18 100 259 400 79.6 G-8 133 256 434 90.8O-18 67 197 434 109.8 O-8 67 221 901 159.5
Track Latency (Range Change) (milliseconds)TechSource Barco
Min Avg Max Std Dev Min Avg Max Std DevE-19 133 174 267 32.0 E-9 100 157 267 38.3G-19 67 224 534 123.8 G-9 67 226 434 97.5O-19 67 266 701 132.9 O-9 33 197 467 114.4
Character Echo (milliseconds)TechSource Barco
Min Avg Max Std Dev Min Avg Max Std DevE-20 33 49 67 16.9 E-10 33 49 67 16.9G-20 33 79 167 43.3 G-10 33 58 100 24.7O-20 33 107 567 121.4 O-10 33 80 300 55.8
75
Figure 19 shows an example spreadsheet for one of the 60 tests. The spreadsheet program automatically calculated the Frames, Time (in milliseconds) and Standard Deviation (every five samples).
The histogram below shows the sample times graphically. The histograms for all 60 tests are show in 30

76
Appendix III: Timing Measurements. They are organized by the 5 test variations so that the results for each vendor, graphics card and one versus two CPU hosts configuration can be seen on a single page for easy comparison.
Figure 19 Example of Single Host, Eagan/TechSource E-1 Track Latency
Minute Second Frame Minute Second Frame Frames Time Std Dev1 0 33 2 0 33 7 6 200 2 0 36 25 0 36 29 5 167 3 0 40 19 0 40 23 5 167 4 0 44 12 0 44 16 5 167 5 0 48 5 0 48 10 6 200 18.36 0 51 29 0 52 2 4 133 7 0 55 22 0 55 26 5 167 8 0 59 15 0 59 19 5 167 9 1 3 10 1 3 15 6 200
10 1 7 4 1 7 8 5 167 21.111 1 10 27 1 11 4 8 267 12 1 14 20 1 14 24 5 167 13 1 18 14 1 18 18 5 167 14 1 22 7 1 22 13 7 234 15 1 26 0 1 26 4 5 167 33.016 1 29 24 1 29 28 5 167 17 1 33 17 1 33 25 9 300 18 1 37 10 1 37 14 5 167 19 1 41 3 1 41 7 5 167 20 1 44 27 1 45 1 5 167 39.721 1 48 20 1 48 24 5 167 22 1 52 13 1 52 17 5 167 23 1 56 7 1 56 11 5 167 24 2 0 2 2 0 6 5 167 25 2 3 25 2 3 29 5 167 36.126 2 7 18 2 7 23 6 200 27 2 11 12 2 11 16 5 167 28 2 15 5 2 15 10 6 200 29 2 18 28 2 19 2 5 167 30 2 22 22 2 22 26 5 167 33.6
Date DAT Tape VHS Tape Graphics Sun 1 (T) Sun 2 (B)TechSrc N/A P A X K
Track LatencyNetwork message to Position Symbol Change
-
200
400
600
800
1,000
1 2 3 4 5 6 7 8 9 10 11 12 13 14 15 16 17 18 19 20 21 22 23 24 25 26 27 28 29 30

77
40 Appendix IV: Timing Measurement Statistical Analysis
Data SetBefore one can analyze the timing measurements obtained, it is important to understand the nature of how the measurements were taken and what those measurements were designed to show. Normally when one measures system timing, an interesting event is sandwiched with timers and samples of measurements are taken of the repeated event with a constant system load to obtain information about the duration of that event. That information, combined with other such event measurements, is then used to make inferences about overall system performance.
However, that is not the method employed here. Rather than measuring overall system performance, these data represent system response times over a variety of changing system loads. In an Air Traffic Control System, consistent and quick response of the system is important and may be required at any time during the normal display of radar data. It is undesirable for the system to appear to hesitate. This viewpoint of response as opposed to overall performance is key to the analysis and interpretation of the measurement data. Since the system load is varying randomly with respect to the response time measurements, one would expect the response time to vary as well. Therefore, the standard deviation is an interesting attribute of the response time measurements, with small deviations indicating an even response time over a variety of system load conditions.
Measurement TechniqueThe System Under Test (SUT) was subjected to 5 different sets of load conditions. During each of the 5 load sets, an external system would execute a command that would turn on an external LED light attached by suction cup to the face of the display for the SUT, followed immediately by issuing a command to the SUT to change a symbol in the center of the display. The response time is defined as the duration between the appearance of light from the LED and the change of the symbol at the center of the display. This response event was repeated 30 times for each load condition set to obtain a statistically valid sample over the range of load conditions within each set. As this proceeded, an external digital video camera was focused with the LED light and the changing symbol within its range of view, recording all response events on digital videotape.
Once recorded, the videotape was reviewed manually, utilizing a digital video playback device that would display frame numbers and have the capability of single frame advance. The frame number of the light turning on and the subsequent frame number of the character change were recorded with a minimum of three participants using pencil and electronic spreadsheet mediums with cross checking to insure accuracy. The number of elapsed video frames indicates the absolute time measurement with a frame resolution

78
of 30ms (NTSC standard). All measurements were later independently reviewed for accuracy and corrected as needed.
The 5 sets of load conditions were repeated for a total of 4 hardware configurations giving a total of 20 sets of measurements for each of the 3 prototype systems (Eagan, Gallium, and Orthogon). This yields 60 sets of tests with 30 samples per set giving a total of 1800 samples for the duration of the measurements.
Statistical Analysis of Variance MethodologyThe key point of interest in the data sets is the consistency of response, using the standard deviation s and the variance s2 as the indicators. As such, the standard F-Test Analysis of Variance (ANOVA) was applied to like pairs of sample sets in the measurement method for Homogeneity of Variance test to estimate the probability of no difference existing between the variances as the null hypothesis H0. The alternate hypothesis H1 is that there is a difference between the two variances tested. After the test statistic F is calculated, the probability of no difference is looked up using a standard F distribution table with 29 Degrees of Freedom (df) for each sample set (df=n-1). The probability PF has the property 0 < PF < 1, where PF close to 1 would accept the null hypothesis of there being no difference, and PF close to 0 would reject the null hypothesis accepting the alternate hypothesis that there is in fact a statistically significant difference. PF also defines the confidence interval. In the attached spreadsheets, the standard FTEST function of Excel was applied to each pair of measurement sets, which reports the probability identifier PF
without showing the intermediate test statistic F, which also gives a more simple presentation of the result.
Analysis of ResultsOn examination one can see that there is a very high confidence (95.3%-99.9%) that the Eagan measurements, without exception, have a statistically smaller variance and standard deviation compared with both Gallium and Orthogon, meaning that Eagan has substantially more consistent response times. Between Gallium and Orthogon, Gallium clearly has a more consistent response time for most tests. However, the results are not so clear on a few of the test sets (particularly the Range Change sets), where there is little statistical difference. For those cases, further statistical study was performed (as described below). In general, these overall results concur with human observations made during the tests.
Students t-test Difference in MeansWhen the Homogeneity of Variance F-Test is inconclusive for determining a difference in variance, the Students t-test for comparing means may be applied. This was the case for six of the sample sets between Gallium and Orthogon. For these sets, the t-test was performed concluding that for three of those cases, the Gallium and Orthogon prototypes had similar response times. Two cases reveal that the Gallium system had a quicker mean response time, with one test showing Orthogon as having better response.

79
Numerical Analysis ConclusionsAfter close examination, the measurement data appears to be accurate, statistically valid, and revealing as to the response performance of the three prototype candidates. The results also corroborate human qualitative observations made during the test proceedings, further validating the statistical results.
The Eagan system appears to clearly have the most consistent and smooth response times under the variety of system loads presented. The Gallium system ranks second for this set of tests, with the Orthogon system showing the widest variation and overall slowest response times, although it made a good showing on a few of the tests. It is interesting that the Eagan system appears to have had a slightly slower mean response than Gallium for test 4 and slightly slower than Orthogon for tests 13 and 18, but this relatively small difference is overshadowed by the consistency of response.

80
Figure 20 Tests 1 through 5 Analysis of Variation
s represents the sample standard deviation
P represents the probability that the compared variances (s 2 ) have no difference
Note: 0 < P < 1
When P approaches 0, the variances are statistically different
When P approaches 1, the variances are statistically equal
P is calculated using a standard F-Test (ANOVA), utilizing the standard Excel function
Test 1Eagan s= 33.58 Gallium s= 97.42 Orthogon s= 89.25
Eagan vs Gallium P = 0.00000Gallium vs Orthogon P = 0.64047Orthogon vs Eagan P = 0.00000
Test 2Eagan s= 38.89 Gallium s= 93.22 Orthogon s= 107.03
Eagan vs Gallium P = 0.00001Gallium vs Orthogon P = 0.46154Orthogon vs Eagan P = 0.00000
Test 3Eagan s= 50.80 Gallium s= 105.83 Orthogon s= 141.89
Eagan vs Gallium P = 0.00017Gallium vs Orthogon P = 0.11997Orthogon vs Eagan P = 0.00000
Test 4Eagan s= 48.49 Gallium s= 93.22 Orthogon s= 107.03
Eagan vs Gallium P = 0.00000Gallium vs Orthogon P = 0.33798Orthogon vs Eagan P = 0.00000
Test 5Eagan s= 18.94 Gallium s= 33.16 Orthogon s= 147.76
Eagan vs Gallium P = 0.00354Gallium vs Orthogon P = 0.00000Orthogon vs Eagan P = 0.00000
Analysis of VarianceDPTO Timing Measurement Data

81
Figure 21 Tests 6 through 10 Analysis of Variation
s represents the sample standard deviation
P represents the probability that the compared variances (s 2 ) have no difference
Note: 0 < P < 1
When P approaches 0, the variances are statistically different
When P approaches 1, the variances are statistically equal
P is calculated using a standard F-Test (ANOVA), utilizing the standard Excel function
Test 6Eagan s= 24.29 Gallium s= 81.13 Orthogon s= 160.24
Eagan vs Gallium P = 0.00000Gallium vs Orthogon P = 0.00045Orthogon vs Eagan P = 0.00000
Test 7Eagan s= 31.21 Gallium s= 76.26 Orthogon s= 98.33
Eagan vs Gallium P = 0.00001Gallium vs Orthogon P = 0.17690Orthogon vs Eagan P = 0.00000
Test 8Eagan s= 31.27 Gallium s= 90.78 Orthogon s= 159.54
Eagan vs Gallium P = 0.00000Gallium vs Orthogon P = 0.00332Orthogon vs Eagan P = 0.00000
Test 9Eagan s= 38.35 Gallium s= 97.45 Orthogon s= 114.37
Eagan vs Gallium P = 0.00000Gallium vs Orthogon P = 0.39378Orthogon vs Eagan P = 0.00000
Test 10Eagan s= 16.93 Gallium s= 24.68 Orthogon s= 55.83
Eagan vs Gallium P = 0.04667Gallium vs Orthogon P = 0.00003Orthogon vs Eagan P = 0.00000
Analysis of VarianceDPTO Timing Measurement Data

82
Figure 22 Tests 11 through 15 Analysis of Variation
s represents the sample standard deviation
P represents the probability that the compared variances (s 2 ) have no difference
Note: 0 < P < 1
When P approaches 0, the variances are statistically different
When P approaches 1, the variances are statistically equal
P is calculated using a standard F-Test (ANOVA), utilizing the standard Excel function
Test 11Eagan s= 38.19 Gallium s= 82.05 Orthogon s= 161.92
Eagan vs Gallium P = 0.00009Gallium vs Orthogon P = 0.00046Orthogon vs Eagan P = 0.00000
Test 12Eagan s= 32.71 Gallium s= 84.47 Orthogon s= 135.32
Eagan vs Gallium P = 0.00000Gallium vs Orthogon P = 0.01344Orthogon vs Eagan P = 0.00000
Test 13Eagan s= 36.85 Gallium s= 90.53 Orthogon s= 71.04
Eagan vs Gallium P = 0.00001Gallium vs Orthogon P = 0.19768Orthogon vs Eagan P = 0.00070
Test 14Eagan s= 42.64 Gallium s= 110.03 Orthogon s= 188.82
Eagan vs Gallium P = 0.00000Gallium vs Orthogon P = 0.00483Orthogon vs Eagan P = 0.00000
Test 15Eagan s= 12.65 Gallium s= 32.96 Orthogon s= 57.95
Eagan vs Gallium P = 0.00000Gallium vs Orthogon P = 0.00330Orthogon vs Eagan P = 0.00000
DPTO Timing Measurement Data

83
Figure 23 Tests 16 through 20 Analysis of Variation
s represents the sample standard deviation
P represents the probability that the compared variances (s 2 ) have no difference
Note: 0 < P < 1
When P approaches 0, the variances are statistically different
When P approaches 1, the variances are statistically equal
P is calculated using a standard F-Test (ANOVA), utilizing the standard Excel function
Test 16Eagan s= 20.22 Gallium s= 93.74 Orthogon s= 133.64
Eagan vs Gallium P = 0.00000Gallium vs Orthogon P = 0.06091Orthogon vs Eagan P = 0.00000
Test 17Eagan s= 24.99 Gallium s= 91.43 Orthogon s= 95.63
Eagan vs Gallium P = 0.00000Gallium vs Orthogon P = 0.81027Orthogon vs Eagan P = 0.00000
Test 18Eagan s= 47.21 Gallium s= 79.60 Orthogon s= 109.81
Eagan vs Gallium P = 0.00634Gallium vs Orthogon P = 0.08851Orthogon vs Eagan P = 0.00002
Test 19Eagan s= 32.04 Gallium s= 123.84 Orthogon s= 132.90
Eagan vs Gallium P = 0.00000Gallium vs Orthogon P = 0.70652Orthogon vs Eagan P = 0.00000
Test 20Eagan s= 16.91 Gallium s= 43.31 Orthogon s= 121.42
Eagan vs Gallium P = 0.00000Gallium vs Orthogon P = 0.00000Orthogon vs Eagan P = 0.00000
Analysis of VarianceDPTO Timing Measurement Data

84
50 Appendix V: CPU and Memory Measurements
Figure 24 Track Latency Prusage Summary: Graphical
Xserver+Application CPU Utilization - Single Host
Gallium / Barco G-11 Track Latency
0%10%20%30%40%50%
0 50
10
0
15
0
20
0
25
0
30
0
Elapsed Time (sec)
% C
PU
Xserver
Application
Eagan / Barco E-11 Track Latency
0%10%20%30%40%50%
0
50
10
0
15
0
20
0
25
0
30
0
Elapsed Time (sec)
% C
PU
Xserver
Application
Orthogon / TechSource O-1 Track Latency
0%10%20%30%40%50%
0
50
10
0
15
0
20
0
25
0
30
0
Elapsed Time (sec)
% C
PU
Xserver
Application
Gallium / TechSource G-1 Track Latency
0%10%20%30%40%50%
0 50
10
0
15
0
20
0
25
0
30
0
Elapsed Time (sec)
% C
PU
Xserver
Application
Eagan / TechSource E-1 Track Latency
0%10%20%30%40%50%
0 50
10
0
15
0
20
0
25
0
30
0
Elapsed Time (sec)
% C
PU
Xserver
Application
Orthogon / Barco O-11 Track Latency
0%10%20%30%40%50%
0 50
10
0
15
0
20
0
25
0
30
0
Elapsed Time (sec)
% C
PU
Xserver
Application
Xserver+Application CPU Utilization - Dual Host
Gallium / Barco G-6 Track Latency
0%10%20%30%40%50%
0 50
10
0
15
0
20
0
25
0
30
0
Elapsed Time (sec)
% C
PU
Xserver
Application
Eagan / Barco G-6 Track Latency
0%10%20%30%40%50%
0 50
10
0
15
0
20
0
25
0
30
0
Elapsed Time (sec)
% C
PU
Xserver
Application
Orthogon / TechSource O-16 Track Latency
0%10%20%30%40%50%
0
50
10
0
15
0
20
0
25
0
30
0
Elapsed Time (sec)
% C
PU
Xserver
Application
Gallium / TechSource G-16 Track Latency
0%10%20%30%40%50%
0
50
10
0
15
0
20
0
25
0
30
0
Elapsed Time (sec)
% C
PU
Xserver
Application
Eagan / TechSource E-16 Track Latency
0%10%20%30%40%50%
0 50
10
0
15
0
20
0
25
0
30
0
Elapsed Time (sec)
% C
PU
Xserver
Application
Orthogon / Barco O-6 Track Latency
0%10%20%30%40%50%
0
50
10
0
15
0
20
0
25
0
30
0
Elapsed Time (sec)
% C
PU
Xserver
Application

85
Table 17 Track Latency Prusage Summary: Tabular
Time Range Max Time Range Max100-200 s Heap (k) Min Avg Max Std Dev 100-200 s Heap (k) Min Avg Max Std DevXserver 904 0.1% 9.1% 18.8% 3.91 Xserver 13,344 0.1% 8.2% 17.6% 3.54Application 5,672 0.5% 2.5% 4.9% 0.87 Application 5,680 0.6% 2.5% 4.8% 0.87X+A 6,576 0.7% 11.6% 23.6% 4.77 X+A 19,024 0.7% 10.7% 22.4% 4.41
Time Range Max Time Range Max100-200 s Heap (k) Min Avg Max Std Dev 100-200 s Heap (k) Min Avg Max Std DevXserver 632 0.04% 6.4% 11.8% 1.71 Xserver 8,944 0.03% 7.5% 14.1% 2.05Application 62,072 1.1% 3.3% 9.9% 2.59 Application 62,072 1.2% 3.3% 10.0% 2.65X+A 62,696 1.2% 9.7% 21.7% 3.81 X+A 71,008 1.2% 10.8% 24.1% 4.19
Time Range Max Time Range Max100-200 s Heap (k) Min Avg Max Std Dev 100-200 s Heap (k) Min Avg Max Std DevXserver 800 0.2% 8.4% 15.9% 3.10 Xserver 9,608 0.1% 8.3% 18.5% 3.19Application 18,792 1.5% 11.3% 63.6% 12.12 Application 18,760 0.3% 10.8% 57.3% 12.21X+A 19,592 6.8% 19.7% 76.4% 12.80 X+A 28,368 0.4% 19.1% 75.5% 14.36
Total CPU Utilization
Gallium / TechSource G-1 Track Latency
Eagan / TechSource E-1 Track LatencyTotal CPU Utilization
Total CPU Utilization
Eagan / Barco E-11 Track LatencyTotal CPU Utilization
Gallium / Barco G-11 Track LatencyTotal CPU Utilization
Single Host
Orthogon / Barco O-11 Track Latency
Total CPU Utilization
Orthogon / TechSource O-1 Track Latency
Time Range Max Time Range Max100-200 s Heap (k) Min Avg Max Std Dev 100-200 s Heap (k) Min Avg Max Std DevXserver 896 0.1% 9.3% 20.0% 4.13 Xserver 13,344 0.1% 9.0% 20.4% 3.91Application 5,672 1.1% 2.4% 4.6% 0.75 Application 5,672 0.6% 2.4% 4.6% 0.78X+A 6,568 2.0% 11.7% 22.9% 4.24 X+A 19,016 2.9% 11.4% 22.2% 3.90
Time Range Max Time Range Max100-200 s Heap (k) Min Avg Max Std Dev 100-200 s Heap (k) Min Avg Max Std DevXserver 632 0.04% 7.2% 13.0% 1.90 Xserver 8,944 0.03% 7.9% 14.7% 1.91Application 62,072 1.3% 3.4% 9.9% 2.67 Application 62,072 0.2% 3.5% 10.3% 2.68X+A 62,704 2.2% 10.6% 17.0% 3.20 X+A 71,016 2.2% 11.5% 23.3% 3.21
Time Range Max Time Range Max100-200 s Heap (k) Min Avg Max Std Dev 100-200 s Heap (k) Min Avg Max Std DevXserver 800 0.2% 8.5% 16.7% 3.33 Xserver 9,616 0.1% 8.8% 17.4% 3.26Application 18,744 1.9% 11.1% 60.0% 11.88 Application 18,768 2.0% 11.5% 60.8% 12.72X+A 19,544 6.7% 19.6% 67.8% 12.17 X+A 28,384 9.2% 20.2% 67.7% 11.70
Dual Host
Orthogon / Barco O-6 Track Latency
Total CPU Utilization
Orthogon / TechSource O-16 Track LatencyTotal CPU Utilization
Eagan / Barco G-6 Track LatencyTotal CPU Utilization
Gallium / Barco G-6 Track LatencyTotal CPU Utilization
Total CPU Utilization
Gallium / TechSource G-16 Track Latency
Eagan / TechSource E-16 Track LatencyTotal CPU Utilization
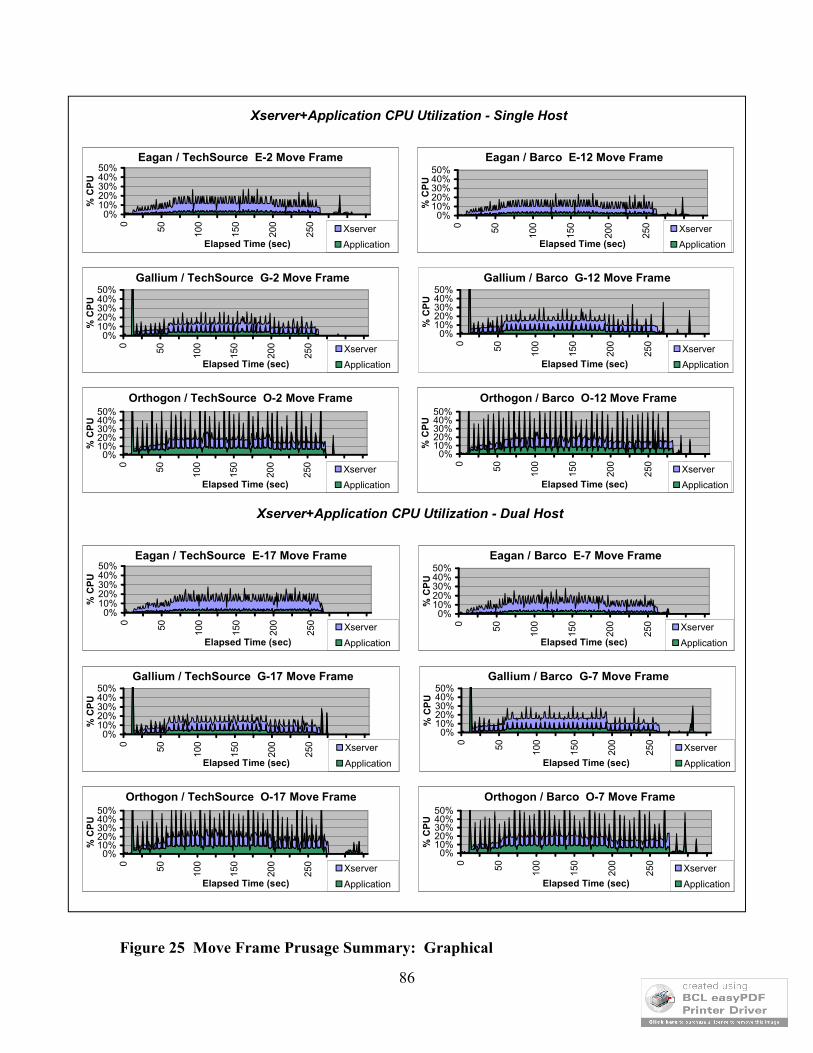
86
Figure 25 Move Frame Prusage Summary: Graphical
Xserver+Application CPU Utilization - Single Host
Gallium / Barco G-12 Move Frame
0%10%20%30%40%50%
0
50 100
150
200
250
300
Elapsed Time (sec)
% C
PU
Xserver
Application
Eagan / Barco E-12 Move Frame
0%10%20%30%40%50%
0 50 100
150
200
250
300
Elapsed Time (sec)
% C
PU
Xserver
Application
Orthogon / TechSource O-2 Move Frame
0%10%20%30%40%50%
0 50 100
150
200
250
300
Elapsed Time (sec)
% C
PU
Xserver
Application
Gallium / TechSource G-2 Move Frame
0%10%20%30%40%50%
0 50 100
150
200
250
300
Elapsed Time (sec)
% C
PU
Xserver
Application
Eagan / TechSource E-2 Move Frame
0%10%20%30%40%50%
0
50 100
150
200
250
300
Elapsed Time (sec)
% C
PU
Xserver
Application
Orthogon / Barco O-12 Move Frame
0%10%20%30%40%50%
0 50 100
150
200
250
300
Elapsed Time (sec)
% C
PU
Xserver
Application
Xserver+Application CPU Utilization - Dual Host
Gallium / Barco G-7 Move Frame
0%10%20%30%40%50%
0 50 100
150
200
250
300
Elapsed Time (sec)
% C
PU
Xserver
Application
Eagan / Barco E-7 Move Frame
0%10%20%30%40%50%
0 50 100
150
200
250
300
Elapsed Time (sec)
% C
PU
Xserver
Application
Orthogon / TechSource O-17 Move Frame
0%10%20%30%40%50%
0 50 100
150
200
250
300
Elapsed Time (sec)
% C
PU
Xserver
Application
Gallium / TechSource G-17 Move Frame
0%10%20%30%40%50%
0 50 100
150
200
250
300
Elapsed Time (sec)
% C
PU
Xserver
Application
Eagan / TechSource E-17 Move Frame
0%10%20%30%40%50%
0 50 100
150
200
250
300
Elapsed Time (sec)
% C
PU
Xserver
Application
Orthogon / Barco O-7 Move Frame
0%10%20%30%40%50%
0 50 100
150
200
250
300
Elapsed Time (sec)
% C
PU
Xserver
Application

87
Table 18 Move Frame Prusage Summary: Tabular
Time Range Max Time Range Max100-200 s Heap (k) Min Avg Max Std Dev 100-200 s Heap (k) Min Avg Max Std DevXserver 904 3.1% 11.6% 21.9% 3.60 Xserver 13,352 1.5% 9.5% 19.1% 3.37Application 5,696 1.4% 3.0% 5.3% 0.78 Application 5,688 1.3% 3.1% 5.4% 0.82X+A 6,600 4.5% 14.6% 27.2% 4.36 X+A 19,040 2.8% 12.5% 24.4% 4.18
Time Range Max Time Range Max100-200 s Heap (k) Min Avg Max Std Dev 100-200 s Heap (k) Min Avg Max Std DevXserver 632 2.4% 9.5% 15.5% 2.32 Xserver 8,960 2.7% 11.3% 19.4% 2.07Application 62,128 2.9% 5.2% 11.5% 2.66 Application 62,312 2.2% 5.2% 11.7% 2.61X+A 62,760 5.4% 14.7% 26.7% 4.38 X+A 71,272 5.9% 16.5% 29.8% 4.09
Time Range Max Time Range Max100-200 s Heap (k) Min Avg Max Std Dev 100-200 s Heap (k) Min Avg Max Std DevXserver 800 4.5% 11.6% 20.5% 2.76 Xserver 9,616 2.0% 10.9% 24.8% 3.16Application 19,456 3.1% 12.8% 63.2% 12.63 Application 19,408 1.9% 12.3% 62.6% 12.40X+A 20,256 11.2% 24.4% 77.6% 13.46 X+A 29,024 3.9% 23.2% 79.9% 13.44
Total CPU Utilization
Gallium / TechSource G-2 Move Frame
Eagan / TechSource E-2 Move FrameTotal CPU Utilization
Total CPU Utilization
Eagan / Barco E-12 Move FrameTotal CPU Utilization
Gallium / Barco G-12 Move FrameTotal CPU Utilization
Single Host
Orthogon / Barco O-12 Move Frame
Total CPU Utilization
Orthogon / TechSource O-2 Move Frame
Time Range Max Time Range Max100-200 s Heap (k) Min Avg Max Std Dev 100-200 s Heap (k) Min Avg Max Std DevXserver 904 3.1% 12.2% 25.2% 3.83 Xserver 13,352 1.7% 11.8% 24.2% 4.67Application 5,688 1.7% 3.2% 5.2% 0.76 Application 5,688 1.4% 3.2% 5.4% 0.83X+A 6,592 5.7% 15.4% 27.8% 4.00 X+A 19,040 5.2% 14.9% 28.2% 4.59
Time Range Max Time Range Max100-200 s Heap (k) Min Avg Max Std Dev 100-200 s Heap (k) Min Avg Max Std DevXserver 632 3.9% 9.5% 15.2% 1.66 Xserver 8,944 0.1% 11.7% 18.8% 2.66Application 62,128 2.2% 5.4% 12.4% 2.66 Application 62,096 2.4% 5.5% 12.0% 2.65X+A 62,760 8.4% 14.9% 22.0% 3.07 X+A 71,040 9.4% 17.1% 30.2% 3.67
Time Range Max Time Range Max100-200 s Heap (k) Min Avg Max Std Dev 100-200 s Heap (k) Min Avg Max Std DevXserver 800 4.2% 12.7% 19.9% 2.86 Xserver 9,616 2.7% 11.5% 18.6% 3.29Application 19,400 4.1% 13.6% 62.8% 11.92 Application 19,520 4.4% 13.6% 63.0% 12.53X+A 20,200 12.6% 26.2% 74.6% 12.01 X+A 29,136 14.3% 25.1% 71.8% 11.64
Dual Host
Orthogon / Barco O-7 Move Frame
Total CPU Utilization
Orthogon / TechSource O-17 Move FrameTotal CPU Utilization
Eagan / Barco E-7 Move FrameTotal CPU Utilization
Gallium / Barco G-7 Move FrameTotal CPU Utilization
Total CPU Utilization
Gallium / TechSource G-17 Move Frame
Eagan / TechSource E-17 Move FrameTotal CPU Utilization

88
Figure 26 Inset Open Prusage Summary: Graphical
Xserver+Application CPU Utilization - Single Host
Gallium / Barco G-13 Inset Open
0%10%20%30%40%50%
0 50
10
0
15
0
20
0
25
0
30
0
Elapsed Time (sec)
% C
PU
Xserver
Application
Eagan / Barco E-13 Inset Open
0%10%20%30%40%50%
0
50
10
0
15
0
20
0
25
0
30
0
Elapsed Time (sec)
% C
PU
Xserver
Application
Orthogon / TechSource O-3 Inset Open
0%10%20%30%40%50%
0 50
10
0
15
0
20
0
25
0
30
0
Elapsed Time (sec)
% C
PU
Xserver
Application
Gallium / TechSource G-3 Inset Open
0%10%20%30%40%50%
0 50
10
0
15
0
20
0
25
0
30
0
Elapsed Time (sec)
% C
PU
Xserver
Application
Eagan / TechSource E-3 Inset Open
0%10%20%30%40%50%
0 50
10
0
15
0
20
0
25
0
30
0
Elapsed Time (sec)
% C
PU
Xserver
Application
Orthogon / Barco O-13 Inset Open
0%10%20%30%40%50%
0 50
10
0
15
0
20
0
25
0
30
0
Elapsed Time (sec)
% C
PU
Xserver
Application
Xserver+Application CPU Utilization - Dual Host
Gallium / Barco G-8 Inset Open
0%10%20%30%40%50%
0
50 100
150
200
250
300
Elapsed Time (sec)
% C
PU
Xserver
Application
Eagan / Barco E-8 Inset Open
0%10%20%30%40%50%
0
50 100
150
200
250
300
Elapsed Time (sec)
% C
PU
Xserver
Application
Orthogon / TechSource O-18 Inset Open
0%10%20%30%40%50%
0 50 100
150
200
250
300
Elapsed Time (sec)
% C
PU
Xserver
Application
Gallium / TechSource G-18 Inset Open
0%10%20%30%40%50%
0 50 100
150
200
250
300
Elapsed Time (sec)
% C
PU
Xserver
Application
Eagan / TechSource E-18 Inset Open
0%10%20%30%40%50%
0 50 100
150
200
250
300
Elapsed Time (sec)
% C
PU
Xserver
Application
Orthogon / Barco O-8 Inset Open
0%10%20%30%40%50%
0
50 100
150
200
250
300
Elapsed Time (sec)
% C
PU
Xserver
Application

89
Table 19 Inset Open Prusage Summary: Tabular
Time Range Max Time Range Max100-200 s Heap (k) Min Avg Max Std Dev 100-200 s Heap (k) Min Avg Max Std DevXserver 912 10.3% 15.8% 34.5% 6.02 Xserver 13,352 9.6% 14.6% 30.2% 5.59Application 5,696 2.6% 3.8% 7.8% 1.26 Application 5,688 2.7% 3.9% 7.5% 1.31X+A 6,608 13.0% 19.7% 42.3% 7.28 X+A 19,040 12.3% 18.5% 37.7% 6.90
Time Range Max Time Range Max100-200 s Heap (k) Min Avg Max Std Dev 100-200 s Heap (k) Min Avg Max Std DevXserver 648 0.05% 14.4% 25.4% 4.15 Xserver 8,960 0.03% 14.5% 31.0% 4.23Application 62,672 1.2% 5.1% 12.7% 2.98 Application 62,640 1.2% 5.0% 13.6% 2.87X+A 63,320 1.3% 19.5% 37.9% 6.47 X+A 71,600 1.2% 19.4% 44.6% 6.30
Time Range Max Time Range Max100-200 s Heap (k) Min Avg Max Std Dev 100-200 s Heap (k) Min Avg Max Std DevXserver 800 6.2% 16.5% 28.8% 4.62 Xserver 9,616 0.4% 16.0% 30.5% 4.41Application 20,848 3.4% 13.2% 63.9% 12.23 Application 20,768 2.3% 12.8% 62.8% 12.94X+A 21,648 12.5% 29.7% 80.2% 14.06 X+A 30,384 5.3% 28.8% 76.4% 14.14
Total CPU Utilization
Gallium / TechSource G-3 Inset Open
Eagan / TechSource E-3 Inset OpenTotal CPU Utilization
Total CPU Utilization
Eagan / Barco E-13 Inset OpenTotal CPU Utilization
Gallium / Barco G-13 Inset OpenTotal CPU Utilization
Single Host
Orthogon / Barco O-13 Inset Open
Total CPU Utilization
Orthogon / TechSource O-3 Inset Open
Time Range Max Time Range Max100-200 s Heap (k) Min Avg Max Std Dev 100-200 s Heap (k) Min Avg Max Std DevXserver 904 5.9% 17.5% 37.4% 6.87 Xserver 13,352 5.7% 16.3% 32.7% 6.18Application 5,696 1.9% 3.8% 7.6% 1.33 Application 5,688 1.66% 3.8% 7.7% 1.35X+A 6,600 11.0% 21.4% 45.0% 7.44 X+A 19,040 10.9% 20.1% 37.2% 6.27
Time Range Max Time Range Max100-200 s Heap (k) Min Avg Max Std Dev 100-200 s Heap (k) Min Avg Max Std DevXserver 648 0.1% 16.2% 32.4% 4.81 Xserver 8,960 3.8% 16.0% 28.0% 4.10Application 62,632 1.7% 5.2% 13.5% 2.97 Application 62,672 1.7% 5.2% 13.9% 2.93X+A 63,280 4.7% 21.3% 36.0% 5.44 X+A 71,632 14.5% 21.2% 40.0% 5.68
Time Range Max Time Range Max100-200 s Heap (k) Min Avg Max Std Dev 100-200 s Heap (k) Min Avg Max Std DevXserver 800 0.6% 18.0% 31.8% 6.25 Xserver 9,616 0.4% 18.9% 32.4% 5.37Application 20,800 3.7% 13.7% 62.9% 13.04 Application 20,872 3.5% 13.6% 64.4% 13.23X+A 21,600 10.8% 31.7% 79.6% 14.04 X+A 30,488 18.3% 32.5% 85.8% 13.75
Dual Host
Orthogon / Barco O-8 Inset Open
Total CPU Utilization
Orthogon / TechSource O-18 Inset OpenTotal CPU Utilization
Eagan / Barco E-8 Inset OpenTotal CPU Utilization
Gallium / Barco G-8 Inset OpenTotal CPU Utilization
Total CPU Utilization
Gallium / TechSource G-18 Inset Open
Eagan / TechSource E-18 Inset OpenTotal CPU Utilization

90
Figure 27 Range Change Prusage Summary: Graphical
Xserver+Application CPU Utilization - Single Host
Gallium / Barco G-14 Range Change
0%10%20%30%40%50%
0
50
10
0
15
0
20
0
25
0
30
0
Elapsed Time (sec)%
CP
U
Xserver
Application
Eagan / Barco E-14 Range Change
0%10%20%30%40%50%
0
50
10
0
15
0
20
0
25
0
30
0
Elapsed Time (sec)
% C
PU
Xserver
Application
Orthogon / TechSource O-4 Range Change
0%10%20%30%40%50%
0
50
10
0
15
0
20
0
25
0
30
0
Elapsed Time (sec)
% C
PU
Xserver
Application
Gallium / TechSource G-4 Range Change
0%10%20%30%40%50%
0 50
10
0
15
0
20
0
25
0
30
0
Elapsed Time (sec)
% C
PU
Xserver
Application
Eagan / TechSource E-4 Range Change
0%10%20%30%40%50%
0
50
10
0
15
0
20
0
25
0
30
0
Elapsed Time (sec)
% C
PU
Xserver
Application
Orthogon / Barco O-14 Range Change
0%10%20%30%40%50%
0
50
10
0
15
0
20
0
25
0
30
0
Elapsed Time (sec)
% C
PU
Xserver
Application
Xserver+Application CPU Utilization - Dual Host
Gallium / Barco G-9 Range Change
0%10%20%30%40%50%
0 50
10
0
15
0
20
0
25
0
30
0
Elapsed Time (sec)
% C
PU
Xserver
Application
Eagan / Barco E-9 Range Change
0%10%20%30%40%50%
0 50
10
0
15
0
20
0
25
0
30
0
Elapsed Time (sec)
% C
PU
Xserver
Application
Orthogon / TechSource O-19 Range Change
0%10%20%30%40%50%
0
50
10
0
15
0
20
0
25
0
30
0
Elapsed Time (sec)
% C
PU
Xserver
Application
Gallium / TechSource G-19 Range Change
0%10%20%30%40%50%
0 50
10
0
15
0
20
0
25
0
30
0
Elapsed Time (sec)
% C
PU
Xserver
Application
Eagan / TechSource E-19 Range Change
0%10%20%30%40%50%
0
50
10
0
15
0
20
0
25
0
30
0
Elapsed Time (sec)
% C
PU
Xserver
Application
Orthogon / Barco O-9 Range Change
0%10%20%30%40%50%
0 50
10
0
15
0
20
0
25
0
30
0
Elapsed Time (sec)
% C
PU
Xserver
Application
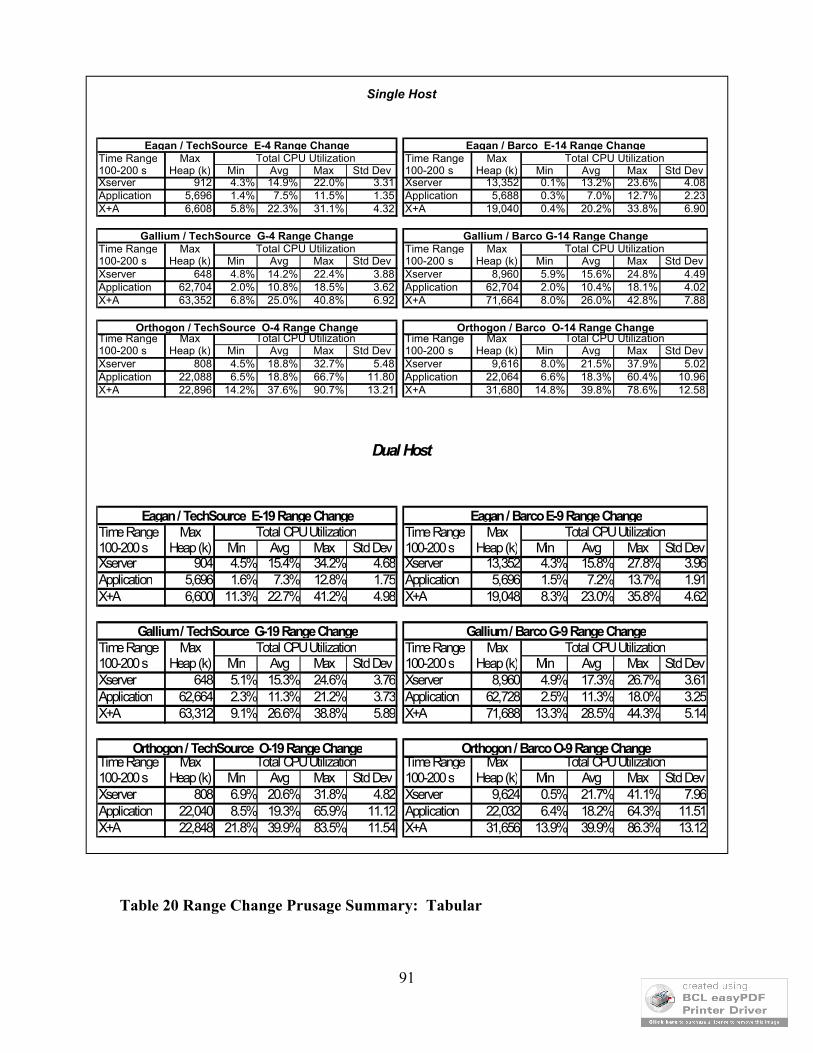
91
Table 20 Range Change Prusage Summary: Tabular
Time Range Max Time Range Max100-200 s Heap (k) Min Avg Max Std Dev 100-200 s Heap (k) Min Avg Max Std DevXserver 912 4.3% 14.9% 22.0% 3.31 Xserver 13,352 0.1% 13.2% 23.6% 4.08Application 5,696 1.4% 7.5% 11.5% 1.35 Application 5,688 0.3% 7.0% 12.7% 2.23X+A 6,608 5.8% 22.3% 31.1% 4.32 X+A 19,040 0.4% 20.2% 33.8% 6.90
Time Range Max Time Range Max100-200 s Heap (k) Min Avg Max Std Dev 100-200 s Heap (k) Min Avg Max Std DevXserver 648 4.8% 14.2% 22.4% 3.88 Xserver 8,960 5.9% 15.6% 24.8% 4.49Application 62,704 2.0% 10.8% 18.5% 3.62 Application 62,704 2.0% 10.4% 18.1% 4.02X+A 63,352 6.8% 25.0% 40.8% 6.92 X+A 71,664 8.0% 26.0% 42.8% 7.88
Time Range Max Time Range Max100-200 s Heap (k) Min Avg Max Std Dev 100-200 s Heap (k) Min Avg Max Std DevXserver 808 4.5% 18.8% 32.7% 5.48 Xserver 9,616 8.0% 21.5% 37.9% 5.02Application 22,088 6.5% 18.8% 66.7% 11.80 Application 22,064 6.6% 18.3% 60.4% 10.96X+A 22,896 14.2% 37.6% 90.7% 13.21 X+A 31,680 14.8% 39.8% 78.6% 12.58
Total CPU Utilization
Gallium / TechSource G-4 Range Change
Eagan / TechSource E-4 Range ChangeTotal CPU Utilization
Total CPU Utilization
Eagan / Barco E-14 Range ChangeTotal CPU Utilization
Gallium / Barco G-14 Range ChangeTotal CPU Utilization
Single Host
Orthogon / Barco O-14 Range Change
Total CPU Utilization
Orthogon / TechSource O-4 Range Change
Time Range Max Time Range Max100-200 s Heap (k) Min Avg Max Std Dev 100-200 s Heap (k) Min Avg Max Std DevXserver 904 4.5% 15.4% 34.2% 4.68 Xserver 13,352 4.3% 15.8% 27.8% 3.96Application 5,696 1.6% 7.3% 12.8% 1.75 Application 5,696 1.5% 7.2% 13.7% 1.91X+A 6,600 11.3% 22.7% 41.2% 4.98 X+A 19,048 8.3% 23.0% 35.8% 4.62
Time Range Max Time Range Max100-200 s Heap (k) Min Avg Max Std Dev 100-200 s Heap (k) Min Avg Max Std DevXserver 648 5.1% 15.3% 24.6% 3.76 Xserver 8,960 4.9% 17.3% 26.7% 3.61Application 62,664 2.3% 11.3% 21.2% 3.73 Application 62,728 2.5% 11.3% 18.0% 3.25X+A 63,312 9.1% 26.6% 38.8% 5.89 X+A 71,688 13.3% 28.5% 44.3% 5.14
Time Range Max Time Range Max100-200 s Heap (k) Min Avg Max Std Dev 100-200 s Heap (k) Min Avg Max Std DevXserver 808 6.9% 20.6% 31.8% 4.82 Xserver 9,624 0.5% 21.7% 41.1% 7.96Application 22,040 8.5% 19.3% 65.9% 11.12 Application 22,032 6.4% 18.2% 64.3% 11.51X+A 22,848 21.8% 39.9% 83.5% 11.54 X+A 31,656 13.9% 39.9% 86.3% 13.12
Dual Host
Orthogon / Barco O-9 Range Change
Total CPU Utilization
Orthogon / TechSource O-19 Range ChangeTotal CPU Utilization
Eagan / Barco E-9 Range ChangeTotal CPU Utilization
Gallium / Barco G-9 Range ChangeTotal CPU Utilization
Total CPU Utilization
Gallium / TechSource G-19 Range Change
Eagan / TechSource E-19 Range ChangeTotal CPU Utilization

92
Figure 28 Character Echo Prusage Summary: Graphical
Xserver+Application CPU Utilization - Single Host
Gallium / Barco G-15 Character Echo
0%10%20%30%40%50%
0
50
10
0
15
0
20
0
25
0
30
0
Elapsed Time (sec)
% C
PU
Xserver
Application
Eagan / Barco E-15 Character Echo
0%10%20%30%40%50%
0 50
10
0
15
0
20
0
25
0
30
0
Elapsed Time (sec)
% C
PU
Xserver
Application
Orthogon / TechSource O-5 Character Echo
0%10%20%30%40%50%
0 50
10
0
15
0
20
0
25
0
30
0
Elapsed Time (sec)
% C
PU
Xserver
Application
Gallium / TechSource G-5 Character Echo
0%10%20%30%40%50%
0
50
10
0
15
0
20
0
25
0
30
0
Elapsed Time (sec)
% C
PU
Xserver
Application
Eagan / TechSource E-5 Character Echo
0%10%20%30%40%50%
0 50
10
0
15
0
20
0
25
0
30
0
Elapsed Time (sec)
% C
PU
Xserver
Application
Orthogon / Barco O-15 Character Echo
0%10%20%30%40%50%
0 50
10
0
15
0
20
0
25
0
30
0
Elapsed Time (sec)
% C
PU
Xserver
Application
Xserver+Application CPU Utilization - Dual Host
Gallium / Barco G-10 Character Echo
0%10%20%30%40%50%
0 50
100
150
200
250
300
Elapsed Time (sec)
% C
PU
Xserver
Application
Eagan / Barco E-10 Character Echo
0%10%20%30%40%50%
0 50 100
150
200
250
300
Elapsed Time (sec)
% C
PU
Xserver
Application
Orthogon / TechSource O-20 Character Echo
0%10%20%30%40%50%
0 50 100
150
200
250
300
Elapsed Time (sec)
% C
PU
Xserver
Application
Gallium / TechSource G-20 Character Echo
0%10%20%30%40%50%
0 50 100
150
200
250
300
Elapsed Time (sec)
% C
PU
Xserver
Application
Eagan / TechSource E-20 Character Echo
0%10%20%30%40%50%
0 50 100
150
200
250
300
Elapsed Time (sec)
% C
PU
Xserver
Application
Orthogon / Barco O-10 Character Echo
0%10%20%30%40%50%
0 50 100
150
200
250
300
Elapsed Time (sec)
% C
PU
Xserver
Application
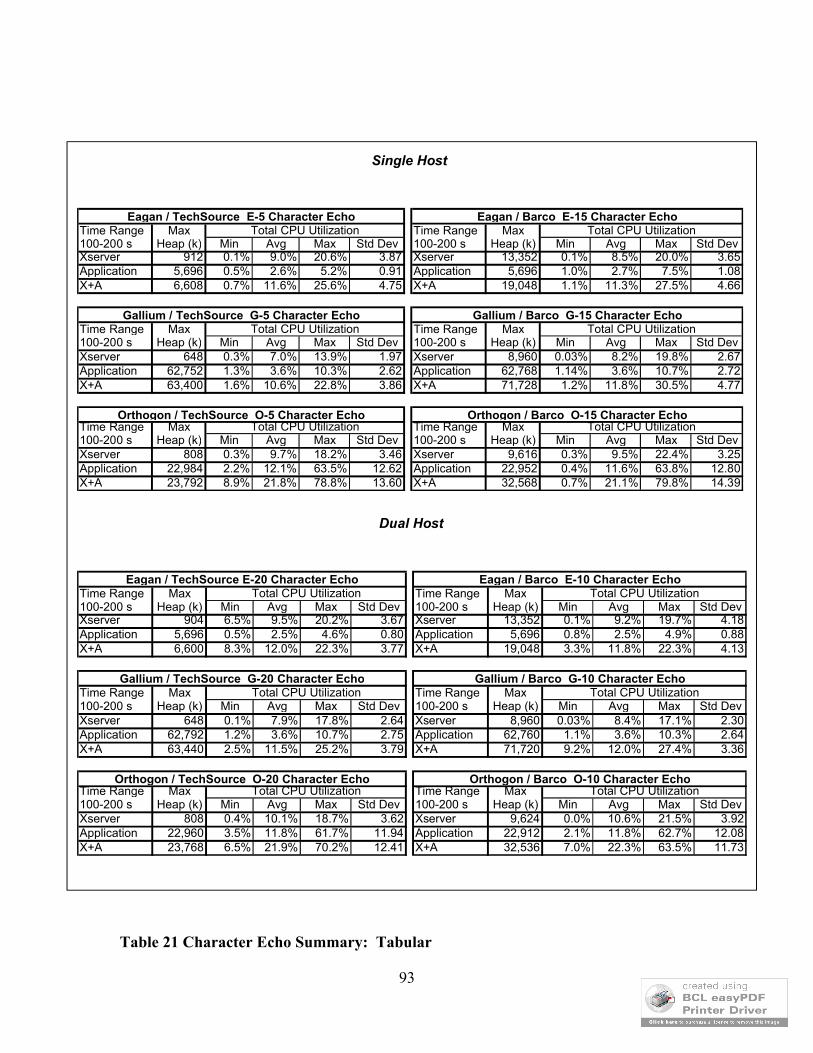
93
Table 21 Character Echo Summary: Tabular
Time Range Max Time Range Max100-200 s Heap (k) Min Avg Max Std Dev 100-200 s Heap (k) Min Avg Max Std DevXserver 912 0.1% 9.0% 20.6% 3.87 Xserver 13,352 0.1% 8.5% 20.0% 3.65Application 5,696 0.5% 2.6% 5.2% 0.91 Application 5,696 1.0% 2.7% 7.5% 1.08X+A 6,608 0.7% 11.6% 25.6% 4.75 X+A 19,048 1.1% 11.3% 27.5% 4.66
Time Range Max Time Range Max100-200 s Heap (k) Min Avg Max Std Dev 100-200 s Heap (k) Min Avg Max Std DevXserver 648 0.3% 7.0% 13.9% 1.97 Xserver 8,960 0.03% 8.2% 19.8% 2.67Application 62,752 1.3% 3.6% 10.3% 2.62 Application 62,768 1.14% 3.6% 10.7% 2.72X+A 63,400 1.6% 10.6% 22.8% 3.86 X+A 71,728 1.2% 11.8% 30.5% 4.77
Time Range Max Time Range Max100-200 s Heap (k) Min Avg Max Std Dev 100-200 s Heap (k) Min Avg Max Std DevXserver 808 0.3% 9.7% 18.2% 3.46 Xserver 9,616 0.3% 9.5% 22.4% 3.25Application 22,984 2.2% 12.1% 63.5% 12.62 Application 22,952 0.4% 11.6% 63.8% 12.80X+A 23,792 8.9% 21.8% 78.8% 13.60 X+A 32,568 0.7% 21.1% 79.8% 14.39
Single Host
Orthogon / Barco O-15 Character Echo
Total CPU Utilization
Orthogon / TechSource O-5 Character EchoTotal CPU Utilization
Eagan / Barco E-15 Character EchoTotal CPU Utilization
Gallium / Barco G-15 Character EchoTotal CPU Utilization
Total CPU Utilization
Gallium / TechSource G-5 Character Echo
Eagan / TechSource E-5 Character EchoTotal CPU Utilization
Time Range Max Time Range Max100-200 s Heap (k) Min Avg Max Std Dev 100-200 s Heap (k) Min Avg Max Std DevXserver 904 6.5% 9.5% 20.2% 3.67 Xserver 13,352 0.1% 9.2% 19.7% 4.18Application 5,696 0.5% 2.5% 4.6% 0.80 Application 5,696 0.8% 2.5% 4.9% 0.88X+A 6,600 8.3% 12.0% 22.3% 3.77 X+A 19,048 3.3% 11.8% 22.3% 4.13
Time Range Max Time Range Max100-200 s Heap (k) Min Avg Max Std Dev 100-200 s Heap (k) Min Avg Max Std DevXserver 648 0.1% 7.9% 17.8% 2.64 Xserver 8,960 0.03% 8.4% 17.1% 2.30Application 62,792 1.2% 3.6% 10.7% 2.75 Application 62,760 1.1% 3.6% 10.3% 2.64X+A 63,440 2.5% 11.5% 25.2% 3.79 X+A 71,720 9.2% 12.0% 27.4% 3.36
Time Range Max Time Range Max100-200 s Heap (k) Min Avg Max Std Dev 100-200 s Heap (k) Min Avg Max Std DevXserver 808 0.4% 10.1% 18.7% 3.62 Xserver 9,624 0.0% 10.6% 21.5% 3.92Application 22,960 3.5% 11.8% 61.7% 11.94 Application 22,912 2.1% 11.8% 62.7% 12.08X+A 23,768 6.5% 21.9% 70.2% 12.41 X+A 32,536 7.0% 22.3% 63.5% 11.73
Total CPU Utilization
Gallium / TechSource G-20 Character Echo
Eagan / TechSource E-20 Character EchoTotal CPU Utilization
Total CPU Utilization
Eagan / Barco E-10 Character EchoTotal CPU Utilization
Gallium / Barco G-10 Character EchoTotal CPU Utilization
Dual Host
Orthogon / Barco O-10 Character Echo
Total CPU Utilization
Orthogon / TechSource O-20 Character Echo

94
60 Appendix VI: Hardware EvaluationThis appendix chapter contains a description of the hardware test and the actual data collect. The summary and recommendations are found in the main document body in section 6.1.1.
60.1 Introduction
The purpose of this evaluation was to compare the operation of the graphic (video) adapters and the video switches that were selected during Phase 1 to replace the current DSR hardware.
The graphics adapter cards evaluated were:
BARCO Graphic Accelerator PVS5600M
TechSource Raptor 2000 Graphic Accelerator Card
The video switches evaluated were:
Extron Video Switch 4:1 SW4 AR Hvxi S/N 533362053, E10453
Matrix Video Switch 3:1 Model 7000/13378, S/N 139975
TechSource Video Switch 2:1 G744514-2 Model 19-0079-05 REV B
Serial Number (S/N) 18399
The operation and performance of the graphics adapter cards and video switches was evaluated by observation of a displayed image on a Sony Main Display Monitor. A DSR Situation display was used as a data pattern that provided vertical lines, horizontal lines, colors, data and graphics. This pattern was observed to determine whether the graphics adapter card provides an image that is suitable for operation.
In each section, such as ‘60.2.1 Display driven by CDG’, the set of test steps is specified. Following that section are the actual test observations that are underlined.

95
60.1.1 Support EquipmentThe following set of support equipment was used during the evaluation:
Main display monitor (MDM) Sony model DDM-2800C Data Display Monitor
S/N 7000022 Manufactured Mar 93
Console Display Generator (CDG) – consists of a Raytheon SC2000 DCX display
generator. CDG is Raytheon Part number C593211-11 S/N M50051
RISC processor to drive the CDG IBM RISC 6000 Model 7018-770 S/N 55804
96
60.2 Graphics Adapter Card Evaluation
60.2.1 Display driven by CDGA. Configure the equipment as shown in Figure 29.
B. Observe the image on the Sony 20 x 20 display driven from a CDG.
C. Verify that the following image characteristics are acceptable:
distortion
color variations
brightness variations
trapezoidal distortion
pin cushion distortion
jitter
convergence
D. Observe the horizontal image fills the full viewing area.
E. Observe that the horizontal image is centered on the screen.
F. Observe the vertical image fills the full viewing area.
G. Observe that the vertical image is centered on the screen.
H. Move the cursor over the entire screen; observe that motion is smooth and continuous.
I. Type in several upper and lower case letters; observe that the characters are displayed with nearly imperceptible delays.
J. Record the results of these observations on the data sheet.
Test Data - 60.2.1 Display driven by CDG
C. Verify that the following image characteristics are acceptable:
Distortion vertical lines curve to right
color variations none - except for the lower left corner
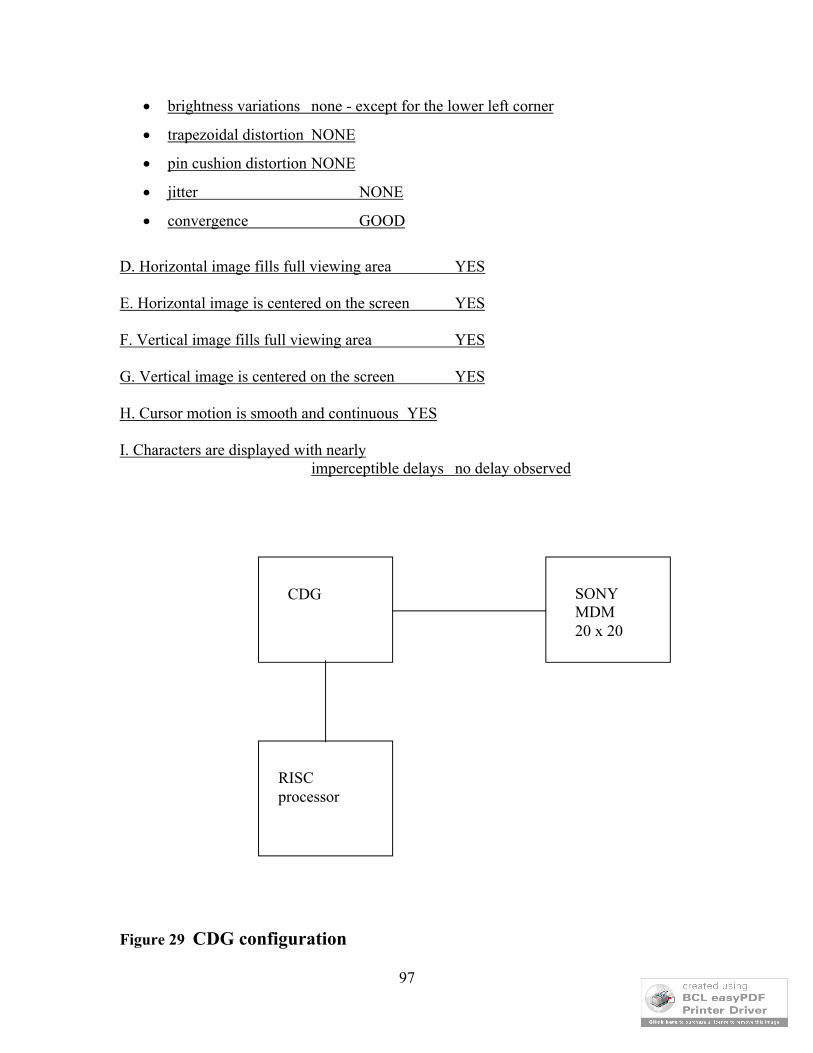
97
brightness variations none - except for the lower left corner
trapezoidal distortion NONE
pin cushion distortion NONE
jitter NONE
convergence GOOD
D. Horizontal image fills full viewing area YES
E. Horizontal image is centered on the screen YES
F. Vertical image fills full viewing area YES
G. Vertical image is centered on the screen YES
H. Cursor motion is smooth and continuous YES
I. Characters are displayed with nearly imperceptible delays no delay observed
Figure 29 CDG configuration
SONYMDM20 x 20
CDG
RISC processor

98
60.2.2 Display driven by TechSource Graphics Adapter CardA. Configure the equipment as shown Figure 30.
B. Observe the image on the Sony 20 x 20 display driven from a TechSource graphics
adapter card.
C. Verify that the following image characteristics are acceptable:
Distortion
color variations
brightness variations
trapezoidal distortion
pin cushion distortion
jitter
convergence
D. Observe the horizontal image fills the full viewing area.
E. Observe that the horizontal image is centered on the screen.
F. Observe the vertical image fills the full viewing area.
G. Observe that the vertical image is centered on the screen.
H. Move the cursor over the entire screen; observe that motion is smooth and continuous.
I. Type in several upper and lower case letters; observe that the characters are displayed with nearly imperceptible delays.
J. Record the results of these observations on the data sheet.
Test Data - 60.2.2 Display driven by TechSource Graphics Adapter
C. Verify that the following image characteristics are acceptable:
Distortion NONE
color variations none - except for the lower left corner
brightness variations none - except for the lower left corner
trapezoidal distortion NONE

99
pin cushion distortion left vertical bends in - 3 mm maximum at the center of the
line
jitter NONE
convergence GOOD
D. Horizontal image fills full viewing area YES
E. Horizontal image is centered on the screen no – image moves to the left of center
F. Vertical image fills full viewing area YES
G. Vertical image is centered on the screen YES
H. Cursor motion is smooth and continuous YES
I. Characters are displayed with nearly imperceptible delays no delay observed
NOTE – the display was not adjusted during the test.To check if the graphics adapter card or the display is the source of the image moving off center the signal was connected to another Sony display (S/N 7000011) – the image is centered and there is no distortion at the lower left corner. After this check the original display was reconnected and the testing continued.
Figure 30 TechSource Graphics Adapter Card Configuration
SONYMDM20 x 20
SUN 1 TechSource

100
60.2.3 Display driven by Barco Graphics Adapter CardA. Configure the equipment as shown in Figure 31.
B. Observe the image on the Sony 20 x 20 display driven from a Barco graphics adapter card.
C. Verify that the following image characteristics are acceptable:
Distortion
color variations
brightness variations
trapezoidal distortion
pin cushion distortion
jitter
convergence
D. Observe the horizontal image fills the full viewing area.
E. Observe that the horizontal image is centered on the screen.
F. Observe the vertical image fills the full viewing area.
G. Observe that the vertical image is centered on the screen.
H. Move the cursor over the entire screen; observe that motion is smooth and continuous.
I. Type in several upper and lower case letters; observe that the characters are displayed with nearly imperceptible delays.
J. Record the results of these observations on the data sheet.
Test Data - 60.2.3 Display driven by Barco Graphics Adapter
C. Verify that the following image characteristics are acceptable:
Distortion NONE
color variations lower left corner
brightness variations lower left corner
trapezoidal distortion NONE
pin cushion distortion NONE

101
jitter NONE
convergence GOOD
D. Horizontal image fills full viewing area YES
E. Horizontal image is centered on the screen YES
F. Vertical image fills full viewing area YES
G. Vertical image is centered on the screen YES
H. Cursor motion is smooth and continuous YES
I. Characters are displayed with nearly imperceptible delays no delay observed
NOTE – the display was not adjusted during the test.
Figure 31 Barco Graphics Adapter Card Configuration
60.2.4 Graphics Adapter Card Evaluation and RecommendationThe summary and evaluation are found in section 6.1.1.
SONYMDM20 x 20
SUN 2 Barco
102
60.3 Video Switch EvaluationPhase 1 of the task order recommended that the Extron, Matrix Systems and TechSource video switches be evaluated as part of the Phase 2 demonstration.
The primary evaluation criterion was the acceptability of the switched display image.
Each of the 3 video switches was evaluated by the following procedure.
Attach the Barco graphics adapter card and CDG as input to the video switch. Then:
- Observe the static displayed image from the Barco graphics card on the MDM display. Ignore the MDM display behavior during switch actuation.
- Observe the dynamic displayed image on the MDM display during switch actuation.
Attach the TechSource graphics adapter card and CDG as input to the video switch. Then:
- Observe the static displayed image from the TechSource graphics card on the MDM display. Ignore the MDM display behavior during switch actuation
- Observe the dynamic displayed image on the MDM display during switch actuation.

103
60.3.1 TechSource switchThis section describes the TechSource switch testing and records the testing results (underlined).
60.3.1.1 TechSource switch with Sun 2 (Barco) and CDG
Configure the equipment as shown in Figure 32.
60.3.1.1.1 Display image, static test of the switch
A. Turn on all of the equipment, set the processors SUN 2 and Processor controlling the CDG for a DSR Situation Display pattern to be displayed.
B. Allow sufficient time for the display to settle
C. Adjust the display as necessary
D. Observe the image on the Sony 20 x 20 display.
E. Verify that the following image characteristics are acceptable:
Distortion
color variations
brightness variations
trapezoidal distortion
pin cushion distortion
jitter
convergence
F. Observe the horizontal image fills the full viewing area.
G. Observe that the horizontal image is centered on the screen.
H. Observe the vertical image fills the full viewing area.
I. Observe that the vertical image is centered on the screen.
J. Move the cursor over the entire screen; observe that motion is smooth and continuous.

104
K. Type in several upper and lower case letters; observe that the characters are displayed with nearly imperceptible delays.
L. Record the results of these observations on the data sheet.
M. Actuate the switch
N. Allow sufficient time for the display to settle
O. Adjust the display as necessary
P. Observe the image on the Sony 20 x 20 display.
Q. Verify that the following image characteristics are acceptable:
Distortion
color variations
brightness variations
trapezoidal distortion
pin cushion distortion
jitter
convergence
R. Observe the horizontal image fills the full viewing area.
S. Observe that the horizontal image is centered on the screen.
T. Observe the vertical image fills the full viewing area.
U. Observe that the vertical image is centered on the screen.
V. Move the cursor over the entire screen; observe that motion is smooth and continuous.
W. Type in several upper and lower case letters; observe that the characters are displayed with nearly imperceptible delays.
X. Record the results of these observations on the data sheet.

105
Test data - 60.3.1.1.1 Display image, static test of the switch
B. Display settling time The display settling time is estimated to be less than 1 second. It could not be more accurately measured with the current test configuration.
C. Display adjustment The display was not adjusted.
E - K. Verify that the following image characteristics are acceptable:
All of these observations were performed with the video signal routed through the
TechSource switch.
Image from the CDG.
Same observations as when image was observed in the previous test (CDG - 60.2.1)
without the switch.
All of these observations were performed with the video signal routed through the
TechSource switch.
Image from the Barco graphics adapter card (as a result of actuating the switch in step
M to change the input)
N. Display settling time The display settling time is estimated to be less than 1 second. It could not be more accurately measured with the current test configuration.
O. Display adjustment The display was not adjusted.
Q –W . Verify that the following image characteristics are acceptable:
Same observations as when image was observed in the previous test (Barco - 60.2.3)
without the switch.

106
60.3.1.1.2 Display image, active test of the switch
A. Actuate the switch.
(NOTE – the purpose of this portion of the test is to observe the display as the switching takes place, observe the display as it settles.)
B. Observe the image on the Sony 20 x 20 display.
C. Observe the display for indications of switch induced artifacts
Image roll
Extraneous characteristics
D. Measure and record the time required for the image to stabilize
E. Verify that the following image characteristics are acceptable:
Distortion
color variations
brightness variations
trapezoidal distortion
pin cushion distortion
jitter
convergence
F. Observe the horizontal image fills the full viewing area.
G. Observe that the horizontal image is centered on the screen.
H. Observe the vertical image fills the full viewing area.
I. Observe that the vertical image is centered on the screen.
J. Move the cursor over the entire screen; observe that motion is smooth and continuous.
K. Type in several upper and lower case letters; observe that the characters are displayed with nearly imperceptible delays.
L. Record the results of these observations on the data sheet.

107
M. Repeat steps 60.3.1.1.2 A up to and including step K
N. Since the graphics adapter cards that are driving the display are not synchronized to each other and have different video characteristics it may be necessary to repeat this test 5 times to observe the worst case of switching effects. As indicated record the time it takes for the display to stabilize.
O. Calculate the average time required for the image to stabilize.
Test Data - 60.3.1.1.2 Display image, active test of the switch
C. Observe the display for indications of switch induced artifacts
Image roll ____NONE__________
Extraneous characteristics ____NONE__________
D. Display settling time The display settling time is estimated to be less than 1 second. It could not more accurately be measured with the current test configuration.
E. Verify that the following image characteristics are acceptable:
Same observations as when image was observed in the previous test without the
switch (60.2.1– CDG, 60.2.3– Barco).
M. The test was performed by actuating the video switch multiple times and observing the display as the switch changed positions. The switching time could not be measured with the test configuration. There was no observable roll or loss of image.
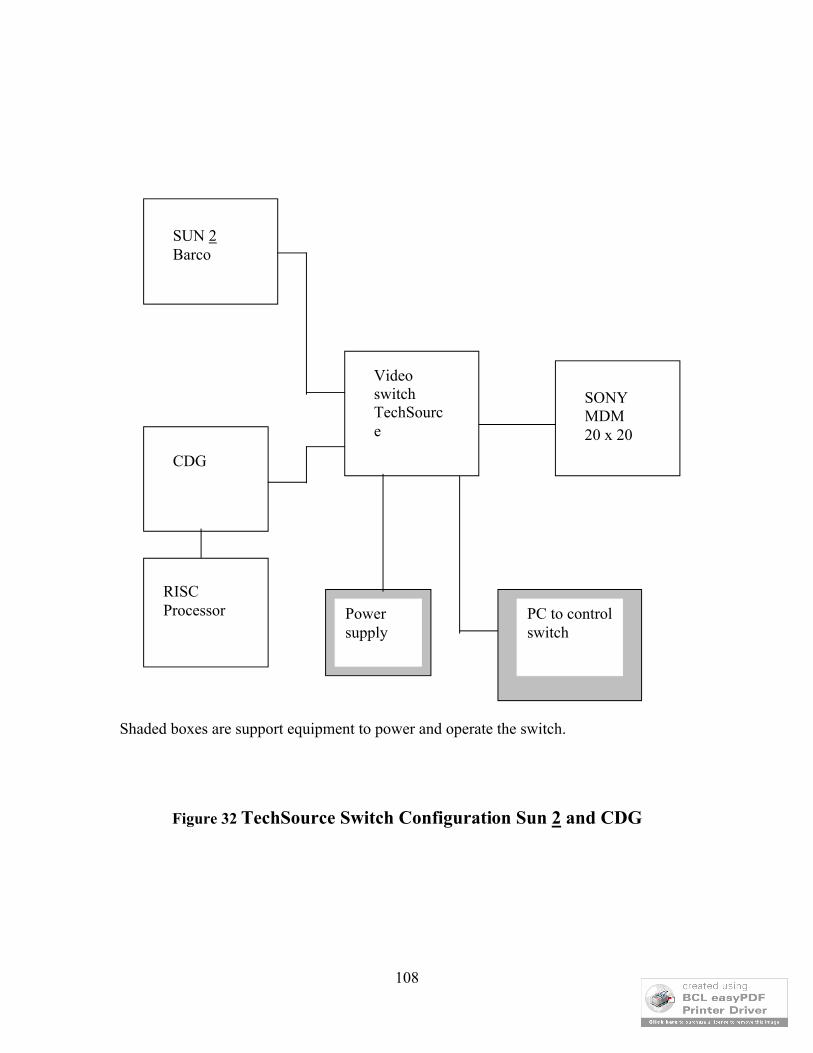
108
Shaded boxes are support equipment to power and operate the switch.
Figure 32 TechSource Switch Configuration Sun 2 and CDG
SONYMDM20 x 20
SUN 2Barco
CDG
Video switchTechSource
Power supply
PC to control switch
RISC Processor

109
60.3.1.2 TechSource switch with Sun 1 (TechSource) and CDG
Configure the equipment as shown in Figure 33.
60.3.1.2.1 Display image, static test of the switch
A. Turn on all of the equipment, set the processors SUN 1 and Processor controlling the CDG for a DSR Situation Display pattern to be displayed.
B. Allow sufficient time for the display to settle
C. Adjust the display as necessary
D. Observe the image on the Sony 20 x 20 display.
E. Verify that the following image characteristics are acceptable:
Distortion
color variations
brightness variations
trapezoidal distortion
pin cushion distortion
jitter
convergence
F. Observe the horizontal image fills the full viewing area.
G. Observe that the horizontal image is centered on the screen.
H. Observe the vertical image fills the full viewing area.
I. Observe that the vertical image is centered on the screen.
J. Move the cursor over the entire screen; observe that motion is smooth and continuous.
K. Type in several upper and lower case letters; observe that the characters are displayed with nearly imperceptible delays.
L. Record the results of these observations.
M. Actuate the switch

110
N. Allow sufficient time for the display to settle
O. Adjust the display as necessary
P. Observe the image on the Sony 20 x 20 display.
Q. Verify that the following image characteristics are acceptable:
Distortion
color variations
brightness variations
trapezoidal distortion
pin cushion distortion
jitter
convergence
R. Observe the horizontal image fills the full viewing area.
S. Observe that the horizontal image is centered on the screen.
T. Observe the vertical image fills the full viewing area.
U. Observe that the vertical image is centered on the screen.
V. Move the cursor over the entire screen; observe that motion is smooth and continuous.
W. Type in several upper and lower case letters; observe that the characters are displayed with nearly imperceptible delays.
X. Record the results of these observations on the data sheet.

111
Test data - 60.3.1.2.1 Display image, static test of the switch
B. Display settling time The display settling time is estimated to be less than 1 second. It could not be more accurately measured with the current test configuration.
C. Display adjustment The display was not adjusted.
All of these observations were performed with the video signal routed through the
TechSource switch.
Image from the CDG
E – K . Verify that the following image characteristics are acceptable:
Same observations as when image was observed in the previous test (CDG - 60.2.1)
without the switch.
All of these observations were performed with the video signal routed through the
TechSource switch.
Image from the TechSource graphics adapter card (as a result of actuating the switch
in step M to change the input).
Same observations as when image was observed in the previous test (TechSource -
60.2.2) without the switch.
N. Display settling time The display settling time is estimated to be less than 1 second. It could not be more accurately measured with the current test configuration.
O. Display adjustment The display was not adjusted.
Q - W. Verify that the following image characteristics are acceptable:
Same observations as when image was observed in the previous test (Barco - 60.2.1)
without the switch.

112
60.3.1.2.2 Display image, active test of the switch
A. Actuate the switch.
(NOTE – the purpose of this portion of the test is to observe the display as the switching takes place, observe the display as it settles.)
B. Observe the image on the Sony 20 x 20 display.
C. Observe the display for indications of switch induced artifacts
Image roll
Extraneous characteristics
D. Measure and record the time required for the image to stabilize
E. Verify that the following image characteristics are acceptable:
Distortion
color variations
brightness variations
trapezoidal distortion
pin cushion distortion
jitter
convergence
F. Observe the horizontal image fills the full viewing area.
G. Observe that the horizontal image is centered on the screen.
H. Observe the vertical image fills the full viewing area.
I. Observe that the vertical image is centered on the screen.
J. Move the cursor over the entire screen; observe that motion is smooth and continuous.
K. Type in several upper and lower case letters; observe that the characters are displayed with nearly imperceptible delays.
L. Record the results of these observations on the data sheet.

113
M. Repeat steps 60.3.1.2.2 A up to and including step K
N. Since the graphics adapter cards that are driving the display are not synchronized to each other and have different video characteristics it may be necessary to repeat this test 5 times to observe the worst case of switching effects. As indicated record the time it takes for the display to stabilize.
O. Calculate the average time required for the image to stabilize.
Test Data – 60.3.1.2.2 Display image, active test of the switch
C. Observe the display for indications of switch induced artifacts
Image roll ____NONE__________
Extraneous characteristics ____NONE__________
D. Display settling time The display settling time is estimated to be less than 1 second. It could not be more accurately measured with the current test configuration.
E. Verify that the following image characteristics are acceptable:
Same observations as when image was observed in the previous test without the
switch (TechSource – 60.2.2, CDG – 60.2.1).
M. The test was performed by actuating the video switch multiple times and observing the display as the switch changed positions. The switching time could not be measured with the test configuration. There was no observable roll or loss of image when switching between the 2 video sources.

114
Shaded boxes are support equipment to power and operate the switch. Note that rather than using a rotary mechanical switch to activate the switch, a PC serial port was used.
Figure 33 TechSource Switch Configuration Sun 1 and CDG
SONYMDM20 x 20
SUN 1TechSource
CDG
Video switchTechSource
Power supply
PC to control switch
RISC Processor

115
60.3.2 Extron switch
This section describes the Extron switch testing and records the testing results (underlined).
60.3.2.1 Extron switch with Sun 2 (Barco) and CDG
Configure the equipment as shown in Figure 34.
60.3.2.1.1 Display image, static test of the switch
A. Turn on all of the equipment, set the processors SUN 2 and Processor controlling the CDG for a DSR Situation Display pattern to be displayed.
B. Allow sufficient time for the display to settle
C. Adjust the display as necessary
D. Observe the image on the Sony 20 x 20 display.
E. Verify that the following image characteristics are acceptable:
Distortion
color variations
brightness variations
trapezoidal distortion
pin cushion distortion
jitter
convergence
F. Observe the horizontal image fills the full viewing area.
G. Observe that the horizontal image is centered on the screen.
H. Observe the vertical image fills the full viewing area.
I. Observe that the vertical image is centered on the screen.

116
J. Move the cursor over the entire screen; observe that motion is smooth and continuous.
K. Type in several upper and lower case letters; observe that the characters are displayed with nearly imperceptible delays.
L. Record the results of these observations on the data sheet.
M. Actuate the switch
N. Allow sufficient time for the display to settle
O. Adjust the display as necessary
P. Observe the image on the Sony 20 x 20 display.
Q. Verify that the following image characteristics are acceptable:
Distortion
color variations
brightness variations
trapezoidal distortion
pin cushion distortion
jitter
convergence
R. Observe the horizontal image fills the full viewing area.
S. Observe that the horizontal image is centered on the screen.
T. Observe the vertical image fills the full viewing area.
U. Observe that the vertical image is centered on the screen.
V. Move the cursor over the entire screen; observe that motion is smooth and continuous.
W. Type in several upper and lower case letters; observe that the characters are displayed with nearly imperceptible delays.
X. Record the results of these observations on the data sheet.
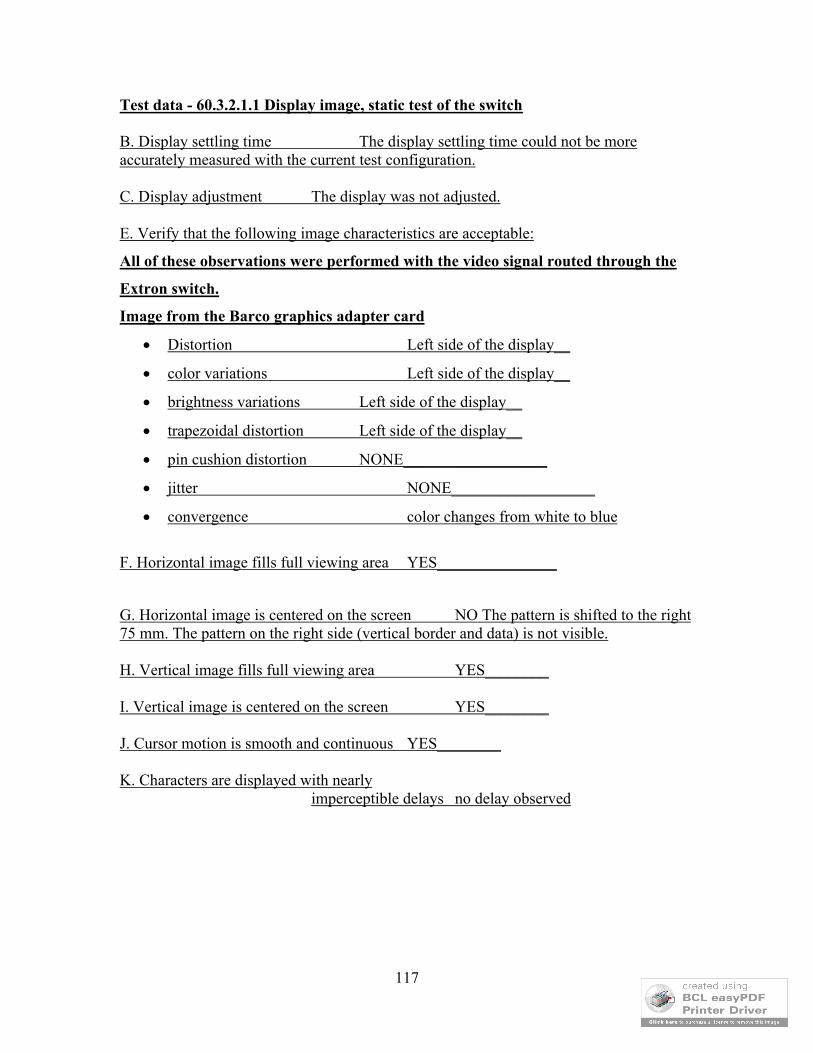
117
Test data - 60.3.2.1.1 Display image, static test of the switch
B. Display settling time The display settling time could not be more accurately measured with the current test configuration.
C. Display adjustment The display was not adjusted.
E. Verify that the following image characteristics are acceptable:
All of these observations were performed with the video signal routed through the
Extron switch.
Image from the Barco graphics adapter card
Distortion Left side of the display__
color variations Left side of the display__
brightness variations Left side of the display__
trapezoidal distortion Left side of the display__
pin cushion distortion NONE__________________
jitter NONE__________________
convergence color changes from white to blue
F. Horizontal image fills full viewing area YES_______________
G. Horizontal image is centered on the screen NO The pattern is shifted to the right 75 mm. The pattern on the right side (vertical border and data) is not visible.
H. Vertical image fills full viewing area YES________
I. Vertical image is centered on the screen YES________
J. Cursor motion is smooth and continuous YES________
K. Characters are displayed with nearly imperceptible delays no delay observed

118
M. Activate the switchImage from the CDG.
N. Display settling time The display settling time could not be measured with the current test configuration.
O. Display adjustment The display was not adjusted.
Q. Verify that the following image characteristics are acceptable:
Distortion NONE__________________
color variations NONE__________________
brightness variations NONE__________________
trapezoidal distortion NONE__________________
pin cushion distortion NONE__________________
jitter NONE__________________
convergence _GOOD ____________
R. Horizontal image fills full viewing area image shifted to the left
S. Horizontal image is centered on the screen NO The pattern is shifted to the right 75 mm. The pattern on the right side (vertical border and data) is not visible.
T. Vertical image fills full viewing area _____YES________
U. Vertical image is centered on the screen _____YES_______
V. Cursor motion is smooth and continuous _____YES_______
W. Characters are displayed with nearly imperceptible delays_________________________________no delay observed
The test configuration was changed to reverse the inputs to the switch.
The same shifts in the pattern were observed.

119
Display image, active test of the switch
The active test of the switch was not performed.
60.3.2.2 Extron switch with Sun 1 (TechSource) and CDG
This test was not performed due the unacceptable static display performance.
Refer to 60.3.2.1
Figure 34 Extron Switch Configuration
Note that in the figure above, there was no switch mechanism to switch the Extron switch. Evaluating the switching behavior of the Extron switch was not necessary since the static behavior of the switch was not acceptable.
SONYMDM20 x 20
SUN 2Barco
CDG
Video switchExtron
RISC Processor

120
60.3.3 Matrix switchThis section describes the Matrix switch testing and records the testing results (underlined).
60.3.3.1 Matrix switch with Sun 2 (Barco) and CDG
Configure the equipment as shown in Figure 35.
60.3.3.1.1 Display pattern, static test of the switch
A. Turn on all of the equipment, set the processors SUN 2 and Processor controlling the CDG for a DSR Situation Display pattern to be displayed.
B. Allow sufficient time for the display to settle
C. Adjust the display as necessary
D. Observe the pattern on the Sony 20 x 20 display.
E. Verify that the following pattern characteristics are acceptable:
Distortion
color variations
brightness variations
trapezoidal distortion
pin cushion distortion
jitter
convergence
F. Observe the horizontal pattern fills the full viewing area.
G. Observe that the horizontal pattern is centered on the screen.
H. Observe the vertical pattern fills the full viewing area.
I. Observe that the vertical pattern is centered on the screen.
J. Move the cursor over the entire screen; observe that motion is smooth and continuous.

121
K. Type in several upper and lower case letters; observe that the characters are displayed with nearly imperceptible delays.
L. Record the results of these observations.
M. Actuate the switch
N. Allow sufficient time for the display to settle
O. Adjust the display as necessary
P. Observe the pattern on the Sony 20 x 20 display.
Q. Verify that the following pattern characteristics are acceptable:
Distortion
color variations
brightness variations
trapezoidal distortion
pin cushion distortion
jitter
convergence
R. Observe the horizontal pattern fills the full viewing area.
S. Observe that the horizontal pattern is centered on the screen.
T. Observe the vertical pattern fills the full viewing area.
U. Observe that the vertical pattern is centered on the screen.
V. Move the cursor over the entire screen; observe that motion is smooth and continuous.
W. Type in several upper and lower case letters; observe that the characters are displayed with nearly imperceptible delays.
X. Record the results of these observations on the data sheet.

122
Test data - 60.3.3.1.1 Display image, static test of the switch
B. Display settling time The display settling time could not be measured with the current test configuration.
C. Display adjustment The display was not adjusted.
E. Verify that the following image characteristics are acceptable:
All of these observations were performed with the video signal routed through the
Matrix switch.
Image from the Barco graphics adapter card
Distortion NONE__________________
color variations NONE__________________
brightness variations NONE__________________
trapezoidal distortion NONE__________________
pin cushion distortion NONE__________________
jitter NONE__________________
convergence good___________________
F. Horizontal image fills full viewing area yes_______________
G. Horizontal image is centered on the screen NO The pattern is shifted to the left 2 mm.
H. Vertical image fills full viewing area yes_______________
I. Vertical image is centered on the screen yes_________
V. Cursor motion is smooth and continuous This test configuration did not support a cursor positioning device – this could not be tested.
W. Characters are displayed with nearly imperceptible delays This test configuration did not support a keyboard – this could not be tested.

123
M. Activate the switchImage from the CDG.
Same observations as when image was observed in the previous test without the
switch (CDG – 60.2.1).
N. Display settling time The display settling time could not be measured with the current test configuration.
O. Display adjustment The display was not adjusted.
Q. Verify that the following image characteristics are acceptable:
Distortion NONE__________________
color variations NONE__________________
brightness variations NONE__________________
trapezoidal distortion NONE__________________
pin cushion distortion NONE__________________
jitter NONE__________________
convergence good___________________
D. Horizontal image fills full viewing area yes_______________
E. Horizontal image is centered on the screen NO The pattern is shifted to the left 2 mm.
F. Vertical image fills full viewing area ______yes____________
G. Vertical image is centered on the screen yes____________
H. Cursor motion is smooth and continuous This test configuration did not support a cursor positioning device – this could not be tested.
W. Characters are displayed with nearly imperceptible delays This test configuration did not support a keyboard – this could not be tested.
The test configuration was changed to reverse the inputs to the switch.
The same shifts in the pattern were observed.

124
60.3.3.1.2 Display pattern, active test of the switch
A. Actuate the switch.
(NOTE – the purpose of this portion of the test is to observe the display as the switching takes place, observe the display as it settles.)
B. Observe the pattern on the Sony 20 x 20 display.
C. Observe the display for indications of switch induced artifacts
Pattern roll
Extraneous characteristics
D. Measure and record the time required for the pattern to stabilize
E. Verify that the following pattern characteristics are acceptable:
Distortion
color variations
brightness variations
trapezoidal distortion
pin cushion distortion
jitter
convergence
F. Observe the horizontal pattern fills the full viewing area.
G. Observe that the horizontal pattern is centered on the screen.
H. Observe the vertical pattern fills the full viewing area.
I. Observe that the vertical pattern is centered on the screen.
J. Move the cursor over the entire screen; observe that motion is smooth and continuous.
K. Type in several upper and lower case letters; observe that the characters are displayed with nearly imperceptible delays.

125
L. Record the results of these observations on the data sheet.
M. Repeat steps 60.3.3.1.2 A up to and including step K.
N. Since the graphics adapter cards that are driving the display are not synchronized to each other and have different video characteristics it may be necessary to repeat this test 5 times to observe the worst case of switching effects. As indicated record the time it takes for the display to stabilize.
O. Calculate the average time required for the pattern to stabilize.
Test Data – 60.3.3.1.2 Display image, active test of the switch
C. Observe the display for indications of switch induced artifacts
Image roll ____YES_________
Extraneous characteristics ____NO__________
D. Display settling time The display settling time could not be measured with the current test configuration.
E. Verify that the following image characteristics are acceptable:
Same observations as when image was observed in the previous test (Barco – 60.2.3,
CDG – 60.2.1) without the switch.
M. The test was performed by actuating the video switch multiple times and observing the display as the switch changed positions. The switching time could not be measured with the test configuration. There was no observable roll or loss of image.

126
Shaded boxes are support equipment to power and operate the switch.
Figure 35 Matrix Switch Configuration Sun 2 and CDG
SONYMDM20 x 20
SUN 2Barco
CDG
Video switchMatrix
Power supply
Manual control for video switch
RISC Processor
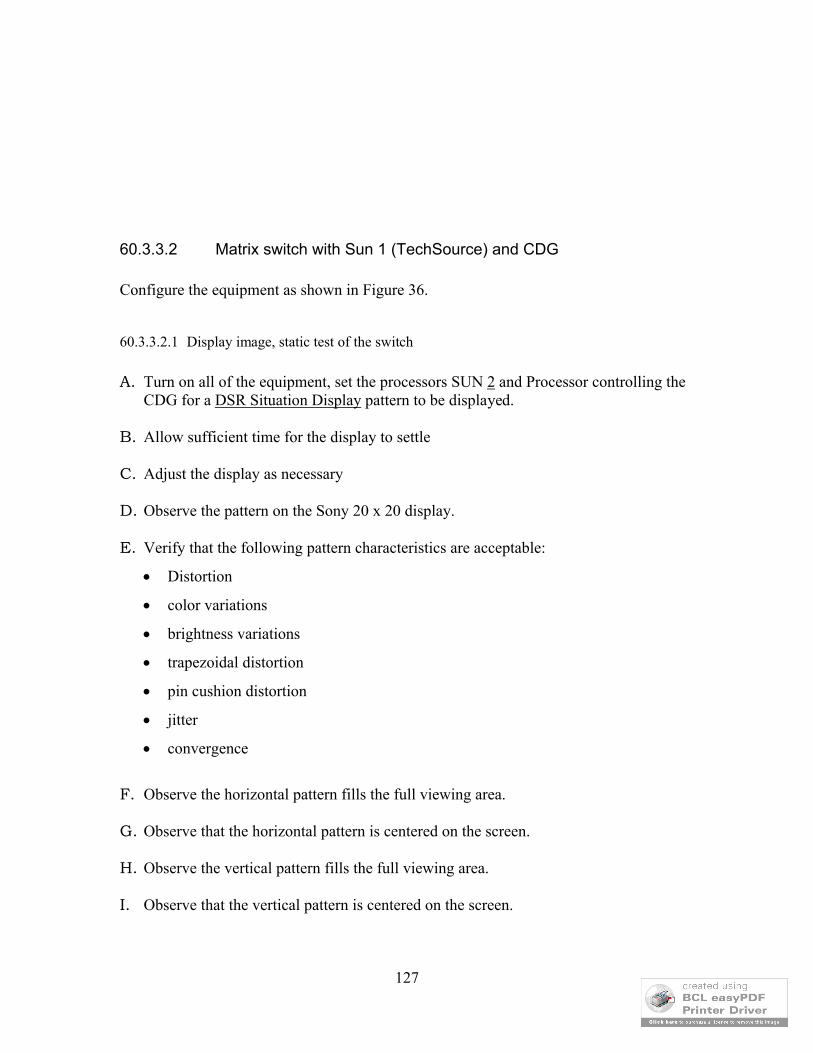
127
60.3.3.2 Matrix switch with Sun 1 (TechSource) and CDG
Configure the equipment as shown in Figure 36.
60.3.3.2.1 Display image, static test of the switch
A. Turn on all of the equipment, set the processors SUN 2 and Processor controlling the CDG for a DSR Situation Display pattern to be displayed.
B. Allow sufficient time for the display to settle
C. Adjust the display as necessary
D. Observe the pattern on the Sony 20 x 20 display.
E. Verify that the following pattern characteristics are acceptable:
Distortion
color variations
brightness variations
trapezoidal distortion
pin cushion distortion
jitter
convergence
F. Observe the horizontal pattern fills the full viewing area.
G. Observe that the horizontal pattern is centered on the screen.
H. Observe the vertical pattern fills the full viewing area.
I. Observe that the vertical pattern is centered on the screen.

128
J. Move the cursor over the entire screen; observe that motion is smooth and continuous.
K. Type in several upper and lower case letters; observe that the characters are displayed with nearly imperceptible delays.
L. Record the results of these observations on the data sheet.
M. Actuate the switch
N. Allow sufficient time for the display to settle
O. Adjust the display as necessary
P. Observe the pattern on the Sony 20 x 20 display.
Q. Verify that the following pattern characteristics are acceptable:
Distortion
color variations
brightness variations
trapezoidal distortion
pin cushion distortion
jitter
convergence
R. Observe the horizontal pattern fills the full viewing area.
S. Observe that the horizontal pattern is centered on the screen.
T. Observe the vertical pattern fills the full viewing area.
U. Observe that the vertical pattern is centered on the screen.
V. Move the cursor over the entire screen; observe that motion is smooth and continuous.
W. Type in several upper and lower case letters; observe that the characters are displayed with nearly imperceptible delays.
X. Record the results of these observations on the data sheet.

129
Test data - 60.3.3.2.1 Display image, static test of the switch
B. Display settling time The display settling time could not be measured with the current test configuration.
C. Display adjustment The display was not adjusted.
E. Verify that the following image characteristics are acceptable:
All of these observations were performed with the video signal routed through the
Matrix switch.
Image from the TechSource graphics adapter card
Distortion NONE__________________
color variations NO_____________________
brightness variations NONE__________________
trapezoidal distortion NONE__________________
pin cushion distortion NO_____________________
jitter NONE__________________
convergence GOOD__________________
F. Horizontal image fills full viewing area YES______________
G. Horizontal image is centered on the screen YES________
H. Vertical image fills full viewing area YES – slight shift to the left, pattern is completely visible
I. Vertical image is centered on the screen YES________
J. Cursor motion is smooth and continuous This test configuration did not support a cursor positioning device – this could not be tested.
K. Characters are displayed with nearly imperceptible delays This test configuration did not support a keyboard – this could not be tested.

130
M. Activate the switchImage from the CDG.
N. Display settling time The display settling time could not be measured with the current test configuration.
O. Display adjustment The display was not adjusted.
Q. Verify that the following image characteristics are acceptable:
Distortion NONE__________________
color variations NO_____________________
brightness variations NONE__________________
trapezoidal distortion NONE__________________
pin cushion distortion NO_____________________
jitter NONE__________________
convergence GOOD__________________
R. Horizontal image fills full viewing area YES______________
S. Horizontal image is centered on the screen YES – slight shift to the left, pattern is completely visible
T. Vertical image fills full viewing area YES______________
U. Vertical image is centered on the screen small shift to the right
V. Cursor motion is smooth and continuous This test configuration did not support a cursor positioning device – this could not be tested.
W. Characters are displayed with nearly imperceptible delays This test configuration did not support a keyboard – this could not be tested.

131
60.3.3.2.2 Display pattern, active test of the switch
A. Actuate the switch.
(NOTE – the purpose of this portion of the test is to observe the display as the switching takes place, observe the display as it settles.)
B. Observe the pattern on the Sony 20 x 20 display.
C. Observe the display for indications of switch induced artifacts
Pattern roll
Extraneous characteristics
D. Measure and record the time required for the pattern to stabilize
E. Verify that the following pattern characteristics are acceptable:
Distortion
color variations
brightness variations
trapezoidal distortion
pin cushion distortion
jitter
convergence
F. Observe the horizontal pattern fills the full viewing area.
G. Observe that the horizontal pattern is centered on the screen.
H. Observe the vertical pattern fills the full viewing area.
I. Observe that the vertical pattern is centered on the screen.
J. Move the cursor over the entire screen; observe that motion is smooth and continuous.
K. Type in several upper and lower case letters; observe that the characters are displayed with nearly imperceptible delays.
L. Record the results of these observations on the data sheet.
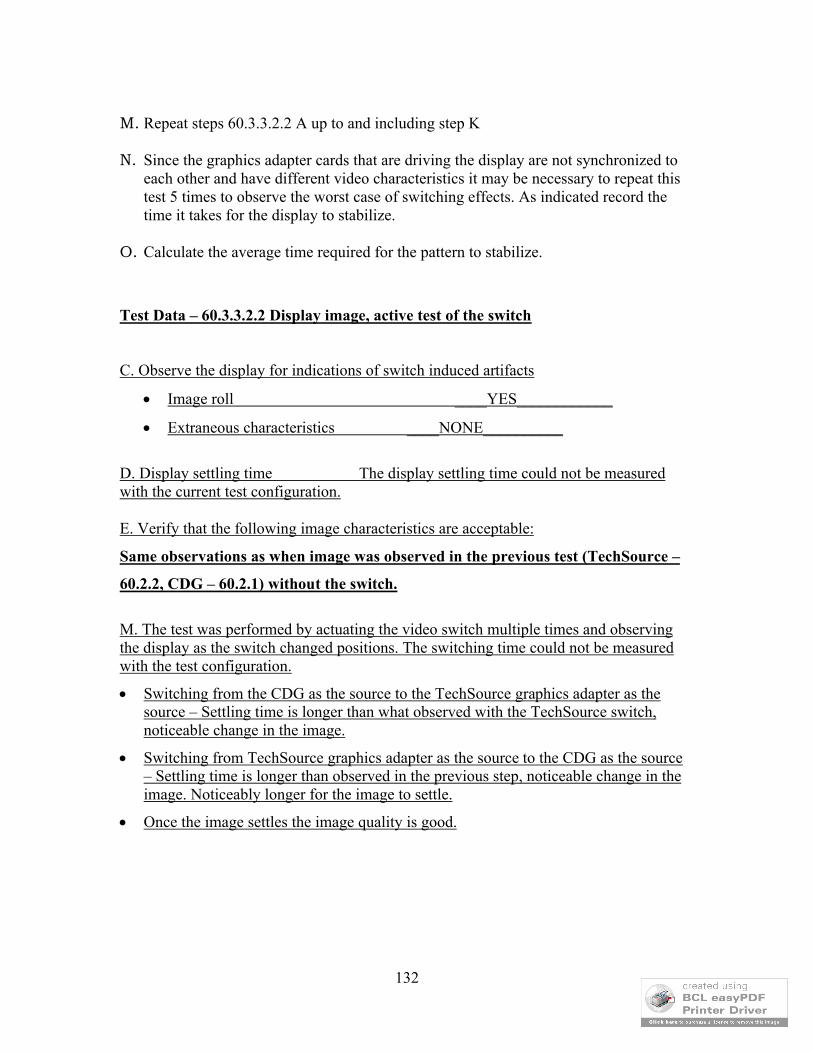
132
M. Repeat steps 60.3.3.2.2 A up to and including step K
N. Since the graphics adapter cards that are driving the display are not synchronized to each other and have different video characteristics it may be necessary to repeat this test 5 times to observe the worst case of switching effects. As indicated record the time it takes for the display to stabilize.
O. Calculate the average time required for the pattern to stabilize.
Test Data – 60.3.3.2.2 Display image, active test of the switch
C. Observe the display for indications of switch induced artifacts
Image roll ____YES____________
Extraneous characteristics ____NONE__________
D. Display settling time The display settling time could not be measured with the current test configuration.
E. Verify that the following image characteristics are acceptable:
Same observations as when image was observed in the previous test (TechSource –
60.2.2, CDG – 60.2.1) without the switch.
M. The test was performed by actuating the video switch multiple times and observing the display as the switch changed positions. The switching time could not be measured with the test configuration.
Switching from the CDG as the source to the TechSource graphics adapter as the source – Settling time is longer than what observed with the TechSource switch, noticeable change in the image.
Switching from TechSource graphics adapter as the source to the CDG as the source – Settling time is longer than observed in the previous step, noticeable change in the image. Noticeably longer for the image to settle.
Once the image settles the image quality is good.
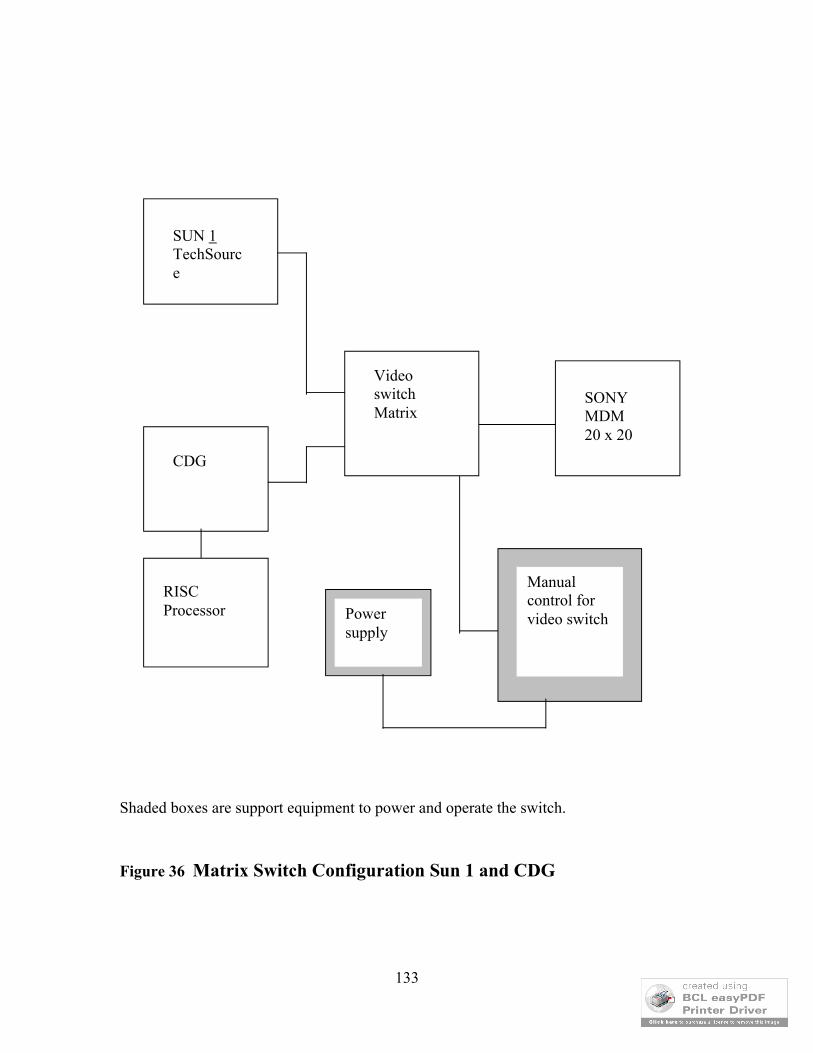
133
Shaded boxes are support equipment to power and operate the switch.
Figure 36 Matrix Switch Configuration Sun 1 and CDG
SONYMDM20 x 20
SUN 1TechSource
CDG
Video switchMatrix
Power supply
Manual control for video switch
RISC Processor

134
60.3.4 Video Switch Evaluation Summary and RecommendationThe behaviors of the switches are summarized in the section below.
60.4 Graphics Card Adapter Market SurveyAfter investigating the commercially available graphics card adapters the devices manufactured by TechSource and Barco were selected as the best candidate devices for evaluation for Phase 2.
Manufacturer
Characteristic Barco TechSource
Model PVS5600 Raptor 2000-24M
Cost $7890 $10,000
Resolution/Refresh rate
2048x2048 / 60Hz and lower 2048x2048
Capabilities 2D Support3 cursorsSupports all X Window fixed and variable width raster fonts
Performance (/sec) - 2.5 M dots- 500K vectors (100 pixel)- 1.5 M vector (10 Pixel)- 2600 500x500 rectangles- 48K 100x100 rectangles- 1.5 M 8x13 char (70 charstring)- 640K 6x13 char (8 char string)- 200K 6x13 char (1 char string)- 892 (500x500) pixmap to window
- 900K X Windows characters,- Back Buffer, erase < 100 usec.
Underlay/Overlay Planes
Yes Super Overlay Yes, Multiple Overlay Extensions (MOX), similar to DSR
Cursors Triple hardware option 3
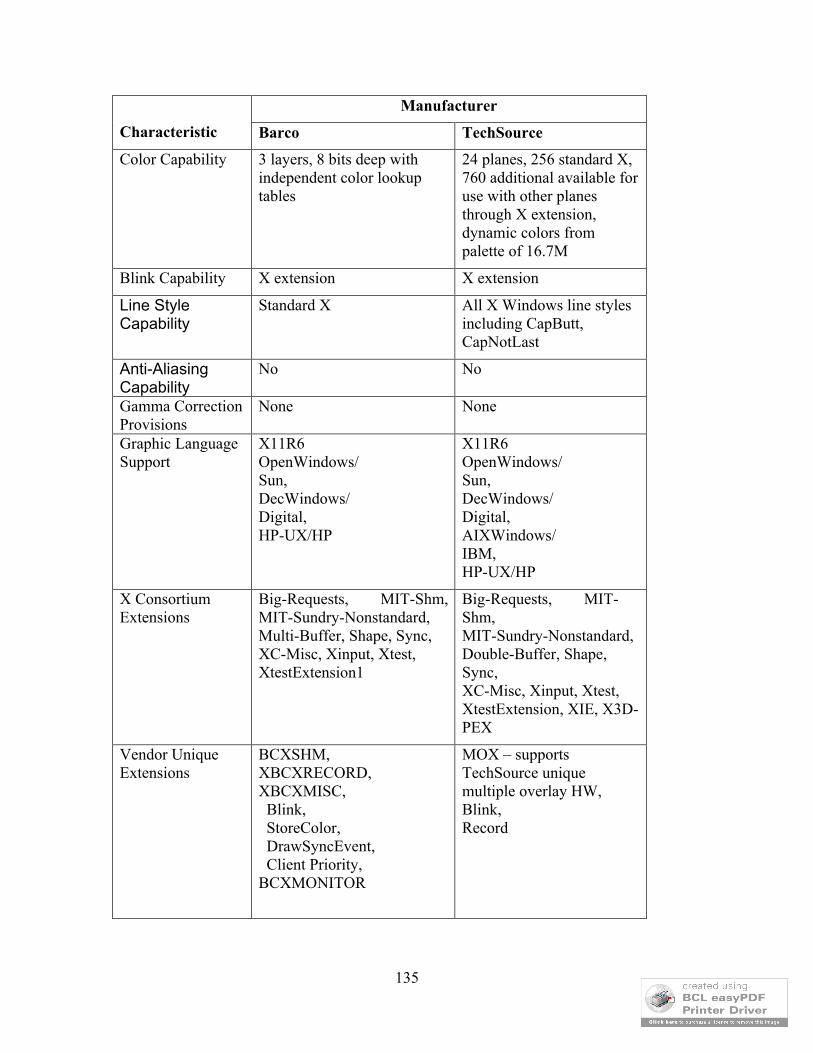
135
Manufacturer
Characteristic Barco TechSource
Color Capability 3 layers, 8 bits deep with independent color lookup tables
24 planes, 256 standard X, 760 additional available for use with other planes through X extension, dynamic colors from palette of 16.7M
Blink Capability X extension X extension
Line Style Capability
Standard X All X Windows line styles including CapButt, CapNotLast
Anti-Aliasing Capability
No No
Gamma Correction Provisions
None None
Graphic Language Support
X11R6OpenWindows/Sun,DecWindows/Digital,HP-UX/HP
X11R6OpenWindows/Sun,DecWindows/Digital,AIXWindows/IBM,HP-UX/HP
X Consortium Extensions
Big-Requests, MIT-Shm, MIT-Sundry-Nonstandard, Multi-Buffer, Shape, Sync, XC-Misc, Xinput, Xtest, XtestExtension1
Big-Requests, MIT-Shm, MIT-Sundry-Nonstandard, Double-Buffer, Shape, Sync, XC-Misc, Xinput, Xtest, XtestExtension, XIE, X3D-PEX
Vendor Unique Extensions
BCXSHM, XBCXRECORD, XBCXMISC, Blink, StoreColor, DrawSyncEvent, Client Priority,BCXMONITOR
MOX – supports TechSource unique multiple overlay HW, Blink, Record

136
Manufacturer
Characteristic Barco TechSource
Performance Monitoring
Draw synchronization event Run-time diagnostics available
Freeze Display if Server Ceases Operation
Display erased when X Server initialized or shut down
Display erased when X Server initialized or shut down
Standard Memory 16MB 12MB
Standard plus Optional Memory
32MB (used in eval) 24M (12MB Frame Buff, 12 MB Refresh)
(used in eval)
Interfaces PCI-32 bit, 3 or 5 volt PCI, version 2.133 MHz., 32-bit, RGB - RS343 (50 Ohms),TTL Sync (75 Ohms)
Software support available for several I/O devices.
Special Features RADAR Scan Converter Interface Option' X Windows recording and playback option
Number of Displays
1 1
Size Full length PCI slot Single long PCI(12.283"x4.2")
Power W/fan: +5v 5 amp max
W/o fan: +5v 4 amp max, 3 amp typical
+12 v less than 100 ma
< 25 watts
Environment 10 to 50C Op,-10 to 70C Non-Op,Humidity 10%-90% non-Condense.
Warranty 1 year warranty (parts and labor)
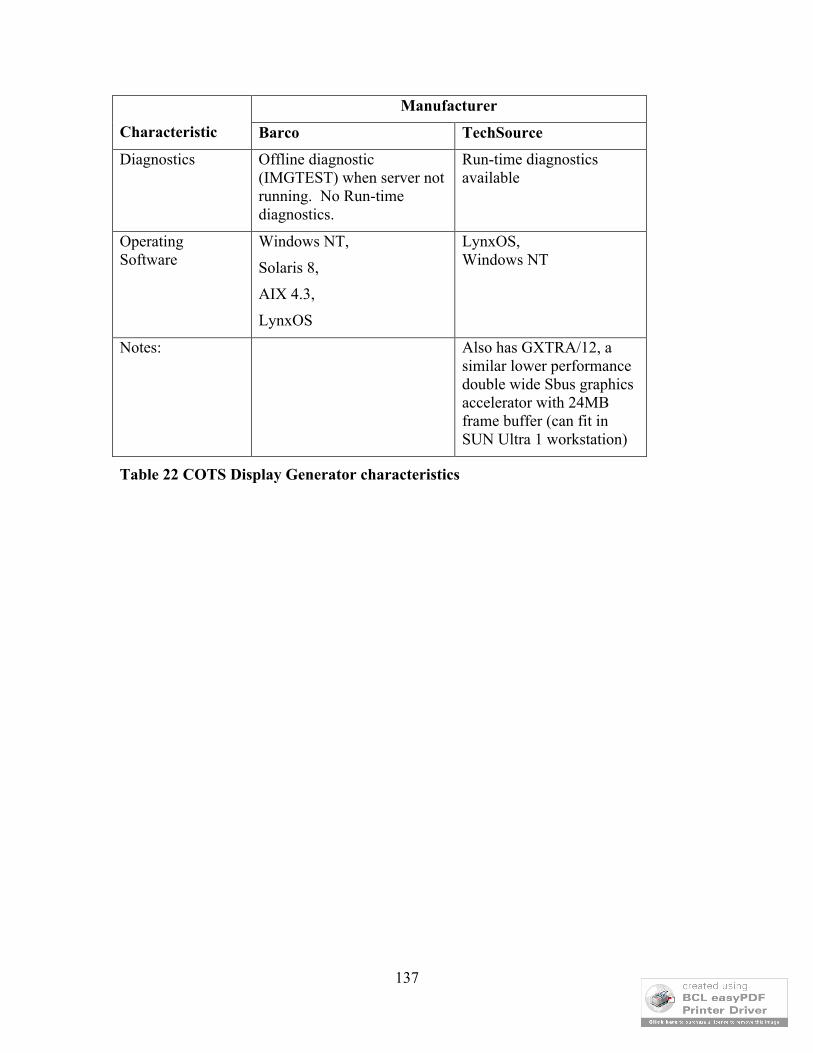
137
Manufacturer
Characteristic Barco TechSource
Diagnostics Offline diagnostic (IMGTEST) when server not running. No Run-time diagnostics.
Run-time diagnostics available
Operating Software
Windows NT,
Solaris 8,
AIX 4.3,
LynxOS
LynxOS,Windows NT
Notes: Also has GXTRA/12, a similar lower performance double wide Sbus graphics accelerator with 24MB frame buffer (can fit in SUN Ultra 1 workstation)
Table 22 COTS Display Generator characteristics

138
60.5 Video/Serial Switch (VSS) Market SurveyCOTS Video switches are of limited availability because of the high bandwidth of the MDM video interface. In order to avoid significant image degradation the switch video bandwidth should be equal to or greater than that of the video amplifiers in the MDM, i.e. 350MHz. The video signals should be terminated with 50 ohms when not switched and the sync signal should similarly be terminated in 75 ohms.
Figure 37 Video Switch Market Survey Summary
ManufacturerCharacteristic Extron
ElectronicsTechSource Inc. Matrix Systems Corporation
ModelSW 4 AR MX HV xi (4 : 1)
RGB Video Switch (2 : 1)
Model 7000/13378 Coaxial Video Relay Module (3 :1)
Cost $489 $1200 $1023MTBF 2,419,756.7 hours 6,435,156 hours# RGBHV Inputs 4 2 (3 inputs not
planned)3
Video Input/Output Impedance (Ohms)
75 Video 50/Sync 75 Video 50/Sync 75
Bandwidth (MHz) 350 350 >350Connectors BNC BNC/9 pin Dsub
(male)BNC
Remote Control RS 232, Keypad, IR
RS-422/switch 5 volts
Voltage 100 to 240 VAC 5 VDC (>500ma) 5 volts (external)Power (Watts) 10 2.5Size HxWxD (in.) 3.35 x 8.4 x 6.25 1.5 x 17.0 x 2.5 3.25 x 0.625 x 15.1Weight (lbs.) 5.5 2.8Op Temperature 0 to + 50C -30 to + 150FStorage Temperature
-40 to +70C
Humidity 10 to 90 %, non-condensing
0 to 95%
AltitudeApprovals UL Listed, CSA,
CEUL Listed, CUL
FCC No Warranty 2 Years parts &
labor1 Year
Comments Also available 6 inputs
TechSource can include switched RS-422 signals

139
60.6 Hardware ConfigurationFigure 38 illustrates the configuration of the video switch, the keyboard switch, and the LAN interconnections. Notice that the input to the video switch is the CDG and the two graphics cards. The output of the video switch is to the MDM. Notice that the keyboard input to the Sun-1 and Sun-2 can be switched with a serial switch. Both the video switch and serial switch were driven from a single rotary switch (S).
Figure 38 Hardware Configuration (Detail View)
MDM
CD
G
PC
P
Keyboard
MDM
PC
P
Maintenance LAN
Keyboard TB
VideoSwitch
SUN -3
Native Ethernet
Ethernet Adapt.
SUN -2
Native Ethernet
Ethernet Adapt.
BarcoGraphicsAdapter
Native RS-232 Port
SUN -1
Native Ethernet
Ethernet Adapt.
TechSourceGraphicsAdapter
Native RS-232 Port
Cisco WS-C412 Hub
Omnitron Power Chassis + 3 10Base-T/2 Converters
BlackBoxSW980Switch
17" DisplayKeyboardMouse
17" DisplayKeyboardMouse
17" DisplayKeyboardMouse
RS-422/232Converter
CD
G
VE
M
VE
M
S
S
S
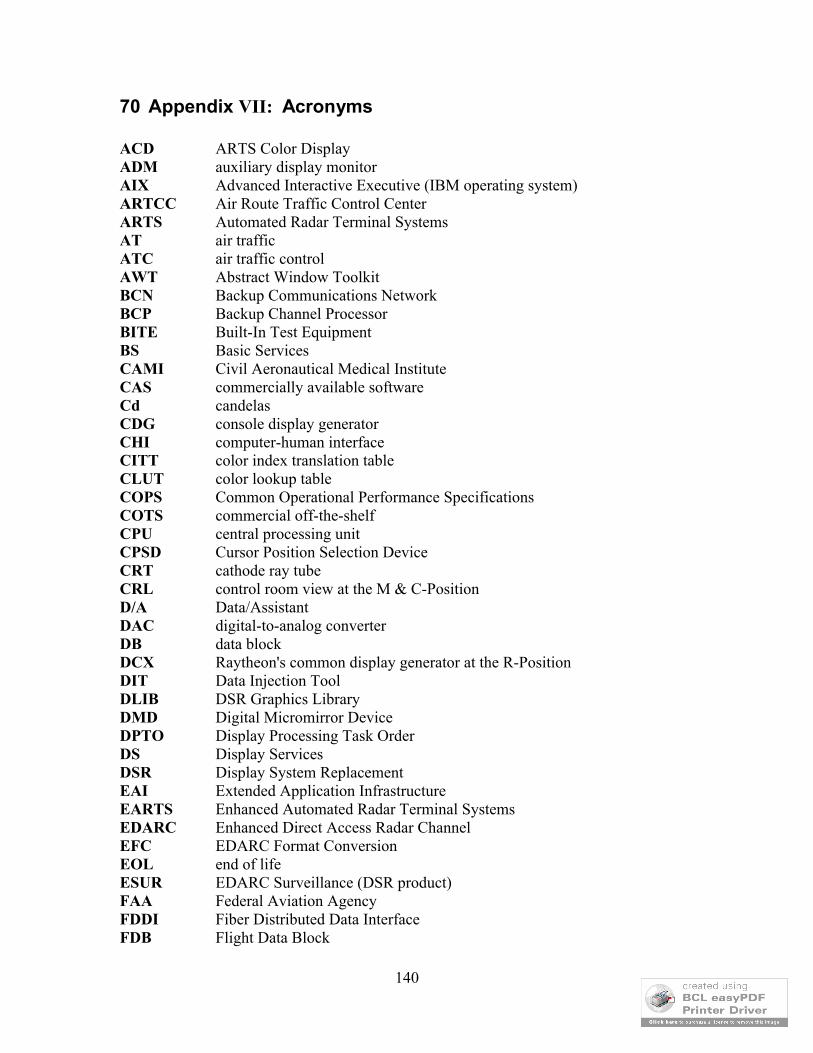
140
70 Appendix VII: Acronyms
ACD ARTS Color DisplayADM auxiliary display monitorAIX Advanced Interactive Executive (IBM operating system)ARTCC Air Route Traffic Control CenterARTS Automated Radar Terminal SystemsAT air trafficATC air traffic controlAWT Abstract Window ToolkitBCN Backup Communications NetworkBCP Backup Channel ProcessorBITE Built-In Test EquipmentBS Basic ServicesCAMI Civil Aeronautical Medical InstituteCAS commercially available softwareCd candelasCDG console display generatorCHI computer-human interfaceCITT color index translation tableCLUT color lookup tableCOPS Common Operational Performance SpecificationsCOTS commercial off-the-shelfCPU central processing unitCPSD Cursor Position Selection DeviceCRT cathode ray tubeCRL control room view at the M & C-PositionD/A Data/AssistantDAC digital-to-analog converterDB data blockDCX Raytheon's common display generator at the R-PositionDIT Data Injection ToolDLIB DSR Graphics LibraryDMD Digital Micromirror DeviceDPTO Display Processing Task OrderDS Display ServicesDSR Display System ReplacementEAI Extended Application InfrastructureEARTS Enhanced Automated Radar Terminal SystemsEDARC Enhanced Direct Access Radar ChannelEFC EDARC Format ConversionEOL end of lifeESUR EDARC Surveillance (DSR product)FAA Federal Aviation AgencyFDDI Fiber Distributed Data InterfaceFDB Flight Data Block

141
FDM Frozen Display MonitorFED Field Effect DisplayFG functional groupGL Graphic LanguageGUI Graphical User InterfaceH horizontalHFC Host Format ConversionHIFS Host Interface and Surveillance (DSR product)HP Hewlett-Packard CorporationHz hertzI/O input/outputI2F Integration and Interoperability Facility IBM International Business MachinesIEEE Institute of Electrical and Electronics EngineersIIF Integration and Interoperability FacilityKB kilobytesLAN local area networkLCD liquid crystal displayLCN Local Communications NetworkLDB Limited Data BlockLED Light Emitting DiodeLGSM Local/Group SMMMm meterM&C Monitor and ControlMbytes megabytesMCW Micro-EARTS Controller WorkstationMDM main display monitorMHz megahertzMIFT Manage Internal Facility TimeMOX Multiple Overlay ExtensionMpixels megapixelsMTBF mean time between failuresNAS National Airspace System softwareNATS National Air Traffic Service (United Kingdom)NATCA National Air Traffic Controllers AssociationODID Operational Display and Input DevelopmentOPEX Operational ExerciserOS operating systemOSE operating system extensionOSI open systems interconnectionOSIM Simulation ServicesPCI Peripheral Component InterconnectPCP primary channel processorPCP-R primary channel processor - R positionPDU power distribution unitPEX PHIGS Extensions to X
142
R&D research and developmentRDP radar data processorRFI request for informationRGB red, green, blueRGL remote graphics librarySCSI small computer system interface (ANSI X3.131-1986)SDA Standard Display ApplicationSITS Simulation and Test SupportSMGT Operational System ManagementSSF System Support FacilityTBD to be determinedTCP/IP Transmission Control Protocol/Internet ProtocolTFT thin film transistorTFTLCD Thin Film Transistor Liquid Crystal DisplayURET User Request Evaluation ToolV verticalVEM VSCS Electronics ModuleVESA Video Electronics Standards AssociationVME Virtual Machine ExtendedVSCS Voice Switching and Control SystemVSS Video/Serial SwitchWARP Weather and Radar ProcessorWDA WARP Display ApplicationWJHTC William J. Hughes Technical CenterWN Windows NetworkXKI X Windows Keyboard InterfaceXlib X Windows LibraryXm X Windows Motif ToolkitXt X Windows Toolkit Intrinsics