DISLOCATION SLIP AND TWINNING STRESS IN SHAPE …
177
DISLOCATION SLIP AND TWINNING STRESS IN SHAPE MEMORY ALLOYS- THEORY AND EXPERIMENTS BY JIFENG WANG DISSERTATION Submitted in partial fulfillment of the requirements for the degree of Doctor of Philosophy in Mechanical Engineering in the Graduate College of the University of Illinois at Urbana-Champaign, 2013 Urbana, Illinois Doctoral Committee: Professor Huseyin Sehitoglu, Chair and Director of Research Professor Elif Ertekin Professor Jimmy Hsia Professor Pascal Bellon
Transcript of DISLOCATION SLIP AND TWINNING STRESS IN SHAPE …

DISLOCATION SLIP AND TWINNING STRESS IN SHAPE MEMORY ALLOYS-
THEORY AND EXPERIMENTS
BY
JIFENG WANG
DISSERTATION
Submitted in partial fulfillment of the requirements
for the degree of Doctor of Philosophy in Mechanical Engineering
in the Graduate College of the
University of Illinois at Urbana-Champaign, 2013
Urbana, Illinois
Doctoral Committee:
Professor Huseyin Sehitoglu, Chair and Director of Research
Professor Elif Ertekin
Professor Jimmy Hsia
Professor Pascal Bellon

ii
Abstract
Slip and twinning are two important deformation mechanisms governing Shape Memory
Alloys (SMAs) plasticity, which results in affecting their pseudoelasticity and shape memory
performance. Precisely determining Peierls stress in dislocation slip and critical twin nucleation
stress in twinning is essential to facilitate the design of new transforming alloys. This thesis
presents an advanced energetic approach to investigate the attributes of phase transformation,
slip and twinning in SMAs utilizing Density Functional Theory based ab initio calculations, and
the role of energy barrier is characterized. Through different length scales incorporating
atomistic simulations into dislocation-based mechanics, an extended Peierls-Nabarro (P-N)
model is developed to establish flow stresses in SMAs and the predicted Peierls stresses are in
excellent agreement with experiments. In addition, a twin nucleation model based on P-N
formulation is proposed to determine the critical twin nucleation stresses in SMAs, and the
validity of the model is confirmed by determining twinning stresses from experiments.
The first part of the thesis presents an energetic approach to comprehend a better
understanding of phase stability, martensitic transformation path and dislocation slip in SMAs
utilizing first principle simulations. In particular, we discovered energy barriers in transformation
path from austenite B2 to martensite B19' and B33 of NiTi, and studied phase stability of B19'
and B33 under effect of hydrostatic pressure. The results provide a more authoritative
explanation regarding the discrepancy between the experimental observations and theoretical
studies. In addition, we calculated energy barriers associated with martensitic transformation
from austenite L21 to modulated martensite 10M of Ni2FeGa incorporating shear and shuffle and
slip resistance in [111] direction as well as in [001] direction of austenite L21. The results show
that the unstable stacking fault energy barriers for slip by far exceeded the transformation
transition state barrier permitting transformation to occur with little irreversibility. This explains
the experimentally observed low martensitic transformation stress and high reversible strain in
Ni2FeGa. Furthermore, we established the energetic pathway and calculated the theoretical shear
strength of several slip systems in B2 NiTi. The results show the smallest and second smallest
energy barriers and theoretical shear strength for the (011)[100] and the (011)[1 11] cases,
respectively, which are consistent with the experimental observations. This study presents a

iii
quantitative understanding of plastic deformation mechanism in B2 NiTi, and the methodology
can be applied for consideration of a better understanding of SMAs.
In the second part of the thesis, we developed an extended P-N model to precisely predict
dislocation slip stress in SMAs utilizing atomistic simulations and mesomechanics. We validated
our model by conducting experiments and the results show that this model provides precise and
rapid results compared to traditional experiments. This extended P-N model with Generalized
Stacking Fault Energy curves provides an excellent basis for a theoretical study of the dislocation
structure and operative slip modes, and an understanding to discovery of new compositions
avoiding the trial-by-trial approach in SMAs. Further, we developed a twin nucleation model
based on the P-N formulation to precisely predict twin nucleation stress in SMAs. We classified
different twin modes that are operative in different crystal structures and developed a
methodology by establishing the Generalized Planar Fault Energy to predict the twinning stress.
This new model provides a science-based understanding of the twin stress for developing SMAs.

iv
To my wonderful family

v
Acknowledgements
I would like to express my gratefulness to my mentor, Professor Huseyin Sehitoglu. I feel
very fortunate to have such a wise and supporting person as my advisor. Professor Sehitoglu puts
his efforts in giving me advices on how to have efficient thinking in my research projects, make
insightful figures and deliver clear information in papers and presentations. He works with me on
every small step in my publications, from which I have benefited tremendously. His professional
guidance and support have been the key to my success as a graduate student and development as
a research scientist. I am grateful for working with him at UIUC.
I would like to thank my committee members, Professors. Elif Ertekin, Jimmy Hsia and
Pascal Bellon for their thoughtful insights that have been an asset to the development and
progression of my dissertation work. I appreciate the discussion with them regarding the
computational approach utilized in my work and crystal structure determination and stability.
I also owe a great deal of gratitude to my fellow lab members (both past and present). I
thank Tawhid Ezaz, Piyas Chowdhury, Avinesh Ojha, Alpay Oral and Shahla Chowdhury for
fruitful discussion in atomistic simulations and VASP. I have benefited a lot from their expertise
and understanding of computations in material science and engineering. I also grateful to Wael
Abuzaid, Garret Pataky, Mallory Casperson, Luca Patriarca, Sertan Alkan, Emanuele
Sgambitterra and Silvio Rabbolini for helping me set up test rig and teaching me to conduct
experiments. With their help, I was able to complete my experiments and record data for my
research.
Finally, I would like to thank my family and friends for all of their love, support and
patience that they have given me through the difficult times that I’ve endured during my
graduate training. I thank my parents for their endless sacrifices and best wishes during my stay
in the US. I dedicate this thesis to my dear wife, Lisi, for her love, and my lovely son, Eric, for
the happiness and joy he always gives to me.

vi
Contents
List of Figures ................................................................................................................................ x
List of Tables ............................................................................................................................... xx
Chapter 1 Introduction ............................................................................................................... 1
1.1 Background ........................................................................................................................... 1
1.1.1 Phase transformation in SMAs-the Ni2FeGa example ................................................... 1
1.1.2 Dislocation slip in shape memory alloys ........................................................................ 3
1.1.3 Twinning in shape memory alloys .................................................................................. 6
1.2 Methodology ......................................................................................................................... 8
1.3 Thesis Organization............................................................................................................... 9
Chapter 2 Resolving Quandaries Surrounding NiTi .............................................................. 12
2.1 Abstract ............................................................................................................................... 12
2.2 Introduction ......................................................................................................................... 12
2.3 Results and Discussion ........................................................................................................ 14
2.4 Summary ............................................................................................................................. 22
Chapter 3 Transformation and Slip Behavior of Ni2FeGa ..................................................... 23
3.1 Abstract ............................................................................................................................... 23
3.2 Introduction ......................................................................................................................... 23
3.2.1 Challenges in Designing Shape Memory Alloys .......................................................... 23
3.2.2 Energetics of Phase Transformation and Dislocation Slip ........................................... 25
3.3 Cubic to Modulated (10M) Transformation in Ni2FeGa ..................................................... 29
3.4 Dislocation Slip (GSFE) in Ni2FeGa .................................................................................. 34
3.4.1 The (011)<111> Case ................................................................................................... 34
3.4.2 The (011) <001> Case .................................................................................................. 38

vii
3.5 Experimental Results........................................................................................................... 39
3.6 Implication of Results ......................................................................................................... 41
Chapter 4 Plastic Deformation of NiTi Shape Memory Alloys ............................................. 45
4.1 Abstract ............................................................................................................................... 45
4.2 Introduction ......................................................................................................................... 45
4.3 Experimental Results........................................................................................................... 50
4.3.1 Experimental Evidence of {011}<100> and (011)<111> Slip ..................................... 50
4.3.2 Further Evidence of Dislocation Slip in Thermal Cycling and Pseudoelasticity
Experiments at Microscale .................................................................................................... 51
4.3.3 Plasticity Mediated Transformation Strains and Residual Strains under Thermal
Cycling at Macroscale ........................................................................................................... 53
4.4 Simulation Methodology-GSFE Calculations ..................................................................... 54
4.5 Simulation Results............................................................................................................... 55
4.5.1 The (011)[100] Case ..................................................................................................... 55
4.5.2 The (011)[111] Case ................................................................................................... 57
4.5.3 The (011)[011] Case ................................................................................................... 59
4.5.4 The (211)[111] Case .................................................................................................... 60
4.5.5 The (001)[010] Case ..................................................................................................... 62
4.6 Analysis and Discussion of Results .................................................................................... 62
4.7 Summary ............................................................................................................................. 67
Chapter 5 Dislocation Slip Stress Prediction in Shape Memory Alloys ............................... 68
5.1 Abstract ............................................................................................................................... 68
5.2. Introduction ........................................................................................................................ 69
5.2.1 Background ................................................................................................................... 69
5.2.2 Dislocation Slip Mechanism ......................................................................................... 73

viii
5.2.3 Purpose and Scope ........................................................................................................ 74
5.3 DFT Calculation Setup ........................................................................................................ 75
5.4 Simulation Results and Discussion ..................................................................................... 76
5.4.1 The L10 Crystal Structure ............................................................................................ 76
5.4.2 Dislocation Slip of L10 Ni2FeGa................................................................................... 79
5.4.3 Peierls-Nabarro Model for Dislocation Slip ................................................................. 88
5.4.4 Peierls Stress Calculations of L10 Ni2FeGa .................................................................. 91
5.5 Experimental Observations and Viewpoints on Martensite Deformation Behavior ........... 97
5.5.1 In-Situ TEM Observations of Dislocation Slip ............................................................ 97
5.5.2 Determination of Martensite Slip Stress from Experiments ....................................... 100
5.6 Prediction of Dislocation Slip Stress for Shape Memory Alloys .................................... 102
5.7 Summary ........................................................................................................................... 103
Chapter 6 Twinning Stress in Shape Memory Alloys-Theory and Experiments .............. 106
6.1 Abstract ............................................................................................................................. 106
6.2 Introduction ....................................................................................................................... 106
6.3 Methodologies for twin nucleation ................................................................................... 110
6.3.1 DFT calculation setup ................................................................................................. 111
6.3.2 Twinning energy landscapes (GPFE)- the L10 Ni2FeGa example .............................. 112
6.3.3 Twinning energy landscapes (GPFE)- the 14M Ni2FeGa example ............................ 117
6.3.4 Peierls-Nabarro Model Fundamentals ........................................................................ 119
6.4 Twin nucleation model based on P-N formulation- the L10 Ni2FeGa example ................ 122
6.5 Prediction of Twinning Stress in Shape Memory Alloys ................................................. 128
6.6 Determination of twinning stress from experiments ......................................................... 132
6.7 Discussion of Results ........................................................................................................ 133
6.8 Conclusions ....................................................................................................................... 137

ix
Chapter 7 Summary and Future work .................................................................................. 138
7.1 Summary ........................................................................................................................... 138
7.2 Future work ....................................................................................................................... 140
References .................................................................................................................................. 141
Publications ............................................................................................................................... 156

x
List of Figures
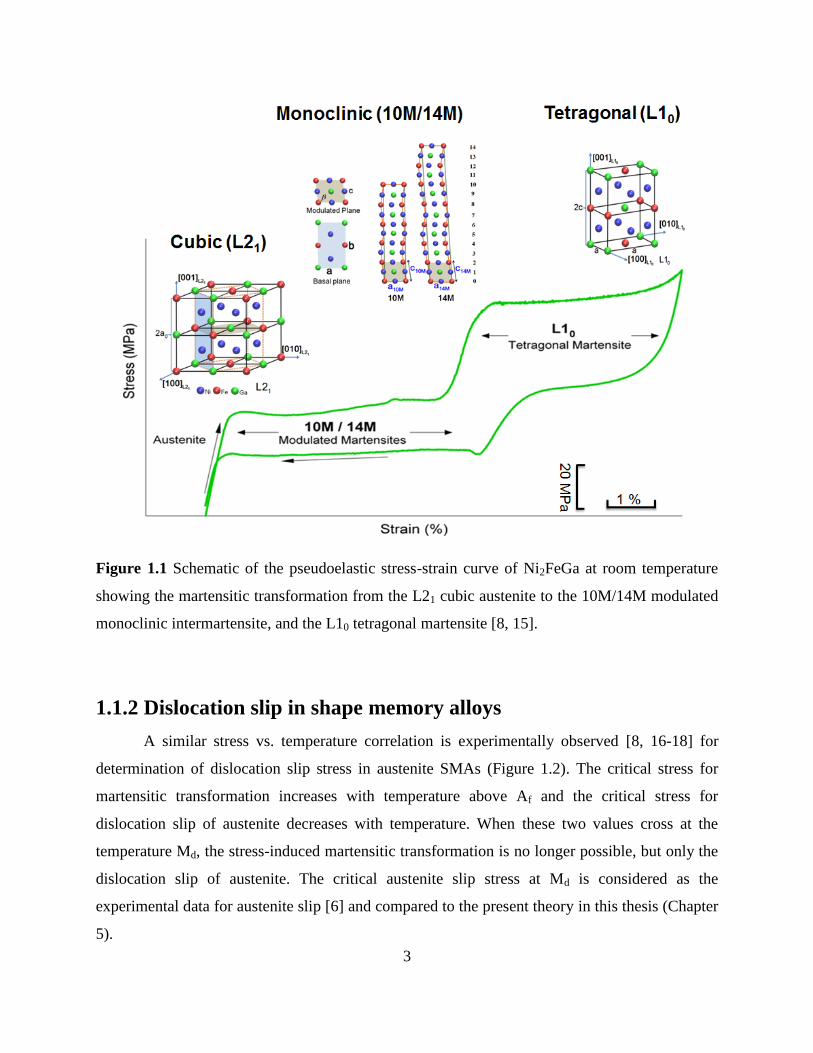
Figure 1.1 Schematic of the pseudoelastic stress-strain curve of Ni2FeGa at room temperature
showing the martensitic transformation from the L21 cubic austenite to the 10M/14M modulated
monoclinic intermartensite, and the L10 tetragonal martensite [8, 15]. .......................................... 3
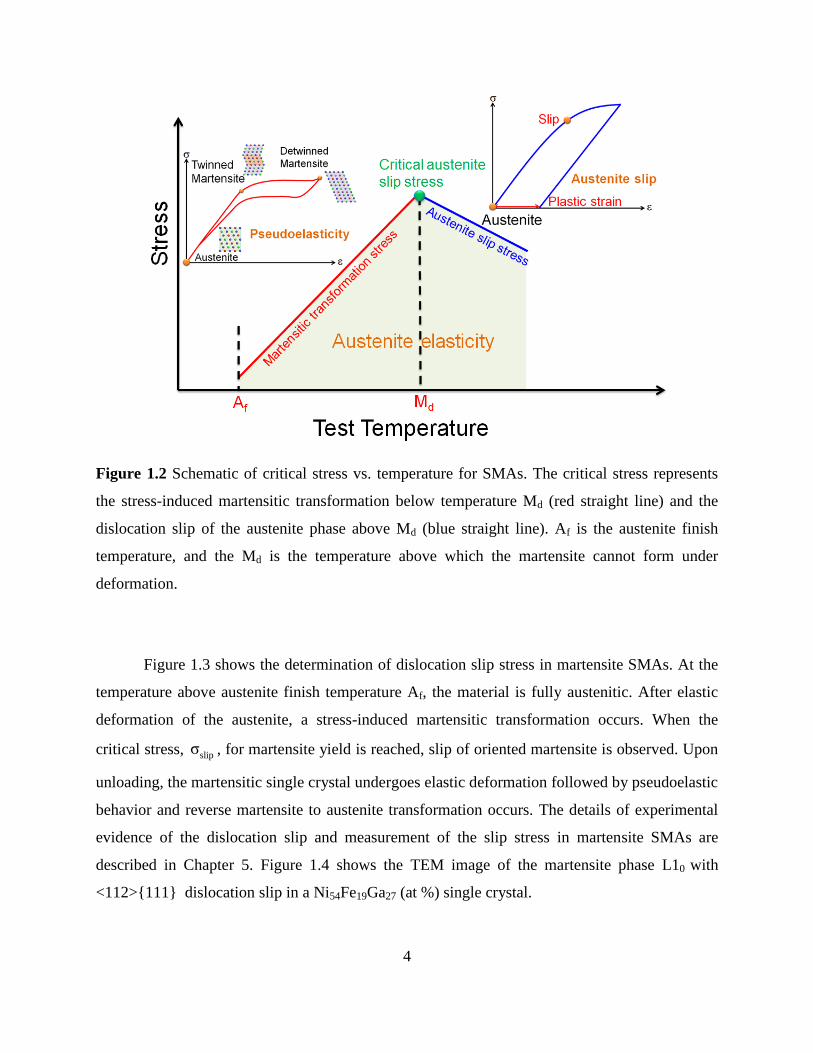
Figure 1.2 Schematic of critical stress vs. temperature for SMAs. The critical stress represents
the stress-induced martensitic transformation below temperature Md (red straight line) and the
dislocation slip of the austenite phase above Md (blue straight line). Af is the austenite finish
temperature, and the Md is the temperature above which the martensite cannot form under
deformation. .................................................................................................................................... 4
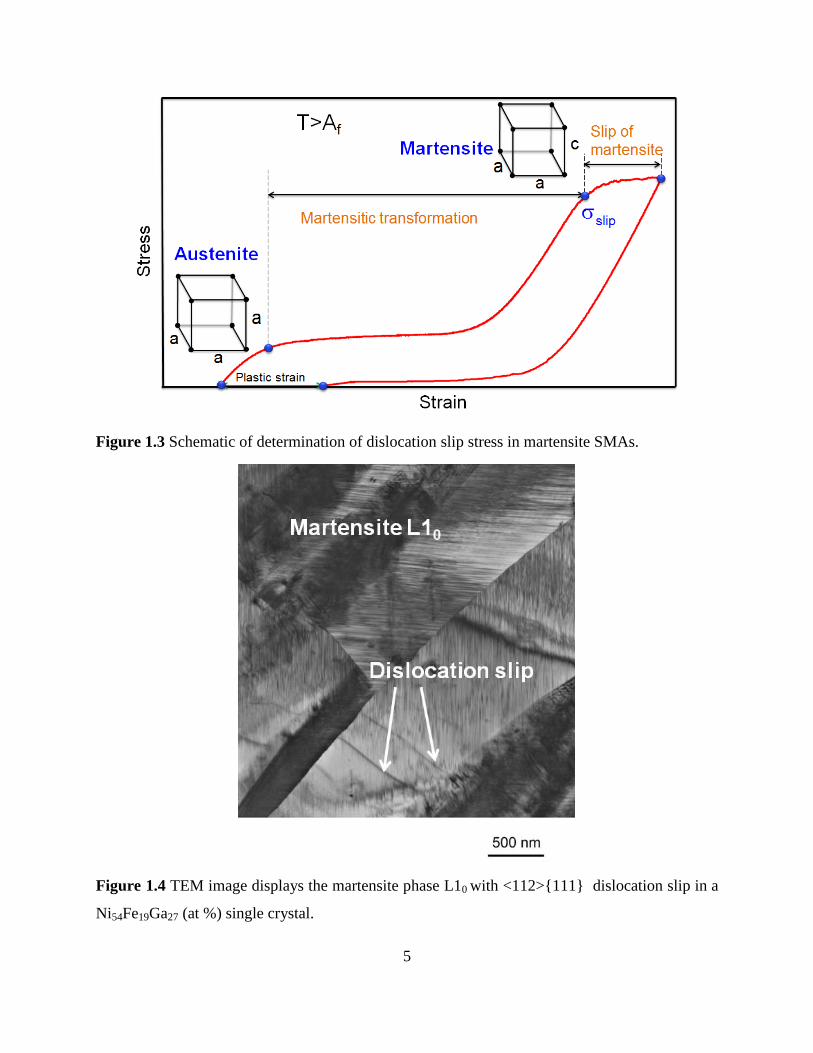
Figure 1.3 Schematic of determination of dislocation slip stress in martensite SMAs. ................ 5
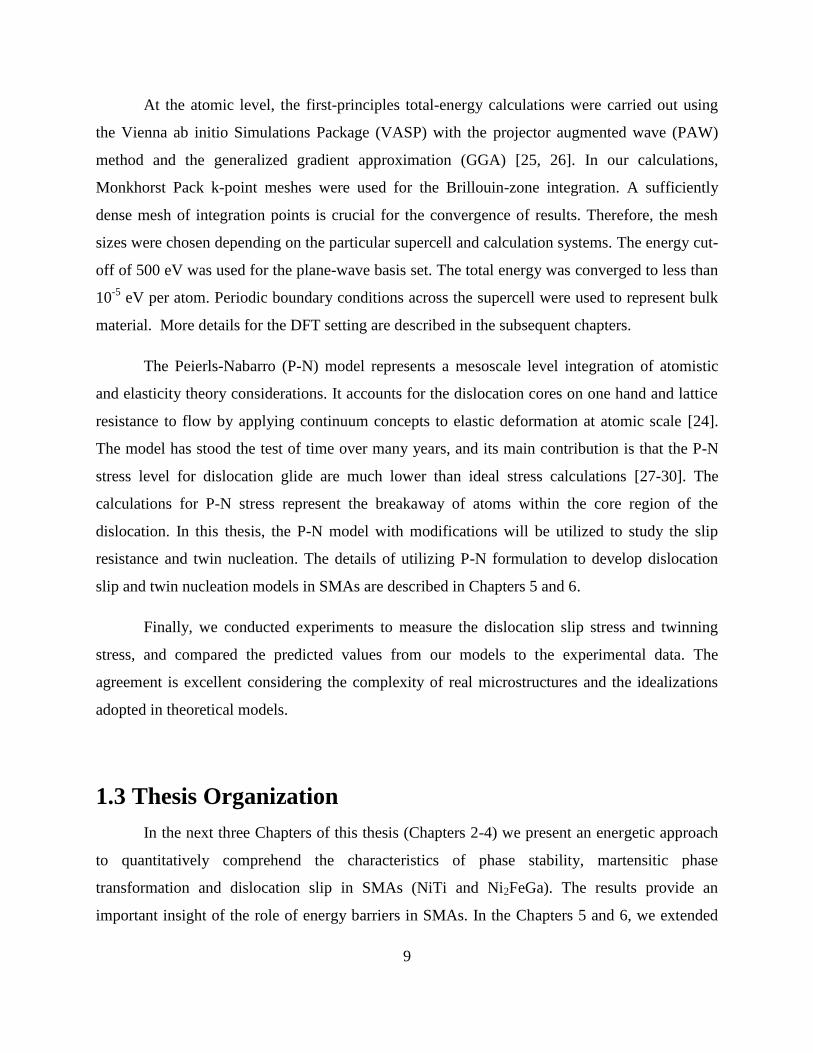
Figure 1.4 TEM image displays the martensite phase L10 with <112>{111} dislocation slip in a
Ni54Fe19Ga27 (at %) single crystal. .................................................................................................. 5
Figure 1.5 Schematic of shape memory effect in SMAs. .............................................................. 6
Figure 1.6 (a) Schematic and (b) Experimental evidence of <112>{111} twinning in L10
martensite Ni2FeGa. ........................................................................................................................ 7
Figure 1.7 Schematic of the multi-scale methodology for modeling of deformation in SMAs. ... 8
Figure 2.1 Crystal structrures of NiTi. (a) Crystal structure of B19' (b) Crystal structure of B33
(c) Crystal structure of B2............................................................................................................. 13
Figure 2.2 Total energies variation with the transformation displacement from the B2 to the B33
of NiTi. The 1B19' is composed of two monoclinic lattices with 8 atoms (a double-monoclinic-
hybrid structure, see Figure 2.3 for details). The B33 can be represented in a 4-atom monoclinic
unit cell with an angle 107.38o or in an 8-atom base center orthorhombic unit cell (red dash line)
related to two equivalent monoclinic unit cells. The blue and grey spheres correspond to Ni and
Ti atoms respectively. The large spheres represent atoms in the plane, and small spheres are
located out of plane (one layer below or above) of the unit cells. ................................................ 17
Figure 2.3 Schematic of the bilayer shear transformation from B2 to 1B19' . (a) The initial B2
structure with lattice parameters0 ,a 0b and
0 .c The green and red color planes are the {011}

xi
basal planes, which form the sheared bilayers. The red arrows show the alternating shear
direction with normalized magnitude 0
u
2ain the {011} basal planes. (b) The 1B19' structure is
formed after relative shear displacement of 0.210
u
a. It is a double-monoclinic-hybrid structure
with different monoclinic angles, (1) o90.9 and (2) oγ = 96.69 , and different largest lattice
parameters, b(1)
= 4.58 Å and b(2)
= 4.67 Å. .................................................................................. 18
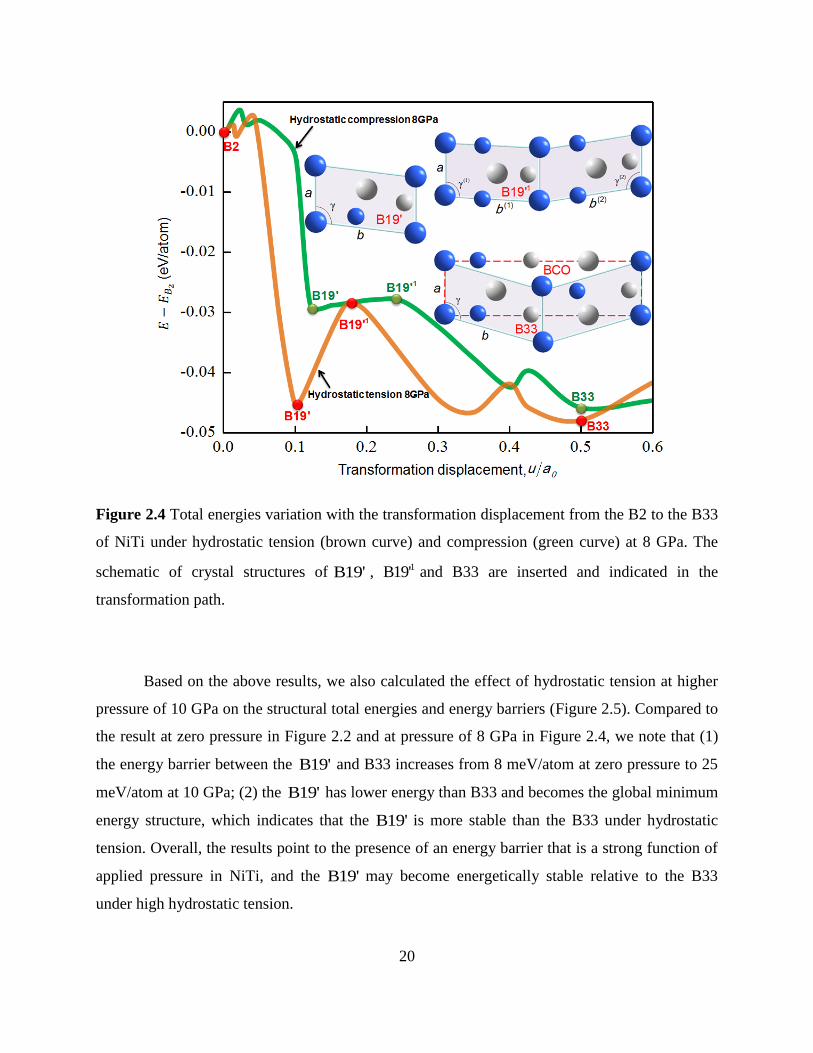
Figure 2.4 Total energies variation with the transformation displacement from the B2 to the B33
of NiTi under hydrostatic tension (brown curve) and compression (green curve) at 8 GPa. The
schematic of crystal structures of B19' , 1B19' and B33 are inserted and indicated in the
transformation path. ...................................................................................................................... 20
Figure 2.5 Effects of hydrostatic tension at 10 GPa on total energies in the phase transformation
of NiTi. The energy barrier between the B19' and B33 is much higher as 25 meV/atom. The
B19' is the global minimum energy structure and the B33 becomes a transition state in the
transformation path. ...................................................................................................................... 21
Figure 3.1 Schematic of stress-strain curve displaying the modulated martensite and dislocation
slip in austenite over the plateau region during pseudoelasticity. ................................................ 26
Figure 3.2 (a) Schematic of transformation path showing the energy in the initial state, the final
state and the transition state, (b) atomic arrangements of Ni2FeGa with long range order (first
configuration). The viewing direction is [110]. The (001) planes are made of all Ni atoms, and
alternating Fe and Ga atoms. The dashed line represents the slip plane. The displacement
<111>/4 creates nearest neighbor APBs (middle configuration) and the displacement <111>/2
results in next nearest neighbor APBs (third configuration). (c) generalized fault energy of
austenite associated with full dislocation dissociation into partials in an ordered alloy. ............. 27
Figure 3.3 (a) Schematic of the L21 austenitic structure of Ni2FeGa, (b) the sublattice displaying
the modulated and basal planes, (c) the 10M monoclinic modulated structure of Ni-Fe-Ga. ...... 31
Figure 3.4 (a) The energy landscape associated with the L21 to 10M transformation. The
transformation is comprised of a distortion and shuffle and the path is rather complex. (b) 3D
view of the transformation surface showing that the energy of 10NM (non-modulated martensite)
structure is higher than 10M (modulated). See Figure 3.3b for the lattices. ................................. 34
xii
Figure 3.5 (a) The austenite (L21) lattice showing the slip plane and slip direction, (b) The {112}
projection illustrating the atom positions on the {110} plane and <111> direction, note the
stacking sequence in the [111] direction, (c) Upon shearing in the <111> direction the
dissociation of the superlattice dislocation ao[111] to four partials, and the associated NNAPB
and NNNAPB energies are noted. ................................................................................................ 35
Figure 3.6 (a) Atomic displacements for Ni2FeGa along the [111] direction. The atoms across
the slip plane with a basic displacement of 1/4[111] are no longer in the correct position, (b)
Upon a displacement of 1/2[111] atoms AA, CC, EE across the slip plane (APB) are partially
ordered. ......................................................................................................................................... 37
Figure 3.7 (a) Atomic configuration for the (011) <100> slip (b) the GSFE curve for the (011)
<100> case. ................................................................................................................................... 39
Figure 3.8 (a) Pseudoelasticity experiments (at room temperature) [45] (b) TEM results
displaying APBs in the austenite domains. ................................................................................... 41
Figure 4.1 Shape memory and pseudoelasticity experiments on solutionized 50.1%Ni-Ti, (a) The
development of macroscopic plastic (residual) strain upon temperature cycling (100 °C to -
100 °C) under constant stress [60] (b) The plastic (residual) strain under pseudoelasticity at
constant temperature (T = 28°C). ................................................................................................. 47
Figure 4.2 Glide planes and directions of different possible slip systems in austenitic NiTi. The
shaded ‘violet’ area points to the glide plane and the ‘orange’ arrow shows the glide direction in
(a) (011)[100] (b) (011)[1 11] (c) (011)[011] (d) (211)[111] (e) (001)[010] systems
respectively. .................................................................................................................................. 48
Figure 4.3 (a) Transmission electron micrographs of dislocations in the specimen deformed at
room temperature imaged with different g-vectors. The white arrow labeled with white letter ‘A’
points to dislocations of the <100> type and (b) shows dislocations of the < 111 > type (labeled
with white letter ‘B’). .................................................................................................................... 51
Figure 4.4 (a) and (b) TEM images of a solutionized Ti-50.4at%Ni [123] single crystal taken at
room temperature. Thermal-mechanically tested under constant uniaxial tensile load while the
temperature was cycled from RT-100C100CRT. The load was increased in 25 MPa
increments from 0 MPa to 100 MPa in successive tests (c) TEM image from single crystal of

xiii
[111] 50.1%Ni orientation thermally cycled under constant load (1 cycle at each +10 MPa
increment from +100 MPa to +170 MPa) showing dislocations within austenite, (d) TEM image
from thermal cycling of 50.4%Ni NiTi in [123] orientation 1 cycle at each +25 MPa increments
from +0 MPa to +100 MPa with RT-100C100CRT, (e) TEM image from thermal
cycling of solutionized 50.4%Ni NiTi [001] orientation with the following history 1 Cycle at
+125 MPa, +140 MPa, +170 MPa, +185 MPa, + 215 MPa, + 230 MPa, +245 MPa, +260 MPa; 2
Cycles at +200 MPa; 3 Cycles at +155 MPa (f) dislocation slip at room temperature of a
solutionized Ti-50.8at%Ni [001] single crystal. Prior to TEM, the specimen was strained to 10%
at room temperature (25C). ....................................................................................................... 52
Figure 4.5 (a) Differential scanning calorimetry results for solutionized 50.1%Ni-Ti and
50.4%Ni-Ti, the dotted curve is for cooling, the hysteresis levels are also marked on the figures
[74] (b) Strain-temperature curves under temperature cycling showing the buildup of plastic
strain with increase in stress (adapted from [60]). ........................................................................ 53
Figure 4.6 (a) Crystal structure of B2 NiTi observed from the [100] direction (b) after a rigid
displacement of a/2 ( / [100] 0.5xu a ), the near neighbor distance of two in-plane Ni or Ti atoms
becomes shortest (shown by red parenthesis) (c) after displacements of a/4 ( / [100] 0.25xu a )
and 3a/4 ( / [100] 0.75xu a ), the position of atoms of the first shear layer (shown by green box)
with respect to the undeformed lower half is different (d) GSFE curve for (011)[100] system... 56
Figure 4.7 (a) Crystal structure of B2 NiTi observed from the [211] direction. Stacking
sequence in the [011] direction is shown as ABAB. (b) after a rigid displacement of
3 / 3 ( / [111] 0.33) xa u a , near neighbor distance of two out of plane Ni or Ti atoms
becomes shortest (shown by green parenthesis). (c) after a displacement of
3 / 2 ( / [11 1] 0.5) xa u a , near neighbor distance of out of plane Ni (Ti) and Ti (Ni) atoms
becomes shortest (shown by red parenthesis), and the anti-phase boundary induced by slip alters
the stacking of Ni and Ti atoms). (d) GSFE curve for the (011)[1 11]system.............................. 58
Figure 4. 8 (a) Crystal structure of B2 NiTi observed from the [100] direction (b) after a rigid
displacement of 2 / 2 ( / | [011] |= 0.5)xa u a , the near neighbor distance of two in-plane Ni or
Ti atoms becomes shortest (shown by red parenthesis) (c) GSFE curve for system (011)[011] . 59

xiv
Figure 4.9 (a) Crystal structure of B2 NiTi observed from the [011] direction. The stacking
sequence is ABCDEFA, where the cell repeats every 6 planes in the [211] direction, the dashed
line denotes the slip plane (b) after a rigid displacement of 3 / 3 ( / [11 1] 0.33) xa u a , near
neighbor distance of two in-plane Ni or Ti atoms is shortest (shown by red parenthesis) (c) after
a rigid displacement of 2 3 / 3 ( / [11 1] 0.67) xa u a , near neighbor distance of in-plane Ni and
out of plane Ti atoms is largest (shown by red parenthesis). (d) GSFE curve for the (211)[111]
system. .......................................................................................................................................... 61
Figure 4.10 (a) Crystal structure of B2 NiTi observed from the [100]direction (b) after a rigid
displacement of a/2 ( / |[010]| 0.5xu a ), near neighbor distance of in-plane Ni and out-of-plane
Ti atoms becomes shortest (shown by red parenthesis) (c) GSFE curve for the (001)[010] system.
....................................................................................................................................................... 62
Figure 4.11 Decomposition of [111] slip (1b ) along [011] (
3b ) and [100] (2b ) directions. The
slip plane shown is (011). Ni atoms are denoted by the dark shading in this schematic. ............. 64
Figure 5.1 Schematic illustration of the stress-strain curve showing the martensitic
transformation from L21 to L10, and the dislocation slip in L10 of Ni2FeGa at elevated
temperature. After unloading, plastic (residual) strain is observed in the material as deformation
cannot be fully recovered. ............................................................................................................. 71
Figure 5.2 Schematic description of the different length scales associated with plasticity in
Ni2FeGa alloys. ............................................................................................................................. 73
Figure 5.3 L10 unit cell of Ni2FeGa. (a) The body centered tetragonal (bct) structure of L10 is
constructed from eight bct unit cells and has lattice parameters 2a , 2a and 2c. The blue, red
and green atoms correspond to Ni, Fe and Ga atoms, respectively. The Fe and Ga atoms are
located at corners and Ni atoms are at the center. The fct structure shown in brown dashed lines
is constructed from the principal axes of L10. (b) The fct structure of L10 with lattice parameters
a, a and 2c contains two fct unit cells. .......................................................................................... 77
Figure 5.4 (a) Crystal structural energy variation with tetragonal ratio c/a for a series of unit cell
volume changes 0ΔV / V , where L21 is considered as the reference volume V0. The L10
xv
tetragonal structure was found at a c/a of 0.95 for 0ΔV / V of -0.76%. (b) High resolution plot
corresponding to the red dashed lines in (a). ................................................................................ 78
Figure 5.5 Possible dislocations and atomic configurations of L10 Ni2FeGa in the (111) plane.
Different sizes of atoms represent three successive (111) layers from the top view. Dislocations
[1 10] ,1
[11 2]2
,[1 01] and 1
< 2 1 1 >6
are shown in different colors corresponding to Eqs. (1)-(3).
Three types of planar defects, SISF, CSF and APB are marked on certain positions. ................. 80
Figure 5. 6 GSFE curve of the superdislocation 1
[11 2]2
dissociated into three 1
[11 2]6
partial
dislocations on the (111) plane of L10 Ni2FeGa. We note that in order to move atoms at position
A to the positon C along [11 2] direction, a high stress is required due to the high energy barrier
formed when atoms at A slide over atoms at B in the same plane. .............................................. 82
Figure 5. 7 Schematic of construction of slip movements that result in SISF, CSF and APB in
(111) plane. ................................................................................................................................... 83
Figure 5. 8 Slip plane and dislocations of possible slip systems in L10 Ni2FeGa. (a) The shaded
violet area represents the slip plane (111) and (b) four dislocations1
[1 01]2
,1
[1 10]2
, 1
[2 11]6
and
1[11 2]
6are shown in the (111) plane. ........................................................................................... 84
Figure 5. 9 Dislocation slip in the (111) plane with dislocation
1[11 2]
6 of L10 Ni2FeGa. (a) The
perfect L10 lattice observed from the [1 1 0]direction. The slip plane (111) is marked with a
brown dashed line. (b) The lattice after a rigid shear with dislocation 1
[11 2]6
, u, shown in a red
arrow. ............................................................................................................................................ 85
Figure 5. 10 GSFE curves (initial portion for one Burgers vector only) of 1
[1 0 1]2
, 1
[1 1 0]2
,
1[2 1 1]
6 and
1[11 2]
6dislocations in the (111) plane of L10 Ni2FeGa. The calculated shear
displacement, u, was normalized by the respective Burgers vector, b. ......................................... 86

xvi
Figure 5. 11 (a) Generalized stacking fault energy surface ( surface) for the (111) plane in L10
Ni2FeGa. (b) A two-dimensional projection of the surface in the (111) plane. The x axis is
taken along the [11 2] direction, and y axis along [1 1 0]. ............................................................ 87
Figure 5. 12 Schematic illustration of Peierls-Nabarro model for dislocation slip. (a) A simple
cubic crystal containing a dislocation with Burgers vector b. h is the interspacing between
adjacent two slip planes. The relative displacement of the two half crystals in the slip plane along
x direction, xA- xB, is defined as the disregistry function f(x) . (b) Schematic illustration showing
the periodic misfit energy s
γE (u) as a function of the position of the dislocation line, u. The
Peierls stress pτ is defined as the maximum slope of
s
γE (u) with respect to u. (c) Schematic
showing the γ f(x) energy (GSFE curve) as a single sinusoidal function of f(x)
b. (d) Schematic
showing the normalized f(x)
bvariation with
x
ζ. ........................................................................... 90
Figure 5. 13 Upon shearing the superdislocation [1 10] , the dissociation into four partials and the
associated CSF and APB energies are determined. The unstable stacking fault energies
us1 us2γ = γ = 360 mJ/m2 (energy barriers); the stable stacking fault energies s1γ = 273 mJ/m
2 (CSF)
and s2γ = 179 mJ/m2 (APB). ......................................................................................................... 92
Figure 5. 14 Separations of partial dislocations for the superdislocation [1 10] . ......................... 93
Figure 5. 15 The disregistry function f(x) for the superdislocation [1 10]dissociated into four
partials1
< 2 11]6
. The separation distances of the partial dislocations are indicated by d1 and d2.
....................................................................................................................................................... 94
Figure 5. 16 Misfit energy s
γE (u) for the superdislocation [1 10]dissociated into four partials
1< 2 11]
6. ...................................................................................................................................... 95
Figure 5. 17 The tensile strain-temperature response at 40 MPa describing the inter-martensitic
transformation L21 10M 14M. Red arrows along the curve indicate directions of cooling
and heating. A SAD pattern is insetted showing the culmination in formation of the 14M
structure......................................................................................................................................... 98

xvii
Figure 5. 18 The tensile strain-temperature response at 80 MPa indicating the martensitic
transformation from the austenite L21 to the non-modulated martensite L10. A SAD pattern in the
inset shows resulting L10 structure. The sample is removed from the load frame at ‘T’ and
studied with TEM under in-situ temperature cycling. .................................................................. 99
Figure 5. 19 Upon cooling to -6°C, the TEM image displays the martensite phase L10 with
<112>{111} dislocation slip in a Ni54Fe19Ga27 (at %) single crystal. ....................................... 100
Figure 5. 20 Compressive stress-strain response of Ni54Fe19Ga27 at a constant temperature of
150 °C. ........................................................................................................................................ 101
Figure 6.1 Schematic of stress-strain curve showing the detwinning of internally twinned
martensite (multiple variant) to detwinned martensite (single crystal) of Ni2FeGa at low
temperature. Upon unloading, plastic strain is observed in the material, which can be fully
recovered upon heating. .............................................................................................................. 109
Figure 6.2 Schematic description of the multi-scale methodology for modeling of deformation
twinning in Ni2FeGa alloys. ........................................................................................................ 111
Figure 6.3 L10 structure and twinning system of Ni2FeGa. The L10 fct structure with lattice
parameters a, a and 2c contains two fct unit cells. The twining plane (111) is shown in shaded
violet and direction [11 2] in red arrow. The blue, red and green atoms correspond to Ni, Fe and
Ga atoms, respectively. ............................................................................................................... 113
Figure 6.4 Schematic of top view from the direction perpendicular to the (111) twinning plane in
L10 Ni2FeGa. Different sizes of atoms represent three successive (111) layers. Twinning partial
1[11 2]
6 is shown in red arrow. ................................................................................................... 114
Figure 6.5 Deformation twinning in (111) plane with partial dislocation 1
[11 2]6
(Burgers vector
b=1.45 Å) of L10 Ni2FeGa. (a) The perfect L10 lattice viewed from the [1 10]direction. Twining
plane (111) is marked with a brown dashed line. (b) The lattice with a three-layer twin after
shearing along 1
[11 2]6
dislocation, u, shown in red arrow. ....................................................... 115

xviii
Figure 6.6 GPFE in (111) plane with 1
[11 2]6
twinning dislocation of L10 Ni2FeGa. The
calculated fault energies are shown in Table 6.1......................................................................... 116
Figure 6.7 Crystal structures of modulated monoclinic 14M(internally twinned) and detwinned
14M of Ni2FeGa. Like modulated monoclinic 10M structure, the 14M can be consructed from
L21 cubic structure by combination of shear (distortion) and atomic shuffle [15]. (a) Schematic
of the L21 cubic structure of Ni2FeGa, (b) the sublattice of L21 (face centered tetragonal structure)
displaying the modulated plane (110)L21 (violet color) and basal plane (001) L21 (brown color), (c)
the modulated monoclinic 14M(internally twinned) structure with twin plane (110)L21 and twin
direction 1L2[1 1 0] . Note the twin system (110)[1 1 0] in the austenite L21 coordinates corresponds
to (010)[100] in the intermartensite 14M coordinates, (d) the detwinned 14M structure. ......... 118
Figure 6.8 GPFE in (010) plane with 1
[100]7
twinning dislocation of 14M Ni2FeGa. The
calculated fault energies are shown in Table 6.1......................................................................... 119
Figure 6.9 Configuration of Peierls-Nabarro model for dislocation slip. (a) b is the lattice
spacing along the slip plane and d is the lattice spacing between adjacent planes. (b) The
enlarged configuration of the green box in (a). The grey and blue spheres represent the atom
positions before and after the extra half-plane is created. uA(x) and uB(x) are the atom
displacements above slip plane (on plane A) and below slip plane (on plane B), and their
difference uA(x)-uB(x) describes the disregistry distribution f(x) as a function of x. ................. 120
Figure 6.10 Schematic illustration showing the semi-lenticular twin morphology of L10
Ni2FeGa, which is viewed in the [1 1 0] direction. The twinning plane is (111) and twinning
direction is [11 2] . h is the twin thickness and N is the number of twin-layers (N=3 for twin
nucleation). d is the spacing between two adjacent twinning dislocations and considered as a
constant for three-layer twin. ...................................................................................................... 123
Figure 6.11 The disregistry function for a three-layer twin nucleation (N=3). ......................... 125
Figure 6.12 The predicted and experimental twinning stress for SMAs versus unstable twin
nucleation energy utγ , from Table 6.3. The predicted twinning stress (red square) is in excellent
agreement with the experimental data (blue circle). The P-N formulation based twin nucleation

xix
model reveals an overall monotonic trend between critτ and utγ . Note that NiTi1, NiTi
2 and
NiTi3 indicate three different twinning systems in NiTi as shown in Table 6.3. ........................ 131
Figure 6.13 The critical martensite twinning stress from deformation experiments conducted in
Sehitoglu’s group. The materials are in the fully martensitic phase of Ni2MnGa 10M, Ni2FeGa
14M and L10, and NiTi B19'. NiTi1, NiTi
2 and NiTi
3 indicate three different twinning systems in
NiTi as shown in Table 6.3. Note that the critical stress is nearly temperature independent. .... 132
Figure 6.14 Compressive stress-strain response of Ni54Fe19Ga27 at a constant temperature of -
190 °C. ........................................................................................................................................ 133
xx
List of Tables
Table 2.1 VASP-PAW-GGA calculated lattice parameters (Å), monoclinic angle (degree),
volume (Å3 per formula unit), total energies (meV per atom) relative to B2 austenite phase
considered as reference state and energy barriers (meV per atom) in the phase transformation of
NiTi for two cases: zero pressure, hydrostatic tension at 10 GPa. ............................................... 15
Table 2.2 Total energy difference between the B19' and B33 under hydrostatic stress. ............ 21
Table 3.1 The L21 structure lattice constants for austenitic Ni-Fe-Ga (ao) and the lattice constants
of the modulated monoclinic (10M) structure. ............................................................................. 30
Table 3.2 Calculated fault energies, Burgers vector, (ideal) critical stress for slip nucleation and
Fisher stress for movement of APBs. ........................................................................................... 42
Table 4.1 Maximum fault energy, shear modulus and elastic energy in different possible slip
systems in B2 NiTi. The fault energy (computational) tolerance is less than 0.17 mJ/m2. .......... 65
Table 4.2 Slip elements in B2 NiTi. The calculated (ideal) critical stress for slip is given in the
last column. The critical stress tolerance is less than 2.25 MPa. .................................................. 66
Table 5.1 VASP-PAW-GGA calculated L10 tetragonal lattice parameters, unit cell volume
change 0ΔV / V and structural energy relative to L21 cubic in Ni2FeGa compared with
experimental data. ......................................................................................................................... 79
Table 5.2 Calculated shear modulus, theoretical shear strength and Peierls stress for dislocation
slip of L10 Ni2FeGa. ...................................................................................................................... 96
Table 5.3 Comparison of experimental and predicted slip stress levels for L10 N2FeGa. ......... 101
Table 5.4 Predicted Peierls stresses for shape memory alloys are compared to known reported
experimental values. The slip systems and crystal structures of SMAs are given. (L21 and B2 are
the crystal structures in austenite phase). .................................................................................... 103

xxi
Table 6.1 Calculated fault energies (in mJ/m2) for twin system
1[11 2](111)
6of L10 Ni2FeGa and
1[100](010)
7 14M Ni2FeGa. ....................................................................................................... 117
Table 6.2 The predicted critical twin nucleation stress, critτ , is compared with ideal twinning
stress, TMidealτ , Peierls stress, pτ , and available experimental data in L10 Ni2FeGa. .................... 128
Table 6.3 Predicted critical twin nucleation stresses theory
critτ for Shape Memory Alloys are
compared to known reported experimental valuesexpt
critτ . The twin systems, equilibrium spacing d
and unstable twin nucleation energy utγ corresponding to SMAs are given. (10M, 14M, L10 and
B19' are the martensitic crystal structures explained in the text). .............................................. 130
Table 6.4 Results comparison of LDA and GGA in L10 Ni2FeGa. ........................................... 135

1
Chapter 1 Introduction
1.1 Background
Compared to regular metals, shape memory alloys (SMAs) exhibit large deformations
and remember their original shape upon unloading; thus SMAs are similar to rubber but have
alloy properties [1]. Given this, SMAs have invaluable applications in numerous industries,
ranging from actuators and sensors, vibration control systems, medical devices, and aerospace
systems [2]. However, because the fundamental behavior of SMAs is not fully understood and
the engineering aspects of these materials are accordingly in flux, the application of SMAs is
therefore limited in industries and academia. Designing new SMAs that exhibit superior
transformation characteristics remains a growing challenge due to: (1) phase change involving
complex transformation paths, such that the energy barrier levels corresponding to the transition
are not well established; and (2) dislocation slip and twinning, the important plastic deformation
mechanisms, limit the transformation strains in SMAs.
In this thesis, we present an energetic methodology to comprehend a better understanding
of phase transformation, energy landscape associated with dislocation slip and twinning in SMAs.
Based on the accurate prediction of energies, we extended the Peierls-Nabarro (P-N) formulation
with atomistic simulations to determine the slip stress, and developed a twin nucleation model
based on P-N formulation to predict twin nucleation stress in SMAs. These new models provide
a precise, rapid and inexpensive approach to predict the slip and twin stress in SMAs, which can
be used to better understand and design new SMAs.
1.1.1 Phase transformation in SMAs-the Ni2FeGa example
SMAs have two phases with different cyrstal structures and therefore different properties
[3, 4]. One is the high temperature phase called austenite and the other is the low temperature
phase called martensite. Austenite has a crystal structure with a high symmetry (generally cubic);

2
while martensite has a crystal structure with a low symmetry (tetragonal, orthorhombic,
monoclinic and modulated monoclinic). Generally, the transformation from austenite to
martensite and vice versa occurs by shear lattice distortion, not by diffusion of atoms [2, 5].
There are two approaches to induce the phase transformation from austenite (parent phase) to
martensite (product phase) and vice versa. The first one is the stress-induced phase
transformation, which leads to strain generation during loading and subsequent strain recovery
upon unloading at temperatures above Af (Af is the austenite finish temperature, so the
transformation starts from the stable austenite). This SMAs behaviour is called pseudoelasticity
and will be described in details later using Ni2FeGa as an example. The second approach to
induce the phase transformation is called thermally induced phase transformation [2]. When the
material at austenite is cooled below the Mf (Mf is the martensite finish temperature) in the
absence of an applied load, the crystal structure changes from austenite to martensite, which is
termed the forward transformation. When the material at martensite is heated above the Af, the
crystal structure changes from martensite to austenite, which is termed the reverse transformation
[2, 3, 6]. In this thesis, we focus on the stress-induced transformation and study the deformation
associated with the dislocation slip and twin.
The Ni2FeGa alloys are new class of SMAs and have received recent attention because of
high transformation strains and potential for magnetic actuation [7]. These alloys are proposed to
be a good alternative to the currently studied ferromagnetic SMAs, Ni2MnGa, due to their
superior ductility in tension and transformation strains exceeding 10% [8, 9]. According to the
experiments reported by researchers [8, 10, 11], there are several crystal structures identified in
Ni2FeGa, which exhibits the martensitic transformation from the austenite L21 (cubic) to
intermartensite 10M/14M (modulated monoclinic), and martensite L10 (tetragonal) phases [9, 12-
14]. Figure 1.1 [8, 14, 15] shows a schematic of the stress-strain curve of Ni2FeGa at room
temperature. The initial phase of Ni2FeGa is the austenite L21 and it transforms to intermartensite
10M/14M as the loading reaches a critial transformation stress approximately 40 MPa. With
further deformation, the martensite L10 is obtained at nearly 80 MPa and the second plateau
takes place. During unloading, the reverse phase transformation occurs and the pseudoelasticity
is observed as the total recovery of deformation [8]. The details of phase transformation from
L21 to 10M and the associated energies are described in Chapter 3.
3
Figure 1.1 Schematic of the pseudoelastic stress-strain curve of Ni2FeGa at room temperature
showing the martensitic transformation from the L21 cubic austenite to the 10M/14M modulated
monoclinic intermartensite, and the L10 tetragonal martensite [8, 15].
1.1.2 Dislocation slip in shape memory alloys
A similar stress vs. temperature correlation is experimentally observed [8, 16-18] for
determination of dislocation slip stress in austenite SMAs (Figure 1.2). The critical stress for
martensitic transformation increases with temperature above Af and the critical stress for
dislocation slip of austenite decreases with temperature. When these two values cross at the
temperature Md, the stress-induced martensitic transformation is no longer possible, but only the
dislocation slip of austenite. The critical austenite slip stress at Md is considered as the
experimental data for austenite slip [6] and compared to the present theory in this thesis (Chapter
5).
4
Figure 1.2 Schematic of critical stress vs. temperature for SMAs. The critical stress represents
the stress-induced martensitic transformation below temperature Md (red straight line) and the
dislocation slip of the austenite phase above Md (blue straight line). Af is the austenite finish
temperature, and the Md is the temperature above which the martensite cannot form under
deformation.
Figure 1.3 shows the determination of dislocation slip stress in martensite SMAs. At the
temperature above austenite finish temperature Af, the material is fully austenitic. After elastic
deformation of the austenite, a stress-induced martensitic transformation occurs. When the
critical stress, slipσ , for martensite yield is reached, slip of oriented martensite is observed. Upon
unloading, the martensitic single crystal undergoes elastic deformation followed by pseudoelastic
behavior and reverse martensite to austenite transformation occurs. The details of experimental
evidence of the dislocation slip and measurement of the slip stress in martensite SMAs are
described in Chapter 5. Figure 1.4 shows the TEM image of the martensite phase L10 with
<112>{111} dislocation slip in a Ni54Fe19Ga27 (at %) single crystal.
5
Figure 1.3 Schematic of determination of dislocation slip stress in martensite SMAs.
Figure 1.4 TEM image displays the martensite phase L10 with <112>{111} dislocation slip in a
Ni54Fe19Ga27 (at %) single crystal.

6
1.1.3 Twinning in shape memory alloys
Twinning in SMAs is of paramount importance, which exists in two main characteristics
of SMAs. In the first case, when the alloy in the austenitic state is cooled below the martensite
finish temperature with no external stress, the internally twinned martensite is formed. If the
twinned martensite is subsequently deformed, the twin variants that are oriented favorably to the
external stress grow in expense of others. The growth of the twin is a process of advancement of
twin interfaces and requires overcoming an energy barrier called the 'unstable twin fault energy'.
Upon further deformation, the internally twinned martensite detwins completely into a single
martensite crystal. After unloading, the twinning-induced deformation remains. If the material is
heated over the austenite finish temperature, then martensite to austenite transformation occurs
and the material reverts back to austenite. Hence, the heating and cooling changes can make the
material behave as an actuator, which is called 'shape memory effect'. A schematic of the shape
memory effect is shown in Figure 1.5. Figure 1.6 shows a schematic and experimental evidence
of <112>{111} twinning in L10 martensite Ni2FeGa.
Figure 1.5 Schematic of shape memory effect in SMAs.

7
Figure 1.6 (a) Schematic and (b) Experimental evidence of <112>{111} twinning in L10
martensite Ni2FeGa.
In the second case, when the SMAs undergo isothermally stress-induced transformation
from austenite to martensite (Figure 1.1), the martensite undergoes detwinning and this
contributes to the overall recoverable strain. Upon unloading, the martensite reverts back to
austenite, and this called 'pseudoleasticity'. The magnitude of the lattice strain is of the order of 5%
in NiTi while the shear associated with detwinning is also nearly 5% making the total near 10%
[19, 20]. In the case of Ni2FeGa, the magnitude of the strains are higher (near 12%) [8, 21, 22],
and the process of twinning plays a considerable role.
Therefore, the phenomenon of twinning or detwinning either during shape memory or
during pseudoelasticity relies on the atomic movements in the martensitic crystal. It influences
the recoverability, the transformation stress levels, hence both the shape memory
effect/pseudoelasticity response. For shape memory, the martensite is deformed first and then
heated to the austenitic phase for full recovery. Martensite undergoes twinning during
deformation at relatively low stress levels. If slip occurs during martensite deformation, this
would curtail full recoverability. On the other hand, during pseudoelasticity, austenite

8
transformation to martensite takes place upon loading. If slip resistance is low, then austenite and
martensite domains can deform plastically inhibiting full recoverability upon unloading. Despite
the significant important of twinning in SMAs, there has been no attempt to develop models to
predict their twinning mechanism. Thus, a fundamental understanding of twin nucleation is
essential to capture the mechanical response of SMAs.
1.2 Methodology
In this thesis, we considered different length scales associated with the plastic
deformation of SMAs (Figure 1.7). In the material science and meso-continuum mechanics field,
coupling the various length scales involved in order to understand the plastic deformation still
remains a major challenge [23]. At the dislocation core scale, quantum mechanics describe the
atomic level interactions and the forces exerted on atoms; while at the mesoscale level, elastic
strain fields of defects address the interactions [24]. The ensemble of dislocations and their
interactions with the microstructure define the continuum behavior. With atomistic simulations
one can gain a better understanding of the energy associated with deformation. Therefore,
atomistic simulations in this case will provide additional insight into material’s behavior and the
deformation mechanisms [20].
Figure 1.7 Schematic of the multi-scale methodology for modeling of deformation in SMAs.
9
At the atomic level, the first-principles total-energy calculations were carried out using
the Vienna ab initio Simulations Package (VASP) with the projector augmented wave (PAW)
method and the generalized gradient approximation (GGA) [25, 26]. In our calculations,
Monkhorst Pack k-point meshes were used for the Brillouin-zone integration. A sufficiently
dense mesh of integration points is crucial for the convergence of results. Therefore, the mesh
sizes were chosen depending on the particular supercell and calculation systems. The energy cut-
off of 500 eV was used for the plane-wave basis set. The total energy was converged to less than
10-5
eV per atom. Periodic boundary conditions across the supercell were used to represent bulk
material. More details for the DFT setting are described in the subsequent chapters.
The Peierls-Nabarro (P-N) model represents a mesoscale level integration of atomistic
and elasticity theory considerations. It accounts for the dislocation cores on one hand and lattice
resistance to flow by applying continuum concepts to elastic deformation at atomic scale [24].
The model has stood the test of time over many years, and its main contribution is that the P-N
stress level for dislocation glide are much lower than ideal stress calculations [27-30]. The
calculations for P-N stress represent the breakaway of atoms within the core region of the
dislocation. In this thesis, the P-N model with modifications will be utilized to study the slip
resistance and twin nucleation. The details of utilizing P-N formulation to develop dislocation
slip and twin nucleation models in SMAs are described in Chapters 5 and 6.
Finally, we conducted experiments to measure the dislocation slip stress and twinning
stress, and compared the predicted values from our models to the experimental data. The
agreement is excellent considering the complexity of real microstructures and the idealizations
adopted in theoretical models.
1.3 Thesis Organization
In the next three Chapters of this thesis (Chapters 2-4) we present an energetic approach
to quantitatively comprehend the characteristics of phase stability, martensitic phase
transformation and dislocation slip in SMAs (NiTi and Ni2FeGa). The results provide an
important insight of the role of energy barriers in SMAs. In the Chapters 5 and 6, we extended
10
Peierls-Nabarro formulation incorporated with atomistic simulations to determine Peierls stress
in SMAs; we proposed a twin nucleation model based on P-N formulation utilizing first principle
simulations to predict twin nucleation stress in SMAs. These theoretical results are in a good
agreement with experimental measurements. These models provide a rapid, inexpensive and
precise approach to predict stress associated with plastic deformation (slip and twinning) in
SMAs. In Chapter 7, we summarized the studies in the thesis and discussed the future work.
In Chapter 2, we make quantitative advances towards understanding of a quandary
associated with the martensitic phase stability of NiTi. Utilizing first principles calculations with
high resolution shear steps, we show unequivocally that a significant energy barrier exists
between the martensitic B19'and B33. We also present an analysis how hydrostatic pressure
alter this energy barrier and the phase stability of martensite NiTi. This study provides an
authoritative rationalization of why B19'(monoclinic lattice) has been experimentally observed
while B33 (base-centered orthorhombic lattice) has been proposed on theoretical grounds to have
a lower energy.
In Chapter 3, we address the mechanism of low martensitic transformation stress and
high reversible strains in Ni2FeGa utilizing first principle simulations and conducting
experiments. We establish the energy barriers associated with the transformation from austenite
L21 to modulated martensite 10M incorporating shear and shuffle and slip resistance in [111]
direction as well as in [001] direction. The results show that the unstable stacking fault energy
barriers for slip by far exceeded the transformation transition state barrier permitting
transformation to occur with little irreversibility. Experiments at the mesoscale on single crystals
and transmission electron microscopy provide further proof of the pseudoelastic behavior. This
provides design of new SMAs that possess low energy barriers for transformation coupled with
high barriers for dislocation slip.
In Chapter 4, we studied dislocation slip in B2 NiTi with atomistic simulations in
conjunction with transmission electron microscopy. We examine the generalized stacking fault
energy (GSFE) curves for five potential slip systems: {011}, {211} and {001} slip planes with
<100>, <111> and <011> slip directions. The results show the smallest and second smallest
energy barriers for the (011)[100] and the (011)[1 11] cases, respectively, which are consistent

11
with the experimental observations of dislocation slip reported in this study. Furthermore, we
calculated the ideal shear stress for these five slip systems and discussed the rationale for slip
resistance in austenite NiTi. This study represents a methodology for consideration of a better
understanding of SMAs.
In Chapter 5, we provide an extended Peierls-Nabarro formulation with a sinusoidal
series representation of GSFE to establish flow stress in several important SMAs. We predicted
the Peierls stress in L10 Ni2FeGa as an example to show the extended formulation. Utilizing
atomistic simulations, we determined the GSFE landscapes with stacking fault energies in L10
Ni2FeGa. The smallest energy barrier was determined as 168 mJ/m2 corresponding to a Peierls
stress of 1.1 GPa. We conducted experiments on single crystals of Ni2FeGa under compression
to determine the L10 slip stress (0.75 GPa), which was much closer to the P-N stress predictions
(1.1 GPa) compared to the theoretical slip stress levels (3.65 GPa). This extended P-N model
with GSFE curves provides an excellent basis for a theoretical study of the dislocation structure
and operative slip modes SMAs.
In Chapter 6, we present a twin nucleation model based on the Peierls-Nabarro (P-N)
formulation utilizing first-principles atomistic simulations. We investigate twinning in several
important SMAs starting with Ni2FeGa to illustrate the methodology, and predict their twin
stress in excellent agreement with experiments. We calculated and minimized the total energy
involved in the twin nucleation process, and led to determination of the twinning stress
accounting for twinning energy landscape (GPFE) in the presence of interacting multiple twin
dislocations and disregistry profiles at the dislocation core. This study provides a rapid,
inexpensive and precise methodology to predict twin nucleation stress in SMAs.
Conclusions and future work is summarized in Chapter 7.

12
Chapter 2 Resolving Quandaries Surrounding NiTi
[Part of the material in this chapter is published as J. Wang, H. Sehitoglu, Applied Physics
Letters, vol. 101, issue 8, 2012].
2.1 Abstract
We address a quandary associated with the phase stability of NiTi. The B19' (monoclinic
lattice) has been experimentally observed while B33 (base-centered orthorhombic lattice) has
been proposed on theoretical grounds to have a lower energy. With high-resolution shearing
steps, we show unequivocally that a significant energy barrier exists between the martensitic
B19' and B33 which is dependent on pressure. The transition state designated as 1B19' has an
energy level 25 meV/atom higher compared to B19'. We note that the formation of B33can be
suppressed because of the presence of the 1B19' high energy barrier which increases
considerably under tensile hydrostatic stress.
2.2 Introduction
Equiatomic NiTi has been the most widely studied shape memory alloy (SMA) owing to
its superior shape memory characteristics [31]. Experimental investigations have revealed that
the B19'structure (Figure 2.1a) is the martensitic phase in NiTi [32-34]. However, recent DFT
calculations [4, 35-38] suggested that the B19' structure is unstable compared to a higher-
symmetry base-centered orthorhombic (BCO) structure (also termed B33 with monoclinic angle
o107γ )(Figure 2.1b). Some of these investigations proposed barrierless transformation paths
between the B2 (Figure 2.1c) and B19' as well as from the B19' to B33 lattices [4, 36, 37]. But
the question remains, why is B19' experimentally observed? Two major explanations have been
proposed in the literature: (1) the B19' structure is stabilized by internal (or residual) stresses
which exist within the microstructure [4, 38], and the B33 structure may be formed in certain
conditions when the internal stresses are minimized [36]; (2) it has been proposed that the

13
presence of (nano) twins, often experimentally observed [39-42], can lower the B19' energy [43,
44]. In addition, we also note that the energy of the self-accommodated (internally twinned)
B19' structure is lower compared to its detwinned counterpart [31]. Another point is that the
B33 structure corresponds to a rather high (10.1%) elongation of the largest lattice parameter
(compared to 3% [36] for B19') hence there is a corresponding higher elastic strain energy.
(a) (b)
(c)
Figure 2.1 Crystal structrures of NiTi. (a) Crystal structure of B19' (b) Crystal structure of B33
(c) Crystal structure of B2.
In this study, we provide a more authoritative explanation of the occurrence of B19' that
has been overlooked: there are two energy barriers in the martensitic phase transformation path

14
from the B19' to B33, and the magnitude of the highest barrier is in the range of 8 to 25
meV/atom depending on the applied pressure.
We utilized DFT to investigate the phase stability and the corresponding energy barriers
over the entire path, which is accomplished by an atomic bilayer shear distortion in the {011}
basal plane along the <100> slip direction with structural optimization for all lattice parameters,
angles, and internal atomic coordinates [36, 37]. The first-principles total-energy calculations
were carried out using the Vienna ab initio Simulations Package (VASP) [25, 26] with the
projector augmented wave (PAW) method and the generalized gradient approximation (GGA).
PAW is an efficient all-electron method which achieves high accuracy when transition elements
such as Ti are considered. In our calculation, Monkhorst-Pack 9×9×9 k-point meshes were used
for the Brillouin-zone integration. Ionic relaxation was performed by a conjugate gradient
algorithm and stopped when absolute values of internal forces were smaller than 5×10⁻³
eV/Å.
The energy cut-off of 500 eV was used for the plane-wave basis set. The total energy was
converged to less than 10-5
eV per atom. The equilibrium structures for all phases were obtained
by minimizing total energies at zero temperature. Furthermore, to simulate the effect of internal
stresses, we calculated structural total energies and energy barriers under several hydrostatic
stresses in the range of -14 GPa to 14 GPa.
2.3 Results and Discussion
The computed lattice parameters, monoclinic angles, volumes, total energies relative to
the B2 phase (considered as the reference state) and energy barriers in the transformation are
summarized in Table 2.1 (for the 0 GPa and 10 GPa cases).

15
Table 2.1 VASP-PAW-GGA calculated lattice parameters (Å), monoclinic angle (degree), volume (Å3 per formula unit), total
energies (meV per atom) relative to B2 austenite phase considered as reference state and energy barriers (meV per atom) in the phase
transformation of NiTi for two cases: zero pressure, hydrostatic tension at 10 GPa.
Struct
ures
Zero pressure Hydrostatic tension 10 GPa
a b c V 2BE - E Energy barrier a b c 2BE - E Energy barrier
B2 3.004 4.25 4.25 90 27.1 0 1B2 B2 B2'
0.53
3.07 4.35 4.35 90 0 1B2 B2 B2'
1.76 B2' 2.91 4.32 4.31 90.5 27.11 -4.38 2.97 4.43 4.42 90.71 -0.64
1B2' 2.93 4.31 4.27 90.7 26.88 -2.48 1B2' B2' B19'
2
3.07 4.35 4.34 91.52 1.83 1B2' B2' B19'
2.47 B19' 2.91 4.64 4.06 97.3 27.18 -44.1 3.03 4.77 4.08 101.2 -49.6
1B19' 2.88
4.58
4.67
4.11
90.9
96.69
27.24 -36.14
1B19' B19' B19''
8
2.99
4.74
4.8
4.16
90.52
96.34
-24.5
1B19' B19' B19''
25 B19''
2.94 4.76 3.99 101.7 27.44 -51.37 3.04 4.87 4.07 102 -43.1
B33 2.93 4.91 4.00 107.38 27.51 -52.4
1B19'' B19'' B33
0.37 3.05 5.02 4.08 107.7 -39.3
B19'' B33
3.78

16
The present results (B2, B19' and B33 at zero pressure) are compared with previous
theoretical [36, 38, 45, 46] and experimental findings [32, 34, 47], and they are in excellent
agreement. However, we point to several metastable structures and transition states which have
not been discovered before. In this letter, the most important transition state is defined as 1B19'
(Figure 2.2). Our first principles calculations confirm that the B19' has higher energy relative to
the B33 at zero pressure, while at 10 GPa hydrostatic tension B19' has the lowest energy. We
discovered the energy barrier of 8 meV/atom (corresponding to 1B19' ) between the B19' and
B33 as the most significant in Fig. 2 (and Table 2.1) which is raised to 25 meV/atom at 10 GPa.
We note that all lattice parameters change abruptly after the shear displacement reaches
0.210
u
acorresponding to 1B19' (see Table 2.1). The decrease of the lattice parameters a (in-
plane Ni-Ni interatomic distance between two adjacent {100} layers) and b (in-plane Ni-Ni
interatomic distance between two adjacent {011} layers) significantly affects the arrangement of
atoms that get closer to each other, which causes excessive interatomic repulsive forces during
the shear transformation. As 0.210
u
ais approached, the interatomic distances in these layers
will increase as shear proceeds and the total energies will decrease until the B19'' is formed. The
metastable structure B19'' results in a very small energy barrier less than 0.4 meV/atom.

17
Figure 2.2 Total energies variation with the transformation displacement from the B2 to the B33
of NiTi. The 1B19' is composed of two monoclinic lattices with 8 atoms (a double-monoclinic-
hybrid structure, see Figure 2.3 for details). The B33 can be represented in a 4-atom monoclinic
unit cell with an angle 107.38o or in an 8-atom base center orthorhombic unit cell (red dash line)
related to two equivalent monoclinic unit cells. The blue and grey spheres correspond to Ni and
Ti atoms respectively. The large spheres represent atoms in the plane, and small spheres are
located out of plane (one layer below or above) of the unit cells.
A schematic of the bilayer shear transformation from the B2 to 1B19' in the {011} basal
plane along the <100> slip direction is given in Figure 2.3. We note that the 1B19' is composed
of two monoclinic lattices with different monoclinic angles, o(1) = 90.9 and o ,= 96.69(2)
and different largest lattice parameters, b(1)
= 4.58 Å and b(2)
= 4.67 Å, i.e., a double-monoclinic-
hybrid structure. As a non-equilibrium state in the transformation path from the B19' to B33,
this double-monoclinic-hybrid structure connected through a coherent interface is formed by

18
allowing full relaxation of the lattice parameters, monoclinic angles and atomic positions in the
DFT calculation. The full relaxation approach, during the imposed bilayer {011}<100> shear,
results in a shuffle of the atomic positions and lowers the structural energy during the phase
transformation [36, 37]. However, the 1B19' hybrid structure still constitutes an important
energetic barrier which makes the transition to B33 difficult.
(a)
(b)
Figure 2.3 Schematic of the bilayer shear transformation from B2 to 1B19' . (a) The initial B2
structure with lattice parameters0 ,a 0b and
0 .c The green and red color planes are the {011}

19
basal planes, which form the sheared bilayers. The red arrows show the alternating shear
direction with normalized magnitude 0
u
2ain the {011} basal planes. (b) The 1B19' structure is
formed after relative shear displacement of 0.210
u
a. It is a double-monoclinic-hybrid structure
with different monoclinic angles, (1) o90.9 and (2) oγ = 96.69 , and different largest lattice
parameters, b(1)
= 4.58 Å and b(2)
= 4.67 Å.
The 1B19' plays a key role in the phase transformation from the B19' to B33 as at this
transition state we found a significantly high energy barrier of around 8 meV/atom above the
B19' (this is the globally highest cubic-monoclinic energy barrier). Since the energy barriers
between the B2 and B2' (0.53 meV/atom) as well as the B2' and the B19' (2 meV/atom) are
rather low, the stress required to induce B19' from B2 is not high. In contrary, the stress
required for B19' to B33 change will be much higher owing to the large energy barrier between
them. So even if the B33 is energetically preferred, the transformation from the B2 to the B19'
overcomes a much lower barrier and the system will be stabilized at the B19' phase.
The effect of hydrostatic tension and compression at 8 GPa on the structural total
energies and energy barriers is shown in Figure 2.4, where four structures B2, B19' , 1B19' and
B33 are indicated. Compared to the result at zero pressure in Figure 2.2, the position of the shear
levels corresponding to the transformation steps and energy barriers are altered dramatically by
pressure. Three major pressure effects are evident: (1) the energy barrier between the B19' and
B33 increases from 8 meV/atom at zero pressure to 18 meV/atom (tension) and decreases to 1
meV/atom (compression) at 8 GPa; (2) the B19' has very close energy (tension) and much
higher energy (compression) compared to B33, which indicates that the B19' becomes more
stable under hydrostatic tension, but less stable at hydrostatic compression; (3) the B19' occurs
at a smaller transformation displacement,
0
u
a, permitting a smaller shear strain to achieve the
transformation from B2 to B19' .
20
Figure 2.4 Total energies variation with the transformation displacement from the B2 to the B33
of NiTi under hydrostatic tension (brown curve) and compression (green curve) at 8 GPa. The
schematic of crystal structures of B19' , 1B19' and B33 are inserted and indicated in the
transformation path.
Based on the above results, we also calculated the effect of hydrostatic tension at higher
pressure of 10 GPa on the structural total energies and energy barriers (Figure 2.5). Compared to
the result at zero pressure in Figure 2.2 and at pressure of 8 GPa in Figure 2.4, we note that (1)
the energy barrier between the B19' and B33 increases from 8 meV/atom at zero pressure to 25
meV/atom at 10 GPa; (2) the B19' has lower energy than B33 and becomes the global minimum
energy structure, which indicates that the B19' is more stable than the B33 under hydrostatic
tension. Overall, the results point to the presence of an energy barrier that is a strong function of
applied pressure in NiTi, and the B19' may become energetically stable relative to the B33
under high hydrostatic tension.

21
Figure 2.5 Effects of hydrostatic tension at 10 GPa on total energies in the phase transformation
of NiTi. The energy barrier between the B19' and B33 is much higher as 25 meV/atom. The
B19' is the global minimum energy structure and the B33 becomes a transition state in the
transformation path.
To examine the phase stability of the B19' relative to B33 at various hydrostatic stresses
(negative hydrostatic stress corresponds to positive pressure), we calculated the total energy
difference between them as shown in Table 2.2. We note that the total energy difference favors
B19' as the stable structure at 10 GPa of tensile hydrostatic stress.
Table 2.2 Total energy difference between the B19' and B33 under hydrostatic stress.
Hydrostatic Stress (GPa) -8 0 4 8 10
B19'- B33 (meV/atom) 16.9 8.3 3.4 3.2 -10.3

22
2.4 Summary
We conclude that the presence of energy barriers and their magnitude in the martensitic
phase transformation of NiTi is central to understanding the stabilization of the observed B19'
structure. The hydrostatic stress influences the structural energies; especially the high hydrostatic
tension can significantly contribute to stabilize the B19'structure in martensite.
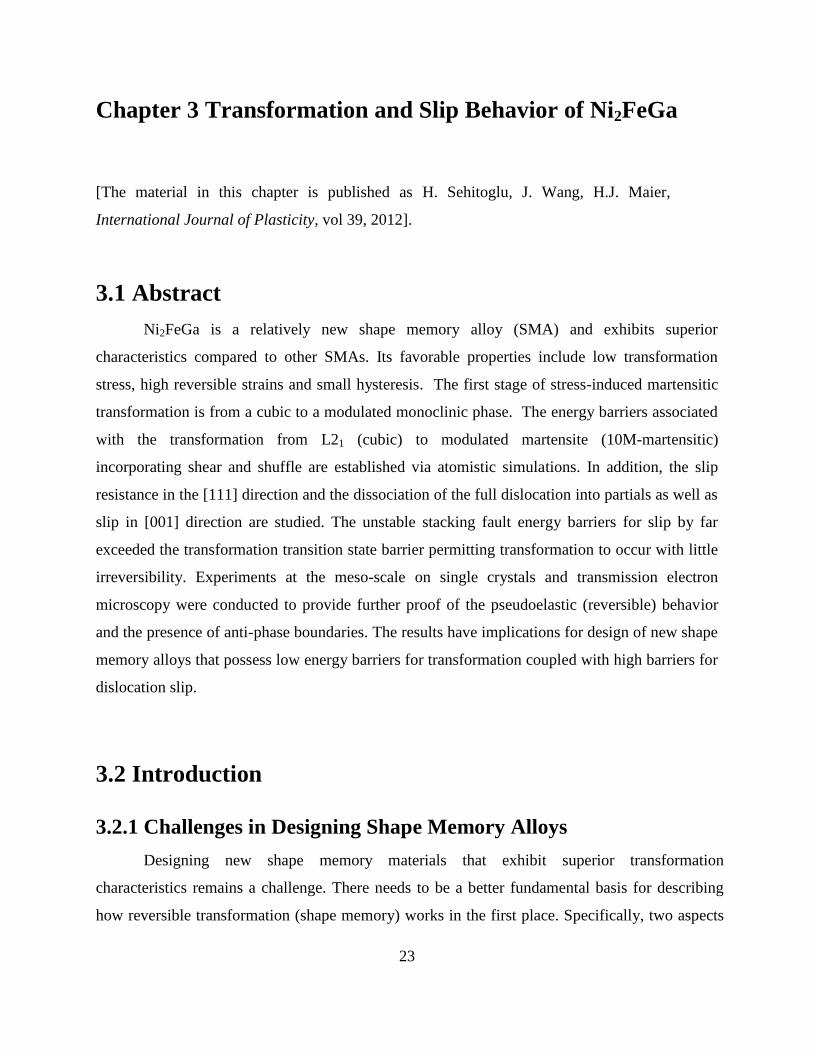
23
Chapter 3 Transformation and Slip Behavior of Ni2FeGa
[The material in this chapter is published as H. Sehitoglu, J. Wang, H.J. Maier,
International Journal of Plasticity, vol 39, 2012].
3.1 Abstract
Ni2FeGa is a relatively new shape memory alloy (SMA) and exhibits superior
characteristics compared to other SMAs. Its favorable properties include low transformation
stress, high reversible strains and small hysteresis. The first stage of stress-induced martensitic
transformation is from a cubic to a modulated monoclinic phase. The energy barriers associated
with the transformation from L21 (cubic) to modulated martensite (10M-martensitic)
incorporating shear and shuffle are established via atomistic simulations. In addition, the slip
resistance in the [111] direction and the dissociation of the full dislocation into partials as well as
slip in [001] direction are studied. The unstable stacking fault energy barriers for slip by far
exceeded the transformation transition state barrier permitting transformation to occur with little
irreversibility. Experiments at the meso-scale on single crystals and transmission electron
microscopy were conducted to provide further proof of the pseudoelastic (reversible) behavior
and the presence of anti-phase boundaries. The results have implications for design of new shape
memory alloys that possess low energy barriers for transformation coupled with high barriers for
dislocation slip.
3.2 Introduction
3.2.1 Challenges in Designing Shape Memory Alloys
Designing new shape memory materials that exhibit superior transformation
characteristics remains a challenge. There needs to be a better fundamental basis for describing
how reversible transformation (shape memory) works in the first place. Specifically, two aspects
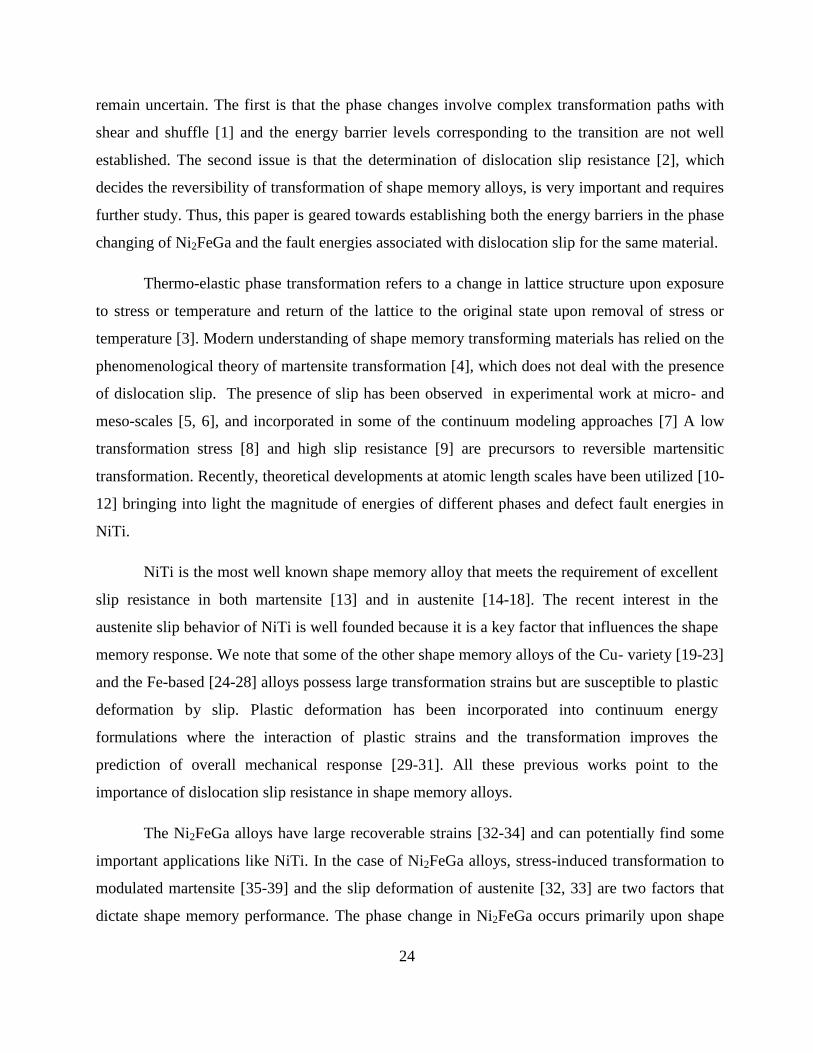
24
remain uncertain. The first is that the phase changes involve complex transformation paths with
shear and shuffle [1] and the energy barrier levels corresponding to the transition are not well
established. The second issue is that the determination of dislocation slip resistance [2], which
decides the reversibility of transformation of shape memory alloys, is very important and requires
further study. Thus, this paper is geared towards establishing both the energy barriers in the phase
changing of Ni2FeGa and the fault energies associated with dislocation slip for the same material.
Thermo-elastic phase transformation refers to a change in lattice structure upon exposure
to stress or temperature and return of the lattice to the original state upon removal of stress or
temperature [3]. Modern understanding of shape memory transforming materials has relied on the
phenomenological theory of martensite transformation [4], which does not deal with the presence
of dislocation slip. The presence of slip has been observed in experimental work at micro- and
meso-scales [5, 6], and incorporated in some of the continuum modeling approaches [7] A low
transformation stress [8] and high slip resistance [9] are precursors to reversible martensitic
transformation. Recently, theoretical developments at atomic length scales have been utilized [10-
12] bringing into light the magnitude of energies of different phases and defect fault energies in
NiTi.
NiTi is the most well known shape memory alloy that meets the requirement of excellent
slip resistance in both martensite [13] and in austenite [14-18]. The recent interest in the
austenite slip behavior of NiTi is well founded because it is a key factor that influences the shape
memory response. We note that some of the other shape memory alloys of the Cu- variety [19-23]
and the Fe-based [24-28] alloys possess large transformation strains but are susceptible to plastic
deformation by slip. Plastic deformation has been incorporated into continuum energy
formulations where the interaction of plastic strains and the transformation improves the
prediction of overall mechanical response [29-31]. All these previous works point to the
importance of dislocation slip resistance in shape memory alloys.
The Ni2FeGa alloys have large recoverable strains [32-34] and can potentially find some
important applications like NiTi. In the case of Ni2FeGa alloys, stress-induced transformation to
modulated martensite [35-39] and the slip deformation of austenite [32, 33] are two factors that
dictate shape memory performance. The phase change in Ni2FeGa occurs primarily upon shape

25
strains (Bain strain) in combination with shuffles to create a 'modulated' martensitic structure. The
'modulated' monoclinic structure has a lower energy than the 'non-modulated' lattice, and hence is
preferred. We focus on atomic movements and the energy landscapes for transformation of L21
austenite to a 10M modulated martensite structure and establish the barrier for this change. We
then investigate the dislocation slip barriers in [111] and [001] directions.
It is important to assess the transformation paths and energies associated with the austenite
to martensite transformation simultaneously with dislocation slip behavior because the external
shear stress that can trigger transformation can also result in dislocation slip. What we show is
that the order strengthened Ni2FeGa alloy requires elevated stress levels for dislocation slip while
undergoing transformation nucleation at much lower stress magnitudes (with lower energy
barriers).
3.2.2 Energetics of Phase Transformation and Dislocation Slip
A schematic of pseudoelastic stress-strain response at constant temperature is given in
Figure 3.1. We note that the initial crystal structure at zero strain is that of austenite. Upon
deformation, the crystal undergoes a phase transformation to a modulated martensitic structure. In
the case of Ni2FeGa, the structures of austenite and martensite are cubic and monoclinic,
respectively. Over the plateau stress region, austenite and martensite phases can coexist. In the
vicinity of austenite to martensite interfaces, high internal stresses are generated to satisfy
compatibility. Hence, slip deformation can occur in the austenite domains as illustrated in the
schematic. Once the transformation is complete, the deformation of the martensitic phase occurs
with an upward curvature. Upon unloading, the martensite reverts back to austenite as shown in
the schematic. The strain recovers at the macroscale, but at the micro-scale residual slip
deformation could remain as shown with TEM studies.

26
Figure 3.1 Schematic of stress-strain curve displaying the modulated martensite and dislocation
slip in austenite over the plateau region during pseudoelasticity.
We capture the energetics of the transformation through ab initio density functional
theory (DFT) calculations. In Figure 3.2a, the initial lattice constant is ao and the monoclinic
lattice constants are a, b and c with a monoclinic angle. We incorporate shears and shuffles for
the case of transformation from L21 to 10M. A typical transformation path is described in Figure
3.2a. The martensite has lower energy than the austenite. To reach the martensitic state, there
exists an energy barrier (corresponding to in Figure 3.2a) that needs to be overcome. This
barrier is dictated by the energy at the transition state (TS) as shown in Figure 3.2a. A smaller
barrier is desirable to allow transformation at stress levels well below dislocation mediated
plasticity. Along the transformation path, we find a rather small energy barrier (8.5 mJ/m2 for the
L21 to 10M transformation in Ni2FeGa).
A
M
A+M
Str
ess
Strain
Austenite (slip)
Martensite (twins,
modulations)
Domains of High
Internal Stress
A M
u

27
(a)
(b) (c)
Figure 3.2 (a) Schematic of transformation path showing the energy in the initial state, the final
state and the transition state, (b) atomic arrangements of Ni2FeGa with long range order (first
configuration). The viewing direction is [110]. The (001) planes are made of all Ni atoms, and
alternating Fe and Ga atoms. The dashed line represents the slip plane. The displacement
<111>/4 creates nearest neighbor APBs (middle configuration) and the displacement <111>/2
results in next nearest neighbor APBs (third configuration). (c) generalized fault energy of
austenite associated with full dislocation dissociation into partials in an ordered alloy.

28
Dislocation slip resistance in the L21 austenite can be understood by consideration of
energetics of slip displacements in the [111] direction associated with the motion of the
dissociated dislocations. Ribbons of anti-phase boundaries (APBs) form by dissociation of
superdislocations in the L21 parent lattice. We compute the separation distance of the
superpartials via equilibrium considerations and show the presence of these APBs from TEM
observations. The energy barriers are manifested via generalized stacking fault energy curves
(GSFE) and decide the slip resistance of the material. We check the GSFE curves in two possible
dislocation slip systems and calculate theoretical resolved shear stress.
The fundamental descriptions of the APB formation in ordered cubic materials point to
decomposition of full dislocations [40] [41]. For the Ni2FeGa, as atoms are sheared over other
atoms in neighboring planes the energy landscape indicates the decomposition of the full
dislocation to four partials resulting in APBs. The partial dislocations are not zig zag type as in
face centered cubic systems but are in the same direction as the full dislocation. This is
illustrated in Figure 3.2b. It is easiest to see the APB formation with a [110] projection (Figure
3.2b). The x-axis is [001] and the y-axis is in this case. In this view atoms on only two
planes (in-plane and out-of-plane) are noted (a different view will be illustrated later). Because
we have twice as many Ni atoms then Fe and Ga, in the direction every second column has
all Ni atoms. When slip occurs with vector 1/4 the original ordering of the lattice no longer
holds. The passage of the first partial 1/4 results in disordering of the atomic order at near
neighbors. The passage of the second partial restores the original stacking of next to near
neighbor atoms. Upon a slip displacement of 1/2 the columns with all Ni atoms are
restored but other columns do not have the original ordering (Figure 3.2b). Upon displacement of
the original lattice structure with long range order of the matrix is recovered. The fault
energy barriers corresponding to Figure 3.2b have several minima (metastable equilibrium points)
corresponding to the passages of the partial dislocations (Figure 3.2c). More details will be given
later in the text. In Figure 3.2b us refers to the unstable fault energy and NN and NNN describe
the nearest-neighbor (NN) and next-nearest neighbor (NNN) APB energies respectively. The
fault energy barriers are moderately high (>400 mJ/m2 in Ni2FeGa) and point to the considerable
[110]
[110]
[111]
[111]
[111]
[111]

29
slip resistance in Ni2FeGa. We provide TEM evidence of the presence of APBs in the austenitic
phase for samples that have undergone pseudoelastic cyclic deformation.
3.3 Cubic to Modulated (10M) Transformation in Ni2FeGa
The martensitic structure is critical to the properties of ferro-magnetic shape memory
alloys. Their tetragonality c/a, twinning stress and magnetocrystalline anisotropy constant
determine the magnetic-field-induced strain (MFIS) [42, 43]. However, large MFIS originates
mainly from the contribution of the modulated martensites[44]. Experiments have shown that the
cubic structure (L21) undergoes the phase transformation to martensitic phases, designated
modulated structure (10M/14M) and tetragonal structure (L10). The transformation from a cubic
structure (L21) to a modulated 10M structure is an important one in shape memory alloys of the
ferro-magnetic variety [32, 45-48]. The Ni2FeGa alloys undergo such a transformation via a
combination of shear (distortion) and shuffle. This is the first stage of multiple transformation
steps resulting in the L10 structure. It is a very important step because it decides the
transformation stress and the plateau stress for the shape memory alloy.
The first-principles total-energy calculations were carried out using the Vienna ab initio
Simulations Package (VASP) with the projector augmented wave (PAW) method and the
generalized gradient approximation (GGA). In our calculation, we used a 9×9×9 Monkhorst
Pack k-point meshes for the Brillouin-zone integration to ensure the convergence of results. The
energy cut-off of 500 eV was used for the plane-wave basis set. The total energy was converged
to less than 10-5
eV per atom. Considering the effect of the number of layers on stacking fault
energies [10], the present DFT calculation of GSFE for slip system (011)<111> is conducted
using a 8 layer supercell having 12-atom per layer; while for slip system (011)<001>, a 8 layer
supercell having 4-atom per layer is used. For every shear displacement, the relaxation
perpendicular to the fault plane was allowed for minimizing the short-range repulsive energy
between misfitted adjacent layers [70, 71]. We construct a supercell consisting of 40 atoms to
model the 10M structure in order to incorporate the full period of modulation in the supercell [72,
73]. The relaxation by changing the supercell shape, volume and atomic positions were carried

30
out. The periodic boundary conditions are maintained across the supercell to represent bulk
Ni2FeGa material (no free surface). All supercells used in the study ensure the convergence of
the calculation after careful testing.
The lattice parameters of L21 and L10 structures using DFT were calculated and
compared with experimental measurements. They are in a good agreement. In order to obtain the
10M structure, the initial calculation parameters a = 4.272 Å, b = 5.245 Å, c = 4.25 Å and the
monoclinic angle β = 91.49o [39] are estimated by assuming the lattice correspondence with the
L10 structure [74, 75]. The relaxation by changing the supercell shape, volume and atomic
positions were carried out. By using this optimization method, the atoms in the supercell move
from their initial positions after each relaxation step by local forces, and after numerous such
iteration processes, the configuration will be finally converged where the forces are zero in the
stable 10M structure.
Table 3.1 The L21 structure lattice constants for austenitic Ni-Fe-Ga (ao) and the lattice constants
of the modulated monoclinic (10M) structure.
Experiment Theory (this study)
Austenite
(L21) Cubic
Structure
Lattice parameter, ao (Å),
5.76 [39], 5.7405[49]
Lattice parameter, ao (Å),
5.755
Energy (eV/atom)
-5.7185
Martensite
(10M)
Monoclinic
Structure
Lattice parameter (Å),
a=4.24, b=5.38, c=4.176,
[39]
Monoclinic angle=91.49°
Lattice parameter (Å),
a=4.203, b=5.434,
c=4.1736, Monoclinic
angle=91.456°
-5.7206
Energy Barrier (TS)
8.5 mJ/m2

31
(a) (b)
(c)
Figure 3.3 (a) Schematic of the L21 austenitic structure of Ni2FeGa, (b) the sublattice displaying
the modulated and basal planes, (c) the 10M monoclinic modulated structure of Ni-Fe-Ga.

32
In Figure 3.3a, the L21 lattice of Ni-Fe-Ga is shown. We note that the distance ao
represents repeating atom positions in the <001> directions. We refer to coordinates in the L21
structure with the larger cell noting that the small cell represents a B2 structure. The L21 unit cell
contains eight cells of the B2 type. Upon transformation to martensite, the lattice structure
becomes monoclinic (Figure 3.3b) characterized by three constants a, b, c and a monoclinic
angle of 91.49°. In Figure 3.3b, the sublattice of L21 is displayed. The distortion plane can be
viewed with atom layers A and B superimposed. The change in dimension is from length
to length c for the modulation direction [110], and from to length a in the
direction. The lattice dimension in [001] is changed from 0a to b. The lattice constants are
summarized in Table 3.1. The second column gives the experimental results, while the third and
fourth columns provide the simulations. The agreement between experimental and theoretical
lattice constants including the monoclinic angle is remarkable. The ab-initio VASP code with
GGA [50-53] is used in the simulations (see Appendix).
Because the transformation occurs first via L21→10M, we investigated the energy
landscape associated with this important step. We note that the lattice parameters of the 10M are
designated as i i ia , b , c , while the L21 lattice is defined by
0a . Relative to the parent body 10M
phase involves a volumetric distortion and local shuffle. The deformation gradient can be written
in the following form to represent the volumetric distortion, where ε represents the extent of the
Bain-type deformation with ε = 0corresponding to the L21 and ε =1 to the 10M end states. The
Cauchy-Born rule was used in establishing the deformation gradient expression given below.
i i
i i
i
b (ε) b (ε) 0
2 2
c (ε) c (ε)F( ) 0 (1)
2 2
a (ε) 0 0
2
0 0
0 0
0
a a
a a
a
To account for the internal displacements associated with the shuffles, the strain energy
density is minimized with respect to the shuffle displacements while F( ) is held fixed. This is
achieved with internal relaxations of the atoms to the local energy minimum. The normalized
a0 2 / 2 a0 2 / 2
[110]

33
shuffle parameter is defined as s
a where s is the absolute shuffle. The energy landscape is
completed for the multiple pathways that could achieve L21→10M by exploring all combinations
of distortion and shuffle for Ni2FeGa. The transformation path to the 10M structure is rather
complex as shown in Figures 3.4a and 3.4b and involves both shear (Bain strain) and shuffle.
The energy contours shown in Figure 3.4b show that the non-modulated martensite (10NM) has
a higher energy than the modulated 10M structure. The 10NM structure has the same lattice
constants as 10M. The difference between the two is that 10M involves considerable shuffle that
results in the modulation. The minimum energy path is indicated in Figure 3.4a. We note that
there is a rather small barrier (8.5 mJ/m2) at the early stages of combined shear and shuffle. This
is the principal reason why the transformation stress is rather low (< 50MPa) in this alloy.
To obtain the Potential Energy Surface (PES) within reasonable computational time, we
divided the shear and shuffle based computational domain primarily into 7 7 nodes. Additional
nodes are added near the energetically significant positions such as the local minima and the
saddle point. A symmetry-adapted “free energy” polynomial was fitted to our E( , ) data. For
this fault energy functional E( , ) , we chose a fourth order cosine-sine polynomial [54],
which can appropriately represent the shear shuffle coupling, i.e.
m n 4 m n 4m n m n
mn m0 n0 mn
m,n 0 m,n 0
E( , ) a [X( )] [X( )] [1 ] b [X( )] [Y( )] (2)
where, [X(x)] [1 cos( x)], [Y(x)] [sin( x)] , and represents Kronecker’s delta ( is 1(0)
if i is (not) equal to j). An additional constraint of x 0,1
d E( , ) / dx 0
was imposed to ensure
local minima at (0, 0) and (1, 1) positions in the PES.
ij ij

34
(a)
(b)
Figure 3.4 (a) The energy landscape associated with the L21 to 10M transformation. The
transformation is comprised of a distortion and shuffle and the path is rather complex. (b) 3D
view of the transformation surface showing that the energy of 10NM (non-modulated martensite)
structure is higher than 10M (modulated). See Figure 3.3b for the lattices.
3.4 Dislocation Slip (GSFE) in Ni2FeGa
3.4.1 The (011)<111> Case
The generalized stacking fault energy (GSFE), first introduced by Vitek [55], is a
comprehensive definition of the fault energy associated with dislocation motion. In fcc alloys, a

35
single layer intrinsic stacking fault is formed by the passage of partial dislocations in the
direction on the {111} plane. The fault energy of different sheared lattice configurations can be
computed as a function of displacement ux. The generalized stacking fault energy (GSFE) is
represented by a surface ( -surface) or a curve ( -curve). The peak in fault energy was termed
as the unstable SFE by Rice [56]. In the case of Ni2FeGa, all fault energies are determined
relative to the energy of the L21 structure.
(a) (b)
(c)
Figure 3.5 (a) The austenite (L21) lattice showing the slip plane and slip direction, (b) The {112}
projection illustrating the atom positions on the {110} plane and <111> direction, note the
stacking sequence in the [111] direction, (c) Upon shearing in the <111> direction the
112< >

36
dissociation of the superlattice dislocation ao[111] to four partials, and the associated NNAPB
and NNNAPB energies are noted.
We investigated slip in the <111> direction consistent with experiments [57]. In this case
the slip plane is {110}. Figure 3.5a shows the L21 lattice with the slip plane (shaded) and the
<111> direction, and Figure 3.5b the stacking in the [111] direction as ABCDEFAB'CD'EF'.....
This stacking is similar to the <111> direction in bcc metals, but the difference arises because of
the presence of three elements in Ni2FeGa. Because the normal plane is {112}, a total of 6 layers
must be shown in this projection. The largest atom represents in-plane and the atom size
becomes smaller as the out-of-plane is depicted. The smallest atom is in the fifth layer (out-of-
plane) and the largest atom is in the zeroth layer (in-plane). Considerable attention should be
placed on establishing the correct atom positions when multiple planes and binary or ternary
alloys are considered. We utilize visualization softwares (particularly VMD) to check for
accuracy of the coordinates.
We note that in the case of dislocation moving through an ordered lattice (such as D03 or
L21) an antiphase boundary forms on the glide plane. The GSFE associated with the APB
formation is given in Figure 3.5c. We note that the stable fault structure formed due to a shear
displacement ux =|b| (see Figure 3.5c corresponding to a local minimum, on the curve with fault
energy intrinsic stacking fault (isf) (or APB)) where b=a0/4[111] (the intrinsic stacking fault
energy has been also referred as the APB energy and both terms have been used interchangeably).
The equilibrium fault structure corresponds to the intrinsic stacking fault on the {110} plane.
Further shear beyond the first minima on the -curve along <111> direction results in another
stable structure at ux =2|b| (Figure 3.5c).
As stated earlier, the nearest neighbor (NN) and next nearest neighbor (NNN) bonds are
altered in the glide plane via the passage of first partial. When the second dislocation travels in
succession, it reorders the NN sites but there is a further change in the next nearest neighbor
(NNN) sites. The passage of the third dislocation disorders the NN sites and results in another
change of the NNN sites. The fourth dislocation reorders both the NN and NNN sites across the
slip plane. If four dislocations travel in succession (as in the present case), the dislocations are

37
bound by two types of anti-phase boundaries. Then, the distances between dislocations 1 and 2
and 2 and 3 are dictated by the APB energies (NN and
NNN ). We note that mechanical
relaxation was allowed for deviation from the perfect crystallographic displacements and these
displacements were found to be less than 1% of the Burgers vector [58, 59]. Although these
displacements are small, the relaxation in all three directions permits higher accuracy in terms of
the APB energy values (Figure 3.5c).
The position of the atoms corresponding to b=a0/4[111] is shown in Figure 3.6a. The
ordering is incorrect across AD, BE, DC, DA ....... planes. We note that in Figure 3.6b the correct
ordering has been restored connecting the atoms across AA, CC, and EE. Thus, the NNNAPB
plane is subdivided periodically with all Ni atoms arranged in the original ordered positions
along direction, with the adjacent layers of Fe and Ga not conforming to the original order.
(a) (b)
Figure 3.6 (a) Atomic displacements for Ni2FeGa along the [111] direction. The atoms across
the slip plane with a basic displacement of 1/4[111] are no longer in the correct position, (b)
Upon a displacement of 1/2[111] atoms AA, CC, EE across the slip plane (APB) are partially
ordered.
The superdislocation splitting into four superpartials with two NN APBs and one NNN
APB can be described as,
[110]
Ni- Out of
Plane 5
Fe- Out of
Plane 5 Ga- Out of
Plane 5
Ni- In
Plane
Fe- In
Plane Ga- In Plane
NN Disordered
Ordered u
x=
ao
4[111]
Ordered
A B C D E F A B’ C D’ E F’ A........
A B C D E F A B’ C

38
1 1 1 1[111] [111] NNAPB [111] NNNAPB [111] NNAPB [111]
4 4 4 4
where, the lattice constant is omitted in the expression. The APBs pull the partials together while
their elastic interaction results in repulsion. There is equilibrium spacing for the APB boundaries.
Ribbons of APB formed by dislocation glide are visible as bands in transmission electron
microscopy of deformed samples which we discuss below.
The separations of the partial dislocations d1 and d2 can be calculated using force balance
[60, 61] for each partial leading to the following equations:
NN
1 1 2 1 2
NNN NN
2 1 2 1
1 1 1K
d d d 2d d
1 1 1K
d d d d
These equations can be solved for the separation distances giving the energy levels and the
other material constants as input. The factor K is given as
2
pμbK =
2π where μ =19 GPa (obtained
from our simulations), p 0
3b a
4 and
0a 5.755 Å as noted earlier. This results in
1d 1.73 nm, 2.41 nm 2d , hence the width of the entire fault is of the order of 010a . We note
that if the shear modulus is not known from simulations one can determine the value of K above
from the cubic constants using a formula provided by Head [62].
3.4.2 The (011) <001> Case
We conducted simulations to determine the energy barriers (GSFE) for the (011) <111>
dislocation slip. The (011) <111> dislocation slip system has been observed experimentally for
CuZnAl alloys as mentioned earlier. As the ionic character of the bonding changes there is a
transition to <100> slip as noted for NiTi [63]. Therefore, it is important to check the GSFE
behavior and compare the results to the <111> case.
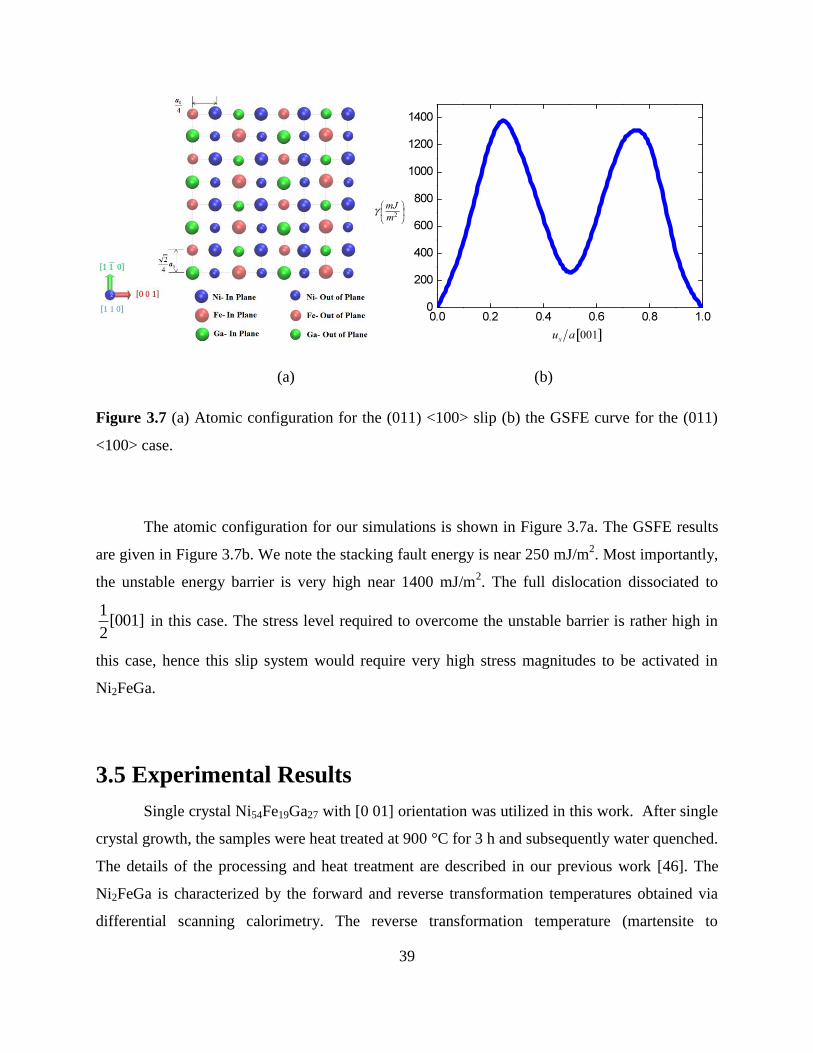
39
(a) (b)
Figure 3.7 (a) Atomic configuration for the (011) <100> slip (b) the GSFE curve for the (011)
<100> case.
The atomic configuration for our simulations is shown in Figure 3.7a. The GSFE results
are given in Figure 3.7b. We note the stacking fault energy is near 250 mJ/m2. Most importantly,
the unstable energy barrier is very high near 1400 mJ/m2. The full dislocation dissociated to
1[001]
2 in this case. The stress level required to overcome the unstable barrier is rather high in
this case, hence this slip system would require very high stress magnitudes to be activated in
Ni2FeGa.
3.5 Experimental Results
Single crystal Ni54Fe19Ga27 with [0 01] orientation was utilized in this work. After single
crystal growth, the samples were heat treated at 900 °C for 3 h and subsequently water quenched.
The details of the processing and heat treatment are described in our previous work [46]. The
Ni2FeGa is characterized by the forward and reverse transformation temperatures obtained via
differential scanning calorimetry. The reverse transformation temperature (martensite to

40
austenite) for the Ni-Fe-Ga alloy is 16°C. Our experiments were conducted at room temperature
(25 °C). The material is in the austenitic state at the beginning of the experiment and undergoes a
stress-induced transformation. In the first step the transformation is from L21 to 10M with a
transformation strain of 4%, then transformation to 14M results in additional 2% strain. Finally,
the transformation to L10 (tetragonal) results in a transformation strain as high as 12%. Single
crystals (of [001] direction) were used in the experiments to facilitate the interpretation of results
and maximize the transformation strains. The samples were deformed to a strain of 12% and then
unloaded to zero strain. This process was repeated and pseudoelastic behavior was established
cycle after cycle. The stress-strain response is shown in Figure 3.8a.
Digital image correlation results (DIC) providing for the strain fields are given in Figure
3.8a. The initial transformation stress represents the L21 to 10M transformation. The details of
the DIC technique for measuring the displacement fields by tracking features on the specimen
surface can be found in [64]. The DIC local strain measurement images are shown at selected
points along the curve for the Ni2FeGa alloy. Each image in the figure corresponds to a marker
point indicated on the stress-strain curve. Note that the loading axis for all images is vertical,
and the color contours represent magnitudes of axial strain based on the inset common scale.
With proper choice of magnification, nuances of martensite nucleation and strain gradients at
austenite/martensite interfaces can be resolved.
As the loading reaches a critical transformation stress, one can establish the instant of
martensite nucleation and the corresponding stress precisely. In the third image of the sequence
(left to right), the 10M phase appears as the blue region and this 10M band propagates along the
specimen length. This shows that it is possible to identify intermediate transformations not
evident in the macroscale stress-strain response. With further deformation, a critical
transformation stress for the L10 phase is achieved at approximately 80 MPa and followed by a
second plateau.
Under suitable composition and annealing conditions, second-phase ( -phase) particles
with a FCC structure can be precipitated in the L21 austenite of Ni2FeGa. Based on the Fe
content determined by Energy-dispersive X-ray (EDX), this phase does not undergo a
martensitic transformation, but plastic accommodation [33, 38]. In Figure 3.8b, the TEM results

41
are shown clearly displaying the presence of APBs in this alloy. The TEM samples were
extracted from samples that have undergone pseudoelastic cycling as described above. The
dislocations were retained after the cycling sequence. The APBs appear as series of lines and are
extended across the specimen width. Considering some deviations because of magnetic rotation
between diffraction patterns and the actual image, the trace of the image was found to be close
to the {110} type plane.
(a) (b)
Figure 3.8 (a) Pseudoelasticity experiments (at room temperature) [45] (b) TEM results
displaying APBs in the austenite domains.
3.6 Implication of Results
Based on the GSFE results the ideal stress levels for dislocation slip were calculated for
<111> and <001> directions and the magnitudes are shown in Table 2. We note that the stress
magnitudes for slip nucleation,shear nuc
max
(τ )
xu
, are rather high precluding significant slip
within austenite. However, the stresses at the austenite-martensite interfaces can be sufficiently
high to generate dislocation slip in the austenite domains. Furthermore, Fisher [65] made a first
APB
APB

42
order estimate of the additional stress associated with the dislocation motion creating a change in
order within the crystal. The increase in energy of the interface needs to be balanced by the extra
applied shear stress to move the dislocations. Upon utilizing 200 mJ/m2 (corresponding to the
lower value of NN ) we calculate the Fisher strengthening near 1 GPa for both cases as shown in
Table 3.2.
Table 3.2 Calculated fault energies, Burgers vector, (ideal) critical stress for slip nucleation and
Fisher stress for movement of APBs.
Slip Plane Slip Direction b Fault Energy, shear nuc
max
(τ )
xu
shear F
γ(τ ) =
b
(Å) (mJ/m2) (GPa) (GPa)
(110) [111]
(110) [001]
Theory (this study)
2.5 200 3.7 0.8
2.88 263 9.5 0.9
We finally note that the calculated separation distances for partials within the APBs are
consistent with the experiments reported in this study. The precise width of the APBs can be
further resolved by experiment utilizing high resolution methods, which are outside the scope of
the present work. Even though the experimental measurement of separation distances is not
available because they are only several nanometers, the experiments clearly show the presence of
APBs. An example of high density of APB formation in Ni-Fe-Ga has also been reported by
Chumlyakov [34] and the images are in agreement to those presented in this study.
We make a comparison between the current results and the work on CuZnAl alloys where
the fault energies were of the order of 45 mJ/m2, which resulted in prediction of Fisher
strengthening near 330 MPa [66]. Similarly, if we are to consider dislocation glide in Ni2FeGa

43
and use Fisher’s formula (shear F(τ ) ) we find the magnitude of extra shear stress to drag the APBs
to be near 0.8 to 0.9 GPa. This magnitude is still significantly higher than the transformation
stresses (less than 0.2 GPa) observed experimentally for Ni2FeGa. Taking into account the
temperature dependence in the phase transformation and plasticity behavior, we note that the
critical stresses for the initial martensitic transformation and slip nucleation in Ni2FeGa will be
modified with increasing temperatures. However, the present results are insightful because they
represent the energies associated with displacements to render the transformation or plasticity at
a reference temperature (0K). Consequently, there is mounting evidence of the potential for
Ni2FeGa as a shape memory alloy with favorable characteristics. To our knowledge, this is the
first time the transformation path for L21 to 10M for Ni2FeGa has been determined and the GSFE
in <111> and <001> directions are computed for the same alloy. Also, we present experimental
evidence of APBs on samples that have undergone pseudoelastic cycling.
There are a number of reasons why a transformation is reversible versus irreversible.
Reversibility is favored when the energy barriers for forward and reverse transformations are
small compared to the energy barriers for dislocation slip. The absence of long range ordering
results in rather large hysteresis levels in martensite transformations. For example, the Fe-C or
Fe-Ni steels exhibit very large thermal hysteresis of the order of 400 °C, and the FeNiCoTi and
FeMnSi fcc shape memory alloys (which do not have long-range ordering) also exhibit high
hysteresis levels (200 °C). On the other hand, the Fe-Pt shape memory alloys, which can be
ordered [67], exhibit hysteresis levels as low as 10 °C. In Ni based alloys (also of the shape
memory variety) such as NiTi, NiTiX (X = Cu,Fe), where long-range ordered B2 to monoclinic
martensite transformation has been observed, the hysteresis levels are typically of the order of
10 °C to 20 °C. In Ni2FeGa, where the austenite phase is long-range ordered cubic L21 and the
martensite is monoclinic 10M, the thermal hysteresis can be as low as 1 °C [32] generating new
possibilities for applications [68]. It is shown that the transformation barrier is rather low in
Ni2FeGa (8.5 mJ/m2), hence the critical stress levels for forward and reverse transformation are
much lower than for dislocation slip.
There has been previous discussion of the slip systems in L21 shape memory alloys of the
CuZnAl type. The <111> glide planes have been observed with APB formation for the L21
CuZnAl alloys as well [66, 69]. It is known that when the APB energies are low, <111> slip

44
dominates. As APB energies become higher with increasing ionic character, <100> slip is
favored as noted by Rachinger and Cottrell [63]. The present results show that the unstable
energies for the <001> case are exceedingly high precluding its occurrence unless the stress
magnitudes exceed a few GPa.
Finally, we summarize what primarily influences the transformation reversibility of
Ni2FeGa alloys. The increase in elastic accommodation of the transformation with an increase in
plastic slip resistance leads to the reversible transformations. We show that the slip resistance in
long-ranged ordered Ni2FeGa is high with total dislocations decomposing to partials connected
with anti-phase boundaries.

45
Chapter 4 Plastic Deformation of NiTi Shape Memory
Alloys
[The material in this chapter is published as T. Ezaz, J Wang, H. Sehitoglu, H.J. Maier,
Acta Materialia, vol 61, 2012. This work is started by Dr. Ezaz]
4.1 Abstract
Dislocation slip in B2 NiTi is studied with atomistic simulations in conjunction with
transmission electron microscopy. The atomistic simulations examine the generalized stacking
fault energy (GSFE) curves for the {011}, {211} and {001} planes. The slip directions
considered are <100>, <111> and <011>. The results show smallest energy barriers for the
(011)[100] case, which is consistent with the experimental observations of dislocation slip
reported in this study. To our knowledge, slip on the (011)[1 11] system is illustrated for the first
time in our TEM findings, and atomistic simulations confirm that this system has the second
lowest energy barrier. Specimens that underwent thermal cycling and pseudoelasticity show
dislocation slip primarily in the austenite domains while the bulk of martensite domains does not
display dislocations. The results are discussed via calculation of the ideal slip nucleation stress
levels for the five potential slip systems in austenite.
4.2 Introduction
The shape memory alloy NiTi has considerable technological relevance and has also been
scientifically perplexing. For some time, the plastic deformation of austenite via dislocation slip
has not been fully understood, although it is very important as it limits the shape memory
performance [48-53]. The role of slip in austenite has drawn significant attention recently [54-
57].

46
The understanding of NiTi has been empowered with recent atomistic simulations. The
simulations provide the energy levels for the different phases [4, 58, 59], the lattice parameters
[38], the elastic constants [36] and the energy barriers for martensite twinning [20, 31]. Beyond
these advances, a detailed consideration of the dislocation slip behavior via simulations is
urgently needed to compare with the experimental findings of active slip systems. Upon
establishing the GSFE (Generalized Stacking Fault Energy) curves in the austenitic (B2) phase,
we study the propensity of five potential slip systems, and note the formation of anti-phase
boundaries (APBs) in certain cases. Consequently, we assess the magnitude of ideal stresses
needed to activate slip in these different systems. We find the (011)[100] system to be the most
likely one consistent with experiments. The occurrence of (011)[1 11] slip is reported in our
experimental findings in Section 4.3.1, which has not been reported earlier to our knowledge.
This is the second most likely slip system after [100] slip.
To gain a better appreciation of the role of slip on shape memory behavior we show two
results in Figure 4.1 for NiTi. In the first case, the temperature is cycled at a constant stress
(Figure 4.1a). The range of temperature is 100 to -100 °C which is typical for application of NiTi.
It is evident that as the stress magnitudes exceed 150 MPa, the strain upon heating is not fully
recoverable. A small plastic strain remains and this is primarily due to residual dislocations in the
B2 matrix. In Figure 4.1b the experiment is conducted at a constant temperature. The sample is
deformed and austenite to martensite transformation occurs, with austenite domains primarily
undergoing dislocation slip to accommodate the transformation strains (see Section 4.3.2 for
further details). Upon unloading, a small but finite amount of plastic strain remains. The plastic
strains become noticeable at the macroscale at stress levels exceeding 600 MPa for the
solutionized 50.1%Ni NiTi. The small plastic strains can accumulate over many cycles and
deteriorate the shape memory effect. Apart from the residual strain that is produced, the presence
of plasticity reduces the maximum transformation strain and increases the stress hysteresis, two
other measures of shape memory performance. This will be discussed further in Section 2.3.

47
(a) (b)
Figure 4.1 Shape memory and pseudoelasticity experiments on solutionized 50.1%Ni-Ti, (a) The
development of macroscopic plastic (residual) strain upon temperature cycling (100 °C to -
100 °C) under constant stress [60] (b) The plastic (residual) strain under pseudoelasticity at
constant temperature (T = 28°C).
Under fatigue loading, the NiTi alloys exhibit gradual degradation of pseudoelasticity
with cycles, and this deterioration has been attributed to slip deformation [50, 51]. As stated
above, the domains that undergo slip curtail the reversibility of transformation. Therefore, a
higher slip resistance is desirable to achieve pseudoelasticity over many cycles in NiTi. Based on
this background, it is extremely worthwhile to develop a quantitative understanding of
dislocation slip; specifically, it’s crucial to determine the energy barriers (GSFE curves) for the
most important slip systems. In this study, the simulation results (in Sections 4.4 and 4.5) are
aimed towards building a framework for a better comprehension of shape memory alloys.
The glide planes and directions of possible slip systems in austenitic NiTi are shown as
Figure 4.2. We note that there are multiple planes within the same family of slip systems, and
only one of the planes is shown in Figure 4.2 for clarity. The potential slip planes are {011},
{211}and {001}. In the studies of Chumlyakov et al [7] and Tyumentsev et al. [61], NiTi is
12
10
8
6
4
2
0
Str
ain
%
-100 0 100
Temperature (o
C)
Ti-50.1%Ni; [123] Solutionized
150 MPa
Plastic (residual) Strain
1000
800
600
400
200
0
Str
ess (
MP
a)
86420
Strain (%)
Ti -50.1 %Ni; [001]Solutionized
Plastic (residual) Strain
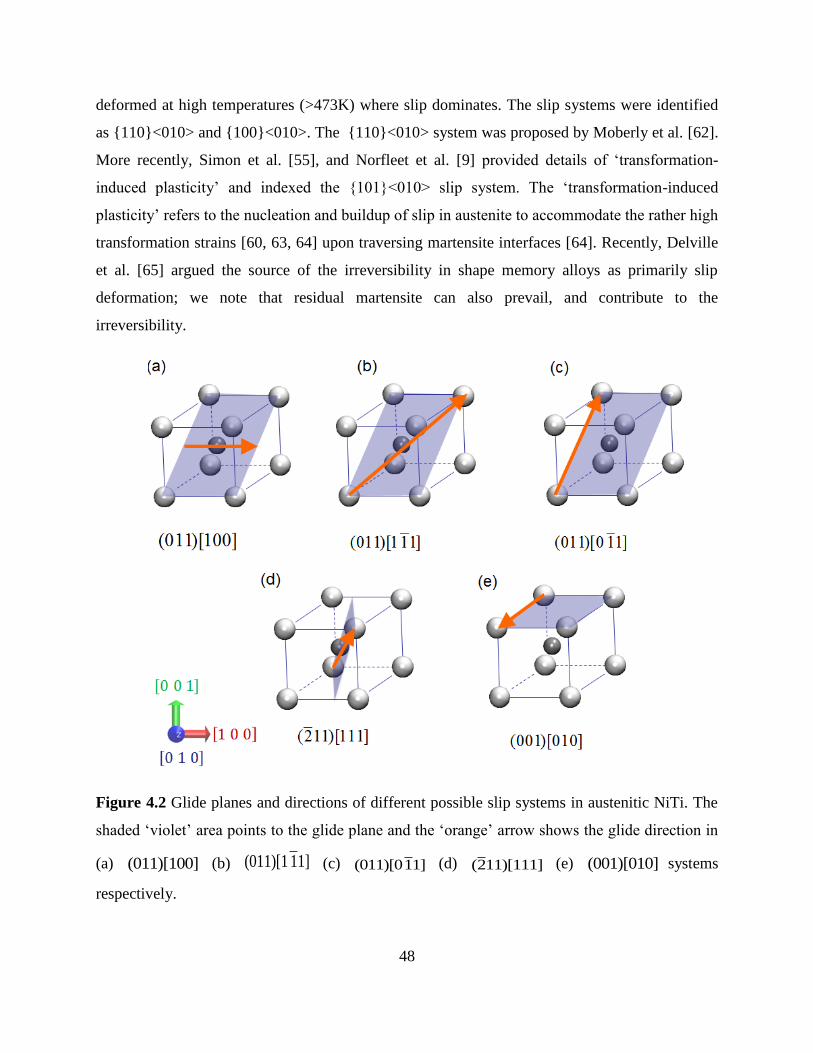
48
deformed at high temperatures (>473K) where slip dominates. The slip systems were identified
as {110}<010> and {100}<010>. The {110}<010> system was proposed by Moberly et al. [62].
More recently, Simon et al. [55], and Norfleet et al. [9] provided details of ‘transformation-
induced plasticity’ and indexed the {101}<010> slip system. The ‘transformation-induced
plasticity’ refers to the nucleation and buildup of slip in austenite to accommodate the rather high
transformation strains [60, 63, 64] upon traversing martensite interfaces [64]. Recently, Delville
et al. [65] argued the source of the irreversibility in shape memory alloys as primarily slip
deformation; we note that residual martensite can also prevail, and contribute to the
irreversibility.
Figure 4.2 Glide planes and directions of different possible slip systems in austenitic NiTi. The
shaded ‘violet’ area points to the glide plane and the ‘orange’ arrow shows the glide direction in
(a) (011)[100] (b) (011)[1 11] (c) (011)[011] (d) (211)[111] (e) (001)[010] systems
respectively.

49
NiTi alloys exhibit considerable ductility. This high ductility behavior is viewed as
unusual since B2 intermetallic alloys are expected to exhibit limited ductility [66]. As discussed
above, the {011}<100> permits glide only in three independent slip systems. The presence of
only three independent systems for the {011}<100> case was discussed in the textbook by Kelly,
Groves and Kidd (p. 196) [67] and the recently in a paper on NiTi by Pelton et al. [10]. If
loading was applied along any of the cube axis the cube is not able to deform because the
resolved shear stress is zero for all possible <100> directions, hence certain orientations produce
no glide if there are less than five independent slip systems. Given that at least five independent
slip systems are required for dislocations to accommodate arbitrary deformations [68], additional
slip systems must be present in B2 NiTi contributing to the enhanced plasticity. In B2 alloys, the
potentially operative {110}<111> slip provides additional nine deformation modes that can
contribute significantly to the superior ductility. The slip system {110}<111>, though observed
in a few ordered intermetallic alloys of B2 type such as -CuZn [69] and FeCo [70], has,
however, not been reported for NiTi to our knowledge. Rachinger and Cottrell [71] classified the
B2 type intermetallic compounds to two categories; (i) those of ionic binding with slip direction
in <100> and (ii) those dominated by metallic binding with slip direction <111>. In the present
article, we report experimental evidence with transmission electron micrographs of
{110}<111>slip in B2 NiTi in Section 4.3, and provide an energetic rationale in comparison to
the other possible B2 slip modes such as (011)[011], (001)[010] and (211)[111] in Section 4.5.
The underlying basis of dislocation motion in a certain glide plane and direction is
described by the generalized stacking fault energy curve (GSFE) [72]. Simulations incorporating
electronic structure are capable of predicting which systems are most likely. We also discuss
dislocation dissociation scenarios for the <111> slip system in Section 5, uncovering the
energetic basis (GSFE) of the super partials formed via dissociations with lower energy barriers.
Specifically, we focus on the (011)[100] , (011)[111] , (001)[010] , (011)[011] and
(211)[111]dislocation slip cases. This information is critical for micro-mechanical models at
higher length scales that can be used to predict the mechanical response during service as well as
during processing. We also report transmission electron micrographs providing evidence of
(011)[111] glide in conjunction with (011)[100] slip from experiments under numerous

50
experimental conditions. Our quantitative GSFE calculations provide an underlying rationale for
these observations and will be discussed in detail in the present article.
4.3 Experimental Results
4.3.1 Experimental Evidence of {011}<100> and (011)<111> Slip
To determine the slip planes and slip directions, experiments were conducted under
compression at room temperature (28°C) on solutionized single crystals of 50.1%Ni NiTi. The
solutionized (SL) samples underwent heating to 940°C for 24 hours and then quenching. In this
case, the austenite finish temperature is 10 °C while the martensite finish temperature is near -
40 °C. In Reference [73], the DSC curves for other heat treatments are provided.
The mechanical response of the deformed sample was presented as Figure 4.1b. In the
case examined in this work, the specimen is subjected to compression in the [001] direction to
strain levels of 5% and unloaded to zero stress. A very small residual plastic strain is present
upon unloading and does not recover upon heating (Figure 4.1b). The overall behavior is
pseudoleastic at the macroscale; however, dislocations are observed at the microscale.
The deformed samples are interrogated with transmission electron microcopy (TEM)
upon conclusion of the pseudoleastic deformation response. Figure 4.3 shows TEM micrographs
of dislocation arrangements observed at the same spot in the specimen deformed at room
temperature. The Burgers vector of dislocations marked with the letter ‘A’ (colored white) in
Figure 4.3a is identified to be [010] from g.b analysis. By contrast, the dislocations marked with
the letter ‘B’ (colored white) in Figure 4.3b have a Burgers vector [111] . These dislocations
tangle each other, which is a cause of high strain hardening observed during deformation. To our
knowledge, this is the first evidence of the presence of the [111] dislocations in NiTi. We note
that these dislocations are not inherited from martensite as the corresponding plane in martensite
((001)M plane) is not a slip plane [17].

51
Figure 4.3 (a) Transmission electron micrographs of dislocations in the specimen deformed at
room temperature imaged with different g-vectors. The white arrow labeled with white letter ‘A’
points to dislocations of the <100> type and (b) shows dislocations of the < 111 > type (labeled
with white letter ‘B’).
4.3.2 Further Evidence of Dislocation Slip in Thermal Cycling and
Pseudoelasticity Experiments at Microscale
Strong evidence of slip is noted in NiTi alloys of different compositions in early work
which is summarized in Reference [60]. Typical Ni rich compositions studied in our work on
single crystals are in the range 50.1 to 50.8% Ni. A series of strain-temperature responses were
given in [60] and they conform to the pattern shown in Figure 4.1a. TEM results from these
experiments under temperature cycling (under stress) are shown in Figures 4.4a through 4.4f. In
all cases, the slip activity in the austenite phase is noted. When austenite to martensite interfaces
are shown, it is noted that the dislocations exist primarily in the austenitic phase. In the case of
50.1% and 50.4%Ni NiTi compositions the temperature is cycled from RT-
100C100CRT under stress. In Figure 4.4a the martensite and austenite domains are
marked; in Figure 4.4b, the lower half of the image shows the transformation-induced
dislocations in the austenitic phase, and the upper half shows the martensite. In Figures 4.4(c)-
4.4(e) the dislocation configurations in the austenite away from the austenite-martensite interface
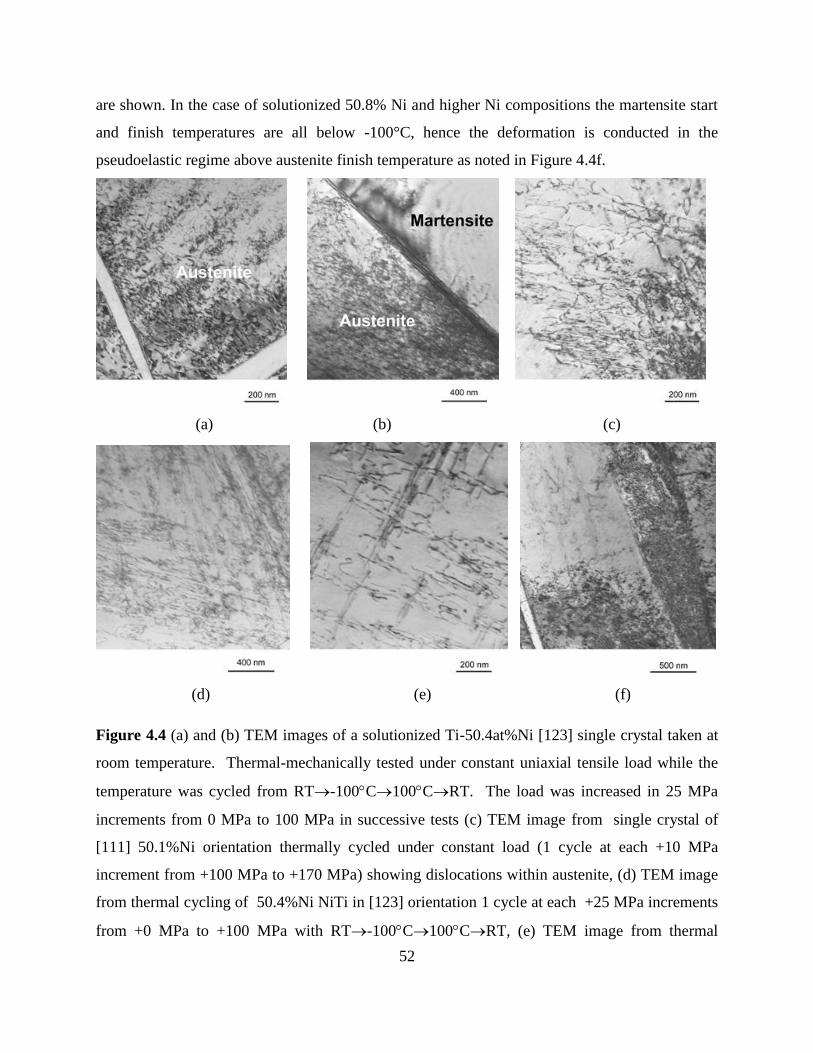
52
are shown. In the case of solutionized 50.8% Ni and higher Ni compositions the martensite start
and finish temperatures are all below -100°C, hence the deformation is conducted in the
pseudoelastic regime above austenite finish temperature as noted in Figure 4.4f.
(a) (b) (c)
(d) (e) (f)
Figure 4.4 (a) and (b) TEM images of a solutionized Ti-50.4at%Ni [123] single crystal taken at
room temperature. Thermal-mechanically tested under constant uniaxial tensile load while the
temperature was cycled from RT-100C100CRT. The load was increased in 25 MPa
increments from 0 MPa to 100 MPa in successive tests (c) TEM image from single crystal of
[111] 50.1%Ni orientation thermally cycled under constant load (1 cycle at each +10 MPa
increment from +100 MPa to +170 MPa) showing dislocations within austenite, (d) TEM image
from thermal cycling of 50.4%Ni NiTi in [123] orientation 1 cycle at each +25 MPa increments
from +0 MPa to +100 MPa with RT-100C100CRT, (e) TEM image from thermal

53
cycling of solutionized 50.4%Ni NiTi [001] orientation with the following history 1 Cycle at
+125 MPa, +140 MPa, +170 MPa, +185 MPa, + 215 MPa, + 230 MPa, +245 MPa, +260 MPa; 2
Cycles at +200 MPa; 3 Cycles at +155 MPa (f) dislocation slip at room temperature of a
solutionized Ti-50.8at%Ni [001] single crystal. Prior to TEM, the specimen was strained to 10%
at room temperature (25C).
4.3.3 Plasticity Mediated Transformation Strains and Residual
Strains under Thermal Cycling at Macroscale
The results of differential scanning calorimetry for NiTi are shown in Figure 4.5a and the
shape memory strains via temperature cycling under stress are shown in Figure 4.5b for 50.1%Ni.
The strain for the correspondent variant pair CVP formation and CVP + detwinning strain from
theory are marked in Figure 4.5b. This experiment is conducted on a single crystal with the
loading axis in [123] direction. The detwinning strain in tension is appreciable and increases the
maximum transformation strains depending on the crystal orientation. The main reason why the
theoretical strain levels (10.51%) are not reached is the occurrence of slip resulting in
irreversibility. The plastic strain is noted at the maximum temperature end of the strain-
temperature curves as the stress level exceeds 125 MPa.
(a) (b)
Figure 4.5 (a) Differential scanning calorimetry results for solutionized 50.1%Ni-Ti and
50.4%Ni-Ti, the dotted curve is for cooling, the hysteresis levels are also marked on the figures
54
[74] (b) Strain-temperature curves under temperature cycling showing the buildup of plastic
strain with increase in stress (adapted from [60]).
4.4 Simulation Methodology-GSFE Calculations
The energy barrier during dislocation motion in a glide system is established via
generalized stacking fault energy (GSFE) [30]. Also referred to as the fault energy curve, GSFE
is defined as the energy associated with a rigid shift of the upper elastic half surface with respect
to the lower half on a given slip plane in a given slip direction. During a GSFE calculation, a
complete landscape of fault energy is investigated, which requires a displacement of a repeating
unit lattice in the respective shear direction. Hence, the total displacement magnitudes in [100]
and [111] directions are a and [111] 3a = a respectively. The GSFE for the slip system [uvw](hkl)
is plotted against the displacement in each layer, ux, which is normalized by its respective
displacement, uvw
We used spin-polarized, ab-initio calculation to properly determine the undeformed and
deformed energy states of NiTi austenite during the shearing in a certain slip system. The ab-
initio calculations were conducted via the density functional theory based Vienna ab-initio
Simulation Package (VASP) [25] and the generalized gradient approximation (GGA) [75] is
implemented on a projection-augmented wave (PAW). Monkhorst-Pack 9 9 9 k-point meshes
were used for Brillouin zone integration. The structural parameter of NiTi in B2 phase was
calculated first and found to be 3.004 Å with a stable energy of -6.95 eV/atom. We have used an
L-layer (hkl)-based cell to calculate defect energies and performed shear along the [uvw]
direction to generate the GSFE curve in that system. We assessed the convergence of the GSFE
energies with respect to increasing L, which indicates that the fault energy interaction in adjacent
cells due to periodic boundary conditions will be negligible. The convergence is ensured once
the energy calculations for L and L+1 layers yield the same GSFE.
During calculation of GSFE, the calculation was followed up by incorporating a
displacement of known magnitude (as discussed above) and performing a full internal atom
relaxation, including perpendicular direction to the glide planes, until the atomic forces were less
55
than ±0.020 eV / Å . Further details of the computational method can be obtained in earlier
literature [76].
4.5 Simulation Results
4.5.1 The (011)[100] Case
This is the most observed slip system in austenitic NiTi. In the B2 NiTi crystal structure,
in the [011] stacking direction, in plane Ni (Ti) and out of plane - Ni (Ti) atoms are periodically
arranged (stacking sequence ABAB…..) as shown in Figure 4.6a. During shearing the atom
positions are shown in Figures 4.6b and 4.6c. The maximum energy barrier in this system is
found to be 142 mJ/m2
(shown in Figure 4.6d). The dislocations need to glide a distance ‘a’ in
the [100] direction to preserve the same stacking sequence. After a glide of a distance a/2[100],
the in plane Ni and in plane Ti reach the shortest near neighbor distance, which is shown in
Figure 4.6b. This point corresponds to ‘unstable fault energy’. After a sliding distance of a/4
( / [100] 0.25xu a ) and a distance of 3a/4 ( / [100] 0.75xu a ) (antiphase of a/4
( / [100] 0.25xu a )), the atomic positions of the first shear layer (shown by green box in Figure
4.6c) are different, which results in an unsymmetrical shape for the GSFE. Specifically, for the
/ [100] 0.75xu a case (Figure 4.6c) the Ni atoms are positioned over other nickel atoms (near
neighbors) which raises the energy levels. On the other hand, at / [100] 0.25xu a the Ni atoms
are positioned over Ti atoms in the next layer and the corresponding energy level is lower.
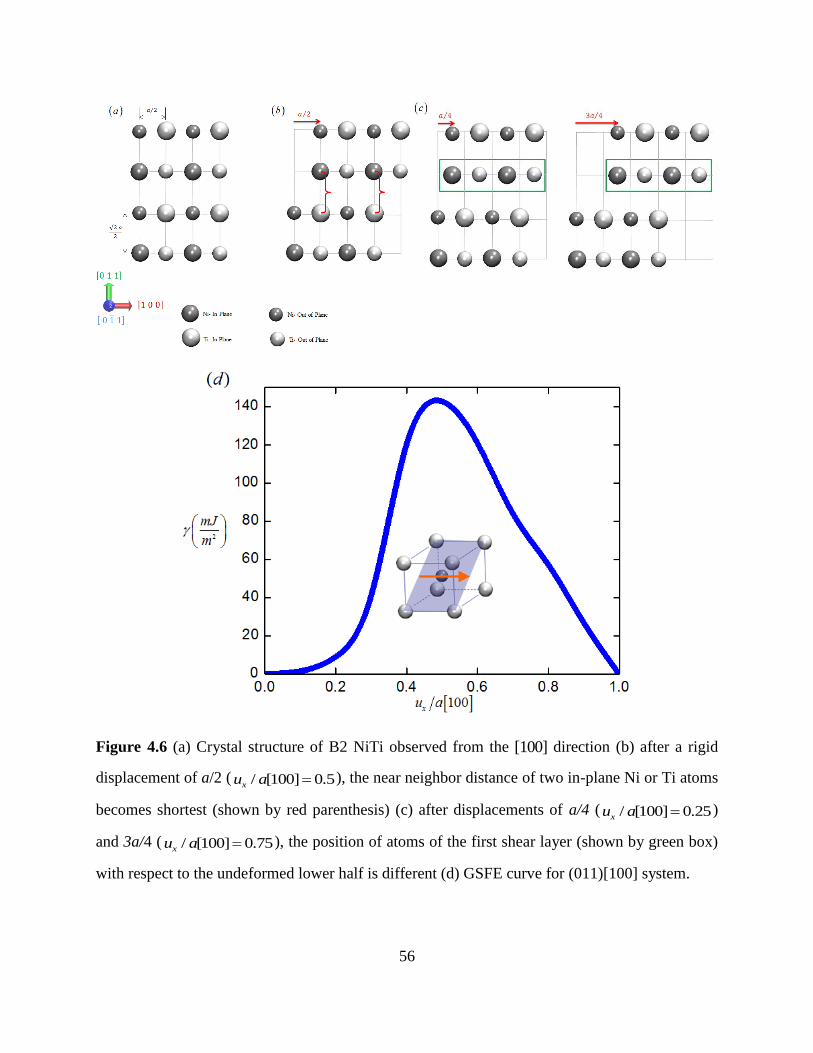
56
Figure 4.6 (a) Crystal structure of B2 NiTi observed from the [100] direction (b) after a rigid
displacement of a/2 ( / [100] 0.5xu a ), the near neighbor distance of two in-plane Ni or Ti atoms
becomes shortest (shown by red parenthesis) (c) after displacements of a/4 ( / [100] 0.25xu a )
and 3a/4 ( / [100] 0.75xu a ), the position of atoms of the first shear layer (shown by green box)
with respect to the undeformed lower half is different (d) GSFE curve for (011)[100] system.

57
4.5.2 The (011)[111] Case
The energetics of (011)[1 11] slip system is calculated and shown in Figure 4.7. We
reported the occurrence of slip in this system in this study in Figure 4.5b. The stacking sequence
is ABAB….. where the cell repeats every two planes in the [111] direction. In Figure 4.7a, we
show all the atoms and designate the furthest out of plane layer as (6) and the layer on the plane
of the paper as in-plane (1). Atoms between layers 1 and 6 are shown with various diameters to
indicate their position with respect to layers 1 and 6. The atom positions at
3 / 3 ( / [111] 0.33) xa u a and 2 3 / 3 ( / [1 1 1] 0.67) xa u a are shown in Figures 4.7b and
4.7c respectively. During sliding of the upper block of atoms relative to the lower half, the fault
energy curve follows the typical antiphase boundary (APB) energy profile and is symmetric at
the midpoint, / [1 1 1] 0.5 xu a (shown in Figure 4.7d). The fault energy reaches a maximum
(660 mJ/m2) after a sliding distance 3 / 3 ( / [11 1] 0.33) xa u a (shown in Figure 4.7d) and
2 3 / 3 ( / [1 1 1] 0.67) xa u a . At this position, near neighbor distances of two similar atoms (Ni
or Ti) become the shortest. At 3 / 2 ( / [111] 0.5) xa u a , a slightly lower peak of 515 mJ/m2
is
observed where the near neighbor distance of two dissimilar atoms becomes the shortest.

58
(a) (b) (c)
(d)
Figure 4.7 (a) Crystal structure of B2 NiTi observed from the [211] direction. Stacking
sequence in the [011] direction is shown as ABAB. (b) after a rigid displacement of
3 / 3 ( / [111] 0.33) xa u a , near neighbor distance of two out of plane Ni or Ti atoms
becomes shortest (shown by green parenthesis). (c) after a displacement of
3 / 2 ( / [11 1] 0.5) xa u a , near neighbor distance of out of plane Ni (Ti) and Ti (Ni) atoms
becomes shortest (shown by red parenthesis), and the anti-phase boundary induced by slip alters
the stacking of Ni and Ti atoms). (d) GSFE curve for the (011)[1 11]system.

59
4.5.3 The (011)[011] Case
The (011)[011] system has been analyzed and the atom positions and the GSFE curve
are shown in Figure 4.8. In the B2 structure, Ni and Ti atoms are periodically arranged (stacking
sequence is ABAB…. as shown in Figure 4.8a). Therefore, dislocations need to glide a distance
2a in [011]direction to obtain the same stacking sequence. After a glide of a distance 2 2a / ,
the Ni or Ti atoms reach the shortest near neighbor distance shown in Figure 4.8b. The maximum
barrier energy in this system is found very high to be 1545 mJ/m2 (shown in Figure 4.8c). Based
on these results, (011)[011] slip can occur at very high stress levels as we discuss later.
(a) (b)
(c)
Figure 4. 8 (a) Crystal structure of B2 NiTi observed from the [100] direction (b) after a rigid
displacement of 2 / 2 ( / | [011] |= 0.5)xa u a , the near neighbor distance of two in-plane Ni or
Ti atoms becomes shortest (shown by red parenthesis) (c) GSFE curve for system (011)[011] .

60
4.5.4 The (211)[111] Case
The (211)[111] is a possible slip system in body centered cubic metals. The GSFE curve
for the (211) plane in the [111] direction is calculated by shearing the (211) top half elastic
space relative to the bottom in the [111] direction, as shown in Figure 4.9a. The viewing
direction is [011] . The GSFE in this system is plotted in Figure 4.9d. The plot reveals two
distinct features for this system (i) there is a meta-stable position at the midpoint of a
displacement of 3 / 2 ( / [11 1] 0.5) xa u a (ii) the energy barriers for dislocation glide in [111]
and in [1 1 1] directions are unequal. The maximum energy barrier is calculated to be 847 mJ/m2
at position / [1 1 1] 0.33 xu a . At this position the near neighbor distance between two Ni or Ti
atoms becomes the shortest. A meta-stable position is observed at / [1 1 1] 0.5 xu a , which
lowers the energy by 155 mJ/m2
to 692 mJ/m2. A second peak is observed at / [1 1 1] 0.67 xu a
with 795 mJ/m2.

61
(a) (b)
(c) (d)
Figure 4.9 (a) Crystal structure of B2 NiTi observed from the [011] direction. The stacking
sequence is ABCDEFA, where the cell repeats every 6 planes in the [211] direction, the dashed
line denotes the slip plane (b) after a rigid displacement of 3 / 3 ( / [11 1] 0.33) xa u a , near
neighbor distance of two in-plane Ni or Ti atoms is shortest (shown by red parenthesis) (c) after
a rigid displacement of 2 3 / 3 ( / [11 1] 0.67) xa u a , near neighbor distance of in-plane Ni and

62
out of plane Ti atoms is largest (shown by red parenthesis). (d) GSFE curve for the (211)[111]
system.
4.5.5 The (001)[010] Case
Another possible slip system for the body centered cubic structure is (001)[010] and is
also investigated for B2 NiTi. In the B2 structure, Ni and Ti atoms are symmetrically arranged in
the [001] and [010] direction, which is shown in Figure 4.10a. During shearing in this system, in
plane Ni and out of plane Ti atoms get nearer only at a position a/2 ( ) (shown
in Figure 4.10b). The GSFE curve shown in Figure 4.10c exhibits only one peak pointing out this
position. The maximum energy barrier for atoms to glide in (001) in [100] direction is calculated
to be 863 mJ/m2.
(a) (b) (c)
Figure 4.10 (a) Crystal structure of B2 NiTi observed from the [100] direction (b) after a rigid
displacement of a/2 ( / |[010]| 0.5xu a ), near neighbor distance of in-plane Ni and out-of-plane
Ti atoms becomes shortest (shown by red parenthesis). (c) GSFE curve for the (001)[010] system.
4.6 Analysis and Discussion of Results
The importance of slip in influencing the shape memory alloy characteristics is well
known and further illustrated based on the TEM images given in Figures 4.3 and 4.5. The
/ |[010]| 0.5xu a

63
observation of (011)[1 11] slip in Figure 4.3b is particularly noteworthy (and first to our
knowledge).
Although some of the shape memory materials have high theoretical transformation
strains such as the Cu- based alloys [77] and Fe-based alloys [78, 79], their performance have not
been as favorable because of the occurrence of plastic deformation. The NiTi alloys have been
widely accepted as having superior performance characteristics because of their inherent
resistance to slip. The present work explains the origins of the high resistance to slip in NiTi
alloys. In B2 NiTi, slip systems such as (211)[111] or (011)[100]have significantly higher fault
barrier energy as compared to the (011)[100] and (011)[1 11] systems. Thus, in B2 NiTi,
dislocation glide is more likely in the (011)[100]and (011)[1 11] systems.
The [111] dislocation can dissociate into partial dislocations with smaller Burgers
vectors. According to the Frank’s energy criteria, a [1 11]a dislocation can dissociate into two
[1 11]2
a partial dislocations.
[111] [111] + [111] (1)2 2
a a
a
This kind of dissociation has been reported for FeAl or CuZn [80]. In the ordered NiTi, an
energy well is present in the (011)[1 11] GSFE curve at / [1 1 1] 0.5 xu a (Figure 4.7(d))
confirming the presence of an APB. Hence, dislocations present in (011)[1 11] system can
dissociate into partial dislocations with a stable equilibrium distance. We note that the separation
distance would be rather small in view of the high APB energy and the resolved stress required
would need to be rather high to move these dislocations.
The [111] dislocations can decompose into perfect dislocations on the (011) plane.
Hence, as illustrated in Figure 4.11, a [1 11]a dislocation dissociates according to (2). In Figure
11, 2 3b , b represent the dissociated dislocations.

64
1 2 3
[111] [100] + [011] (2)
a a a
b b b +
The 3b dislocation may further decompose to yield additional <100> type perfect dislocations
[011] [010] + [001] (3)a a a
Based on the simple Frank's rule, there is no change in elastic energy associated with (2)
and (3) as noted first by Nabarro [81]. And, a resolved stress that acts favorably on the [100]a
can move this dislocation independently of others. This is particularly true in view of the lower
GSFE magnitudes for the [001] a case. Therefore, the [111] or even [011] dislocations could
exist in the crystal, but they do not dominate the dislocation slip process because they decompose,
under sufficient stress, to yield <100> dislocations.
Figure 4.11 Decomposition of [111] slip (1b ) along [011] (
3b ) and [100] (2b ) directions. The
slip plane shown is (011). Ni atoms are denoted by the dark shading in this schematic.
In the case of austenitic NiTi, <111> or <100> slip are identified as noted in Figure 4.3.
Two factors are noteworthy. The first is that the B2 NiTi maintains a strong directionality in its
Ni-Ni, Ti-Ti and Ni-Ti bonds; hence, a covalent bonding nature is observed in its deformation
characteristics [82].This covalent nature influences the energy levels observed during the entire
simulations. The second factor is that the interplanar distance between {112} plane is measured
to be 1.23 Å, whereas between {011}, this is calculated to be 2.13 Å. Shearing of covalent bonds

65
with smaller interplanar distance requires higher stresses and is manifested by a higher maximum
fault energy.
The magnitude of maximum fault energy indicates the most energetically favorable
system for dislocation nucleation[83, 84] and the slope of the GSFE curve equivalently measures
the slip nucleation stress as follows, [85, 86]. Hence, in a cubic system,
with a single family of slip systems, the maximum energy barrier and ideal slip nucleation stress
has a one to one correlation with each other and unstable stacking fault energy us can be utilized
to point out the active slip systems. In the case of a cubic system with multiple slip systems, the
slip vector needs to be accounted for the calculation of ideal stress as well. The results shown in
Table 4.1 utilize both the
usvalues and the corresponding Burgers vector for different slip
systems in calculation of ideal stress. Also, we note that ideal slip nucleation stress calculated
from the GSFE of particular system accounts the anisotropy of system and a measure without
any continuum approximation. However, ideal nucleation stress differs from actual since energy
associated with creation of surface during dislocation emission and effects related to
reconstruction of the dislocation core are neglected which contributes to actual Peierls stress.
These approximations may affect the exact number, but we expect the qualitative picture to
remain the same.
Table 4.1 Maximum fault energy, shear modulus and elastic energy in different possible slip
systems in B2 NiTi. The fault energy (computational) tolerance is less than 0.17 mJ/m2.
Slip Plane Burgers Vector
b
Maximum fault
energy (mJ/m2)
(011)
[100] 142
(011) [111] 660
(011) [011]
1545
(211) [111] 847
(100) [010] 863
max( ) /SLIP ideal xu

66
It is important to point that the unstable stacking fault energy for the (011)[100] is 142
mJ/m2 which is significantly lower than for pure metals and B19' martensite [76]. Consequently,
slip in the B2 system is favored compared to martensite (B19') slip as noted in Figures 4.3a and
4.3b and Figures 4.5. The (011)[100] system will be activated at 2.6 GPa and the (011)[1 11]
system is expected to be activated at ideal stresses exceeding 5 GPa (Table 4.2). These levels
represent ideal stresses and in experiments, local stresses in the vicinity of martensites [87], or
near precipitates can be significant in mediating dislocation slip plasticity. In the analysis of
Norfleet, the most stressed slip systems upon stress-induced transformation exceeded 2500 MPa,
triggering local slip in austenite [56]. Also, experiments on nanopillars confirm that plastic
deformation initiated in austenite at stress levels exceeding 2.5 GPa [88].
Table 4.2 Slip elements in B2 NiTi. The calculated (ideal) critical stress for slip is given in the
last column. The critical stress tolerance is less than 2.25 MPa.
Slip Plane Slip Direction
max
( )shear idealxu
(MPa)
(011)
[100] 2667
(011) [111] 5561
(011) [011]
12847
(211) [111] 7430
(100) [010] 9320
Returning to the GSFE of the (211)[111] system, as noted earlier, the energetic barrier
for dislocation glide is higher than for (011)[1 11] or (011)[100] . Hence, in B2 NiTi, dislocation
glide in this system is possible only when the Schmid factor associated with internal stresses
provides a large contribution. A metastable position is observed at / [1 1 1] 0.5 xu a in this
system. However, to nucleate any [1 1 1]2
a
superpartial, the atoms have to overcome an energy
barrier of 847 mJ/m2 with a shear of 2.12. However, the energetic profile of (211)[111] is

67
important since twinning glide can occur in this system. A perfect [111] dislocation can
dissociate into three [1 1 1]3
a
super partials that glide in three consecutive planes and generate a
three layer twin [54, 89]. The energy barrier during (112) twinning has recently been calculated
[90].
The study sheds light into whether to- and -fro APB dragging can be a possible
mechanism for shape memory. The concept is intriguing, under stress or temperature changes,
the (011)[1 11] dislocation motion could undergo reversible motion. Such a mechanism could
potentially explain cases where the material undergoes nearly complete recovery despite the
presence of dislocations in the micrographs. We note the need for further research in this
particular area.
4.7 Summary
Further advances towards a quantitative understanding of slip in austenitic NiTi have
been achieved. The results explain, in light of the generalized stacking fault energy curves
(GSFE), why mainly (011)[100] and (011)[1 11] systems are observed in experiments, and we
provide a rationale for slip resistance in NiTi austenite with our predictions.
As shown in Table 4.2, the magnitude of ideal stress required for dislocation slip is
determined to exceed 2 GPa. The reversible transformation can occur without dislocation build
up provided that transformation stress magnitudes are limited levels less than that to activate slip.
This is indeed the case for the NiTi alloys; and further improvement of slip resistance is
important because the TEM evidence points to activation of slip in pseudoelastic and shape
memory cases. The present results emphasize the importance of understanding of the atomic
displacements and metastable positions (APBs) in most important slip systems. Overall, the
study represents a methodology for consideration of a better understanding of shape memory
alloys.

68
Chapter 5 Dislocation Slip Stress Prediction in Shape
Memory Alloys
[The material in this chapter is published as J. Wang, H. Sehitoglu, H.J.Maier,
International Journal of Plasticity, 2013].
5.1 Abstract
We provide an extended Peierls-Nabarro (P-N) formulation with a sinusoidal series
representation of generalized stacking fault energy (GSFE) to establish flow stress in a Ni2FeGa
shape memory alloy. The resultant martensite structure in Ni2FeGa is L10 tetragonal. The
atomistic simulations allowed determination of the GSFE landscapes for the (111) slip plane and
1[1 01]
2,
1[1 10]
2,1
[2 11]6
and 1
[11 2]6
slip vectors. The energy barriers in the (111) plane were
associated with superlattice intrinsic stacking faults, complex stacking faults and anti-phase
boundaries. The smallest energy barrier was determined as 168 mJ/m2 corresponding to a Peierls
stress of 1.1 GPa for the 1
[11 2](111)6
slip system. Experiments on single crystals of Ni2FeGa
were conducted under tension where the specimen underwent austenite to martensite
transformation followed by elasto-plastic martensite deformation. The experimentally
determined martensite slip stress (0.75 GPa) was much closer to the P-N stress predictions (1.1
GPa) compared to the theoretical slip stress levels (3.65 GPa). The evidence of dislocation slip in
Ni2FeGa martensite was also identified with transformation electron microscopy observations.
We also investigated dislocation slip in several important shape memory alloys and predicted
Peierls stresses in Ni2FeGa, NiTi, Co2NiGa, Co2NiAl, CuZn and Ni2TiHf austenite in excellent
agreement with experiments.
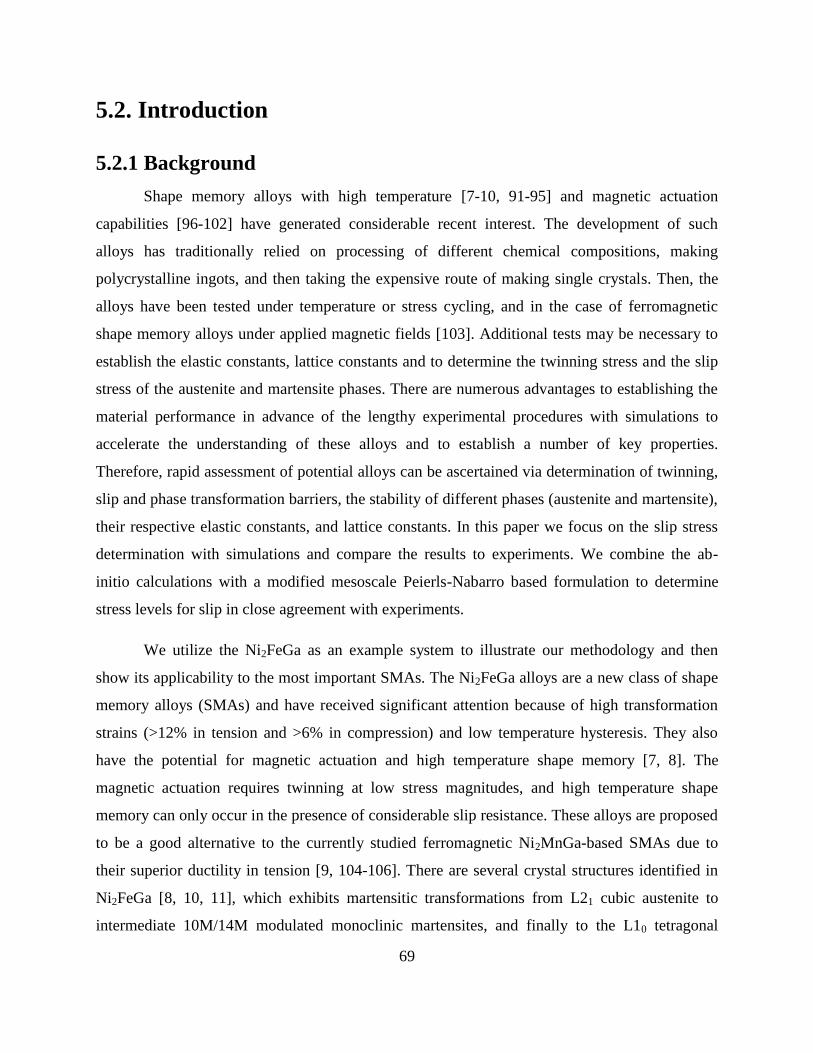
69
5.2. Introduction
5.2.1 Background
Shape memory alloys with high temperature [7-10, 91-95] and magnetic actuation
capabilities [96-102] have generated considerable recent interest. The development of such
alloys has traditionally relied on processing of different chemical compositions, making
polycrystalline ingots, and then taking the expensive route of making single crystals. Then, the
alloys have been tested under temperature or stress cycling, and in the case of ferromagnetic
shape memory alloys under applied magnetic fields [103]. Additional tests may be necessary to
establish the elastic constants, lattice constants and to determine the twinning stress and the slip
stress of the austenite and martensite phases. There are numerous advantages to establishing the
material performance in advance of the lengthy experimental procedures with simulations to
accelerate the understanding of these alloys and to establish a number of key properties.
Therefore, rapid assessment of potential alloys can be ascertained via determination of twinning,
slip and phase transformation barriers, the stability of different phases (austenite and martensite),
their respective elastic constants, and lattice constants. In this paper we focus on the slip stress
determination with simulations and compare the results to experiments. We combine the ab-
initio calculations with a modified mesoscale Peierls-Nabarro based formulation to determine
stress levels for slip in close agreement with experiments.
We utilize the Ni2FeGa as an example system to illustrate our methodology and then
show its applicability to the most important SMAs. The Ni2FeGa alloys are a new class of shape
memory alloys (SMAs) and have received significant attention because of high transformation
strains (>12% in tension and >6% in compression) and low temperature hysteresis. They also
have the potential for magnetic actuation and high temperature shape memory [7, 8]. The
magnetic actuation requires twinning at low stress magnitudes, and high temperature shape
memory can only occur in the presence of considerable slip resistance. These alloys are proposed
to be a good alternative to the currently studied ferromagnetic Ni2MnGa-based SMAs due to
their superior ductility in tension [9, 104-106]. There are several crystal structures identified in
Ni2FeGa [8, 10, 11], which exhibits martensitic transformations from L21 cubic austenite to
intermediate 10M/14M modulated monoclinic martensites, and finally to the L10 tetragonal

70
martensite [9, 12-14]. However, one can get a single stage transformation from L21 to L10 as
temperature is increased [8], also in the case of nano-pillars [107], and upon aging treatment
[108]. Therefore, a study on the L10 martensite is both scientifically interesting and
technologically relevant. The phase transformation of Ni2FeGa has been experimentally
observed and theoretically investigated using atomistic simulations [10, 14, 15, 109, 110]. The
results show that the L21 austenite requires much high stress levels for dislocation slip while
undergoing transformation nucleation at much lower stress magnitudes [15]. However, the
plastic deformation of L10 martensite via dislocation slip has not been fully understood, although
it is very important in understanding the shape memory performance.
Figure 5.1 shows a schematic of the stress-strain curve of Ni2FeGa at temperatures in the
range 75° C to 300°C where L21 can directly transform to L10. These temperatures are
significantly above the austenite finish temperature. The initial phase of Ni2FeGa is L21 and it
transforms to L10 when the stress level reaches the transformation stress. The transformation
occurs at a near plateau stress followed by elastic deformation of martensite. With further
deformation, dislocation slip (of L10) takes place at a critical stress designated as slipσ . This
stress is much higher than the transformation stress. During unloading, the reverse phase
transformation occurs with plastic (residual) strain remaining in Ni2FeGa as part of the
deformation cannot be recovered.
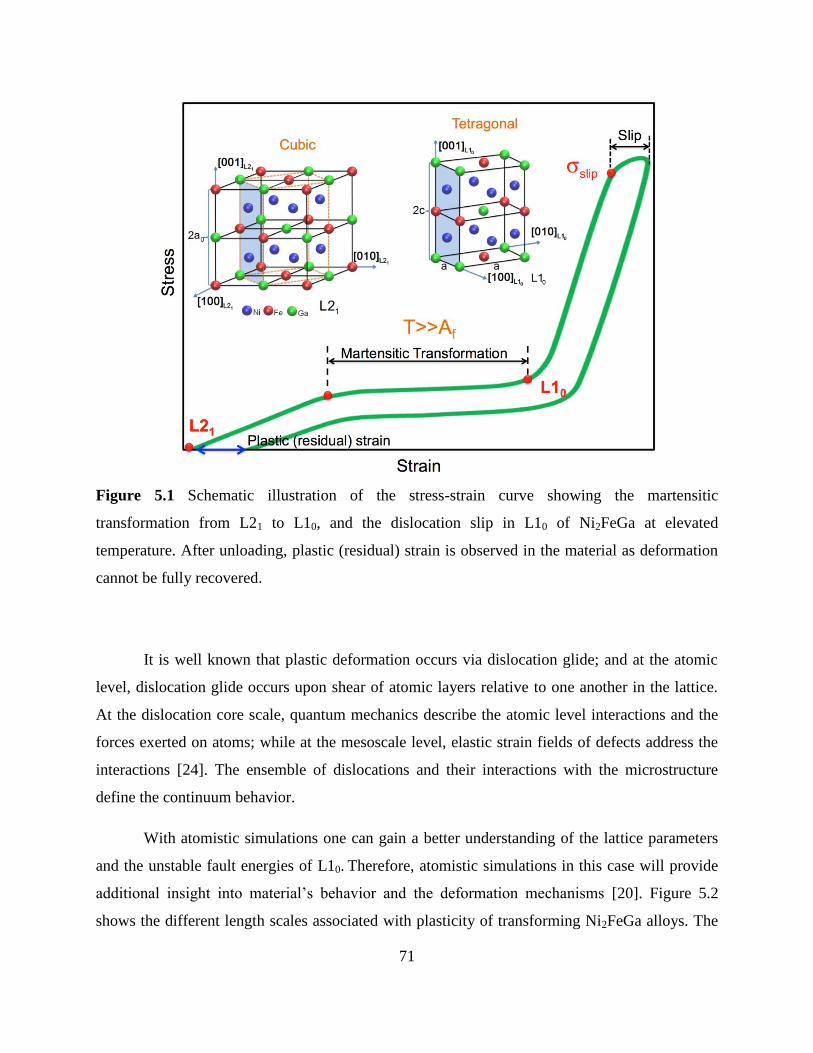
71
Figure 5.1 Schematic illustration of the stress-strain curve showing the martensitic
transformation from L21 to L10, and the dislocation slip in L10 of Ni2FeGa at elevated
temperature. After unloading, plastic (residual) strain is observed in the material as deformation
cannot be fully recovered.
It is well known that plastic deformation occurs via dislocation glide; and at the atomic
level, dislocation glide occurs upon shear of atomic layers relative to one another in the lattice.
At the dislocation core scale, quantum mechanics describe the atomic level interactions and the
forces exerted on atoms; while at the mesoscale level, elastic strain fields of defects address the
interactions [24]. The ensemble of dislocations and their interactions with the microstructure
define the continuum behavior.
With atomistic simulations one can gain a better understanding of the lattice parameters
and the unstable fault energies of L10. Therefore, atomistic simulations in this case will provide
additional insight into material’s behavior and the deformation mechanisms [20]. Figure 5.2
shows the different length scales associated with plasticity of transforming Ni2FeGa alloys. The

72
generalized stacking fault energy (GSFE) surface ( -surface) at the atomic level (via atomistic
simulations using density functional theory (DFT)) is shown at the lowest length scale. Of
particular interest is the (111) plane, and from the entire -surface the propensity of slip in
multiple directions can be established. The energy landscape for slip that is calculated is rather
complex for the case of ordered shape memory alloys resulting in complex faults and anti-phase
boundaries.
In the material science and meso-continuum mechanics field, coupling the various length
scales involved in order to understand the plastic deformation still remains a major challenge
[23]. The Peierls-Nabarro (P-N) model represents a mesoscale level integration of atomistic and
elasticity theory considerations. It accounts for the dislocation cores on one hand and lattice
resistance to flow by applying continuum concepts to elastic deformation at atomic scale [24].
The model has stood the test of time over many years, and its main contribution is that the P-N
stress level for dislocation glide are much lower than ideal stress calculations [27-30]. The
calculations for P-N stress represent the breakaway of atoms within the core region of the
dislocation. If the core is narrow the stress required to overcome the barrier is higher compared
to the case of a wider core, and smaller Burgers vectors require lower stress for glide. Different
slip systems in fcc, bcc and ordered crystals can be evaluated, and the most favorable planes and
directions can be readily identified. Thus, the P-N model predicts stresses for dislocation slip
more precisely than the theoretical shear strength obtained directly from atomistic simulations.
In this study, the P-N model with modifications will be utilized to study the slip
resistance. In Figure 5.2, the disregistry above and below the slip plane is shown which will be
explained later in the paper. This results in a solution for the slip distribution (disregistry) within
the core that exhibits a non-monotonic variation as a function of core position. We have made
observations of slip during experiments in this paper and also in pseudoelasticity experiments at
constant temperature. The dislocation slip was identified upon heating-cooling within the TEM
via in-situ observations. Finally, we compared the calculated slip stresses with experimental
measurements of slip stress under compression loading to strain exceeding 6%. The agreement is
excellent considering the complexity of real microstructures and the idealizations adopted in
theoretical models.

73
The occurrence of dislocation slip is noted at macro-scale by observing non-closure of
the strain-temperature curves in Figure 5.2. For example, upon cooling the austenite reverts to
martensite and upon heating the reverse transformation occurs. If the entire process is reversible,
the transformation strain in forward and reverse directions is identical. If plastic deformation
develops, there is a residual strain upon heating to austenite. We are not attempting to predict the
entire strain-temperature response at the continuum level (shown in Figure 5.2) because multiple
slip-twin systems and multi-phase interactions are governing. Our purpose is to point out the
complexity of an isolated mechanism, mainly the dislocation glide behavior that contributes to
the irreversibility.
Figure 5.2 Schematic description of the different length scales associated with plasticity in
Ni2FeGa alloys.
5.2.2 Dislocation Slip Mechanism
So far, the investigation of L10 Ni2FeGa martensite has been mostly through experimental
research. Its properties are not well understood although it is very important to establish its
dislocation slip behavior. The L10 Ni2FeGa has a tetragonal structure with no modulation [9, 12].
The modulation refers to the internally sheared crystal structures with periodic displacements. As
a fundamental deformation mechanism, dislocation slip plays a critical role in defining the
mechanical properties of SMAs, especially their irreversibility of transformation [15, 111, 112].
74
It is likely that the material can exhibit different dislocation slip modes (planes and directions),
which are activated at different stress levels. To quantitatively understand the experimentally
observed dislocation slip, a detailed study via atomistic simulations is needed to determine active
slip systems and compare with experimental findings. It is possible to investigate the dislocation
slip via generalized stacking fault energy (GSFE) curves. GSFE is the interplanar potential
energy determined by rigidly sliding one half of a crystal over the other half [27, 113]. It was
first introduced by Vitek [72] and is a comprehensive definition of the fault energy associated
with dislocation motion [15]. By taking the maximum slope of the GSFE curve, the theoretical
shear strength of the lattice along the slip direction is obtained. This stress is the upper bound on
the flow stress of materials [28, 114] and is a much larger value compared to the experiments.
The Peierls-Nabarro (P-N) model is essentially based on continuum mechanics applied to
lower length scales and addresses the dislocation structure by applying the elasticity theory and
energetics from atomistic simulations. This model calculates stresses for dislocation slip more
precisely. The corresponding Peierls stress p is the minimum external stress required to move a
dislocation irreversibly through a crystal and can be considered as the critical resolved shear
stress at 0 K [115-117]. The slip system with lowest pwill be the dominant system in the crystal
[113, 118, 119]. Recently, there has been renewed interest in calculating Peierls stress of
dislocation by applying the P-N model [113, 120]. This is motivated by the advance of reliable
first-principles calculations using DFT to determine the GSFE ( energy) landscapes. However,
when the GSFE curve comprises of multiple minima corresponding to various fault
configurations, it cannot be approximated well by a single sinusoidal function as used in the
original P-N model. Therefore, the representation of the P-N model needs to be modified to
consider this complexity, which is described in detail in this study and applied for the dislocation
slip calculations in L10 Ni2FeGa.
5.2.3 Purpose and Scope
A fundamental understanding of the dislocation slip that plays a key role in the shape
memory behavior of L10 Ni2FeGa is currently lacking, which is essential for understanding the
75
mechanical response. Four possible slip systems in L10 martensite, 1
<1 01](111), 2
1<1 10](111),
2
1< 211](111)
6and
1<11 2](111)
6 are considered in Ni2FeGa. Three related types
of planar defects, superlattice intrinsic stacking fault (SISF), complex stacking fault (CSF) and
anti-phase boundary (APB), are analyzed. We note that due to the tetragonality of the L10 lattice
of Ni2FeGa, the dislocation behavior of 1
[11 2]6
is different from 1
[2 11]6
(similarly, 1
[1 01]2
is
different from1
[1 10]2
), which results in different energy levels as reported in section 3.2. Thus,
in this paper the Miller indices with mixed parentheses <uvw] and {hkl) are used in order to
differentiate the first two equivalent indices (corresponding to the a and b axis in the L10 lattice)
from the third (corresponding to the tetragonal c axis), which indicate that all permutations of the
first two indices are allowed, whereas the third one is fixed [121]. The purpose of this paper is to
investigate the possible slip systems existing in L10 Ni2FeGa, and to determine the most likely
one by calculating the Peierls stresses and compare it with experimental observations. The results
indicate that the mobility of the 1
[11 2]6
partial dislocation in the slip plane (111) is controlling
the plasticity of L10 Ni2FeGa.
5.3 DFT Calculation Setup
We utilized DFT to precisely determine the undeformed and deformed energy states of
L10 Ni2FeGa during shearing in certain slip systems. The first-principles total-energy
calculations were carried out using the Vienna ab initio Simulations Package (VASP) with the
projector augmented wave (PAW) method and the generalized gradient approximation (GGA)
[25, 26]. Monkhorst Pack 9×9×9 k-point meshes were used for the Brillouin-zone integration to
ensure the convergence of results. An energy cut-off of 500 eV was used for the plane-wave
basis set. The total energy was converged to less than 10-5
eV per atom. We have used an n-
layer based cell to calculate fault energies to generate GSFE curves in the different slip systems.
We assessed the convergence of the GSFE energies with respect to increasing n, which indicates

76
that the fault energy interaction in adjacent cells due to periodic boundary conditions will be
negligible. The convergence is ensured once the energy calculations for n and n+1 layers yield
the same GSFE. In the present work, n was taken as 10 in order to obtain the convergent results.
For each shear displacement u, a full internal atom relaxation, including perpendicular and
parallel directions to the fault plane, was allowed for minimizing the short-range interaction
between misfitted layers near to the fault plane. This relaxation process caused a small additional
atomic displacement r ( x y zr = r + r + r ) in magnitude within 1% of the Burgers vector b. Thus,
the total fault displacement is not exactly equal to u but involves additional r. The total energy of
the deformed (faulted) crystal was minimized during this relaxation process through which atoms
can avoid coming too close to each other during shear [85, 122, 123]. From the calculation
results of dislocation slip, we note that the energy barrier after full relaxation was near 10%
lower than the barrier where the relaxation of only perpendicular to the fault plane was allowed.
5.4 Simulation Results and Discussion
5.4.1 The L10 Crystal Structure
We note that two different unit cells are used in literature to describe the L10 crystal
structure. One is directly derived from the L21 body centered cubic (bcc) axes forming a body
centered tetragonal (bct) structure (Figure 5.3a); the other one is constructed from the principal
axes of L10 forming the face centered tetragonal (fct) structure (shown in brown dashed lines in
Figure 5.3a). We note that if 2c = 2a , Figure 3a represents the L21 cubic structure; while if
2c 2a , it is the L10 tetragonal structure. In this paper, the L10 fct structure is considered and
its corresponding lattice parameters are shown in Figure 5.3b. Note that the tetragonal axis is 2c,
so the L10 unit cell contains two fct unit cells.

77
(a) (b)
Figure 5.3 L10 unit cell of Ni2FeGa. (a) The body centered tetragonal (bct) structure of L10 is
constructed from eight bct unit cells and has lattice parameters 2a , 2a and 2c. The blue, red
and green atoms correspond to Ni, Fe and Ga atoms, respectively. The Fe and Ga atoms are
located at corners and Ni atoms are at the center. The fct structure shown in brown dashed lines
is constructed from the principal axes of L10. (b) The fct structure of L10 with lattice parameters
a, a and 2c contains two fct unit cells.
The lattice parameter of L21 cubic was calculated as 2ao= 5.755 Å in our previous study
[15]. During the martensitic transformation from L21 cubic to L10 tetragonal in Ni2FeGa, the unit
cell volume can be changed since the material is always energetically more stable with lower
energy level. For a certain unit cell volume of L10 tetragonal, there are many combinations of
parameters c and a (or tetragonal ratio c/a), and one of these ratios yields the structure with the
minimum energy level. To compute the unit cell volume change ΔV during the martensitic
transformation, we considered a series of values 0ΔV / V (-3% to 3%), where V0 is the L21 unit
cell volume as the reference. For any 0ΔV / V , we changed the tetragonal ratio c/a from 0.55 to
1.1 and found that the minimum crystal structural energy almost always remains at a c/a ratio of
0.95. The crystal structural energy as a function of c/a in varying 0ΔV / V was calculated and

78
shown in Figure 5.4a (only a part of the calculated curves for a series of 0ΔV / V is shown for
clarity). The lowest energy level among a series of 0ΔV / V was found at a
0ΔV / V of -0.76%
and the corresponding crystal structure was L10. Figure 5.4b is a high resolution plot of the red
dashed lines in (a) showing the minimum energy lever at the c/a ratio of 0.95 in the volume
change 0ΔV / V of -0.76%. This energy was lower than L21 by 12.4 meV/atom, which indicates
that the L10 is energetically more stable. The L10 lattice parameters were calculated as a=b=3.68
Å, and c=3.49 Å in Table 1 and they were in a good agreement with experimental measurements
[9]. We note that the alloy in the experiment is off stoichiometry (Ni54Fe19Ga27) [2] compared to
our simulations (Ni50Fe25Ga25), which causes the slight difference of the lattice parameters.
These precisely determined lattice parameters form the foundation of atomistic simulations in
this study. In the following section, we establish GSFE curves based on these parameters.
(a) (b)
Figure 5.4 (a) Crystal structural energy variation with tetragonal ratio c/a for a series of unit cell
volume changes 0ΔV / V , where L21 is considered as the reference volume V0. The L10
tetragonal structure was found at a c/a of 0.95 for 0ΔV / V of -0.76%. (b) High resolution plot
corresponding to the red dashed lines in (a).

79
Table 5.1 VASP-PAW-GGA calculated L10 tetragonal lattice parameters, unit cell volume
change 0ΔV / V and structural energy relative to L21 cubic in Ni2FeGa compared with
experimental data.
L10 tetragonal structure Experiment [9] Theory (this study)
Lattice parameter (Å) a 3.81 3.68
c 3.27 3.49
Volume change 0ΔV / V (%) -0.65 -0.76
Structural energy
relative to L21 (meV/atom)
_ -12.4
The dash indicates that experimental data were not available for comparison.
5.4.2 Dislocation Slip of L10 Ni2FeGa
From the classical dislocation theory, the most favorable slip systems should contain the
close-packed lattice planes and the Burgers vectors with shortest shear displacements. Thus,
dislocation slip in the L10 fct structure favors the {111} planes along close or relatively close
packed directions. The {111} planes are preferred planes as in fcc metals [121], but the favorable
dislocations in these planes are not identified. It is well known that superdislocations of the L10
structure can split into different types of partial dislocations with smaller Burgers vectors and
smaller planar fault energies [124-126]. Figure 5.5 shows a top view from the direction
perpendicular to the (111) slip plane with three-layers of atoms stacking in L10 Ni2FeGa. Four
dislocations in this plane are presented: superdislocations [1 10] , 1
[11 2]2
and [1 01], and partial
dislocations, 1
< 2 1 1 >6
. Three types of planar defects, SISF (superlattice intrinsic stacking fault),
CSF (complex stacking fault) and APB (anti-phase boundary) are marked on certain positions.
We note that due to the non-unity tetragonal ratio c/a of 0.95, the 1
[2 1 1]6
dislocation vector is
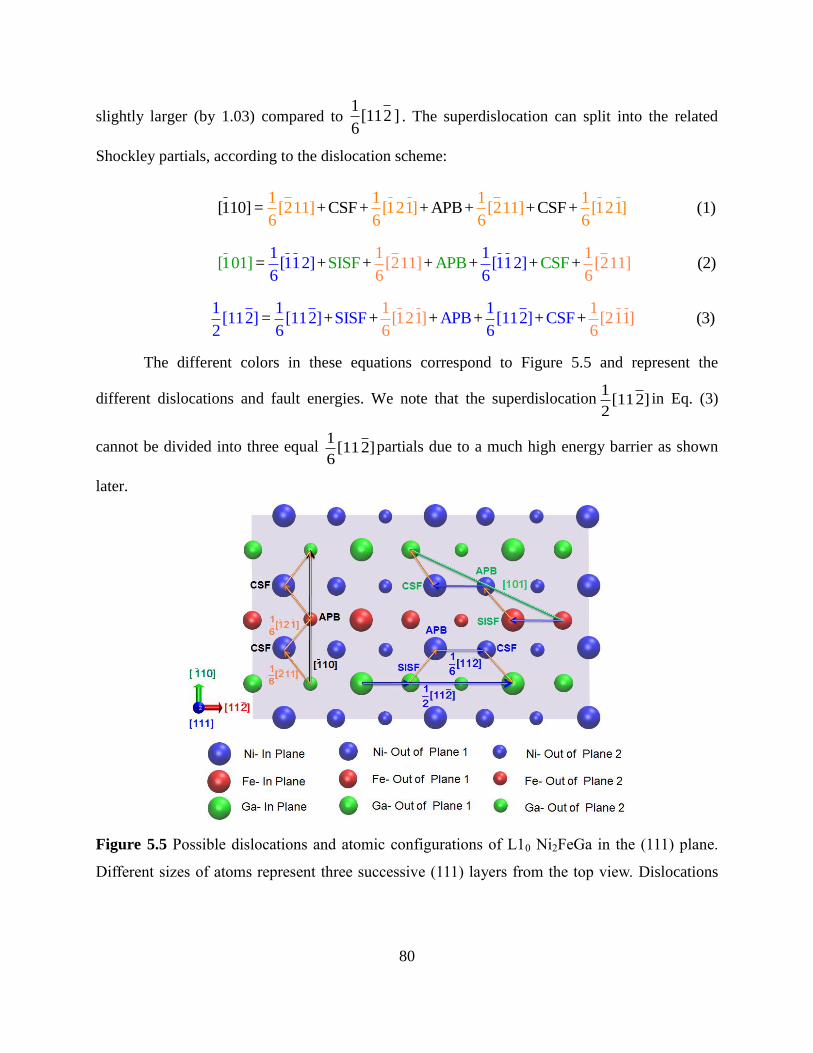
80
slightly larger (by 1.03) compared to 1
[1 1 2 ]6
. The superdislocation can split into the related
Shockley partials, according to the dislocation scheme:
1 1 1 1[2 1 1] [1 2 1] [2 1 1] [1 2 1]
6 6 6 6[1 10] = +CSF+ + APB+ +CSF+ (1)
1 1
[1 1 2] [1 1 2][1 01] SISF APB CS1 1
[2 1 1] [2 = + + + + + + 11 6
]6 6
F6
(2)
1 1 1[11 2] [11 2] SISF APB [
1 1[1 2 1] [2 1 1]
6 6= + + + + + + 11 2] CSF
2 6 6 (3)
The different colors in these equations correspond to Figure 5.5 and represent the
different dislocations and fault energies. We note that the superdislocation1
[11 2]2
in Eq. (3)
cannot be divided into three equal 1
[11 2]6
partials due to a much high energy barrier as shown
later.
Figure 5.5 Possible dislocations and atomic configurations of L10 Ni2FeGa in the (111) plane.
Different sizes of atoms represent three successive (111) layers from the top view. Dislocations

81
[1 10] ,1
[11 2]2
,[1 01] and 1
< 2 1 1 >6
are shown in different colors corresponding to Eqs. (1)-(3).
Three types of planar defects, SISF, CSF and APB are marked on certain positions.
Similar to the dislocation dissociation in fcc metals [127], it is very unlikely to dissociate
the superdislocation 1
[11 2]2
into three 1
[11 2]6
partial dislocaitons, due to the much higher enegy
barrier formed when the atoms in the same plane sliding past each other. We calculated the
GSFE curve for the superdislocation 1
[11 2]2
dissociated into three 1
[11 2]6
partial dislocations
in Figure 5.6. After shearing the displacement 1
u = [11 2]6
, a metastable structure is obtained at
point S in the curve. Similar to fcc metals [127], further shear beyond point S along the [11 2]
direction results in an unstable structure at point C (1
u = [11 2]3
). We note that this unstable
stacking fault energy (global energy barrier) is 475 mJ/m2, which is much higher than the energy
barrier of 360 mJ/m2
along the direction 1
[1 2 1]6
shown in Figure 5.13. Thus, it is impossible to
dissociate the superdislocation 1
[11 2]2
into three 1
[11 2]6
partial dislocations; instead, it will
dissociate into the combination of 1
[11 2]6
and 1
[1 2 1]6
shown in Eq. (3).

82
Figure 5. 6 GSFE curve of the superdislocation 1
[11 2]2
dissociated into three 1
[11 2]6
partial
dislocations on the (111) plane of L10 Ni2FeGa. We note that in order to move atoms at position
A to the position C along [11 2] direction, a high stress is required due to the high energy barrier
formed when atoms at A slide over atoms at B in the same plane.
The planar defects SISF, CSF and APB are defined by pure movement of one half of a
crystal over the other half in the (111) plane. The movement forms metastable positions
corresponding to local minimum energies, which govern the dislocation slip behavior of L10
Ni2FeGa. Figure 5.7 shows a schematic of the construction of SISF, CSF and APB in the (111)
plane due to atom movements along different directions. As denoted earlier, the three different
atom sizes indicate three (111) layers of atoms stacking. A SISF is produced , when the in-plane
atoms and all atoms above are shifted along the Burgers vector 1
[1 1 2 ]6
. This displacement
results in a stacking sequence where the in-plane Ga atoms lie directly above the out-of-plane Ga
atoms. A CSF is generated, when the in-plane atoms and all atoms above are shifted along the
Burgers vector 1
[1 2 1 ]6
. This displacement results in a stacking sequence where the in-plane Ga
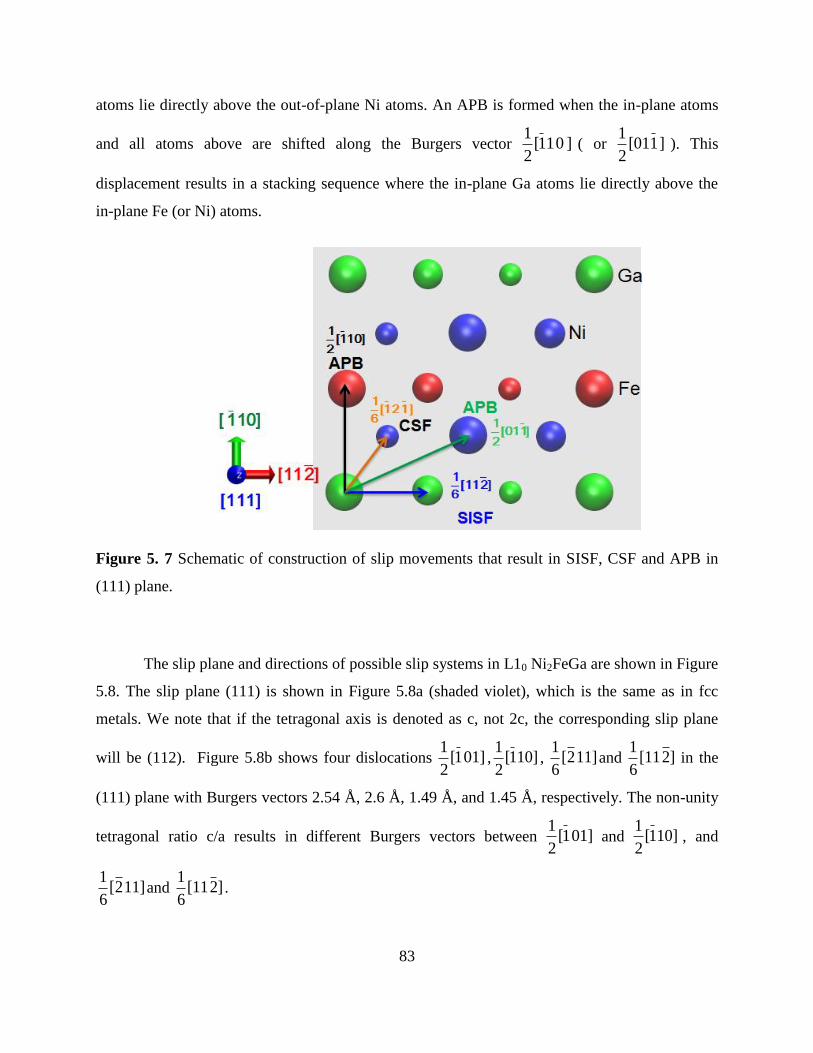
83
atoms lie directly above the out-of-plane Ni atoms. An APB is formed when the in-plane atoms
and all atoms above are shifted along the Burgers vector 1
[1 1 0 ]2
( or 1
[01 1 ]2
). This
displacement results in a stacking sequence where the in-plane Ga atoms lie directly above the
in-plane Fe (or Ni) atoms.
Figure 5. 7 Schematic of construction of slip movements that result in SISF, CSF and APB in
(111) plane.
The slip plane and directions of possible slip systems in L10 Ni2FeGa are shown in Figure
5.8. The slip plane (111) is shown in Figure 5.8a (shaded violet), which is the same as in fcc
metals. We note that if the tetragonal axis is denoted as c, not 2c, the corresponding slip plane
will be (112). Figure 5.8b shows four dislocations 1
[1 01]2
,1
[1 10]2
, 1
[2 11]6
and 1
[11 2]6
in the
(111) plane with Burgers vectors 2.54 Å, 2.6 Å, 1.49 Å, and 1.45 Å, respectively. The non-unity
tetragonal ratio c/a results in different Burgers vectors between 1
[1 01]2
and 1
[1 10]2
, and
1[2 11]
6and
1[11 2]
6.

84
(a) (b)
Figure 5. 8 Slip plane and dislocations of possible slip systems in L10 Ni2FeGa. (a) The shaded
violet area represents the slip plane (111) and (b) four dislocations1
[1 01]2
,1
[1 10]2
, 1
[2 11]6
and
1[11 2]
6are shown in the (111) plane.
The dislocation slip energy barriers and the faults (SISF, CSF and APB) are all
characterized by the GSFE curve, which is calculated while one elastic half crystal is translated
relative to the other in the slip plane along the slip direction [20]. The 1
[11 2](111)6
case of L10
Ni2FeGa is illustrated in Figure 5.9 showing the configuration of slip in the plane (111) with
dislocation 1
[11 2]6
. Figure 5.8a is the perfect L10 lattice before shear, while Figure 5.9b is the
lattice after shear by one Burgers vector, 1
u = [11 2]6
(1.45 Å), in the slip plane.
All fault energies can be computed as a function of shear displacement u and are
determined relative to the energy of the undeformed L10.

85
Figure 5. 9 Dislocation slip in the (111) plane with dislocation
1[11 2]
6 of L10 Ni2FeGa. (a) The
perfect L10 lattice observed from the [1 1 0]direction. The slip plane (111) is marked with a
brown dashed line. (b) The lattice after a rigid shear with dislocation 1
[11 2]6
, u, shown in a red
arrow.
The calculated shear displacements for the slip systems 1
[1 01](111),2
1 [1 10](111)
2,
1[2 11](111)
6 and
1[11 2](111)
6 were normalized by their respective Burgers vectors, and the
corresponding GSFE curves are shown in Figure 5.10. We note that the dislocation 1
[1 01]2
possesses the highest energy barrier of 932 mJ/m2 (APB, 316 mJ/m
2). For the other three
dislocations, the energy barriers decrease in the sequence of 1
[1 10]2
, 1
[2 11]6
and 1
[11 2]6
,
corresponding to 723 mJ/m2 (APB, 179 mJ/m
2), 360 mJ/m
2 (CSF, 273 mJ/m
2) and 168 mJ/m
2
(SISF, 85 mJ/m2), respectively.

86
Figure 5. 10 GSFE curves (initial portion for one Burgers vector only) of 1
[1 0 1]2
, 1
[1 1 0]2
,
1[2 1 1]
6 and
1[11 2]
6dislocations in the (111) plane of L10 Ni2FeGa. The calculated shear
displacement, u, was normalized by the respective Burgers vector, b.
The generalized stacking fault energy surface ( surface) describes the energy variation
when one half of a crystal is rigidly shifted over the other half with different fault vectors lying
in a given crystallographic plane. To determine the surface corresponding to the DFT derived
curves shown in Figure 5.10, we chose a fourth order cosine-sine polynomial [128], which can
appropriately represent the energy variation in the (111) plane, i.e.
m+n 4 m+n 4
m n m n
1 2 mn 1 2 m0 n0 mn 1 2
m,n=0 m,n=1
γ(k ,k ) = a X(k ) X(k ) 1- δ δ + b X(k ) Y(k ) (4) ≤ ≤
where, 1k and
2k are coefficients for fault vectors e in the (111) plane and 1 1 1 1e = k e + k e , where
1
1e = [11 2]
6 and 2
1e = [1 1 0]
2 are unit vectors along the [11 2] and [1 1 0] directions,

87
respectively. [X(x)] = [1-cos(πx)] and [Y(x)] = [sin(πx)]. ijrepresents Kronecker’s delta ( ij
is
1(0) if i is (not) equal to j). Figure 5.11a shows the surface for the (111) plane of L10 Ni2FeGa
with the x axis along the [11 2] direction, and the y axis along [1 1 0]. Figure 5.11b is a two-
dimensional projection of the surface in the (111) plane.
(a)
(b)
Figure 5. 11 (a) Generalized stacking fault energy surface ( surface) for the (111) plane in L10
Ni2FeGa. (b) A two-dimensional projection of the surface in the (111) plane. The x axis is
taken along the [11 2] direction, and y axis along [1 1 0].

88
5.4.3 Peierls-Nabarro Model for Dislocation Slip
The original P-N framework is based on a simple cubic crystal containing a dislocation
with Burgers vector b shown in Figure 5.12a. Glide of the dislocation with this Burgers vector
leaves behind a perfect crystal. This approach yields a variation in the GSFE with a periodicity
of b and thus the energy can be approximated by using a single sinusoidal function as seen
next. To calculate the Peierls stress for dislocation slip, a potential energy of displacement
associated with the dislocation movement, misfit energy s
γE (u) , must be determined. This
energy depends on the position of the dislocation line, u, within a lattice cell and reflects the
lattice periodicity, thus it is periodic [120, 129, 130] as shown in Figure 5.12b. The misfit energy
s
γE (u) across the glide plane is defined as the sum of misfit energies between pairs of atomic
planes and can be obtained from the GSFE at the local disregistry. With obtained dislocation
profiles and considering the lattice discreteness, the s
γE (u) can be expressed as follows [85] :
+s
γ
m=-
E (u) = γ(f(ma' - u))a' (5)
where a' is the periodicity of s
γE (u) and defined as the shortest distance between two equivalent
atomic rows in the direction of the dislocation’s displacement, f(x) is the disregistry function
representing the relative displacement (disregistry) of the two half crystals in the slip plane along
the x direction, and u is the position of the dislocation line [114, 131, 132].
By using the Frenkel expression [133], the γ f(x) from GSFE can be written as follows:
maxγ 2πf(x)γ f(x) = 1-cos (6)
2 b
where max is the unstable stacking fault energy for GSFE, and b is the dislocation Burgers
vector. Figure 5.12c shows a schematic of γ f(x) as a single sinusoidal function of f(x)
b.
The solution of the disregistry function f(x) in the dislocation core is assumed to be of
the Peierls type [114]:

89
b b xf(x) = + arctan (7)
2 π ζ
where h
ζ =2(1- ν)
is the half-width of the dislocation for an isotropic solid [129], h is the
interspacing between two adjacent slip planes and ν is Poisson’s ratio. Figure 5.12d shows the
normalized f(x)
bvariation with
x
ζ.
After substituting Eq. (6) and Eq. (7) into Eq. (5), we have the following formula of
s
γE (u) :
+ +
s -1maxγ
m=- m=-
γ ma'- uE (u) = γ f(ma'- u) a' = 1+cos 2tan a' (8)
2 ζ
The Peierls stress pτ is the maximum stress required to overcome the periodic barrier in
s
γE (u) and defined as the maximum slope of s
γE (u) with respect to u (shown Figure 5.11d) as
follows:
s
γ
p
dE (u)1τ = max (9)
b du

90
(a) (b)
(c) (d)
Figure 5. 12 Schematic illustration of Peierls-Nabarro model for dislocation slip. (a) A simple
cubic crystal containing a dislocation with Burgers vector b. h is the interspacing between
adjacent two slip planes. The relative displacement of the two half crystals in the slip plane along
x direction, xA- xB, is defined as the disregistry function f(x) . (b) Schematic illustration showing
the periodic misfit energy s
γE (u) as a function of the position of the dislocation line, u. The
Peierls stress pτ is defined as the maximum slope of
s
γE (u) with respect to u. (c) Schematic
showing the γ f(x) energy (GSFE curve) as a single sinusoidal function of f(x)
b. (d) Schematic
showing the normalized f(x)
bvariation with
x
ζ.

91
The Peierls stress pτ is smaller than the theoretical shear strength shear nuc
τ and predicts
experimental values more precisely. This is due to the fact that pτ is determined not only by the
energy barrier from GSFE curves, but also by the character of the dislocation slip distribution
[134]. In this study, Peierls stresses of dislocation slip in L10 Ni2FeGa were calculated based on
the above equations. However, for the slip case of superdislocations dissociated to partial
dislocations, the disregistry function f(x) in Eq. (7) needs to be modified to include these partial
dislocations with separation distances. Additionally, when the GSFE curve involves local
minimum energy locations representing stacking faults, a single sinusoidal function in Eq. (6)
cannot approximate it well and must be revised by applying multiple sinusoidal functions to fit it.
The details of these modifications are described in Section 5.4.4.
5.4.4 Peierls Stress Calculations of L10 Ni2FeGa
To determine the Peierls stresses required to move the dislocations, the misfit energies
s
γE (u) derived from GSFE curves must be calculated based on the method described in Section
5.4.3. However, for the case of GSFE curve comprising SISF, CSF and APB, the s
γE (u)
description is more complex than for simple fcc or bcc metals as a single sinusoidal function
cannot approximate the GSFE curve well. Thus, revising the misfit energy formulation
considering multiple sinusoidal functions to fit GSFE curves is necessary. For the case of the
[1 10] superdislocation dissociated into four partials with smaller Burgers vectors as given in Eq.
(1), the GSFE curve is shown in Figure 5.13.

92
Figure 5. 13 Upon shearing the superdislocation [1 10] , the dissociation into four partials and the
associated CSF and APB energies are determined. The unstable stacking fault energies
us1 us2γ = γ = 360 mJ/m2 (energy barriers); the stable stacking fault energies
s1γ = 273 mJ/m2 (CSF)
and s2γ = 179 mJ/m2 (APB).
The separations of the partial dislocations d1=0.538 nm and d2=1.85 nm are calculated
by the condition that the force due to the surface tension of stacking faults balances the mutual
repulsion of partials [15, 135-137]. The separations, d1 and d2, of partial dislocations can be
calculated using the force balance between attraction due to fault energies and elastic repulsion
of partial dislocations [135, 136]:
attraction repulsionF = F (γ) - F (K,d) = 0 (10)
This leads to the following equations for the case of superdislocation [1 10] splitting into four
partials 1
< 2 11]6
as follows:

93
CSF
1 1 2 1 2
APB CSF
2 1 2 1
1 1 1γ = K + + (11)
d d +d 2d +d
1 1 1γ - γ = K + - (12)
d d +d d
with and K/d representing the attraction and elastic repulsion force, respectively. These
equations can be solved for the separation distances giving the energy levels and the other
material constants as input. As noted earlier, 2
CSFγ = 273 mJ / m and 2
APBγ =179 mJ / m . The
factor K is given as
2μbK =
2π, where μ = 29.5 GPa (obtained from our simulations), b = 1.49 Å .
This results in 1d = 0.538 nm and 2
d =1.85 nm shown in Figure 5.14.
Figure 5. 14 Separations of partial dislocations for the superdislocation [1 10] .
The disregistry function f(x) can be described in Eq.(13) by considering the multiple
partials, and Figure 5.15 shows the normalized f(x)
bvariation with
x
ζ. In Figure 5.15, d1 and d2
are the distances between partial dislocations, and their values depend on the CSF and APB.
1 21 1 2x - 2d +dx -d x -(d +d )b x
f(x) = arctan +arctan +arctan +arctan + 2b (13)π ζ ζ ζ ζ

94
Figure 5. 15 The disregistry function f(x) for the superdislocation [1 10]dissociated into four
partials1
< 2 11]6
. The separation distances of the partial dislocations are indicated by d1 and d2.
We note that this GSFE curve does not fit a single sinusoidal relation; instead, it is
approximated by a sinusoidal series function. Thus, the corresponding misfit energy is presented
as the explicit form in Eq. (14), and Figure 5.16 shows the misfit energy s
γE (u) variation with
the lattice period a'. Two quantities s
γ a' 2E and s
γ pE in the plot are denoted. The s
γ a' 2E
represents the minimum of s
γE (u) function and provides an estimate of the core energy of
dislocations. The s
γ pE is defined as the Peierls energy, which is the amplitude of the variation
of s
γE (u) and the barrier required to move dislocations [129].

95
6 0
s s us1γ γ n
n=1 m=-
s1 s2us2
us1 s1
m=1 m=-
s1 s2us2
γ 2πf(ma' - u)E (u) = E (u) = 1-cos a'+
2 b
γ + γγ -
γ - γ 2πf(ma' - u) 2πf(ma' - u)21-cos a'+ 1-cos a'+
2 b 2 b
γ + γγ -
2πf(ma' - u21-cos
2
0us1 s1
m=- m=-
us1
m=1
γ - γ) 2πf(ma' - u)a'+ 1-cos a'+
b 2 b
γ 2πf(ma' - u)1-cos a' (14
2 b
)
Figure 5. 16 Misfit energy s
γE (u) for the superdislocation [1 10]dissociated into four partials
1< 2 11]
6.
Once the misfit energy is determined, the Peierls stress pτ can be calculated by the
maximum of
s
γdE (u)1
b du. As mentioned before, by taking the maximum slope of the GSFE curve,

96
the theoretical shear strength shear nucτ for each slip system is obtained. The corresponding shear
modulus μ can then be approximately determined as shear nucμ = 2π τ [138]. The calculated shear
modulusμ , theoretical shear strength shear nucτ and Peierls stress
pτ for the four slip systems of
L10 Ni2FeGa are shown in Table 5.2. We note that pτ is smaller than shear nuc
τ and predicts
experimental values more precisely, as described in Section 5.4.3. However, the theoretical shear
strength shear nucτ follows the trend of the Peierls stress
pτ for these four slip systems.
Table 5.2 Calculated shear modulus, theoretical shear strength and Peierls stress for dislocation
slip of L10 Ni2FeGa.
Slip
plane
Burgers
vector, b Shear modulus
(GPa)
shear nucμ = 2π τ
Theoretical Shear
Stress (GPa)
shear nuc
γτ = max
u
∂
∂
Critical Shear Stress
(theory)-This Study
(GPa) s
γ
p
E (u)1τ = max
b du
(111) 1
[1 0 1]2
61.3 9.76 5.8
(111) 1
[1 1 0]2
52.5 8.36 3.13
(111) 1
[2 1 1]6
29.5 4.7 1.26
(111) 1
[11 2]6
22.9 3.65 1.1
Combining the results of shear nucτ and
pτ , we note that the 1
[11 2]6
has the lowest stress
levels and will be most likely the first to activate. Both of the 1
[1 1 0]2
and 1
[1 0 1]2
dislocations

97
possess significantly higher shear nucτ and
pτ values than 1
[2 1 1]6
and 1
[11 2]6
, so these
superdislocations will split into 1
< 2 1 1 >6
partials and planar defects left between them as
shown in Eqs. (1) and (2). However, when the Schmid factor associated with internal shear
stresses provides a larger contribution, the glide of 1
[1 0 1]2
and 1
[1 1 0]2
superdislocations can
also be activated. Thus, the Peierls stress calculated in combination with the P-N model and
GSFE curves provides a basis for a theoretical study of the dislocation structure and operative
slip modes in L10 Ni2FeGa.
5.5 Experimental Observations and Viewpoints on
Martensite Deformation Behavior
5.5.1 In-Situ TEM Observations of Dislocation Slip
Understanding the dislocation slip behavior of shape memory alloys is extremely relevant
to understanding the shape memory performance. The higher the resistance to martensite slip, the
superior the shape memory performance. During dynamic evolution of phase boundaries, both
austenite and martensite may undergo slip due to the high internal stress fields. Because
observations of slip are difficult to make during the loading experiments, one way to prepare the
samples for such observations is to subject the specimens to phase change, remove the sample,
and then conduct heating cooling experiments in an transmission electron microscope (TEM).
The first portion of the experiment is sometimes referred to as training to obtain a two way shape
memory effect. During this experiment one can transform to the L10 phase under stress and
interrupt the experiment at room temperature, so one can retain the martensite L10 phase. Then,
samples are cut from the L10 specimens, which are observed in the TEM. Cooling in the TEM
further allows observations of the evolution of dislocation slip behaviors. Such experiments were
conducted and the results confirm dislocation slip in the martensitic phase. To ensure that the
resultant phase is the L10 phase and not the 10M/14M intermediate martensites, the stress is
raised in a stair case fashion to sufficiently high levels, and diffraction peaks were collected to

98
index the martensite L10 phase. When the stress is not sufficiently high (less than 40 MPa), the
diffraction peaks corresponded to 14M, an intermediate martensitic structure. When the stress
was 80 MPa, the final martensitic phase observed was L10. These results are shown in Figs. 15
and 16 for applied stress levels of 40 MPa and 80 MPa respectively.
At tensile stress of 40 MPa, the transformation steps were L21 10M 14M shown in
Figure 5.17. We note that the strain saturates at nearly 6.2% and the formation of 14M structure
is confirmed with diffraction measurements at room temperature. The inset shows a selected area
diffraction (SAD) pattern of the 14M structure.
Figure 5. 17 The tensile strain-temperature response at 40 MPa describing the inter-martensitic
transformation L21 10M 14M. Red arrows along the curve indicate directions of cooling
and heating. A SAD pattern is insetted showing the culmination in formation of the 14M
structure.
When the tensile stress was increased to 80 MPa, the transformation steps (cooling) were
L2110M14ML10 shown in Figure 5.18. The strain saturates approximately at 9.5% and
the crystal structure is L10 at room temperature. The inset shows a SAD pattern of the L10

99
structure. Compared to the maximum strain of 6.2% in the transformation L21 10M 14M
in Figure 5.17, we note that once 14ML10 forms, the L10 detwins in tension. Because the test
is interrupted near room temperature the specimen has not reverted to the austenitic phase (L21).
In the second phase of the experiments, the sample that is shown in Figure 5.18 was
subsequently studied by TEM via in-situ heating and cooling. The existence of dislocations slip
of L10 at -6 oC is shown in in Figure 5.19.
Figure 5. 18 The tensile strain-temperature response at 80 MPa indicating the martensitic
transformation from the austenite L21 to the non-modulated martensite L10. A SAD pattern in the
inset shows resulting L10 structure. The sample is removed from the load frame at ‘T’ and
studied with TEM under in-situ temperature cycling.

100
Figure 5. 19 Upon cooling to -6°C, the TEM image displays the martensite phase L10 with
<112>{111} dislocation slip in a Ni54Fe19Ga27 (at %) single crystal.
5.5.2 Determination of Martensite Slip Stress from Experiments
Our previous compression experiments show that as the temperature increases to 150 °C,
the austenite L21 can directly transform to L10 martensite bypassing the intermartensite
10M/14M [8]. A series of experiments were conducted to study the martensite slip behavior
(L10) subsequent to austenite to martensite transformation. These experiments involve
compression loading of [001] oriented single crystals of Ni54Fe19Ga27 at a constant temperature
of 150 °C. A typical compressive stress-strain curve is shown in Figure 5.20. The samples were
originally in the L21 state and directly transformed to the L10 regime when the loading reached
the martensitic transformation stress of 450 MPa. Upon further loading, the samples were in a
fully L10 state and dislocation slip was observed as the stress magnitude exceeded 1500 MPa.
After unloading, a finite amount of plastic strain remained due to residual dislocations in the L10.
Because the [001] orientation in L21 corresponds to [001] in L10 (Fig. 3), the Schmid factor for
the compressive axis [001] and dislocation slip system [11 2](111) in L10 is near 0.5. The shear
stress of dislocation slip in L10 at a temperature of 150 °C is then calculated as 750 MPa. We
note that the Peierls stress is the shear stress required to move a dislocation at 0 K, where the
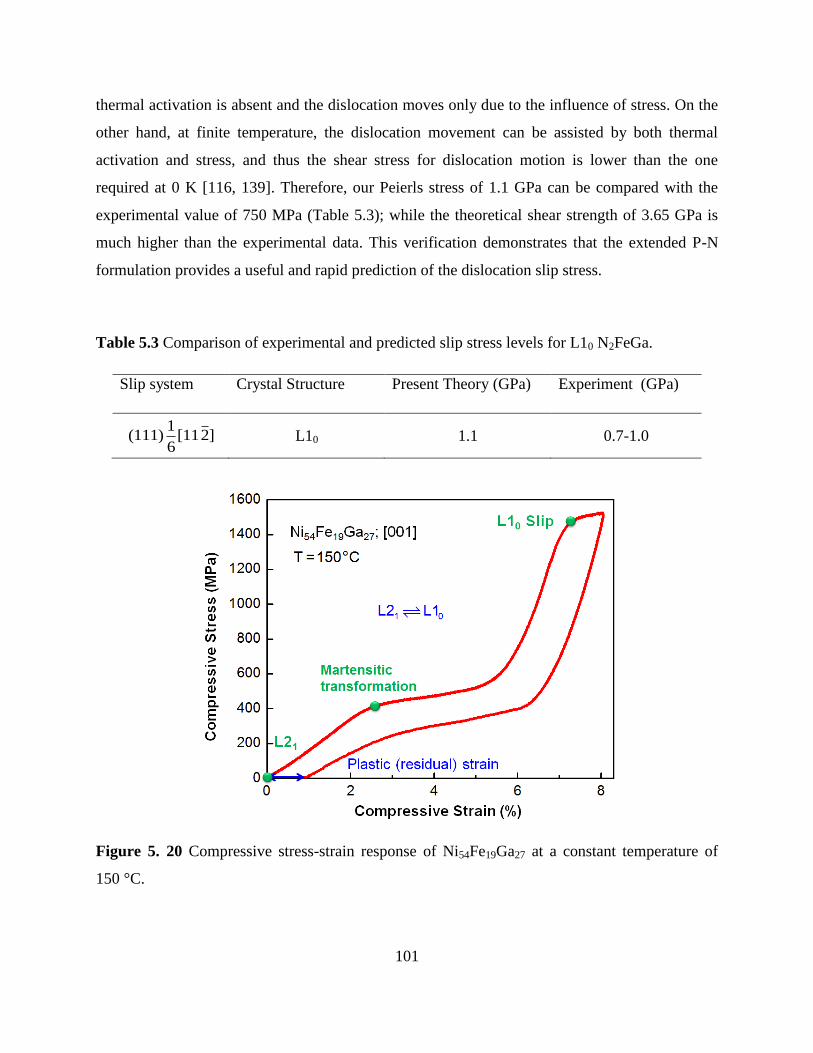
101
thermal activation is absent and the dislocation moves only due to the influence of stress. On the
other hand, at finite temperature, the dislocation movement can be assisted by both thermal
activation and stress, and thus the shear stress for dislocation motion is lower than the one
required at 0 K [116, 139]. Therefore, our Peierls stress of 1.1 GPa can be compared with the
experimental value of 750 MPa (Table 5.3); while the theoretical shear strength of 3.65 GPa is
much higher than the experimental data. This verification demonstrates that the extended P-N
formulation provides a useful and rapid prediction of the dislocation slip stress.
Table 5.3 Comparison of experimental and predicted slip stress levels for L10 N2FeGa.
Slip system Crystal Structure Present Theory (GPa) Experiment (GPa)
1(111) [11 2]
6 L10 1.1 0.7-1.0
Figure 5. 20 Compressive stress-strain response of Ni54Fe19Ga27 at a constant temperature of
150 °C.

102
5.6 Prediction of Dislocation Slip Stress for Shape Memory
Alloys
To validate the extended P-N formulation for dislocation slip, we calculated Peierls
stresses predicted from the model for several important shape memory alloys in austenite phase
and compared to the experimental slip stress data. The martensite slip stress levels are rather high
as we show in this study (1.1 GPa versus 0.63 GPa). The austenite slip stress levels, on the other
hand, are more readily available in the experiments and are also very important. The austenite of
these materials (Ni2FeGa, Co2NiGa, Co2NiAl, NiTi, CuZn and Ni2TiHf) possess the L21 and B2
cubic structures. We found excellent agreement between the predicted values and experimental
data shown in Table 5.4. For each material, the lattice type, the slip system, and the experimental
range of critical slip stresses and the theory are shown. If the ideal stress levels are included,
these exceed several GPa and are much higher than experiments. Interestingly, the critical stress
for CuZn, which has excellent transformation properties, but suffers from plastic deformation,
exhibits the lowest levels. For austenitic NiTi the most likely slip system is (011 )[1 00] with a
slip stress level of 0.71 GPa consistent with experiments.
The experimental slip stress data are taken from the plot of critical stress vs. temperature.
In all the studied materials, a similar stress vs. temperature correlation is observed such that near
the Md temperature the material undergoes slip. The critical stress for martensitic transformation
increases with temperature above Af and the critical stress for dislocation slip of austenite
decreases with temperature. When these two values cross at the temperature Md, the stress-
induced martensitic transformation is no longer possible, but the dislocation slip of austenite
dominates the mechanical response. The critical austenite slip stress at Md is considered as the
experimental data for austenite slip and compared to the (Peierls based) present theory.

103
Table 5.4 Predicted Peierls stresses for shape memory alloys are compared to known reported
experimental values. The slip systems and crystal structures of SMAs are given. (L21 and B2 are
the crystal structures in austenite phase).
Material Crystal
Structure
Slip system Critical Shear
Stress-Present
Theory (GPa)
Critical Shear
Stress-Experiment (GPa)
Ni2FeGa L21
1(1 1 0) [11 1]
4 0.63
0.40-0.65 [18]
Co2NiGa B2 (011 )[1 00] 0.76 0.40-0.70 [16, 140]
Co2NiAl B2 (011 )[1 00] 0.72 0.60-0.80 [16, 141]
NiTi B2
(011 )[1 00]
(011 )[1 1 1]
0.71
1.2
0.40-0.80 [92, 111, 142,
143]
Ni2TiHf B2 (011 )[1 00] 0.78 0.55-0.75 [17, 144]
CuZn B2 (011 )[1 1 1] 0.08 0.03-0.07 [145, 146]
5.7 Summary
The present work focuses on the dislocation slip mechanism of L10 Ni2FeGa, and the
rationalization of why 1
[11 2]6
is the favorable dislocation slip system. The simulations
underscore a significant quantitative understanding of Ni2FeGa and extend the P-N formulation
for the study of complex faults.
The calculated lattice parameters of L10 are in good agreement with the available
experimental results, which form the foundation of the GSFE and Peierls stress calculation. We
identified the energies and stresses required for dislocations movement of L10 Ni2FeGa. To
address this issue, we precisely established the GSFE curves and determined energy barriers and
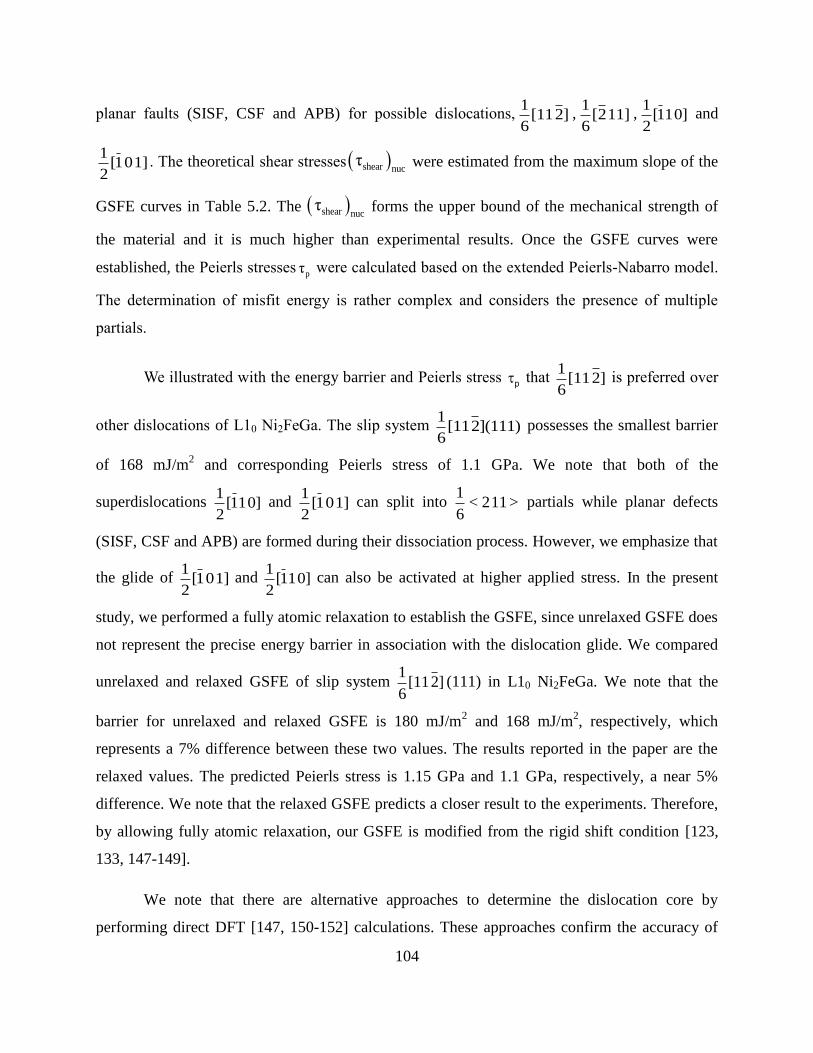
104
planar faults (SISF, CSF and APB) for possible dislocations,1
[11 2]6
,1
[2 1 1]6
,1
[1 1 0]2
and
1[1 0 1]
2. The theoretical shear stresses shear nuc
τ were estimated from the maximum slope of the
GSFE curves in Table 5.2. The shear nucτ forms the upper bound of the mechanical strength of
the material and it is much higher than experimental results. Once the GSFE curves were
established, the Peierls stressespτ were calculated based on the extended Peierls-Nabarro model.
The determination of misfit energy is rather complex and considers the presence of multiple
partials.
We illustrated with the energy barrier and Peierls stress p that 1
[11 2]6
is preferred over
other dislocations of L10 Ni2FeGa. The slip system 1
[11 2](111)6
possesses the smallest barrier
of 168 mJ/m2 and corresponding Peierls stress of 1.1 GPa. We note that both of the
superdislocations 1
[1 1 0]2
and 1
[1 0 1]2
can split into 1
< 2 1 1 >6
partials while planar defects
(SISF, CSF and APB) are formed during their dissociation process. However, we emphasize that
the glide of 1
[1 0 1]2
and 1
[1 1 0]2
can also be activated at higher applied stress. In the present
study, we performed a fully atomic relaxation to establish the GSFE, since unrelaxed GSFE does
not represent the precise energy barrier in association with the dislocation glide. We compared
unrelaxed and relaxed GSFE of slip system 1
[11 2]6
(111) in L10 Ni2FeGa. We note that the
barrier for unrelaxed and relaxed GSFE is 180 mJ/m2 and 168 mJ/m
2, respectively, which
represents a 7% difference between these two values. The results reported in the paper are the
relaxed values. The predicted Peierls stress is 1.15 GPa and 1.1 GPa, respectively, a near 5%
difference. We note that the relaxed GSFE predicts a closer result to the experiments. Therefore,
by allowing fully atomic relaxation, our GSFE is modified from the rigid shift condition [123,
133, 147-149].
We note that there are alternative approaches to determine the dislocation core by
performing direct DFT [147, 150-152] calculations. These approaches confirm the accuracy of

105
the disregistry function of the arctan form derived from the P-N model [147]. For the case of
superdislocation dissociated into four partials in the present study, further developments in the
direct DFT approach are needed including modifications of the Lattice Green's functions [150].
To validate our Peierls stress prediction, we conducted a series of experiments to observe
the dislocation slip in L10 Ni2FeGa and determined the slip stress of L10 approximately as 1.5
GPa (CRRS is 750 MPa) under compression loading of [001] samples. The single crystals
underwent slip deformation following austenite to martensite transformation. These results
confirmed our Peirerls stress prediction of 1.1 GPa for the 1
[11 2](111)6
slip system. These
predicted levels with the P-N model are in far better agreement with experiments in comparison
with the theoretical stress level of 3.65 GPa. In addition to the temperature effects discussed
earlier, some of the differences may stem from the fact that the actual alloy is off stoichiometry
(Ni54Fe19Ga27) compared to the simulations (Ni50Fe25Ga25). The theoretical lattice constants are
not exactly the same as the experimental values contributing to some of the differences in stress
levels.
We also investigated dislocation slip in several important shape memory alloys and
predicted stresses based on the present theory for Ni2FeGa (austenite), NiTi, Co2NiGa, Co2NiAl,
CuZn and Ni2TiHf austenites in excellent agreement with experiments. Overall, we note that the
stresses calculated with the extended P-N model and GSFE curves provides an excellent basis for
a theoretical study of the dislocation structure and operative slip modes in L10 Ni2FeGa and the
some of the most important shape memory alloys. The formulation can be extended to other
proposed shape memory alloys with different crystal structures as well.

106
Chapter 6 Twinning Stress in Shape Memory Alloys-Theory
and Experiments
[The material in this chapter is published as J. Wang, H. Sehitoglu, Acta Materialia, Vol
61, 2013].
6.1 Abstract
Utilizing first-principles atomistic simulations, we present a twin nucleation model based
on the Peierls-Nabarro (P-N) formulation. We investigate twinning in several important shape
memory alloys starting with Ni2FeGa (the 14M-modulated monoclinic and L10 crystals) to
illustrate the methodology, and predict twin stress in Ni2MnGa, NiTi, Co2NiGa, and Co2NiAl
martensites in excellent agreement with experiments. Minimization of the total energy led to
determination of the twinning stress accounting for twinning energy landscape (GPFE) in the
presence of interacting multiple twin dislocations and disregistry profiles at the dislocation core.
The validity of the model was confirmed by determining the twinning stress from experiments on
Ni2FeGa (14M and L10 cases), NiTi, and Ni2MnGa and utilizing results from the literature for
Co2NiGa, and Co2NiAl martensites. The paper demonstrates that the predicted twinning stress
can vary from 3.5 MPa in 10M Ni2MnGa to 129 MPa for the B19' NiTi case consistent with
experiments.
6.2 Introduction
To facilitate the design of new transforming alloys, including those proposed for
magnetic shape memory, twinning modes associated with these alloys need to be fully
understood [1]. The objective of the current paper is to study the most important twin modes in
monoclinic and tetragonal (modulated and non-modulated) shape memory martensites and
establish their twin fault energy barriers that are in turn utilized to predict the twinning stress. A
new model for twin nucleation is proposed which shows excellent overall agreement with
experiments.

107
Martensite twinning and subsequent recovery upon heating is called the 'shape memory
effect' [2]. In the 'shape memory' case, when the internally twinned martensite is subsequently
deformed, the twin variants that are oriented favorably to the external stress grow in expense of
others. The growth of the twin is a process of advancement of twin interfaces and requires
overcoming an energy barrier called the 'unstable twin fault energy' [3, 4]. Upon unloading, the
twinning-induced deformation remains. If the material is heated above the austenite finish
temperature, the material reverts back to austenite. Hence, the heating and cooling changes can
make the material behave as an actuator, which is called the 'shape memory effect'. In this paper,
we present experimental results of twinning stress for several important shape memory alloys
and compare the results to theory.
It is now well known that the phenomenon of twinning during shape memory relies on
complex atomic movements in the martensitic crystal. Despite the significant importance of
twinning in SMAs, there have been limited attempts to develop models to predict the twinning
stress from first-principles. The twinning energy landscapes for ordered binary and ternary alloys
are more complex compared to pure fcc metals [5-7]. Thus, a fundamental understanding of twin
nucleation is essential to capture the mechanical response of SMAs. This is the subject of this
paper.
Several methodologies exist for evaluation of the twin nucleation and migration stresses
of materials [4, 8-12]. However, the early models either require one or more fitting parameters or
depend only on the intrinsic stacking fault energy, and they predict unrealistically high twinning
stress. The Peierls–Nabarro (P-N) formalism can be utilized for rapid assessment of deformation
behavior of binary and ternary shape memory materials and to evaluate different crystal
structures of martensites. In the P-N model, the stress required to overcome a Peierls valley is
determined for dislocation motion. The calculations for Peierls stress represent the breakaway of
an atom within the core region of the dislocation. The Peierls stress is the minimum applied
shear stress to move a dislocation. In recent years, the model benefited significantly from
atomistic simulations which precisely calculate the energy landscape associated with atomic
movements in different planes and directions. A brief description of P-N model used to predict
the Peierls stress is given in Appendix. The formalism for dislocation slip stress determination
utilizing the P-N concepts is well established, while the twinning stress determination is not as

108
well developed. If a P-N based twinning model is developed, then it can lead to a quantitative
prediction of twinning stress in SMAs, and a better understanding of the factors that govern the
shape memory effect. The current study addresses this important issue.
In recent years, several noteworthy approaches for twinning have been developed based
on the P-N methodology. Yip and colleagues [4] determined the twin migration stress where a
dislocation advance at the twin boundary represented twin growth. Their formula for twinning
stress provides a simple and powerful relation linking the Peierls stress for twinning to the twin
migration energy, the difference between unstable twin energy and twin stacking fault energy.
Paidar and colleagues [13], accounting for anisotropy effects, undertook a similar treatment.
Since the twinning motion involves a collective treatment of multiple dislocations, and their
mutual interaction should affect their glide [14-16], we propose a modified treatment of the
calculation of twin nucleation stress.
Martensite can undergo twinning deformation associated with shape memory effect as
explained earlier. The stress levels for martensite twinning can be determined from experiments
at temperatures below the martensite finish temperature. Figure 1 shows a schematic of the
stress-strain curve of Ni2FeGa at the temperature below the martensite finish temperature.
During loading, twin interfaces advance in 14M (modulated monoclinic structure) followed by
twinning of the L10 structure at higher strains. As we show later these two crystal structures of
Ni2FeGa have distinctly different twin stresses. Upon unloading the detwinned martensitic
structure remains, which is recovered upon heating above the austenite finish temperature.

109
Figure 6.1 Schematic of stress-strain curve showing the detwinning of internally twinned
martensite (multiple variant) to detwinned martensite (single crystal) of Ni2FeGa at low
temperature. Upon unloading, plastic strain is observed in the material, which can be fully
recovered upon heating.
From our previous tests, we note that compressive loading experiments are better suited
to avoid premature fracture in tension [17]. When the specimen is deformed, the martensite
twinning process initiates at a finite stress level. There are very limited experiments in the
literature on the martensite twinning stress of ferromagnetic shape memory alloys such as
Ni2FeGa, Co2NiAl and Co2NiGa. There have been more experiments on NiTi and Ni2MnGa. The
research teams of Sehitoglu and Chumlyakov have conducted experiments below the martensite
finish temperature on a number of advanced shape memory alloys [18, 19]. Since the twin
thicknesses are of nano-dimensions, it is difficult to observe in-situ the onset of twinning
experimentally. Additionally, several twin systems can co-exist, hence making it rather
complicated to discern experimentally the twin stress when multiple systems interact such as in
NiTi and Ni2FeGa. Therefore, the theoretical calculations provide considerable insight.
At the mesoscale, our current treatment deals with the dislocation movements leading to
the twin formation. Several modifications to the original Peierls-Nabarro treatment were

110
implemented in the course of the study. At the atomic scale, during the calculations of the
generalized planar fault energy (GPFE) curve, full internal atom relaxation was allowed. This
allows a three dimensional description of the energy landscape with displacements in two other
directions in addition to the imposed shear. The misfit energy expression accounts for the
discreteness in the lattice across atomic pairs and not treated as a continuous integral. This
energy description is dependent on the spacing between two adjacent twinning partials and
results in a more realistic twin stress evaluation. Both of these modifications enrich the original
approach forwarded by Peierls-Nabarro. A further advancement forwarded in this study is to
incorporate the elastic strain fields in the overall energy expression accounting for the mutual
interaction of dislocation fields. Upon minimization of the total energy, we seek for the critical
twin nucleation stress. We show results for Ni2FeGa in comparison to our experiments, but the
methodology developed is appealing and was applied to other materials. The outcome of these
calculations is that one can evaluate magnitudes of critical twin nucleation stress in better
agreement with experiments.
In the first calculation, we note that the ideal shear stress value obtained from the fault
energy curves without accounting for the discreteness of the crystal structure is rather high (GPa
levels). In the second calculation, the calculated Peierls stress from the original P-N model gives
a reasonable value (MPa range), but it is still higher than experimental data. Consequently, the
third calculation, i.e. the proposed twin nucleation model, which is based on the extended
Peierls-Nabarro treatment and considers the elastic strain fields in the twin nucleation, points to a
significant advantage and certainty. This model can be used for rapid and accurate prediction of
twin stresses of potential shape memory alloys before undertaking costly experimental programs.
6.3 Methodologies for twin nucleation
We model the deformation process of twin nucleation at the atomic level and integrate
with the mesoscale description of overall energy. At the atomic level, the twinning energy
landscape (GPFE) is established representing the lattice shearing process due to the passage of
twinning partials [12]. At the mesoscale level, an extended P-N formulation is proposed to
determine the twin configuration and address the total energy associated with the twin nucleation.

111
Figure 2 shows a schematic of methodology adopted in this study and different length scales
associated with twinning in Ni2FeGa (14M and L10) alloys. Here we proposed a twin nucleation
model based on Peierls-Nabarro formulation describing the mesoscale twinning partial
dislocation interactions using dislocation mechanics [20] incorporating the ab initio DFT
simulations. We minimized the total energy associated to the twin nucleation and calculated the
critical twin nucleation stress of 14M and L10 Ni2FeGa (shown in detail as examples in this
paper) and other important shape memory alloys. We note that for NiTi there are several twin
systems activated and we calculate twin stress for the most important ones consistent with
experiments.
Figure 6.2 Schematic description of the multi-scale methodology for modeling of deformation
twinning in Ni2FeGa alloys.
6.3.1 DFT calculation setup
The generalized planar fault energy (GPFE) provides a comprehensive description of
twins, which is the energy per unit area required to form n-layer twins by shearing n consecutive
layers along twinning direction [76]. The first-principles total-energy calculations were carried
out using the Vienna ab initio Simulations Package (VASP) with the projector augmented wave
(PAW) method and the generalized gradient approximation (GGA) [25, 26]. Monkhorst Pack
9×9×9 k-point meshes were used for the Brillouin-zone integration to ensure the convergence of
results. The energy cut-off of 500 eV was used for the plane-wave basis set. The total energy was

112
converged to less than 10-5
eV per atom. Periodic boundary conditions across the supercell were
used to represent bulk material. We have used L- layer based cell to calculate fault energies to
generate GPFE curve in the certain system. We assessed the convergence of the GPFE energies
with respect to increasing L, which indicates that the fault energy interaction in adjacent cells due
to periodic boundary conditions will be negligible. The convergence is ensured once the energy
calculations for L and L+1 layers yield the same GPFE. For each shear displacement u, a fully
internal atom relaxation, including perpendicular and parallel directions to the fault plane, was
allowed for minimizing the short-range interaction between misfitted layers near to the fault
plane. During the shear deformation process, the volume of the supercell was maintained
constant ensuring the correct twin structure [153, 154]. This relaxation process caused a small
additional atomic displacement r ( x y zr = r + r + r ) in magnitude within 1% of the Burgers vector
b. Thus, the total fault displacement is not exactly equal to u but involves additional r. The total
energy of the deformed (faulted) crystal was minimized during this relaxation process through
which atoms can avoid coming too close to each other during shear [85, 122, 123]. From the
calculation results of deformation twinning, we note that the energy barrier after full relaxation
was near 10% lower than the barrier where the relaxation of only perpendicular to the fault plane
was allowed.
6.3.2 Twinning energy landscapes (GPFE)- the L10 Ni2FeGa example
The deformation twinning system <11 2]{111}has been observed experimentally for L10
structure in past work [11, 155-159], which is the same with fcc metals. In this study, we
conducted simulations to determine the GPFE of L10 Ni2FeGa by successive shearing every (111)
plane over 1
[11 2]6
dislocation. We note that the formation of twin system 1
[11 2](111)6
of L10
Ni2FeGa requires no additional atomic shuffle, which is also observed in other L10 structures
[155, 160-162] and fcc materials [76, 130, 163-165]. Figure 6.3 shows the L10 fct (face centered
tetragonal) structure with corresponding lattice parameters of a=b=3.68 Å, and c=3.49 Å. We
note that the tetragonal axis is 2c, so the L10 unit cell contains two fct unit cells. These lattice
parameters are in a good agreement with experimental measurements [9]. These precisely

113
determined lattice parameters form the foundation of atomistic simulations to establish GPFE.
The twinning plane (111) is shaded violet and the [11 2] direction is denoted with the red arrow
in L10 Ni2FeGa and shown in Figure 6.3. We note that if the tetragonal axis is denoted as c, not
2c, the corresponding twinning plane will be (112).
Figure 6.3 L10 structure and twinning system of Ni2FeGa. The L10 fct structure with lattice
parameters a, a and 2c contains two fct unit cells. The twining plane (111) is shown in shaded
violet and direction [11 2] in red arrow. The blue, red and green atoms correspond to Ni, Fe and
Ga atoms, respectively.
Figure 6.4 shows a top view from the direction perpendicular to the (111) twinning plane
with three-layers of atoms stacking in L10 Ni2FeGa. Different sizes of atoms represent three
successive (111) layers. The twinning partial dislocation is 1
[11 2]6
(Burgers vector b=1.45 Å)
and is shown with a red arrow.

114
Figure 6.4 Schematic of top view from the direction perpendicular to the (111) twinning plane in
L10 Ni2FeGa. Different sizes of atoms represent three successive (111) layers. Twinning partial
1[11 2]
6 is shown in red arrow.
We conducted simulations to determine the GPFE of L10 Ni2FeGa by successive shear of
every (111) plane over 1
[11 2]6
partial dislocation. Figure 6.5a shows the perfect L10 lattice of
Ni2FeGa, while Figure 6.5b is the lattice with a three-layer twin after shearing displacement, u
(shown with red arrow), in successive (111) planes (twinning plane is marked with a brown
dashed line). The atomic arrangement is viewed in [1 1 0]direction. We note that the stacking
sequence ABCABCA….. in the perfect lattice changed to ABCACBA…. in the three-layer twin
(i.e. moving plane B into the position of plane C after one-layer twin generated, and moving
plane C into the position of plane B when two-layer twin is created.)

115
Figure 6.5 Deformation twinning in (111) plane with partial dislocation 1
[11 2]6
(Burgers vector
b=1.45 Å) of L10 Ni2FeGa. (a) The perfect L10 lattice viewed from the [1 10]direction. Twining
plane (111) is marked with a brown dashed line. (b) The lattice with a three-layer twin after
shearing along 1
[11 2]6
dislocation, u, shown in red arrow.
In Figure 6.6, the shear displacement in each successive plane (111), u, is normalized by
the respective required Burgers vector b=1.45 Å along [11 2] direction. We define usγ as the
stacking fault nucleation barrier, which is the barrier preventing a one-layer partial fault from
becoming a one-layer full fault, isf as the first layer intrinsic stacking fault energy (SFE), ut
as the twin nucleation barrier, which is the barrier against a one-layer partial fault becoming a
two-layer partial fault, and tsf2γ as twice the twin SFE [76, 130]. Note that us and ut cannot
be experimentally measured and must be computed [76]. The twin migration energy is denoted
by TM ut tsfγ = γ -2γ (shown in vertical green arrow in Figure 6.5), which is most relevant in the
presence of existing twins and determines the twin migration stress [20]. Table 6.1 summarizes

116
the calculated fault energies for twin system 1
[11 2](111)6
of L10 Ni2FeGa and for twin system
1[100](010)
7of 14M Ni2FeGa (twinning in 14M will be discussed in next section). We will see in
the next section that the critical twin nucleation stress, crit , for L10 Ni2FeGa strongly depends
on these fault energies and barriers. Thus, utilizing ab initio DFT to precisely establish the GPFE
landscape is essential in computing crit .
Figure 6.6 GPFE in (111) plane with 1
[11 2]6
twinning dislocation of L10 Ni2FeGa. The
calculated fault energies are shown in Table 6.1.
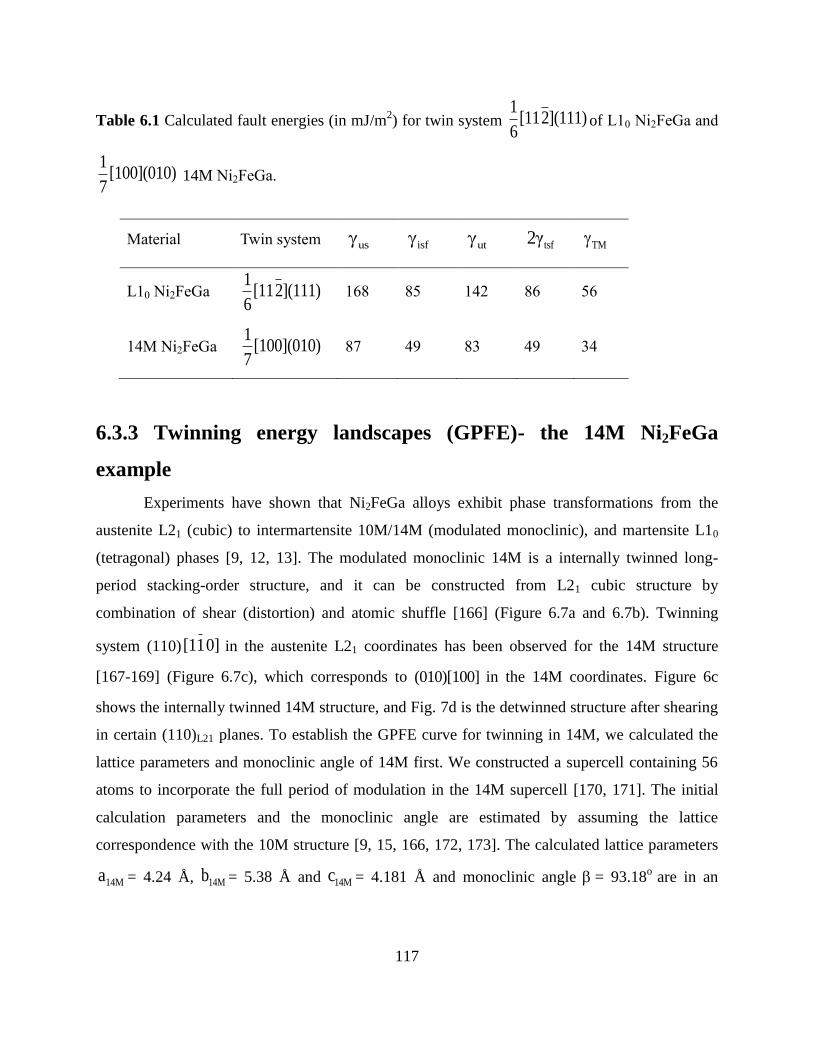
117
Table 6.1 Calculated fault energies (in mJ/m2) for twin system
1[11 2](111)
6of L10 Ni2FeGa and
1[100](010)
7 14M Ni2FeGa.
Material Twin system us isf ut tsf2γ TM
L10 Ni2FeGa 1
[11 2](111)6
168 85 142 86 56
14M Ni2FeGa 1
[100](010)7
87 49 83 49 34
6.3.3 Twinning energy landscapes (GPFE)- the 14M Ni2FeGa
example
Experiments have shown that Ni2FeGa alloys exhibit phase transformations from the
austenite L21 (cubic) to intermartensite 10M/14M (modulated monoclinic), and martensite L10
(tetragonal) phases [9, 12, 13]. The modulated monoclinic 14M is a internally twinned long-
period stacking-order structure, and it can be constructed from L21 cubic structure by
combination of shear (distortion) and atomic shuffle [166] (Figure 6.7a and 6.7b). Twinning
system (110)[1 1 0] in the austenite L21 coordinates has been observed for the 14M structure
[167-169] (Figure 6.7c), which corresponds to (010)[100] in the 14M coordinates. Figure 6c
shows the internally twinned 14M structure, and Fig. 7d is the detwinned structure after shearing
in certain (110)L21 planes. To establish the GPFE curve for twinning in 14M, we calculated the
lattice parameters and monoclinic angle of 14M first. We constructed a supercell containing 56
atoms to incorporate the full period of modulation in the 14M supercell [170, 171]. The initial
calculation parameters and the monoclinic angle are estimated by assuming the lattice
correspondence with the 10M structure [9, 15, 166, 172, 173]. The calculated lattice parameters
14Ma = 4.24 Å, 14Mb = 5.38 Å and 14Mc = 4.181 Å and monoclinic angle = 93.18o
are in an

118
excellent agreement with experimental data [9] . Figure 6.8 shows the calculated GPFE curve of
14M, and the calculated fault energies for twin system 1
[100](010)7
are summarized in Table 6.1.
(a) (b)
Figure 6.7 Crystal structures of modulated monoclinic 14M(internally twinned) and detwinned
14M of Ni2FeGa. Like modulated monoclinic 10M structure, the 14M can be consructed from
L21 cubic structure by combination of shear (distortion) and atomic shuffle [15]. (a) Schematic

119
of the L21 cubic structure of Ni2FeGa, (b) the sublattice of L21 (face centered tetragonal structure)
displaying the modulated plane (110)L21 (violet color) and basal plane (001) L21 (brown color), (c)
the modulated monoclinic 14M(internally twinned) structure with twin plane (110)L21 and twin
direction 1L2[1 1 0] . Note the twin system (110)[1 1 0] in the austenite L21 coordinates corresponds
to (010)[100] in the intermartensite 14M coordinates, (d) the detwinned 14M structure.
Figure 6.8 GPFE in (010) plane with 1
[100]7
twinning dislocation of 14M Ni2FeGa. The
calculated fault energies are shown in Table 6.1.
6.3.4 Peierls-Nabarro Model Fundamentals
The Peierls-Nabarro model considers two semi-infinite continuous half crystals joined at
the slip plane with a dislocation inserted [133]. The behavior of the half crystals is confined to

120
linear elasticity and all nonlinear behavior is confined to a single plane as shown in Figure 6.9
[174].
(a) (b)
Figure 6. 9 Configuration of Peierls-Nabarro model for dislocation slip. (a) b is the lattice
spacing along the slip plane and d is the lattice spacing between adjacent planes. (b) The
enlarged configuration of the green box in (a). The grey and blue spheres represent the atom
positions before and after the extra half-plane is created. uA(x) and uB(x) are the atom
displacements above slip plane (on plane A) and below slip plane (on plane B), and their
difference uA(x)-uB(x) describes the disregistry distribution f(x) as a function of x.
According to the P-N model, the total energy of the dislocation with the two half crystals
in Figure 6.9 can be expressed as [133]
tot elast mis
2
R- - -
f(x) (1)
E = E + E =
-K df(x) df(x') Kbln x - x' dxdx'+ lim lnR + γ dx
4π dx dx' 4π
→∞
where elastE accounts for the elastic strain energy stored in the two half crystals; while misE is the
misfit energy representing the non-linear interatomic interactions in the dislocation core and
depends on the position of the dislocation line within a lattice cell and hence is periodic [120,

121
129, 130]. The parameter K is a material property measuring the elastic response of the lattice to
displacement along the Burgers vector direction [129], and is the generalized stacking fault
energy representing the fault energy associated with dislocation motion [15, 72].
By considering the lattice discreteness, the misfit energy misE can be defined as the sum
of all the misfit energies between pairs of atoms rows as a function of u [85, 133],
+
m=-mis (u) = γ f(ma' - u) a' (2)E
where, a' is the periodicity of mis(u)E and defined as the shortest distance between two
equivalent atomic rows in the direction of the dislocation’s displacement [113, 114, 131]. The
solution of the disregistry function f(x) in the dislocation core is [114, 133, 173, 175]:
b b xf(x) = + arctan (3)
2 π ζ
where d
ζ =2(1- ν)
is the half-width of the dislocation for an isotropic solid [129], d is the
interplanar distance between the twinning planes and is the Poisson’s ratio. By using the
Frenkel expression [133], the γ f(x) can be written as:
maxγ 2πf(x)γ f(x) = 1-cos (4)
2 b
where, max is maximum fault energy. After substituting Eq. (3) and Eq. (4) into Eq. (2), we
have the following summation form with m as integer:
+ +
s -1maxγ
m=- m=-
γ ma'- uE (u) = γ f(ma'- u) a' = 1+cos 2tan a' (5)
2 ζ

122
Because the elastic strain energy elastE is independent on the location of dislocation line u, the
Peierls stress p is then given by the maximum stress required to overcome the periodic barrier
in mis(u)E only,
tot misd (u)d1 1τ = max = max (6)p
b du b du
EE
6.4 Twin nucleation model based on P-N formulation- the
L10 Ni2FeGa example
It is experimentally observed that the morphology of twinning dislocations array near the
twin tip is thin and semi-lenticularly shaped [176-179]. The critical stage of twin nucleation is
the activation of the first twinning partial dislocation on twin plane involving an intrinsic
stacking fault [176, 179-181]. This can occur in a region of high stress concentration such as the
inclusions, grain boundaries and notches [180]. Figure 6.10 shows the schematic illustration of
the twin morphology with twinning plane (111) and twinning partial 1
[11 2]6
in L10 Ni2FeGa.
The h is the twin thickness and N is the number of twin-layers, and d is the spacing between two
adjacent twinning dislocations and varies depending on their locations relative to the twin tip. It
is experimentally observed that twinning partials near the twin tip are more closely spaced (d is
smaller) compared to the dislocations far away from the twin tip (d is larger) [176]. The is the
applied shear stress and the minimum to form a twin is called critical twin nucleation stress,
critτ . Once the first twinning partial (leading twinning dislocation) has nucleated, subsequent
partials readily form on successive twin planes [181]. We note that a three-layer fault forms the
twin nucleus in L10 Ni2FeGa, which reproduces the L10 structure. Thus, the number of twin-
layers, N, equals to 3 and we seek for the minimization of the total energy as described below.

123
Figure 6.10 Schematic illustration showing the semi-lenticular twin morphology of L10
Ni2FeGa, which is viewed in the [1 1 0] direction. The twinning plane is (111) and twinning
direction is [11 2] . h is the twin thickness and N is the number of twin-layers (N=3 for twin
nucleation). d is the spacing between two adjacent twinning dislocations and considered as a
constant for three-layer twin.
The total energy associated with the twin nucleation shown in Figure 6.10 can be
expressed as:
total int GPFE lineE = E +E +E -W (7)
where intE is the twin dislocations interaction energy, GPFEE is the twin boundary energy (GPFE),
lineE is the twin dislocations line energy and W is the applied work. These energy terms can be
described as follows:
(1) Twinning dislocations interaction energy, intE
The energy for the ith twinning dislocation interacting with the (i+n)th or (i-n)th
dislocation is [182, 183]

124
2
2
i,i+n/i-n
μb LE = 1- νcos θ ln (8)
4π(1- ν) nd
where is the shear modulus of the twinning system, b is the Burgers vector of the twinning
dislocations, ν is the Poisson’s ratio, and θ is the angle between the Burgers vector and the
dislocation line, and L is the dimensions of the crystal containing the twin. After summing for
all twinning dislocations, we have the energy for the ith dislocation as [182, 183]
2 n=N-i m=i-1
2
i
n=1 m=1
μb L LE = 1- νcos θ ln + ln (9)
4π(1- ν) nd md
where, N is the number of layers in the twin nucleus.
The total interactions energy of all twinning dislocations is:
2 m=N-12 2
int
i=2
μb LE = 1- νcos θ N ln - ln N - 2 !+ ln N -i !+ ln i -1 ! (10)
4π 1- ν d
(2) Twin boundary energy (GPFE), GPFEE
Considering the interaction of multiple twinning dislocations, the disregistry function f(x)
can be described in Eq. (11) and Figure 6.11 shows a schematic of normalized f(x)/b variation
with x / ζ . ζ is defined as the half-width of the dislocation for an isotropic solid [129].
-1 -1 -1 -1x - N -1 db b x x -d x - 2d
f(x) = + tan + tan + tan +...+ tan (11)2 Nπ ζ ζ ζ ζ

125
Figure 6. 11 The disregistry function for a three-layer twin nucleation (N=3).
In the GPFE curve, the energy required to create an intrinsic stacking fault can be expressed as:
us isfSF isf
γ - γ f(x)γ f(x) = γ + 1-cos 2π for 0 f(x) b (12)
2 b
≤ ≤
The energy required to nucleate a twin can be expressed as:
tsf isf tsf isftwin ut
2γ + γ 2γ + γ1 f(x)γ f(x) = + γ - 1-cos 2π
2 2 2 b
for b < f(x) Nb (13)
≤
Thus, the twin boundary energy GPFEE can be expressed as:
+ + +
GPFE SF twin
m=- m=- m=-
E (d) = γ f(mb -d) b = γ f(mb -d) b + N -1 γ f(mb -d) b (14)
∞
∞

126
(3) Dislocation line energy, lineE
2 22 2
line
μb NμbE = N 1- νcos θ = 1- νcos θ (15)
2 1- ν 2 1- ν
As we will see in the total energy expression that the dislocation line energy, lineE , does not
depend on the spacing d, so it will not contribute to the critical twin nucleation stress.
(4) Applied work, W
Assuming the applied stress is uniform within the twin, the work done by the applied
shear stress on the crystal is
W = Nτdsh (16)
where s is the twinning shear.
When all the terms in the total energy expression are determined, the total energy for the
twin nucleation can be expressed as follows:
total int GPFE line
2 m=N-12 2
i=2
2+ +2
SF twin
m=- m=-
E = E + E + E - W =
μb L1- νcos θ N ln - ln N - 2 !+ ln N -i !+ ln i -1 ! +
4π 1- ν d
Nμbγ f(mb -d) b + N -1 γ f(mb -d) b + 1- νcos θ - Nτdsh (17)
2 1- ν
For a constant value of N in specific twin systems, the total energy is a function of the
spacing between adjacent twinning partials, d. The equilibrium d corresponds to the minimum
total energy. To determine the critical twin nucleation stress, critτ , we minimized the total energy
for the twin nucleation, totalE , with respect to d:
totalE= 0 (18)
d
∂
∂

127
The derived explicit and closed-form expression for crit is given by
2 2
tsf isfcrit us isf ut2
m=-1 -1
m=-
2 22 2
μb 1- νcos θ N 2γ + γbτ = + γ - γ + N -1 γ -
4π 1- ν shd N sh 2
2 mb -d mb - Nd× sin tan +...+ tan
N ζ ζ
- N -1 ζ-ζ× +...+
ζ + mb - 2d ζ + mb - Nd
(19)
We compared the critical twin nucleation stress, critτ , for L10 and 14M Ni2FeGa
predicted from our P-N formulation based twin nucleation model with the experimental twinning
stress data, and found excellent agreement without any fitting parameters (Table 6.2). The 'ideal
twinning stress' is calculated by the maximum slope of GPFE curve with respect to the shear
displacement and in the form of TMTMideal
γτ = π
b
[130]. Based on the P-N model shown earlier
[130], the 'Peierls stress 'p needed to move a twin partial dislocation is also determined. Note in
the Eq. (4) , the maxγ is replaced by TMγ . We note that the ideal twinning stress of 1420 MPa for
L10 is an order of magnitude larger than the twin nucleation stress observed experimentally; even
though the Peierls stress of 230 MPa is smaller than ideal twinning value, it is still much larger
than experimental data of 35-50 MPa. Similarly for 14M case, the ideal twinning stress and
Peierls stress are much larger than experimental data. Our model shows favorable agreement
between experiment and theory for 14M (27.5 MPa experiment (our experiment) vs 30 MPa
theory Eq. (19)). This observation demonstrates that the P-N formulation based twin nucleation
model provides an accurate prediction of the twin nucleation stress.

128
Table 6.2 The predicted critical twin nucleation stress, critτ , is compared with ideal twinning
stress, TMidealτ , Peierls stress, pτ , and available experimental data in L10 Ni2FeGa.
Crystal
Structure
Ni2FeGa
Ideal Twin Stress
(MPa)
TMTMideal
γτ = π
b
Twin Stress based
on Peierls (MPa)
TM
γ
p
E (u)1τ = max
b du
Twin Stress-
this study
(MPa) critτ
Eq.(13)
Experimental
Twin Stress
(MPa)[9]
L10
1420
230
52
35-50
14M
1779
120
30
25-35
We note that in the energy expressions, the spacing between the first (leading) and the
second dislocation, d, i.e. the tip behavior or the first two layers, governs the results. Therefore,
the role of varying spacing d along the length of the twin was considered, but this modification
did not change the stress values obtained in this work (the stress values calculated by varying
equilibrium spacing and by assuming constant equilibrium spacing are within 5%). For example,
for the case of Ni2MnGa 10M 3.8 MPa, for Ni2FeGa L10 49 MPa and for NiTi3 B19' 126 MPa
were obtained for variable d values in comparison with 3.5 MPa, 51 MPa and 129 MPa
respectively for constant d values.
6.5 Prediction of Twinning Stress in Shape Memory Alloys
To validate the P-N formulation based twin nucleation model, we calculated the critical
twinning stress crit predicted from the model for several important shape memory alloys and
compared the results to experimental twinning stress data. The martensitic crystal structures of
these materials present 10M (five-layered modulated tetragonal structure for Ni2MnGa and five-
layered modulated monoclinic structure for Ni2FeGa), 14M(seven-layered modulated monoclinic
129
structure), L10(non-modulated tetragonal structure) and B19' (monoclinic structure). We found
excellent agreement between the predicted values and experimental data without any fitting
parameters in theory as shown in Table 3. The equilibrium d corresponding to the minimum total
energy for different materials is also shown in Table 6.3. We considered both the important
crystal structures 10M and 14M in Ni2MnGa, and the monoclinic B19’ structure of NiTi. In all
cases, we determined the lattice constants prior to our simulations. The twin system and unstable
twin nucleation energy utγ corresponding to SMAs are also given.

130
Table 6.3 Predicted critical twin nucleation stresses theory
critτ for Shape Memory Alloys are compared to known reported experimental
valuesexpt
critτ . The twin systems, equilibrium spacing d and unstable twin nucleation energy utγ corresponding to SMAs are given. (10M,
14M, L10 and B19' are the martensitic crystal structures explained in the text).
Material Twin system 2
utγ (mJ / m )
(predicted)
d (Å)
(predicted)
theory
critτ (MPa)
(predicted)
expt
critτ (MPa)
(experiment)
Ni2MnGa 10M [100](010) 11 38 3.5 0.5-4 Ref. [184-190]
Ni2MnGa 14M [100](010) 20 21 9 2-10 Ref. [168,
188]
NiTi1 B19' (001)[1 00] 25 45 20 20-28 Ref. [20, 191]
Co2NiGa L10 (111)[11 2] 41 42 26 22-38 Ref. [16, 159]
Ni2FeGa 14M [100](010) 87 17 30 25-40 Ref.[9, 18]
NiTi2
B19' (100)[ 001] 102 35 43 26-47 Ref.[20, 191]
Co2NiAl L10 (111)[11 2] 124 37 48 32-51 Ref [16, 141]
Ni2FeGa L10 (111)[11 2] 142 24 51 35-50 Ref [9, 18]
NiTi3
B19' (201)[1 0 2] 180 9 129 112-130 Ref [20,
153]

131
We plot the predicted and experimental twinning stress of SMAs considered here against
utγ in Figure 12. We note that the monotonic increase in twinning stress with utγ , which, for the
first time, establishes an extremely important correlation between critτ and ut in SMAs. The
similar correlation between critτ and utγ has also been observed for fcc metals [76]. The physics
of twinning indicates that in order to form a twin boundary and for layer by layer growth to the
next twinning plane, the twinning partials must overcome the twin nucleation barrier utγ .
However, the relationship is affected by other parameters in the model so both the model and
experiment point to a rather complex relationship.
Figure 6. 12 The predicted and experimental twinning stress for SMAs versus unstable twin
nucleation energy utγ , from Table 6.3. The predicted twinning stress (red square) is in excellent
agreement with the experimental data (blue circle). The P-N formulation based twin nucleation
model reveals an overall monotonic trend between critτ and utγ . Note that NiTi1, NiTi
2 and
NiTi3 indicate three different twinning systems in NiTi as shown in Table 6.3.
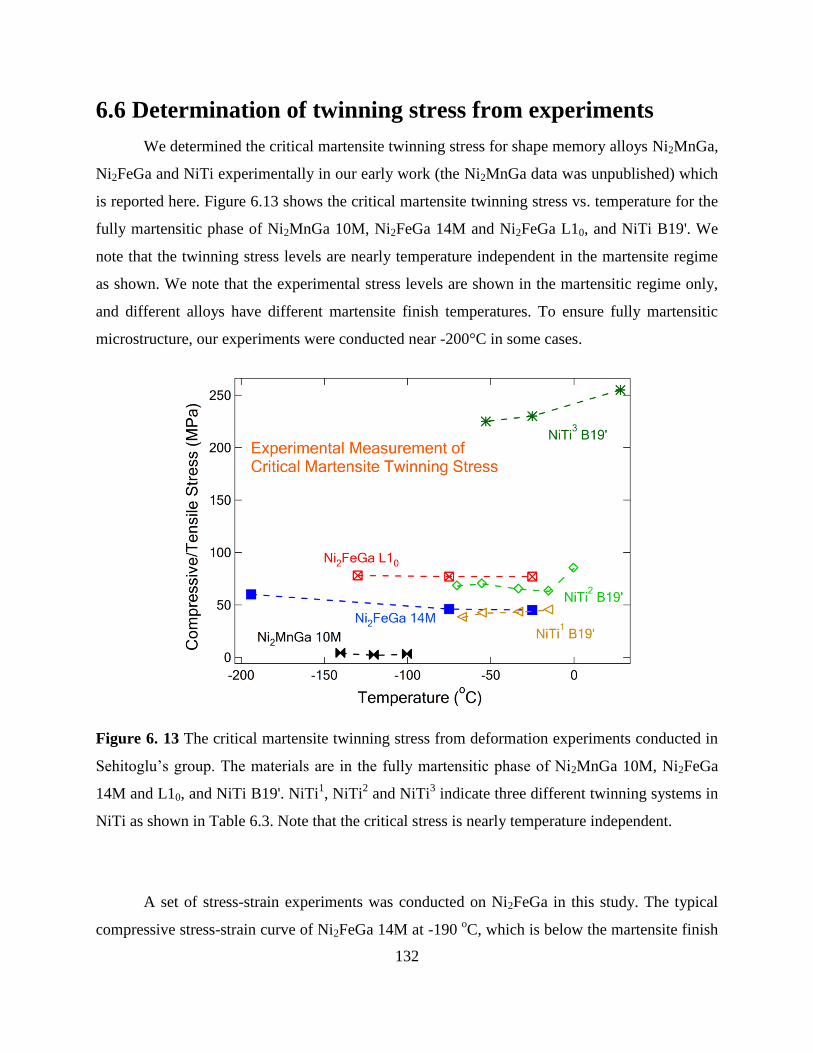
132
6.6 Determination of twinning stress from experiments
We determined the critical martensite twinning stress for shape memory alloys Ni2MnGa,
Ni2FeGa and NiTi experimentally in our early work (the Ni2MnGa data was unpublished) which
is reported here. Figure 6.13 shows the critical martensite twinning stress vs. temperature for the
fully martensitic phase of Ni2MnGa 10M, Ni2FeGa 14M and Ni2FeGa L10, and NiTi B19'. We
note that the twinning stress levels are nearly temperature independent in the martensite regime
as shown. We note that the experimental stress levels are shown in the martensitic regime only,
and different alloys have different martensite finish temperatures. To ensure fully martensitic
microstructure, our experiments were conducted near -200°C in some cases.
Figure 6. 13 The critical martensite twinning stress from deformation experiments conducted in
Sehitoglu’s group. The materials are in the fully martensitic phase of Ni2MnGa 10M, Ni2FeGa
14M and L10, and NiTi B19'. NiTi1, NiTi
2 and NiTi
3 indicate three different twinning systems in
NiTi as shown in Table 6.3. Note that the critical stress is nearly temperature independent.
A set of stress-strain experiments was conducted on Ni2FeGa in this study. The typical
compressive stress-strain curve of Ni2FeGa 14M at -190 oC, which is below the martensite finish

133
temperature (Mf), is shown in Figure 6.14 (this curve is representative of 5 repeated experiments).
The experiments were conducted in compression loading of [001] oriented single crystals of
Ni54Fe19Ga27. For T<Mf, the crystal is in the 14M state [18] subsequent to detwinning and
reorientation when the loading reached the critical twinning stress of 55 MPa. Because the
Schmid factor for the compressive axis [001] and twin system {110} <1 1 0 > in Ni2FeGa 14M is
0.5, the critical twinning stress at a temperature of -190 °C is then calculated as 27.5 MPa. This
experimentally measured twinning stress is in excellent agreement with the predicted value from
P-N formulation based twin nucleation model (30 MPa based on Equation 13). Upon unloading
the twinning-induced deformation remains as plastic strain. However, If the material is heated
above the austenite finish temperature (Af), the martensite to austenite transformation occurs and
the plastic strain can be fully recovered (shown in blue arrow).
Figure 6. 14 Compressive stress-strain response of Ni54Fe19Ga27 at a constant temperature of -
190 °C.
6.7 Discussion of Results
We presented a general framework for describing twinning in shape memory materials
with attention to the processes at the atomistic scale. Inevitably, there is complexity in twinning
of monoclinic, tetragonal, modulated monoclinic and orthorhombic martensitic structures. The

134
paper tries to demonstrate this complexity and revises the original P-N model. Without such
understanding, the characterization and design of new shape memory systems do not have a
strong scientific basis. We suggest that the results can serve as the foundation to develop a shape
memory materials modeling and discovery methodology, where the deformation behavior of the
material at the atomic level directly using quantum mechanics informs the higher length scale
calculations. This methodology incorporates the mesoscale P-N calculation. Previously, we
showed how energy barriers (calculated using first-principles DFT) are utilized in fcc metals to
capture the twinning stress. We noted the added complexities in the ordered shape memory
alloys, and the need to understand the mechanisms for the complex twinning where shear and
relaxation of atoms lead to accurate GPFE descriptions. We note that the magnitude of Peierls
stress calculated from the ‘classical’ Peierls-Nabarro model depends exponentially on the
dislocation core, which predicts significant core size dependence of critical stress nearly an order
of magnitude [130, 156, 166]. However, the derived formula of the critical twin nucleation stress
in the present study does not hold this exponential form and it is dependent on the elastic strain
energy due to the interaction of twinning partials in addition to the misfit energy. Therefore, the
core size of dislocation affects the twinning stress very slightly. For example, for the L10
Ni2FeGa varying ζ in the range of 1 Å to 1.5 Å ( for 0o to 90
o) resulted in crit in the range of
49 to 51 MPa. We also performed calculations using the local density approximation (LDA) to
determine the planar fault energies and performed simulations with the modified fault energies.
LDA and GGA are two widely used methods to describe the electronic exchange-correlation
interaction. Generally, LDA underestimates slightly the crystal lattice parameter; while, GGA
calculates the lattice parameter in a better agreement with experiments [192, 193] and provides a
substantially improved description of the ground state properties [194]. We calculated the lattice
parameter of cubic L21 Ni2FeGa, and found that the lattice parameter of 5.755 Å using GGA is
closer to experiments than that of 5.6 Å using LDA [15]. Since LDA underestimates the lattice
parameter and overestimate the cohesive energy, it will lead to shorter Burgers vector, smaller
interplanar distance and larger stacking fault energy [86, 192, 195]. These changes will cause
different (less accurate) twinning stress from the proposed twin nucleation model compared to
our present study using GGA. Here we compare calculated results of L10 Ni2FeGa by using LDA
and GGA as an example. We note that the twinning stress predicted from the present twin
nucleation model by using LDA is 59 MPa, which is 15% greater than the one of 51 MPa by

135
using GGA and much larger than the experimental results. However, the use of LDA does not
change the model itself and the critical twinning stress formula, so we believe that the
conclusions regarding to the twinning stress as a function of Burgers vector, interplanar distance
and twinning fault energies and the monotonic relation between critτ and utγ will still hold.
Table 6.4 Results comparison of LDA and GGA in L10 Ni2FeGa.
Calculations LDA GGA Experiments
Lattice parameter, a (Å) 3.58 3.68 3.81[9]
Lattice parameter, c (Å) 3.4 3.49 3.27[9]
Burgers vector (Å) 1.41 1.45
Interplanar distance (Å) 2.03 2.09
usγ (mJ/m2) 181 168
isfγ (mJ/m2) 89 85
utγ (mJ/m2) 153 142
tsf2γ (mJ/m2) 91 86
Twinning stress (MPa) 59 51 35-50 Ref [9, 18]
We note that the results are in agreement within 15% in most cases (for example, isfγ
values were 89 (mJ/m2) and 85 (mJ/m
2) and utγ levels were 153 (mJ/m
2) and 142 (mJ/m
2) for
LDA and GGA, respectively). The GGA based results compare more favorably with the
experimental twin stress levels.
The modeling results were checked with selected experiments to test the capability of the
methodology proposed. The simulations have been undertaken on new shape memory alloys
such as Ni2FeGa, Co2NiAl and Ni2MnGa exhibiting low twinning stress (<50 MPa). This is in
addition to the more established but equally complex NiTi which has multiple twin modes with

136
higher twin stresses (reaching >150 MPa). We further verified the predictions with experiments
measuring the twinning stress in 14M (modulated monoclinic) Ni2FeGa with excellent
agreement.
There are several observations that are unique to the findings in this study. We note that
twinning in these alloys cannot be classified with a simple mirror reflection; the shuffles due to
relaxation at the interfaces need to be considered. This modification provides more accurate
energy barriers. In addition to establishing the twinning stress our study provides a wealth of
information, such as the lattice constants (hence the volume change that plays an important role
in shape memory alloys), the shear moduli which can be all measured experimentally. It is the
determination of the twinning stress that is far more difficult experimentally because the
experiments need to be performed well below room temperature in several cases and very precise
stress-strain curves measurements on samples with uniform gage sections need to be established.
Large amount of efforts have been devoted to lowering the magnitude of twinning stress
in magnetic shape memory (MSM) alloys. The main alloy system of study has been Ni2MnGa
because it undergoes twinning at stress levels less than 10 MPa. The other candidate alloys of
interest include Ni2FeGa, Co2NiAl and Co2NiGa. Their twinning stress levels are also rather low
(less than 30 MPa). We predict the twinning stress in these materials with considerable accuracy
and without adjustable constants. The NiTi presents a complex system because the twin modes
change with deformation, from the {001} system to the {012} and higher order ones. This results
in an overall higher twin stress in the case of NiTi.
Finally, we note that in the 'pseudoelasticity' case, when the shape memory alloy
undergoes isothermally stress-induced transformation from austenite to martensite, the
martensite undergoes detwinning and this contributes to the overall recoverable strain. Upon
unloading, the martensite reverts back to austenite, and this called 'pseudoelasticity'. The
magnitude of the correspondence variant pair formation strain is of the order of 5% in NiTi while
the shear associated with detwinning is also nearly 5% making the total near 10%. In the case on
Ni2FeGa, the magnitude of the strains are higher (near 14%), and the process of twinning plays a
considerable role [8]. It is difficult to determine the twinning stress during pseudoelasticity

137
experiments; therefore theoretical calculations such as presented in this paper provide significant
understanding.
6.8 Conclusions
The work supports the following conclusions:
(1) The proposed twin nucleation model shows that Ni2MnGa 10M undergoes twinning at stress
level as low as 3.5 MPa in agreement with experiments (<4 MPa). The Ni2FeGa 14M undergoes
twinning at 30 MPa also in very close agreement with experiments conducted in this study (27.5
MPa). The predicted twinning stresses for NiTi are higher (43 MPa for the (100) case and 129
MPa for the (201) case) which are also in close agreement with experiments.
(2) The twinning stress for the newly proposed ferromagnetic shape memory alloys Co2NiGa,
Co2NiAl are 26 MPa and 48 MPa respectively, also in close agreement with experiments (22-38
MPa for Co2NiGa and 32-51 MPa for Co2NiAl).
(3) Depending on the martensitic structure and twin systems, the twinning processes may involve
combined shear and atomic shuffles such as for the case of B19' NiTi (100), which makes the
determination of GPFE landscape challenging. Nevertheless, the recognition of the out of plane
displacements at twin interfaces during simulations provides increasingly accurate results for the
energy barriers.
(4) The proposed twin nucleation model reveals that critτ has an overall monotonic dependence
on the unstable twin nucleation energy utγ . The critτ vs utγ plot was chosen to demonstrate
theory and experiment comparison. We note that crit prediction depends on the entire GPFE
landscape, the elastic constants, and the Burgers vectors, so a simple relationship can not be
written in an algebraic form. To achieve smaller twinning stress in shape memory alloys, shorter
Burgers vectors, lower unstable twin energies and larger interplanar distances are desirable.

138
Chapter 7 Summary and Future work
7.1 Summary
In this thesis, we first present an energetic approach to comprehend a better
understanding of phase stability, martensitic phase transformation and dislocation slip in SMAs
utilizing first principles simulations. By precisely determining energy barriers associated with the
phase transformation and dislocation slip, we provide an important insight of understanding the
role of energy barriers in SMAs. In the second part of the thesis, we extended the Peierls-
Nabarro (P-N) formulation with atomistic simulations to determine the Peierls stress in SMAs,
and developed a twin nucleation model based on P-N formulation to predict twin nucleation
stress in SMAs. These new models provide a precise, rapid and inexpensive approach to predict
the slip and twin stress in SMAs, and a better understanding to design new SMAs.
In Chapter 2, by utilizing atomistic simulations and considering small shear steps in
phase transformation, we discovered energy barriers in transformation path of NiTi and provide a
more authoritative explanation regarding the discrepancy between the experimental observations
and theoretical studies. The results resolved a longstanding problem plaguing the NiTi for
decades. We calculate the energy barriers in the phase transformation of B2 B19' B33 and
determine the crystal structure of transition states. In addition, we also investigated the effect of
hydrostatic pressure on the phase stability of B19' and B33 , and found that the B19' can be
energetically more stable than B33at high tension pressure.
In Chapter 3, we calculated the energy barriers associated with the martensitic
transformation from austenite L21 to modulated martensite 10M of Ni2FeGa incorporating shear
and shuffle and slip resistance in [111] direction as well as in [001] direction. The results show
that the unstable stacking fault energy barriers for slip by far exceeded the transformation
transition state barrier permitting transformation to occur with little irreversibility. This explains
the experimentally observed low martensitic transformation stress and high reversible strain in
Ni2FeGa. Our methodology is a foundational advance as it overcomes the limitations of the
modern understanding of SMAa that rely on the phenomenological theory, which does not deal
with the presence of dislocation slips.

139
In Chapter 4, we make quantitative advances towards understanding of plastic
deformation in B2 NiTi. We established the energetic pathway and calculated the theoretical
shear strength of several slip systems in B2 NiTi. The results show the smallest and second
smallest energy barriers and theoretical shear strength for the (011)[100] and the (011)[1 11]cases,
respectively, which are consistent with the experimental observations of dislocation slip reported
in this study. This work presents a quantitative understanding of plastic deformation mechanism
in B2 NiTi, and the methodology can be applied for consideration of a better understanding of
SMAs.
In Chapter 5, we extended the Peierls-Nabarro (P-N) model to precisely predict the
dislocation slip stress in SMAs utilizing atomistic simulations and mesomechanics tools
combined with experiments. We considered the sinusoidal series representation of GSFE in
SMAs and incorporated the energies into the P-N formulation. We validated our model by
performing experiments and the results show that this model provides precise and rapid results
compared to traditional experiments. This extended P-N model with GSFE curves provides an
excellent basis for a theoretical study of the dislocation structure and operative slip modes, and
an understanding to discovery of new compositions avoiding the trial-by-trial approach in SMAs.
In Chapter 6, we developed a twin nucleation model based on the classical Peierls-
Nabarro formulation to precisely predict twin nucleation stress in SMAs. This research is aimed
at developing a hierarchical methodology for advanced materials design utilizing the advanced
first principles/mesomechanics tools combined with experiments. We classified different twin
modes that are operative in different crystal structures and developed a methodology by
establishing the fault energy barriers that are in turn utilized to predict the twinning stress. This
new model provides a science-based understanding of the twin stress for developing alloys with
new methodologies.

140
7.2 Future work
Following the studies described in this thesis, a number of research projects could be
taken up based on the energetic approach and the proposed models for dislocation slip and twin
nucleation in SMAs.
In this thesis, we investigated the crystal structure, slip/twinning plane and direction of
alloys having the atomic percentage in the same magnitude order. For example, the
binary alloy NiTi has the atomic ratio of 1:1, and the ternary alloy Ni2FeGa has the
atomic ratio of 2:1:1. However, some intermetallic/alloys have the different atomic
percentage in a magnitude order. For example, the intermetallic Ni12Al3Ta has the atomic
ratio of 12:3:1. To generate the ordered crystal structure for this type of materials, a large
supercell is needed. Therefore, the GSFE for slip and GPFE for twin require further
attention and methods to capture the complex crystallography.
In the proposed models for dislocation slip and twin nucleation, the extended core
structure of dislocations derived from the Peierls-Nabarro (P-N) model has an arctan
form and predicts the slip/twin stresses in good agreement with experiments. We can also
perform atomic simulations using direct DFT to examine the dislocation core, and
compare the results (disregistry function of dislocation core) with the P-N approach.
Furthermore, the disregistry function of dislocation core determined using direct DFT can
be incorporated into the proposed dislocation slip and twin nucleation models to predict
the corresponding stresses, which can be compared to the results reported in this thesis.

141
References
[1] Ma J, Karaman I. Expanding the Repertoire of Shape Memory Alloys. Science
2010;327:1468.
[2] Lagoudas DC. Shape memory alloys: modeling and engineering applications: Springer,
2008.
[3] Otsuka K, Wayman CM, editors. Shape Memory Materials. Cambridge: Cambridge
University Press, 1998.
[4] Xiangyang H, Ackland GJ, Rabe KM. Crystal structures and shape-memory behaviour of
NiTi. Nature Materials 2003;2:307.
[5] Dolce M, Cardone D. Mechanical behaviour of shape memory alloys for seismic
applications 2. Austenite NiTi wires subjected to tension. International Journal of Mechanical
Sciences 2001;43:2657.
[6] Robertson S, Pelton A, Ritchie R. Mechanical fatigue and fracture of Nitinol.
International Materials Reviews 2012;57:1.
[7] Omori T, Kamiya N, Sutou Y, Oikawa K, Kainuma R, Ishida K. Phase transformations in
Ni–Ga–Fe ferromagnetic shape memory alloys. Materials Science and Engineering: A
2004;378:403.
[8] Hamilton RF, Sehitoglu H, Efstathiou C, Maier HJ. Inter-martensitic transitions in Ni-Fe-
Ga single crystals. Acta Materialia 2007;55:4867.
[9] Sutou Y, Kamiya N, Omori T, Kainuma R, Ishida K, Oikawa K. Stress-strain
characteristics in Ni-Ga-Fe ferromagnetic shape memory alloys. Applied Physics Letters
2004;84:1275.
[10] Hamilton RF, Efstathiou C, Sehitoglu H, Chumlyakov Y. Thermal and stress-induced
martensitic transformations in NiFeGa single crystals under tension and compression. Scripta
Materialia 2006;54:465.
[11] Whang SH, Feng Q, Gao YQ. Ordering, deformation and microstructure in L10 type FePt.
Acta Materialia 1998;46:6485.
[12] Hamilton RF, Sehitoglu H, Aslantas K, Efstathiou C, Maier HJ. Inter-martensite strain
evolution in NiMnGa single crystals. Acta Materialia 2008;56:2231.

142
[13] Masdeu F, Pons J, Segui C, Cesari E, Dutkiewicz J. Some features of Ni-Fe-Ga shape
memory alloys under compression. Journal of Magnetism and Magnetic Materials 2005;290-
291:816.
[14] Efstathiou C, Sehitoglu H, Carroll J, Lambros J, Maier HJ. Full-field strain evolution
during intermartensitic transformations in single-crystal NiFeGa. Acta Materialia 2008;56:3791.
[15] Sehitoglu H, Wang J, Maier HJ. Transformation and slip behavior of Ni2FeGa.
International Journal of Plasticity 2012;39:61.
[16] Chumlyakov Y, Kireeva I, Panchenko E, Timofeeva E, Pobedennaya Z, Chusov S,
Karaman I, Maier H, Cesari E, Kirillov V. High-temperature superelasticity in CoNiGa, CoNiAl,
NiFeGa, and TiNi monocrystals. Russian Physics Journal 2008;51:1016.
[17] Coughlin D, Phillips P, Bigelow G, Garg A, Noebe R, Mills M. Characterization of the
microstructure and mechanical properties of a 50.3 Ni-29.7 Ti-20Hf shape memory alloy. Scripta
Materialia 2012.
[18] Timofeeva E, Panchenko EY, Chumlyakov YI, Maier H. Development of thermoelastic
martensitic transformations in ferromagnetic [011]-oriented NiFeGa single crystals in
compression. Russian Physics Journal 2012:1.
[19] Liu Y, Xiang H. Apparent modulus of elasticity of near-equiatomic NiTi. Journal of
alloys and compounds 1998;270:154.
[20] Ezaz T, Sehitoglu H, Maier HJ. Energetics of twinning in martensitic NiTi. Acta
Materialia 2011;59:5893.
[21] Hamilton ARF, Sehitoglu AH, Efstathiou C, Maier HJ. Mechanical response of NiFeGa
alloys containing second-phase particles. Scripta Materialia 2007;57:497.
[22] Panchenko E, Chumlyakov Y, Maier H, Timofeeva E, Karaman I. Tension/compression
asymmetry of functional properties in [001]-oriented ferromagnetic NiFeGaCo single crystals.
Intermetallics 2010;18:2458.
[23] McDowell DL. A perspective on trends in multiscale plasticity. International Journal of
Plasticity 2010;26:1280.
[24] Kibey SA. Mesoscale models for stacking faults, deformation twins and martensitic
transformations: Linking atomistics to continuum: ProQuest, 2007.
[25] Kresse G, Hafner J. Ab initio molecular dynamics for open-shell transition metals.
Physical Review B (Condensed Matter) 1993;48:13115.

143
[26] Kresse G, Furthmuller J. Efficient iterative schemes for ab initio total-energy calculations
using a plane-wave basis set. Physical Review B (Condensed Matter) 1996;54:11169.
[27] Hartford J, von Sydow B, Wahnström G, Lundqvist BI. Peierls barriers and stresses for
edge dislocations in Pd and Al calculated from first principles. Physical Review B 1998;58:2487.
[28] CARREZ P, CORDIER P, MAINPRICE D, TOMMASI A. Slip systems and plastic
shear anisotropy in Mg2SiO4ringwoodite. European Journal of Mineralogy 2006;18:149.
[29] Nabarro FRN. Dislocation in a simple cubic lattice. Proc. Phys. Soc. 1947;59.
[30] R.E.Peierls. The size of a dislocaiton. Proc. Phys. Soc. 1940;52.
[31] Ezaz T, Sehitoglu H. Type II detwinning in NiTi. Applied Physics Letters 2011;98.
[32] Kudoh Y, Tokonami M, Miyazaki S, Otsuka K. Crystal structure of the martensite in Ti-
49.2 at.% Ni alloy analyzed by the single crystal X-ray diffraction method. Acta Metallurgica
1985;33:2049.
[33] Michal GM, Sinclair R. The structure of TiNi martensite. Acta Crystallographica, Section
B (Structural Crystallography and Crystal Chemistry) 1981;B37:1803.
[34] Prokoshkin SD, Korotitskiy AV, Brailovski V, Turenne S, Khmelevskaya IY, Trubitsyna
IB. On the lattice parameters of phases in binary Ti–Ni shape memory alloys. Acta Materialia
2004;52:4479.
[35] Guda Vishnu K, Strachan A. Phase stability and transformations in NiTi from density
functional theory calculations. Acta Materialia 2010;58:745.
[36] Hatcher N, Kontsevoi OY, Freeman AJ. Role of elastic and shear stabilities in the
martensitic transformation path of NiTi. Physical Review B (Condensed Matter and Materials
Physics) 2009;80:144203 (18 pp.).
[37] James R. Morris YY, Maja Krcmar and Chong Long Fu (2006). The Role of Phase
Stability in Ductile, Ordered B2 Intermetallics. MRS Proceedings,980,0980-II06-10
doi:10.1557/PROC-980-0980-II06-10
[38] Wagner MFX, Windl W. Lattice stability, elastic constants and macroscopic moduli of
NiTi martensites from first principles. Acta Materialia 2008;56:6232.
[39] Nishida M, Yamauchi K, Itai I, Ohgi H, Chiba A. High resolution electron microscopy
studies of twin boundary structures in B19′ martensite in the Ti-Ni shape memory alloy. Acta
Metallurgica et Materialia 1995;43:1229.

144
[40] Nishida M, Ohgi H, Itai I, Chiba A, Yamauchi K. Electron microscopy studies of twin
morphologies in B19 martensite in the Ti-Ni shape memory alloy. Acta Metallurgica et
Materialia 1995;43:1219.
[41] Onda T, Bando Y, Ohba T, Otsuka K. Electron microscopy study of twins in martensite
in a Ti-50.0 at.% Ni alloy. Materials Transactions, JIM 1992;33:354.
[42] Waitz T, Spisak D, Hafner J, Karnthaler HP. Size-dependent martensitic transformation
path causing atomic-scale twinning of nanocrystalline NiTi shape memory alloys. Europhysics
Letters 2005;71:98.
[43] Šesták P, Černý M, Pokluda J. Can twinning stabilize B19′ structure in NiTi martensite?
Intermetallics 2011;19:1567.
[44] Zhong Y, Gall K, Zhu T. Atomistic study of nanotwins in NiTi shape memory alloys.
Journal of Applied Physics 2011;110.
[45] Guda Vishnu K, Strachan A. Size effects in NiTi from density functional theory
calculations. Physical Review B 2012;85:014114.
[46] Holec D, Friák M, Dlouhý A, Neugebauer J. Ab initio study of pressure stabilized NiTi
allotropes: Pressure-induced transformations and hysteresis loops. Physical Review B
2011;84:224119.
[47] Šittner P, Lukáš P, Novák V, Daymond MR, Swallowe GM. In situ neutron diffraction
studies of martensitic transformations in NiTi polycrystals under tension and compression stress.
Materials Science and Engineering: A 2004;378:97.
[48] Olson GB, Cohen M. Thermoelastic behavior in martensitic transformations. Scripta
Metallurgica 1975;9:1247.
[49] Gall K, Sehitoglu H. The role of texture in tension-compression asymmetry in
polycrystalline NiTi. International Journal of Plasticity 1999;15:69.
[50] Melton KN, Mercier O. Fatigue of NiTi thermoelastic martensites. Acta Metallurgica
1979;27:137.
[51] Miyazaki S, Imai T, Igo Y, Otsuka K. Effect of cyclic deformation on the
pseudoelasticity characteristics of Ti-Ni alloys. Metallurgical Transactions A (Physical
Metallurgy and Materials Science) 1986;17A:115.

145
[52] Strnadel B, Ohashi S, Ohtsuka H, Ishihara T, Miyazaki S. Cyclic stress-strain
characteristics of Ti-Ni and Ti-Ni-Cu shape memory alloys. Materials Science and Engineering:
A 1995;202:148.
[53] Delaey L, Krishnan RV, Tas H, Warlimont H. Thermoelasticity, pseudoelasticity and the
memory effects associated with martensitic transformations. Journal of Materials Science
1974;9:1521.
[54] Surikova NS, Chumlyakov YI. Mechanisms of plastic deformation of the titanium
nickelide single crystals. Physics of Metals and Metallography 2000;89:196.
[55] Simon T, Kroger A, Somsen C, Dlouhy A, Eggeler G. On the multiplication of
dislocations during martensitic transformations in NiTi shape memory alloys. Acta Materialia
2010;58:1850.
[56] Norfleet DM, Sarosi PM, Manchiraju S, Wagner MFX, Uchic MD, Anderson PM, Mills
MJ. Transformation-induced plasticity during pseudoelastic deformation in Ni-Ti microcrystals.
Acta Materialia 2009;57:3549.
[57] Pelton AR, Huang GH, Moine P, Sinclair R. Effects of thermal cycling on microstructure
and properties in Nitinol. Materials Science and Engineering: A 2012;532:130.
[58] Kibey S, Sehitoglu H, Johnson DD. Energy landscape for martensitic phase
transformation in shape memory NiTi. Acta Materialia 2009;57:1624.
[59] Sanati M, Albers RC, Pinski FJ. Electronic and crystal structure of NiTi martensite.
Physical Review B (Condensed Matter) 1998;58:13590.
[60] Hamilton RF, Sehitoglu H, Chumlyakov Y, Maier HJ. Stress dependence of the
hysteresis in single crystal NiTi alloys. Acta Materialia 2004;52:3383.
[61] Tyumentsev AN, Surikova NS, Litovchenko IY, Pinzhin YP, Korotaev AD, Lysenko OV.
Mechanism of deformation and crystal lattice reorientation in strain localization bands and
deformation twins of the B2 phase of titanium nickelide. Acta Materialia 2004;52:2067.
[62] Moberly WJ, Proft JL, Duerig TW, Sinclair R. Deformation, twinning and thermo-
mechanical strengthening of Ti50Ni47Fe3. Acta metallurgica et materialia 1990;38:2601.
[63] Delaey L, Ortin J, Van Humbeeck J. Hysteresis effects in martensitic non-ferrous alloys.
Cambridge, UK: Inst. Met, 1988. p.60.
[64] Van Humbeeck J, Aernoudt E, Delaey L, Lu L, Verguts H, Ortin J. Hysteretic
transformation behaviour of shape memory alloys. vol. 23. Aussois, France, 1988. p.557.

146
[65] Delville R, Malard B, Pilch J, Sittner P, Schryvers D. Transmission electron microscopy
investigation of dislocation slip during superelastic cycling of Ni–Ti wires. International Journal
of Plasticity 2011;27:282.
[66] Duerig TW. Some unsolved aspects of Nitinol. Materials Science and Engineering A
2006;438-440:69.
[67] Kelly A, Groves GW, Kidd P. Crystallography and Crystal Defects: Wiley, 2000.
[68] Taylor GI. The Mechanism of Plastic Deformation of Crystals. Part I. Theoretical.
Proceedings of the Royal Society of London. Series A, Containing Papers of a Mathematical and
Physical Character 1934;145:362.
[69] Ardley GW, Cottrell AH. Yield points in brass crystals. Proceedings of the Royal Society
of London, Series A (Mathematical and Physical Sciences) 1953;219:328.
[70] Stoloff NS, Davies RG. Plastic deformation of ordered FeCo and Fe3Al alloys. Acta
Metallurgica 1964;12:473.
[71] Rachinger WA, Cottrell AH. Slip in crystals of caesium chloride type. Acta Metallurgica
1956;4:109.
[72] Vitek V. Intrinsic stacking faults in body-centred cubic crystals. Philosophical Magazine
1968;18:773.
[73] Wagoner Johnson AJ, Hamilton RF, Sehitoglu H, Biallas G, Maier HJ, Chumlyakov YI,
Woo HS. Analysis of multistep transformations in single-crystal NiTi. Metallurgical and
Materials Transactions A (Physical Metallurgy and Materials Science) 2005;36A:919.
[74] Hamilton R. Investigations into the Physical Mechanisms that Facilitate the
Transformation Hysteresis in Shape Memory Alloys. PhD Thesis, University of Illinois, Urbana
2008.
[75] Perdew JP, Burke K, Ernzerhof M. Generalized gradient approximation made simple.
Physical Review Letters 1996;77:3865.
[76] Kibey S, Liu JB, Johnson DD, Sehitoglu H. Predicting twinning stress in fcc metals:
linking twin-energy pathways to twin nucleation. Acta Materialia 2007;55:6843.
[77] Sade M, Rapacioli R, Ahlers M. Fatigue in Cu-Zn-Al single crystals. Acta Metallurgica
1985;33:487.
[78] Kajiwara S. Characteristic features of shape memory effect and related transformation
behavior in Fe-based alloys. Materials Science and Engineering A 1999;273:67.
147
[79] Sehitoglu H, Zhang XY, Kotil T, Canadinc D, Chumlyakov Y, Maier HJ. Shape memory
behavior of FeNiCoTi single and polycrystals. Metallurgical and Materials Transactions A:
Physical Metallurgy and Materials Science 2002;33:3661.
[80] Potter DI. Prediction of the operative slip system in CsCl type compounds using
anisotropic elasticity theory. . Material Science and Engineering 1970;5.
[81] Nabarro F. Mathematical theory of stationary dislocations. Advances in Physics
1952;1:269.
[82] Wang F. Bonding Theory of Metals and Alloys: Elsevier, 2005.
[83] Rice JR, Beltz GE. The activation energy for dislocation nucleation at a crack. Journal of
the Mechanics and Physics of Solids 1994;42:333.
[84] Rice JR. Dislocation nucleation from a crack tip: An analysis based on the Peierls
concept. Journal of the Mechanics and Physics of Solids 1992;40:239.
[85] Juan Y-M, Kaxiras E. Generalized stacking fault energy surfaces and dislocation
properties of silicon: A first-principles theoretical study. Philosophical Magazine A
1996;74:1367.
[86] Ogata S, Li J, Yip S. Ideal Pure Shear Strength of Aluminum and Copper. Science
2002;298:807.
[87] Sun QP, Hwang KC. Micromechanics modelling for the constitutive behavior of
polycrystalline shape memory alloys--I. Derivation of general relations. Journal of the
Mechanics and Physics of Solids 1993;41:1.
[88] Frick CP, Orso S, Arzt E. Loss of pseudoelasticity in nickel–titanium sub-micron
compression pillars. Acta Materialia 2007;55:3845.
[89] Moberly WJ. PhD Thesis- Mechanical twinning and twinless martensite in ternary
Ti50Ni(50-x)Mx intermetallics Stanford, 1991.
[90] Ezaz T, Sehitoglu H. Coupled shear and shuffle modes during twin growth in B2-NiTi.
Applied Physics Letters 2011;98:241906.
[91] Oikawa K, Omori T, Sutou Y, Kainuma R, Ishida K. Development of the Co-Ni-Al
ferromagnetic shape memory alloys. Journal De Physique. IV : JP 2003;112 II:1017.
[92] Chumlyakov Y, Kireeva I, Panchenko E, Timofeeva E, Pobedennaya Z, Chusov S,
Karaman I, Maier H, Cesari E, Kirillov V. High-temperature superelasticity in CoNiGa, CoNiAl,
NiFeGa, and TiNi monocrystals. Russian Physics Journal 2008;51:1016.

148
[93] Hamilton RF, Sehitoglu H, Efstathiou C, Maier HJ, Chumlyakov Y. Pseudoelasticity in
Co-Ni-Al single and polycrystals. Acta Materialia 2006;54:587.
[94] Santamarta R, Font J, Muntasell J, Masdeu F, Pons J, Cesari E, Dutkiewicz J. Effect of
ageing on the martensitic transformation of Ni-Fe-Ga alloys. Scripta Materialia 2006;54:1105.
[95] Hartl DJ, Chatzigeorgiou G, Lagoudas DC. Three-dimensional modeling and numerical
analysis of rate-dependent irrecoverable deformation in shape memory alloys. International
Journal of Plasticity 2010;26:1485.
[96] Pons J, Santamarta R, Chernenko VA, Cesari E. Long-period martensitic structures of Ni-
Mn-Ga alloys studied by high-resolution transmission electron microscopy. Journal of Applied
Physics 2005;97.
[97] Brown PJ, Crangle J, Kanomata T, Matsumoto M, Neumann KU, Ouladdiaf B, Ziebeck
KRA. The crystal structure and phase transitions of the magnetic shape memory compound
Ni2MnGa. Journal of Physics: Condensed Matter 2002;14:10159.
[98] Planes A, Obrado E, Gonzalez-Comas A, Manosa L. Premartensitic transition driven by
magnetoelastic interaction in BCC ferromagnetic Ni2MnGa. Physical Review Letters
1997;79:3926.
[99] Zheludev A, Shapiro SM, Wochner P, Tanner LE. Precursor effects and premartensitic
transformation in Ni2MnGa. Physical Review B (Condensed Matter) 1996;54:15045.
[100] Ullakko K, Huang JK, Kantner C, O'Handley RC, Kokorin VV. Large magnetic-field-
induced strains in Ni2MnGa single crystals. Applied Physics Letters 1996;69:1966.
[101] Kokorin VV, Martynov VV, Chernenko VA. Stress-induced martensitic transformations
in Ni2MnGa. Scripta metallurgica et materialia 1992;26:175.
[102] Arndt M, Griebel M, Novák V, Roubíček T, Šittner P. Martensitic transformation in
NiMnGa single crystals: Numerical simulation and experiments. International Journal of
Plasticity 2006;22:1943.
[103] Ullakko K, Huang JK, Kantner C, O'Handley RC, Kokorin VV. Large magnetic-field-
induced strains in Ni2MnGa single crystals. Applied Physics Letters 1996;69:1966.
[104] Barandiarán JM, Gutiérrez J, Lázpita P, Chernenko VA, Seguí C, Pons J, Cesari E,
Oikawa K, Kanomata T. Martensitic transformation in Ni–Fe–Ga alloys. Materials Science and
Engineering: A 2008;478:125.

149
[105] Oikawa K, Ota T, Ohmori T, Tanaka Y, Morito H, Fujita A, Kainuma R, Fukamichi K,
Ishida K. Magnetic and martensitic phase transitions in ferromagnetic Ni-Ga-Fe shape memory
alloys. Applied Physics Letters 2002;81:5201.
[106] Yu HJ, Fu H, Zeng ZM, Sun JX, Wang ZG, Zhou WL, Zu XT. Phase transformations and
magnetocaloric effect in NiFeGa ferromagnetic shape memory alloy. Journal of Alloys and
Compounds 2009;477:732.
[107] Ozdemir N, Karaman I, Mara N, Chumlyakov Y, Karaca H. Size effects in the
superelastic response of Ni54Fe19Ga27 shape memory alloy pillars with a two stage martensitic
transformation. Acta Materialia 2012.
[108] Chumlyakov YI, Kireeva IV, Panchenko EY, Kirillov VA, Timofeeva EE, Kretinina IV,
Danil’son YN, Karaman I, Maier H, Cesari E. Thermoelastic martensitic transformations in
single crystals with disperse particles. Russian Physics Journal 2012;54:937.
[109] Martynov VV. X-ray diffraction study of thermally and stress-induced phase
transformations in single crystalline Ni-Mn-Ga alloys. vol. 5. Lausanne, Switzerland: Editions de
Physique, 1995. p.91.
[110] Segui C, Chernenko VA, Pons J, Cesari E, Khovailo V, Takagi T. Low temperature-
induced intermartensitic phase transformations in Ni-Mn-Ga single crystal. Acta Materialia
2005;53:111.
[111] Ezaz T, Wang J, Sehitoglu H, Maier HJ. Plastic deformation of NiTi shape memory
alloys. Acta Materialia 2013;61:67.
[112] Gall K, Maier H. Cyclic deformation mechanisms in precipitated NiTi shape memory
alloys. Acta Materialia 2002;50:4643.
[113] Lu G, Kioussis N, Bulatov VV, Kaxiras E. The Peierls-Nabarro model revisited.
Philosophical Magazine Letters 2000;80:675.
[114] Joós B, Duesbery MS. The Peierls Stress of Dislocations: An Analytic Formula. Physical
Review Letters 1997;78:266.
[115] Wang G, Strachan A, Cagin T, Goddard III WA. Molecular dynamics simulations of
1/2a< 1 1 1> screw dislocation in Ta. Materials Science and Engineering: A 2001;309:133.
[116] Cordier P, Amodeo J, Carrez P. Modelling the rheology of MgO under Earth/'s mantle
pressure, temperature and strain rates. Nature 2012;481:177.

150
[117] Wheeler JM, Niederberger C, Tessarek C, Christiansen S, Michler J. Extraction of
plasticity parameters of GaN with high temperature, in situ micro-compression. International
Journal of Plasticity 2013;40:140.
[118] Miranda CR, Scandolo S. Computational materials science meets geophysics:
dislocations and slip planes of MgO. Computer Physics Communications 2005;169:24.
[119] Nabarro FRN. Theoretical and experimental estimates of the Peierls stress. Philosophical
Magazine A 1997;75:703.
[120] Schoeck G. Peierls Energy of Dislocations: A Critical Assessment. Physical Review
Letters 1999;82:2310.
[121] Appel F, Paul JDH, Oehring M. Deformation Behavior of Single-Phase Alloys. Gamma
Titanium Aluminide Alloys. Wiley-VCH Verlag GmbH & Co. KGaA, 2011. p.71.
[122] Fu CL, Yoo MH. Deformation behavior of B2 type aluminides: FeAl and NiAl. Acta
Metallurgica et Materialia 1992;40:703.
[123] Paidar V. Generalized stacking faults in model lattice of ordered Fe-Si alloys.
Czechoslovak Journal of Physics 1976;26:865.
[124] Liu YL, Liu LM, Wang SQ, Ye HQ. First-principles study of shear deformation in TiAl
and Ti3Al. Intermetallics 2007;15:428.
[125] Paidar V. Behaviour of dislocations in TiAl intermetallics. Materials Science and
Engineering: A 2004;387–389:977.
[126] Ehmann J, Fähnle M. Generalized stacking-fault energies for TiAl: Mechanical instability
of the (111) antiphase boundary. Philosophical Magazine A 1998;77:701.
[127] Kibey S, Liu JB, Curtis MJ, Johnson DD, Sehitoglu H. Effect of nitrogen on generalized
stacking fault energy and stacking fault widths in high nitrogen steels. Acta Materialia
2006;54:2991.
[128] Liu J, Johnson D. bcc-to-hcp transformation pathways for iron versus hydrostatic
pressure: Coupled shuffle and shear modes. Physical Review B 2009;79:134113.
[129] Joós B, Ren Q, Duesbery MS. Peierls-Nabarro model of dislocations in silicon with
generalized stacking-fault restoring forces. Physical Review B 1994;50:5890.
[130] Ogata S, Ju L, Yip S. Energy landscape of deformation twinning in bcc and fcc metals.
Physical Review B (Condensed Matter and Materials Physics) 2005;71:224102.

151
[131] Carrez P, Ferré D, Cordier P. Peierls–Nabarro model for dislocations in MgSiO3 post-
perovskite calculated at 120 GPa from first principles. Philosophical Magazine 2007;87:3229.
[132] Lejček L. On minimum of energy in the Peierls-Nabarro dislocation model. Czech J Phys
1973;23:176.
[133] Tadmor EB, Miller RE. Modeling Materials: Continuum, Atomistic and Multiscale
Techniques: Cambridge University Press, 2011.
[134] Medvedeva NI, Mryasov ON, Gornostyrev YN, Novikov DL, Freeman AJ. First-
principles total-energy calculations for planar shear and cleavage decohesion processes in B2-
ordered NiAl and FeAl. Physical Review B 1996;54:13506.
[135] Crawford RC, Ray ILF, Cockayne DJH. The weak-beam technique applied to superlattice
dislocations in iron-aluminium alloys. Philosophical Magazine 1973;27:1.
[136] Stroh AN. Dislocations and Cracks in Anisotropic Elasticity. Philosophical Magazine
1958;3:625.
[137] Whelan M, Hirsch P, Horne R, Bollmann W. Dislocations and stacking faults in stainless
steel. Proceedings of the Royal Society of London. Series A, Mathematical and Physical
Sciences 1957:524.
[138] Hosford WF. Mechanical behavior of materials: Cambridge University Press, 2005.
[139] Wang JN. Prediction of Peierls stresses for different crystals. Materials Science and
Engineering: A 1996;206:259.
[140] Karaman I, Lagoudas DC. Magnetic Shape Memory Alloys with High Actuation Forces.
DTIC Document, 2006.
[141] Dilibal S, Sehitoglu H, Hamilton R, Maier H, Chumlyakov Y. On the volume change in
Co–Ni–Al during pseudoelasticity. Materials Science and Engineering: A 2011;528:2875.
[142] Efstathiou C, Sehitoglu H. Local transformation strain measurements in precipitated NiTi
single crystals. Scripta Materialia 2008;59:1263.
[143] Sehitoglu H, Jun J, Zhang X, Karaman I, Chumlyakov Y, Maier HJ, Gall K. Shape
memory and pseudoelastic behavior of 51.5%Ni-Ti single crystals in solutionized and overaged
state. Acta Materialia 2001;49:3609.
[144] Wang Y, Zheng Y, Cai W, Zhao L. The tensile behavior of Ti36Ni49Hf15 high
temperature shape memory alloy. Scripta Materialia 1999;40:1327.

152
[145] Romero R, Lovey F, Ahlers M. Plasticity in phase Cu-Zn-Al alloys. Philosophical
Magazine A 1988;58:881.
[146] Wollmershauser JA, Kabra S, Agnew SR. In situ neutron diffraction study of the plastic
deformation mechanisms of B2 ordered intermetallic alloys: NiAl, CuZn, and CeAg. Acta
Materialia 2009;57:213.
[147] Clouet E. Screw dislocation in zirconium: An ab initio study. Physical Review B
2012;86:144104.
[148] Hartford J, Von Sydow B, Wahnström G, Lundqvist B. Peierls barriers and stresses for
edge dislocations in Pd and Al calculated from first principles. Physical Review B 1998;58:2487.
[149] Lu G. The Peierls—Nabarro model of dislocations: A venerable theory and its current
development. Handbook of Materials Modeling. Springer, 2005. p.793.
[150] Trinkle DR. Lattice Green function for extended defect calculations: Computation and
error estimation with long-range forces. Physical Review B 2008;78:014110.
[151] Woodward C. First-principles simulations of dislocation cores. Materials Science and
Engineering: A 2005;400:59.
[152] Woodward C, Rao S. Flexible ab initio boundary conditions: simulating isolated
dislocations in bcc Mo and Ta. Physical review letters 2002;88:216402.
[153] Ezaz T, Sehitoglu H, Abuzaid W, Maier H. Higher order twin modes in martensitic NiTi-
The (20-1) Case. Materials Science and Engineering: A 2012.
[154] Hodgson DE, Ming W, Biermann RJ. Shape memory alloys. ASM International, Metals
Handbook, Tenth Edition. 1990;2:897.
[155] Pond RC, Muntifering B, Müllner P. Deformation twinning in Ni2MnGa. Acta Materialia
2012;60:3976.
[156] Rajasekhara S, Ferreira PJ. A dislocation model for the magnetic field induced shape
memory effect in Ni2MnGa. Scripta Materialia 2005;53:817.
[157] Brown PJ, Dennis B, Crangle J, Kanomata T, Matsumoto M, Neumann K-U, Justham
LM, Ziebeck KRA. Stability of martensitic domains in the ferromagnetic alloy Ni 2 MnGa: a
mechanism for shape memory behaviour. Journal of Physics: Condensed Matter 2004;16:65.
[158] Han M, Bennett JC, Gharghouri MA, Chen J, Hyatt CV, Mailman N. Microstructure
characterization of the non-modulated martensite in Ni–Mn–Ga alloy. Materials Characterization
2008;59:764.

153
[159] Kireeva I, Chumlyakov Y, Pobedennaya Z, Kretinina I, Cesari E, Kustov S, Picornell C,
Pons J, Karaman I. Orientation dependence of superelasticity in ferromagnetic single crystals
Co49Ni21Ga30. The Physics of Metals and Metallography 2010;110:78.
[160] Chu F, Pope DP. Deformation twinning in intermetallic compounds—the dilemma of
shears vs. shuffles. Materials Science and Engineering: A 1993;170:39.
[161] Heo YU, Lee HC. The twin and twin system in FCT L10 θ-MnNi phase in an equiatomic
Mn-Ni alloy. MATERIALS TRANSACTIONS 2007;48:2546.
[162] Yoo M. Deformation twinning in superlattice structures. Journal of Materials Research
1989;4:50.
[163] Kibey S, Liu J, Johnson D, Sehitoglu H. Generalized planar fault energies and twinning
in Cu–Al alloys. Applied Physics Letters 2006;89:191911.
[164] Siegel DJ. Generalized stacking fault energies, ductilities, and twinnabilities of Ni and
selected Ni alloys. Applied Physics Letters 2005;87:121901.
[165] Warner D, Curtin W, Qu S. Rate dependence of crack-tip processes predicts twinning
trends in fcc metals. Nature Materials 2007;6:876.
[166] Kang K, Bulatov VV, Cai W. Singular orientations and faceted motion of dislocations in
body-centered cubic crystals. Proceedings of the National Academy of Sciences 2012;109:15174.
[167] Soolshenko V, Lanska N, Ullakko K. Structure and twinning stress of martensites in non-
stoichiometric Ni2MnGa single crystal. International Conference on Martensitic Transformations,
June 10, 2002 - June 14, 2002, vol. 112 II. Espoo, Finland: EDP Sciences, 2003. p.947.
[168] Sozinov A, Likhachev A, Lanska N, Ullakko K. Giant magnetic-field-induced strain in
NiMnGa seven-layered martensitic phase. Applied Physics Letters 2002;80:1746.
[169] Aaltio I. Role of twin boundary mobility in performance of the Ni-Mn-Ga single crystals.
2011.
[170] Zayak A, Adeagbo WA, Entel P, Buchelnikov VD. Crystal structures of Ni2MnGa from
density functional calculations. Phase Transitions 2005;78:259.
[171] Luo HB, Li CM, Hu QM, Kulkova SE, Johansson B, Vitos L, Yang R. First-principles
investigations of the five-layer modulated martensitic structure in Ni 2Mn(Al xGa 1-x) alloys.
Acta Materialia 2011;59:5938.
154
[172] Kainuma R, Nakano H, Ishida K. Martensitic transformations in NiMnAl β phase
alloys. Metallurgical and Materials Transactions A: Physical Metallurgy and Materials Science
1996;27A:4153.
[173] Schoeck G. The Peierls stress in a simple cubic lattice. physica status solidi (b)
2011;248:2284.
[174] Hirth J P LJ. Theory of Dislocations: McGraw Hill Book Company, 1968.
[175] Dunand D, Mari D, Bourke M, Roberts J. NiTi and NiTi-TiC composites: Part IV.
Neutron diffraction study of twinning and shape-memory recovery. Metallurgical and Materials
Transactions A 1996;27:2820.
[176] Jin Z, Bieler TR. An in-situ observation of mechanical twin nucleation and propagation
in TiAl. Philosophical Magazine A 1995;71:925.
[177] Zhang L. Twin-intersection-related nanotwinning in a heavily deformed gamma-TiAl-
based alloy. Philosophical Magazine Letters 1999;79:49.
[178] Müllner P, Romanov A. Internal twinning in deformation twinning. Acta Materialia
2000;48:2323.
[179] Gutkin MY, Ovid’ko I, Skiba N. Mechanism of deformation-twin formation in
nanocrystalline metals. Physics of the Solid State 2007;49:874.
[180] Marcinkowski M, Sree Harsha K. Numerical Analysis of Deformation Twin Behavior.
Small Static Twin Lamellas. Journal of Applied Physics 1968;39:6063.
[181] Appel F, Paul JDH, Oehring M. Gamma Titanium Aluminide Alloys: Science and
Technology: Wiley, 2011.
[182] Cooper R. THE EQUILIBRIUM SHAPE OF DEFORMATION TWINS. PT. 2. Acta Met
1966;14:78.
[183] Cooper R. The equilibrium shape of deformation twins. Acta Metallurgica 1965;13:46.
[184] Sozinov A, Likhachev AA, Ullakko K. Magnetic and magnetomechanical properties of
Ni-Mn-Ga alloys with easy axis and easy plane of magnetization. SPIE's 8th Annual
International Symposium on Smart Structures and Materials: International Society for Optics and
Photonics, 2001. p.189.
[185] Straka L, Novák V, Landa M, Heczko O. Acoustic emission of Ni–Mn–Ga magnetic
shape memory alloy in different straining modes. Materials Science and Engineering: A
2004;374:263.
155
[186] Callaway JD, Sehitoglu H, Hamilton RF, Aslantas K, Miller N, Maier HJ, Chumlyakov Y.
Magnetic shape memory in Ni2MnGa as influenced by applied stress. Applied Physics Letters
2006;89:221905.
[187] Chulist R, Sozinov A, Straka L, Lanska N, Soroka A, Lippmann T, Oertel C-G, Skrotzki
W. Diffraction study of bending-induced polysynthetic twins in 10M modulated Ni-Mn-Ga
martensite. Journal of Applied Physics 2012;112:063517.
[188] Soolshenko V, Lanska N, Ullakko K. Structure and twinning stress of martensites in non-
stoichiometric NiMnGa single crystal. Journal de Physique IV (Proceedings), vol. 112, 2003.
p.947.
[189] Müllner P, King A. Deformation of hierarchically twinned martensite. Acta Materialia
2010;58:5242.
[190] Müllner P, Chernenko V, Kostorz G. A microscopic approach to the magnetic-field-
induced deformation of martensite (magnetoplasticity). Journal of Magnetism and Magnetic
Materials 2003;267:325.
[191] Sehitoglu H, Karaman I, Anderson R, Zhang X, Gall K, Maier HJ, Chumlyakov Y.
Compressive response of NiTi single crystals. Acta Materialia 2000;48:3311.
[192] Yan J-A, Wang C-Y, Wang S-Y. Generalized-stacking-fault energy and dislocation
properties in bcc Fe: A first-principles study. Physical Review B 2004;70:174105.
[193] Gall K, Tyber J, Brice V, Frick CP, Maier HJ, Morgan N. Tensile deformation of NiTi
wires. Journal of Biomedical Materials Research Part A 2005;75:810.
[194] Lazar P, Naturarum DR. Ab initio modelling of mechanical and elastic properties of
solids: University of Vienna Vienna, 2006.
[195] Frick CP, Ortega AM, Tyber J, Gall K, Maier HJ. Multiscale structure and properties of
cast and deformation processed polycrystalline NiTi shape-memory alloys. Metallurgical and
Materials Transactions A 2004;35:2013.

156
Publications
1. J. Wang, H. Sehitoglu, Resolving quandaries surrounding NiTi, Applied Physics Letters,
101, 081907, 2012.
2. H. Sehitoglu, J. Wang, H. J. Maier, Transformation and slip behavior of Ni2FeGa,
International Journal of Plasticity, Vol 39, P.61–74, 2012.
3. T. Ezaz, J. Wang, H. Sehitoglu, H. J. Maier, Plastic deformation of NiTi shape memory
alloys, Acta Materialia, Vol 61, P. 6790–6801, 2013.
4. J. Wang, H. Sehitoglu, Twinning Stress in Shape Memory Alloys-Theory and
Experiments, Acta Materialia, Vol 61, P. 67–78, 2013.
5. J. Wang, H. Sehitoglu, H. J. Maier, Dislocation Slip Stress Prediction in Shape Memory
Alloys, International Journal of Plasticity, in press, 2013.
6. J. Wang, H. Sehitoglu, Dislocation Slip and Twinning in Ni-based L12 type Alloys,
submitted to Intermetallics, 2013.