DISINFECTION BYPRODUCT PRECURSORS FROM WASTEWATER ORGANICS ...
168
The Pennsylvania State University The Graduate School Department of Civil and Environmental Engineering DISINFECTION BYPRODUCT PRECURSORS FROM WASTEWATER ORGANICS: FORMATION POTENTIAL AND INFLUENCE OF BIOLOGICAL TREATMENT PROCESSES A Dissertation in Environmental Engineering by Hao Tang 2011 Hao Tang Submitted in Partial Fulfillment of the Requirements for the Degree of Doctor of Philosophy August 2011
Transcript of DISINFECTION BYPRODUCT PRECURSORS FROM WASTEWATER ORGANICS ...
The Pennsylvania State University
The Graduate School
Department of Civil and Environmental Engineering
DISINFECTION BYPRODUCT PRECURSORS FROM WASTEWATER ORGANICS:
FORMATION POTENTIAL AND INFLUENCE OF BIOLOGICAL TREATMENT
PROCESSES
A Dissertation in
Environmental Engineering
by
Hao Tang
2011 Hao Tang
Submitted in Partial Fulfillment
of the Requirements
for the Degree of
Doctor of Philosophy
August 2011

The dissertation of Hao Tang was reviewed and approved* by the following:
John M. Regan
Associate Professor of Environmental Engineering
Dissertation Co-Advisor
Co-Chair of Committee
Yuefeng F. Xie
Professor of Environmental Engineering
Dissertation Co-Advisor
Co-Chair of Committee
Brian A. Dempsey
Professor of Environmental Engineering
Yen-Chih Chen
Assistant Professor of Environmental Engineering
Peggy A. Johnson
Professor of Civil Engineering
Head of the Department of Civil and Environmental Engineering
*Signatures are on file in the Graduate School

iii
ABSTRACT
Wastewater organics are an important source of various disinfection byproduct (DBP) precursors
in downstream potable water supplies. Because of the various biological treatment processes
adopted at wastewater treatment plants (WWTPs), the effluents may have a wide range of
qualities, especially in DBP precursors. To minimize the risks posed by DBP-related issues, it is
necessary to investigate the essence of DBP precursors in wastewater and evaluate the influence
of biological treatment processes.
Because conventional practices for evaluating DBP precursors in drinking water cannot
be used directly in wastewater due to the complexity of wastewater constituents, a DBP formation
potential (FP) quantification method was developed and used for wastewater samples. Sample
pretreatment was required to maintain the level of DBPFP and filtration coupled with
acidification to pH less than 2 produced stable samples for DBPFP assessment and has
advantages for long-term storage. The proposed method for quantification of DBPFP in
wastewater is based on the standardized parameters in the chlorination conditions, which include
20 mg/L chlorine dose, pH 7, 25°C, and an incubation of 3 days in the dark. Proper dilution is a
key to assure that free chlorine residual remains after incubation. It is recommended that the
dilution ratio be determined based on the ammonia level. The proposed method was validated by
varying chlorine doses and ammonia levels, and could be used to quantify DBPFP for a broad
range of wastewater samples.
A survey on DBPFP of treated effluents from various WWTPs was conducted to explore
the influence of different biological treatment processes on DBP precursors. The WWTPs that
achieved better organic matter removal and nitrification tended to result in low DBPFP in treated
effluents. By focusing on a model WWTP that had two biological processes for the same primary
effluent treatment, the survey found that haloacetic acid (HAA), trihalomethane (THM) and

iv
chloral hydrate (CH) precursors were in predominant concentrations in wastewater. The
combination of trickling filter and modified Ludzack-Ettinger process was more efficient in
dissolved organics and DBPFP removal than the activated sludge process. The FPs of
haloacetonitriles and haloketones showed the highest removal efficiencies in both systems
compared to the FPs of other predominant DBP species such as HAAs and THMs. In addition,
WWTP changed the DBPFP speciation profile by lowering the HAAFP/THMFP ratio. The DBP
yields and specific ultraviolet absorbance increased after secondary treatment, indicating that the
remaining organic matters tend to be more humic. The study implied that oxic and anoxic
conditions, soluble microbial products, nitrification, and solid retention time may impact
DBPFPs. The study is a comprehensive survey on an assessment of DBP precursor removal
efficiencies in a large-scale WWTP.
Three continuously stirred tank reactors (CSTRs) and two sequencing batch reactors
(SBRs) were designed to simulate different biological treatment processes in the laboratory. For
the three CSTRs, HAAFP decreased as nitrification improved from a poor to a good level.
THMFP, however, was not found to be clearly correlated with nitrification. For the two SBRs that
were operated at the same SRTs and with complete nitrification, the oxic-anoxic SBR with better
denitrification had decreased DBPFP. During an 8-h cycle of an SBR operation, the majority of
DBP precursor removal was completed with the bulk removal of wastewater organics. The oxic
reactions had a faster removal rate and greater removal efficiency than the anoxic reactions.
Although the majority of wastewater organics were removed by biological treatment processes,
the remaining organic matter had a higher potential to form DBPs upon chlorination. The study
provides information on the effectiveness of wastewater treatment processes on a variety of
wastewater parameters, organic matter, and precursors for DBPs. The information can be
beneficially used by wastewater and water professionals to minimize the health risks posed by
wastewater-derived DBPs.

v
Materials of human origin (MHOs) are the main constituents of wastewater organics.
This research monitored DBPs in an indoor swimming pool over a 1-year period following water
change, explored DBPFP from MHOs, and developed a model to simulate DBPs in swimming
pool water. As the time since the water change increased, the HAA concentrations increased up to
1650 µg/L while the THM concentrations fluctuated in a range between 40 and 181 µg/L over the
1-year period in the monitored pool. The difference between the concentrations of HAAs and
THMs is attributed to three factors: (1) MHOs from pool users; (2) slow HAA reduction; and (3)
long water retention. The model developed based on a mass balance and pseudo first-order
kinetics achieved a good simulation of a real swimming pool system at long water age. The
sensitivity analysis indicates that MHO loadings would impact DBPs in swimming pool water.
The research reveals that MHOs contribute to DBP formation and are an important source of
DBPs in swimming pools. As MHOs are continuously brought in by swimmers and pools are
continuously exposed to disinfectants, pool water represents extreme cases of disinfection that
differ from the disinfection of drinking water, and the net-accumulated HAAs could pose
negative health risks to human beings. The study can help water professionals to better
understand the contribution of MHOs to DBP precursors.

vi
TABLE OF CONTENTS
LIST OF FIGURES ................................................................................................................. ix
LIST OF TABLES ................................................................................................................... xi
ACKNOWLEDGEMENTS ..................................................................................................... xii
Chapter 1 Introduction ............................................................................................................. 1
DBP-Related Issues from Wastewater Organics .............................................................. 1 Research Summaries ........................................................................................................ 4
Quantification of DBPFP in Wastewater ................................................................. 4 DBPFPs of Wastewater Effluents and Their Removal in WWTPs .......................... 5 Impact of Biological Treatment Processes on DBPFP in Wastewater ..................... 6 Materials of Human Origin as a Source of DBP Precursors .................................... 7
Further Research .............................................................................................................. 9 Literature Cited ................................................................................................................ 9
Chapter 2 Literature Review .................................................................................................... 12
DBP Precursors from Natural Organics ........................................................................... 12 Disinfection of drinking water and DBP formation ................................................. 12 DBP precursors in drinking water ............................................................................ 16 Quantification of DBP precursors in drinking water ................................................ 17 Influence of treatment processes on DBP precursors in drinking water .................. 18
DBP Precursors from Wastewater Organics .................................................................... 19 Disinfection of wastewater and DBP formation ....................................................... 19 DBP precursors in wastewater ................................................................................. 20 Quantification of DBP precursors in wastewater ..................................................... 23 Influence of treatment processes on DBP precursors in wastewater ........................ 24
Literature Cited ................................................................................................................ 27
Chapter 3 Quantification of Disinfection Byproduct Formation Potential in Wastewater ...... 35
Abstract ............................................................................................................................ 35 Introduction ...................................................................................................................... 36 Materials and Methods ..................................................................................................... 38
Chemicals ................................................................................................................. 38 Wastewater sampling, pretreatment, and characterization ....................................... 38 Dilution and buffering of wastewater ....................................................................... 39 Chlorination and incubation of wastewater .............................................................. 39 DBP analyses ........................................................................................................... 39 DBP measurements .................................................................................................. 40 Statistical analysis .................................................................................................... 41
Results and Discussion ..................................................................................................... 41 Sample Pretreatment ................................................................................................ 41 Chlorination Conditions ........................................................................................... 44 Method Validation.................................................................................................... 45

vii
Conclusions ...................................................................................................................... 47 Acknowledgements .......................................................................................................... 47 Literature Cited ................................................................................................................ 48 List of Figure and Table Captions .................................................................................... 51
Chapter 4 Disinfection Byproduct Formation Potentials of Wastewater Effluents and
Their Removal in a Model Wastewater Treatment Plant ................................................. 58
Abstract ............................................................................................................................ 58 Introduction ...................................................................................................................... 59 Materials and Methods ..................................................................................................... 61
WWTPs Surveyed .................................................................................................... 61 The model WWTP ................................................................................................... 61 Sample preservation and the FP test......................................................................... 62 DBP extractions and measurements ......................................................................... 62 Data and statistical analysis ...................................................................................... 63
Results and Discussion ..................................................................................................... 64 Effluents of the nine WWTPs .................................................................................. 64 The model WWTP ................................................................................................... 67 Implications of the process impact ........................................................................... 69
Conclusions ...................................................................................................................... 73 Acknowledgements .......................................................................................................... 73 Literature Cited ................................................................................................................ 74 List of Figure and Table Captions .................................................................................... 77
Chapter 5 Impact of Biological Treatment Processes on Disinfection Byproduct
Formation Potential in Wastewater .................................................................................. 85
Abstract ............................................................................................................................ 85 Introduction ...................................................................................................................... 86 Materials and Methods ..................................................................................................... 89
Wastewater ............................................................................................................... 89 Reactors for nitrification .......................................................................................... 89 Reactors for O/A and A/O processes ....................................................................... 89 Measurements of operational conditions .................................................................. 90 Formation potential test ............................................................................................ 91 DBP extraction and analyses .................................................................................... 92
Results and Discussion ..................................................................................................... 93 Effect of SRT ........................................................................................................... 93 Effect of Denitrification ........................................................................................... 94 Fate of DBP precursors ............................................................................................ 95 Implications .............................................................................................................. 99
Conclusions ...................................................................................................................... 101 Acknowledgements .......................................................................................................... 101 Literature Cited ................................................................................................................ 102 List of Figure and Table Captions .................................................................................... 107
Chapter 6 Materials of Human Origin as a Source of Disinfection Byproduct Precursors ..... 123
viii
Abstract ............................................................................................................................ 123 Introduction ...................................................................................................................... 124 Materials and Methods ..................................................................................................... 126
Swimming pool ........................................................................................................ 126 MHOs ....................................................................................................................... 126 DBPFP test ............................................................................................................... 127 DBP extractions and analyses .................................................................................. 127 Modeling approach ................................................................................................... 128
Results and Discussion ..................................................................................................... 129 DBPs in the monitored swimming pool ................................................................... 129 DBPFPs and DBP yields from MHOs ..................................................................... 130 Simulations on DBP formation and reduction ......................................................... 132 The swimming pool DBP model .............................................................................. 133
Conclusions ...................................................................................................................... 137 Acknowledgements .......................................................................................................... 137 Literature Cited ................................................................................................................ 138 List of Figure and Table Captions .................................................................................... 142
Appendix: Abbreviations ......................................................................................................... 152
ix
LIST OF FIGURES
Figure 2-2. Haloform reaction with fulvic acids and resorcinol .............................................. 14
Figure 2-2. Generalized conceptual model for the formation of major halide products
from fulvic acid ................................................................................................................ 15
Figure 3-1. Impact of sample pretreatment on DBPFPs of wastewater samples ..................... 52
Figure 3-2. Impact of filter pore size on DBPFPs of wastewater samples .............................. 53
Figure 3-3. Impact of dilution ratio on DBPFPs of wastewater samples: (a) Effluent from
Annville Wastewater Treatment Plant; (b) Effluent from Middletown Wastewater
Treatment ......................................................................................................................... 54
Figure 3-4. Ammonia level test on DBPFPs of wastewater samples ....................................... 55
Figure 4-1. Flows and sampling points of the model WWTP.................................................. 78
Figure 4-2. (a) Mass and (b) percentage removal of DBPFPs by the Stage 1 reactors ............ 79
Figure 4-3. Change of (a) DBPFPs and (b) DBP yields by the Stage 2 reactors ..................... 80
Figure 4-4. Correlations between nitrification and DBPFPs including (a) HAAFP and (b)
THMFP ............................................................................................................................ 81
Figure 5-1. Set-up of reactors for experiments: a) three CSTRs; b) two SBRs ....................... 108
Figure 5-2. The DO profile in an 8-h cycle of two SBRs: (a) O/A SBR; (b) A/O SBR .......... 109
Figure 5-3. MLSS of the three CSTRs and removal of NH3-N, DOC and DBPFP ................. 110
Figure 5-4. Species of DBPFPs in the effluents of the three CSTRs ....................................... 111
Figure 5-5. MLSS of the O/A and A/O SBRs and removal of NO3-N, DOC and DBPFP ...... 112
Figure 5-6. Species of DBPFPs in the effluents of the O/A and A/O SBRs ............................ 113
Figure 5-7. (a) DOC and (b) NH3-N profile in an 8-h cycle of the O/A and A/O SBRs ......... 114
Figure 5-8. DCAA, TCAA, CF and CH profile in an 8-h cycle of the (a) O/A SBR and
(b) A/O SBR..................................................................................................................... 115
Figure 5-9. HK and HAN profile in an 8-h cycle of the (a) O/A SBR and (b) A/O SBR ........ 116
Figure 5-10. DCAA, TCAA, CF and CH yield profile in the (a) O/A SBR and (b) A/O
SBR .................................................................................................................................. 117
Figure 5-11. HK and HAN yield profile in the (a) O/A SBR and (b) A/O SBR ..................... 118
x
Figure 5-12. Relative abundance of DBPFPs in the (a) O/A SBR and (b) A/O SBR .............. 119
Figure 6-1. (a) HAAs and THMs in an indoor swimming pool since water change and (b)
Number of pool users. Error bars are based on duplicate samples and are sometimes
smaller than symbol size. ................................................................................................. 143
Figure 6-2. DBP yields of MHO samples ................................................................................ 144
Figure 6-3. DBPs in the simulation of a lab-scale swimming pool. Error bars are based on
duplicate sets. ................................................................................................................... 145
Figure 6-4. THMs and HAAs in the simulation of DBP reduction in lab-scale
experiments ...................................................................................................................... 146
Figure 6-5. Model performance on the simulation of swimming pool DBPs .......................... 147
Figure 6-6. Sensitivity analysis on the impact of MHO loadings on DBPs in swimming
pool .................................................................................................................................. 148

xi
LIST OF TABLES
Table 2-2. Typical municipal wastewater characteristic parameter value (Source: Melcer
et al., 2003)....................................................................................................................... 22
Table 3-1. Suggested dilution ratio for wastewater with different ammonia levels ................ 56
Table 3-2. Chlorine dose test on the DBPFPs of six wastewater samples ............................... 57
Table 4-2. Effluents of the nine WWTPs ................................................................................. 83
Table 4-3. Primary effluent and secondary effluents of the model WWTP ............................. 84
Table 5-1. Parameters of the two SBRs ................................................................................... 120
Table 5-2. SBR programming in an 8-h cycle during a day .................................................... 121
Table 5-3. Free-chlorine residuals and demands of the chlorinated samples in an 8-h cycle
of the two SBRs (Dilution ratio: 1:25) ............................................................................. 122
Table 6-1. Water quality of the MHO samples ........................................................................ 149
Table 6-2. DBPFPs from the MHO samples............................................................................ 150
Table 6-3. Description of parameters for the swimming pool DBP model.............................. 151

xii
ACKNOWLEDGEMENTS
This research is made possible by the Pennsylvania State University Office of Physical Plant and
Institute of Energy and Environment assistantship.
I would like to express my sincere gratitude to my advisor and life mentor, Dr. Yuefeng
Xie. In my life from 20 to 27 years old, I was supported, advised, encouraged, and inspired under
his direct guidance. He helped me a lot in a variety of fields such as my course work, research,
teaching, networking, and so on. His enthusiasm and achievements in research and teaching give
me strong faith of growing into a researcher I want to be.
I’m heartily grateful to my co-advisor, Dr. John Regan. His guidance, patience, and
encouragement were indispensible to my journey from the beginning to the end of my study at
Penn State University.
I would like to thank Dr. Brian Dempsey and Dr. Yen-Chih Chen for their guidance and
serving on my committee. Specifically, I wish to acknowledge Dr. Yen-Chih Chen, for this
advice and instructions on many of my projects related to biotechnology.
I’m indebted to all of my colleagues at Environmental Engineering Programs at Penn
State Harrisburg, especially Sue Hipple, Mitch Spear, and Alison Shuler, who kindly offer their
help on numerous matters.
This dissertation is dedicated to my parents, Zhengwu Tang and Yuelan Lu; my wife,
Wen Peng; and my sons, Shunyu (Andy) and Jinyu (Evan). I could not have accomplished this
honorable milestone in my life without their love.

1
Chapter 1
Introduction
DBP-Related Issues from Wastewater Organics
Chlorination is a widely used technique for disinfection of drinking water and wastewater
effluents to prevent water-borne diseases such as typhoid, cholera, and dysentery. However,
chlorination also produces disinfection byproducts (DBPs), such as trihalomethanes (THMs) and
haloacetic acids (HAAs), which have been linked to cancers of the urinary and digestive tracts
and a variety of adverse health consequences (Singer, 1999; Boorman et al., 1999). The DBP
chemistry and effects of water treatment processes on DBP formation have been discussed (Xie,
2004; Chiang, 2002; Chellam, 2000). Formation of DBPs has been found to be affected by factors
such as chlorine dose, chlorination time, pH, temperature, and bromide. It is believed that
precursors of DBPs are aquatic organic matter, including humic acids , fulvic acids and other
substances, though information on their structures and DBP formation mechanisms are not well
understood. They are generally evaluated by formation potential (FP) tests, which maximize DBP
formation using a high chlorine dose (Summers et al., 1996).
Because of adverse health effects of DBPs, in drinking water systems, the removal of
DBP precursors by utilities is required under the EPA Stage 1 Disinfectants and Disinfection
Byproducts (D/DBP) rule (USEPA, 1998), a comprehensive regulation that specifies maximum
concentrations for disinfectants and DBPs. To be in compliance with the rule, DBP precursors
need to be controlled by a variety of approaches. Among them, enhanced coagulation, lime
softening, carbon adsorption, biofiltration, and membrane technologies have shown effectiveness

2
(Shorney, 1999; Jacangelo et al., 1995; Weiss et al., 2003; Chellam, 2000) in drinking water
treatment.
Control of DBP precursors during wastewater treatment has received less attention, since
disinfection of wastewater effluents is carried out to prevent the spread of human pathogens
rather than for human consumption. Currently, there are no regulations on DBP precursor
removal efficiencies by wastewater treatment plants (WWTPs). The National Pollutant Discharge
Elimination System (NPDES) discharge limits only regulate some THMs (e.g. chloroform) in
WWTP effluents. However, DBP precursors control in wastewater is needed and becoming more
and more important, because many treated effluents are indirectly reclaimed as part of water
supply in downstream rivers or directly reclaimed by drinking water supplies due to the shortage
of fresh water (Tortajada, 2006). Wastewater organics are becoming an important source of
pollutants in existing potable water supplies (Chen et al., 2009). When these organics are
chlorinated, DBPs are formed. Sirivedhin and Gray (2005a,b) found the wastewater organics are
structurally different from the natural organic matter in drinking water, and chlorination of
wastewater leads to the formation of various DBPs due to the presence of chlorine-reacting
species such as ammonia, organic carbon, organic nitrogen, and bromide at high concentrations.
It is expected that high levels of DBPs are formed during chlorination of wastewater effluents,
which poses a contamination problem (Rebhun et al., 1997).
Because wastewater organics are a source of various DBP precursors, more attention is
given to the DBP-related issues with wastewater, especially the DBP precursor removal by
WWTPs:
(1) What are the levels of DBP precursors in raw wastewater and treated wastewater?
(2) Is DBP precursor removal affected by different biological treatment processes
adopted by WWTPs?

3
Many wastewater treatment facilities employ a variety of biological, physical, and
chemical processes, which can produce a wide range of treated water qualities in terms of DBP
levels, if chlorine disinfection is practiced (Krasner et al., 2008). Few studies have explored DBPs
in chlorinated wastewater to date. Krasner et al. (2009b) explored the impact of wastewater
treatment processes on DBP precursors and emphasized a profound impact of nitrification on
many measures of effluent quality including organic carbon, organic nitrogen, and DBP
precursors. Galapate et al. (1999) found that the hydraulic retention time (HRT) and mixed liquor
suspended solids (MLSS) were two parameters that could affect THM precursors and chemical
properties of organic matter in the effluents of activated sludge processes. Since WWTPs affect
wastewater quality in many ways, there is a need for comprehensive studies. For example, the
compositions of DBP precursors in wastewater are expected to be different from those found in
drinking water, and the fate of DBP precursors during different biological treatment processes has
not been studied. It is hypothesized that in addition to the removal of organics, DBP precursors
are affected in various ways by different biological treatment processes.
The research herein aims to explore the essence of DBP precursors in wastewater and the
influence of biological treatment processes adopted by WWTPs. It is expected that armed with a
relatively full understanding of these subjects, we will be able to provide referable information
about the capability of DBP precursor removal by WWTPs and to understand the yields and
speciation of DBPs in different wastewater. We will also be able to propose favorable design and
operational conditions for DBP precursor removal from wastewater, which would better limit the
DBP precursors from treated wastewater entering potable water supplies.

4
Research Summaries
The dissertation mainly focused on the contribution of wastewater treatment processes to DBP
precursors. The author developed a reliable method for assessment of DBP precursors in
wastewater, evaluated DBP formation potential from wastewater organics, and explored the
influence of various biological treatment processes adopted by WWTPs.
The dissertation is composed of six chapters. Chapter 1 describes the author’s research
summaries. Chapter 2 provides comprehensive background information on DBP precursors from
natural organics and wastewater organics. Chapter 3 presents a quantification method to assess
DBP precursors in wastewater. Chapter 4 presents results of a survey on DBP precursor removal
by various WWTPs and a model WWTP. Chapter 5 is a detailed discussion on the impact of
biological treatment processes on DBP precursors. Chapter 6 deals with materials of human
origin, a main source of wastewater organics, as DBP precursors.
Quantification of DBPFP in Wastewater
Conventional practices of DBP formation potential (FP) test for drinking water cannot be
used directly in wastewater due to the complexity of wastewater constituents. Quantification of
DBPFP in wastewater was conducted by several researchers. However, due to different sample
preservation and chlorination conditions used, it might be difficult to compare these results. As
wastewater samples vary in their characteristics, development of a DBPFP quantification method
that can be applied to a broad range of wastewater samples is necessary. The research evaluated
three preservation methodologies on wastewater samples: (1) storing samples at 4°C only; (2)
filtering samples with 0.45 µm filters and storing at 4°C; and (3) filtering samples with 0.45 µm
filters, acidifying to pH less than 2, and storing at 4°C. Results show that storing samples at 4°C
5
without any pretreatment affected dissolved organic carbon (DOC), Ultraviolet absorbance at 254
nm (UV254), Specific Ultraviolet Absorbance (SUVA), HAAFP and THMFP. This indicates that
proper sample pretreatment is required to maintain the level of DBPFP. Filtration coupled with
acidification to pH less than 2 has advantages for long-term storage, because it is able to provide
the most stable samples for DBPFP assessment. However, both pretreatment methods changed
the organic matter constituents which made the samples biased at the beginning. They could not
address the DBPFP of the particulate matter and the DBPFP of the organic matter that was lost,
likely due to precipitation. The proposed method for quantification of DBPFP in wastewater is
based on standardized parameters for chlorination, which include 20 mg/L chlorine dose, pH 7,
25°C, and incubation of 3 days in the dark. Proper dilution is a key to assure that free chlorine
residual remains after incubation. It is recommended that dilution ratio be determined based on
the ammonia level. These dilution ratios were tested on effluent samples from various wastewater
treatment plants and were able to produce consistent results. Sample preservation affects the
quantification of DBPFP in wastewater. Filtration (0.45 µm) coupled with acidification to pH less
than 2 and 4°C storage provides stable levels of DBPFP during long-term storage. However, this
pretreatment technique underestimated the original wastewater DBPFP. Proper sample dilution is
a key to address sample chlorination conditions. (The research was presented at IWA Micropol &
Ecohazard 2011 Conference in Sydney, Australia. It is described in Chapter 3.)
DBPFPs of Wastewater Effluents and Their Removal in WWTPs
The DBPFPs of treated wastewaters from various WWTPs were investigated and the
research explored the DBPFP removal by various treatment facilities in a model wastewater
treatment plant. Results showed that the WWTPs that achieved better organic matter removal and
nitrification resulted in low DBPFPs in treated effluents. HAA, THM, and chloral hydrate (CH)
6
precursors were in predominant concentrations in wastewater. The chlorinated primary effluent
contains 2000 µg/L HAAFP, 1080 µg/L THMFP, and 987 µg/L CHFP. The WWTP removed
82% DBPFP by the activated sludge process and 83% DBPFP by the trickling filter and modified
Ludzack-Ettinger process. The haloacetonitrile (HAN) FP and haloketone (HK) FP showed the
highest removal efficiencies (95% and 96%) by both systems compared to the FPs of other DBP
species. In addition, WWTP could affect the DBPFP speciation profile by lowering the
HAAFP/THMFP ratio. The DBP yields and SUVA increased after secondary treatment,
indicating that the remaining organic matters tend to be more humic. The survey implies that the
oxic & anoxic conditions, soluble microbial products (SMPs), nitrification, and solid retention
time (SRT) may impact DBPFPs. (The research is a manuscript in preparation, and is described in
Chapter 4.)
Impact of Biological Treatment Processes on DBPFP in Wastewater
To further enhance the understanding of the impact of biological treatment processes on
DBPFP in wastewater, bench-scale experiments were carried out to simulate different processes
under controlled conditions in the laboratory. Three continuously stirred tank reactors (CSTRs)
were designed to achieve various levels of nitrification by varying SRTs, and two sequencing
batch reactors (SBRs) were designed to achieve denitrification by oxic-anoxic and anoxic-oxic
processes. The five reactors used the same wastewater as influent and were stabilized after more
than 180 days of continuous operation under controlled conditions (SRT, HRT, dissolved oxygen,
and temperature). The three CSTRs achieved poor, medium, and good levels of nitrification.
HAAFPs decreased as nitrification improved from the poor to the good level. THMFPs, however,
were not found to be clearly correlated with nitrification. For the two SBRs that were operated at
the same SRTs (20 days) and with complete nitrification, the oxic-anoxic SBR with better

7
denitrification had lower DBPFPs when the two SBRs were compared. During the 8-h cycle of
the SBR operation, the DBP precursors of wastewater influent decreased, and the majority of
DBP precursor removal was completed with the bulk removal of wastewater organics. Advanced
treatment processes including nitrification and denitrification slightly brought down DBP
precursors further. The oxic reactions had a faster DBP precursor removal rate and a greater DBP
precursor removal efficiency than the anoxic reactions. Although the majority of wastewater
organics were removed by wastewater treatment processes, the remaining organic matter had a
higher potential to form DBPs upon chlorination. This could be due to two factors: (1) the non-
removal of recalcitrant organic matter initially present in wastewater influent; and (2) the
production of new DBP precursors that came from SMPs, especially biomass-associated products
(BAPs). The study provides information on the effectiveness of wastewater treatment processes
on a variety of wastewater parameters, organic matter, and precursors for DBPs. The information
can be beneficially used by wastewater and water professionals to minimize the health risks posed
by wastewater-derived DBPs. (The research was presented at AWWA 130th Annual Conference
in Washington, DC, and is described in Chapter 5.)
Materials of Human Origin as a Source of DBP Precursors
Contribution of wastewater organics to DBPs in drinking water is an important research
area because of the increasing wastewater reuse nowadays. Materials of human origin (MHOs)
are the main constituents of wastewater organics and they are substantially different from the
natural organic matter in drinking water. This research monitored DBPs in an indoor swimming
pool over a 1-year period following water change, explored DBPFPs from MHOs, and developed
a model to simulate DBPs in swimming pool water. As the time since the water change increased,
the HAA concentrations increased up to 1650 µg/L while the THM concentrations were

8
fluctuating in a range of 40 to 181 µg/L over the 1-year period in the monitored swimming pool.
The difference between the concentrations of HAAs and THMs is attributed to three factors: (1)
MHOs from pool users; (2) slow HAA reduction; and (3) long water retention. Lab experiments
indicate that all MHO samples had high DBPFPs, and MHOs contributed to more HAAs than
THMs. The sweat, saliva, skin wash, hair wash, and urine samples had higher DBP yields than
NOM. The THM reduction rate coefficient was 0.45 per day while the HAA reduction rate
coefficient was 0.023 per day based on the pseudo first order kinetics. There was no net
accumulation of THMs taking place in swimming pools. The model developed based on a mass
balance and pseudo first-order kinetics achieved a good simulation of a real swimming pool
system. Optimized parameters of the model implied approximately 117 ml sweat and 69 ml urine
per person were released to the pool. The sensitivity analysis indicates that MHO loadings would
impact DBPs in swimming pool water. The experimental results reveal that MHOs contribute to
DBP formation and are an important source of DBPs in swimming pools. As MHOs are
continuously brought in by swimmers and pools are continuously exposed to disinfectants, pool
water represents extreme cases of disinfection that differ from the disinfection of drinking water,
and the net-accumulated HAAs could pose negative health risks to human beings. The results can
help water professionals to better understand the MHO contribution to DBPs and the fate of
DBPs. (The research was submitted to Water Research, and is described in Chapter 6.)

9
Further Research
The methods and tools developed in this research were used to investigate the DBP precursors
from dissolved organic matter in wastewater. WWTPs may also produce various qualities of
particulate matter. Based on the preliminary research, the particulate matter may also lead to DBP
formation upon chlorination. Further research is needed to preserve particulate matter and explore
the contribution of particulate matter to DBP formation.
The DBP precursors in wastewater could be characterized based on various fractions of
wastewater organics. Further research into the reactivity of each fraction is needed for better
characterization of DBP precursors.
Literature Cited
Boorman, G.A., Dellarco, V., Dunnick, J.K., Chapin, R.E., Hunter, S., and Hauchman, F. (1999)
Drinking water disinfection byproducts: review and approach to toxicity evaluation,
Environmental Health Perspectives, 107, 207-217.
Chellam, S. (2000) Effects of nanofiltration on trihalomethane and haloacetic acid precursor
removal and speciation in waters containing low concentration of bromide ion, Environ.
Sci. Technol., 34(9), 1813-1820.
Chiang, P.C., Chang, E.E., Liang, C.H. (2002) NOM characteristics and treatabilities of
ozonation processes, Chemosphere, 46(6), 929-936.
Galapate, R.P., Agustiani, E., Baes, A.U., Ito, K., and Okada, M. (1999) Effect of HRT and
MLSS on THM precursor removal in the activated sludge process, Water Research,
33(1), 131-136.

10
Jacangelo, J.G., DeMarco, J., Owen, D.M., and Randtke, S.J. (1995) Selected processes for
removing NOM: an overview, J. Am. Wat. Works Assn., 87(1), 64-77.
Krasner, S.W., Westerhoff, P., Chen, B., Amy, G., Nam, S.-N., Chowdhury, Z.K., Sinha, S.,
Rittmann, B.E. (2008) Contribution of wastewater to DBP formation. AWWA Research
Foundation, Denver, CO, USA.
Krasner, S.W., Westerhoff, P., Chen, B., Rittmann, B.E. and Amy G. (2009) Occurrence of
disinfection byproducts in United States wastewater treatment plant effluents. Environ.
Sci. Technol., 43(21), 8329-8325.
Rebhun, M., Heller-Grossman, L., and Manka, J. (1997) Formation of disinfection byproducts
during chlorination of secondary effluent and renovated water, Water Environ. Res.,
69(6), 1154-1162.
Singer, P.C. (1999) Humic substances as precursors for potentially harmful disinfection by-
products, Wat. Sci. Tech., 40(9), 25-30.
Shorney, H.L.(1999) Removal of DBP precursors by enhanced coagulation and lime softening,
American Water Works Association.
Sirivedhin, T., and Gray, K.A. (2005a) Identifying anthropogenic markers in surface waters
influenced by treated effluents: a tool in potable water reuse. Water Res., 39(6), 1154-
1164.
Sirivedhin, T. and Gray, K.A. (2005b) Comparison of the disinfection by-product formation
potentials between a wastewater effluent and surface waters. Water Res., 39(6), 1025-
1036.
Summers, R.S., Hooper, S.M., Shukairy, H.M., Solarik, G. and Owen, D. (1996) Assessing the
DBP yield: Uniform formation conditions. J. Am. Wat. Works Assn, 88(6), 80-93.
Tortajada, C. (2006) Water management in Singapore, Water Resources Development, 22(2),
227-240.

11
USEPA (1998) National primary drinking water regulations: disinfectants and disinfection by-
products, final rule. Washington, DC.
Weiss, W.J., Bouwer, E.J., Ball, W.P., and O’Melia, C.R. (2003) Riverbank filtration – fate of
DBP precursors and selected microorganisms, J. of Am. Wat. Works Assn., 95(10), 68-
81.
Xie, Y.F. (2004) Disinfection byproducts in drinking water: Formation, analysis, and control.
Boca Raton, FL: Lewis Publishers.
12
Chapter 2
Literature Review
DBP Precursors from Natural Organics
Disinfection of drinking water and DBP formation
Disinfection kills or inactivates disease-causing organisms and is an important step to
ensure that water is safe to drink. Disinfection byproduct (DBP) is a term used to describe a group
of organic and inorganic compounds formed during water disinfection (Xie 2004). Since the
discovery of DBPs in drinking water in 1970s, numerous researches have been focused on their
occurrence, formation, health effects, and control (Karanfil et al., 2008). Because chlorine is still
the predominant disinfectant and the bromide levels are low in potable waters, many researches
focus on trihalomethane (THMs) and haloacetic acids (HAAs), the two largest classes of
halogenated DBPs on weight basis, and their regulations have been well-established and enforced
(USEPA, 1998).
The formation of DBPs is briefly illustrated in Eq. 2.1 and 2.2.
Eq. 2.1
Eq. 2.2

13
THMs are obtained by replacing three hydrogen atoms with halogen atoms including
chlorine and bromine, and a total of four THMs are formed. They are trichloromethane
(chloroform) (CF), bromodichloromethane (BDCM), chlorodibromomethane (CDBM), and
tribomomethane (bromoform) (BF).
HAAs are obtained by partially or completely replacing the hydrogen atoms with halogen
atoms including chlorine and bromine, and a total of nine HAAs are formed. They are
monochloroacetic acid (MCAA), monobromoacetic acid (MBAA), dichloroacetic acid (DCAA),
bromochloroacetic acid (BCAA), dibromoacetic acid (DBAA), trichloroacetic acid (TCAA),
bromodichloroacetic acid (BDCAA), chlorodibromoacetic acid (CDBAA), and tribromoacetic
acid (TBAA) (Cowman and Singer, 1996).
Rook (1977) postulated that the haloform reaction occurred with the resorcinol-type
moiety of fulvic acids, a constituent of natural organic matter (NOM). The proposed pathway first
involved a fast chlorination of the carbon atoms that are activated by ortho hydroxide (OH)
substituents or phenoxide ions in an alkaline environment. Hypochlorous acid (HOCl) is the
typical source of electrophilic halogenating species Cl+. The reaction initially gives the
intermediate carbanion, which is rapidly halogenated. After the aromatic structure has been
halogenated and opened (Shown in Figure 2-1), cleavage at a will result in formation of THMs.
Alternatively, oxidative and hydrolytic cleavages at b will yield an HAA (e.g., TCAA or chloral
hydrate). In addition, cleavage at c will result in haloketone (HK) formation.

14
Figure 2-2. Haloform reaction with fulvic acids and resorcinol
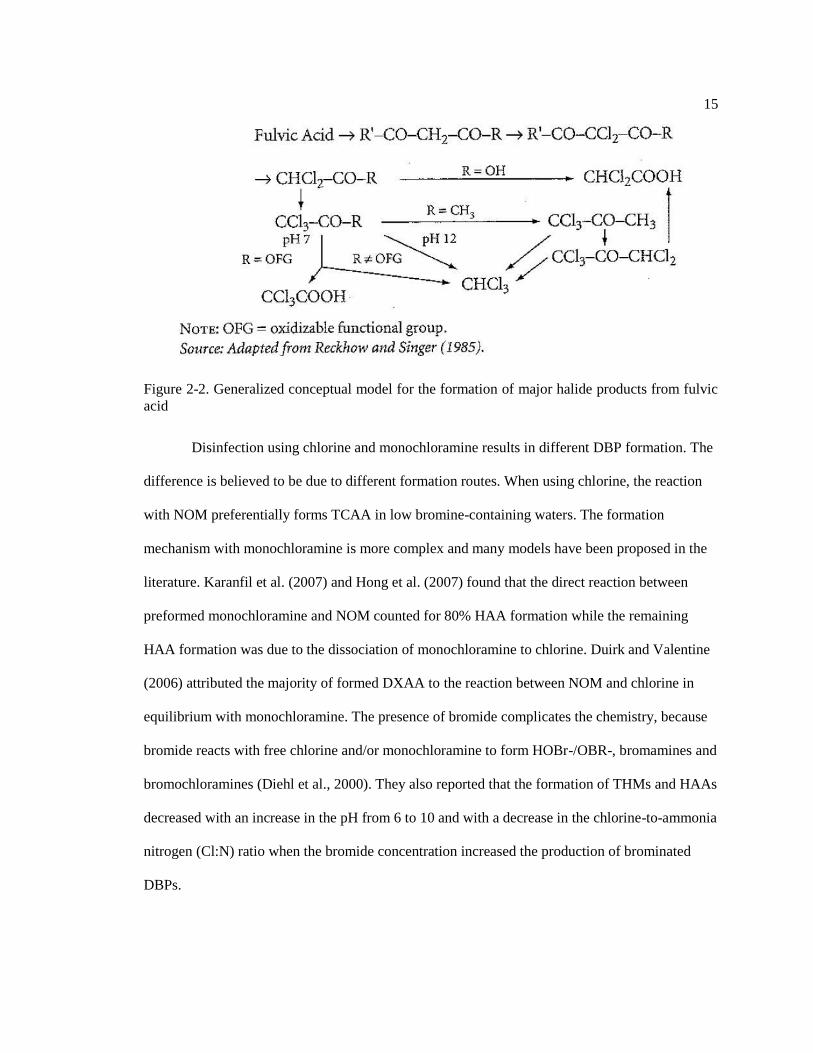
In the Reckhow and Singer (1985) model (shown in Figure 2-2), oxygenated functional
groups (e.g., β-diketone groups) are formed. And the activated carbon will quickly become fully
substituted with chlorine. Hydrolysis then occurs rapidly, yielding a monoketone group. If the
remaining “R” group is a hydroxyl group, the reaction will stop, yielding DCAA. Otherwise, the
structure will be further chlorinated to a trichloromethyl species. This intermediate species is
base-hydrolyzable to chloroform. At neutral pH, if the R group is an oxidizable functional group
capable of readily donating an electron pair to the rest of the molecule, TCAA is expected to
form. In the absence of such as oxidative cleavage, hydrolysis will prevail, yielding chloroform.
15
Figure 2-2. Generalized conceptual model for the formation of major halide products from fulvic
acid
Disinfection using chlorine and monochloramine results in different DBP formation. The
difference is believed to be due to different formation routes. When using chlorine, the reaction
with NOM preferentially forms TCAA in low bromine-containing waters. The formation
mechanism with monochloramine is more complex and many models have been proposed in the
literature. Karanfil et al. (2007) and Hong et al. (2007) found that the direct reaction between
preformed monochloramine and NOM counted for 80% HAA formation while the remaining
HAA formation was due to the dissociation of monochloramine to chlorine. Duirk and Valentine
(2006) attributed the majority of formed DXAA to the reaction between NOM and chlorine in
equilibrium with monochloramine. The presence of bromide complicates the chemistry, because
bromide reacts with free chlorine and/or monochloramine to form HOBr-/OBR-, bromamines and
bromochloramines (Diehl et al., 2000). They also reported that the formation of THMs and HAAs
decreased with an increase in the pH from 6 to 10 and with a decrease in the chlorine-to-ammonia
nitrogen (Cl:N) ratio when the bromide concentration increased the production of brominated
DBPs.

16
DBP precursors in drinking water
DBP precursors are sort of materials that react with disinfectants such as chlorine and
chloramines, and forms DBPs (Barrett et al., 2000). NOM is a commonly recognized source of
DBP precursors in drinking water (White et al., 2003). It typically consists of humic
(hydrophobic) substances, such as humic and fulvic acids, and nonhumic (hydrophilic) material,
which is often of biological origin. However, it is usually categorized according to its humic
content, measured by the specific ultraviolet absorbance (SUVA). Ultraviolet absorbance (UV)
and SUVA have been used as surrogates for measuring DBPs as an easier, cheaper and faster
approach in different water sources (Goslan et al., 2002; Parsons et al., 2005; Ates et al., 2007).
Waters with SUVA of greater than 4 L/mg.m is considered humic while non-humic waters has
SUVA of less than 2 L/mg.m (Krasner et al., 2008). Humic waters generally yield more DBPs
upon chlorination than non-humic waters.
To better understand these DBP precursors from NOM, researchers have used various
methods to fractionate dissolved organic carbon (DOC) into different sub-groups. Thurman and
Malcolm (1981) used a series of resins and differentiate DOC into hydrophobic acids, transphilic
acids, and hydrophilic constituents. Rosario-Ortiz et al. (2007) used a polarity rapid assessment
method (PRAM) to characterize the polarity of DOC using different solid-phase extraction (SPE)
sorbent and differentiate it into non-polar, moderate non-polar, moderate polar, and polar
substances. Kim and Dempsey (2008) separated DOC based on size and functionality. Based on
existing studies, the THM precursors are found to be related with hydrophobic fractions. The
DCAA precursors, however, show very little systematic difference among these fractions,
because hydrophilic fractions produce a higher level of DCAA compared to other DBPs.
Hydrophobic fractions are also responsible for higher reactivity on forming TCAA.

17
Quantification of DBP precursors in drinking water
The concentrations of DBP precursors need to be quantified in order to better control the
formation of DBPs in finished water and distribution systems. Three standardized tests are
commonly used for drinking water: the formation potential (FP) test (Xie, 2004), simulated
distribution system (SDS) test (Nieminski et al., 1993; Rostad et al., 2000), and uniform
formation conditions (UFC) test (Summers et al., 1996). However, the latter two tests were not
strictly for DBP precursors, because the SDS and UFC were developed to simulate the DBP
formation in distribution system. Only the DBPFP test is good for evaluating the DBP precursors.
It is a procedure to assess the levels of precursors rather than the formation of DBPs. The purpose
is achieved by adding excess chlorine to ensure the maximum formation of DBPs.
Since the DBP formation can be affected by chlorine dose, chlorination time, temperature
and pH, it is important to have the four parameters controlled during the FP test. The standard test
conditions are described in Standard Method 5710B (APHA 1998), which controls the chlorine
residual in a range of 3-5 mg/L after 7 days incubation at 25±2°C and pH 7. Reckhow (1984)
observed a proportional relationship between 3-day and 7-day high dose THMFP concentrations,
and other reaction conditions are also used by researcher for quick determination (Hutton, 1992;
Li and Chu, 2003; Chu, 2003; Drikas et al., 2008). These conditions include a chlorine dose of 20
mg/L, an incubation time of 3 days, and a temperature of 20 °C. Since excess chlorine is added
(>3 mg/L), the variation of chlorine residuals does not significantly affect the DBPFP (Xie,
2004), and the results are comparable among different systems or laboratories.

18
Influence of treatment processes on DBP precursors in drinking water
Removal of NOM has been adopted as one of the main mechanisms to remove DBP
precursors in drinking water. This has led to the optimization of existing treatment processes and
the development of new process which focus on NOM removal. Many studies have determined
that some NOM in drinking water cannot be removed by regular processes (Randtke, 1988;
Edwards, 1998; Chow et al., 1999, and van Leeuwen, 2002). The remaining organics are referred
as recalcitrant organic matter and is primary consisted of low molecular weight hydrophilic
neutral organics such as polysaccharides, proteins and amino sugars (Leenheer, 2004; Allpike et
al., 2005). These organics exhibit different reactivity with chlorine to produce DBPs.
Chang et al. (2001) characterized the molecular weight distribution of NOM and found
that most organics that responsible for the major DBP precursors are small compounds with a
molecular weight less than 1kDa. Therefore, effective removal of small molecules prior to
disinfection will significantly reduce the DBP formation in finished water. Conventional
coagulation is effective in removing large organics, but is limited in eliminating small organics,
which have high DBPFP. Therefore, the enhanced coagulation technique is able to provide a
decent removal of DBP precursors in drinking water treatment. In addition, powdered activated
carbon can be used to remove the low molecular weight organics and taste-odor causing materials
in raw water. Uyak et al. (2007) showed that the combination of enhanced coagulation and
powdered activated carbon (PAC) adsorption can be more effective than enhanced coagulation
alone to meet the Turkish THM limit of 150 µg/L.
In addition, advanced drinking water treatment processes such as nanofiltration (Fu et al.,
1994; Chellam, 2000), reverse osmosis (Taylor and Jacobs, 1996), iron exchange (Boyer and
Singer, 2005), ozonation and biotreatment (Miltner et al., 1992) are also effective on DBP
precursor removal from drinking water.

19
DBP Precursors from Wastewater Organics
Disinfection of wastewater and DBP formation
Wastewater disinfection is an important public health measure that helps protect human
being from exposure to harmful pathogens after treated wastewater is returned to waterways.
Although alternative disinfectants such as ozone and UV can be used, many wastewater treatment
practices principally rely on the use of chlorine for disinfection due to its availability at a
reasonable cost and well established practices.
The DBP formation during the disinfection of wastewater has not yet received much
attention, because wastewater is not to be consumed. It is expected that chlorination of
wastewater is different from chlorination of water. It involves many reactions due to the presence
of various chlorine-reacting species such as ammonia, organic carbon, organic nitrogen, and
bromide at substantially high concentrations. These interactions may lead to or interfere with
DBP formation (White, 1999). Since more and more treated effluents are indirectly reclaimed as
part of water supply in downstream nowadays, the National Pollutant Discharge Elimination
System (NPDES) discharge limits regulate some THMs (e.g., chloroform) in WWTP effluents,
and investigations on the DBP formation during wastewater disinfection are an important
research area.
Yang et al. (2005) explored DBP formation in breakpoint chlorination of wastewater, and
found that the concentrations and distribution of THM and HAA species showed variances
among different wastewater effluents and different zones of the breakpoint curves of the same
wastewater source. Bromide concentrations had great influence on the THM and HAA
distribution. The longer reaction time favors the formation of THMs and HAAs, especially the
dihalogenated HAAs. Qi et al. (2004) studied factors affecting the formation of HAAs during

20
monochloramination of wastewater and found the initial Cl:N ratio was related with chlorine
demand and HAA formation. The variance observed in the patterns of HAA formation cannot be
easily explained by the chlorine chemistry but are likely attributable to the combining effects of
the water quality and the characteristics of the organics in the wastewater.
Because of the high chlorine demand of the wastewater organics, wastewater disinfection
with chlorine may end up with unintentional chloramination instead of chlorination. The reactions
between monochloramine and wastewater organics lead to the formation of other DBPs including
haloacetonitriles (HANs), haloketones (HKs), chloropicrin (CP) and N-nitrosodimethylamine
(NDMA) (Mitch et al., 2003; Guo and Krasner, 2009) while THMs and HAAs are formed at
relatively low concentrations (Krasner et al., 2009a). Common HANs observed in chlorination or
chloramination consist of dichloroacetonitrile (DCAN), trichloroacetonitrile (TCAN),
bromochloroacetonitrile (BCAN), and dibromoacetonitrile (DBAN). Major HKs include 1,1-
dichloro-2-propanone (1,1-DCP) and 1,1,1-trichloro-2-propanone (1,1,1-TCP) (Krasner et al.,
1989). These DBPs including NDMA were found in relatively high concentrations and became an
issue particularly in locations where wastewater effluents are used for indirect potable use (Mitch
et al., 2003). Since wastewater organics contribute to the formation of various DBPs upon
disinfection, it is important to investigate the DBP precursors from those wastewater organics.
DBP precursors in wastewater
Because wastewater organics are sources of various precursors for DBPs (Krasner et al.,
2008), adequate knowledge on the characteristics of these organics is critical for the
understanding of DBP precursors in wastewater.
Table 2-1 shows the values of typical municipal wastewater characteristics. The term
“wastewater characteristics” refers to the partitioning of organic material into biodegradable and

21
unbiodegradable (inert) portions, the ammonia portion of the total nitrogen and so on (Melcer et
al., 2003). Within the biodegradable fraction, the organics are further divided into readily
biodegradable and slowly biodegradable compounds. The readily biodegradable compounds are
presumed to consist of relatively small molecules (such as volatile fatty acids (VFAs) and low
molecular weight carbohydrates, alcohols, peptones and amino acids) (Henze, 1992), which can
be easily transported into the cell resulting in an immediate response in the use of electron
acceptor (oxygen or nitrate). The slowly biodegradable compounds are assumed to consist of
particulate/colloidal material and complex organic molecules, which require extracellular
breakdown prior to uptake and utilization (Dold et al., 1980). Dold et al. (1980) also found that
filtration (0.45 µm) was able to remove the particulate material, but a significant portion of
colloidal materials passed through the filters, because the colloidal material spans a wide range of
molecular sizes and weights. Effluent organics are the basis for evaluating plant performance, and
they are also made up of a wide range of organic compounds. It can be assumed that the readily
biodegradable compounds in wastewater influent have been completely consumed after
wastewater treatment, and the remaining organics in the effluents are attributed to the three
principle sources: (1) the influent organics (e.g. unbiodegradable compounds); (2) intermediates
and end products of various metabolic pathways; and (3) material from cell lysis and death. The
latter two sources are the two components of soluble microbial products (SMPs) (Namkung and
Rittmann, 1986).

22
Table 2-2. Typical municipal wastewater characteristic parameter value (Source: Melcer et al.,
2003).
Sirivedhin and Gray (2005a,b) found the organics in wastewater effluent and NOM were
structurally different, and the structurally different organic matrices also behaved differently in
the chlorination process. The effluent organic matter was found to be less reactive with chlorine
on a DOC concentration basis. Liu and Li (2010) found the biodegradation may effectively
remove some DBP precursors, but the biotransformation during the process produces new DBP
precursors in the form of SMPs.
Although further information regarding DBP precursors from wastewater organics is
scarce, a number of researchers have focused on a major component of wastewater organics –
materials of human origin (Judd and Black, 2000; Kim et al., 2002; Judd and Bullock, 2003;
Kanan and Karanfil, 2011), which would contribute to DBP formation in chlorinated swimming
pool water. However, there is still a need to directly look into the DBP precursors in raw and
treated wastewater, and to explore the removal efficiencies by WWTPs.

23
Quantification of DBP precursors in wastewater
One reason that may limit the investigations into DBP precursors in wastewater is the
lack of the standardized method for DBPFP quantification due to the complex constituents of
wastewater organics. Wastewater has high levels of ammonia and other inorganic and organic
compounds which react with free chlorine. This makes the conventional practices for DBPFP test
unadoptable in wastewater because of the high chlorine demand of wastewater and low to none
free-chlorine residual after several days of incubation. Using the conventional practices, the
halogenated DBPFP of wastewater could easily be under-estimated. In addition, wastewater is not
biologically stable (Sundstrom and Klei, 1979) and it could undergo a series of biodegradation
and DBPFP may change very quickly. To quantify the DBPFP of wastewater, therefore,
pretreatment strategies are also needed in order to maximally preserve DBP precursors.
Various sample pretreatment strategies were found in literature. Yang et al. (2005)
preserved their wastewater samples by lowering the temperature to 4 °C before the DBPFP test.
Sirivedhin and Gray (2005) and Krasner et al. (2009b) immediately filtered their wastewater
samples with 0.45 µm filters before the DBPFP test. Standard Methods 5710 (1998) suggested
store samples at 4°C and analyze as soon as possible. Since the Standard Methods 5710 was
developed for quantifying DBPFP in drinking water, the pretreatment method may be
insufficient. Chlorination conditions, such as temperature, reaction time, chlorine dose and
residual, and pH, need to be controlled and standardized. For wastewater, dilution may also be
considered as a controlled parameter in chlorination conditions. However, literature also shows a
wide selection of strategies. Yang et al. (2005) diluted wastewater samples with 0.01M phosphate
buffer at a 1:1.5 volume ratio to buffer the pH at 7, and then initiated chlorination by adding a
pre-set chlorine dosage. Samples were incubated at room temperature (21±1°C) for 24 hours.
Sirivedhin and Gray (2005) buffered each sample at pH 7, chlorinated with an excess of free

24
chlorine and stored them at 25°C for 7 days. Lee et al. (2007) buffered samples to pH 7 with 5
mM phosphate buffer, and then used an initial dose of 5 mg Cl2 per mg of DOC with 7-day
incubation at 20°C. Diaz et al. (2008) employed uniform formation conditions (Summers et al.,
1996; Boyer and Singer, 2005) in determining DBPFP in wastewater. Those conditions included
1±0.4 mg/L free chlorine residual at pH 8±0.2 after 24±1 h of incubation at 20°C. Krasner et al.
(2009a) chlorinated wastewater samples according to organic and inorganic chlorine demand and
held them for 24 hours at pH 8.2 and 25°C. The standard reaction conditions described in
Standard Methods 5710 (APHA, 1998) included free-chlorine residual at least 3 mg/L and not
more than 5 mg/L at the end of a 7-day incubation period, and the incubation temperature at 25 ±
2°C, and pH at 7 ± 0.2. So far, there is no systematic study on the impact of these non-
standardized issues on the quantification of DBPFP in wastewater. As wastewater samples vary in
their characteristics, development of a DBPFP quantification method that can be applied to a
broad range of wastewater samples is essential.
Influence of treatment processes on DBP precursors in wastewater
The performance of treatment processes has a significant impact on the removal
wastewater organics. It is suspected that DBP precursors may also be affected. These processes
could be conducted in a number of ways, and at different scales, for example, batch, continuous-
flow, and sequencing batch reactor (SBR) systems. Typically, batch tests would be conducted at
laboratory-scale, but continuous-flow and SBR systems could be either laboratory- or full-scale.
In full-scale studies, Krasner et al. (2009a) found that the DBP formation in wastewater is
strongly affected by whether or not the WWTP achieved good nitrification. Chlorine addition to
poorly nitrified effluents formed low levels of halogenated DBPs but often substantial amounts of
NDMA. Chlorination of well-nitrified effluent typically resulted in substantial formation of

25
halogenated DBPs but much less NDMA. The results may imply that well-nitrified effluents have
less DBP precursors than the poorly-nitrified effluents, and the nitrification process during the
wastewater treatment play an important role. However, to truly evaluate the levels of DBP
precursors, the effects of reactions between chlorine and inorganic nitrogen (e.g. ammonia) need
to be minimized, and there should be excess chlorine to ensure the maximum formation of
halogenated DBPs.
In a follow-up full-scale study by Krasner et al. (2009b), 23 WWTPs were surveyed on
organic carbon, organic nitrogen, and DBP precursors in wastewater effluents. DBPFP (based on
reactivity) was measured to determine the levels of DBP precursors in treated wastewater, and
they found nitrification reduced the HAA precursors while the THM precursors were relatively
unaffected by the level of treatment. The increase in SUVA was attributed to the preferential
removal of the less UV-absorbing (nonhumic) fraction of the DOC during biological treatment.
Very often the information available on full-scale plant (flow rate, sludge age, recycle
ratio, etc) may be inaccurate or incomplete, and there is a need to operate a laboratory-scale
system which allows for more accurate control of these operating parameters.
The continuous-flow systems could be in a plug-flow design or in a form of continuously
stirred tank reactor (CSTR). Plug-flow introduces waste at one end, allows it to flow through the
length of the reactor, and the treated effluent exits the other end. In a CSTR, the contents of the
reactor are mixed and the concentration of the material in the reactor is equal to that in the
effluent exiting the reactor. In terms of laboratory-scale systems, the fill-and-draw SBR system
has a few advantages over the continuous flow systems: (1) less equipment is required; (2) no
settling tank is needed; (3) Simple to operate; and (4) More accurate control of sludge age. The
CSTR has advantages, too. Kim et al. (2002) found that continuously fed lab-scale CSTRs were
more stable during variable organic loading rates than reactors which were instead fed once at a
time.

26
The suspended growth systems (e.g. activated sludge) generally adopted by WWTPs are
usually in the form of CSTR. CSTRs are operated with continuous feeding, mixing, and wasting
so that ideally the concentrations of substrate and active biomass are equal throughout the reactor,
and the biomass produced during the treatment equals to those removed from the reactor in the
effluent (Rittmann and McCarty, 2001). Part of the wasted biomass may be recirculated back into
the reactor to maintain a higher biomass concentration and increase the solid retention time
(SRT). CSTRs are also referred to as chemostats, and are frequently used to determine the
kinetics of microbial growth and metabolism in laboratory. Grady and Williams (1975) studied a
CSTR system without recycle and proposed that the effluent organics are inversely related to the
sludge age. Many activated sludge process designs used for biological nitrogen removal have a
mixed, non-aerated anoxic reactor in front of the aeration reactor (anoxic-oxic, A/O) to achieve
the denitrification. There are numerous other designs (Rittmann and McCarty, 2001), such as
O/A, A2O, and various modifications for enhanced nutrient removal from wastewater.
Fixed-film reactors (e.g., trickling filter) are different from suspended growth systems
like activated sludge. Fixed-film reactors depend on the colonization of an inert support material
with a microbial biofilm. Wastewater is spread onto the top of the reactor and flows downward
through the bed of the colonized material where treatment takes place with treated effluent exiting
the bottom of the reactor. The design allows separation of the hydraulic retention time (HRT) and
SRT by retaining active biomass in the reactor. Reactors with immobilized biomass have been
reported to withstand the stress of changing substrate loading conditions better than reactors with
a flocculent or suspended growth system (Raposo et al., 2004).
So far, there are no adequate studies on DBP precursor removal influenced by different
wastewater treatment processes. Both comprehensive full-scale survey and in-depth laboratory-
scale investigation are needed to enhance the understandings about the impact of wastewater
treatment processes on DBP precursors.

27
Literature Cited
Allpike, B.P., Heitz, A., Joll, C.A., Kagi, R.I., Abbt-Braun, G., Frimmel, F.H., Brinkmann, T.,
Her, N., and Amy, G. (2005) Size exclusion chromatography to characterize DOC
removal in drinking water treatment. Environ. Sci. Technol., 39(7), 2334-2342.
APHA (1998) Standard methods for the examination of water and wastewater, 20th ed.,
Washington, DC.
Ates, N., Kaplan, S.S., Sahinkaya, E., Kitis, M., Dilek, F.B., and Yetis, U. (2007) Occurrence of
disinfection by-products in low DOC surface waters in Turkey. Journal of Hazardous
Materials, 142, 526-534.
Barrett, S.E., Krasner, S.W., and Amy, G.L. (2000) Natural organic matter and disinfection by-
products characterization and control in drinking water. American Chemical Society,
Washington, DC.
Boyer, T.H., and Singer, P.C. (2005) Bench-scale testing of a magnetic ion exchange resin for
removal of disinfection by-product precursors. Water Res., 39(7), 1265-1276.
Chang, E.E., Chiang, P.-C., Ko, Y.-W., and Lan, W.-H. (2001) Characteristics of organic
precursors and their relationship with disinfection by-products. Chemosphere, 44(5),
1231-1236.
Chellam, S. (2000) Effects of nanofiltration on trihalomethane and haloacetic acid precursor
removal and speciation in waters containing low concentrations of bromide ion. Environ.
Sci. Technol., 34(9), 1813-1820.
Chen, B., Nam, S.-N., Westerhoff, P.K., Krasner, S.W. and Amy, G.L. (2009) Fate of effluent
organic matter and DBP precursors in an effluent-dominated river: A case study of
wastewater impact on downstream water quality. Water Res., 43(6), 1755-1765.

28
Chow, C.W.K., van Leeuwen, J.A., Drikas, M., Fabris, R., Spark, K.M., and Page, D.W. (1999)
The impact of the character of natural organic matter in conventional treatment with
alum. Water Sci. Technol., 40(9), 97-104.
Chu, H.P. (2003) Trihalomethane formation in contaminated surface water and its control by
membrane bioreactor. PhD thesis, Hong Kong University.
Cowman, G.A., and Singer, P.C. (1996) Effect of bromide ion on haloacetic acid speciation
resulting from chlorination and chloramination of aquatic humic substances. Environ.
Sci. Technol., 30(1), 16-24.
Diaz, F.J., Chow, A.T., O’Geen, A.T., Dahlgren, R.A. and Wong, P-K. (2008) Restored wetlands
as a source of disinfection byproduct precursors. Environ. Sci. Technol., 42(16), 5992-
5997.
Diehl, A.C., Speitel, G.E. Jr., Symons, J.M., Krasner, S.W., Hwang, C.J., and Barrett, S.E. (2000)
DBP formation during chloramination. J. AWWA, 92(6), 76-90.
Dold, P.L., Ekama, G.A., and Marais, G.V.R. (1980) A general model for the activated sludge
process. Prog. Water Technol., 12, 47-77.
Drikas, M., Dixon, M., and Morran, J.Y. (2008) Removal of trihalomethane precursors using the
MIEX dissolved organic carbon process in combination with granular activated carbon.
In Chapter 16 of Disinfection by-products in drinking water, ACS Symposium Series,
Vol 995, 227-241.
Duirk, S.E., and Valentine, R.L. (2006) Modeling dichloroacetic acid formation from the reaction
of monochloramine with natural organic matter. Water Research, 40(14), 2667-2674.
Edwards, M. (1997) Predicting DOC removal during enhanced coagulation. J. Am Water Works
Assn., 89(5), 78-89.
Fu, P., Ruiz, H., Thompson, K., and Spangenberg, C. (1994) Selecting membranes for removing
NOM and DBP precursors. J. Am. Wat. Works. Assn. 86(12), 55-72.

29
Galapate, R.P., Agustiani, E., Baes, A.U., Ito, K. and Okada, M. (1999) Effect of HRT and MLSS
on THM precursor removal in the activated sludge process. Water Res., 33(1), 131-136
Grady, C.P.L., and Williams, D.R. (1975) Effects of influent substrate concentration on the
kinetics of natural microbial populations in continuous culture. Water Res., 18(2), 239-
246.
Goslan, E.H., Fearing, D.A., Banks, J., Wilson, D., Hills, P., Campbell, A.T., and Parsons, S.A.
(2002) Seasonal variations in the disinfection by-product precursor profile of a reservoir
water. Aqua – Journal of Water Supply: Research and Technology, 51(8), 475-482.
Guo, Y.C., and Krasner, S.W. (2009) Occurrence of primidone, carbamazepine, caffeine, and
precursors for N-Nitrosodimethylamine in drinking water sources impacted by
wastewater. Journal of the American Water Resources Association, 45(1), 58-67.
Henze, M. (1992) Characterization of wastewater for modeling of activated sludge processes.
Water Sci. Technol., 25(6), 1-15.
Hutton, P. (1992) Trihalomethane formation potential modeling. In Chapter 9 of Methodology for
flow and salinity estimates in the Sacramento-San Joaquin Delta and Suisun Marsh, 13th
Annual Progress Report.
Hong, Y., Liu, S., Song, H., and Karanfil, T. (2007) HAA formation during chloramination –
significance of monochloramine’s direct reaction with DOM. J. Am. Wat. Works Assn,
99(8), 57-59.
Judd, S.J., and Black, S. (2000) Disinfection byproduct formation in swimming pool waters: A
simple mass balance. Water Res., 34, 1611-1619.
Judd, S.J., and Bullock, G. (2003) The fate of chlorine and organic materials in swimming pools.
Chemosphere, 51, 869-879.

30
Kanan, A., and Karanfil, T. (2011) Formation of disinfection by-products in indoor swimming
pool water: The contribution from filling water natural organic matter and swimmer body
fluids, Water Res., 45(2), 926-932.
Kim, H.-C., and Dempsey, H.-C. (2008) Effects of wastewater effluent organic materials on
fouling in ultrafiltration. Water Res., 42(13), 3379-3384.
Kim, H., Shim, J., and Lee, S. (2002) Formation of disinfection by-products in chlorinated
swimming pool water. Chemosphere, 46)1), 123-130.
Kim, M., Ahn, Y.H., and Speece, R.E. (2002) Comparative process stability and efficiency of
anaerobic digestion: mesophilic vs thermophilic. Water Res., 36, 4369-4385.
Karanfil, T., Hong, Y., Song, Y., and Orr, O. (2007) Exploring the pathways of HAA formation
during chloramination. American Water Works Association, Denver, Colorado, US.
Karanfil, T., Krasner, S.W., Westerhoff, P., and Xie, Y.F. (2008) Recent advances in disinfection
by-products formation, occurrence, control, health effects, and regulations. In
Disinfection By-Products in Drinking Water: Occurrence, Formation, Health Effects and
Control; Karanfil, T., Krasner, S. W., Westerhoff, P., Xie, Y. F., Editors. ACS
Symposium Series 995, Oxford University Press, New York.
Krasner, S.W., McGuire, M.J., Jacangelo, J.G., Patania, N.L., Regan, K.W., and Aieta, E.M.
(1989) The occurrence of disinfection by-products in US drinking water. J. Am. Water
Works Assn. 81(8), 41-53.
Krasner, S.W., Westerhoff, P., Chen, B., Amy, G., Nam, S.-N., Chowdhury, Z.K., Sinha, S., and
Rittmann, B.E. (2008) Contribution of Wastewater to DBP Formation. AWWA Research
Foundation, Denver, CO.
Krasner, S.W., Westerhoff, P., Chen, B., Rittmann, B.E. and Amy G. (2009a) Occurrence of
disinfection byproducts in United States wastewater treatment plant effluents. Environ.
Sci. Technol., 43(21), 8329-8325.

31
Krasner, S.W., Westerhoff, P., Chen, B., Rittmann, B.E., Nam, S.-N. and Amy, G. (2009b)
Impact of wastewater treatment processes on organic carbon, organic nitrogen, and DBP
precursors in effluent organic matter. Environ. Sci. Technol., 43(8), 2911-2918.
Lee, W., Westerhoff, P. and Croue, J-P (2007) Dissolved organic nitrogen as a precursor for
chloroform, dichloroacetonitrile, n-nitrosodimethylamine, and trichloronitromethane.
Environ. Sci. Technol., 41(15), 5485-5490.
Leenheer, J.A. (2004) Comprehensive assessment of precursors, diagenesis, and reactivity to
water treatment of dissolved and colloidal organic matter. Water Sci. Technol: Water
Supply, 4(4), 1-9.
Li, X.-Y., Chu, H.P. (2003) Membrane bioreactor for the drinking water treatment of polluted
surface water supplies. Water Res., 37(19), 4781-4791.
Liu, J.-L., and Li, X.-Y. (2010) Biodegradation and biotransformation of wastewater organics as
precursors of disinfection byproducts in water. Chemosphere, 81(9), 1075-1083.
Melcer, H., Dold, P.L., Jones, R.M., Bye, C.M., Takacs, I., Stensel, H.D., Wilson, A.W., Sun, P.,
and Bury, S. (2003) Methods for wastewater characterization in activated sludge
modeling. Water Environment Research Foundation (WERF), Alexandria, VA, USA
Miltner, R.J., Shukairy, H.M., and Summers, R.S. (1992) Disinfection by-product formation and
control by ozonation and biotreatment. J. Am. Water Works Assn, 84(11), 53-62.
Mitch, W.A., Gerecke, A.C., and Sedlak, D.L. (2003) A N-Nitrosodimethylamine (NDMA)
precursor analysis for chlorination of water and wastewater. Water Res., 37(15), 3733-
3741.
Namkung, E., and Rittman, B.E. (1986) Soluble microbial products (SMP) formation kinetics by
biofilms. Water Res., 20(6), 795-806.
Nieminski, E.C., Chaudhuri, S., and Lamoreaux, T. (1993) The occurrence of DBPs in Utah
drinking water. J. Am. Wat. Work. Assn., 85(9), 98-105.

32
Parsons, S.A., Jefferson, B., Goslan, E.H., Jarvis, P.R., and Fearing, D.A. (2005) Natural organic
matter – the relationship between character and treatability. Water Supply 4(5-6), 43-48.
Qi, Y., Shang, C., and Lo, I.M.C. (2004) Formation of haloacetic acids during
monochloramination. Water Res., 38(9), 2374-2382.
Rittmann, B.E., and McCarty, P.L. (2001) Environmental biotechnology: Principles and
applications. McGraw Hill, New York, NY.
Randtke, S.J. (1988) Organic contaminant removal by coagulation and related process
combinations. J. Am. Water Works Assn., 80(5), 40-56.
Raposo, F., Borja, R., Sanchez, E., Martin, M.A., and Martin, A. (2004) Performance and kinetic
evaluation of the anaerobic digestion of two-phase olive mill effluents in reactors with
suspended and immobilized biomass. Water Res., 38, 2017-2026.
Reckhow, D.A. (1984) Organic halide formation and the use of preozonation and alum
coagulation to control organic halide precursors. Doctoral dissertation, University of
North Carolina, Chapel Hill.
Reckhow, D.A., Singer, P.C. (1985) Mechanisms of organic halide formation during fulvic acid
chlorination and implications with respect to preozonation. In: Jolley R, Gorcher H,
Hamilton DH, Editors. Water chlorination: environmental impact and health effects, Vol.
5. Ann Arbor, MI: Ann Arbor Science Publisher Inc, 1229–1257.
Rook, J.J. (1977) Chlorination reactions of fulvic acids in natural waters. Environ. Sci. Technol.,
11(5), 478-482.
Rosario-Ortiz, F.L., Snyder, S., and Suffet, I.H., Characterization of the polarity of natural
organic matter under ambient conditions by the polarity rapid assessment method
(PRAM), Environ. Sci. Technol., 41, 4895-4900, 2007

33
Rostad, C.E., Martin, B.S., Barber, L.B. and Leenheer, J.A. (2000) Effects of a constructed
wetland on disinfection byproducts: Removal processes and production of precursors.
Environ. Sci. Technol., 34(13), 2703-2710.
Summers, R.S., Hooper, S.M., Shukairy, H.M., Solarik, G., and Owen, D., Assessing the DBP
yield: Uniform formation conditions. J. Am. Water Works Assoc., 88(6), 80-93, 1996
Sirivedhin, T., and Gray, K.A. (2005a) Identifying anthropogenic markers in surface waters
influenced by treated effluents: a tool in potable water reuse. Water Res., 39(6), 1154-
1164.
Sirivedhin, T., and Gray, K.A. (2005b) Comparison of the disinfection by-product formation
potentials between a wastewater effluent and surface waters. Water Res., 39(6), 1025-
1036.
Sundstrom, D.W. and Klei, H.E. (1979) Wastewater Treatment. Prentice-Hall, Inc., Englewood
Cliffs, NJ.
Taylor, J.S., and Jacobs, E.P. (1996) Reverse Osmosis and nanofiltration. In Mallevialle J,
Odendall PE, Wiesner MR, Editors, Water treatment membrane processes, McGraw-Hill,
New York, NY,
USEPA (1998) National primary drinking water regulations: disinfectants and disinfection by-
products, final rule. Washington, DC.
Uyak, V., Yavuz, S., Toroz, I., Ozaydin, S., Genceli, E.A. (2007) Disinfection by-products
precursor removal by enhanced coagulation and PAC adsorption. Desalination, 216, 334-
344.
van Leeuwen, J., Chow, C., Fabris, R., Withers, N., Page, D., and Drikas, M. (2002) Application
of a fractionation technique for better understanding of the removal of natural organic
matter by alum coagulation. Water Sci. Technol: Water Supply, 2(5), 427-433.

34
White, G.C. (1999) Handbook of chlorination and alternative disinfectants, 4th ed. Wiley
Interscience, New York, NY.
White, D.M., Garland, D.S., Narr, J., and Woolard, C.R. (2003) Natural organic matter and DBP
formation potential in Alaskan water supplies. Water Res., 37(4), 939-947.
Xie, Y.F. (2004), Disinfection byproducts in drinking water: Formation, analysis, and control,
Boca Raton, FL: Lewis Publishers.
Yang, X., Shang, C., and Huang, J.-C. (2005) DBP formation in breakpoint chlorination of
wastewater. Water Res., 39(19), 4755-4767.
Yang, X., Shang, C., and Westerhoff, P. (2007) Factors affecting formation of haloacetonitriles,
haloketones, chloropicrin and cyanogens halides during chloramination. Water Res.,
41(6), 1193-1200.

35
Chapter 3
Quantification of Disinfection Byproduct Formation Potential in Wastewater
Abstract
Sample pretreatment methods were evaluated to explore their impacts on the quantification of
disinfection by-product formation potential (DBPFP) in wastewater. Results showed that
pretreatment was required to maintain the level of DBPFP and filtration coupled with
acidification to pH less than 2 produced stable samples for DBPFP assessment and had
advantages for long-term storage. The proposed method for quantification of DBPFP in
wastewater is based on the standardized chlorination parameters, which include 20 mg/L chlorine
dose, pH 7, 25°C, and 3-day incubation in the dark. Proper dilution is a key to assure that free-
chlorine residual remains after incubation. It is recommended that the dilution ratio be determined
based on the ammonia level. The proposed method was validated by varying the chlorine doses
and ammonia levels. The method could be used to quantify DBPFP for a broad range of
wastewater samples.
Keywords: Chlorination; disinfection by-products; formation potential; disinfection by-product
precursor; sample pretreatment; wastewater
Material presented in this chapter was presented at IWA Micropol & Ecohazard 2011 Conference
in Sydney, Australia.

36
Introduction
Disinfection of wastewater is required before treated wastewater is discharged into natural water
bodies. Chlorination is a commonly adopted disinfection strategy because of its mature practices
and low cost. However, it has been known for decades that chlorine readily reacts with aquatic
organic matter, or disinfection by-product (DBP) precursors, to form possibly carcinogenic DBPs.
Since organic matter is abundant in wastewater, it is crucial to evaluate its DBP formation or
DBP precursors. DBP precursors are usually estimated by the DBP formation potential (DBPFP)
(Amy et al., 1990; Galapate et al., 1999; Chu et al., 2002). In drinking water, the DBPFP test is
conducted according to standardized chlorination conditions, which allows comparison of results
between water systems or laboratories (Xie, 2004). These standardized conditions include a
chlorine dose of 20 mg/L, an incubation time of 3 days and/or an incubation temperature of 20°C
(Xie, 2004). Wastewater is more complicated due to the complexity of its constituents, including
high levels of ammonia and other inorganic and organic compounds which react with free
chlorine. This makes the drinking water DBPFP test protocol unadoptable in wastewater because
of the high chlorine demand of wastewater which results in low to none free-chlorine residual
after several days of incubation. In addition, wastewater is not biologically stable and could
undergo a series of biodegradation. To quantify the DBPFP of wastewater, therefore,
pretreatment strategies are needed in order to maximally preserve DBP precursors.
Quantification of DBPFP in wastewater has been conducted by several researchers (Li
and Chu, 2003; Sirivedhin and Gray, 2005; Yang et al., 2005; Lee et al., 2007; Diaz et al., 2008;
Krasner et al., 2009b; Song et al., 2010). However, due to different pretreatment and chlorination
conditions used, it might be difficult to compare these results. Various sample pretreatment
strategies were found in literature. Yang et al. (2005) preserved their wastewater samples by
lowering the temperature to 4°C before the DBPFP test. Sirivedhin and Gray (2005) and Krasner

37
et al. (2009b) immediately filtered their wastewater samples with 0.45 µm filters before the
DBPFP test. Standard Methods 5710 (APHA, 1998) suggested storing samples at 4°C and
analyzing as soon as possible. Since Standard Methods 5710 was developed for quantifying
DBPFP in drinking water, the pretreatment strategy may be insufficient. Chlorination conditions,
such as temperature, pH, reaction time, chlorine dose and residual, need to be controlled and
standardized. For wastewater, dilution may also be needed. However, literature also shows a wide
selection of strategies. For example, Yang et al. (2005) diluted wastewater samples with a 0.01M
phosphate buffer at a 1:1.5 volume ratio to pH 7, and then initiated chlorination by adding a pre-
set chlorine dose. Samples were incubated at room temperature (21±1°C) for 24 hours. Sirivedhin
and Gray (2005) buffered each sample at pH 7, chlorinated with an excess of free chlorine and
stored them at 25°C for 7 days. Lee et al. (2007) buffered samples to pH 7, and then used an
initial dose of 5 mg Cl2 per mg of DOC with 7-day incubation at 20°C. Diaz et al. (2008)
employed uniform formation conditions, which were conventionally used in drinking water
(Summers et al, 1996), for DBPFP assessment in wastewater. Those conditions included 1±0.4
mg/L free-Cl2 residual at pH 8±0.2 after 24±1 h of incubation at 20°C. Krasner et al. (2009a)
chlorinated wastewater samples according to organic and inorganic chlorine demand and held
them for 24 hours at pH 8.2 and 25°C. The reaction conditions described in Standard Methods
5710 (APHA, 1998) included free-chlorine residual at least 3 mg/L and not more than 5 mg/L at
the end of a 7-day incubation period, and the incubation temperature at 25 ± 2°C, and pH at 7 ±
0.2. Li and Chu (2003) followed the chlorination conditions described in Standard Methods
except that an incubation period of 3 days was used. It is important to investigate how these
variable conditions affect the quantification of DBPFP in wastewater. As wastewater samples
vary in their characteristics, development of a standardized method for DBPFP assessment in
wastewater is essential.

38
The objectives of this study are: (1) to evaluate the effects of pretreatment methods on
DBPFP in wastewater, and (2) to propose a method for quantification of DBPFP in wastewater
that can be applied to a broad range of wastewater samples.
.
Materials and Methods
Chemicals
All chemical solutions were prepared from reagent-grade chemicals or stock solutions. A
free chlorine (sodium hypochlorite) stock solution (1000 mg/L) was prepared from 6% sodium
hypochlorite and it was periodically standardized using the n,n-diethyl-p-phenylene diamine
(DPD) colorimetric method (APHA, 1998). Trihalomethanes (THMs), haloacetic acids (HAAs),
and chloral hydrate (CH) were obtained from Supelco (Bellefonte, Pennsylvania, USA). 200
µg/ml of THMs and 200 µg/ml of HAAs in methyl tert-butyl ether (MTBE) and 150 µg/ml of CH
in methanol were made as stock solutions for calibration standards.
Wastewater sampling, pretreatment, and characterization
Wastewater samples were collected from various domestic wastewater treatment systems.
To evaluate the pretreatment strategies, non-pretreated samples, filtered samples, and filtered &
acidified samples were stored at 4°C before further analyses. Filtration (0.45 µm) was conducted
immediately on site. Acidification was conducted by adding a few drops of concentrated sulfuric
acid to lower the pH to less than 2. To evaluate the effects of filter pore sizes, 0.1 µm, 0.2 µm,
and 0.45 µm filters were used during the filtration process. Total organic carbon (TOC) was

39
measured with a TOC analyzer (O.I. Analytical Model 1010, Maryland, USA). Ammonia
nitrogen was measured using the ammonia-selective electrode method (APHA, 1998). A Hewlett
Packard 8453 UV/VIS spectrophotometer was used for measuring ultraviolet absorbance at 254
nm (UV254) based on Standard Method 5910B (APHA, 1998).
Dilution and buffering of wastewater
The dilution ratio was determined based on the ammonia level. To evaluate the effects of
dilutions, three volume dilution ratios (1:25, 1:12.5, and 1:5) were tested. Two ml of 1 M
phosphate buffer (pH 7) was added to a pre-determined volume of a wastewater sample, and the
volume was brought up to 250 ml by distilled water.
Chlorination and incubation of wastewater
After dilution, a chlorine dose of 20 mg/L was applied. The amber bottles were sealed
with PTFE-lined screw caps without head space for incubation. A 3-day reaction time in the dark
was adopted for DBP formation. Temperatures were set to 25°C. At the end of the sample
incubation, samples were transferred to two 40 ml vials containing granular ammonia chloride to
convert free chlorine to combined chlorine. These vials were sealed with PTFE-lined screw caps
without head space and stored at 4°C until sample extractions.
DBP analyses
HAA, THM and CH analyses were conducted using modified EPA method 552.3 and
551.1, and their method detection limits were 0.26, 0.06, and 0.005 µg/L, respectively. For HAA

40
analysis, each 30 ml sample was acidified with 1.5 ml concentrated sulfuric acid and extracted
with 3 ml of MTBE spiked with 300 µg/L 1,2-dibromopropane. Approximately 12 g of sodium
sulfate was added to enhance the extraction. Then, 1 ml of the MTBE extract was mixed with 1
ml of 10% sulfuric acid/methanol mix, and incubated for two hours at 50°C for HAA
derivatization. After derivatization, the solution was back-extracted with 4 ml of 10% sodium
sulfate solution to remove excess methanol. For THM and CH analysis, each 30 ml sample was
treated using the protocols above excluding pre-extraction acidification and post-extraction
methylation.
DBP measurements
The concentrations of DBPs were determined using gas chromatographs (Hewlett
Packard 6890) with electron capture detectors. A DB-1 capillary column (30 m × 0.32 mm i.d.,
1.0 µm film thickness) was used for THM and CH analyses. A DB-1701 capillary column (30 m
× 0.25 mm i.d., 0.25 µm film thickness) was used for HAA analysis. The temperature ramping
programs were as follows: (1) THMs and CH: Initial at 35°C for 22 minutes, ramp to 145°C at 10
°C/min and hold at 145°C for 2 minutes; (2) HAAs: Initial at 35°C for 10 minutes, ramp to 75°C
at 5°C/min and hold 16 minutes, a final ramp to 200°C at 25°C/min and hold 5 minutes. DBP
concentrations were obtained using the calibration curves developed for THMs, HAAs, and CH.
Based on replicate analyses, errors in the measurements were less than 10%, and the relative
standard deviation was 8.3% for THMs, 8.9% for HAAs, and 6.4% for CH, respectively. The
matrix recoveries for DBPs were within 80-120%.
41
Statistical analysis
Statistical methods were implemented using Minitab version 15 (State College,
Pennsylvania, USA). The level of significance was set to α ≤ 0.05. Analysis of Means (ANOM)
was performed to compare DBPFP data obtained between any two different sample pretreatment
or chlorination conditions. Mann-Whitney procedure, a nonparametric method was used if the
sample sizes were small. Minitab’s Homogeneity of Variances Test was used to test whether the
two standard deviations of any two populations were different. If the variances were similar, a
pooled variance t-test was used. Otherwise, a separate variance t-test was used.
Results and Discussion
Sample Pretreatment
DBP precursors in drinking water and wastewater are of different origins (Krasner et al.,
2009a). In drinking water, organic matter is generally stable and DBP formation is correlated with
aromatic moieties (Singer, 1999). DBP precursors in wastewater, however, are mostly non-humic
organic matter (Chen et al., 2009), and unstable due to bacteriological activities. Therefore, it is
crucial to use a pretreatment method for maximum preservation.
This research employed three preservation methodologies for DBP precursors in
wastewater: (1) storing samples at 4°C only; (2) filtering samples with 0.45 µm filters and storing
at 4°C; and (3) filtering samples with 0.45 µm filters, acidifying to pH less than 2, and storing at
4°C. Figure 3-1 shows the DBPFP results during a 14-day preservation. The chlorination
conditions include pH 7, 25°C, 20 mg/L Cl2 and 3-day incubation in the dark.
During the 14-day preservation at 4°C, the TOC of the non-pretreated samples decreased
by 19%. In the meantime, the UV254 and specific ultraviolet absorbance (SUVA) also changed.

42
This indicates that the organic matter in non-pretreated samples was unstable at 4°C. Since
SUVA correlates with DBP formation (Kitis et al., 2001), the DBPFP may also be affected. For
the filtered samples and the filtered & acidified samples, TOC only showed slight decrease. Their
UV254 and SUVA values were relatively stable. This indicates that the two pretreatment
strategies preserve organic matter very well. However, it was also found that they reduced the
TOC at the very beginning. Results showed that the filtration instantly removed 17% TOC by
retaining the particulate matter on the filters, and the acidification instantly removed 14% TOC
further due to potential mineralization. Therefore, the organic matter constituents were changed
by the pretreatment.
While the DBPFPs were explored, Figure 3-1d and e show that the 4°C preservation
without other pretreatment strategies could not preserve DBP precursors well. In the first 5 days
of preservation, the HAAFP and THMFP in the non-pretreated samples increased by 32% and
35%, respectively. This indicates that although the bacteriological activities might be limited at
4°C, there still existed slow reactions that converted some organic matter to DBP precursors. The
possible mechanism is the formation of soluble microbial products (SMPs). The SMPs can react
with chlorine and are an important source of wastewater-derived DBP precursors (Liu and Li,
2010). Because some SMPs can be degraded further, the experiments observed a decline of
HAAFP and THMFP after 5 days of preservation. Filtration can remove a majority of bacteria.
With filtration, increases of HAAFP and THMFP were still observed. However, the increases
were not as significant as those of the non-pretreated samples. Filtration coupled with
acidification was found to result in most stability on DBPFP. It appears to be an efficient strategy
to produce stable samples for DBPFP assessment. However, the method could not address the
DBPFP from the particulate matter and the mineralized organics.

43
Literatures show that different size organic matter fractions, such as particulate organic
matter, colloidal organic matter, and dissolved organic matter have different chemical properties
(Guo et al., 2003) and different reactivity in forming DBPs (Chow et al., 2006). Filters with a
pore size of 0.45 µm are widely used for filtration of wastewater samples. It is believed dissolved
organic matter (DOC) remains in the filtrate while suspended solids are retained on filters. Hu et
al. (2010) used 0.2 µm filters to eliminate particles. The use of 0.1 µm membrane retains all
colloid materials on filter (Roeleveld and van Loosdrecht, 2002). Chow et al. (2005) found that a
finer pore size filter is able to provide more homogeneous DOC properties and enables a better
characterization of DBP precursors. Therefore, filters with three pore sizes were tested in this
study. After filtration with these filters on site, samples were also acidified immediately to
maximally preserve DBP precursors. Figure 3-2 shows three major DBPFPs including THMFP,
HAAFP, and CHFP in 0.1 µm, 0.2 µm, and 0.45 µm filtered samples. The results indicate that
filtration with a finer pore size filter appeared to produce lower DBPFPs. The Mann-Whitney test
determined that the difference between 0.1 µm and 0.2 µm and the difference between 0.2 µm
and 0.45 µm were 0.1914 and 0.3313, respectively. They were not significant at the significance
level of 0.05, although a marginal increase was observed. The 0.45 µm filters were preferably
chosen because the 0.45 µm pore size was commonly used as a cutoff point for defining DOC.
By exploring the DBPFP levels in the preserved samples, the research data supports that
for longer storage, further pretreatment was required to maintain the level of DBPFP. In addition
to the 4°C described in Standard Methods 5710, both filtration (0.45 µm) and acidification
(pH<2) could be used for better characterization and maximal preservation of wastewater samples
for DBPFP determination.

44
Chlorination Conditions
The chlorination conditions in the DBPFP test include chlorine dose, pH, temperature,
and incubation time. All of them affect the formation of DBPs (Xie, 2004). High pH generally
results in a higher level of THM formation but a lower level of HAA formation. High temperature
generally results in a higher level of DBP formation. Both 20°C and 25°C have been reported in
protocols. In accordance with Standard Methods 5710, the authors recommend selected pH 7 and
25°C. The authors also recommend an incubation time of 3 days, which is in accordance with the
method generally used for quantification of DBPFP in drinking water.
A chlorine dose of 20 mg/L is normally used since it is sufficient to drive all DBP
precursors to DBPs for a broad range of drinking water samples. However, it may not be the case
for wastewater. The free-chlorine demand of wastewater could range from tens of milligram per
liter to hundreds of milligram per liter. If sufficient chlorine residual is not maintained, DBPFP
can be under-estimated (Dieh et al., 2000; Hong et al., 2007). Therefore, dilution becomes a pre-
requisite step before chlorine is added.
A well-nitrified effluent sample from Annville Wastewater Treatment Plant (Annville,
Pennsylvania, USA) was diluted in three volume ratios (1:25, 1:12.5, and 1:5) during the DBPFP
test. The chlorine doses were 20 mg/L, and the free chlorine residuals after incubation were 19.4,
18.5, and 16.0 mg/L, respectively. Figure 3-3a shows that a high dilution tended to result in
higher DBPFP, which could be due to the slightly higher chlorine residual. However, dilution
also cannot be too low, because the chlorine demand may consume all free chlorine and result in
much lower DBPs. Proper dilution has to assure that free-Cl2 residual remains after incubation
and to accommodate individual sample characteristics and laboratory limitations. For the
Annville sample, dilution ratios of 1:12.5 and 1:5 were all acceptable, since statistically there
were no significant difference between the resulting DBPFPs according to the Mann-Whitney

45
test. For the poorly-nitrified effluent sample from Middletown Wastewater Treatment Plant
(Middletown, Pennsylvania, USA), the dilution ratio of 1:5 was un-acceptable due to the severe
under-estimation of DBPFP (Figure 3-3b). The free-Cl2 residual after 3-day incubation was zero
mg/L.
The authors recommend that the dilution ratio be selected based on the concentration of
ammonia, which accounts for the majority of inorganic chemical demand in wastewater. Table 3-
1 shows the recommendations of the dilution ratios based on different ammonia levels.
Method Validation
Two tests by varying chlorine doses and ammonia levels were designed to validate the
proposed method. In the chlorine dose test, two chlorine doses were applied to the samples while
other conditions remained the same. Since the ammonia level is a key factor in determining the
DBPFP of wastewater, the effects of ammonia need to be explored to validate the proposed
method as well. In the ammonia level test, two ammonia levels were spiked to the samples to
produce different levels of ammonia while other conditions remained the same. The samples
would result in the same DBPFPs after chlorination, if the proposed method was valid.
For the chlorine dose test, the study compared two chlorine doses, including Dose 1 at 20
mg/L and Dose 2 at 20 + 8×(NH3-N) mg/L. Dose 2 was based on the inorganic (i.e., NH3)
chlorine demand, because for breakpoint chlorination, 7.6 mg Cl2 was needed to oxidize 1 mg
NH3-N. Dose 2 had included the ammonia level into consideration so that there were sufficient
free-Cl2 residual after incubation (Krasner et al., 2009a). Table 3-2 shows the results of DBPFP
test on six different effluent samples from wastewater treatment systems. The samples were
divided into two groups based on their ammonia content. Group 1 (No. 1-3) had less than 0.5
mg/L NH3-N, and Group 2 (No. 4-6) had 27.8, 11.9 and 13.2 mg/L NH3-N, respectively. A 1:5

46
volume ratio dilution was applied to all the samples. Apparently, when Dose 1 was applied,
according to Table 3-1, the dilution was sufficient for Group 1, but was insufficient for Group 2.
All samples in Group 2 had zero free-Cl2 residuals. For the samples of Group 1 which had high
free-Cl2 residuals, the two chlorine doses did not impact DBPFP data. This was because proper
dilutions were made and free-Cl2 residuals were maintained. The variation of chlorine dose does
not significantly affect the DBPFP. When Group 2’s DBPFP data was explored, chlorine dose
was found to be an issue. Because Group 2 did not maintain free-Cl2 residual due to insufficient
dilution, the DBPFP data using Dose 1 was much lower compared to the data obtained by using
Dose 2. The results supported that: (1) when wastewater samples had low ammonia
concentrations and high free-Cl2 residuals, both chlorine doses had no significant impact on
DBPFP; (2) The 20 mg/L chlorine dose became an issue when wastewater samples had high
ammonia concentrations and low free-Cl2 residual. Therefore, the 1:25-1:50 dilution ratio should
be used as suggested by the authors in Table 3-1.
For the ammonia level test, the study compared three levels (low, medium, and high
levels) of NH3-N concentrations. Figure 3-4 shows the DBPFP data of a well-nitrified effluent.
Originally, the sample had 0.6 mg/L NH3-N. Results were obtained after the addition of 0, 5 and
15 mg/L of NH3-N into the sample before the DBPFP test. The chlorination conditions included
pH 7, 25°C, 1:10 volume ratio dilution, 20 mg/L chlorine dose, and 3-day incubation in the dark.
It was found that, statistically, there was no significant difference among the DBPFPs of the three
samples. This indicated that ammonia itself did not impact DBPFP when a proper dilution was
made. The impact of ammonia on DBPFP came from the low free-Cl2 residuals as a result of the
high ammonia levels.

47
Conclusions
The following main conclusions were obtained from this study:
• Sample pretreatment and the selection of filter pore size affected the
quantification of DBPFP. Filtration (0.45 µm) coupled with acidification to pH less than 2
provided stable samples for DBPFP assessment and had advantages for long-term storage of
wastewater samples.
• The proposed method for quantification of DBPFP in wastewater was based on a
series of standardized chlorination conditions, which include 20 mg/L chlorine dose, pH 7, 25°C,
and 3-day incubation in the dark.
• Proper sample dilution is a key to DBPFP quantification in wastewater. It is an
effective way to maintain free-Cl2 residual after incubation. It is recommended that the dilution
ratio be determined based on the ammonia level.
• The proposed method was validated by varying chlorine doses and ammonia
levels. The method can be used to quantify DBPFP for a broad range of wastewater samples.
Acknowledgements
This study was supported by Office of Physical Plant and Institutes of Energy and the
Environment at the Pennsylvania State University.

48
Literature Cited
Amy, G.L., Thompson, J.M., Tan, L., Davis, M.K. and Krasner, S.W. (1990). Evaluation of THM
precursor contributions from agricultural drains. J. AWWA, 82(1), 57-64.
APHA (1998). Standard methods for the examination of water and wastewater. 20th edn,
Washington DC, USA.
Chen, B., Nam, S.-N., Westerhoff, P.K., Krasner, S.W. and Amy, G.L. (2009). Fate of effluent
organic matter and DBP precursors in an effluent-dominated river: A case study of
wastewater impact on downstream water quality. Water Res., 43(6), 1755-1765.
Chow, A.T., Guo, F., Gao, S., Breuer, R. and Dahlgren, R.A. (2005). Filter pore size selection for
characterizing dissolved organic carbon and trihalomethane precursors from soil. Water
Res., 39(7), 1255-1264.
Chow, A.T., Guo, F., Gao, S. and Breuer, R.S. (2006). Size and XAD fractionations of
trihalomethane precursors from soils. Chemosphere, 62(10), 1636-1646.
Chu, H.P., Wong, J.H.C., and Li, X.Y. (2002). Trihalomethane formation potentials of organic
pollutants in wastewater discharge. Water Sci. Tech., 46(11-12), 401-406.
Diaz, F.J., Chow, A.T., O’Geen, A.T., Dahlgren, R.A. and Wong, P-K. (2008). Restored wetlands
as a source of disinfection byproduct precursors. Environ. Sci. Technol., 42(16), 5992-
5997.
Diehl, A.C., Speitel, G.E. Jr., Symons, J.M., Krasner, S.W., Hwang, C.J. and Barrett, S.E. (2000).
DBP formation during chloramination. J. AWWA, 92(6), 76-90.
Galapate, R.P., Agustiani, E., Baes, A.U., Ito, K. and Okada, M. (1999). Effect of HRT and
MLSS on THM precursor removal in the activated sludge process. Water Res., 33(1),
131-136.

49
Guo, L.D., Lehner, J.K., White, D.M. and Garland, D.S. (2003). Heterogeneity of natural organic
matter from the Chena River. Water Res., 37(5), 1015-1022.
Hong, Y., Liu, S., Song, H. and Karanfil, T. (2007). HAA formation during chloramination –
significance of monochloramine’s direct reaction with DOM. J. AWWA, 99(8), 57-59.
Hu, J., Song, H., Addison, J.W. and Karanfil, T. (2010). Halonitromethane formation potentials in
drinking waters. Water Res., 44, 105-114.
Kitis, M., Karanfil, T., Kilduff, J.E. and Wigton, A. (2001). The reactivity of natural organic
matter to disinfection by-products formation and its relation to specific ultraviolet
absorbance. Water Sci. Technol., 43(2), 9-16.
Krasner, S.W., Westerhoff, P., Chen, B., Rittmann, B.E. and Amy G. (2009a). Occurrence of
disinfection byproducts in United States wastewater treatment plant effluents. Environ.
Sci. Technol., 43(21), 8329-8325.
Krasner, S.W., Westerhoff, P., Chen, B., Rittmann, B.E., Nam, S.-N. and Amy, G. (2009b).
Impact of wastewater treatment processes on organic carbon, organic nitrogen, and DBP
precursors in effluent organic matter. Environ. Sci. Technol., 43(8), 2911-2918.
Lee, W., Westerhoff, P. and Croue, J-P. (2007). Dissolved organic nitrogen as a precursor for
chloroform, dichloroacetonitrile, n-nitrosodimethylamine, and trichloronitromethane.
Environ. Sci. Technol., 41(15), 5485-5490.
Li, X.Y. and Chu, H.P. (2003). Membrane bioreactor for the drinking water treatment of polluted
surface water supplies. Water Res., 37(19), 4781-4791.
Liu, J.L. and Li, X.Y. (2010). Biodegradation and biotransformation of wastewater organics as
precursors of disinfection byproducts in water. Chemosphere, 81(9), 1075-1083.
Roeleveld, P.J. and van Loosdrecht, M.C.M. (2002). Experience with guidelines for wastewater
characterization in the Netherlands. Water Sci. Tech., 45(6), 77-87.

50
Singer, P.C. (1999). Humic substances as precursors for potentially harmful disinfection by-
products. Wat. Sci. Tech., 40(9), 25-30.
Sirivedhin, T. and Gray, K.A. (2005). Comparison of the disinfection by-product formation
potentials between a wastewater effluent and surface waters. Water Res., 39(6), 1025-
1036.
Song, H., Addison, J.W., Hu, J. and Karanfil, T. (2010). Halonitromethanes formation in
wastewater treatment plant effluent. Chemosphere, 79(2), 174-179.
Summers, R.S., Hooper, S.M., Shukairy, H.M., Solarik, G. and Owen, D. (1996). Assessing the
DBP yield: Uniform formation conditions. J. AWWA, 88(6), 80-93.
Xie, Y.F. (2004). Disinfection byproducts in drinking water: Formation, analysis, and control,
Boca Raton, FL: Lewis Publishers.
Yang, X., Shang, C. and Huang, J-C (2005). DBP formation in breakpoint chlorination of
wastewater. Water Res., 39(19), 4755-4767.

51
List of Figure and Table Captions
Figure 3-1. Impact of sample pretreatment on DBPFPs of wastewater samples
Figure 3-2. Impact of filter pore size on DBPFPs of wastewater samples
Figure 3-3. Impact of dilution ratio on DBPFPs of wastewater samples: (a) Effluent from
Annville Wastewater Treatment Plant; (b) Effluent from Middletown Wastewater
Treatment
Figure 3-4. Ammonia level test on DBPFPs of wastewater samples
Table 3-1. Suggested dilution ratio for wastewater with different ammonia levels
Table 3-2. Chlorine dose test on the DBPFPs of six wastewater samples

52
Figure 3-1. Impact of sample pretreatment on DBPFPs of wastewater samples

53
Figure 3-2. Impact of filter pore size on DBPFPs of wastewater samples

54
Figure 3-3. Impact of dilution ratio on DBPFPs of wastewater samples: (a) Effluent from
Annville Wastewater Treatment Plant; (b) Effluent from Middletown Wastewater Treatment
0
100
200
300
400
500
600
DBPFP[µg/L]
Ratio 1:25
Ratio 1:12.5
Ratio 1:5
THMFP HAAFP
a
0
200
400
600
800
1000
DBPFP[µg/L]
Ratio 1:25
Ratio 1:12.5
Ratio 1:5
THMFP HAAFP
b

55
Figure 3-4. Ammonia level test on DBPFPs of wastewater samples

56
Table 3-1. Suggested dilution ratio for wastewater with different ammonia levels
NH3-N Dilution ratio
<5 mg/L 1:5
5-15 mg/L 1:10-1:20
15-30 mg/L 1:25-1:50

57
Table 3-2. Chlorine dose test on the DBPFPs of six wastewater samples
Sample
ID
Free-Cl2 residual DBPFP HAAFP THMFP CHFP
Dose 1 Dose 2 Dose 1 Dose 2 Dose 1 Dose 2 Dose 1 Dose 2 Dose 1 Dose 2
Group 1: Samples had low ammonia concentrations No. 1 17.4 18.4 262 257 138 140 75 83 18 21
No. 2 17.5 18.6 260 258 139 156 72 71 18 18
No. 3 18.7 19.5 265 247 148 144 70 71 17 18
Group 2: Samples had high ammonia concentrations No. 4 0 18.8 94 456 45 251 17 136 5 49
No. 5 0 14.8 196 360 99 206 44 104 16 32
No. 6 0 13.1 121 346 48 191 35 104 8 30 Dose 1: 20 mg/L Cl2, pH 7, 25°C, 1:5 volume ratio dilution, and 3 day incubation time in the dark
Dose 2: 20+8×[NH3-N] mg/L Cl2, pH 7, 25°C, 1:5 volume ratio dilution, and 3 day incubation time in the dark

58
Chapter 4
Disinfection Byproduct Formation Potentials of Wastewater Effluents and
Their Removal in a Model Wastewater Treatment Plant
Abstract
The disinfection byproduct formation potentials (DBPFPs) of treated wastewaters from various
wastewater treatment plants (WWTPs) were analyzed and the DBPFP removal by different
treatment processes in a model WWTP was studied. Results showed that the WWTPs that
achieved better organic matter removal and nitrification resulted in low DBPFPs in treated
effluents. In the model WWTP, the combination of trickling filter and modified Ludzack-Ettinger
process was more efficient in dissolved organics and DBPFP removal than the activated sludge
process. The FPs of haloacetonitriles and haloketones showed the highest removal efficiencies in
both systems compared to the FPs of other predominant DBP species such as haloacetic acids
(HAAs) and trihalomethanes (THMs). In addition, WWTP changed the DBPFP speciation profile
by lowering the HAAFP/THMFP ratio. The DBP yields and specific ultraviolet absorbance
increased after secondary treatment, indicating that the remaining organic matters tend to be more
humic. The study implied that the oxic and anoxic conditions, soluble microbial products,
nitrification, and solid retention time may impact DBPFPs.
Keywords: disinfection by-products; formation potential; wastewater treatment plants
Material presented in this chapter is a manuscript in preparation.

59
Introduction
In recent years, increased wastewater discharges pose a serious threat to drinking water supplies
(Krasner et al., 2008). As rivers, lakes and groundwater are accepting more and more treated
wastewater, the drinking water quality is affected and a notable impact on disinfection byproduct
(DBP) precursors was observed (Chen et al., 2009). Some of DBPs are carcinogenic (Bull, 1982;
Singer, 1999) and have been regulated. The removal of DBP precursors by utilities in drinking
water systems is required under the EPA Stage 1 Disinfectants and Disinfection Byproducts
(D/DBP) rule (USEPA, 1998), which specifies maximum concentrations for disinfectants and
DBPs in drinking water. Although wastewater is a source of various DBP precursors, currently
there are no regulations on DBP precursor removal efficiencies by wastewater treatment plants
(WWTPs). The National Pollutant Discharge Elimination System (NPDES) discharge limits only
regulate some THMs (e.g. chloroform) in WWTP effluents. Because chlorination of wastewater
involves many reactions due to the presence of various chlorine-reacting species such as
ammonia, organic carbon, organic nitrogen, and bromide at high concentrations, various DBPs
can be formed at high levels (Diehl et al., 2000; Yang et al., 2005; Lee et al., 2007; Hong et al.,
2007; Hu et al., 2010; Song et al., 2010). A non-removal or poor-removal of DBP precursors
from wastewater would impact the downstream water treatment systems.
Assessment of DBP precursors can be completed by a formation potential (FP) test
(APHA, 1998; Rostad et al., 2000; Chu et al., 2002; Li and Chu, 2003; Xie, 2004; Diaz et al.,
2008). The DBP precursors in wastewater are generally estimated by analyzing the FPs of the
DBPs, including trihalomethanes (THMs), haloacetic acids (HAAs), oxygenated DBPs and
nitrogenous DBPs. Because wastewater organics are substantially different from the natural
organic matter in drinking water, the types and amounts of DBPFPs in wastewater could be
different from those found in drinking water (Sirivedhin and Gray, 2005a,b). Krasner et al.

60
(2009b) explored the impact of wastewater treatment processes on DBP precursors and
emphasized a profound impact of nitrification on effluent quality including organic carbon,
organic nitrogen, and DBP precursors. Galapate et al. (1999) found that the hydraulic retention
time (HRT) and mixed liquor suspended solids (MLSS) were two parameters that could affect
THM precursors and chemical properties of organic matter in the effluents of activated sludge
process. Since WWTPs affect wastewater quality in many ways, there is a need for
comprehensive studies. To date, few studies evaluated the DBPFPs in various wastewater
effluents and the fate of DBP precursors during the biodegradation processes remains unclear.
In this study, a survey on DBPFPs was conducted on WWTP effluents of various levels
of organic removal and nitrification. In addition, the survey focused on a model WWTP, which
employs two independent process trains to treat the same wastewater influent. The objectives
were (1) to evaluate the levels of DBPFPs in various wastewater effluents; and (2) to explore the
DBPFP removal efficiencies during the biodegradation trains in the model WWTP. The target
species of DBPFPs were chloroform (CF), bromodichloromethane (BDCM),
dibromochloromethane (DBCM), bromoform (BF), chloral hydrate (CH), monochloroacetic acid
(MCAA), monobromoacetic acid (MBAA), dichloroacetic acid (DCAA), trichloroacetic acid
(TCAA), bromochloroacetic acid (BCAA), dibromoacetic acid (DBAA), trichloroacetonitrile
(TCAN), dichloroacetonitrile (DCAN), bromochloroacetonitrile (BCAN), dibromoacetonitrile
(DBAN), chloropicrin (CP), 1,1-dichloro-2-propanone (DCP), and 1,1,1-trichloro-2-propanone
(TCP). Since some of these compounds such as THM and HAA species are regulated in drinking
water (USEPA, 1998), the research into THMs and HAAs is of particular interest.

61
Materials and Methods
WWTPs Surveyed
Nine domestic WWTPs in Pennsylvania USA were selected for a survey on DBPFPs in
treated wastewater. All WWTPs had grit removal and primary treatment. A description of
secondary treatment by the WWTPs is presented in Table 4-1. In December 2008, grab samples
of secondary effluents prior to disinfection were collected from these plants. Due to the different
biological treatment processes, the WWTPs produced various effluent qualities. The levels of
carbon, nitrogen and DBPFPs were evaluated.
The model WWTP
The University WWTP (University Park, Pennsylvania, USA) was selected as a model
WWTP for the intensive study. The plant has a treatment capacity of 4.0 mgd. It accepts domestic
wastewater from the Pennsylvania State University and a portion of State College Borough. The
WWTP provides primary treatment, carbonaceous oxidation, nitrification, and denitrification.
Wastewater receives preliminary treatment via vortex grit removal and primary treatment with
primary clarifiers prior to the secondary treatment. It has two independent process trains to treat
the same primary effluent and a series of facilities are involved. Approximately, 50% of the flow
is treated by a trickling filter and a modified Ludzack-Ettinger activated sludge process
(TF/MLE) that operate in tandem while the other 50% is treated by an activated sludge process
(ASP). The TF/MLE side flow is split between two parallel-operating trickling filters and the
anoxic zone of an MLE process. The trickling filter effluent and anoxic zone effluent combine
and enter the aerobic reactors of the MLE process. The ASP side flow enters an oxic reactor of
the activated sludge process, and then it enters an anoxic zone and a second oxic reactor

62
sequentially. Eleven sampling points, illustrated in Figure 5-1, covered all outlet flows of the
secondary treatment facilities. Grab sampling of the process trains were finished in 2 hours and it
was conducted in April 2009 when the WWTP had full operation. The experiments were repeated
in May 2009 and June 2009 when the WWTP had reduced flows, for which reason the anoxic
zone and the second oxic reactor in the ASP side flow were shut down, and again in October
2009 when the WWTP resumed normal operation.
Sample preservation and the FP test
Samples collected from the WWTPs were preserved at 4°C on site. After they were
transported to the laboratory, samples were filtered (0.45 µm) and acidified to pH<2 by adding a
few drops of concentrated sulfuric acid. Samples were then stored in a 4°C until analysis.
The DBPFP test was conducted by applying a chlorine dose of 20 mg/L to the diluted and
buffered samples. The dilution ratio was determined based on the ammonia level. A phosphate
buffer solution (1M, pH 7) was used. Incubation was completed at 25°C in amber glass bottles for
3 days in absence of light. Then samples were transferred to 40 ml vials containing granular
ammonia chloride to quench the free chlorine residuals. The vials were sealed with PTFE-lined
screw caps without head space and stored at 4°C before extractions.
DBP extractions and measurements
Sample extractions were conducted using modified EPA method 552.3 and 551.1. For
HAAs, each 30 ml sample was acidified with 1.5 ml concentrated sulfuric acid and extracted with
3 ml of MTBE spiked with 300 µg/L 1,2-dibromopropane. Approximately 12 g of sodium sulfate
was added to enhance the extraction efficiency. Then, 1 ml of the MTBE extract was mixed with

63
1 ml of 10% sulfuric acid/methanol mix, and incubated for two hours at 50 °C for HAA
derivatization. After derivatization, the solution was back-extracted with 4 ml of 10% sodium
sulfate solution to remove excess methanol. For other DBPs, each 30 ml sample was treated using
the protocols above excluding pre-extraction acidification and post-extraction methylation.
The concentrations of DBPs were determined using gas chromatographs (Hewlett
Packard 6890) with electron capture detectors. A DB-1701 capillary column (30 m × 0.25 mm
i.d., 0.25 µm film thickness) was used for HAA analysis. A DB-1 capillary column (30 m × 0.32
mm i.d., 1.0 µm film thickness) was used for the analysis of other DBPs. The temperature
ramping programs were as follows: (1) HAAs: Initial at 35 °C for 10 minutes and ramp to 75 °C
at 5 °C/min and hold for 15 minutes, ramp to 100 °C at 5 °C/min and hold 5 minutes, a final ramp
to 135 °C at 5 °C/min; (2) Other DBPs: Initial at 35 °C for 22 minutes, ramp to 145 °C at 10
°C/min and hold 2 minutes. Minimum reporting levels (MRLs) for the DBPs were determined to
be 1.0 µg/L.
Data and statistical analysis
Duplicate sets were analyzed and only average data were presented. The standard
deviations were below 10% of the average value. For comparisons of those surveyed WWTPs,
statistical methods were implemented using Minitab version 15 (State College, Pennsylvania,
USA). Mann-Whitney procedure, a nonparametric method was used and the level of significance
was set to α < 0.05.
64
Results and Discussion
Effluents of the nine WWTPs
Carbon and nitrogen levels
The carbon content was evaluated by the dissolved organic carbon (DOC) in this study.
The DOC levels of the nine WWTP effluents were in the range of 5.1 and 14.3 mg/L (Table 4-1).
For the nitrogen content, the ammonia nitrogen concentrations (NH3-N) were used as a parameter
to evaluate the process efficiencies on nitrification. Based on the NH3-N levels, the nine surveyed
WWTPs were divided into two categories: five WWTPs (Plants #1, #2, #3, #4, and #5) that had
insufficient nitrification with NH3-N greater than 2 mg/L and four WWTPs (Plants #6, #7, #8,
and #9) that had complete nitrification with non-detected NH3-N in their effluents.
Plants #1, #2, #3, #4, and #5, which belonged to the category of insufficient nitrification,
had relatively high DOC in their effluents. Plants #6 and #8 achieved DOC as low as 5.1 mg/L
and 6.3 mg/L and non-detected NH3-N in effluents, indicating that the two WWTPs had superior
performances on organic matter removal and nitrification. This also implies that while
nitrification was in progress, additional organic matter removal could be observed. Plant #9,
although had complete nitrification, showed the highest DOC as 14.3 mg/L among the 9 surveyed
WWTPs. This was related with the tertiary membrane system in Plant #9. The membrane treated
a portion of the plant’s secondary effluent. It rejected 99% of organics and recycled them to the
primary effluent. The high DOC observed in secondary effluent of Plant #9 implied that the
rejected unbiodegradable organics were returned.

65
DBPFP levels
Of all WWTPs analyzed, the data showed that their effluents had higher HAAFPs than
THMFPs. This was possibly due to the characteristics of wastewater organics, which were
substantially different from the natural organic matter in drinking water (Sirivedhin and Gray,
2005a). Plants #6 and #8, which achieved better organic matter removal and nitrification, also had
low DBPFPs including HAAFPs (321 and 302 µg/L) and THMFPs (132 and 197 µg/L) in
effluents. Plants #1, #2, #3, #4, and #5, which had high organic matter level and insufficient
nitrification, had high DBPFPs. The HAAFPs of the five WWTPs ranged between 400 and 710
µg/L, and the THMFPs ranged between 248 and 305 µg/L. Specifically, Plants #2 and #3 had
effluents high in HAAFPs. Their THMFPs, however, were not significantly different from the
other three insufficiently nitrified WWTP effluents based on the Mann-Whitney test at the
significance level of 0.05. Plant #2, which adopted pure oxygen activated sludge process, had a
short solid retention time (SRT) with a maximum of 4.3 days. In addition, the relatively low pH
also limited the efficiency of nitrification and possible degradation of HAA precursors.
According to USEPA (1993), the maximum nitrification rate for Plant #7 which had pH 7.0 could
be 10% lower than other WWTPs which had pH higher than 7.5 in bioreactors. Plant #3, which
adopted trickling filter process, relied on the slime layer of filter media to achieve nitrification.
However, there was also denitrification due to the existence of anoxic conditions. The anoxic
reactions and the limited capabilities of biomass retention may be the cause for the poor removal
of HAA precursors. In addition, production of new HAA precursors from the formation of SMPs
(Liu and Li, 2010) could be another factor. Plant #9’s effluent had extraordinarily high THMFPs.
This was due to the high concentrations of recalcitrant organic matters (Krasner et al., 2009a)
from the recycled flow of the tertiary membrane system. The hydrophobic portions of those

66
organics had been related with THM precursors (Galapate et al., 1999; Chiang et al., 2002; Chow
et al., 2005, 2006).
DBP yields
DBP yields are calculated per carbon basis. The parameter normalizes the DBPFPs based
on the organic matter concentrations. Compared to a low DBP yield, a high DBP yield in
wastewater effluent would indicate that the remaining organics have high reactivity in forming
DBPs, or the remaining organics were more associated with DBP precursors. Plants #2 and #3
resulted in high HAA yields (78.0 and 78.8 µg/mgC) in their effluents. This implies that the pure
oxygen activated sludge and trickling filter processes produced effluent organics that had
relatively high reactivity in forming HAAs. Compared to other plants’ effluents, Plant #9’s
effluent appeared to have a high THM yield (34.9 µg/mgC) even though the increase of DOC
tend to offset the increase of THMFP. However, according to the Mann-Whitney test, the
difference was not significant.
By investigating the DBPFP levels in effluents of the nine WWTPs, the research data
supports that a wastewater treatment process that is able to achieve better organic matter removal
and complete nitrification (e.g. Plants #6 and #8) tends to result in low DBPFPs in the effluent.
Although all of these plants mainly treat domestic wastewater, it would be difficult to compare
the removal efficiencies of the different WWTPs because of their variable influent quality. It is
necessary to investigate a model WWTP with various treatment processes and the same
wastewater influent.

67
The model WWTP
Primary effluent
The primary treatment facilities of the model WWTP resulted in an effluent COD of 268
mg/L. The DOC of samples for the DBPFP test was 52.7 mg/L. Because the NH3-N level was in
the 25 mg/L range, a high dilution ratio (1:50) was applied to accommodate a 3-day chlorine
demand. Results of the DBPFP test (Table 4-3) shows that the wastewater sample prior to
biological treatment was high in DBP precursors. HAA, THM and CH precursors were in
predominant concentrations. 2000 µg/L HAAFP, 1080 µg/L THMFP and 987 µg/L CHFP were
found in the chlorinated primary effluent. The FPs of individual species were 1280, 700, 1080,
987µg/L, 99, 56, 18, and 4 µg/L for DCAA, TCAA, CF, CH, TCP, DCAN, CP, and BDCM,
respectively. MCAA, MBAA, DBAA, DBCM, BF, DCP, TCAN, BCAN and DBAN were below
the MRLs in chlorinated samples during the DBPFP test, since dilutions were applied. The
specific ultraviolet absorbance (SUVA) (0.89 L/mg-m) of the primary effluent were relatively
low. As SUVA lower than 2 L/mg-m would indicate non-humic organic matter in drinking water
systems (Krasner et al., 2008), the wastewater organics of primary effluent would be classified as
“non-humic” since they were mostly biodegradable organic matter.
Secondary effluents
Because both the ASP and TF/MLE treated the same primary effluent, the qualities of
their secondary effluents could be compared. The SRTs of the two processes were 11.9 and 12.3
days, respectively. The long SRTs ensured complete nitrification in both systems and NH3-N was
not detected in their secondary effluents. However, their carbon removal capabilities were

68
different. The TF/MLE had lower DOC (5.6 mg/L) in secondary effluent compared to the ASP
(7.7 mg/L), indicating that the TF/MLE was more efficient on organic matter removal.
The two processes also behaved differently on DBPFP removal efficiencies. The
TF/MLE had lower DBPFP in secondary effluent compared to the ASP, indicating that the
TF/MLE was also more efficient on DBPFP removal. The HANFP and HKFP showed the highest
removal efficiencies (greater than 95%) by both systems compared to the FPs of other DBP
species. This could be due to the properties of the precursors. The HK precursors were primarily
small molecules such as ketones which were easily biodegradable. Therefore, greater removal
efficiencies could be achieved compared to those hard-to-decompose compounds such as HAA
precursors and THM precursors.
The DBPFP speciation profile also changed after treatment by the WWTP. While the
relative abundance of DBP precursors was explored, the HAA precursors and THM precursors,
which were two major DBP precursors in wastewater, demonstrated different ratios before (1.9:1
for primary effluent) and after the secondary treatment (1.5:1 for ASP effluent and 1.4:1 for
TF/MLE effluent). This implies that the HAA precursors were more associated with those
biodegradable organic matters in the primary effluent and more HAA precursors were removed
by the secondary treatment compared to THM precursors. The TF/MLE, which achieved higher
DOC removal, resulted in a lower HAAFP/THMFP ratio (1.4:1) than the ASP (1.5:1),
Although the DBPFPs were removed by both systems, the DBP yields increased from
80.6 to 102 µg/mgC by ASP and to 127 µg/mgC by TF/MLE. The DBP yield increase in this
study implies that the organic matter removed in this secondary treatment was less associated
with DBP precursors. The TF/MLE, which removed more organic matter, resulted in higher DBP
yield than the ASP. The SUVA, a parameter normally used to predict DBP formation in drinking
water systems (Kitis et al., 2001; White et al., 2003), also correlated well with the change of DBP
yield in wastewater, and the SUVA increased from 0.89 to 1.55 L/mg-m by ASP and to 1.70

69
L/mg-m by TF/MLE. As the value were approaching 2 L/mg-m, below which would be classified
as less-humic organic matter, the effluent organic matter tend to have more-humic constituents.
Investigations on the removal of DBPFPs by the model WWTP indicate that the TF/MLE
was more efficient on DOC and DBPFP removal. WWTP could remove more percentages of
HKFP and HANFP than the FPs of other DBP species and could affect the DBPFP speciation
profile by lowering the HAAFP/THMFP ratio. The DBP yields and SUVA increased after
secondary treatment, indicating that the remaining organic matters tend to be more humic.
Implications of the process impact
The investigation on the DBPFP removal efficiencies by exploring the start point and end
points of secondary treatment illustrated the effectiveness of the two processes. As each process
consisted of one or more reactors, to better understand the fate of DBP precursors during the
biodegradation, it was important to evaluate how the DBPFP removal was affected by each
treatment reactor in the process trains. The samplings from the eleven locations, which covered
the outlet flows of all secondary treatment reactors made the evaluation possible. Because the
influents to some reactors were diluted in various ratios by recycled flows, the following
discussion on the process impact would be limited due to the influent discrepancy. For better
comparisons, the study divided the treatment reactors of the two process trains into two stages:
(1) Stage 1 included the reactors which directly accepted primary effluent. The first oxic tank in
the ASP, the trickling filter and the anoxic tank in the TF/MLE were included. The three reactors
used the primary effluent and recycled flows as influent and their influent organic matter
concentrations were relatively high; (2) Stage 2 included the second reactor (the anoxic tank) and
the third reactor (the second oxic tank) in the ASP, and the second reactor (the oxic tank) in the
TF/MLE. The three reactors accepted influents after Stage 1 biological treatment and therefore

70
had relatively low organic matter concentrations. The effects of dilution from recycled flows were
addressed by calculating DBP precursors in mass, so that the DBP precursor removal by each
reactor can be determined. By defining Stage 1 and Stage 2 reactors, one may obtain some
implications about the process impact on DBPFPs. But for accurate comparison, well designed
and experimentally controlled WWTP operation would be needed. For example, operation of
laboratory-scale systems would allow for more accurate control of operating parameters (e.g.
flow rate, sludge age, recycle ratio, etc).
Oxic and anoxic conditions
Analysis of the Stage 1 reactors implies that the oxic and anoxic conditions of the
reactors would impact the DBPFP removal. The first tank in ASP and the trickling filter in
TF/MLE, which were oxic or partially oxic reactors, removed more kilograms DBPFPs per MGD
treated flows from the primary effluent than the anoxic tank in TF/MLE (Figure 4-2a). The mass
removal of HAAFP, THMFP, and CHFP was greater than that of HANFP and HKFP due to the
large amount of the first three precursors in primary effluent. For the DBPFP removal
percentages, Figure 4-2b shows that the first tank in ASP had the highest removal efficiency
(60% for the overall DBPFP removal). The reason could be that the fully aerated condition in the
oxic reactor was favorable for the biodegradation of the hard-to-decompose DBP precursors. The
trickling filter in TF/MLE had 41% overall DBPFP removal. The trickling filter is an attached
growth system, which has the combination of oxic and anoxic conditions for nitrification in the
outer slime layer and denitrification in the inner slime layer. The presence of anoxic condition in
the trickling filter would limit the oxygen utilization rate (OUR) and resulted in less DBP
precursor removal. No significant overall DBPFP removal was observed in the anoxic tank in
TF/MLE due to lack of oxygen in the reactor. Some DBPFP species (THMFP, HANFP, and

71
HKFP) even showed slight increase after treatment by the anoxic reactor. This would indicate
that new DBP precursors were formed in anoxic reactions. Figure 4-2b also shows that although
HANFP and HKFP had low concentrations, their removal percentages were high (82% and 92%,
respectively). This is in accordance with the previous discussion on the HANFP and HKFP
concentrations in the secondary effluents. The results imply that the majority of HAN and HK
precursors, which were likely small molecules such as ketones, were largely removed by the first
oxic reactors in the process trains.
Soluble microbial products (SMPs)
SMPs were intermediates and end products of various metabolic pathways and materials
from cell lysis and death (Namkung and Rittmann, 1986). The SMPs could react with chlorine
and were found to be associated with wastewater-derived DBP precursors (Liu and Li, 2010). As
the Stage 1’s oxic reactors removed the majority of organic matter and DBPFPs, it is suspected
that the role of SMPs became significant. Figure 4-3 demonstrates that although there was
DBPFP removal by the Stage 2 reactors (Figure 4-3a), the DBP yields increased significantly
(Figure 4-3b). Because the organic matter removal by the Stage 2 reactors was relatively low, the
DBP yield increase implies that new DBP precursors were generated. The generation of new DBP
precursors could be attributed to the formation of SMPs.
For the removal of DBPFP species by the Stage 2 reactors, it was found that the second
reactor in ASP, which was an anoxic reactor, had less percentage of HAAFP, THMFP, CHFP,
HANFP, and HKFP removal than the second reactor in TF/MLE, which was an oxic reactor. The
results coincided with the previous discussion about the Stage 1 reactors that oxic conditions are
favorable for DBP precursor removal.

72
The HK and HAN yields decrease after treatment by the second reactor in TF/MLE
(Figure 4-3b) indicates that the newly formed HK and HAN precursors were degraded further. It
has been discussed (Laspidou and Rittmann, 2002) that there were two classes of SMPs:
utilization-associate products (UAPs) and biomass-associated products (BAPs). UAPs are the
intermediate and end products of biodegradation which can be degraded further. They may not
contribute to DBP precursors in the long term view. HK and HAN precursors are likely
associated with UAPs, since they are intermediate products of biodegradation and they are easily
biodegraded. BAPs are formed due to cell lysis and they are hard to be biodegraded. It is
speculated that BAPs are associated with the majority of the remaining DBP precursors in treated
wastewater including HAA and THM precursors and could be the reason for the DBP yield
increase.
Nitrification and SRTs
The impact of nitrification on DBP precursors in treated wastewater was evaluated by
Krasner et al. (2009b), and the survey results in this study also indicate a possible relationship
between nitrification and DBPFPs. Figure 4-4 shows that the WWTPs that achieved good
nitrification resulted in lower HAAFPs. However, it was not necessarily true for the THMFPs,
because the range of THMFPs in the effluents of the surveyed WWTPs was relatively wide
(Figure 4-4b). Since WWTPs normally achieved nitrification by using long SRTs, it is suspected
that SRTs would also have impact on the THMFPs. Further studies are needed to investigate the
effect of SRT on DBPFP removal.

73
Conclusions
The following conclusions were obtained from this study:
(1) WWTPs with better organic matter removal and complete nitrification tend to
result in low DBPFPs in the effluent.
(2) The TF/MLE was more efficient on DOC and DBPFP removal. The WWTP
removed more percentages of HKFP and HANFP than the FPs of other DBP species, and affected
the DBPFP speciation profile by lowering the HAAFP/THMFP ratio. The DBP yields and SUVA
increased after secondary treatment, indicating that the remaining organic matters tend to be
“more humic”.
(3) The whole plant analysis lead to three implications of the process impact: (a) The
oxic condition appears to be more favorable than anoxic condition on DBPFP removal. (b) The
role of SMPs becomes significant after the majority of organic matter and DBPFPs were
removed, and the DBP yield increase was likely due to the formation of SMPs. (c) Nitrification
and SRTs may affect DBPFPs in treated wastewater.
Acknowledgements
This study was supported by Office of Physical Plant and Institutes of Energy and the
Environment at the Pennsylvania State University. The authors acknowledge Mr. Joe Swanderski
and the staff at University Park Wastewater Treatment Plant for providing access to the plant
facilities. The authors thank Kevin Frank from AECOM Technology Corporation for assistance
on GPS-X.

74
Literature Cited
APHA (1998) Standard methods for the examination of water and wastewater, 20th ed.,
Washington, DC.
Bull, R.J. (1982) Health effects of drinking water disinfectants and disinfection by-products.
Environ. Sci. Technol., 16(10), 554-559.
Chen, B., Nam, S.-N., Westerhoff, P.K., Krasner, S.W. and Amy, G.L. (2009) Fate of effluent
organic matter and DBP precursors in an effluent-dominated river: A case study of
wastewater impact on downstream water quality. Water Res., 43(6), 1755-1765.
Chiang, P.C., Chang, E.E. and Liang, C.H. (2002) NOM characteristics and treatabilities of
ozonation processes. Chemosphere, 46, 929-936.
Chow, A.T., Guo, F., Gao, S., Breuer, R. and Dahlgren, R.A. (2005) Filter pore size selection for
characterizing dissolved organic carbon and trihalomethane precursors from soil. Water
Res., 39(7), 1255-1264.
Chow, A.T., Guo, F., Gao, S. and Breuer, R.S. (2006) Size and XAD fractionations of
trihalomethane precursors from soils. Chemosphere, 62(10), 1636-1646.
Chu, H.P., Wong, J.H.C. and Li, X.Y. (2002) Trihalomethane formation potentials of organic
pollutants in wastewater discharge. Water Sci. Tech., 46(11-12), 401-406.
Diaz, F.J., Chow, A.T., O’Geen, A.T., Dahlgren, R.A. and Wong, P-K. (2008) Restored wetlands
as a source of disinfection byproduct precursors. Environ. Sci. Technol., 42(16), 5992-
5997.
Diehl, A.C., Speitel, G.E. Jr., Symons, J.M., Krasner, S.W., Hwang, C.J. and Barrett, S.E. (2000)
DBP formation during chloramination. J. Am. Wat. Works Assn, 92(6) 76-90.
Galapate, R.P., Agustiani, E., Baes, A.U., Ito, K. and Okada, M. (1999) Effect of HRT and MLSS
on THM precursor removal in the activated sludge process. Wat. Res., 33(1) 131-136.

75
Hong, Y., Liu, S., Song, H. and Karanfil, T. (2007) HAA formation during chloramination –
significance of monochloramine’s direct reaction with DOM. J. Am. Wat. Works Assn,
99(8), 57-59.
Hu, J., Song, H., Addison, J.W. and Karanfil, T. (2010) Halonitromethane formation potentials in
drinking waters. Water Res., 44, 105-114.
Kitis, M., Karanfil, T., Kilduff, J.E. and Wigton, A. (2001) The reactivity of natural organic
matter to disinfection by-products formation and its relation to specific ultraviolet
absorbance. Water Sci. Technol., 43(2), 9-16.
Krasner, S.W., Westerhoff, P., Chen, B., Amy, G., Nam, S.-N., Chowdhury, Z.K., Sinha, S. and
Rittmann, B.E. (2008) Contribution of wastewater to DBP formation. AWWA Research
Foundation, Denver, CO, USA.
Krasner, S.W., Westerhoff, P., Chen, B., Rittmann, B.E. and Amy G. (2009a) Occurrence of
disinfection byproducts in United States wastewater treatment plant effluents. Environ.
Sci. Technol., 43(21), 8329-8325.
Krasner, S.W., Westerhoff, P., Chen, B., Rittmann, B.E., Nam, S.-N. and Amy, G. (2009b)
Impact of wastewater treatment processes on organic carbon, organic nitrogen, and DBP
precursors in effluent organic matter. Environ. Sci. Technol., 43(8), 2911-2918.
Laspidou, C.S. and Rittmann, B.E. (2002) A unified theory for extracellular polymeric
substances, soluble microbial products, and active and inert biomass. Water Res., 36(11),
2711-2720.
Lee, W., Westerhoff, P. and Croue, J-P (2007) Dissolved organic nitrogen as a precursor for
chloroform, dichloroacetonitrile, n-nitrosodimethylamine, and trichloronitromethane.
Environ. Sci. Technol., 41(15), 5485-5490.
Li, X.Y. and Chu, H.P. (2003) Membrane bioreactor for the drinking water treatment of polluted
surface water supplies. Water Res., 37(19), 4781-4791.
76
Liu, J.-L. and Li, X.-Y. (2010) Biodegradation and biotransformation of wastewater organics as
precursors of disinfection byproducts in water. Chemosphere, 81(9), 1075-1083.
Rostad, C.E., Martin, B.S., Barber, L.B. and Leenheer, J.A. (2000) Effects of a constructed
wetland on disinfection byproducts: Removal processes and production of precursors.
Environ. Sci. Technol., 34(13), 2703-2710.
Singer, P.C. (1999) Humic substances as precursors for potentially harmful disinfection by-
products. Wat. Sci. Tech., 40(9), 25-30.
Sirivedhin, T. and Gray, K.A. (2005a) Identifying anthropogenic markers in surface waters
influenced by treated effluents: a tool in potable water reuse. Water Res., 39(6), 1154-
1164.
Sirivedhin, T. and Gray, K.A. (2005b) Comparison of the disinfection by-product formation
potentials between a wastewater effluent and surface waters. Water Res., 39(6), 1025-
1036.
Song, H., Addison, J.W., Hu, J. and Karanfil, T. (2010) Halonitromethanes formation in
wastewater treatment plant effluent. Chemosphere, 79(2), 174-179.
USEPA (1993) Manual for nitrogen control. EPA/625/R-93/010. Washington, DC.
USEPA (1998) National primary drinking water regulations: disinfectants and disinfection by-
products, final rule. Washington, DC.
White, D.M., Garland, D.S., Narr, J. and Woolard, C.R. (2003) Natural organic matter and DBP
formation potential in Alaskan water supplies. Water Res., 37(4), 939-947.
Xie, Y.F. (2004), Disinfection byproducts in drinking water: Formation, analysis, and control,
Boca Raton, FL: Lewis Publishers.
Yang, X., Shang, C. and Huang, J-C. (2005) DBP formation in breakpoint chlorination of
wastewater. Water Res., 39, 4755-4767.

77
List of Figure and Table Captions
Figure 4-1. Flows and sampling points of the model WWTP
Figure 4-2. (a) Mass and (b) percentage removal of DBPFPs by the Stage 1 reactors
Figure 4-3. Change of (a) DBPFPs and (b) DBP yields by the Stage 2 reactors
Figure 4-4. Correlations between nitrification and DBPFPs including (a) HAAFP and (b) THMFP
Table 4-1. Description of the nine surveyed WWTPs
Table 4-2. Effluents of the nine WWTPs
Table 4-3. Primary effluent and secondary effluents of the model WWTP

78
Figure 4-1. Flows and sampling points of the model WWTP

79
Figure 4-2. (a) Mass and (b) percentage removal of DBPFPs by the Stage 1 reactors
-2
0
2
4
6
DBPFPRemoval[kg/mgd]
1st reactor (oxic) in ASP
1st reactor (trickling filter) in TF/MLE
1st reactor (anoxic) in TF/MLE
HAAFP THMFP CHFP HANFP HKFP
(a)
-40
-20
0
20
40
60
80
100
DBPFPRemovalPercentage[%]
HAAFP THMFP CHFP HANFP HKFP
(b)

80
Figure 4-3. Change of (a) DBPFPs and (b) DBP yields by the Stage 2 reactors
-40
-20
0
20
40
60
80
100
DBPFPRemovalPercentage[%]
2nd reactor (anoxic) in ASP
2nd reactor (oxic) in TF/MLE
3rd reactor (oxic) in ASP
HAAFP THMFP CHFP HANFP HKFP
(a)
-100
-50
0
50
100
150
DBP YieldIncreasePercentage[%]
HAAFP THMFP CHFP HANFP HKFP
(b)
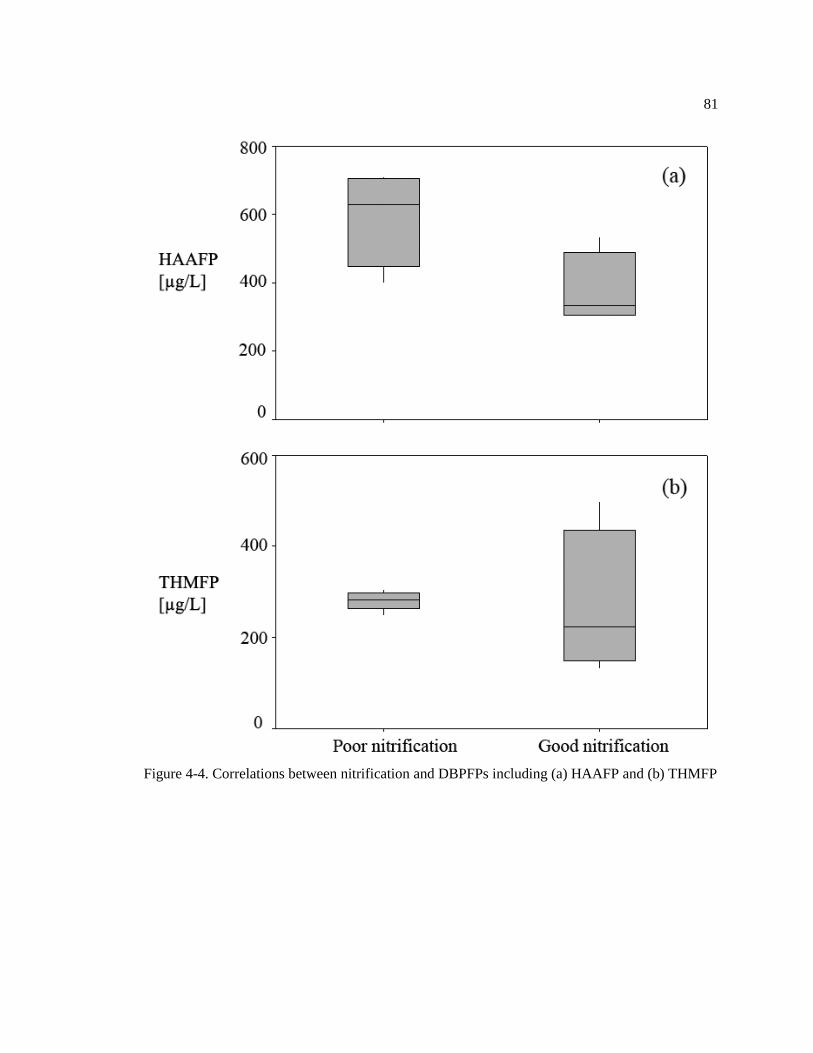
81
Figure 4-4. Correlations between nitrification and DBPFPs including (a) HAAFP and (b) THMFP

82
Table 4-1. Description of the nine surveyed WWTPs
WWTP Capacity(MGD) Biological treatment processes
WWTP #1 2.0 Conventional activated sludge
WWTP #2 37.7 Pure oxygen activated sludge
WWTP #3 2.08 Trickling filter
WWTP #4 5.02 Anoxic-Oxic activated sludge
WWTP #5 2.2 Conventional activated sludge
WWTP #6 0.75 Contact stabilization and extended aeration
WWTP #7 2.0 Oxic-Anoxic-Oxic activated sludge
WWTP #8 2.0 Trickling filter and activated sludge in tandem
WWTP #9 6.0 Anaerobic-Anoxic-Oxic activated sludge

83
Table 4-2. Effluents of the nine WWTPs
WWTP Effluent2
DOC [mg/L]
NH3-N [mg/L]
HAAFP [µg/L]
THMFP [µg/L]
HAA Yield [µg/mgC]
THM Yield [µg/mgC]
Plant #1 8.9 4.1 400 305 44.9 34.3
Plant #2 9.1 3.6 710 281 78.0 30.9
Plant #3 8.9 3.2 701 293 78.8 32.9
Plant #4 9.5 4.3 629 283 66.2 29.8
Plant #5 8.9 4.3 496 248 55.7 27.9
Plant #6 5.1 ND1 321 132 62.9 25.9
Plant #7 7.2 ND1 347 249 48.2 34.6
Plant #8 6.3 ND1 302 197 47.9 31.3
Plant #9 14.3 ND1 536 498 37.5 34.9
Data presented are average values of duplicate sets collected in December 2008. ND: not detected.

84
Table 4-3. Primary effluent and secondary effluents of the model WWTP
Parameter Primary effluent2
ASP effluent2
TF/MLE effluent2
ASP removal efficiency (%)
TF/MLE removal efficiency (%)
MCAAFP [µg/L] <MRL <MRL <MRL - -
MBAAFP [µg/L] <MRL <MRL <MRL - -
DCAAFP [µg/L] 1280 199 179 84 86
TCAAFP [µg/L] 700 174 147 75 79
BCAAFP [µg/L] 25 19 21 24 16
DBAAFP [µg/L] <MRL <MRL <MRL - -
CFFP [µg/L] 1078 262 249 76 77
BDCMFP [µg/L] 4 <MRL <MRL 100 100
DBCMFP [µg/L] <MRL <MRL <MRL - -
BFFP [µg/L] <MRL <MRL <MRL - -
CHFP [µg/L] 987 117 106 88 89
TCANFP [µg/L] <MRL <MRL <MRL - -
DCANFP [µg/L] 56 3 2 95 96
BCANFP [µg/L] <MRL <MRL <MRL - -
DBANFP [µg/L] <MRL <MRL <MRL - -
DCPFP [µg/L] <MRL <MRL <MRL - -
TCPFP [µg/L] 99 4 4 96 96
CPFP [µg/L] 18 5 3 72 83
HAAFP [µg/L] 2000 392 347 80 83
THMFP [µg/L] 1080 262 249 76 77
O-DBPFP [µg/L] 1000 122 109 88 89
HANFP [µg/L] 56 3 2 95 96
HKFP [µg/L] 99 4 4 96 96
DBPFP [µg/L] 4250 783 711 82 83
DOC [mg/L] 52.7 7.7 5.6 85 89
DBP Yield [µg/mgC] NH3-N [mg/L]
80.6 23.7
101.7 ND
127.0 ND
-26 100
-58 100
UV254 [cm-1] 0.469 0.119 0.095 75 80
SUVA [L/mg-m] HAAFP/THMFP
0.89 1.9
1.55 1.5
1.70 1.4
-74 19
-91 25
Data presented are average values of duplicate sets collected in April 2009.
MRL: minimal reporting level. N.D.: not detected.
85
Chapter 5
Impact of Biological Treatment Processes on Disinfection Byproduct
Formation Potential in Wastewater
Abstract
Three continuously-stirred tank reactors and two sequencing batch reactors were designed to
simulate different wastewater treatment processes in the laboratory. For the continuously-stirred
tank reactors with different solid retention times and resultant levels of nitrification, haloacetic
acid formation potentials decreased as retention time increased and nitrification level improved.
Trihalomethane formation potentials, however, showed an opposite trend due to the influence of
soluble microbial products. For both sequencing batch reactors with complete nitrification, the
oxic-anoxic reactor with better denitrification resulted in lower disinfection byproduct formation
potentials compared to the anoxic-oxic reactor. By comparing oxic and anoxic phases in a cycle
of their operations, oxic phases were found to have faster removal rates and greater removal
efficiencies than anoxic phases. Major reductions of disinfection byproduct formation potentials
were accompanied with bulk removal of wastewater organics, and contribution of soluble
microbial products became significant thereafter.
Keywords: disinfection byproduct formation potential; biological treatment processes;
sequencing batch reactor; continuously stirred tank reactor; wastewater
Material presented in this chapter was presented at AWWA 130th Annual Conference in
Washington, DC.

86
Introduction
Wastewater disinfection is an important public health measure that helps protect human being
from exposure to harmful pathogens after treated wastewater is returned to waterways. Because
wastewater is a source of various disinfection byproduct (DBP) precursors, DBP formation is a
major concern. Nowadays more and more wastewater is accepted by potable water supplies
(Chen et al., 2009). Control of DBPs and DBP precursors in wastewater is becoming an important
research area because of adverse health effects of DBPs.
In drinking water systems, the removal of DBP precursors by utilities is required under
the EPA Stage 1 Disinfectants and Disinfection Byproducts (D/DBP) rule (USEPA, 1998), which
specifies maximum concentrations for disinfectants and DBPs. Because natural organic matter
(NOM) is regarded as a source of DBP precursors in drinking water (White et al., 2003), removal
of NOM has been adopted as one of the main mechanisms to remove DBP precursors in drinking
water. This has led to the optimization of existing treatment processes and the development of
new process which focus on NOM removal. Among them, enhanced coagulation, lime softening,
carbon adsorption, ion exchange, biofiltration, and membrane technologies have shown
effectiveness (Chang et al., 2001; Uyak et al., 2007; Chellam, 2000; Boyer and Singer, 2005;
Miltner et al., 1992).
Currently, there are no regulations on DBP precursor removal efficiencies by wastewater
treatment plants (WWTPs). The National Pollutant Discharge Elimination System (NPDES)
discharge limits only regulate some trihalomethanes (THMs) (e.g. chloroform) in WWTP
effluents. Sirivedhin and Gray (2005a,b) found the organics in wastewater effluent and NOM
were structurally different, and the structurally different organic matrices also behaved differently
in the chlorination process. Because many wastewater treatment facilities employ variety of
biological, physical, and chemical processes, a wide range of treated wastewater qualities are

87
expected in terms of organic carbon, organic nitrogen, and DBP precursor levels (Imai et al.,
2002; Krasner et al., 2008), and chlorination of wastewater leads to the formation of various
DBPs at high levels due to the presence of various chlorine-reacting species at high
concentrations (Mitch et al., 2003; Lee et al., 2007; Guo et al., 2009; Song, et al., 2010). Since
biological treatment processes have a significant impact on the removal wastewater organics, it is
hypothesized that DBP precursors may also be affected (Rostad et al., 2000; Chu et al., 2002;
Diaz et al., 2008). Liu and Li (2010) found that biodegradation may effectively remove some
DBP precursors, but the biotransformation process also produces new DBP precursors in the form
of soluble microbial products (SMPs). Galapate et al. (1999) found that hydraulic retention time
(HRT) and mixed liquor suspended solids (MLSS) were two parameters that can affect THM
precursors and chemical properties of organic matter in the effluents of activated sludge
processes. The optimum removal of THM precursors was achieved at HRT of 24 h and at MLSS
of 2500 mg/L, and the activated sludge process preferentially removed the hydrophilic organic
substances. Krasner et al. (2009a,b), on the other hand, found that the DBP formation in
wastewater is strongly affected by whether or not the WWTP achieved good nitrification. Upon
chlorination, WWTPs with poor nitrification normally did not achieve breakpoint chlorination
due to high ammonia-nitrogen levels; and therefore low-to-none free-chlorine residuals and low
DBPs were produced, if a regular chlorine dose was applied.
Since biological treatment processes can result in treated water with various DBP
precursors, there is a need for comprehensive studies. Very often the information available on
full-scale plant (flow rate, sludge age, recycle ratio, etc) may be inaccurate or incomplete, and it
is necessary to operate a lab-scale system which allows for more accurate control of these
operating parameters. Many activated sludge process designs used for biological nitrogen
removal have a mixed, non-aerated anoxic reactor in front of the aerated reactor (anoxic-oxic,
A/O) with mixed liquor recirculation to achieve the denitrification. Designs such as oxic-anoxic
88
(O/A), anaerobic-anoxic-oxic (A2O), and many others are also used for enhanced nutrient
removal from wastewater (Rittmann and McCarty, 2001). Kim et al. (2002) found that
continuously fed lab-scale continuously stirred tank reactors (CSTRs) were more stable during
variable organic loading rates than reactors that were fed-batch reactors, such as fill-and-draw
sequencing batch reactors (SBRs). However, SBR does possess advantages, including: (1) less
equipment is required; (2) no separate settling tank is needed; (3) they are simple to operate; and
(4) they allow more accurate control of sludge age in a lab-scale setting.
The objective of this study was to explore the impact of biological treatment processes on
DBP precursors. Lab-scale CSTRs and SBRs were used to simulate different aerobic and anoxic
processes to achieve various levels of nutrient removal, and the fate of DBP precursors was
evaluated. The target species of DBP precursors were chloroform (CF), bromodichloromethane
(BDCM), dibromochloromethane (DBCM), bromoform (BF), chloral hydrate (CH),
monochloroacetic acid (MCAA), monobromoacetic acid (MBAA), dichloroacetic acid (DCAA),
trichloroacetic acid (TCAA), bromochloroacetic acid (BCAA), dibromoacetic acid (DBAA),
trichloroacetonitrile (TCAN), dichloroacetonitrile (DCAN), bromochloroacetonitrile (BCAN),
dibromoacetonitrile (DBAN), chloropicrin (CP), 1,1-dichloro-2-propanone (DCP), and 1,1,1-
trichloro-2-propanone (TCP). Since some of these compounds such as THM and HAA species are
regulated in drinking water (USEPA, 1998), the research into THMs and HAAs is of particular
interest.

89
Materials and Methods
Wastewater
Synthetic wastewater was used in this study. The recipe was adapted based on Irvin and
Li (2007): 300 mg/L milk powder, 60 mg/L ammonia chloride, 11.3 mg/L urea, 11.3 mg/L
potassium monobasic phosphate, and 5.65 mg/L sodium acetate. The recipe resulted in
approximately 400 mg/L COD, 20 mg/L ammonia nitrogen, 5 mg/L organic nitrogen, and 3 mg/L
phosphorus.
Reactors for nitrification
Three 2-L reactors were operated as CSTRs. The reactors’ set-up is shown in Figure 5-1a.
Baffle walls were used to create sludge settling zones in the CSTRs. The baffles were taken out
from the reactors every day for complete sludge mixing. While the baffles were removed, 500 ml,
200 ml and 100 ml mixed liquors were withdrawn and decanted from each reactor. After that, the
baffles were placed back into the reactors. This maintained three distinct solid retention times
(SRTs) (4, 10, and 20 days) to achieve different levels of nitrification. The flow rates were
controlled at 3.1 ml/min by peristaltic pumping from an influent tank for all three reactors giving
an HRT of 10.7 hours. Effluents were withdrawn from the top of the sludge settling zones
through vacuum tubes maintained by level regulators.
Reactors for O/A and A/O processes
Two 2-L reactors were operated as SBRs. The reactors’ set-up is shown in Figure 5-1b.
Two combinations of oxic and anoxic conditions were used to achieve nitrification and

90
denitrification at SRT of 20 days. This resulted in two biological treatment processes: O/A and
A/O. Table 5-1 shows the parameters of the two SBRs. A volume of 1.5 L was refilled and
decanted in each cycle, and the HRT of the two reactors was 10.7 hours. The SBRs were operated
3 cycles per day and were controlled by digital timers. Programming of the timers is presented in
Table 5-2. Timer 1 controlled the influent feed pump; Timer 2 controlled the air compressor for
aerating the O/A SBR; Timer 3 controlled the stirring plates for mixing in the O/A and A/O
SBRs; Timer 4 controlled the methanol feed pump for the O/A SBR; Timer 5 controlled the
effluent withdrawal pump; Timer 6 controlled the air compressor for aerating the A/O SBR. Each
cycle of the O/A SBR consisted of aerated filling (0.5 h), aeration (3.5 h), anoxic mixing (2.5 h),
settling (0.75 h), decanting (0.5 h) and aerated idling (0.25 h). The aerated filling and idling were
used to avoid pre-denitrification and thus achieve the desired O/A operation. Methanol was used
as the external carbon source for the O/A SBR. The ratio was 3.5 gram methanol per gram nitrate
nitrogen being reduced, considering the net effect of mixed liquor, endogenous decay, and
residual dissolved oxygen (DO). Each cycle of the A/O SBR consisted of filling (0.5 h), anoxic
mixing (2.5 h), aeration (3.5 h), settling (0.75 h) and idling (0.25 h).
Measurements of operational conditions
DO, temperature, and MLSS were measured regularly. The on-off switches of Timers 2
and 6 for aeration control created two combinations of oxic and anoxic conditions for biological
treatment processes. Figure 5-2 presents the DO profile in a cycle of the two SBRs. Because the
reactors were considered anoxic under 2 mg/L DO, one can obtain similar lengths of anoxic
phases (3.5 hours) in both SBRs from Figure 5-2. It was found that in addition to the same
wastewater influents, working volumes and recycle ratios, the two SBRs had the same lengths of

91
oxic and anoxic phases. All of these features of the two processes made it possible to conduct a
comparative analysis.
Influent and effluents of the reactors were filtered through a 0.45 µm membrane prior to
chemical analyses. Then dissolved organic carbon (DOC) was measured with a Total Organic
Carbon Analyzer (O.I. Analytical Model 1010, Maryland, USA). Ammonia nitrogen was
measured using the ammonia-selective electrode method 4500-NH3 (APHA, 1998). UV
absorbance at 254 nm was measured using with a UV/Vis spectrophotometer (Agilent 8453
spectrophotometer) with a 10 mm quartz cuvette.
Formation potential test
The research used a formation potential test (Li and Chu, 2003; Xie, 2004) to quantify
DBP precursors in wastewater. Samples were buffered at pH 7 and a chlorine dose of 20 mg/L
was applied. A 3-day reaction time at 25°C in the dark was adopted. After the incubation was
complete, samples were transferred to 40 ml vials containing granular ammonia chloride to
convert free chlorine to combined chlorine. These vials were sealed with PTFE-lined screw caps
without head space and stored at 4°C before DBP extractions.
Because high ammonia levels in wastewater could lead to low-to-none free-chlorine
residuals given insufficient sample dilutions and thus had an indirect impact on quantification of
DBPFPs (Tang et al., 2011), it is very important that all wastewater samples have been properly
diluted in order to ensure that free-chlorine residuals remain after sample incubation. In this
study, all wastewater samples contained no more than 25 mg/L ammonia nitrogen including raw
wastewater prior to biological treatment, poorly nitrified wastewater, and completely nitrified
wastewater. Therefore, a 1:25 dilution ratio was applied to all samples and it was found to be able
to produce sufficient free-chlorine residuals in all samples that were to be compared. Table 5-3

92
presents the free-chlorine residuals and demands of the chlorinated samples in an 8-h cycle of the
two SBRs. The free-chlorine residuals in the wastewater samples were as low as 9.1 mg/L for raw
wastewater, which was still sufficient after 3 days of incubation given a dilution ratio of 1:25.
DBP extraction and analyses
Sample extractions were conducted using modified EPA methods 552.3 and 551.1. For
HAAs, each 30 ml sample was acidified with 1.5 ml concentrated sulfuric acid and extracted with
3 ml of MTBE spiked with 300 µg/L 1,2-dibromopropane. Approximately 12 g of sodium sulfate
was added to enhance the extraction efficiency. Then, 1 ml of the MTBE extract was mixed with
1 ml of 10% sulfuric acid/methanol mix, and incubated for two hours at 50 °C for HAA
derivatization. After derivatization, the solution was back-extracted with 4 ml of 10% sodium
sulfate solution to remove excess methanol. For other DBPs, each 30 ml sample was extracted
using the protocols above excluding pre-extraction acidification and post-extraction methylation.
The concentrations of DBPs were determined using gas chromatographs (Hewlett
Packard 6890) with electron capture detectors. A DB-1701 capillary column (30 m × 0.25 mm
i.d., 0.25 µm film thickness) was used for HAA analysis. A DB-1 capillary column (30 m × 0.32
mm i.d., 1.0 µm film thickness) was used for the analysis of other DBPs. The temperature
ramping programs were as follows: (1) HAAs: Initial at 35 °C for 10 minutes and ramp to 75 °C
at 5 °C/min and hold for 15 minutes, ramp to 100 °C at 5 °C/min and hold 5 minutes, a final ramp
to 135 °C at 5 °C/min; (2) Other DBPs: Initial at 35 °C for 22 minutes, ramp to 145 °C at 10
°C/min and hold 2 minutes.

93
Results and Discussion
Effect of SRT
The CSTRs were used to simulate biological treatment processes with different levels of
nitrification. Because the CSTRs for nitrification were continuously aerated, sufficient DO was
maintained and this avoided unwanted denitrification. In addition, because the nitrification levels
were varied by maintaining various SRTs, the study, on the other hand, explores the impact of
SRT on DBP precursors. Samples for water quality and DBPFP analyses were consecutively
collected from each CSTR after the systems reached steady state. Poor (12.0 mg/L NH3-N),
medium (6.8 mg/L NH3-N) and good levels (0.3 mg/L NH3-N) of nitrification were produced by
varying SRTs (Figure 5-3a). The MLSS concentrations were 600, 800, and 1400 mg/L,
respectively for the CSTRs with 4-day, 10-day, and 20-day SRTs, and after treatment, the effluent
DOC values were 6.3, 5.2, and 4.2 mg/L, respectively. Reactors with longer SRTs or better
nitrification tend to achieve lower DOC and higher MLSS (Figure 5-3b and c).
The DBPFPs that were explored in this study included the FPs of HAAs, THMs, CH,
HANs and HKs. Figure 5-3d shows the overall DBPFPs in the effluents of the three reactors.
There was no significant difference among the overall DBPFPs in the effluents. However, by
looking into each group of DBP species (Figure 5-4a), it was found that HAAFP decreased from
938 to 539 µg/L as SRT increased from 4 to 20 days and nitrification improved from the poor to
the good level. This implies that elongated SRT was accompanied with better removals of NH3-N
and organics, and the removed organics are likely more associated with HAA precursors. The
results indicate that HAA precursors could be slowly biodegradable compounds, because they can
degrade, but it may take longer time. THMFP, on the other hand, demonstrated an opposite
94
trend, because it increased from 319 to 524 µg/L. It appears that THMFP may be affected by
other factors. One possible reason for the increased THMFP was that the longer SRT may result
in the release of more SMPs and the SMPs were likely more associated with THM precursors. In
addition, it appears THM precursors are difficult to be biodegraded compared to HAA precursors,
even more time is given. It has been recognized that there are different precursor types that give
rise to DCAA that has two halogens and TCAA that has three halogens (Reckhow et al., 2008),
there is a need to study the two species independently. Figure 5-4b compares DCAAFP and
TCAAFP removals affected by different SRTs. Their removals were generally in accordance with
the overall HAAFP removal. The results imply that long SRT is one of optimum conditions for
removing precursors of HAA species.
Effect of Denitrification
In this section, the O/A and A/O processes were compared according to their abilities on
removals of nitrogen and DBPFPs. The two SBRs for O/A and A/O processes were operated at
20-day SRT with complete nitrification. Under the experimental settings described in Table 5-1,
the O/A process was supposed to have higher nitrogen removal capability, because all NO3-N
formed in the oxic phase had a potential to be denitrified by the followed anoxic reactions. For
the A/O process, only the portion of nitrified wastewater that was recycled to the front anoxic
phase had potential to be denitrified. The denitrification efficiency of the A/O process was closely
related to the recycle ratio. Although O/A process was theoretically better than A/O process on
denitrification, two problems need to be addressed in field applications: (1) low carbon content
after oxic phase; and (2) poor sludge settling capability. To solve the potential problems, the O/A
SBR in this research used methanol as an external carbon source to promote the denitrification
and a 3-minute bubbling period was provided prior to the settling phase to avoid floating sludge.

95
Effluent NO3-N levels of the O/A SBR were stabilized at 3.9 mg/L with a standard deviation of
0.9 mg/L, while those of the A/O SBR were stabilized at 7.5 mg/L with a standard deviation of
1.3 mg/L (Figure 5-5a). Because lower effluent DOC levels were observed for the O/A SBR
(Figure 5-5b), the dosed methanol for promoting denitrification had shown complete utilization.
Furthermore, comparisons of the two SBR’s effluents imply that besides bulk removal of organics
in aerobic phase, there was additional removal of organic matter for the O/A SBR with better
denitrification. This may be correlated with the findings that the DBPFPs in effluents of the O/A
SBR were also lower (Figure 5-5d). For individual groups of DBP species, Figure 5-6 shows that
the O/A process, which had better denitrification, resulted in effluents with lower HAAFP
(including DCAAFP and TCAAFP), THMFP and CHFP. The results imply that denitrification
affect removals of these DBP precursors.
Fate of DBP precursors
To explore how DBP precursors change during wastewater treatment processes and the
fate the DBP precursors, the research focused on one 8-h cycle of the two SBRs. In that cycle,
liquids from both reactors were withdrawn at a 30 min interval. Samples were immediately
filtered and preserved for DBPFP characterization.
DOC and NH3-N
Both reactors had been continuously operated for more than 180 days and had
demonstrated steady removal of carbon and nitrogen. The DOC and NH3-N profiles in an 8-h
cycle are shown in Figure 5-7. For the O/A process, sharp decline of DOC occurred within the
first half hour and sharp decline of NH3-N occurred within the first two hours when the SBR was

96
in oxic phase. In 2.5 hours, complete nitrification was achieved. For the A/O process, the DOC
removal was slow in anoxic phase. In the meantime, there was slight decline of NH3-N due to cell
synthesis. The aeration started at the 3rd hour and nitrification was completed in 1.5 hours.
DBPFPs and speciation
Figure 5-8 presents the changes of major DBPFPs including FPs of DCAA, CF, TCAA
and CH in the 8-h cycle of O/A and A/O SBRs. The wastewater influent had 544 µg/L DCAAFP,
496 µg/L CFFP, 404 µg/L TCAAFP, and 215 µg/L CHFP. The FPs showed substantial changes
under the influence of biological processes. For the O/A SBR, 66% DCAAFP, 40% CFFP, 68%
TCAAFP and 58% CHFP were finally removed from the influent, and the remaining FPs in
treated effluent were 184, 300, 130, and 91 µg/L, respectively. Figure 5-8a shows that substantial
decline of FPs were observed in the first half hour of aeration while the reactor demonstrated
sharp decline of DOC. This indicates that the portion of removed organics was related with these
DBP precursors. The substantial DOC and DBP precursor removals at the beginning of each
cycle may be due to direct biodegradation or adsorption by MLSS. As time went on, DCAAFP
and TCAAFP showed decreases at slower rates. CFFP and CHFP, however, did not show much
removal within the experimental time frame. This could be due to the characteristics of their
precursors. It is believed that THM (e.g. CF) precursors are mostly humic-like recalcitrant
organic matter (Singer, 1999). This explains why they are difficult to degrade. In anoxic phase of
the O/A SBR, removals of the remaining FPs were limited. This implies that these precursors
were preferably removed in oxic conditions other than anoxic conditions. The fluctuations of FPs
in anoxic phase could be due to the formation and degradation of SMPs. Researchers concluded
that primary and secondary metabolites are the major contributor of the effluent organics
(Laspidou and Rittmann, 2002). It can be assumed that the readily biodegradable compounds in

97
wastewater influent have been completely consumed after wastewater treatment, and the
remaining organics in the effluents are attributed to the three principle sources: (1) the influent
organics (e.g. unbiodegradable compounds); (2) intermediates and end products of various
metabolic pathways; and (3) material from cell lysis and death. The latter two sources are the two
components of SMPs (Namkung and Rittmann, 1986). And SMPs start to play a significant role
after the majority of organics is removed. The intermediates and end products of biodegradation
and cell lysis products could be a source of new DBP precursors (Liu and Li, 2010).
For the A/O SBR, 26% DCAAFP, 15% CFFP, 38% TCAAFP and 54% CHFP were
finally removed from the wastewater influent, and the remaining FPs in treated effluent were 405,
421, 250, and 99 µg/L, respectively. Although FP removals were observed in both anoxic and
oxic phases, without an oxic phase in the beginning, their removal rates were much slower. This
coincides with previous discussions that oxic conditions were favorable for DBP precursor
removal. Fluctuations of CFFP in the cycle could be due to the formation and degradation of
SMPs.
Figure 5-9 presents changes of HKFP and HANFP in the SBR cycles. Although their FP
levels were low, their removal efficiencies were 93% and 97% for the O/A SBR and 91% and
90% for the A/O SBR, respectively, and they were largely removed at the beginning of the
processes regardless of oxic or anoxic conditions. This indicates that HK and HAN precursors are
readily biodegradable compounds, which consist of relatively small molecules (such as volatile
fatty acids) and low molecular weight carbohydrates, alcohols, peptones and amino acids (Henze,
1992).

98
DBP yields
DBP yields were calculated per carbon basis. The parameter normalizes DBPFPs based
on organic matter concentrations. A yield increase indicates that the removed organics are less
associated with DBP precursors, and vice versa. The yield profiles of the two SBRs are shown in
Figure 5-10. The yields of DCAA, CF, TCAA, and CH demonstrated steady increases under the
influence of biological treatment processes. An exception to this was the sharp decline between
the 4th and 5th hour in the O/A SBR. This was due to the addition of external carbon source,
which significantly enlarged the denominator during the yield calculations. Greater yield increase
rates were observed in oxic phase than anoxic phase, as revealed in both O/A and A/O SBRs. The
theoretical bases of the phenomena could be: (1) the biological processes preferentially removed
readily biodegradable organics which are usually less associated with DBP precursors; and (2)
oxic reactions removed readily biodegradable organics more quickly than anoxic reactions.
Changes of HK and HAN yields, which are presented in Figure 5-11, can be explained by
the first basis. Because HK and HAN precursors are readily biodegradable, the yields showed
decrease at the beginning of cycles in both O/A and A/O SBRs. After the majority of readily
biodegradable compounds were removed, the yield changes were due to the formation and
degradation of SMPs.
The second basis can be explained by the concept of aerobic and anoxic (anaerobic)
respiration. As deduced from previous discussions, some DBP precursors are slowly
biodegradable compounds. The slowly biodegradable compounds are assumed to consist of
particulate/colloidal material and complex organic molecules, which require extracellular
breakdown prior to uptake and utilization (Dold et al., 1980). Compared to the anoxic respiration
which uses nitrate as electron acceptor, the aerobic respiration uses oxygen as electron acceptor

99
and more energy is released. This facilitates quick breakdown of the slowly biodegradable
compounds.
Implications
Substantial removals of carbon and nitrogen were achieved in the lab-scale reactors.
Evaluation and characterization of DBP precursors during the biological processes help
professionals to better understand the relationship between wastewater organics and DBP
precursors.
In water, correlations between NOM and DBP precursors are revealed by specific
ultraviolet absorbance (SUVA), which defines humic (>4 L/mg-m) and non-humic (<2 L/mg-m)
water. In wastewater, SUVA is normally less than 2 L/mg-m and it would be classified as non-
humic. However, high levels of DBPs are still formed upon chlorination. This implies that in
addition to NOM, wastewater organics are also important sources of DBP precursors. Because of
the deficiency of existing characterization method, new methods are needed to characterize DBP
precursors in wastewater. For instance, Galapate et al. (1999) characterized DBP precursors based
on the hydrophobicity and hydrophilicity of wastewater organics.
Results of the study reveal that wastewater organics contribute to a level of 2000 µg/L
DBP precursors according to the FP test, including precursors of HAAs, THMs, HKs, HANs and
CH. Biological treatment processes can only remove about half of HAA, THM and CH
precursors without significantly changing their relative abundance (Figure 5-12), although DOC
has been substantially removed. HK and HAN precursors can be removed with the bulk removal
of wastewater organics, because they are readily biodegradable compounds. Other precursors are
primarily slowly biodegradable compounds. There are either influent organics that are initially
present or the SMPs that are primarily cell debris.

100
The experiments used a special design for comparing different processes. Results reveal
that oxic condition is more favorable for DBP precursor removal than anoxic condition.
Advanced treatment processes including nitrification and denitrification appear to affect levels of
DBP precursors, although there could be other reasons, such as SRT and levels of DOC.
SMPs play an important role on DBP precursors during the wastewater treatment
processes. Their impact becomes significant when the majority of wastewater organic matter is
degraded and cells start to starve. The intermediate and end products of biodegradation belong to
one class of SMPs --- Utilization-associated products (UAPs). UAPs can be degraded further and
will not contribute to DBP precursors in the end. What matters is the other class of SMPs ---
Biomass-associated products (BAPs). BAPs are formed due to cell lysis and they are slowly-
biodegradable compounds. It is speculated that BAPs contributes to the majority of the remaining
DBP precursors in treated wastewater. Further investigations on BAPs and their removal
strategies may result in enhanced DBP precursor removal.
101
Conclusions
The three CSTRs with nitrification and the two SBRs with denitrification behaved differently on
nutrient and DBPFP removal. The CSTRs with longer SRT resulted in better HAAFP removal
including DCAAFP and TCAAFP, but THMFP might be increased due to the release of more
SMPs. The O/A SBR with better denitrification resulted in lower DOC and DBPFPs.
DBP precursors of wastewater influent decreased during biological treatment processes.
HK and HAN precursors were readily biodegradable and they had greater removal efficiencies
than other remaining precursors which were slowly-biodegradable. Oxic reactions had faster
removal rates and greater removal efficiencies than anoxic reactions.
Although DBPFPs were removed by wastewater treatment processes, DBP yields
increased. After the bulk removal of organics, the yield changes were affected by the formation
and degradation of SMPs.
Because advanced treatment processes including nitrification and denitrification were
accompanied with greater organic matter and DBP precursor removal capabilities, wastewater
treatment facilities with enhanced nutrient removal are able to reduce the wastewater-derived
DBPs.
Acknowledgements
This research was supported by Office of Physical Plant and Institutes of Energy and the
Environment at the Pennsylvania State University.

102
Literature Cited
APHA (1998). Standard methods for the examination of water and wastewater. 20th edn,
Washington DC, USA.
Boyer, T.H., and Singer, P.C. (2005) Bench-scale testing of a magnetic ion exchange resin for
removal of disinfection by-product precursors. Water Res., 39(7), 1265-1276.
Chang, E.E., Chiang, P.-C., Ko, Y.-W., and Lan, W.-H. (2001) Characteristics of organic
precursors and their relationship with disinfection by-products. Chemosphere, 44(5),
1231-1236.
Chellam, S. (2000) Effects of nanofiltration on trihalomethane and haloacetic acid precursor
removal and speciation in waters containing low concentrations of bromide ion. Environ.
Sci. Technol., 34(9), 1813-1820.
Chen, B., Nam, S.-N., Westerhoff, P.K., Krasner, S.W. and Amy, G.L. (2009) Fate of effluent
organic matter and DBP precursors in an effluent-dominated river: A case study of
wastewater impact on downstream water quality, Water Res., 43(6), 1755-1765.
Chu, H.P., Wong, J.H.C., and Li, X.Y. (2002). Trihalomethane formation potentials of organic
pollutants in wastewater discharge. Water Sci. Tech., 46(11-12), 401-406.
Diaz, F.J., Chow, A.T., O’Geen, A.T., Dahlgren, R.A. and Wong, P-K. (2008). Restored wetlands
as a source of disinfection byproduct precursors. Environ. Sci. Technol., 42(16), 5992-
5997.
Dold, P.L., Ekama, G.A., and Marais, G.V.R. (1980) A general model for the activated sludge
process. Prog. Water Technol., 12, 47-77.
Galapate, R.P., Agustiani, E., Baes, A.U., Ito, K., and Okada, M. (1999) Effect of HRT and
MLSS on THM precursor removal in the activated sludge process, Water Research,
33(1), 131-136.
103
Guo, Y.C., and Krasner, S.W. (2009) Occurrence of primidone, carbamazepine, caffeine, and
precursors for N-Nitrosodimethylamine in drinking water sources impacted by
wastewater. Journal of the American Water Resources Association, 45(1), 58-67.
Henze, M. (1992) Characterization of wastewater for modeling of activated sludge processes.
Water Sci. Technol., 25(6), 1-15.
Imai, A., Fukushima, T., Matsushige, K., Kim, Y-H., and Choi, K., Characterization of dissolved
organic matter in effluents from wastewater treatment plants, Water Res., 36, 859-870,
2002
Namkung, E. and Rittman, B.E. (1986) Soluble microbial products (SMP) formation kinetics by
biofilms. Water Res., 20(6), 795-806.
Reckhow, D.A.; Makdissy, G.; and Rees, P.S. (2008) Disinfection by-product precursor content
of natural organic matter extracts. In Disinfection By-Products in Drinking Water:
Occurrence, Formation, Health Effects and Control; Karanfil, T.; Krasner, S.W.;
Westerhoff, P.; Xie, Y.F.; Eds.; ACS Symposium Series 995; Oxford University Press:
New York, 2008; pp 80-94.
Kim, M., Ahn, Y.H., and Speece, R.E. (2002) Comparative process stability and efficiency of
anaerobic digestion: mesophilic vs thermophilic. Water Res., 36, 4369-4385.
Krasner, S.W., Westerhoff, P., Chen, B., Amy, G., Nam, S.-N., Chowdhury, Z.K., Sinha, S.,
Rittmann, B.E. (2008) Contribution of wastewater to DBP formation. AWWA Research
Foundation, Denver, CO, USA.
Krasner, S.W., Westerhoff, P., Chen, B., Rittmann, B.E., and Amy G. (2009a) Occurrence of
disinfection byproducts in United States wastewater treatment plant effluents, Environ.
Sci. Technol., 43, 8329-8325.

104
Krasner, S.W., Westerhoff, P., Chen, B., Rittmann, B.E., Nam, S.-N. and Amy, G. (2009b)
Impact of wastewater treatment processes on organic carbon, organic nitrogen, and DBP
precursors in effluent organic matter. Environ. Sci. Technol., 43(8), 2911-2918.
Laspidou, C.S., and Rittmann, B.E. (2002) A unified theory for extracellular polymeric
substances, soluble microbial products, and active and inert biomass. Water Res., 36(11),
2711-2720.
Lee, W., Westerhoff, P. and Croue, J-P. (2007). Dissolved organic nitrogen as a precursor for
chloroform, dichloroacetonitrile, n-nitrosodimethylamine, and trichloronitromethane.
Environ. Sci. Technol., 41(15), 5485-5490.
Li, B. and Irvin, S. (2007) The comparison of alkalinity and ORP as indicators for nitrification
and denitrification in a sequencing batch reactor (SBR). Biochemical Engineering
Journal, 34(3), 248-255.
Li, X.Y. and Chu, H.P. (2003). Membrane bioreactor for the drinking water treatment of polluted
surface water supplies. Water Res., 37(19), 4781-4791.
Liu, J.-L., and Li, X.-Y. (2010) Biodegradation and biotransformation of wastewater organics as
precursors of disinfection byproducts in water, Chemosphere, 81(9), 1075-1083.
Miltner, R.J., Shukairy, H.M., and Summers, R.S. (1992) Disinfection by-product formation and
control by ozonation and biotreatment. J. Am. Water Works Assn, 84(11), 53-62.
Mitch, W.A., Gerecke, A.C., and Sedlak, D.L. (2003) A N-Nitrosodimethylamine (NDMA)
precursor analysis for chlorination of water and wastewater. Water Res., 37(15), 3733-
3741.
Rittmann, B.E., and McCarty, P.L. (2001) Environmental biotechnology: Principles and
applications. McGraw Hill, New York, NY.

105
Rostad, C.E., Martin, B.S., Barber, L.B. and Leenheer, J.A. (2000) Effects of a constructed
wetland on disinfection byproducts: Removal processes and production of precursors.
Environ. Sci. Technol., 34(13), 2703-2710.
Singer, P.C. (1999). Humic substances as precursors for potentially harmful disinfection by-
products. Wat. Sci. Tech., 40(9), 25-30.
Sirivedhin, T., and Gray, K.A. (2005a) Identifying anthropogenic markers in surface waters
influenced by treated effluents: a tool in potable water reuse. Water Res., 39(6), 1154-
1164.
Sirivedhin, T., and Gray, K.A. (2005b) Comparison of the disinfection by-product formation
potentials between a wastewater effluent and surface waters, Water Res., 39(6), 1025-
1036.
Song, H., Addison, J.W., Hu, J. and Karanfil, T. (2010). Halonitromethanes formation in
wastewater treatment plant effluent. Chemosphere, 79(2), 174-179.
Taylor, J.S., and Jacobs, E.P. (1996) Reverse Osmosis and nanofiltration. In Mallevialle J,
Odendall PE, Wiesner MR, Editors, Water treatment membrane processes, McGraw-Hill,
New York, NY,
Tang, H.L., Chen, Y.-C., and Xie, Y.F. (2011) Quantification of disinfection byproduct
formation potential in wastewater. Proceedings of IWA Micropol & Ecohazard 2011
Conference, Sydney, Australia.
USEPA (1998) National primary drinking water regulations: disinfectants and disinfection by-
products, final rule. Washington, DC.
Uyak, V., Yavuz, S., Toroz, I., Ozaydin, S., Genceli, E.A. (2007) Disinfection by-products
precursor removal by enhanced coagulation and PAC adsorption. Desalination, 216, 334-
344.

106
White, D.M., Garland, D.S., Narr, J., and Woolard, C.R. (2003) Natural organic matter and DBP
formation potential in Alaskan water supplies. Water Res., 37(4), 939-947.
Xie, Y.F. (2004). Disinfection byproducts in drinking water: Formation, analysis, and control,
Boca Raton, FL: Lewis Publishers.

107
List of Figure and Table Captions
Figure 5-1: Set-up of reactors for experiments: (a) three CSTRs; (b) two SBRs
Figure 5-2: The DO profile in an 8-h cycle of two SBRs: (a) O/A SBR; (b) A/O SBR
Figure 5-3: MLSS of the three CSTRs and removal of NH3-N, DOC and DBPFP
Figure 5-4: Species of DBPFPs in effluents of the three CSTRs.
Figure 5-5: MLSS of the O/A and A/O SBRs and removal of NO3-N, DOC and DBPFP
Figure 5-6: Species of DBPFPs in the effluents of the O/A and A/O SBRs
Figure 5-7: (a) DOC and (b) NH3-N profile in an 8-h cycle of the O/A and A/O SBRs
Figure 5-8: DCAA, TCAA, CF and CH profile in an 8-h cycle of the (a) O/A SBR and (b) A/O
SBR
Figure 5-9: HK and HAN profile in an 8-h cycle of the (a) O/A SBR and (b) A/O SBR
Figure 5-10: DCAA, TCAA, CF and CH yield profile in the (a) O/A SBR and (b) A/O SBR
Figure 5-11: HK and HAN yield profile in the (a) O/A SBR and (b) A/O SBR
Figure 5-12: Relative abundance of DBPFPs in the (a) O/A SBR and (b) A/O SBR
Table 5-1. Parameters of the two SBRs
Table 5-2. SBR programming in an 8-h cycle during a day
Table 5-3. Free-chlorine residuals and demands of the chlorinated samples in an 8-h cycle of the
two SBRs (Dilution ratio: 1:25)

108
a
b
Figure 5-1. Set-up of reactors for experiments: a) three CSTRs; b) two SBRs

109
Figure 5-2. The DO profile in an 8-h cycle of two SBRs: (a) O/A SBR; (b) A/O SBR
-1
0
1
2
3
4
5
6
0 1 2 3 4 5 6 7 8
DO [mg/L]
Hours
a
-1
0
1
2
3
4
5
6
7
0 1 2 3 4 5 6 7 8
DO [mg/L]
Hours
b

110
Figure 5-3. MLSS of the three CSTRs and removal of NH3-N, DOC and DBPFP

111
Figure 5-4. Species of DBPFPs in the effluents of the three CSTRs
0
200
400
600
800
1000
1200
DBPFP[µg/L]
Reactor 1 (4-d SRT)Reactor 2 (10-d SRT)Reactor 3 (20-d SRT)
HAAFP THMFP CHFP HANFP HKFP
(a)
0
200
400
600
800
1000
1200
HAAFP[µg/L]
Reactor 1 (4-d SRT)
Reactor 2 (10-d SRT)
Reactor 3 (20-d SRT)
DCAAFP TCAAFP
(b)

112
Figure 5-5. MLSS of the O/A and A/O SBRs and removal of NO3-N, DOC and DBPFP

113
Figure 5-6. Species of DBPFPs in the effluents of the O/A and A/O SBRs
0
200
400
600
800
1000
1200
DBPFP[µg/L]
O/A SBR (20-d SRT)
A/O SBR (20-d SRT)
HAAFP THMFP CHFP HANFP HKFP
(a)
0
200
400
600
800
1000
1200
HAAFP[µg/L]
O/A SBR (20-d SRT)
A/O SBR (20-d SRT)
DCAAFP TCAAFP
(b)

114
Figure 5-7. (a) DOC and (b) NH3-N profile in an 8-h cycle of the O/A and A/O SBRs
0
5
10
15
20
25
0 1 2 3 4 5 6 7 8
DOC[mg/L]
O/A SBR A/O SBR (a)
0
5
10
15
20
25
30
0 1 2 3 4 5 6 7 8
NH3-N[mg/L]
Hours
O/A SBR A/O SBR(b)

115
a
b
Figure 5-8. DCAA, TCAA, CF and CH profile in an 8-h cycle of the (a) O/A SBR and (b) A/O
SBR
0
100
200
300
400
500
600
0 1 2 3 4 5 6 7 8
DBPFP[µg/L]
DCAAFP
CFFP
TCAAFP
CHFP
0
100
200
300
400
500
600
0 1 2 3 4 5 6 7 8
DBPFP[µg/L]
Hours
DCAAFP
CFFP
TCAAFP
CHFP

116
Figure 5-9. HK and HAN profile in an 8-h cycle of the (a) O/A SBR and (b) A/O SBR
0
10
20
30
40
50
0 1 2 3 4 5 6 7 8
DBPFP[µg/L]
HKFP
HANFP
(a)
0
10
20
30
40
50
0 1 2 3 4 5 6 7 8
DBPFP[µg/L]
Hours
HKFP
HANFP
(b)

117
a
b
Figure 5-10. DCAA, TCAA, CF and CH yield profile in the (a) O/A SBR and (b) A/O SBR
0
10
20
30
40
50
60
0 1 2 3 4 5 6 7 8
DBPYield[µg/mgC]
DCAACFTCAACH
0
20
40
60
80
0 1 2 3 4 5 6 7 8
DBPYield[µg/mgC]
Hours
DCAACFTCAACH

118
Figure 5-11. HK and HAN yield profile in the (a) O/A SBR and (b) A/O SBR
0.0
0.5
1.0
1.5
2.0
0 1 2 3 4 5 6 7 8
DBP Yield[µg/mgC]
HK
HAN
(a)
0.0
0.5
1.0
1.5
2.0
0 1 2 3 4 5 6 7 8
DBP Yield[µg/mgC]
Hours
HK
HAN
(b)

119
Figure 5-12. Relative abundance of DBPFPs in the (a) O/A SBR and (b) A/O SBR
0
1
2
3
0 1 2 3 4 5 6 7 8
RelativeAbundance
DCAAFP/TCAAFP
DCAAFP/TCMFP
TCAAFP/TCMFP
(a)
0
1
2
3
0 1 2 3 4 5 6 7 8
RelativeAbundance
Hours
DCAAFP/TCAAFP
DCAAFP/TCMFP
TCAAFP/TCMFP
(b)

120
Table 5-1. Parameters of the two SBRs
O/A SBR A/O SBR
Working volume Temperature
2 L 20±2 °C
2 L 20±2 °C
HRT 10.7 h 10.7 h
SRT 20 d 20 d
Hours per cycle 8 h 8 h
Cycles per day 3 3
Days of continous operation 180 d 180 d
Filling volume per cycle 1.5 L 1.5 L
Discharge volume per cycle 1.5 L 1.5 L
Retained volume per cycle 0.5 L 0.5 L
Recycle ratio 0.33 0.33
Filling time 30 min 30 min
Settling time 45 min 45 min
Decanting time 30 min 30 min
Idling time 15 min 15 min
Anoxic reaction time 3 h 3 h
Oxic reaction time 3.5 h 3.5 h
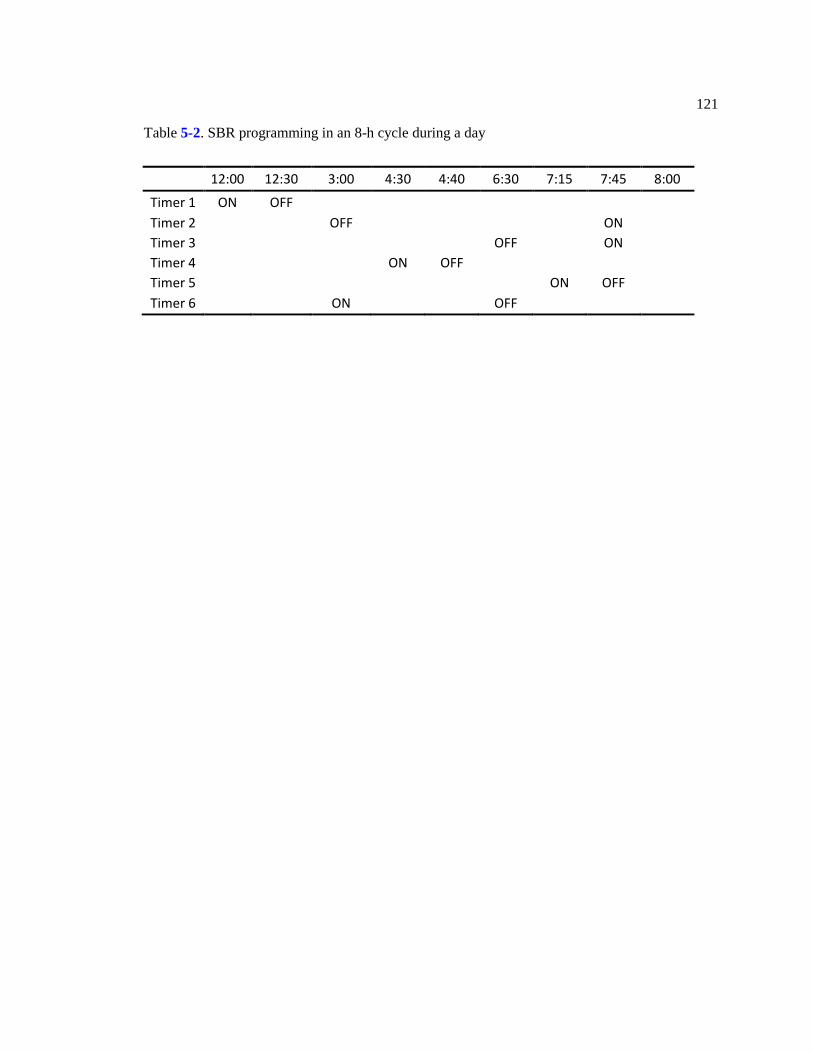
121
Table 5-2. SBR programming in an 8-h cycle during a day
12:00 12:30 3:00 4:30 4:40 6:30 7:15 7:45 8:00
Timer 1 ON OFF
Timer 2
OFF
ON
Timer 3
OFF
ON
Timer 4
ON OFF
Timer 5
ON OFF
Timer 6 ON OFF
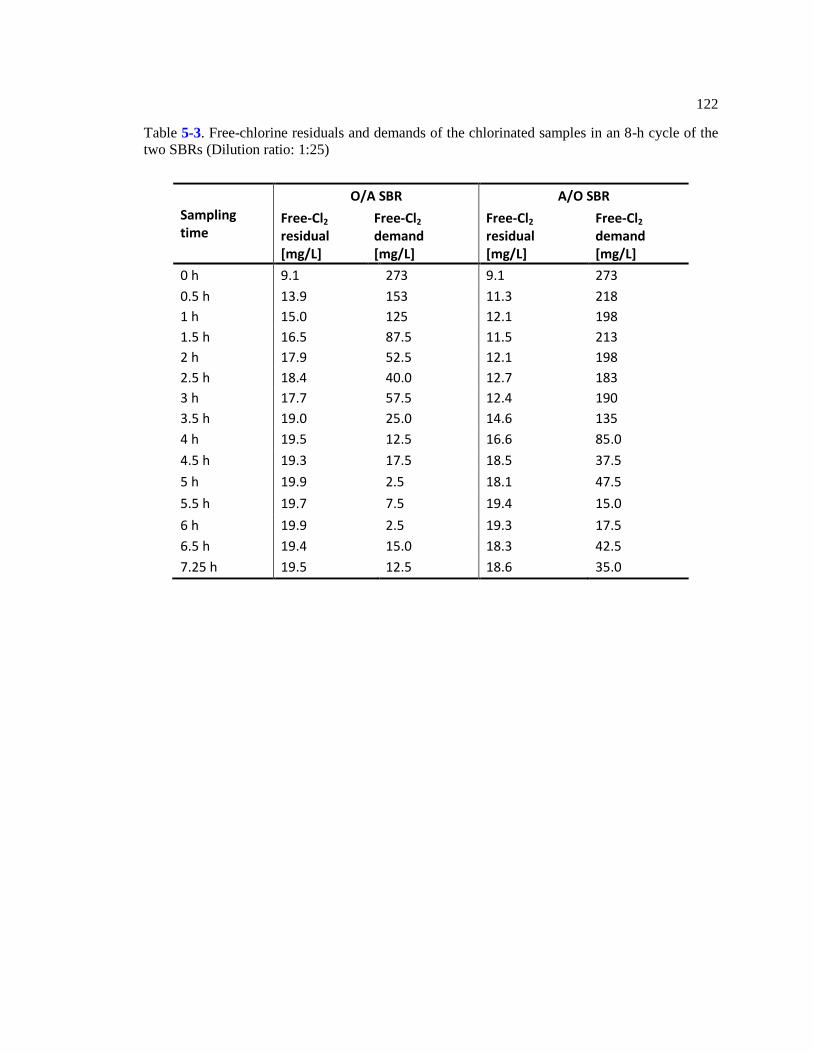
122
Table 5-3. Free-chlorine residuals and demands of the chlorinated samples in an 8-h cycle of the
two SBRs (Dilution ratio: 1:25)
Sampling time
O/A SBR A/O SBR
Free-Cl2 residual [mg/L]
Free-Cl2 demand [mg/L]
Free-Cl2 residual [mg/L]
Free-Cl2 demand [mg/L]
0 h 9.1 273 9.1 273
0.5 h 13.9 153 11.3 218
1 h 15.0 125 12.1 198
1.5 h 16.5 87.5 11.5 213
2 h 17.9 52.5 12.1 198
2.5 h 18.4 40.0 12.7 183
3 h 17.7 57.5 12.4 190
3.5 h 19.0 25.0 14.6 135
4 h 19.5 12.5 16.6 85.0
4.5 h 19.3 17.5 18.5 37.5
5 h 19.9 2.5 18.1 47.5
5.5 h 19.7 7.5 19.4 15.0
6 h 19.9 2.5 19.3 17.5
6.5 h 19.4 15.0 18.3 42.5
7.25 h 19.5 12.5 18.6 35.0

123
Chapter 6
Materials of Human Origin as a Source of Disinfection Byproduct Precursors
Abstract
The research monitored disinfection byproducts (DBPs) in an indoor swimming pool over a 1-
year period since water change, explored DBP formation potentials (FPs) from materials of
human origin (MHOs), and developed a model to simulate DBP formation in the pool water. As
the pool was admitting more and more swimmers, the haloacetic acid (HAA) concentrations
increased up to 1650 µg/L while the trihalomethane (THM) concentrations fluctuated in a range
of 40 to 181 µg/L during the 1-year observation. High HAA levels and the difference between the
concentrations of HAAs and THMs was attributed to three factors: (1) MHOs from swimmers.
MHOs yielded more DBPs than the natural organic matter in drinking water, and they contributed
to more HAAs than THMs; (2) slow HAA reduction. Laboratory simulations of swimming pools
indicated that the HAAs had a much longer half life than THMs; and (3) long water retention
time. By implementing the model with the data from 1-year observation and optimized
parameters, a good simulation on DBP formation was achieved. The sensitivity analysis indicated
that MHO loadings had a major impact on HAAs in swimming pool water.
Keywords: Materials of human origin, Chlorination; disinfection by-products; formation
potential; swimming pool
Material presented in this chapter was submitted to Water Research.

124
Introduction
Hygienic safety of swimming pool water is critical not only because of a number of outbreaks of
diseases caused by microorganisms in pool water (Friedman et al., 1999; Leoni et al., 1999), but
also because of the unintended consequences of disinfection, known as disinfection byproducts
(DBPs). DBPs that are escaped into the atmosphere, absorbed through inhalation, ingestion,
bathing, showering and swimming have negative effects on human health (Villanueva et al.,
2007; Karagas et al., 2008; Richardson et al., 2010). Two major groups of DBPs, trihalomethanes
(THMs) and haloacetic acids (HAAs) are of keen interests by researchers. Trihalomethanes
(THMs) are the best known and most intensively investigated class of DBPs. Reports on THMs
in swimming pools first appeared in 1980. Since then, THMs have been measured in pool waters
around the world (Zwiener et al., 2007). Fantuzzi et al. (2001) found the THMs ranged from 17.8
to 70.8 µg/L in five indoor swimming pools in Italy. Chu and Nieuwenhuijsen (2002) found the
THMs averaged at 132.4 µg/L in forty four indoor swimming pools in UK. In addition to THMs,
HAAs are also of toxicological concern, but information regarding their concentrations is rare and
their formation kinetic in swimming pools remains unclear.
DBP formation in drinking water is related with a number of environmental factors.
Chlorine concentration and reaction time are two of them (Xie, 2004). In Germany, the chlorine
concentration must be kept in the range of 0.3-0.6 mg/L in swimming pools and 0.7 - 1.0 mg/L in
spas (Zwiener et al., 2007). In the UK and Australia, chlorine concentrations of 1-3 mg/L are
recommended. Although there are no strictly enforced regulations in US, a survey shows that the
median chlorine concentration was 3.0 mg/L in indoor public pools (Kanan and Karanfil, 2011).
Due to continuous addition of chlorine in swimming pools, the water represents a special case of
disinfection. Swimming pool water differs from the disinfection of drinking water that is
regulated under the USEPA’s D/DBP Rule (USEPA, 1998). In swimming pool systems, water
125
has two distinctive characteristics: (1) The precursors that may account for DBPs not only include
the natural organic matter (NOM) in drinking water, but also include the organic constituents that
are continuously brought in by swimmers; (2) In contrast to short water ages in drinking water
systems, pool water is not frequently changed, and the continuous reaction with the added
chlorine have a potential to drive all DBP precursors to form DBPs. Because of these two
characteristics, an intensive investigation into the organics in swimming pools regarding their
DBP formation potentials (FPs) becomes essential.
A number of researchers (Judd and Jeffrey, 1995; Kim et al., 2002; Judd and Bullock,
2003; Li and Blatchley, 2007; Kanan and Karanfil, 2011) have associated swimming pool
organics to the materials of human origin (MHOs) from the pool users. MHOs such as sweat and
urine are main constituents of organics in the pool water. The MHO release during an average
swim session per person is 25-30 ml urine (Gunkel and Jessen, 1988) and 200-1000 ml sweat
(Erdinger et al., 1997). These values were not accurately determined and the actual values may
show great variance among different studies, because the MHO release is difficult to measure.
For instance, Erdinger et al. (1997) found the urine release into the indoor swimming pool per
person was estimated to be 77.5 ml and in outdoors the amount was about 60 ml. Reactions
between chlorine and MHOs have been reported by Kim et al. (2002). However, some of their
samples had no free chlorine residuals after incubation due to a low chlorine dose and no dilution
of samples, therefore, their DBPFPs of MHOs may be underestimated because the free chlorine
residual is around 3 mg/L in typical swimming pools. As MHOs are continuously brought in by
swimmers and pools are continuously exposed to disinfectants, an FP test that ensures sufficient
free chlorine residual and long reaction time may result in a better simulation of chlorination in a
real swimming pool system. In addition, it is important to investigate HAAFPs of MHOs because
of the exceptionally high HAA concentrations found in swimming pools (Ristau, 2007).

126
The objective of this research was to monitor DBPs, explore the DBPFPs from MHOs,
and develop a model to simulate DBPs in swimming pool water. As the contribution of
wastewater organics to DBPs in drinking water is an important research area due to the increasing
wastewater reuse nowadays, the research can help water professionals to better understand the
contribution of MHOs and the fate of DBPs in drinking water sources where source water is
impacted by swimming and wastewater.
Materials and Methods
Swimming pool
The swimming pool under investigation was located in Capital Union Building at The
Pennsylvania State University, Middletown, Pennsylvania, USA. The pool has a volume of 440
m3 and accepts an average of 1500 persons per month. The water in the pool was changed on
June 7th, 2009. Since then, grab samples were collected monthly and analyzed for DBPs. The
free-chlorine residuals in the pool were in the range of 1 to 4 mg/L. There was no water change
during the experimental period except that a small amount of make-up water (approximately 1.8
m3) was added weekly to replace the water lost through evaporation. Pool users were suggested to
take a shower prior to their entries to the pool but the shower was not enforced.
MHOs
Samples of MHOs were prepared using distilled water and five kinds of MHOs (sweat,
saliva, skin wash, hair wash, and urine) collected from a 26-year-old man. Raw samples were
filtered through 0.45 µm membranes. Then dissolved organic carbon (DOC) was measured with a

127
TOC analyzer (O.I. Analytical Model 1010, Maryland, USA). Ammonia nitrogen was measured
using the ammonia-selective electrode method 4500-NH3 (APHA, 1998). UV absorbance at 254
nm was measured using with a UV/Vis spectrophotometer (Agilent 8453 spectrophotometer) with
a 10 mm quartz cuvette. The DPD colorimetric method 4500-Cl G (APHA, 1998) was used to
measure the concentrations of free chlorine in swimming pool water. Table 6-1 shows the water
quality parameters. Samples were acidified to pH 2 and stored at 4 °C during the preservation.
DBPFP test
To accommodate the chlorine demand of MHO samples, dilution ratio needs to be
determined before the chlorination. After dilution, samples were buffered to pH 7 by a phosphate
buffer and a chlorine dose of 20 mg/L was applied. Incubation took 3 days at 25°C in the dark.
After the incubation was complete, samples were transferred to 40 ml vials containing granular
ammonia chloride to convert free chlorine to combined chlorine. These vials were sealed with
PTFE-lined screw caps without head space and stored at 4°C before DBP extractions.
DBP extractions and analyses
DBP extractions were conducted using modified EPA method 552.3 and 551.1. For HAA
analysis, each 30 ml sample was acidified with 1.5 ml concentrated sulfuric acid and extracted
with 3 ml of MTBE spiked with 300 µg/L 1,2-dibromopropane. Approximately 12 g of sodium
sulfate was added to enhance the extraction. Then, 1 ml of the MTBE extract was mixed with 1
ml of 10% sulfuric acid/methanol mix, and incubated for two hours at 50°C for HAA
derivatization. After derivatization, the solution was back-extracted with 4 ml of 10% sodium
sulfate solution to remove excess methanol. For the analyses of THMs and other DBPs, each 30
128
ml sample was treated using the protocols above without pre-extraction acidification and post-
extraction methylation.
The concentrations of DBPs were determined using gas chromatographs (Hewlett
Packard 6890) with electron capture detectors. A DB-1701 capillary column (30 m × 0.25 mm
i.d., 0.25 µm film thickness) was used for HAA analysis. A DB-1 capillary column (30 m × 0.32
mm i.d., 1.0 µm film thickness) was used for the analyses of THMs and other DBPs. The
temperature ramping programs were as follows: (1) HAAs: Initial at 35°C for 10 minutes and
ramp to 75°C at 5°C/min and hold for 16 minutes, a final ramp to 200°C at 25°C/min and hold 5
minutes; (2) THMs and other DBPs: Initial at 35°C for 22 minutes, and ramp to 145°C at
10°C/min and hold for 2 minutes..
Modeling approach
The conceptualization of a swimming pool system is based on a mass balance and
kinetic-based model (Judd and Black, 2000; Sohn et al., 2004). The Shuffled Complex Evolution
(SCE-UA) (Duan et al., 1993), a global optimization method, is used to optimize the parameters
for the model. The amounts of sweat and urine released by the pool users are to be optimized by
the algorithm. Each of the variable parameter is pre-assigned a value to start the simulation. Then
the simulated data are compared with the observed data. If the simulation performance does not
meet certain criteria, values of the variable parameters are adjusted. After each calibration of
variable parameters, the model is evaluated again to examine whether the simulation performance
is improved. Simulation and calibration are repeatedly performed until the simulation
performance is the best. Then the model is considered to be in good shape to get the closest
response of swimming pool DBPs. Root Mean Squared Error, which is defined in Eq. 6-1, is used
to evaluate the simulation performance of the model.

129
Eq. 6-1:
Where Osim = the simulated output; Oobs = the observed output; n = the number of data
Results and Discussion
DBPs in the monitored swimming pool
Figure 6-1a shows the HAAs and THMs profile in the monitored indoor swimming pool
since water change. The initial HAA and THM concentrations (81 µg/L and 87 µg/L) were close
to the finished water from a typical water treatment plant (maximum contaminant levels: 60 µg/L
for HAAs and 80 µg/L for THMs). As time went on and the pool was admitting more swimmers,
the HAA concentrations increased significantly. In August, two months since water change, 939
µg/L HAAs were found in the pool. During November 2009 and January 2010 (the 6th and 8th
months since water change), the HAA level appeared to have reached a plateau and it fluctuated
at 1600 µg/L. This may be due to the fact that less people used the pool in December during the
winter break. After January 2010, HAAs declined. Figure 6-1b shows the number of pool users
each month. It was suspected that the HAA decline since February 2010 may be correlated with
the declining number of pool users and possible HAA degradation. In contrast to HAAs, THMs
did not show the increase trend in the pool. During the one-year period, the THM concentrations
were only averaged at 68 µg/L with a standard deviation of 40 µg/L. Therefore, there was a
substantial difference between the concentrations of HAAs and THMs in the swimming pool
water. Similar observations on the difference of HAA and THM concentrations were also
reported by Kanan and Karanfil (2011) when 23 indoor pools were surveyed. Three factors were
suspected to be the reason: (1) MHOs introduced by pool users; (2) slow HAA degradation, and

130
(3) long water retention time. The impacts of the three factors on DBPs in swimming pools were
discussed in the following sections.
DBPFPs and DBP yields from MHOs
Table 6-2 shows the DBPFPs from the MHO samples. All analyzed MHOs were found to
contribute to DBP formation, which was consistent with results reported by Kim et al. (2002). In
the DBPFP test, 1930 µg/L, 3050 µg/L, 3420 µg/L, 1750 µg/L, and 1610 µg/L HAAFP was
found in chlorinated sweat, saliva, skin wash, hair wash, and urine samples, respectively. Their
corresponding THMFPs were 427 µg/L, 1010 µg/L, 875 µg/L, 563 µg/L, and 971 µg/L.
Therefore, MHOs could be important sources of DBP precursors in pool water. When the relative
abundance of HAAFPs and THMFPs were explored, the data shows all analyzed MHOs
contributed more to HAAFPs than THMFPs. The HAAFP/THMFP ratios were between 1.7 and
4.5. Specifically, the sweat, saliva, skin wash and hair wash samples had higher ratios than the
urine sample. The results indicate that these MHOs may have more HAA precursors than THM
precursors, and may partially explain the difference between the concentrations of HAAs and
THMs found in pool water.
Because THM and HAA species are regulated in drinking water (USEPA, 1998), the
research into THMs and HAAs is usually of particular interest. Other species also need
investigation. For example, Weaver et al. (2009) analyzed 11 DBPs in chlorinated swimming
pool water. In this study, besides regulated DBPs, other investigated DBP species included:
chloral hydrate (CH), haloacetonitriles (HANs) including trichloroacetonitrile (TCAN),
dichloroacetonitrile (DCAN), bromochloroacetonitrile (BCAN), dibromoacetonitrile (DBAN),
and haloketones (HKs) including 1,1-dichloro-2-propanone (DCP) and 1,1,1-trichloro-2-
propanone (TCP). Data shows that HANs and HKs were in much lower concentrations compared

131
to THMs and HAAs. CH, however, was in great abundance, and the CHFPs, which were 1150
µg/L, 1300 µg/L, and 1470 µg/L in the sweat, skin wash, and hair wash samples, were higher
than THMFPs.
Table 6-2 also indicated that the MHO samples had much higher free-chlorine demands
than NOM in drinking water, which is usually less than 20 mg/L. The 3-day free-chlorine
demands per DOC for sweat, saliva, skin, hair and urine were in the range of 21 to 33 mg Cl2 per
mg carbon. This was similar to the results of body fluid analogs reported by Kanan and Karanfil
(2011). The majority of the chlorine demands of MHOs were not necessarily from inorganic
matter (i.e. ammonia nitrogen), but could be from organic matter. A 1:25 or even higher dilution
ratio was required to maintain sufficient free-chlorine residual after 3-day incubation during the
DBPFP tests. In addition, the free-chlorine demand of urine is much higher than other MHOs.
This could be due to the rich nitrogenous compounds in the urine that react with free chlorine
during the incubation (De Laat et al., 2011).
Because it is difficult to collect large amounts of MHOs, the obtained samples in this
research were diluted MHOs. The concentrations of these organics, denoted by dissolved organic
carbon (DOC), may show substantial variance during multiple collections. Therefore, there is a
need to normalize the obtained DBPFPs based on DOC. DBP yield is such a parameter, and it
can be used to compare different MHOs regardless of their dilution ratios during collections. The
DBP yields were 547 µg/mgC for sweat, 562 µg/mgC for saliva, 615 µg/mgC for skin wash, 340
µg/mgC for hair wash and 304 µg/mgC for urine samples. The authors also studied the DBP
yields of waters containing various levels of humic acid, a component of NOM, and found the
DBP yield was 153 µg/mgC based on the FP test. Therefore, the DBP yields of MHOs were
higher than that of NOM. Sweat, saliva and skin wash samples also showed higher DBP yields
than hair wash and urine samples. Figure 6-2 presents the yields of HAA, THM and CH after the
FP tests. Urine had the lowest HAA yields (161 µg/mgC) compared to others, and the HAA

132
yields for sweat (301 µg/mgC), saliva (391 µg/mgC) and skin wash (376 µg/mgC) were all high
compared to the yields of other DBP species. The THM yields were in the range of 51 and 129
µg/mgC, which were much higher than Kim et al. (2002)’s data on THM yields in the range of 16
to 32 µg/mgC for hair, saliva, skin and urine samples.
Simulations on DBP formation and reduction
Lab-scale experiments were conducted to simulate a swimming pool environment in
order to confirm the contribution of MHOs to DBP formation. A lab-scale swimming pool built
with an 8-L reactor with occasional water agitation was used to simulate the swimming pool.
MHOs were manually added to the open reactor and free-chlorine residuals were maintained in a
range of 1-4 mg/L all the time. Analysis of grab samples from the simulated pool over the time
(Figure 6-3) showed that the introduction of MHOs was the cause for HAAs increase. However,
in the open air environment with intermittent water agitation, THMs did not show high
concentrations, but instead was relatively stable compared to HAAs. It was suspected that THMs
were partially lost due to the water agitation while being formed. Benoit and Jackson (1987)
observed unchanged THMs while exploring the THM concentrations in 25 whirlpool spas
affected by heat, aeration, and agitation. The water agitation by pool users, thought difficult to
measure, may play an important role on DBPs.
Lab-scale experiments were used to simulate THM and HAA reductions due to water
agitation. The mechanisms involved in real swimming pool systems may include evaporation and
possible degradations such as biodegradation (Tung and Xie, 2009) and photodegradation
(Lifongo et al, 2004) in outdoor pools. Water samples were taken out from the real swimming
pool and placed in an open container after quenching free-chlorine residual with ammonium
chloride. Occasional water agitation was applied every day and no external MHOs were added

133
during the experiment. The THM concentration in the freshly collected swimming pool water
was 45 µg/L. It decreased to 11 µg/L after 3 days. The data was plotted in Figure 6-4a. A pseudo
first-order kinetic equation (Eq 6-2) was applied to the experimental data to determine the
reduction rate coefficient. Based on laboratory simulations, the THM reduction rate coefficient
was 0.45 day-1
, and the half life of THMs was 1.5 days during the simulation of swimming pool.
Eq 6-2:
The pseudo first-order kinetic equation based on the experimental data of HAA reduction
(Figure 6-4b) shows that the rate coefficient of HAAs reduction was 0.023 day-1
. And the half life
of HAAs in the simulation of swimming pool was 30 days. Because the half life of HAAs is
much longer than that of THMs, HAAs can be accumulated while THMs were quickly lost. This
explains the particular DBP profile in swimming pools: high HAA and low THM concentrations.
The swimming pool DBP model
Numerous models on DBP formation have been presented by Sohn et al. (2004), and
computer-based simulation is a useful tool for a number of tasks performed by water and
wastewater professionals (Melcer et al., 2003; Lee et al., 2002). In this study, the
conceptualization of a swimming pool system is based on a mass balance and kinetic-based
model, which is presented in Eq. 6-3. The DBPin is calculated based on the experimentally
determined DBP yields from MHOs in the DBPFP tests. The DBPreacted is based on pseudo first-
order kinetics, and the DBP reduction rate coefficients are experimentally determined according
to laboratory simulations. Three assumptions were made for the model: (1) All DBP precursors
from MHOs have been converted to DBPs; (2) DBPout is zero because water in the swimming
pool is not changed in a given time t; (3) The DBP reaction kinetics between the laboratory
simulation and the real swimming pool are the same.

134
Eq. 6-3:
Where Y = DBP yields from MHOs; C = Concentrations of MHOs; [DBP] = DBP
concentrations; k = DBP reduction rate coefficient; t = time
Description of the parameters in the swimming pool DBP model is presented in Table 6-
3. The model input includes three parameters from observations (Number of pool users per day,
days, and swimming pool volume) and six stoichiometric and kinetic paramaters (HAA and THM
yields from sweat and urine and the rate coefficients of HAA and THM reductions), which must
be defined in order to apply the model to predict system behavior. These stoichiometric and
kinetic parameters do not change dramatically among different systems, and they are obtained by
indirect techniques (e.g. laboratory experiments). The initial concentrations of HAAs and THMs
are assumed to be 60 and 80 µg/L, respectively, based on the MCLs in drinking water. The model
output includes the estimated HAA and THM concentrations. The variable parameters are the
amounts of released sweat and urine per person and each of them was assigned an initial value to
start the simulation. The computational algorithm (i.e. for HAAs) is shown in the following steps
based on a daily input of pool users in a 365-day time frame. And the computation was completed
using MATLAB (The Mathworks, Inc.).

135
At Day 0,
At Day 1,
At Day 2,
At Day 3,
…
At Day i,
i=365.
If all of the input data were perfect, there would be an approximate prediction but not
necessarily an exact match. In calibrating the model to take care of small discrepancies, small
adjustments were made to the variable parameters until the simulated data matches the observed
data. The SCE-UA algorithm ensured that the root mean squared value (168.25) between the
simulated and observed data was the lowest. The parameters after optimization were that 701 mg
carbon from sweat per person and 415 mg carbon from urine per person were released to the pool.
This indicated that an overall estimate of 1120 mg carbon from MHOs per swim per person was
released. According to available literature (Judd and Black, 2000), a carbon content of 6000 mg/L
is used to simulate body fluids, the optimized parameters implied that each pool user released
approximately 117 ml sweat and 69 ml urine into the pool. These values were in the range
reported by Erdinger et al. (1997).
Figure 6-5 shows the HAA and THM levels in the swimming pool simulated by the
model with optimized parameters. The model simulations on HAAs are close to the experimental

136
results and they capture the rising trend and declining trend well. Therefore, the model is
competent to simulate HAAs in swimming pools. However, while exploring the simulated and
observed THM data, the model’s performance on THMs simulation appears to be limited. This is
because the THM reduction rate is so high that the monthly observation data could not reveal its
relationship with the MHO input and could not capture the trend.
The swimming pool DBP model was implemented to obtain simulated DBP data given
lower or higher MHO loading scenarios to explore the impact of MHOs on DBP concentrations
in swimming pools. Besides the three assumptions for the model, the fourth assumption made
here is that the daily MHO loading is constant. Sensitivity analysis in Figure 6-6 shows that the
MHO loading plays an important role on DBPs, especially HAAs, in swimming pool systems. A
high loading tends to achieve a higher HAA plateau, but it takes longer time to reach the plateau
than a low loading (Figure 6-6a). A high loading also tends to achieve higher THM formation
(Figure 6-6b). However, due to the high THM reduction rate coefficient, the THM concentrations
will be stable and low given a constant MHO loading scenario. Various MHO loadings do not
differentiate the HAA/THM ratio, as revealed in Figure 6-6c. The ratio will increase regardless of
the high or low MHO loadings, and will finally be stabilized given a constant MHO loading
scenario in a conceptual swimming pool system.

137
Conclusions
The following conclusions were obtained from this study:
• Monitoring of an indoor swimming pool over a 1-year period revealed HAA
levels up to 1650 µg/L and stable THMs at 68 µg/L in average in the pool water. High HAA
levels and the difference between the concentrations of HAAs and THMs was attributed to three
factors: (1) MHOs from pool users; (2) slow HAA reduction; and (3) long water retention time.
• All MHO samples were found to have high DBPFPs, and MHOs contributed
more HAAs than THMs. The sweat, saliva, skin wash, hair wash, and urine samples had higher
DBP yields than NOM in drinking water.
• The THM reduction rate coefficient was 0.45 per day while the HAA reduction
rate coefficient was 0.023 per day based on laboratory pool simulations.
• The model achieved a good simulation of a real swimming pool system.
Optimized parameters of the model implied approximately 117 ml sweat and 69 ml urine per
person were released to the pool. The sensitivity analysis indicated that MHO loadings had a
major impact on HAAs in swimming pool water.
Acknowledgements
This study was supported by the Office of Physical Plant and Institutes of Energy and the
Environment at The Pennsylvania State University. The authors thank the staff at Penn State
Harrisburg Aquatic Center for providing access to the swimming pool.

138
Literature Cited
APHA (1998) Standard method for the examination of water and wastewater. 20th ed.
Benoit, F.M. and Jackson, R. (1987) Trihalomethane formation in whirlpool spas. Wat. Res.,
21(3), 353-357.
Chu, H. and Nieuwenhuijsen, M.J. (2002) Distribution and determinants of trihalomethane
concentrations in indoor swimming pools. Occupational and Environmental Medicine,
59, 243-247.
De Laat, J., Feng, W., Freyfer, D.A. and Dossier-Berne, F. (2011) Concentration levels of urea in
swimming pool water and reactivity of chlorine with urea. Water Res., 45(3), 1139-1146.
Duan, Q.Y., Gupta, V.K. and Sorooshian, S. (1993) Shuffled complex evolution approach for
effective and efficient global minimization. Journal of Optimization Theory and
Applications, 76(3), 501-521.
Erdinger, L., Kirsch, F. and Sonntag, H.G. (1997) Potassium as an indicator of anthropogenic
contamination of swimming pool water. Zbl. Hyg. Umweltmed., 200, 297-308.
Fantuzzi, G., Righi, E., Predieri, G., Ceppelli, G., Gobba, F. and Aggazzotti, G. (2001)
Occupational exposure to trihalomethanes in indoor swimming pools. The Science of the
Total Environment, 264, 257-265.
Friedman, M.S., Roels, T., Koehler, J.E., Feldman, L., Bibb, W.F. and Blake, P. (1999)
Escherichia coli O157:H7 outbreak associated with an improperly chlorinated swimming
pool. Clin. Infect. Dis., 29(2), 298-303.
Gunkel, K. and Jessen, H.J. (1988) The problem of urea in bathing water. Zeitschrift für die
Gesamte Hygiene, 34, 248-250.
Judd, S. and Jeffrey, J.A. (1995) Trihalomethane formation during swimming pool water
disinfection using hypobromous and hypochlorous acids. Water Res., 29(4), 1203-1206.

139
Judd, S.J. and Black, S. (2000) Disinfection byproduct formation in swimming pool waters: A
simple mass balance. Water Res., 34, 1611-1619.
Judd, S.J. and Bullock, G. (2003) The fate of chlorine and organic materials in swimming pools.
Chemosphere, 51, 869-879.
Kim, H., Shim, J. and Lee, S. (2002) Formation of disinfection by-products in chlorinated
swimming pool water. Chemosphere, 46, 123-130.
Kanan, A. and Karanfil, T. (2011) Formation of disinfection by-products in indoor swimming
pool water: The contribution from filling water natural organic matter and swimmer body
fluids, Water Res., 45(2), 926-932.
Karagas, M.R., Villanueva, C.M., Nieuwenhuijsen, M., Weisel, C.P., Cantor, K.P. and
Kogevinas, M. (2008) Disinfection byproducts in drinking water and skin cancer? A
hypothesis. Cancer Causes and Control, 19(5), 547-548.
Lee, Y., Cho, J., Seo, Y., Lee, J.W. and Ahn, K.-H. (2002) Modeling of submerged membrane
bioreactor process for wastewater treatment. Desalination, 146, 451-457.
Leoni, E., Legnani, P., Mucci, M.T. and Pirani, R. (1999) Prevalence of mycobacteria in a
swimming pool environment. J. Appl. Microbio., 87(5), 683-688.
Li, J. and Blatchley, E.R. (2007) Volatile disinfection byproduct formation resulting from
chlorination of organic-nitrogen precursors in swimming pools. Environ. Sci. Technol.,
41(19), 6732-6739.
Lifongo, L., Bowden, D. and Brimblecombe, P. (2004) Photodegradation of haloacetic acids in
water. Chemosphere, 55, 467-476.
Melcer, H., Dold, P.L., Jones, R.M., Bye, C.M., Takacs, I., Stensel, H.D., Wilson, A.W., Sun, P.
and Bury, S. (2003) Methods for wastewater characterization in activated sludge
modeling. Water Environment Research Foundation (WERF), Alexandria, VA, USA.

140
Richardson, S.D., DeMarini, D.M., Kogevinas, M., Fernandez, P., Marco, E., Lourencetti, C.,
Ballesté, C., Heederik, D., Meliefste, K., McKague, A.B., Marcos, R., Font-Ribera, L.,
Grimalt, J.O. and Villanueva, C.M. (2010) What’s in the pool? A comprehensive
identification of disinfection by-products and assessment of mutagenicity of chlorinated
and brominated swimming pool water. Environmental Health Perspectives, 118(11),
1523-1530.
Ristau, R.J. (2007) Disinfection by-product formation and control in swimming pools. Master
Thesis, The Pennsylvania State University, Harrisburg, PA, USA.
Sohn, J., Gary, A., Cho, J., Lee, Y. and Yoon, Y. (2004) Disinfectant decay and disinfection by-
products formation model development: chlorination and ozonation by-products. Water
Res., 38, 2461-2478.
Tung, H. and Xie, Y.F. (2009) Association between haloacetic acid degradation and heterotrophic
bacteria in water distribution systems. Wat. Res., 43, 971-978.
USEPA (1998) National primary drinking water regulations: disinfectants and disinfection by-
products, final rule. Washington, DC.
Villanueva, C.M., Cantor, K.P., Grimalt, J.O., Malats, N., Silverman, D., Tardon, A., Garcia-
Closas, R., Serra, C., Carrato, A., Castano-Vinyals, G., Marcos, R., Rothman, N., Real,
F.X., Dosemeci, M. and Kogevinas, M. (2007) Bladder cancer and exposure to water
disinfection by-products through ingestion, bathing, showering, and swimming in pools.
American Journal of Epidemiology, 165(2), 148-156.
Weaver, W.A., Li, J., Wen, Y., Johnston, J., Blatchley, M.R. and Blatchley, E.R. (2009) Volatile
disinfection by-product analysis from chlorinated indoor swimming pools. Water Res.,
43, 3308-3318.
Xie, Y.F. (2004) Disinfection byproducts in drinking water: Formation, analysis, and control,
Boca Raton, FL: Lewis Publishers.

141
Zwiener, C., Richardson, S.D., De Marini, D.M., Grummt, T., Glauner, T. and Frimmel, F.H.
(2007) Drowning in disinfection byproducts? Assessing swimming pool water. Environ.
Sci. Technol., 41(2), 363-372.
142
List of Figure and Table Captions
Figure 6-1. (a) HAAs and THMs in an indoor swimming pool since water change and (b) Number
of pool users. Error bars are based on duplicate samples and are sometimes smaller
than symbol size.
Figure 6-2. DBP yields of MHO samples
Figure 6-3. DBPs in the simulation of a lab-scale swimming pool. Error bars are based on
duplicate sets.
Figure 6-4. (a) THMs and (b) HAAs in the simulation of DBP reduction in lab-scale experiments
Figure 6-5. Model performance on the simulation of swimming pool DBPs: (a) HAAs and (b)
THMs.
Figure 6-6. Sensitivity analysis on the impact of MHO loadings on DBPs: (a) HAAs, (b) THMs,
and (c) HAA/THM ratio in swimming pool.
Table 6-1. Water quality of the MHO samples
Table 6-2. Yields of DBPs after the FP test for MHO samples
Table 6-3. Description of parameters in the swimming pool DBP model

143
Figure 6-1. (a) HAAs and THMs in an indoor swimming pool since water change and (b) Number
of pool users. Error bars are based on duplicate samples and are sometimes smaller than symbol
size.
0
500
1000
1500
DBPs[µg/L]
HAAs THMs(a)
0
500
1000
1500
2000
2500
# o
f p
oo
l use
rs p
er
mo
nth
06
/20
09
07
/20
09
08
/20
09
09
/20
09
10
/20
09
11
/20
09
12
/20
09
01
/20
10
02
/20
10
03
/20
10
04
/20
10
05
/20
10
(b)

144
Figure 6-2. DBP yields of MHO samples
0
100
200
300
400
500
DBP Yield[µg DBP/mg C]
HAA THM CH
Sweat Saliva Skin wash UrineHair wash

145
Figure 6-3. DBPs in the simulation of a lab-scale swimming pool. Error bars are based on
duplicate sets.
0
30
60
90
120
DBPs[µg/L]
HAA THM
0 day with no MHO addition
7 days after MHO addition
14 days after further MHO addition

146
Figure 6-4. THMs and HAAs in the simulation of DBP reduction in lab-scale experiments
0
10
20
30
40
50
0 1 2 3 4 5
THMs[µg/L]
Days
𝑦 = 45 0.45 , R2=0.997
(a)
0
200
400
600
0 7 14 21 28
HAAs[µg/L]
Days
𝑦 = 600 0.023 , 2 = 0.999
(b)

147
Figure 6-5. Model performance on the simulation of swimming pool DBPs
0
500
1000
1500
0 60 120 180 240 300 360
HAAs[µg/L]
Days since water change
Model
Experiment (a)
0
50
100
150
200
0 60 120 180 240 300 360
THMs[µg/L]
Days since water change
Model
Experiment (b)

148
Figure 6-6. Sensitivity analysis on the impact of MHO loadings on DBPs in swimming pool
0
500
1000
1500
2000
0 60 120 180 240 300 360
HAAs[µg/L]
High MHO loading
Low MHO loading
a
0
20
40
60
80
100
0 60 120 180 240 300 360
THMs[µg/L]
b
0
10
20
30
40
50
0 60 120 180 240 300 360
HAA/THMRatio
Days since water change
c

149
Table 6-1. Water quality of the MHO samples
MHO samples DOC [mg/L] UV254 [cm-1] SUVA [L/mg-m] NH3-N [mg/L]
Sweat 6.4 0.107 1.67 0.9
Saliva 7.8 0.134 1.72 2.4
Skin wash 9.1 0.204 2.24 0.9
Hair wash 11.1 0.229 2.06 1.9
Urine 10.0 0.222 2.22 1.3
Data presented are average values of duplicate sets

150
Table 6-2. DBPFPs from the MHO samples
MHO samples
Dilution ratio for DBPFP test
3-day Cl2 demand [mg/L]
Cl2 demand per DOC
[mg Cl2/ mg C]
THMFP [µg/L]
HAAFP [µg/L]
CHFP [µg/L]
DCANFP [µg/L]
DCPFP [µg/L]
TCPFP [µg/L]
HAAFP/ THMFP
Sweat 1:25 168 26.3 427 1930 1150 10 12 42 4.5
Saliva 1:25 170 21.8 1010 3050 324 37 11 42 3.0
Skin wash 1:25 208 22.9 875 3420 1300 32 18 43 3.9
Hair wash 1:25 233 21.0 563 1750 1470 4 18 45 3.1
Urine 1:33 408 32.9 971 1610 466 8 6 75 1.7
Data presented are average values of duplicate sets

151
Table 6-3. Description of parameters for the swimming pool DBP model
Parameter Symbol Description Unit Source
Input
N Number of pool users per day Person Observation
i Days day Observation
V Volume of swimming pool m3 Observation
HYS HAA yield of sweat µg DBP/ mg C Experiment
HYU HAA yield of urine µg DBP/ mg C Experiment
TYS THM yield of sweat µg DBP/ mg C Experiment
TYU THM yield of urine µg DBP/ mg C Experiment
KH HAA reduction rate coefficient day-1
Experiment
KT THM reduction rate coefficient day-1
Experiment
Output HAA HAA concentration µg/L Model
THM THM concentration µg/L Model
Instate HAA0 Initial HAA concentration µg/L MCL
THM0 Initial THM concentration µg/L MCL
Variable CS Released carbon from sweat mg C / person To be optimized
CU Released carbon from urine mg C / person To be optimized
152
Appendix: Abbreviations
This appendix summarizes the abbreviations used throughout the dissertation.
A2O Anaerobic-Anoxic-Oxic
ANOM analysis of means
A/O Anoxic-oxic
APHA American Public Health Association
ASP Activated sludge process
BAP biomass-associated products
BCAA bromochloroacetic acid
BCAAFP bromochloroacetic acid formation potential
BCAN bromochloroacetonitrile
BCANFP bromochloroacetonitrile formation potential
BDCM bromodichloromethane
BDCMFP bromodichloromethane formation potential
BF bromoform
BFFP bromoform formation potential
CF chloroform
CFFP chloroform formation potential
CH chloral hydrate
CHFP chloral hydrate formation potential
Cl2 chlorine
COD chemical oxygen demand
CP chloropicrin
CPFP chloropicrin formation potential

153
DBAA dibromoacetic acid
DBAAFP dibromoacetic acid formation potential
DBCM dibromochloromethane
DBCMFP dibromochloromethane formation potential
DBP disinfection byproduct
DBPFP disinfection byproduct formation potential
DCAA dichloroacetic acid
DCAAFP dichloroacetic acid formation potential
DCAN dichloroacetonitrile
DCANFP dichloroacetonitrile formation potential
DCP 1,1-dichloro-2-propanone
DCPFP 1,1-dichloro-2-propanone formation potential
DO dissolved oxygen
DOC dissolved organic carbon
DPD n,n-diethyl-p-phenylene diamine
ECD electron capture detector
EPA Environmental Protection Agency
FP formation potential
GC gas chromatograph
HAA haloacetic acid
HAAFP haloacetic acid formation potential
HAN haloacetonitrile
HANFP haloacetonitrile formation potential
HK haloketone
HKFP haloketone formation potential

154
HRT hydraulic retention time
MCAA monochloroacetic acid
MCAAFP monochloroacetic acid formation potential
MBAA monobromoacetic acid
MBAAFP monobromoacetic acid formation potential
MGD million gallons per day
MLSS mixed liquor suspended solids
MRL minimum reporting level
MTBE methyl tert-butyl ether
NDMA N-nitrosodimethylamine
NH3 ammonia
NH3-N ammonia nitrogen
NO2-N nitrite nitrogen
NO3-N nitrate nitrogen
NOx-N nitrite and nitrate nitrogen
NOM natural organic matter
NPDES National Pollutant Discharge Elimination System
O/A Oxic-anoxic
OUR oxygen utilization rate
PAC powdered activated carbon
PRAM polarity rapid assessment method
SCE-UA shuffled complex evolution – University of Arizona
SDS simulated distribution system
SMP soluble microbial products
SPE solid phase extraction

155
SRT solid retention time
SUVA specific ultraviolet absorbance
TCAA trichloroacetic acid
TCAAFP trichloroacetic acid formation potential
TCAN trichloroacetonitrile
TCANFP trichloroacetonitrile formation potential
TCM trichloromethane
TCP 1,1,1-trichloro-2-propanone
TCPFP 1,1,1-trichloro-2-propanone formation potential
TF/MLE Trickling filter and modified Ludzack-Ettinger process
THM trihalomethane
THMFP trihalomethane formation potential
TKN total Kjeldahl nitrogen
TOC total organic carbon
UAP utilization-associated products
UFC uniform formation condition
USEPA United States Environmental Protection Agency
UV ultraviolet absorbance
UV254 ultraviolet absorbance at 254 nm
VFA volatile fatty acid
WWTP wastewater treatment plant

156
VITA
Hao Tang
EDUCATION
Ph.D. in Environmental Engineering, Penn State University, University Park, PA. 2011
M.S. in Environmental Engineering, Penn State University, University Park, PA. 2008
B.S. in Water Supply and Drainage Engineering, Hunan University, Changsha, China. 2004
EXPERIENCE
Graduate Research Assistant, Penn State University, University Park, PA. Jan. 2005 to Aug 2011.
Visiting Scholar, University of Massachusetts, Amherst, MA. May 2011 to Jun 2011.
AWARDS
Student Research Award, Pennsylvania Water Environment Association, 2010.
2nd
Place Award in poster contest, Pennsylvania American Water Works Association, 2010
Student Research Award, Pennsylvania Water Environment Association, 2006.
2nd
Place Award in poster contest, Pennsylvania American Water Works Association, 2006
Scholarship Award, Hunan University, 2001-2004
3rd
Place Award in speech contest, Hunan University, 2003
PUBLICATIONS
1. Tang, H., Regan, J.M., Clark, S.E. and Xie, Y.F. 2011. Prediction of clean-bed head loss in
crumb rubber filters. Journal of Environmental Engineering. 137(1): 55-62.
2. Tang, H., Regan, J.M., Chen, Y.-C. and Xie, Y.F. 2011. Impact of wastewater treatment
processes on disinfection byproduct formation potential in treated wastewater. Proceedings
of AWWA 130th Annual Conference, Washington, DC.
3. Tang, H., Chen, Y-C. and Xie, Y.F. 2011. Quantification of disinfection by-product formation
potential in wastewater. Proceedings of IWA Micropol & Ecohazard 2011 Conference, Sydney,
Australia.
4. Tang, H. and Xie, Y.F. 2010. Tertiary wastewater denitrification by crumb rubber filtration
(Extended abstract). Keystone Water Quality Manager, Oct-Dec: 54.
5. Tang, H. 2008. Development and calibration of a conceptual activated sludge based MBR
model for wastewater treatment. Proceedings of Penn State College of Engineering Research
Symposium 2008, State College, PA.
6. Tang, H., Regan, J.M. and Xie, Y.F. 2007. DBP precursors removal by membrane bioreactors.
Proceedings of Penn State College of Engineering Research Symposium 2007, State College, PA.
7. Tang, H. and Xie, Y.F. 2006. Membrane bioreactor technology for wastewater reuse
(Extended abstract). Keystone Water Quality Manager, Oct-Dec: 34.
PROFESSIONAL AFFILIATIONS
American Water Works Association (AWWA)
American Society of Civil Engineers (ASCE)
Water Environment Federation (WEF)
Association of Environmental Engineering and Science Professors (AEESP)
Chinese-American Professors in Environmental Engineering and Science (CAPEES)