Disinfection By-products Formation after Coagulation of ...
109
Western University Western University Scholarship@Western Scholarship@Western Electronic Thesis and Dissertation Repository 2-8-2017 12:00 AM Disinfection By-products Formation after Coagulation of Algal Disinfection By-products Formation after Coagulation of Algal Extracellular and Intracellular Organic Matters Extracellular and Intracellular Organic Matters Tianyiru Chen, The University of Western Ontario Supervisor: Dr. Madhumita Ray, The University of Western Ontario A thesis submitted in partial fulfillment of the requirements for the Master of Engineering Science degree in Chemical and Biochemical Engineering © Tianyiru Chen 2017 Follow this and additional works at: https://ir.lib.uwo.ca/etd Part of the Biochemical and Biomolecular Engineering Commons, and the Environmental Engineering Commons Recommended Citation Recommended Citation Chen, Tianyiru, "Disinfection By-products Formation after Coagulation of Algal Extracellular and Intracellular Organic Matters" (2017). Electronic Thesis and Dissertation Repository. 4410. https://ir.lib.uwo.ca/etd/4410 This Dissertation/Thesis is brought to you for free and open access by Scholarship@Western. It has been accepted for inclusion in Electronic Thesis and Dissertation Repository by an authorized administrator of Scholarship@Western. For more information, please contact [email protected].
Transcript of Disinfection By-products Formation after Coagulation of ...

Western University Western University
Scholarship@Western Scholarship@Western
Electronic Thesis and Dissertation Repository
2-8-2017 12:00 AM
Disinfection By-products Formation after Coagulation of Algal Disinfection By-products Formation after Coagulation of Algal
Extracellular and Intracellular Organic Matters Extracellular and Intracellular Organic Matters
Tianyiru Chen, The University of Western Ontario
Supervisor: Dr. Madhumita Ray, The University of Western Ontario
A thesis submitted in partial fulfillment of the requirements for the Master of Engineering
Science degree in Chemical and Biochemical Engineering
© Tianyiru Chen 2017
Follow this and additional works at: https://ir.lib.uwo.ca/etd
Part of the Biochemical and Biomolecular Engineering Commons, and the Environmental Engineering
Commons
Recommended Citation Recommended Citation Chen, Tianyiru, "Disinfection By-products Formation after Coagulation of Algal Extracellular and Intracellular Organic Matters" (2017). Electronic Thesis and Dissertation Repository. 4410. https://ir.lib.uwo.ca/etd/4410
This Dissertation/Thesis is brought to you for free and open access by Scholarship@Western. It has been accepted for inclusion in Electronic Thesis and Dissertation Repository by an authorized administrator of Scholarship@Western. For more information, please contact [email protected].

i
Abstract
Algal organic matter (AOM) is found in high concentration during algal bloom season in
drinking water systems, which is generally categorized into extracellular organic matter
(EOM) and intracellular organic matter (IOM). These compounds are not well removed in
traditional water treatment methods such as coagulation, and are the precursors of subsequent
disinfection by-products (DBPs) during chlorination of water. In this study, EOM and IOM
content of four different algae were quantified measuring dissolved organic carbon (DOC),
UV absorbance at 254 nm and turbidity. Coagulation using alum (Al2(SO4)3•16H2O) was
used to remove the algal matters. UV radiation and post-UV chlorination were used to
determine the DBPs formation potential of the algal matters. The DBPs such as
trihalomethanes (THMs) and Haloacetic acids (HAAs) were analyzed after disinfection
treatment. The DBPs formation decreased in coagulated algae. Compared with EOM, IOM
produced more DBPs because of higher content of protein and aromatic organic matters.
Keywords
Algae, extracellular organic matter, intracellular organic matter, coagulation, disinfection by-
products (DBPs), haloacetic acids (HAA), trihalomethanes (THMs)

ii
Acknowledgments
I want to thank my advisors, colleagues, friends and family, who helped me during
my studies in Western University.
I extend my deepest gratitude to my mentor, Dr. Madhumita Ray, whose expertise
and passion led me into the exciting field. I really appreciate all her mentorship and patience.
She is also open-minded and supportive of my career choice.
To my very closest friends and colleagues in Dr. Madhumita Ray’s research group. I
am thankful to have had your companionship and advice. Many thanks to Xian Hu,
especially, my lab mate, who helped me to get through tough times. I am also grateful to
Ziming Zhao, Jing Wan and Ying Zhang, for their assistance in the lab on my research. I
would like to thank Dr. Amarjeet Bassi, and the students in his research group namely
Timothy Ian Metke and David Lee for providing algae cultures.
I also want to thank all my friends in or out of lab who spent fun times with me
travelling around, playing board games, or simply sitting in the summer sun. I cannot name
them all, but their names are in my memory forever. May our friendship continue.
I am extremely thankful and fortunate for the sacrifice and support by my parents,
Jian Chen and Yanjun Xu, who taught me the values of independence and optimism so that I
could study abroad by myself. Without their love and support, I could not have achieved any
of my personal goals. Special thanks to my mom, who is rational and always supports my
decisions unconditionally.
It is all the love, help, and support from my mentor, friends, and family that got me through
so many hurdles in my studies.

iii
Table of Contents
Abstract ...................................................................................................................................... i
Acknowledgments ..................................................................................................................... ii
Table of Contents ..................................................................................................................... iii
List of Tables ............................................................................................................................ v
List of Figures .......................................................................................................................... vi
List of Appendices ................................................................................................................... ix
List of Acronyms ...................................................................................................................... x
Chapter 1 ................................................................................................................................... 1
1 Introduction ........................................................................................................................ 1
1.1 Objectives .................................................................................................................... 3
1.2 Thesis Overview .......................................................................................................... 4
Chapter 2 ................................................................................................................................... 5
2 Literature Review ............................................................................................................... 5
2.1 Introduction of Algae ................................................................................................... 5
2.2 Algae Organic Matter .................................................................................................. 7
2.2.1 Introduction ........................................................................................................... 7
2.2.2 Separation of IOM and EOM Solutions ................................................................ 7
2.2.3 Algal Problems ...................................................................................................... 8
2.3 Drinking Water Treatment Process ........................................................................... 10
2.3.1 Pretreatment Process ........................................................................................... 10
2.3.2 Disinfection Treatment ........................................................................................ 13
2.3.3 Disinfection By-Product (DBP) Analysis ........................................................... 23
2.4 The Importance of This Study ................................................................................... 31
Chapter 3 ................................................................................................................................. 33
3 Materials and Methods ..................................................................................................... 33
3.1 Experimental Materials .............................................................................................. 35
3.1.1 Algae Suspensions ............................................................................................... 35

iv
3.1.2 Chemical Reagents .............................................................................................. 35
3.2 Experimental and Analytical Methods ...................................................................... 37
3.2.1 Algae Growth ...................................................................................................... 37
3.2.2 Separation of IOM and EOM .............................................................................. 38
3.2.3 Pre-treatment: Coagulation ................................................................................. 39
3.2.4 Disinfection Treatment: UV Treatment .............................................................. 41
3.2.5 Disinfection Treatment: Chlorination ................................................................. 44
3.2.6 Water Quality Parameters Analysis .................................................................... 45
3.2.7 DBP Analysis ...................................................................................................... 45
Chapter 4 ................................................................................................................................. 48
4 Results and Discussions ................................................................................................... 48
4.1 Initial Water Parameters of EOM and IOM solutions ............................................... 48
4.2 Coagulation Effects ................................................................................................... 52
4.2.1 Coagulation Effects on Turbidity ........................................................................ 52
4.2.2 Coagulation Effects on UV254 and DOC ............................................................. 54
4.3 Effects of Disinfection on EOM and IOM ................................................................ 59
4.3.1 Effects on UV254 and DOC .................................................................................. 59
4.3.2 DBPs Formation Potential ................................................................................... 65
Chapter 5 ................................................................................................................................. 72
5 Conclusions and Future Directions .................................................................................. 72
5.1 Conclusions ................................................................................................................ 72
5.2 Future Directions ....................................................................................................... 72
References ............................................................................................................................... 74
Appendices .............................................................................................................................. 91
Curriculum Vitae .................................................................................................................... 98

v
List of Tables
Table 2.1 List of common algae observed in drinking water sources ...................................... 6
Table 2.2 Comparison of different chemical coagulants ........................................................ 13
Table 2.3 Estimated radiation time to inactivate some common microorganisms with a
dosage of 30,000 µW-s/cm2 at UV 254 nm ............................................................................ 18
Table 2.4 UV Dose of 4-log Inactivation for some common pathogens at 254 nm ............... 19
Table 2.5 Comparisons of Drinking Water Standards on DBPs (THMs) ............................... 24
Table 2.6 Comparisons of Drinking Water Standards on DBPs (HAAs) ............................... 25
Table 2.7 Comparisons of Drinking Water Standards on DBPs ............................................. 26
Table 3.1 Characteristics of the four strains used in the experiments .................................... 35
Table 3.2 Media and initial cell counts of the algaes .............................................................. 37
Table 4.1 Initial Water Parameters of EOM and IOM Solution (Green Algae) ..................... 48
Table 4.2 Initial Water Parameters of EOM and IOM Solution (Diatom) ............................. 49

vi
List of Figures
Figure 2.1 Typical flow of drinking water purification treatment process ............................. 10
Figure 2.2 Size range of particles of concern in water treatment ........................................... 11
Figure 2.3 The chain of DNA and RNA attacked by UV ....................................................... 15
Figure 2.4 The UV absorption spectra of DNA and RNA ...................................................... 15
Figure 2.5 The output of low-pressure UV lamp .................................................................... 16
Figure 2.6 The output of high-pressure UV lamp ................................................................... 17
Figure 3.1 Experimental procedures ....................................................................................... 33
Figure 3.2 Experimental procedures of the separation of EOM and IOM .............................. 39
Figure 3.3 Coagulation setup .................................................................................................. 40
Figure 3.4 UV bench-scale apparatus ..................................................................................... 41
Figure 3.5 Collimated beam circle .......................................................................................... 42
Figure 4.1 The comparison of UV absorbance (cm-1) at 254 nm for the four different algae
cultures .................................................................................................................................... 51
Figure 4.2 The comparison of DOC (mg/L) for the four different algae cultures .................. 51
Figure 4.3 Turbidity (NTU) variations of EOM (A) and IOM (B) for four algae cultures after
coagulation with the coagulants range from 0 – 60 mg/L and settling time of 2 h at room
temperature (20 ± 2 °C). (Standard deviations of triplicate experiments are represented by the
error bars.) ............................................................................................................................... 53
Figure 4.4 DOC (mg/L) variations of EOM (A) and IOM (B) for four algae cultures after
coagulation with the coagulants range from 0 – 60 mg/L and settling time of 2 h at room
temperature (20 ± 2 °C). (Standard deviations of triplicate experiments are represented by the
error bars.) ............................................................................................................................... 55

vii
Figure 4.5 DOC removal (%) (with a coagulant dose of 20 mg/L) and average DOC removal
(%) (with a coagulant dose of 30 mg/L, 40 mg/L, 50 mg/L, and 60 mg/L) of EOM and IOM
for four algae cultures after coagulation with settling time of 2 h at room temperature (20 ±
2 °C). (Standard deviations of triplicate experiments are represented by the error bars.) ...... 57
Figure 4.6 UV254 (cm-1) variations of EOM (A) and IOM (B) for four algae cultures after
coagulation with the coagulants range from 0 – 60 mg/L and settling time of 2 h at room
temperature (20 ± 2 °C). (Standard deviations of triplicate experiments are represented by
error bars.) ............................................................................................................................... 58
Figure 4.7 UV254 (cm-1) variations of EOM (A) and (B), as well as IOM (C) and (D) for four
types of algae before and after disinfection with and without coagulation. coagulant dosage =
60 mg/L, pH = 8.0 ± 0.2, UV dose: 40 mJ/cm2, chlorine dose: Cl2: DOC = 1.8, temperature:
20 ± 2 °C, incubation time: 24 h. (Standard deviations of triplicate experiments are
represented by the error bars.) ................................................................................................ 61
Figure 4.8 DOC (mg/L) variations of EOM (A) and (B), as well as IOM (C) and (D) for four
types of algae before and after disinfection with and without coagulation. coagulant dosage =
60 mg/L, pH = 8.0 ± 0.2, UV dose: 40 mJ/cm2, chlorine dose: Cl2: DOC = 1.8, temperature:
20 ± 2 °C, incubation time: 24 h. (Standard deviations of triplicate experiments are
represented by the error bars.) ................................................................................................ 64
Figure 4.9 Pathway of chloroform formation via haloform reaction (ketoenol functional
groups) .................................................................................................................................... 66
Figure 4.10 Possible pathways of chloroform and HAAs formation via haloform reaction
(activated aromatic ring) ......................................................................................................... 67
Figure 4.11 THMs formation (ppb) of EOM (A) and IOM (B) for C. Vulgaris and P.
Tricomutum after disinfection with and without coagulation. coagulant dosage = 60 mg/L, pH
= 8.0 ± 0.2, UV dose: 40 mJ/cm2, chlorine dose: Cl2: DOC = 1.8, temperature: 20 ± 2 °C,
incubation time: 24 h. (Standard deviations of triplicate experiments are represented by the
error bars.) ............................................................................................................................... 69

viii
Figure 4.12 HAAs formation (ppb) of EOM (A) and IOM (B) for C. Vulgaris and P.
Tricomutum after disinfection with and without coagulation. coagulant dosage = 60 mg/L, pH
= 8.0 ± 0.2, UV dose: 40 mJ/cm2, chlorine dose: Cl2: DOC = 1.8, temperature: 20 ± 2 °C,
incubation time: 24 h. (Standard deviations of triplicate experiments are represented by the
error bars.) ............................................................................................................................... 70

ix
List of Appendices
Figure A-1 Growth of four different algae at Western University ......................................... 91
Figure A-2 Coagulation jar test setup ..................................................................................... 91
Figure A-3 UV bench-scale apparatus .................................................................................... 92
Figure A-4 Water sample exposed under collimated beam .................................................... 92
Figure A-5 Collimated beam UV calibration spreadsheets-step (a) ....................................... 93
Figure A-6 Collimated beam UV calibration spreadsheets-step (b) ....................................... 93
Figure A-7 Chlorination bottle with PTFE cap and aluminum foil ........................................ 94
Figure B-1 Calibration Curve of Chloroform ......................................................................... 95
Figure B-2 Calibration Curve of Bromoform ......................................................................... 95
Figure B-3 Calibration Curve of Bromodichloroform ............................................................ 96
Figure B-4 Calibration Curve of MBAA ................................................................................ 96
Figure B-5 Calibration Curve of DCAA ................................................................................. 97
Figure B-6 Calibration Curve of TCAA ................................................................................. 97

x
List of Acronyms AOM Algal Organic Matter BDCM BCAA
Bromodichloromethane Bromochloroacetic Acid
CH Chloral Hydrate DBAA DBCM
Dibromochloromethane Dibromoacetic Acid
DBP Disinfection By-products DCAA Dichloroacetic Acid DW Deionized Water DOC Dissolved Organic Carbon DPD N,N-Diethyl-l,4-Phenylenediamine Sulfate ECD Electron Capture Detector EEM Excitation Emission Matrix EOM Extracellular Organic Matter FAS Ferrous Ammonium Sulfate FTIR Fourier Transform infrared
spectrophotometer GC Gas Chromatography HAAs Haloacetic Acids HANs Haloacetonitriles HK Halolcetones IOM Intracellular Organic Matter LC Liquid chromatography MBAA Monobromoacetic Acid MCLs Maximum Contaminant levels MS Mass Spectrometry MTBE Methyl Tert-Butyl Ether MW Molecular Weight NMR Nuclear Magnetic Resonance NOM Natural Organic Matter NTU Nephelometric Turbidity Units PHA Polyhydroxyphenolic Acid POC Particulate Organic Carbon SNWD South to North Water Diversion SUVA Specific Ultraviolet Absorbance TBM TCAA TCM
Bromoform Trichloroacetic Acid Chloroform
TCNM Trichloronitromethane TOC Total Organic Carbon THMs Trihalomethanes USEPA United States Environmental Protection
Agency UV254 Ultraviolet Absorbance at 254 nm WTP Water Treatment Plant

1
Chapter 1
1 Introduction
Algae are aquatic and photosynthetic microorganisms which utilize nitrogen, phosphorus,
sunlight, carbon dioxide as well as water to produce biomass (Pivokonsky et al. 2015).
The most commonly found algae in drinking water sources are green algae, blue-green
algae, diatoms, euglenoids, dinoflagellates, cryptomonads, yellow-green algae, and
golden algae (Knappe et al. 2004).
Algal bloom has been defined as a visible accumulation of algal biomass (Reynolds &
Walsby 1975). Temperature, light exposure and trophic status of aquatic system are the
three major factors that favor the formation of algal bloom (Merel et al. 2013). Since
algae are primarily phototrophic microorganisms, groundwater resources are not as
vulnerable to algal bloom as surface waters. Algal organic matter (AOM) is found in high
concentration during algal bloom season in drinking water systems, and it affects the
drinking water quality as one of the substantial contributors to natural organic matter
concentration (NOM) (Pivokonsky et al. 2015). Algal organic matter (AOM) is generally
categorized into extracellular organic matter (EOM) (Zheng et al. 2016), which is
excreted to surrounding environment by living algae cells. Intracellular organic matter
(IOM) is released mainly in stationary and declining growth phase, or during cell rupture
and lysis (Pivokonsky et al. 2015). These organic substances are comprised of various
compounds such as oligosaccharides, polysaccharides, proteins, peptides, amino acids, as
well as other traceable organic acids (Pivokonsky et al. 2015). The composition of
different algal matter varies with algae species (Hong et al. 2008).
Drinking water treatment began in the early 1900s, which mainly includes pretreatment
and disinfection processes. The aim of pretreatment is to remove colloid contents and
suspended solids, while the main purpose of disinfection is to kill microbial pathogens in
water to prevent the spread and prevalence of waterborne infectious diseases
(WolrdChlorineCouncil 2008). The disinfection process not only kills pathogens, but also
act as an oxidizing agent to remove taste, color, iron oxide and manganese of drinking

2
water, to improve coagulation and filtration efficiency, to prevent the growth of algae on
the bottom of sedimentation tanks and filters as well as the regrowth of organisms in
drinking water distribution systems (USEPA 1999a)(Wang et al. 2014)(SDWF 2012).
During drinking water disinfection process, oxidation, addition and substitution reactions
occur between disinfectant and natural organic matters (NOMs) such as humic and fulvic
acids and algal matter, as well as bromide or iodide in source water, which produce
disinfection by-products (DBPs). Since the time trihalomethanes (THMs) were found in
the 1970s, more than 600 different DBPs have been identified. Most DBPs compounds
have potential carcinogenicity, teratogenicity, and mutagenicity (Zhao et al. 2012;
Hutzinger et al. 2011; Pan & Zhang 2013). After years of research, quantitative
information of a few DBPs has been revealed.
AOM is rich in organic nitrogen and organic carbon compared with NOM, which causes
the formation of more DBPs during disinfection treatment (Lui et al. 2012). The level of
DBPs formation may vary considerably with algae species, the genus, the algal cells, the
algal growth, biochemical composition and the applied conditions of disinfection
treatment (Lv et al. 2014; Liang et al. 2012; Li et al. 2012; Lui et al. 2012; Lui et al.
2011; Huang et al. 2009). Up to now, the details of DBPs formation from IOM and EOM
solutions for different algae are still very limited.

3
1.1 Objectives
a) To determine the amount of EOM and IOM from four different commonly found
species of algae commonly found in surface water.
b) To determine the efficiency of a common coagulant in removing algal matter.
c) To determine the impact of different drinking water treatment methods, such as UV
radiation and post-UV chlorination on the formation of DBP for EOM and IOM.

4
1.2 Thesis Overview
There are five chapters in this thesis. A brief introduction of the research topic and
objectives is provided in Chapter 1. Chapter 2 presents the literature review related to the
pertinent research. The brief introduction of algae and algal organic matters, bloom
problems from algae, drinking water treatment processes and DBP formation is presented
in this chapter. Chapter 3 contains the experimental methods and analysis methods. The
results and discussions are presented in Chapter 4. The conclusions and future directions
are discussed in Chapter 5.

5
Chapter 2
2 Literature Review
2.1 Introduction of Algae
Algae are aquatic and photosynthetic microorganisms which utilize nitrogen, phosphorus,
sunlight, carbon dioxide as well as water to produce biomass (Pivokonsky et al. 2015).
Traditionally, algae are classified by the pigments and structure of their cells. For
example, green algae are named after the grass-green shade while diatoms are brown in
color (Fang, Ma, et al. 2010). The most commonly found algae in drinking water sources
are green algae, blue-green algae, diatoms, euglenoids, dinoflagellates, cryptomonads,
yellow-green algae, and golden algae (Knappe et al. 2004).

6
Table 2.1 List of common algae observed in drinking water sources
Algae species Characteristics Growth Condition
Typical genera
Blue-‐Green Algae
Prokaryotes Contains phycocyanin, allophycocyanin and chlorophyll a, which gives blueor blue-‐green color. Produce cyanotoxins, perform oxygenic photosynthesis
Warm, eutrophic water, above 25 °C
Anabaena, Aphanizomenon, Microcystis and Oscillatoria
Green Algae Contains chlorophyll a and b, green color. Some genera are associated with taste and odor and filter clogging problems
Summer Ankistrodesmus, Chlamydomonas, Chlorella, Scenedesmus
Euglenoids Contains chlorophyll a and b, green color, capable of photosynthesis
Summer
Dinoflagellates Capable of photosynthesis and feeding on bacteria and small planktonic algae. Brownish color, some genera are commonly associated with taste and odor problems 90% are found in ocean.
Summer and fall
Ceratium, Peridinium
Cryptomonads Contains chlorophyll a and c2, and many pigments that mask the color of chlorophyll. May appear blue, blue-‐green, reddish, yellow-‐brown, olive-‐green. Light sensitive and prefer nutrient-‐enriched water.
Temperate climate throughout winter
Cryptomonas, Chroomonas, Rhodomonas
Yellow-‐Green Algae
Rarely present in large quantities Contains chlorophyll a β-‐carotene, and many pigments, appears yellow-‐green, bright green
Low temperature
Tribonema
Golden Algae Synura, Dinobryon are commonly associated with taste and odor problems. Appears golden-‐brown Photosynthesis and feed on bacteria
Summer Synura, Dinobryon
Diatom Commonly associated with taste and odor and filter clogging problems. Appear in brown color Siliceous cell wall consists of polymerized silicic acid. Can perform oxygenic photosynthesis at water temperature of 5°C
Spring Optimum temperature at 10-‐20 °C
Asterionella, Cyclotella, Fragilaria Melosira

7
2.2 Algae Organic Matter
2.2.1 Introduction
Algal organic matter (AOM) is released into water as algal photosynthesis and secondary
metabolism by-products. AOM is generally categorized into intracellular organic matter
(IOM)(Pivokonsky et al. 2015) released mainly in stationary and declining growth phase,
and extracellular organic matter (EOM) (Zheng et al. 2016) excreted to surrounding
environment by living algae cells. These organic substances are comprised of various
compounds such as oligosaccharides, polysaccharides, proteins, peptides, amino acids, as
well as other traceable organic acids (Pivokonsky et al. 2015). Hong et al gave a general
overview of major constituents of different algae species (Hong et al. 2008), which shows
that the composition of different algal matter varies with algae species. Villacorte et al
have studied different characteristics of three bloom-forming algae: growth, cell
concentration and mechanism of AOM release (L O Villacorte et al. 2015).
Both EOM and IOM are hydrophilic with low SUVA (Pivokonsky et al. 2015).
Compared with EOM, IOM is richer in proteins or peptide, more hydrophilic and have
lower SUVA value. MW fractionation shows that both EOM and IOM of green algae and
diatom contain large portions of low-MW (below 1 k Da) compounds and high-MW
(over 100 k Da) polysaccharides (Pivokonsky et al. 2006). According to Fang et al, the
MW of organic carbon in EOM and IOM is relatively lower compared with natural
organic matters. EOM and IOM are both rich in organic nitrogen. IOM has a higher
fraction of total organic nitrogen, higher fractions of free amino acids but lower fractions
of aliphatic amines than EOM (Fang, Yang, et al. 2010).
2.2.2 Separation of IOM and EOM Solutions
All the methods to separate IOM and EOM are quite similar to each other. Basically,
EOM remains in the solution after the filtration of algae solution, after which, some
procedures such as freeze/thaw cycles and physically grinding are used to kill the algae to
release IOM. Then filtration is used again to get EOM. However, the size of filtration
film, centrifugal speed and time, as well as the times of freeze/thaw cycles sometimes
vary with different algae species.

8
For a blue-green algae M. aeruginosa and a diatom Cyclotella meneghiniana, EOM can
be extracted by first centrifuging the cells in growth phase at 10,000g for 10 min, then
subsequently filtering the supernatant with 0.7 mm GF/F glass fiber filters
(Whatman)(Zhou et al. 2014). Subsequently, the deposited algal cells are collected and
washed 3 times with 100 mL Milli-Q water (Fang et al. 2010). To obtain IOM,
freeze/thawing (−18 °C /25 °C) cycles can be used to kill the cells to release the
intracellular materials. After 3 cycles, ultrasonic treatments (500 W, 20 min, 2 s/2 s),
centrifugation and filtration were conducted to extract the organic matter as IOM solution
(Li et al. 2012; Li et al. 2014). Grinding is another way to kill algae cells to extract IOM.
By physically grinding the cells with a mortar and pestle in Milli-Q water, IOM was
extracted, which was also followed by filtration through a GF/F membrane (Fang et al.
2010). For another blue-green algae, anabaena flos-aquae, a different 0.45mm membrane
was used to separate EOM and algae cells (Huang et al. 2009). All samples need to be
adjusted to pH 7.0 ± 0.1 with KH2PO4 and Na2HPO4 (Liao et al. 2015).
2.2.3 Algal Problems
Algal bloom has been defined as a visible accumulation of algal biomass (Reynolds &
Walsby 1975). Most algae prefer flowing water. Merel et al have summarized three major
factors that favor the formation of algal bloom: Temperature, light exposure and trophic
status of aquatic system (Merel et al. 2013). Since algae are primarily phototrophic
microorganisms, groundwater resources are not as vulnerable to algal bloom as surface
waters.
Over the years, big blooms have been observed via satellite in the lower Great Lakes
since mid-1990s (Becker et al. 2009). In 2011, the western basin of Lake Erie
experienced the largest blooms since 2002 (Bridgeman et al. 2013). The blooms,
extending over 5,000 kilometer squares (Michalak et al. 2013), have led to the closure of
beaches and drinking water advisories in both Canada and US (Pick 2016).
Blue-green algae, are one of the most problematic algae in drinking water system because
of releasing algal toxins (Jančula & MarŠálek 2011). Diatom species such as Pseudo-
nitzschia are also very harmful. It was reported that the neurotoxin domoic acid produced

9
by Pseudo-nitzschia has killed at least three elderly people and led to at least over 100
illnesses in 1987 in North America(Lelong et al. 2012). Lelong et al. have published a
critical review paper concerning a list of diatom species, their worldwide distribution,
toxins produced and records of diatom blooms around the world (Lelong et al. 2012). A
marine diatom species Chaetoceros affinis, has been used to investigate the mechanism
and compositions of its releasing organic matters (L. O. Villacorte et al. 2015), and nano-
mechanical properties (Gutierrez et al. 2016), as well as potential fouling and removal
rate of its organic matters ( Tabatabai et al. 2014).
Wang et al. have conducted both fields and laboratory experiments on diatoms to
understand the mechanisms of blooms, the effects of varying phosphorus concentration
and hydrodynamics on the growth (Wang et al. 2012). About 16 taxa were found to be
dominant among various diatoms. Among them, Cyclotella meneghiniana was the
predominant species (Ai et al. 2015). It is also reported that Aulacoseira granulata,
Asterionella formosa and Synedra spp. co-dominated in succession with C. meneghiniana
in winter and spring (Ying et al. 2015)(Ai et al. 2015).
Algal organic matter (AOM) is found in high concentration during algal bloom season in
drinking water systems, and it affects the drinking water quality as one of the substantial
contributors to natural organic matter concentration (NOM) (Pivokonsky et al. 2015).
When compared to NOM, AOM appears to contain more organic nitrogen, more
hydrophilic content, less aromatic carbon content and have much lower specific UV
absorbance (SUVA < 2L/mg/m) (Fang, Yang, et al. 2010). It may be problematic when
AOM enters into drinking water treatment systems, because it can increase coagulant
demands, foul membranes, and produce disinfection by-product (DBPs) during
chlorination. Traditional water treatment processes such as coagulation and filtration
poorly remove the AOM (Cheng et al. 2015).

10
2.3 Drinking Water Treatment Process
The flow diagram for a typical drinking water treatment plant is shown below (Figure
2.1). In drinking water treatment processes, the main purpose of pretreatment is to
remove the colloid contents, suspended solids, microorganism and heavy metals in the
raw water, whilst disinfection is mainly used to remove viruses, bacteria and
microorganisms (Environmental Ptotection Agency (Ireland) 2013; Bao et al. 2006; Jin et
al. 2011).
Figure 2.1 Typical flow of drinking water purification treatment process
(Figure Reference)
2.3.1 Pretreatment Process
Typically, the pretreatment process includes coagulation, flocculation, sedimentation and
filtration. The objectives of pretreatment are mainly to remove suspended solids and
colloidal impurities to decrease turbidity (Koohestanian et al. 2008). The size ranges of
various suspended and colloidal particles are shown in Figure 2.2 (Koohestanian et al.
2008).

11
Figure 2.2 Size range of particles of concern in water treatment
Typical coagulants used in water treatment include metal salts and polymers class.
Commonly used chemical coagulants are metal ions such as A13+, Fe3+ and Zn2+
(Ghernaout et al. 2014; Alizadeh Tabatabai et al. 2014; Cheng et al. 2015). The
coagulants are added into raw water to neutralize the negative charges of colloids
preventing electrostatic repulsion between particles (Xie et al. 2016). The neutralized
suspended particles and colloids tend to agglomerate and form bigger particles (Lin et al.
2015). These large particles are settled in the sedimentation tank by gravity separation.
Filtration is mainly used after the coagulation and sedimentation process, to further
reduce the turbidity of the water. The effective coagulation, sedimentation and filtration,
are able to reduce the turbidity of water, to remove some of the organic matters, bacteria
and virus in water ( Tabatabai et al. 2014; Cheng et al. 2015).
Depending on the quality of the raw water, some other treatment methods may also be
added or eliminated. For instance, sediment pre-sedimentation tank or sedimentation tank
often needs to be used when dealing with high turbidity raw water. On the other hand,
sedimentation tank even be spared if the turbidity of the raw water is very low, and in that
case filtration can be directly used after the addition of coagulants. However, filtration is
a very essential part in most drinking water treatment processes.

12
The surface of algae cells exhibits negative charge (Vandamme et al. 2013), so the
positively charged coagulants can be strongly adsorbed on the surface of algae cells,
neutralizing the surface charge and eliminate cell-based electrostatic effect. At some
specific pH, the metal ions in coagulants can form insoluble substances such as
Al(OH)3(s), Fe(OH)3(s) and Zn(OH)2(s). These insoluble substances can wrap the algae
cells network to achieve coagulation. In addition, A13+, Fe3+ and other metal salts can
form [Al(OH)3]n, [Fe(OH)3]n and other polymers, which can connect two or more algae
cells in the form of adsorption bridges to achieve coagulation. Chemical coagulation is
successfully used on removing Chlorella, Nannochloropsis, Neochloris and
Phaeodactylum. However, there are problems associated with coagulation such as high
cost and secondary pollution. The metal ions in coagulants and high polymer residues in
the water are extremely difficult to degrade, which may likely cause the secondary
pollution of the environment. The advantages and disadvantages of various chemical
coagulants are summarized in Table 2.2.

13
Table 2.2 Comparison of different chemical coagulants
Chemical Coagulation (Dosage) Algae (Cell density) Features Reference
Inorganic coagulants
Al2(SO4)3 (0.1 g/L) Fe2(SO4)3 (1 g/L)
Scenedesmus sp. (0.23 g/L) C. minutissima (2.2 x 10⁸/mL)
High efficiency, harmful to algal cells, secondary pollution
(Papazi et al. 2010; Chen et al. 2013)
Aluminium nitrate sulphate (5.4 mg/L)
N. salian (15 or 20 g/L)
High efficiency, secondary pollution
(Rwehumbiza et al. 2012)
Ammonia (38-‐120 mmol/L)
N. oculata (-‐*) C. sorokiniana (-‐) Dunaliella sp. (-‐)
High efficiency, long coagulating time, species dependent
(Chen et al. 2012)
Inorganic polymers
Poly aluminium chloride, polyacrylamide (0.1-‐0.2 g/L)
Scenedesmus sp. (~0.2-‐0.4 g/L) C. vulgaris (~0.4 g/L)
High efficiency, harmful to algal cells, risk of toxic acrylamide
(Lakaniemi et al. 2011; Chen et al. 2013; Beach et al. 2012)
Organic polymers
Chitosan (6-‐100 mg/L)
Scenedesmus sp. (~0.2-‐0.7 g/L) Chlorella sp. (0.5 g/L) N. oleoabundans (0.5 g/L)
High efficiency, high cost of coagulants
(Chen et al. 2013; Beach et al. 2012; Zheng et al. 2012)
Cationic starch (30 mg/L)
Parachlorella kessleri (0.3 g/L)
High efficiency, pH dependent
(Vandamme & Foubert 2010)
Poly g-‐glutamic acid (g-‐PGA) (~20 mg/L)
C. protothecoides (0.6 g/L) N. oculata (0.6 g/L) P. tricornutum (0.6 g/L)
High efficiency, salinity dependent
(Zheng et al. 2012)
* - data of concentration is unavailable.
2.3.2 Disinfection Treatment
Drinking water disinfection began in the early 1900s with the aim of killing microbial
pathogens in water to prevent the spread and prevalence of waterborne infectious diseases
(WolrdChlorineCouncil 2008). At present, the commonly used methods of drinking water
disinfectants are: chlorination, ultraviolet radiation, chloramine disinfection, chlorine
dioxide disinfection and ozone disinfection. Disinfectant could not only kill pathogens,
but also be as an oxidizing agent to remove taste, color, iron oxide and manganese of

14
drinking water, to improve coagulation and filtration efficiency, to prevent the growth of
algae on the bottom of sedimentation tanks and filters as well as the regrowth of
organisms in drinking water distribution systems (USEPA 1999a)(Wang et al.
2014)(SDWF 2012)
2.3.2.1 Ultraviolet Disinfection
2.3.2.1.1 UV Light
Ultraviolet (UV) rays are part of the sun light. Ultraviolet rays are divided into three
zones of UV-A, UV-B, UV-C and vacuum ultraviolet rays according to the wavelength
range: UV-A is in the range 320 - 400 nm, UV-B ranges from 275 - 320 nm, UV-C
ranges from 200 - 275 nm and vacuum ultraviolet ray ranges from 100 - 200 nm (Arenas
et al. 2016; Trang et al. 2014). The shortwave UV-C is used in water disinfection process
(Canonica et al. 2008; Sommer et al. 2008).
2.3.2.1.2 UV Absorption
According to quantum theory, light is a special form of material and a grain of particles
flow, which are not connected. Each of the 253.7 nm UV photons has energy of 4.9 eV
(Liu et al. 2009; Xu et al. 2009b; Xu et al. 2009a; Canonica et al. 2008). On the other
hand, nucleic acid is the basic material and life foundation of all living things. In essence,
nucleic acid absorbs ultraviolet energy when microorganisms are radiated (Wenhai et al.
2016; Cui et al. 2016; Wang et al. 2015). Nucleic acid is divided into RNA (RNA) and
deoxyribonucleic acid (DNA). The common point of DNA and RNA is the
phosphodiester bond by purine and pyrimidine base pairing of the principle of linking the
polynucleotide chain (Xu et al. 2009b; Cui et al. 2016; Wang et al. 2015; Bolton et al.
2003). Figure 2.3 and Figure 2.4 present the UV absorption spectra of DNA and RNA,
respectively, ranging from 240 nm to 280 nm, with maximum absorption of UV at around
260 nm (Xu et al. 2009b; Xu et al. 2009a; Canonica et al. 2008; Sommer et al. 2008;
Yuan et al. 2013; Wenhai et al. 2016; Cui et al. 2016; Wang et al. 2015; Bolton et al.
2003).

15
Figure 2.3 The chain of DNA and RNA attacked by UV
Figure 2.4 The UV absorption spectra of DNA and RNA
There are two most common forms of DNA damages, cyclobutane pyrimidine dimer
(CPD) and pyrimidine-pyrimidone photoproducts (PP). The generation of free radicals
can cause photoionization (Roccaro & Vagliasindi 2010; Roccaro & Vagliasindi 2010;
Xu et al. 2010). Once the DNA is destroyed or becomes a dimer, organism cells like
cryptosporidium are not able to perform routine cellular functions such as respiration,
absorption of food, or replication. Once the cells become inactive, the organisms die
quickly. UV is the only cost-effective disinfection option, and does not produce
carcinogenic by-products to the environment.

16
2.3.2.1.3 Determination of UV Dosage
The bactericidal effect of ultraviolet light is determined by the intensity of ultraviolet
radiation and the irradiation time. The key factor is irradiation dose, which is defined as:
UV Dose (µW-sec/cm2) = UV Intensity (µW/cm2) * Exposure Time (sec) (Bolton &
Linden 2003).
2.3.2.1.4 Types of UV lamps
In general, the central radiation wavelength of the UV lamp for water disinfection is
253.7 nm. In UV technology, there are two types of UV light currently: low pressure (LP)
and medium pressure (MP) (Andrea 2009). The low-pressure UV lamp has a
monochromatic UV spectral output (limited to 254 nm) while the medium-pressure lamp
has a multicolored UV output (output wavelengths between 185 and 400 nm) (USEPA
2006).
Figure 2.5 The output of low-pressure UV lamp

17
Figure 2.6 The output of high-pressure UV lamp
2.3.2.1.5 Irradiation UV Dosage of Microorganisms
UV inactivation efficiency is defined by how effective UV is at inactivating cells.
Usually dose-response curves are used to measure the UV inactivation efficiency (Andrea
2009). Inactivation of microorganism in a disinfection process is determined as:
Log Inactivation = log10 N0/N (Andrea 2009)
where N0 = Concentration of microorganisms before exposure to UV light
where N = Concentration of microorganisms after exposure to UV light
The estimated radiation time to inactivate some common microorganisms with dosage of
30,000 µW-s/cm2 at UV 254 nm can be found in Table 2.3 (Andrea 2009;
ChesapeakeResearch 1982; Technologies 2006; AquaTreatmentService 2006; USEPA
1991).

18
Table 2.3 Estimated radiation time to inactivate some common microorganisms with
a dosage of 30,000 µW-s/cm2 at UV 254 nm
Microorganisms 100% lethal Dosage
Microorganisms 100% lethal Dosage
Bacteria Dysentery Bacilli 0.15 Micrococcus Candidus 0.4-‐1.53 Leptospira SPP 0.2 Salmonella Paratyphi 0.41
Legionella Pneumophila 0.2 Mycobacterium Tuberculosis 0.41 Corynebacterium
Diphtheriae 0.25 Streptococcus Haemolyticus 0.45
Shigella Dysenteriae 0.28 Salmonella Enteritidis 0.51 Bacillus Anthracis 0.3 Salmonella Typhimurium 0.53 Clostridium Tetani 0.33 Vibrio Cholerae 0.64 Escherichia coli 0.36 Clostridium Tetani 0.8
Pseudomonas Aeruginosa 0.37 Staphylococcus Albus 1.23 Virus
Coxsackie Virus A9 0.08 Echovirus 1 0.73 Adenovirus 3 0.1 Hepatitis B Virus 0.73 Bacteiophage 0.2 Echovirus 11 0.75 Influenza 0.23 Poliovirus 1 0.8
Rotavirus SA 11 0.52 Tobacco Mosaic 16 Mucor Mucedo 0.23-‐
4.67 Penicillium Roqueforti 9.87
Oospara Lactis 0.33 Penicillium Chrysogenum 2.93 Aspergillus Amstelodami 0.73-‐
8.80 Aspergillus Niger 6.67
Penicillium Digitatum 0.87 Manure Fungi 8 Algae
Chlorella Vulgaris 0.93 Protozoa 4-‐6.70 Green Algae 1.22 Paramecium 7.3
Nematode Eggs 3.4 Blue-‐Green Algae 10-‐40
In addition, it is found that ultraviolet disinfection technology has a good inactivation
effect on pathogenic microorganisms such as Giardia and Cryptosporidium in recent
19
years. Cryptosporidium enters into the environment through human and animal feces (Xu
et al. 2009b; Xu et al. 2009a; Canonica et al. 2008; Sommer et al. 2008; Yuan et al. 2013;
Wenhai et al. 2016; Cui et al. 2016). They can survive in the environment for a long time.
Giardia and Cryptosporidium can live much longer than other bacteria, which can cause
multiple outbreaks of the disease. Cryptosporidium-causing disease is very dangerous,
and the general symptoms are diarrhea, vomiting, fever, flu-like symptoms. For the
patients with disabilities of immune, such as AIDS patients, the disease is even more
dangerous, sometimes leading to death. The UV doses of 4-log inactivation for some
common pathogens at 254 nm are shown in Table 2.4 (Andrea 2009;
ChesapeakeResearch 1982; Technologies 2006; AquaTreatmentService 2006; USEPA
1991).
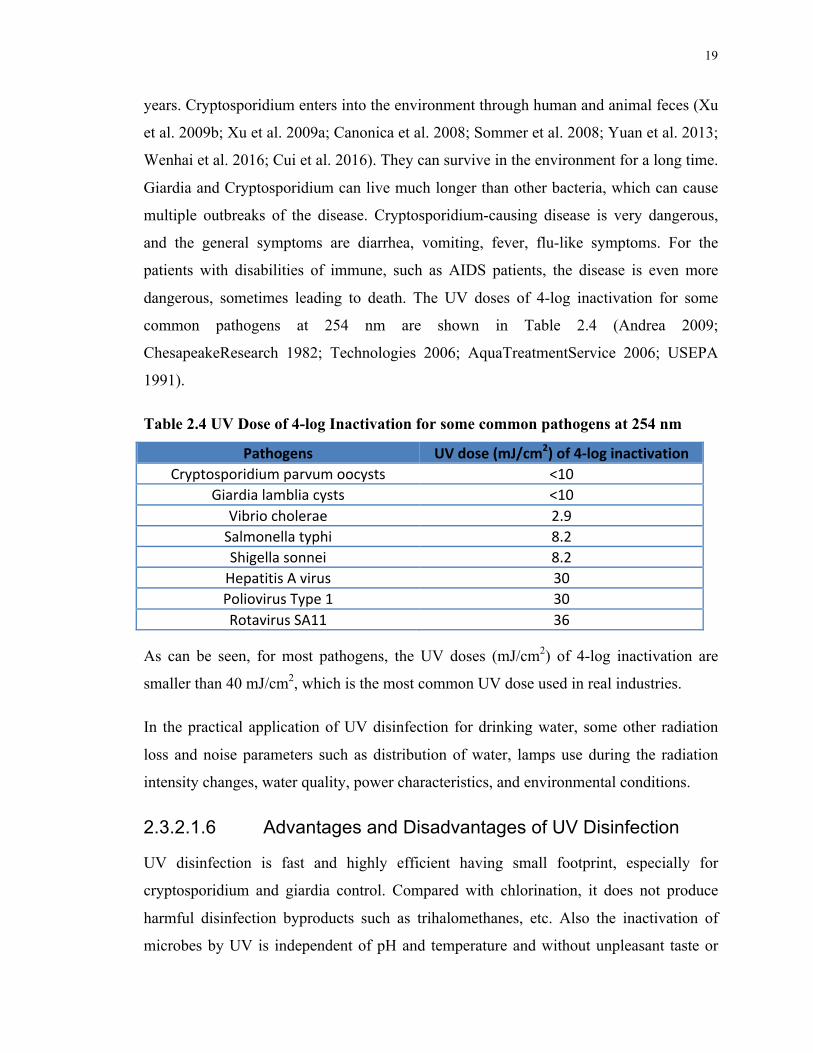
Table 2.4 UV Dose of 4-log Inactivation for some common pathogens at 254 nm
Pathogens UV dose (mJ/cm2) of 4-‐log inactivation Cryptosporidium parvum oocysts <10
Giardia lamblia cysts <10 Vibrio cholerae 2.9 Salmonella typhi 8.2 Shigella sonnei 8.2 Hepatitis A virus 30 Poliovirus Type 1 30 Rotavirus SA11 36
As can be seen, for most pathogens, the UV doses (mJ/cm2) of 4-log inactivation are
smaller than 40 mJ/cm2, which is the most common UV dose used in real industries.
In the practical application of UV disinfection for drinking water, some other radiation
loss and noise parameters such as distribution of water, lamps use during the radiation
intensity changes, water quality, power characteristics, and environmental conditions.
2.3.2.1.6 Advantages and Disadvantages of UV Disinfection
UV disinfection is fast and highly efficient having small footprint, especially for
cryptosporidium and giardia control. Compared with chlorination, it does not produce
harmful disinfection byproducts such as trihalomethanes, etc. Also the inactivation of
microbes by UV is independent of pH and temperature and without unpleasant taste or

20
odor. There is no transportation, storage or handling of chemicals. In addition, the UV
equipment is easily installed within existing water treatment facilities with low capital
and operating costs. The equipment is also very simple, and easy to operate and
manageas well as to achieve automation, which highly minimize the hazard risk for
operators. So in recent years, ultraviolet disinfection gradually has wide range of
applications. For example, in some industries such as aquaculture and food industries,
continuity of the chemical disinfectants should be avoided; otherwise it will result in
killing aquatic organisms, odor in food, and other side effects due to the influence of
chemicals.
The biggest drawback of ultraviolet sterilization is that it does not exhibit residual
disinfection capacity and is vulnerable to secondary pollution.
2.3.2.2 Chlorination Disinfection
Chlorination is the oldest and most extensive disinfection technology. It played a major
role since published in 1908 to prevent the spread of waterborne diseases. Chlorination
includes two disinfectants: liquid chlorine and sodium hypochlorite.
At present, liquid chlorine disinfection is the most cost-effective, widely used method in
drinking water disinfection process, since it is a mature technology with strong
bactericidal capacity, long duration, low cost, etc. (WolrdChlorineCouncil 2008).
Approximately 99.5 percent of the drinking water plants in China are using chlorine
disinfection process (US-EPA 2006; Standardization Administration of the People’s
Republic of China 2006). Sodium hypochlorite reduces the hazards of chlorine operation
and technical requirements, but it is possible to introduce inorganic byproducts, such as
chlorate (chlorate, ClO-3), chlorite (chlorite, ClO-2), and bromate (bromate, BrO-3)
(WolrdChlorineCouncil 2008).
Due to a long history of application of chlorination, the studies of chlorine disinfection
by-products are much deeper than others. Chlorination byproducts are mainly
trihalomethane (THMs) and haloacetic acid (HAAs) (USEPA 2011b)(US-EPA 2006).
Other chlorinated byproducts include: haloacetonitrile (HANs), cyanogen halide (XCNs),

21
halogenated acetaldehyde (HATs), halogenated phenol (HHBs), haloketones (HKs),
halogen nitro methane (HNMs), furans, halogenated hydroxy (CHFs) (Fang, Ma, et al.
2010; Zamyadi et al. 2011). In these chlorination DBPs, trihalomethanes (such as
chloroform) have already been recognized as carcinogen. From America's drinking water
safety regulations bromochloromethane, dichloroacetic acid, bromate, etc. are recognized
as suspected carcinogens. Most of the other DBPs also have general toxicity, irritation or
narcotic effect to human organs. Large number of epidemiological studies shows that
long-term consumption of chlorinated drinking water can increase the digestive and
urinary system cancer risk, which have a statistically significant correlation (Munch &
Bassett 2004; Fang, Ma, et al. 2010; US-EPA 2006; USEPA 2011a).
2.3.2.3 Chloramine Disinfection
In 1930s, DBPs from chlorination process drew more and more attention. In order to
control the concentration of THMs and HAAs in drinking water, many plants started to
improve the disinfection process from chlorination to chloramine disinfection (Water &
Centre 2007). Compared with chlorine, chloramine has higher penetration and stability,
so it is better able to prevent the microbial growth in the distribution of drinking water
supply system network; in addition, the chloramine disinfection also significantly
improves the taste and smell of water bodies (WolrdChlorineCouncil 2008). However,
due to the lower disinfection capacity of chloramine, it is often used as a secondary
disinfectant, combined with other strong oxidizing disinfectants (such as chlorine,
ozone).
The reactivity of organic compounds in water with chloramine is far below free chlorine.
Under the same conditions, DBPs generated from chloramine, especially THMs are
significantly lower than chlorinated production (WolrdChlorineCouncil 2008)(CDC
2008). However, recent studies have found that chloramine disinfection may have
generated more potential hazardous nitrogenous disinfection byproducts (N-DBPs), such
as cyanogen chloride (CCN), N-nitosodimethylamine (N-NDMA), halonitromethane
(HNMs), haloacetamides (HAMs) (USEPA 2011a; Munch & Bassett 2004; Fang, Ma, et
al. 2010).

22
2.3.2.4 Chlorine Dioxide Disinfection
ClO2 sterilization method is an efficient, fast, long-lasting, safe drinking water
disinfection method (USEPA 2006). ClO2 has a strong oxidizing power, and it is a broad-
spectrum disinfectant to effectively kill all waterborne pathogens. ClO2 does not react
with nitrogen and ammonia in water. Compared with chlorine, ClO2 has better and faster
sterilization effect with lower dosage and wider scope; the effect of pH and ammonia on
the capacity of oxidation disinfection is small; and it can also significantly improve the
color and taste of the water (WolrdChlorineCouncil 2008). However, ClO2 is a high cost
disinfection technology, limiting its real application.
ClO2 is a strong oxidant rather than chlorinating agent, which means during disinfection,
small amounts of THMs are generated compared to chlorine or chloramine disinfection.
However, ClO2 disinfection process produces more HAAs (primarily DCAA, CBAA and
DBAA). ClO2 inorganic disinfection byproducts ClO-2, ClO-3 and BrO-3 have high
potential toxicity at high-dose or high concentrations, wherein ClO-2 can cause hemolytic
anemia (Environmental Ptotection Agency (Ireland) 2013; USEPA 2011b).
2.3.2.5 Ozone Disinfection
As an alternative to chlorine disinfection, ozone disinfection in drinking water treatment
is increasingly being used. Ozone sterilization effect is achieved through biochemical
oxidation. Sterilization performance test showed that the ozone has significant
inactivation on almost all bacteria, viruses, fungi and protozoa and oocytes (USEPA
2006). At room temperature (20°C), half-life of O3 in water is only about 20 min
(Eagleton 1999; Majewski 2012); therefore, chlorine, chloramines, chlorine dioxide as
auxiliary disinfectants are needed in pipe network to maintain the disinfection ability.
Ozone sterilization effect is stronger than chlorine and chlorine dioxide. However, ozone
is extremely unstable, therefore it needs to be prepared on-site at the time of use, which
increases the investment in equipment and disinfection costs (Gordon et al. 2008). At
present, only a few companies in few countries are using ozone water disinfection
process (USEPA 1999b; Eagleton 1999; Majewski 2012).

23
As a disinfectant, ozone will not produce the halogenated DBPs. The total amount of
DBPs is also less than chlorination (WolrdChlorineCouncil 2008). The higher
concentrations of organic matter in source water, will result in a number of oxygen-
containing compounds formation, such as aldehydes, carboxylic acids, ketones, phenols,
bromate (when the source water contains higher concentrations of bromide) DBPs
(Weinberg et al. 2002). Formaldehyde can cause human nasopharyngeal cancer, nasal
sinus cancer, and cancer. Bromoacetate and chloro acetic acid have very stronger ability
of DNA damage.
2.3.3 Disinfection By-Product (DBP) Analysis
During drinking water disinfection process, oxidation, addition and substitution reactions
occur between disinfectant and natural organic matters (NOMs), such as humic acid,
fulvic acid and algal matter, as well as bromide or iodide in source water, which produce
new compounds: disinfection by-products.
Epidemiological studies have shown that long-term consumption of chlorinated drinking
water and the incidence of bladder cancer are positively correlated, which may also cause
early abortion and other side effects of reproductive system (International Agency for
Cancer Research 2002). Since trihalomethanes (THMs) were found in the 1970s, more
than 600 kinds of DBPs have been identified.
Most DBPs compounds have potential carcinogenicity, teratogenicity, and mutagenicity
(Zhao et al. 2012; Hutzinger et al. 2011; Pan & Zhang 2013). After years of research,
quantitative information of a few DBPs has been revealed. DBPs with extensive
monitoring include: trihalomethanes (THMs), haloaceticacids (HAAs), haloacetonitriles,
halo ketone, chloropicrin, trichloroacetaldehyde, cyanogen chloride, chlorite, chlorate,
bromate, glyoxal, methylglyoxal, and other aldehydes class. Accordingly, the World
Health Organization as well as relevant regulating bodies have developed limited
standards of drinking water DBPs (Table 2.5, Table 2.6, Table 2.7) (Gordon et al. 2008;
HealthCanada 2012; USEPA 2010; US-EPA 2006; Zerbe & Siepak 2001;
Standardization Administration of the People’s Republic of China 2006).

24
Table 2.5 Comparisons of Drinking Water Standards on DBPs (THMs)
All values are in units of
mg/L
THMs 1 TCM BDCM DBCM TBM
Chinese Sanitary
Standards for Drinking Water
The sum of the ratio of the concentration
of each to its respective guideline value should not
exceed 1
0.06 0.1 0.06 0.1
European Union
Directives
0.1 * * * *
National Primary Drinking Water
Regulations (USA)
0.08 * * * *
Guidelines for Drinking
Water Quality (WHO)
The sum of the ratio of the concentration
of each to its respective guideline value should not
exceed 1
0.3 0.1 0.06 0.1
Guidelines for Canadian Drinking
Water Quality
0.1 * * 0.016 *
Risk Comments
Liver effects (fatty cysts) (chloroform classified as possible carcinogen); Kidney and colorectal cancers
1: Trihalomethanes – Total (THMs): chloroform (CHCl3, TCM), dichlorobromomethane
(CHCl2Br, BDCM), dibromochloromethane (CHClBr2, DBCM) and bromoform (CHBr3,
TBM) (US-EPA 2006)
*: None required

25
Table 2.6 Comparisons of Drinking Water Standards on DBPs (HAAs)
All values are in units of mg/L
HAAs 2 DCAA TCAA
Chinese Sanitary
Standards for Drinking Water
* 0.05 0.1
European Union
Directives
* * *
National Primary Drinking Water
Regulations (USA)
0.06 * *
Guidelines for Drinking
Water Quality (WHO)
* 0.05 0.2
Guidelines for
Canadian Drinking Water Quality
0.08 * *
Risk Comments
Liver and cancer (DCAA: DCAA is classified as probably carcinogenic to humans); Other organ cancers (DCAA, DBAA, TCAA); liver and (body, kidney and testes weights)
2: Haloacetic acids – Total (HAAs): monochloroacetic acid (MCAA), dichloroacetic acid
(DCAA), trichloroacetic acid (TCAA), bromoacetate (MBAA) and dibromoacetic acid
(DBAA)(US-EPA 2006)
*: None required

26
Table 2.7 Comparisons of Drinking Water Standards on DBPs
All values are in units of mg/L
Bromate Chlorite Chlorate
Chinese Sanitary
Standards for Drinking Water
0.01 0.7 0.7
European Union
Directives
0.01 * *
National Primary Drinking Water
Regulations (USA)
0.01 * *
Guidelines for Drinking
Water Quality (WHO)
0.01 0.7 0.7
Guidelines for
Canadian Drinking Water Quality
0.01 1 1
Risk Comments
Renal cell tumors (classified as probable carcinogen)
Neurobehavioral effects (lowered auditory startle amplitude, decreased exploratory activity), decreased absolute brain weight, altered liver weights
Thyroid gland effects (colloid depletion)
*: None required
However, 30 years of toxicology and risk assessments show that the DBPs in current
drinking water standards are unlikely to cause very great health risk shown by
epidemiology researches. It is still unclear that which contaminations are the occurrences
of bladder cancer (Costet et al. 2011; Lee et al. 2013; Alija et al. 2016).

27
2.3.3.1 Trihalomethanes (THMs)
2.3.3.1.1 Introduction
THMs are the first series of DBPs found in chlorinated drinking water. There are 4 THMs
often detected in drinking water, namely chloroform (CHCl3, TCM),
dichlorobromomethane (CHCl2Br, BDCM), dibromochloromethane (CHClBr2, DBCM)
and bromoform (CHBr3, TBM), among which TCM is the main component. When the
source water contains iodide, iodide THMs may also be generated with disinfectants (Zha
et al. 2014; Bougeard et al. 2010; Grunwald et al. 2002).
THMs are a major component in the formation of DBPs in drinking water. THMs and
HAAs make up to 25% of total halogenated DBPs (Stuart W Krasner et al. 2006).
Concentrations of THMs generated in disinfection process depend on the type of
disinfectant. Generally, THM formation follows the following order: chlorination >
chloramine > ozone > chlorine dioxide (WolrdChlorineCouncil 2008). Ozonation could
produce higher concentration of brominated THMs if the source water contains high
concentrations of bromide (Aljundi 2011; Moslemi et al. 2012).
2.3.3.1.2 Detection and Analysis
The concentration levels of iodide THMs in drinking water are mostly less than 1 ppb,
but in some cases about 12-13 ppb can also be found with an average concentration of
10.2 ppb as found in 23 cities of United States and Canada (Weinberg et al. 2002; Stuart
W Krasner et al. 2006).
There are many US EPA standard methods available for the detection of THMs in
drinking water, such as EPA Method 502.2, 524.2, 551 and 551.1 which use mainly gas
chromatography (GC) combined with photoionization detection, electronic capture
detector (ECD) and mass spectrometry (MS) detector (EPA551 1995; EPA551.1 1995;
EPA501.2 1996; EPA524.2 1995; EPA502.2 1995). Sample preparation methods such as
purge & trap (P & T), headspace sampling techniques, liquid-liquid extraction (LLE),
closed-loop stripping concentrate (CLSA), solid phase extraction (SPE) or solid phase
micro extraction (SPME), etc. are all used. Headspace sampling techniques and GC/MS

28
method are the most effective analytical method for chlorinated and brominated THMs
(including TCM, BDCM, DBCM and TBM). Low recovery (< 50 %) headspace
sampling techniques or purge & trap (P & T) process cannot be used for accurate
quantification of iodide THMs because of its low concentration level (< 1 ppb)(Jones et
al. 2012). Thus, higher recovery LLE process (47 % - 94 %) is used for 6 iodide THMs,
CHCl2I, CHBrClI, CHBr2I, CHClI2, CHBrI2 and CHI3, with recovery of about 100 %
with analysis in GC-ECD (detection limit of 0.01- 0.03 ppb, and the quantification limit
of 0.1- 0.7 ppb)(Weinberg et al. 2002; Stuart W Krasner et al. 2006).
Over the last 3 decades, the studies on THMs are focused on their effects such as
mutagenic activity (genetic or chromosomal mutation) and genotoxicity (mutagenicity
and DNA damage). Large numbers of studies have shown that THMs have obvious
mutagenicity or genotoxicity with accurate dose-response relationships. IARC and
Richard SD, have reviewed the toxicity of TCMs and other THMs (IARC Working
Group on the Evaluation of Carcinogenic Risks to Humans 2010; Richardson et al. 2007).
The cytotoxic order of THMs is: TBM > DBCM > TCM > BDCM; and the mutagenicity
order follows: TBM > BDCM > DBCM > TCM (Wang et al. 2014; Chang et al. 2010).
US EPA indicates that THMs are carcinogenic for rats. TBM, DBCM and BDCM can
cause intestinal, liver and kidney tumors in rats, respectively (IARC 1999; WHO 1991;
IARC Working Group on the Evaluation of Carcinogenic Risks to Humans 2010).
2.3.3.2 Haloacetic Acids (HAAs)
2.3.3.2.1 Introduction
1983, Christman etc. found haloacetic acids (HAAs) in chlorinated drinking water
disinfection (Chrlstman et al. 1983). HAAs caused high attention of US EPA due to its
high boiling point, unable to be blown off, and the much higher unit cancer risk than
THMs. There are 9 HAAs in total, the US EPA made five species defined:
monochloroacetic acid (MCAA), dichloroacetic acid (DCAA), trichloroacetic acid
(TCAA), bromoacetate (MBAA) and dibromoacetic acid (DBAA)(US-EPA 2006).
HAAs are formed during chlorine, chloramines, and chlorine dioxide and ozone
disinfection process. But with different amounts of different disinfection methods, HAAs

29
are produced with various concentrations. Chlorination could form highest HAAs, which
are often higher than the concentration limits specified in drinking water DBPs
regulations (Zheng et al. 2016; Bougeard et al. 2010). Compared with chlorination,
chloramine disinfection greatly reduces the HAAs formation (McGuire et al. 2002).
HAAs from chlorine dioxide disinfection process are mainly DCAA, CBAA and
DBAA(McKie et al. 2015; Richardson et al. 2007). Ozone disinfection greatly reduces
the formation of THM and HAA, but when the concentration of bromide or iodide in
source water is high, there would be the formation of bromo, iodo and mixed haloacetic
acid, dibromoacetic acid, such as (DBAA), tribromoacetic acid, 1-iodoacetate (MIAA),
1-bromo acid chloride (CBAA), dichlorobromoacetic acid (DCMBAA), 1-chlorine-
dibromoacetic acid, 1-bromine-iodine acid (BIAA)(Liu et al. 2013; Xie et al. 2010; Pan et
al. 2015).
2.3.3.2.2 Detection and Analysis
There are many US EPA standard methods available for the detection of HAAs in
drinking water, such as EPA Method 552.1, 552.2, 552.3 (EPA552 1990; EPA552.2
1995; Dell 1993; USEPA552.3 2003). Generally, methyl tert-butyl ether (MtBE) is used
first for liquid-liquid extraction, then 1, 2- dibromopropane is added as an internal
standard. Subsequently, acidified methanol or diazomethane is used for derivatization
before analyzing in GC/ECD or GC/MS.
All 5 US EPA defined HAAs species have mutagenic activity. There are fewer
genotoxicity studies for iodide, brominated, dibrominated, tribrominated and chlorinated
acetic acids. Among them, the concentrations of chlorinated HAAs are much higher than
brominated HAAs. Most commonly detected HAAs are DCAA and TCAA. Both of them
have been identified as animal carcinogenicity, the cancer risks of which are about 50-
fold and 100-fold of TCM. HAAs contribute more than 90% in total cancer risks among
all DBPs; while HANs, HKs and other DBPs have relatively little cancer risk. Animal
experiments have shown that, compared with chlorinated HAAs, brominated HAAs have
stronger cell toxicity and genetic toxicity. The cytotoxic order of HAAs is: MBAA >>
DBAA > MCAA > DCAA > TCAA; and the genotoxicity order follows: MBAA >
MCAA > DBAA > TBAA, while DCAA and TCAA have no genotoxicity in

30
experiments. In addition, animal experiments also shown that iodide HAAs have 3 times
greater cytotoxicity and genotoxicity than brominated HAAs (Xie et al. 2010; Hu & Hu
2013; Zhang et al. 2010; Richardson et al. 2007).
2.3.3.3 Effects of AOM on DBP Formation
The AOM from different algal species may contain different levels of dissolved organic
carbon (DOC) and dissolved organic nitrogen (DON) (Lui et al. 2012). AOM is rich in
organic nitrogen and lack of organic carbon compared to NOM, which results in more
nitrogenous DBPs (N-DBPs) and less carbonaceous DBPs (C-DBPs) during disinfection
treatment (Lui et al. 2012). However, C-DBP has drawn more attention from the
researchers for its dominant occurrence and serious harm.
The level of DBPs formation may vary considerably with algae species, the genus, the
algal cells, the algal growth, biochemical composition and the applied conditions of
chlorination treatment (chlorination dose, pH and incubation time)(Lv et al. 2014; Liang
et al. 2012; Li et al. 2012; Lui et al. 2012; Lui et al. 2011; Huang et al. 2009). The DBPs
formation of nine different fresh water algal species were studied (three blue-green algae,
three green algae, and three diatoms), and it showed that green algae and diatoms
produced more DBPs than blue-green algae (Zhang et al. 2014). For green algae and
blue-green algae, EOM produced less fraction in DBPs (except for trichloronitromethane)
than IOM in chlorination treatment (Fang, Yang, et al. 2010) (Yang et al. 2011; Li et al.
2012). However, up to now, the details of C- DBPs and N-DBPs formation from IOM
and EOM of diatoms are still very limited (Pivokonsky et al. 2014; Liang et al. 2012;
Zhang et al. 2016).

31
2.4 The Importance of This Study
Algae are aquatic and photosynthetic microorganisms, which are widely living in lakes,
reservoirs and surface waters. The most commonly found algae in drinking water sources
are green algae, blue-green algae, diatoms, euglenoids, dinoflagellates, cryptomonads,
yellow-green algae, and golden algae (Knappe et al. 2004). Algal bloom has been defined
as a visible accumulation of algal biomass (Reynolds & Walsby 1975). Algal organic
matter (AOM) is found in high concentration during algal bloom season in drinking water
systems, and it affects the drinking water quality as one of the substantial contributors to
natural organic matter concentration (NOM) (Pivokonsky et al. 2015). Algal organic
matter (AOM) is generally categorized into extracellular organic matter (EOM) and
intracellular organic matter (IOM).
Drinking water treatment mainly includes pretreatment and disinfection processes. The
aim is to remove colloid contents and suspended solids as well as to kill microbial
pathogens in water to prevent the spread and prevalence of waterborne infectious diseases
(WolrdChlorineCouncil 2008). Also, during drinking water treatment, the disinfectant
also remove taste, color, iron oxide and manganese of drinking water (Wang et al.
2014)(SDWF 2012).
During drinking water disinfection process, oxidation, addition and substitution reactions
occur between disinfectant and natural organic matters (NOMs) such as humic and fulvic
acids and algal matter, as well as bromide or iodide in source water, which produce
disinfection by-products (DBPs). Since the time trihalomethanes (THMs) were found in
the 1970s, more than 600 different DBPs have been identified. Most DBPs compounds
have potential carcinogenicity, teratogenicity, and mutagenicity (Zhao et al. 2012;
Hutzinger et al. 2011; Pan & Zhang 2013). After years of research, quantitative
information of a few DBPs has been revealed.
The bloom of algae causes a series of problems for drinking water treatment. It affects the
efficiency of coagulation, causes bad taste and release algal toxins. What’s more, AOM is
rich in organic nitrogen and organic carbon compared with NOM, which causes the
formation of more DBPs during disinfection treatment (Lui et al. 2012). Therefore, it is

32
very necessary to remove algae and AOM during drinking water treatment to avoid the
problems described above.
In this study, two diatoms and tow green algae were selected as the most common algae
in natural water. The various dosages of coagulant were used for EOM and IOM to
evaluate the efficiency of coagulation. UV and post-UV chlorination were used as the
disinfection methods. Chlorination was a necessary part to provide the disinfectant
residual which can main the disinfection effect. HAAs and THMs were determined after
treatments to analyze the DBPs formation potential.
The specific objectives are:
a) To determine and analyze the parameters of EOM and IOM from four different
commonly found species of algae in surface water.
b) To determine the efficiency of various dosages of common alum coagulant used in
drinking water treatment plants for four different commonly found species of algae in
surface water.
c) To determine the impact of UV radiation and post-UV chlorination on the water
parameters and DBPs formation potential for coagulated and not coagulated EOM and
IOM.

33
Chapter 3
3 Materials and Methods
The experimental procedures adopted in this work are shown in the following schematic
as shown in Figure 3.1.
Figure 3.1 Experimental procedures
Test algal strains were grown in the laboratory in Western University. For each algae
strain, AOM was separated into EOM and IOM raw solutions using freeze/thaw cycles as
described later. Several water quality parameters such as turbidity, pH, DOC were
determined after each experiment. Alum (Al2(SO4)3•16H2O) was used as the coagulant
for EOM and IOM removal from water. Before coagulation, pH of all the EOM and IOM
solutions were adjusted to 8.0 ± 0.2. The dosage of alum varied in the range from 20 - 60
mg/L. A bench-scale collimating beam apparatus supplied by Trojan Technologies was
used for UV-disinfection experiments of water with algal matters with a fixed UV dosage
of 40 mJ/cm2. The chlorination treatment was conducted based on the uniform formation
conditions (UFC) (Summers 1996) for 24 h at room temperature. THMs (chloroform,
bromoform, dibromochloromethane) and HAAs (MBAA, DCAA, TCAA) were

34
determined based on EPA methods (EPA334.0 2009; EPA551 1995; EPA330.5 1978;
EPA552.2 1995; EPA502.2 1995) using a GC-ECD system.

35
3.1 Experimental Materials
3.1.1 Algae Suspensions
Two strains of diatom as well as two strains of green algae were used in this research.
The two species of diatom are Phaedactylum Tricornutum, Cyclotella Meneghiniana and
the two species of green algae are Chlorella Vulgaris, Chlamydomonas Reinhardtii. The
two species of green algae were purchased from University of Texas at Austin (C.
vulgaris strain no. UTEX 2714), Chlamydomonas Resource Center (C. reinhardtii strain
no. CC-125). The two species of diatom (P. tricornutum strain no. CPCC 162 and C.
meneghiniana strain no. CPCC710) were obtained from Canadian Phycological Culture
Centre (Waterloo, ON, Canada). The characteristics of four strains are listed in Table 3.1
(Meza et al. 2015; Hernández-zamora et al. 2015; Harris & Coleman 2005; Yang & Li
2016; Rees & Victoria 2006).
Table 3.1 Characteristics of the four strains used in the experiments
Characteristics C. Vulgaris C. Reinhardtii P. Tricornutum C. Meneghiniana
Class Green Algae Diatom
Geometric shape and dimensions
Spherical, 2-‐10 µm in diameter
Ellipsoidal, 10 µm in diameter
Fusiform, 10 µm length
Cylinder, 18-‐30 µm length
Typical bloom period
Summer or early fall Spring
3.1.2 Chemical Reagents
All the stock and experimental solutions were prepared form ACS regent grade
chemicals. The four mediums (Bold’s Basal Medium, High Salt Minimal Media, F/2
Marine Medium and CHU-10 Medium) were purchased from Canadian Phycological
Culture Centre and made based on standard methods (Robert R. L. Guilard
2014)(Rochaix 2002)(Robert R. L. Guilard 1962)(Abomohra & Wagner 2013). A stock
solution of Al2(SO4)3•16H2O at 10 g/L was prepared by dissolving 10 g Al2(SO4)3•16H2O
in 1 L Milli-Q water. A 5% commercial hypochlorite solution (NaOCl, ACROS, NJ,
USA), DPD (N,N-diethyl-p-phenylene diamine) indicator as well as FAS solution
(ferrous ammonium sulfate) were purchased from RICCA, Arlington, USA. 99.9%

36
Methyl tert-butyl ether (MTBE) was purchased from Sigma-Aldrich, USA. THMs (EPA
501 Trihalomethanes Mix) and HAAs (EPA 552 Methyl Esters Mix) standards were
purchased from Fisher Scientific (ON, Canada).

37
3.2 Experimental and Analytical Methods
3.2.1 Algae Growth
The four strains were cultured in four different media in incubators maintained at 25°C,
Chlorella Vulgaris (Bold’s Basal Medium) (Robert R. L. Guilard 2014), Chlamydomonas
Reinhardtii (High Salt Minimal Media) (Rochaix 2002), Phaedactylum Tricornutum (F/2
Marine Medium) (Robert R. L. Guilard 1962), Cyclotella Meneghiniana (CHU-10
Medium) (Abomohra & Wagner 2013). All media were autoclaved before use.
The stock algal suspensions were harvested during the exponential growth period, which
was determined by counting the cells regularly. The experimental suspensions were
prepared by diluting the stock algal suspensions using deionized water. The experimental
suspensions were stained with methylene blue (MB) in 3% acetic acid, and incubated in
dark at room temperature for 20 minutes (Imase et al. 2013). After that, a light
microscope (ZEISS) with a hemocytometer (LW Scientific) was used to count the
number of algae cells in the suspensions. Cells that were blue or pale blue color under the
microscope were determined to be dead, while the living cells retained their own color
(Imase et al. 2013). The cell counts of stock and experimental suspensions are shown in
Table 3.2. The experimental suspensions were created for the next experimental step,
which is the separation of IOM and EOM.
Table 3.2 Media and initial cell counts of the algaes
Characteristics and parameters
C. Vulgaris C. Reinhardtii P. Tricornutum C. Meneghiniana
Media Bold’s Basal Medium
High salt minimal media
F/2 Marine Medium
CHU-‐10 Medium
Stock suspension cell count (cells/mL)
(8.1 ± 0.3) × 107 (5.6 ± 0.4) × 107 (9.4 ± 0.2) × 107 (8.8 ± 0.3) × 106
Experimental suspension cell count (cells/mL)
(5.1 ± 0.2) × 106 (8.3 ± 0.3) × 106 (5.5 ± 0.3) × 106 (4.0 ± 0.2) × 106

38
3.2.2 Separation of IOM and EOM
As mentioned in the previous section, experimental algal suspensions were created by
diluting the stock algal suspensions using deionized water. The algal suspensions were
transferred into several 50 mL tubes and then centrifuged at ∼3000g for 20 min under 25
°C with a 6 × 50 mL rotor (Thermo Scientific Sorvall, Legend T Plus). The supernatant
fractions were transferred into a 1L beaker, and then filtered through 0.45-µm sterilized
47 mm membranes (PALL life Sciences) into a 1 L flask by vacuum. The filtrate is
referred to as experimental raw EOM solution. The organic matters content in EOM were
determined by a TOC analyzer. The algae cells, which were separated in centrifugation at
the bottom of the 50 mL tubes, were washed and followed by re-suspending in the same
amount of Milli-Q water. The resulting cells suspensions were subjected into four
freeze/thaw cycles (−15 °C/25 °C) to achieve the lysis of the algae cells. During the lysis
of algae cells, IOM is released in water, which was subjected to similar centrifugation
and filtration treatments as for the EOM solutions discussed above. The filtrate was
referred to as experimental IOM solutions. Same water quality parameters such as
turbidity, DOC and UV254 were determined for both EOM and IOM solutions.
Before coagulation, the pH of both EOM and IOM raw solutions was adjusted to 8.0 ±
0.1 using 0.1 M HCl and 0.2 M NaOH solution. The experimental procedures for EOM
and IOM separation are shown in Figure 3.2.

39
Figure 3.2 Experimental procedures of the separation of EOM and IOM
3.2.3 Pre-treatment: Coagulation
The coagulation setup (shown in Figure 3.3) consisted of a Phipps & Bird programmable
jar tester (Model PB900) with six stainless steel mixing paddles, an LED illuminator
fixed on the base and a chassis with powder coated steel frame. All the experiments were
conducted at room temperature.

40
Figure 3.3 Coagulation setup
In this study, Al2(SO4)3•16H2O was used as a coagulant. The range of the added
coagulant was between 20 to 60 mg/L. 500 ml sample of AOM in water was added into a
clean 600 ml beaker, and then placed under the base with the mixing paddle inside of it.
There were 6 groups of coagulation samples conducted at the same time at room
temperature (shown in Appendix A-2). The first group was the control group without
adding any coagulant, while groups 2-6 were with the coagulants at dosage of 20, 30, 40,
50, 60 mg/L respectively. Coagulation was conducted with the rapid mixing speed at 150
rpm for 2 min, followed by flocculation treatment at a slow mixing at 25 rpm for 20 min.
After flocculation, all the six samples were allowed to settle for 2 hours.
After settling, the supernatant was collected for the analysis of turbidity, DOC and UV254.
For DOC determination, the supernatant needed to be filtered through 0.45-µm sterilized
membranes with diameter of 47 mm (PALL life Sciences) into a 1 L flask by vacuum.
The supernatants were buffered to pH 8.0 ± 0.1 with 2 mL/L borate buffer (1.0 M boric
acid and 0.26 M sodium hydroxide in ultrapure water) before disinfection treatment. 0.1
M HCl solution and 0.2 M NaOH solution were used to adjust the pH at 8.0 ± 0.1of the
supernatants if necessary. All the experimental data were obtained in triplicate.

41
3.2.4 Disinfection Treatment: UV Treatment
A bench-scale apparatus (shown in Appendix A-3) supplied by Trojan Technologies was
used in this study. The apparatus (shown in Figure 3.4) consisted of a collimating tube,
which provided the irradiation on the surface of water samples, using a low-pressure
(monochromatic at 254 nm) UV lamp, and a magnetic stir plate with a small stir bar
(shown in Appendix A-4), which was used to make a completely mixed water samples
during the treatment.
Figure 3.4 UV bench-scale apparatus
Before the UV radiation experiments, the UV lamp needed to be turned on for at least 4
hours to achieve a stable UV intensity. The calibrated radiometer (IL1400A, International
Light, S/N 6976) equipped with a SEL 240 detector was used to determine the UV
intensity. A new calibration was needed each time before treatment, which is described
below.
The UV irradiation intensities were measured every 0.5 cm along both X and Y-axes
from 0 to 3 cm to obtain the average irradiation intensity in the petri dish circle shown
(Figure 3.5). The UV detector was placed at the same level of the water sample surface.

42
The average intensity in the petri dish was then calculated using the formulae shown in
Appendix A-5.
Figure 3.5 Collimated beam circle
In a collimated beam experiment, certain correction factors are needed to calculate the
final irradiance of UV light. Bolton and Linden (Bolton et al. 2003) used 4 correction
factors which are listed below.
a. Reflection Factor (Rf)
Light reflects off the interface between the media when it travels from one medium to the
other (Bolton & Stefan 2002). Thus a constant reflection factor is necessary to correct the
reflected UV light.
b. Petri Factor (Pf)
The Petri Factor is needed to account for the variance of irradiance over the surface of the
sample (Andrea 2009). To get the Petri Factor, light intensity are measured from the

43
center of the Petri dish and divided by the center irradiance and an average of ratios
known as the Petri Factor is calculated (Bolton et al. 2003).
c. Water Quality Factor (Wf)
A Water Quality Correction is needed to correct the energy absorbed by water body as
UV light travels through it. Water Quality Correction is done by integrating the Beer-
Lambert Law over sample depth and takes into account the water absorption coefficient
(Bolton & Linden 2003). The equation of Water Factor is listed blow (Bolton & Linden
2003):
Water Factor = !!!"!"
!" !" (!")
where a = absorbance for a 1 cm path length
l = vertical path length (cm) of the water in the Petri dish
d. Divergence Factor (Df)
Divergence Factor is very needed to correct the collimation of collimated (Bolton &
Linden 2003). The equation of Divergence Factor is shown blow (Bolton & Linden
2003):
Divergence Factor = !(!!!)
where L = distance form the UV lamp to the surface of the cell suspension
l = vertical path length (cm) of the cell suspension in the Petri dish
Given all the 4 correctors, the final irradiance rate can be calculated by the following
equation (Bolton & Linden 2003),
Ave. final irradiance rate = UV beam irradiance rate * Pf * Rf * Wf * Df
As described above, the four correction factors of the collimated beam were determined
from measured parameters such as UV transmittance, the depth of water sample, the

44
distance from UV lamp to the surface of water sample and were used in average intensity
calculation. Among all these parameters, only UV transmittance and UV intensity were
changed in different experiments while other parameters were constants. The irradiation
time for a water sample is calculated based on the average intensity and the desired
dosage (40 mJ/cm2)(shown in Appendix A-6).
For UV radiation, only the algal solutions with 0 and 60 mg/L coagulants were treated.
The samples without coagulants were the control groups and the samples with 60 mg/L
coagulant were the experimental groups. Water samples were buffered at pH 8.0 ± 0.1
with 2 mL/L borate buffer: (1.0 M boric acid and 0.26 M sodium hydroxide DI water).
0.1 M HCl and 0.2 M NaOH were used to adjust the pH at 8.0 ± 0.1 of the water samples
when necessary. 50 ml samples were added into a clean petri dish, which contained a
magnetic stir bar, and then placed under the collimating beam at room temperature. As
used in many drinking water treatment plants, a UV dose of 40 mJ/cm2 for 4-log
inactivation was used in this study.
3.2.5 Disinfection Treatment: Chlorination
The chlorination treatment was conducted based on the uniform formation conditions
(UFC)(Summers 1996). As above only the solutions with 0 and 60 mg/L coagulants were
treated. The samples without coagulants were control groups and the samples with 60
mg/L were experimental groups. The basic uniform formation conditions include: pH 8.0
± 0.2, temperature 20.0 ± 1.0 °C, incubation time 24 ± 1 h and chlorine residual 1.0 ± 0.4
mg/L as free chlorine after 24 h (Summers 1996). The pH of all water samples were
adjusted to 8.0 ± 0.2 before UV, so there was no need to add the buffer again. The
chlorination solution is a combination of sodium hypochlorite (NaOCl) and a borate
buffer. The combined hypochlorite-buffer solution was made by buffering the
commercial 5% hypochlorite solution to pH 8.0 with pH 6.7 borate buffer (1.0 M boric
acid and 0.11 M sodium hydroxide in DI water) (Summers 1996). The chlorine dosages
in this study were adjusted to 1.8 times of the initial DOC values to achieve a 24 h
chlorine residual of 1.0 ± 0.4 mg/L. The bottles were then capped with PTFE lined caps
and covered with aluminum foil and kept in dark at 20.0 ± 1.0 °C for 24 h (shown in
Appendix A-7). UV254, pH, chlorine residual and DOC were determined after incubation.

45
3.2.6 Water Quality Parameters Analysis
The main water quality parameters measured in this study include pH, turbidity, DOC,
UV254 and chlorine residual. A pH meter (Orion Model STAR A111) was used to
determine the pH. The turbidity of water samples was measured by a Hach ratio turbid
meter (Model 2100AN) in nephelometric turbidity units (NTU). A Shimadzu TOC-
VCPNASI-V analyzer was used to determine DOC of the water samples. Before
determination, the water samples were filtered through 47 mm, 0.45-µm sterilized
membranes (PALL life Sciences) by vacuum. UV254 is the absorbance of water samples
at 254 nm, was determined by a dual-beam UV-VIS-NIR spectrophotometer (Shimadzu
Model 3600). Chlorine residual was determined as free chlorine (hypochlorite ion,
hypochlorous acid) based on DPD-FAS titration spectrophotometric method (EPA334.0
2009; EPA330.5 1978). The calibration was built up with Cl2 concentration at a range of
0.05, 0.1, 0.5, 1, 2, 4 ppm. Standard ferrous ammonium sulfate (FAS) solution was used
to titrate the standard KMnO4 solution as well as water samples after disinfection. During
the calibration, KMnO4 standard solutions were used instead of chlorine solution because
of the instability of chlorine in water. KMnO4 as well as free chlorine can oxidize DPD
(N,N-diethyl-p-phenylenediamine) to produce a red colored solution. The absorbance of
the solution was spectrophotometrically determined at 515 nm (Public & Association
1992; ThermoFisher 2003; EPA334.0 2009; EPA330.5 1978).
3.2.7 DBP Analysis
THMs (chloroform, bromoform, dibromochloromethane) and HAAs (MBAA, DCAA,
TCAA) were determined in this study based on EPA methods.
THMs determination was mainly based on EPA 551 and 551.1. A 50 mL sample aliquot
was collected in a 65 mL vial. 0.833 g buffer/ dechlorinating agent powder was added to
lower the pH as well as convert free chlorine to monochloramine (EPA551.1 1995;
EPA502.2 1995; EPA524.2 1995; EPA501.2 1996). The phosphate buffer powder was a
mixer of 1% sodium phosphate, dibasic (Na2HPO4) and 99% potassium phosphate,
monobasic (KH2PO4) by weight (EPA551.1 1995). 1.2 g ammonium chloride (NH4Cl)
was added to the 200 g phosphate buffer powder as the dechlorinating agent to make the

46
buffer/ dechlorinating agent. The sample aliquot was then extracted with 3 mL of MTBE
(Column et al. 1995). After shaking for 2 min, 20 g Na2SO4 was added to the aliquot. The
vial was capped immediately and was shaken vigorously for 4 min, and then inverted to
allow the MTBE and water phases to separate for another 5 min. 2 µL of the MTBE
extract was then injected into a GC (Shimadzu GC-2014) equipped with a BPX5 column
(0.25 mm ID × 30 m, 0.50 µm film thickness, 5% phenyl (equivalent) / 95% methyl
polysilphenylene / siloxane phase) and electron capture detector (ECD) for separation
and analysis (EPA551.1 1995). The temperature program of the column oven was as
follows: an initial temperature of 45 °C was held for 5 min, then increased at a rate of 10
°C /min to 145 °C, 25 °C /min to 225 °C, 10 °C /min to 260 °C. The temperature of the
injector and electron conductivity detector were set at 200 °C and 290 °C, respectively.
Nitrogen and helium were used as the make-up gas and carrier gas, respectively. The
calibration curves are shown in Appendix B-1, B-2, and B-3.
HAAs determination was mainly based on EPA 552 and 552.2. A 40 mL sample was
collected in a 65 mL vial. 100 mg/L ammonium chloride (NH4Cl) was added as the
dechlorinating agent. About 2 mL of 95-98% sulfuric acid was then added into the vial to
adjust pH < 0.5 (EPA552.2 1995; EPA552 1990; Dell 1993; USEPA552.3 2003). After 2
min of shaking, 16 g Na2SO4 was added to increase the ionic strength of the aqueous
phase (EPA552.2 1995; EPA552 1990). 4 mL MTBE was then added as the extract
solvent. The vial was recapped immediately, shaken vigorously for 4 min and then
inverted to allow the MTBE and water phases to separate for another 5 min (EPA552.2
1995; EPA552 1990). About 3 mL of the MTBE extract was then transferred into a 15
mL glass vials and methylated using one mL 10% sulfuric acid / methanol solution
(EPA552.2 1995; EPA552 1990). The tube was placed in a heating bath at 50 °C for two
hours in dark. After heating, 4 mL of saturated sodium bicarbonate solution was added to
remove the extra acid, which would damage the GC column. 2 µL of the MTBE extract
was then injected into a GC (Shimadzu GC-2014) equipped with a BPX5 column (0.25
mm ID × 30 m, 0.50 µm film thickness, 5% phenyl (equivalent) / 95% methyl
polysilphenylene / siloxane phase) and electron capture detector (ECD) for separation
and analysis (EPA552.2 1995; EPA552 1990; Dell 1993). The temperature program of
the column oven is as follows: an initial temperature of 42 °C was held for 8 min, then

47
increased at a rate of 15 °C /min to 100 °C and held for 5 min, 25 °C /min to 280 °C. The
temperature of the injector and electron conductivity detector were set at 250 °C and 290
°C, respectively (EPA552.2 1995; EPA552 1990; Dell 1993). Nitrogen and Helium were
used as the make-up gas and carrier gas, respectively (EPA552.2 1995; EPA552 1990;
Dell 1993). The calibration curves are shown in Appendix B-4, B-5, and B-6.
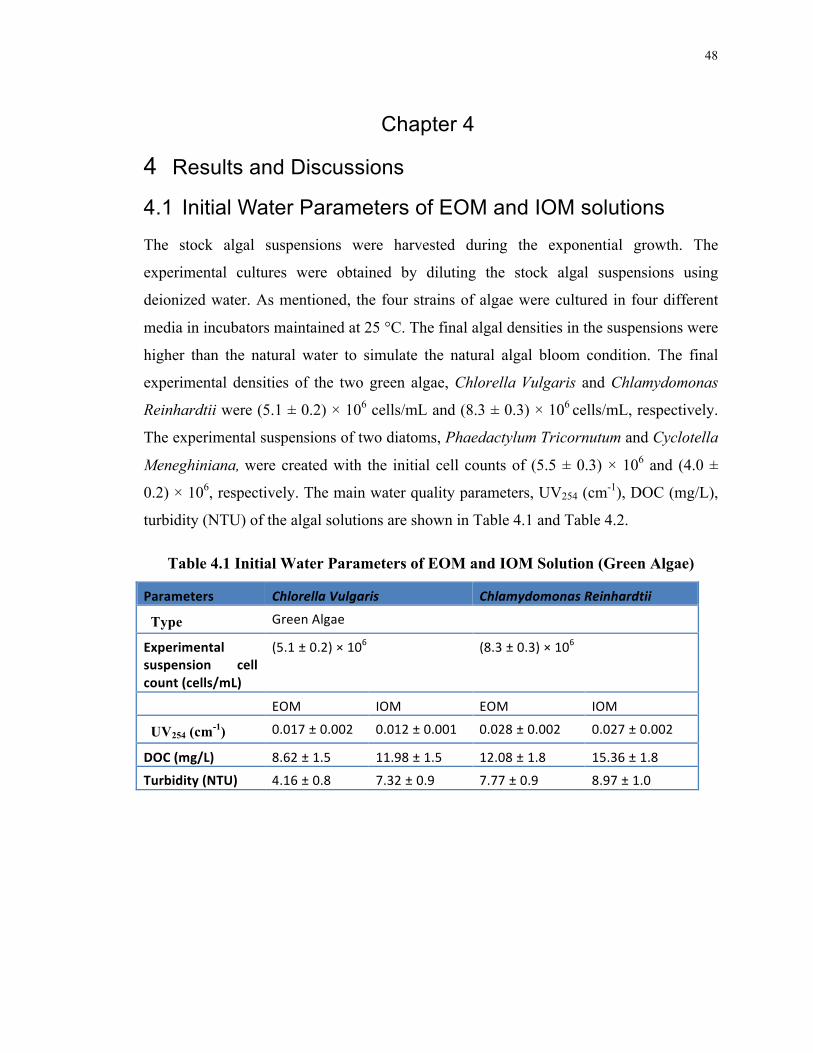
48
Chapter 4
4 Results and Discussions
4.1 Initial Water Parameters of EOM and IOM solutions
The stock algal suspensions were harvested during the exponential growth. The
experimental cultures were obtained by diluting the stock algal suspensions using
deionized water. As mentioned, the four strains of algae were cultured in four different
media in incubators maintained at 25 °C. The final algal densities in the suspensions were
higher than the natural water to simulate the natural algal bloom condition. The final
experimental densities of the two green algae, Chlorella Vulgaris and Chlamydomonas
Reinhardtii were (5.1 ± 0.2) × 106 cells/mL and (8.3 ± 0.3) × 106 cells/mL, respectively.
The experimental suspensions of two diatoms, Phaedactylum Tricornutum and Cyclotella
Meneghiniana, were created with the initial cell counts of (5.5 ± 0.3) × 106 and (4.0 ±
0.2) × 106, respectively. The main water quality parameters, UV254 (cm-1), DOC (mg/L),
turbidity (NTU) of the algal solutions are shown in Table 4.1 and Table 4.2.
Table 4.1 Initial Water Parameters of EOM and IOM Solution (Green Algae)
Parameters Chlorella Vulgaris Chlamydomonas Reinhardtii
Type
Green Algae
Experimental suspension cell count (cells/mL)
(5.1 ± 0.2) × 106 (8.3 ± 0.3) × 106
EOM IOM EOM IOM
UV254 (cm-1)
0.017 ± 0.002 0.012 ± 0.001 0.028 ± 0.002 0.027 ± 0.002
DOC (mg/L) 8.62 ± 1.5 11.98 ± 1.5 12.08 ± 1.8 15.36 ± 1.8 Turbidity (NTU) 4.16 ± 0.8 7.32 ± 0.9 7.77 ± 0.9 8.97 ± 1.0

49
Table 4.2 Initial Water Parameters of EOM and IOM Solution (Diatom)
Parameters Phaedactylum Tricornutum Cyclotella Meneghiniana
Type
Diatom
Experimental suspension cell count (cells/mL)
(5.5 ± 0.3) × 106 (4.0 ± 0.2) × 106
EOM IOM EOM IOM
UV254 (cm-1)
0.026 ± 0.002 0.032 ± 0.001 0.012 ± 0.001 0.019 ± 0.002
DOC (mg/L) 19.71 ± 1.8 17.29 ± 1.9 14.93 ± 0.8 12.99 ± 1.3 Turbidity (NTU) 11.01 ± 1.7 12.33 ± 1.5 17.49 ± 1.8 16.49 ± 1.9
Turbidity is the ratio of intensities of the incident light intensity and the light scattered by
the solutions (Karanfil et al. 2005; Mark 2002; Chln et al. 1994; Cheng et al. 2005). For
the suspensions with algae cells, Beer-Lambert law was followed. The turbidity is
proportional to the concentration of the cells and was slightly affected by the size and the
shape of the algae cells (Karanfil et al. 2005; Mark 2002; Chln et al. 1994; Cheng et al.
2005). In this study, the initial turbidity of EOM solution was much lower than IOM
solution for Chlorella Vulgaris, while all other three algae had very similar values for
both EOM and IOM.
It has been widely reported that DOC contains several types of unsaturated bonds. These
unsaturated bonds can absorb light over a wide range of wavelengths (Karanfil et al.
2005). The strong correlations between UV absorbance of humics and fulvic isolates and
the aromatic carbon content in DOC have been reported by many researchers (Karanfil et
al. 2005; Mark 2002; Chln et al. 1994). As a result, aromatic structures may primarily
cause the absorbance of natural water at UV wavelengths near 250 nm (from 240 to 280)
(Karanfil et al. 2005; Mark 2002; Chln et al. 1994). The UV absorbance at 254 nm has
been chosen to be an important water quality parameter for most researches because of
the following reasons: (i) it is an easy and reliable method to determine the absorbance at
254 nm of organic matter, (ii) it has minimal or even non-existent interference due to
other inorganic compounds (especially at concentrations of most natural waters), (iii) a
low-pressure mercury lamp can produce very strong irradiation (Cheng et al. 2005; Chen
et al. 2008; Altmann et al. 2016), (iv) it has been reported by many researchers that there

50
are very strong correlations between DOC value and absorbance at 254 nm for natural
water body (Chen et al. 2008; Altmann et al. 2016; Roccaro et al. 2015). However,
saturated aliphatic acids, alcohols and some other organic compounds cannot be
measured by UV absorbance at 254 nm as they do not absorb UV light at 254 nm.
Therefore, a sample may actually contain larger organic matters even if it has a very
small value of UV absorbance at 254 nm.
The comparisons UV absorbance at 254 nm and DOC for the four different algae cultures
are shown in Figure 4.1 and Figure 4.2. Overall, diatoms have larger values than green
algae both for UV absorbance and DOC. For green algae (Chlorella Vulgaris and
Chlamydomonas Reinhardtii), the UV254 values of EOM solutions were higher than IOM
solutions, which indicate that EOM in green algae contains more aromatic organic
matters especially for Chlorella Vulgaris. Diatoms had the opposite results with the
UV254 values of IOM solutions were higher than the EOM solutions. The initial DOC
concentrations of IOM solutions for the green algae were higher than EOM solutions,
with the value of 11.98 ± 1.5 mg/L for IOM and 8.62 ± 1.5 mg/L for EOM for Chlorella
Vulgaris as well as 15.36 ± 1.8 mg/L for IOM and 12.08 ± 1.8 mg/L for EOM for
Chlamydomonas Reinhardtii. It needs to be mentioned that the cell counts of
Chlamydomonas Reinhardtii was almost twice of Chlorella Vulgaris. For diatoms, the
initial DOC concentrations of EOM solutions were slightly higher than IOM solutions
with the similar cell counts of both Phaedactylum Tricornutum and Cyclotella
Meneghiniana.
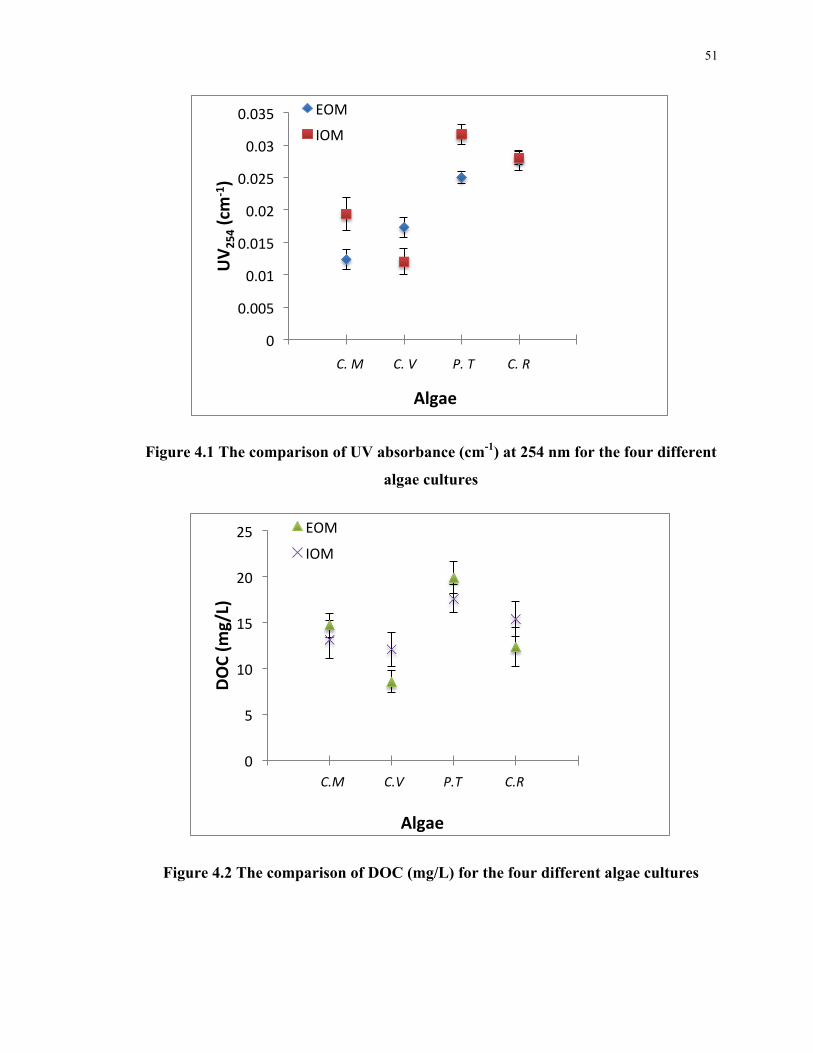
51
Figure 4.1 The comparison of UV absorbance (cm-1) at 254 nm for the four different
algae cultures
Figure 4.2 The comparison of DOC (mg/L) for the four different algae cultures
0
0.005
0.01
0.015
0.02
0.025
0.03
0.035
0 1 2 3 4 5
UV 2
54 (cm
-‐1)
Algae
EOM
IOM
C. M C. V P. T C. R
0
5
10
15
20
25
0 1 2 3 4 5
DOC (m
g/L)
Algae
EOM
IOM
C.M C.V P.T C.R

52
4.2 Coagulation Effects
4.2.1 Coagulation Effects on Turbidity
The turbidity variations (NTU) of EOM and IOM solutions for four algae cultures after
coagulation with the coagulants range from 0 – 60 mg/L and settling time of 2 h at room
temperature (20 ± 2 °C) is shown in Figure 4.3. The initial turbidities of diatoms were
higher than green algae for both EOM and IOM solutions. It was easier to coagulate
diatoms than green algae. The turbidity removals of the EOM solutions for Phaedactylum
Tricornutum and Cyclotella Meneghiniana (diatoms) were 59.2% and 75.0% while for
Chlorella Vulgaris and Chlamydomonas Reinhardtii (green algae) were 24.0% and
30.0%, respectively. Over all, the turbidity of both EOM and IOM solutions declined
after coagulation, while the effect on EOM solutions was more significant than IOM
solutions. However, for Chlamydomonas Reinhardtii (green algae) the turbidity removal
of IOM (41.0% in NTU) solution was somehow higher than EOM solution (30.0% in
NTU). The most significant decline occurred to the EOM solution of Phaedactylum
Tricornutum (diatom) with turbidity removal of 75.0% (from 11.01 ± 1.2 NTU to 2.75 ±
0.3 NTU), while Chlorella Vulgaris (green algae) has the minimum decline in IOM
solution with turbidity removal of 19.5% (from 4.16 ± 0.8 NTU to 3.16 ± 1.1 NTU).
Most turbidity values remained at the same level after the addition of coagulant of 40
mg/L, especially for IOM solutions.

53
Figure 4.3 Turbidity (NTU) variations of EOM (A) and IOM (B) for four algae
cultures after coagulation with the coagulants range from 0 – 60 mg/L and settling
time of 2 h at room temperature (20 ± 2 °C). (Standard deviations of triplicate
experiments are represented by the error bars.)
0
2
4
6
8
10
12
14
16
18
20
0 20 30 40 50 60
Turbidity
(NTU
)
Coagulant Dosage (mg/L)
A C. vulgaris C. reinhardEi
P. tricornutum C. meneghinian
0 2 4 6 8 10 12 14 16 18 20
0 20 30 40 50 60
Turbidity
(NTU
)
Coagulant Dosage (mg/L)
B

54
4.2.2 Coagulation Effects on UV254 and DOC
The AOM from different algal species may contain different levels of dissolved organic
carbon (DOC) and dissolved organic nitrogen (DON) (Lui et al. 2012). In this study, the
amount of IOM and EOM were measured as DOC in water samples. DOC is a very
important precursor of carbonaceous DBPs (C-DBPs) formation potential.

55
Figure 4.4 DOC (mg/L) variations of EOM (A) and IOM (B) for four algae cultures
after coagulation with the coagulants range from 0 – 60 mg/L and settling time of 2
h at room temperature (20 ± 2 °C). (Standard deviations of triplicate experiments
are represented by the error bars.)
0 2 4 6 8
10 12 14 16 18 20
0 20 30 40 50 60
DOC (m
g/L)
Coagulant Dosage (mg/L)
A C. vulgaris C. reinhardEi P. tricornutum C. meneghinian
0 2 4 6 8 10 12 14 16 18 20
0 20 30 40 50 60
DOC (m
g/L)
Coagulant Dosage (mg/L)
B

56
The DOC (mg/L) variations of EOM and IOM solutions for four algae cultures after
coagulation with dosage ranging from 0 – 60 mg/L and settling time of 2 h at room
temperature (20 ± 2 °C) are shown in Figure 4.4. Both EOM and IOM are more
hydrophilic than DOC in natural waters. Compared with EOM, IOM is richer in proteins
or peptide, more hydrophilic and tends to have lower SUVA value. MW fractionation
shows that both EOM and IOM of green algae and diatom contain large portions of low-
MW (below 1 k Da) compounds and high-MW (over 100 k Da) polysaccharides (Ã et al.
2006). After coagulation, DOC values of both the EOM and IOM solutions for all four
algae declined initially, but remained constant at a larger dose. The decrease was more
for EOM solutions because of higher hydrophobicity. For EOM solutions, the DOC
removal of Chlamydomonas Reinhardtii (green algae) and Phaedactylum Tricornutum
declined very fast with the DOC values dropping from 12.88 to 4.79 mg/L and 18.77 to
8.70 mg/L, respectively. For IOM solutions, the significant drop only occurred to
Chlamydomonas Reinhardtii (green algae) from 15.86 to 10.30 mg/L, while all other
three algae showed marginal decline in DOC with coagulation. The DOC values start to
maintain at a same level from a coagulant dose of 20 mg/L, which indicates that large
dose of coagulant, is not very necessary for AOM coagulation. However, larger dosage of
coagulant is widely used in drinking water plants because of the much higher turbidity
and particles in natural water body. Figure 4.5 shows the DOC removal (%) (with a
coagulant dose of 20 mg/L) and average DOC removal (%) (with a coagulant dose of 30
mg/L, 40 mg/L, 50 mg/L, and 60 mg/L) of EOM and IOM for four different algae after
coagulation and settling time of 2 h at room temperature (20 ± 2 °C). Among all the four
algae, coagulation had the best effect on Chlamydomonas Reinhardtii (green algae) (with
62.8% DOC removal for EOM and 35.1% DOC removal for IOM) and worst on
Chlorella Vulgaris (green algae) (with 27.4% for EOM and 13.4% for IOM).

57
Figure 4.5 DOC removal (%) (with a coagulant dose of 20 mg/L) and average DOC
removal (%) (with a coagulant dose of 30 mg/L, 40 mg/L, 50 mg/L, and 60 mg/L) of
EOM and IOM for four algae cultures after coagulation with settling time of 2 h at
room temperature (20 ± 2 °C). (Standard deviations of triplicate experiments are
represented by the error bars.)
As mentioned before, it has been reported by many researchers that there are very strong
correlations between DOC value and absorbance at 254 nm for natural water body,
because the aromatic compounds in DOC primarily cause the UV absorbance of natural
water at 254 nm. The UV254 variations (mg/L) of EOM and IOM solutions for four algae
cultures after coagulation with the coagulants range from 0 – 60 mg/L and settling time
of 2 h at room temperature (20 ± 2 °C) is shown in Figure 4.6. Only very small changes
in the UV254 values were obtained for both EOM and IOM. For Chlorella Vulgaris and
Chlamydomonas Reinhardtii (green algae), the UV254 values slightly dropped for both
EOM and IOM while for Cyclotella Meneghiniana (diatom) the values slightly increased
possible due to experimental error.
0
10
20
30
40
50
60
C. vulgaris C. reinhardEi P. tricornutum C. meneghinian
DOC removal (%
)
EOM Removal at 20 mg/L Maximum EOM Removal
IOM Removal at 20 mg/L Maximum IOM Removal

58
Figure 4.6 UV254 (cm-1) variations of EOM (A) and IOM (B) for four algae cultures
after coagulation with the coagulants range from 0 – 60 mg/L and settling time of 2
h at room temperature (20 ± 2 °C). (Standard deviations of triplicate experiments
are represented by error bars.)
0
0.005
0.01
0.015
0.02
0.025
0.03
0.035
0 20 30 40 50 60
UV 2
54 (cm
-‐1)
Coagulant Dosage (mg/L)
A C. vulgaris C. reinhardEi
P. tricornutum C. meneghinian
0
0.005
0.01
0.015
0.02
0.025
0.03
0.035
0 20 30 40 50 60
UV 2
54 (cm
-‐1)
Coagulant Dosage (mg/L)
B

59
4.3 Effects of Disinfection on EOM and IOM
4.3.1 Effects on UV254 and DOC
Figure 4.7 shows the UV254 (cm-1) variations of coagulated and not coagulated EOM and
IOM for the four types of algae after UV and chlorine disinfection processes.

60
0
0.005
0.01
0.015
0.02
0.025
0.03
0.035
Before disinfecoon Aper UV Aper UV + Cl2
UV 2
54 (cm
-‐1)
A Non-‐Coagulated C. vulgaris Coagulated C. vulgaris
Non-‐Coagulated C. reinhardoi Coagulated C. reinhardoi
0
0.005
0.01
0.015
0.02
0.025
0.03
0.035
Before disinfecoon Aper UV Aper UV + Cl2
UV 2
54 (cm
-‐1)
B Non-‐Coagulated P. tricornutum Coagulated P. tricornutum
Non-‐Coagulated C. meneghinian Coagulated C. meneghinian

61
Figure 4.7 UV254 (cm-1) variations of EOM (A) and (B), as well as IOM (C) and (D)
for four types of algae before and after disinfection with and without coagulation.
coagulant dosage = 60 mg/L, pH = 8.0 ± 0.2, UV dose: 40 mJ/cm2, chlorine dose: Cl2:
DOC = 1.8, temperature: 20 ± 2 °C, incubation time: 24 h. (Standard deviations of
triplicate experiments are represented by the error bars.)
0
0.005
0.01
0.015
0.02
0.025
0.03
0.035
Before disinfecoon Aper UV Aper UV + Cl2
UV 2
54 (cm
-‐1)
C Non-‐Coagulated C. vulgaris Coagulated C. vulgaris Non-‐Coagulated C. reinhardoi Coagulated C. reinhardoi
0
0.005
0.01
0.015
0.02
0.025
0.03
0.035
0.04
Before disinfecoon Aper UV Aper UV + Cl2
UV 2
54(cm
-‐1)
D Non-‐Coagulated P. tricornutum Coagulated P. tricornutum Non-‐Coagulated C. meneghinian Coagulated C. meneghinian

62
Figure 4.8 show the DOC variations (mg/L) of EOM and IOM for the four algae cultures
before and after disinfection with and without coagulation, respectively. Overall, the
control groups had higher UV254 and DOC values than the coagulated groups. The UV254
value slightly decreased after UV disinfection and increased after chlorination. The
reason of the decline after UV radiation is due to the breakdown or photodegradation of
some organic compounds like aromatics, which may absorb UV radiation and followed
by photolysis to smaller compounds. On the other hand, UV254 absorbance increased
slightly after chlorination due to the possible formation of chlorinated compounds with
the intermediates formed during photolysis. For the IOM solutions of Cyclotella
Meneghiniana (diatom), both the decline and increase were quite obvious from 0.028 to
0.031 cm-1. Compared with non-chlorinated compounds, the corresponding chlorinated
compounds could absorb more UV radiation, which results in a higher UV254 value after
chlorination. It is interesting to see that the UV254 decreased after the disinfection
experiments for the EOM of green algae, indicating lower formation of chlorinated
compounds from the EOM. Figures 4.8 A-D present the variations in DOC concentration
after coagulation and disinfection experiments. It can be seen that coagulation removed
more EOM compared to IOM decreasing the value of DOC for all four algae. DOC
remained almost constant after UV radiation, the reason of which is because the total
amount of organic carbon should not change even if some compounds break into smaller
organic matters due to photolysis. DOC values increased slightly after chlorination,
probably due to the interference of Cl- for the determination of DOC.

63
0
2
4
6
8
10
12
14
16
Before disinfecoon Aper UV Aper UV + Cl2
DOC (m
g/L)
A Non-‐Coagulated C. vulgaris Coagulated C. vulgaris
Non-‐Coagulated C. reinhardoi Coagulated C. reinhardoi
0
5
10
15
20
25
Before disinfecoon Aper UV Aper UV + Cl2
DOC (m
g/L)
B Non-‐Coagulated P. tricornutum Coagulated P. tricornutum
Non-‐Coagulated C. meneghinian Coagulated C. meneghinian

64
Figure 4.8 DOC (mg/L) variations of EOM (A) and (B), as well as IOM (C) and (D)
for four types of algae before and after disinfection with and without coagulation.
coagulant dosage = 60 mg/L, pH = 8.0 ± 0.2, UV dose: 40 mJ/cm2, chlorine dose: Cl2:
DOC = 1.8, temperature: 20 ± 2 °C, incubation time: 24 h. (Standard deviations of
triplicate experiments are represented by the error bars.)
0
2
4
6
8
10
12
14
16
18
20
Before disinfecoon Aper UV Aper UV + Cl2
DOC(mg/L)
C Non-‐Coagulated C. vulgaris Coagulated C. vulgaris
Non-‐Coagulated C. reinhardoi Coagulated C. reinhardoi
0
2
4
6
8
10
12
14
16
18
20
Before disinfecoon Aper UV Aper UV + Cl2
DOC (m
g/L)
D Non-‐Coagulated P. tricornutum Coagulated P. tricornutum
Non-‐Coagulated C. meneghinian Coagulated C. meneghinian

65
4.3.2 DBPs Formation Potential
4.3.2.1 Possible Pathways of DBPs Formation
The EOM and IOM from different algal species may contain different levels of dissolved
organic carbon (DOC) (Lui et al. 2012). AOM is rich in organic nitrogen and organic
carbon compared with NOM, which results in that there are more DBPs forming during
disinfection treatment (Lui et al. 2012). The maximum contaminant level (MCL) of
THMs and HAAs are 80 and 60 ppb, respectively (National Primary Drinking Water
Regulations). The results of DBPs formations for C. Vulgaris (green algae) and P.
Tricomutum (diatom) are shown in this study. For THMs, TCM (Chloroform), TBM
(Bromoform) and BDCM (Bromodichloromethane) were determined. For HAAs, MBAA
(Monobromoacetic Acid), DCAA (Dichloroacetic Acid) and BCAA (Bromochloroacetic
Acid) were determined. The cell density of C. Vulgaris (green algae) and P. Tricomutum
(diatom) were (5.1 ± 0.2) × 106 and (5.5 ± 0.3) × 106, respectively.
For organic matters, the activated aromatic groups, namely polyhydroxyphenolic acid
(PHA) moieties are considered as the predominantly reaction sites. Some other organic
matters such as esters and ketones, are also considered as sources of to the formation of
DBPs with less contribution than PHAs (Huang et al. 2009; Korshin et al. 2004; Lyon et
al. 2014; Lui et al. 2012; Stuart W. Krasner et al. 2006; Cumming & Jolley 1993).
However, the reactivity of organic compounds is not completely understood. Even for
some pure aromatic compounds, such as phenol, resorcinol and hydroxybenzoic acids,
the incorporation of chlorine includes multi-step and some other branching reactions. The
incorporations of organic compounds are much more complex and varied (Lui et al. 2012;
Stuart W. Krasner et al. 2006; Cumming & Jolley 1993). Also, the molar concentration,
distribution, structure and chemical properties of most chemical sites are not available for
the reactions during chlorination process.
There are two main sites that can be attacked by chlorine in the sequences of reactions for
the formation of almost all DBPs, which are activated aromatic units (PHAs moiety) and
ketone groups (Larson et al. 1994; Tretyakova et al. 1994). The formation of THMs from
a ketone site via the classic haloform reaction is described in Figure 4.9.

66
Figure 4.9 Pathway of chloroform formation via haloform reaction (ketoenol
functional groups)
The reactions of aromatic sites are much more complex. The reaction starts from the
multiple attacks by chlorine on the aromatic rings, then the intermediates are generated,
which are cyclic but non-aromatic chlorinated compounds. The process is shown in
Figure 4.10. A series of transformations following the ring opening occurs, which lead to
more halogens being incorporated into the products, and finally smaller products are
formed. Eventually smaller products such as THMs and HAAs (one- and two-carbon
molecules), as well as some larger unidentified DBPs are formed (Huang et al. 2009;
Korshin et al. 2004; Lyon et al. 2014; Lui et al. 2012; Stuart W. Krasner et al. 2006;
Cumming & Jolley 1993).

67
Figure 4.10 Possible pathways of chloroform and HAAs formation via haloform
reaction (activated aromatic ring)
4.3.2.2 DBPs Formation Potential Analysis
For THMs formation, there was no significant difference between C. Vulgaris (green
algae) and P. Tricomutum (diatom), which is shown in Figure 4.11. For C. Vulgaris
(green algae), the THMs formation of the non-coagulated groups was higher than the
coagulated groups, which indicated the efficiency of coagulation. Similar results could
also be observed for IOM solutions of P. Tricomutum (diatom). The most significant
difference happened to TBM formation. The formation of TBM for P. Tricomutum
(diatom) was significantly higher than C. Vulgaris (green algae), which resulted in a
higher amount of total THMs.
The HAAs formation is shown in Figure 4.12. Overall, the non-coagulated groups had
more HAAs formation potential. For EOM solutions, there was no significant difference
between C. Vulgaris (green algae) and P. Tricomutum (diatom). The formation of MBAA
was much lower than DCAA and TCAA. It was interesting that for IOM solutions, the
formation of MBAA was much higher compared to EOM solutions, especially for C.

68
Vulgaris (green algae). The increase of MBAA formation mainly contributed to higher
total HAAs for IOM solutions even with a lower TCAA formation. IOM contains up to
90% of polysaccharides, which are attributed to the formation of low HAA species like
MBAA.
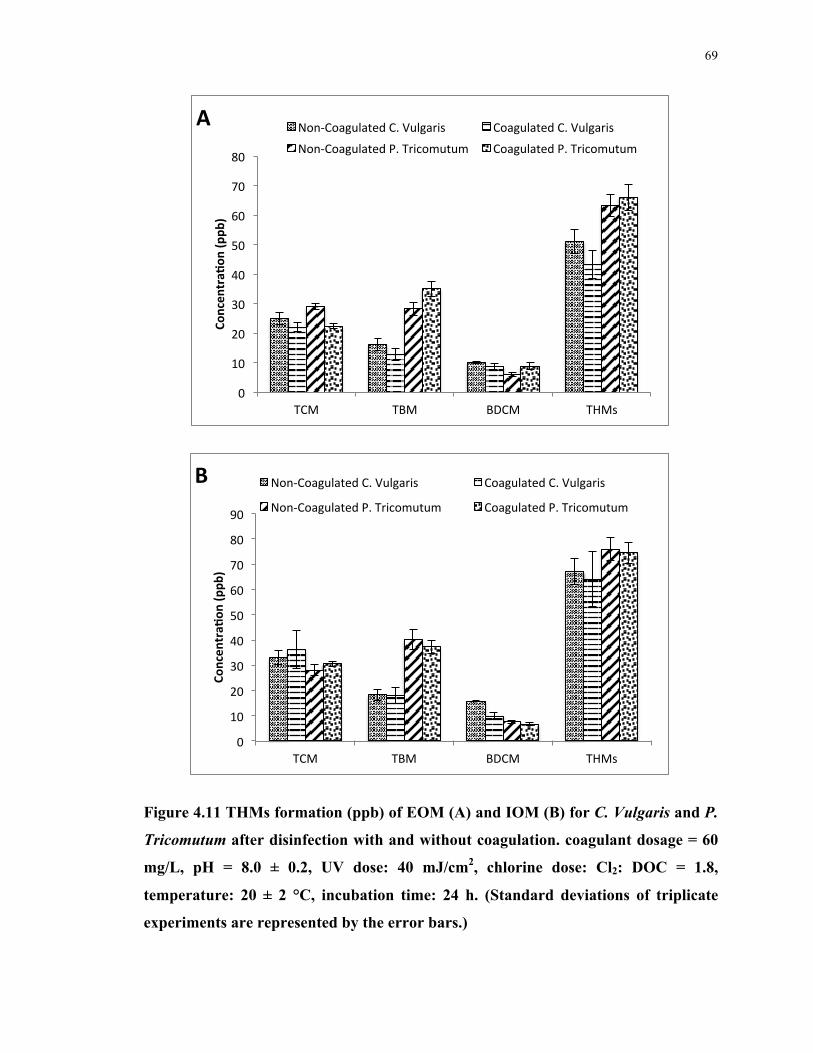
69
Figure 4.11 THMs formation (ppb) of EOM (A) and IOM (B) for C. Vulgaris and P.
Tricomutum after disinfection with and without coagulation. coagulant dosage = 60
mg/L, pH = 8.0 ± 0.2, UV dose: 40 mJ/cm2, chlorine dose: Cl2: DOC = 1.8,
temperature: 20 ± 2 °C, incubation time: 24 h. (Standard deviations of triplicate
experiments are represented by the error bars.)
0
10
20
30
40
50
60
70
80
TCM TBM BDCM THMs
Concen
traX
on (p
pb)
A Non-‐Coagulated C. Vulgaris Coagulated C. Vulgaris
Non-‐Coagulated P. Tricomutum Coagulated P. Tricomutum
0
10
20
30
40
50
60
70
80
90
TCM TBM BDCM THMs
Concen
traX
on (p
pb)
B Non-‐Coagulated C. Vulgaris Coagulated C. Vulgaris
Non-‐Coagulated P. Tricomutum Coagulated P. Tricomutum

70
Figure 4.12 HAAs formation (ppb) of EOM (A) and IOM (B) for C. Vulgaris and P.
Tricomutum after disinfection with and without coagulation. coagulant dosage = 60
mg/L, pH = 8.0 ± 0.2, UV dose: 40 mJ/cm2, chlorine dose: Cl2: DOC = 1.8,
temperature: 20 ± 2 °C, incubation time: 24 h. (Standard deviations of triplicate
experiments are represented by the error bars.)
0
20
40
60
80
100
120
140
MBAA DCAA TCAA HAAs
Concen
traX
on (p
pb)
A Non-‐Coagulated C. Vulgaris Coagulated C. Vulgaris
Non-‐Coagulated P. Tricomutum Coagulated P. Tricomutum
0
20
40
60
80
100
120
140
160
180
200
MBAA DCAA TCAA HAAs
Concen
traX
on (p
pb)
B Non-‐Coagulated C. Vulgaris Coagulated C. Vulgaris
Non-‐Coagulated P. Tricomutum Coagulated P. Tricomutum

71
Based on the experimental results in this study, IOM of diatoms produces more bromine
by-products. Since there was no background bromine in water AOM is the source of
bromine in the experimental solutions. It has been widely known that diatoms are
producers of reactive bromine and iodine (primarily hypobromous acid [HOBr] and
hypoiodous acid [HOI], respectively), and polybromomethanes (Nguvava et al. 2016;
Leblanc et al. 2014; Kurihara et al. 2012). Most of the HOBr released by diatoms may
react with dissolved organic matters to form nonvolatile bromine organics. Some of the
produced HOBr and HOI may also form volatile Br2 and I2 (Nguvava et al. 2016; Leblanc
et al. 2014; Kurihara et al. 2012).
The formations of HAAs were much higher than THMs. IOM produced more DBPs than
EOM. As mentioned before, during chlorination, the predominant reaction sites are the
activated aromatic groups (mainly polyhydroxyphenolic acid (PHA) moieties), although
some other organic matters such as esters and ketones also contribute to the formation of
DBPs. AOM especially, IOM contains more proteins, a higher fraction of aromatic
organic matters, total organic nitrogen and free amino acids compared to natural organic
matters. Higher DBP formation by IOM was found by other researchers (Fang, Yang, et
al. 2010) (Yang et al. 2011; Li et al. 2012).
According to the USEPA regulation mentioned in Chapter 2, the limit of THMs is 80 ppb
and HAAs is 60 ppb. In our work, we have used higher initial algal concentration to
simulate the algal bloom condition, and also to have better analytical accuracy, which is
difficult at the trace concentration of organics in ppb level.
72
Chapter 5
5 Conclusions and Future Directions
5.1 Conclusions
The evaluation of coagulation and disinfections of EOM and IOM solutions for four
different algae cultures has been presented in this thesis. The four algae used were
Chlorella Vulgaris, Chlamydomonas Reinhardtii, Phaedactylum Tricornutum and
Cyclotella Meneghiniana. The disinfection treatments include UV radiation and
chlorination.
The coagulant dosages were from 0 to 60 mg/L with settling time of 2 h. It was easier to
coagulate diatoms cells than green algae cells. The turbidity and DOC of both EOM and
IOM solutions declined after coagulation especially for turbidity, while the effect of
coagulation on EOM was more significant than IOM. A coagulant dose more than 40
mg/L did not bring any additional benefit in terms of turbidity and DOC removal.
The UV radiation dose was fixed at 40 mJ/cm2, as this is the typical dosage in water
treatment industry. The chlorination dose was fixed at Cl2: DOC = 1.8, with the
incubation time of 24 h. Overall, experimental results indicated that higher AOM resulted
in higher DBP formation potential, especially the formation of HAAs. EOM solutions
showed the lower concentration of DBP compared with IOM solutions. Coagulation
slightly reduced the formation of DBPs, as DOC removal was not very significant due to
coagulation.
5.2 Future Directions
Some future directions are presented.
a) Different conditions can be used for coagulation. Some other coagulants and longer
settling time are recommended. Coagulation modeling may be developed based on the
various conditions for better removal of DOC and lower DBP formations.
b) For disinfection process, chlorination may be used as a pretreatment to remove DOC

73
before UV radiation. A better understanding of the correlation between DOC and UV
absorbance at 254 nm should be obtained.
c) The analysis of organic matters of EOM and IOM is necessary to get a better
understanding of the DBP formation. Determination of N-DBPs is highly recommended.

74
References
Abomohra, A.E. & Wagner, M., 2013. Lipid and total fatty acid productivity in
photoautotrophic fresh water microalgae : screening studies towards biodiesel
production. , pp.931–936.
Ai, Y., Bi, Y. & Hu, Z., 2015. Response of predominant phytoplankton species to
anthropogenic impacts in Lake Taihu. Journal of Freshwater Ecology, 30(1), pp.99–
112.
Alija, A.J. et al., 2016. Cyto- and genotoxic potential of water samples from polluted
areas in Kosovo. Environmental Monitoring and Assessment, 188(9), p.501.
Available at: http://link.springer.com/10.1007/s10661-016-5447-4.
Alizadeh Tabatabai, S.A., Schippers, J.C. & Kennedy, M.D., 2014. Effect of coagulation
on fouling potential and removal of algal organic matter in ultrafiltration
pretreatment to seawater reverse osmosis. Water Research, 59, pp.283–294.
Aljundi, I.H., 2011. Bromate formation during ozonation of drinking water: A response
surface methodology study. Desalination, 277(1–3), pp.24–28. Available at:
http://dx.doi.org/10.1016/j.desal.2011.03.090.
Altmann, J. et al., 2016. UV 254 absorbance as real-time monitoring and control
parameter for micropollutant removal in advanced wastewater treatment with
powdered activated carbon. Water Research, 94, pp.240–245. Available at:
http://dx.doi.org/10.1016/j.watres.2016.03.001.
Andrea, W., 2009. Effects of Freezing on UV Inactivation of Waterbourne
Microorganisms.
AquaTreatmentService, 2006. DWS / SE / DWSW Series, U.V. Disinfection installation
and operation manual. , (717), pp.1–39.
Arenas, L.D.O. et al., 2016. Electronic Ballast Design for UV Lamps Based on UV Dose

75
, Applied to Drinking Water Purifier. , 63(8), pp.4816–4825.
Bao, W. et al., 2006. Disinfection of high quality drinking water.
Beach, E.S. et al., 2012. Bioresource Technology Preferential technological and life cycle
environmental performance of chitosan flocculation for harvesting of the green algae
Neochloris oleoabundans. Bioresource Technology, 121, pp.445–449. Available at:
http://dx.doi.org/10.1016/j.biortech.2012.06.012.
Becker, R.H. et al., 2009. Mapping cyanobacterial blooms in the Great Lakes using
MODIS. Journal of Great Lakes Research, 35(3), pp.447–453.
Bolton, J.R. & Linden, K.G., 2003. Standardization of Methods for Fluence (UV Dose)
Determination in Bench-Scale UV Experiments. Journal of Environmental
Engineering, 129(3), pp.209–215.
Bolton, J.R., Linden, K.G. & Asce, M., 2003. Standardization of Methods for Fluence „
UV Dose … Determination in Bench-Scale UV Experiments. , 129(March), pp.209–
215.
Bolton, J.R. & Stefan, M.I., 2002. Fundamental photochemical approach to the concepts
of fluence (UV dose) and electrical energy efficiency in photochemical degradation
reactions. Research on Chemical Intermediates, 28(7), pp.857–870.
Bougeard, C.M.M. et al., 2010. Comparison of the disinfection by-product formation
potential of treated waters exposed to chlorine and monochloramine. Water
Research, 44(3), pp.729–740. Available at:
http://dx.doi.org/10.1016/j.watres.2009.10.008.
Bridgeman, T.B., Chaffin, J.D. & Filbrun, J.E., 2013. A novel method for tracking
western Lake Erie Microcystis blooms, 2002-2011. Journal of Great Lakes
Research, 39(1), pp.83–89.
Canonica, S., Meunier, L. & Gunten, U. Von, 2008. Phototransformation of selected
pharmaceuticals during UV treatment of drinking water. , 42, pp.121–128.

76
CDC, 2008. Drinking Water Treatment Methods for Backcountry and Travel Use. ,
p.2008.
Chang, C.C. et al., 2010. Nitrates in Drinking Water and the Risk of Death from Rectal
Cancer: Does Hardness in Drinking Water Matter? Journal of Toxicology and
Environmental Health-Part a-Current Issues, 73(19), pp.1337–1347.
Chen, F. et al., 2012. Bioresource Technology Using ammonia for algae harvesting and
as nutrient in subsequent cultures. BIORESOURCE TECHNOLOGY, 121, pp.298–
303. Available at: http://dx.doi.org/10.1016/j.biortech.2012.06.076.
Chen, J. et al., 2008. Spectroscopic characterization of the structural and functional
properties of natural organic matter fractions. , 48(2002), pp.59–68.
Chen, L. et al., 2013. Bioresource Technology Optimal conditions of different
flocculation methods for harvesting Scenedesmus sp . cultivated in an open-pond
system. Bioresource Technology, 133, pp.9–15. Available at:
http://dx.doi.org/10.1016/j.biortech.2013.01.071.
Cheng, P. et al., 2015. Coagulation performance and floc properties of Microcystis
aeruginosa in the presence of humic acid. Water Science and Technology: Water
Supply, 15(2), pp.339–347.
Cheng, W., Dastgheib, S.A. & Ã, T.K., 2005. Adsorption of dissolved natural organic
matter by modified activated carbons. , 39, pp.2281–2290.
Chln, Y., Alken, G. & Loughlins, E.O., 1994. Molecular Weight , Polydispersity , and
Spectroscopic Properties of Aquatic Humic Substances. , (11), pp.1853–1858.
Chrlstman, R.F. et al., 1983. Identity and Yields of Major Halogenated Products of
Aquatic Fulvic Acid Chlorination. , 17, pp.625–628.
Costet, N. et al., 2011. Water disinfection by-products and bladder cancer: is there a
European specificity? A pooled and meta-analysis of European case-control studies.
Occupational and Environmental Medicine, 68(5), pp.379–85. Available at:

77
http://www.ncbi.nlm.nih.gov/pubmed/21389011%5Cnhttp://oem.bmj.com/content/6
8/5/379.short.
Cui, C. et al., 2016. Science of the Total Environment Removal of trace level amounts of
twelve sulfonamides from drinking water by UV-activated peroxymonosulfate.
Science of the Total Environment, The, 572, pp.244–251. Available at:
http://dx.doi.org/10.1016/j.scitotenv.2016.07.183.
Cumming, R.B. & Jolley, R.L., 1993. Occurrence and exposures to disinfectants and
disinfection byproducts. In Safety of Water Disinfection: Balancing Chemical and
Microbial Risks. ILSI Press, pp. 257–275.
Dell, J.W.O., 1993. Office of Research and Development. Quality, (December), pp.1–13.
Eagleton, C.J., 1999. IN DRINKING WATER TREATMENT a brief overview 106 years
& still going. , pp.1–31.
EPA330.5, 1978. Chlorine, Total Residual (Spectrophotometric, DPD) CAS. , 4(Issued),
pp.330–332.
EPA334.0, 2009. METHOD 334.0 : DETERMINATION OF RESIDUAL CHLORINE
IN DRINKING WATER USING AN ON-LINE CHLORINE ANALYZER. ,
(September), pp.0–23.
EPA501.2, 1996. EPA Method 501.2. , 2(November 1979), pp.1–12.
EPA502.2, 1995. Capillary Column Gas Chromatography With Photoionization Office of
Research and Development Capillary Column Gas Chromatography With
Photoionization. , 0(1989).
EPA524.2, 1995. Measurement of Purgeable Organic Compounds in Water By Office of
Research and Development. Exposure, 0.
EPA551, 1995. Determination of Chlorination Disinfection Byproducts , Chlorinated
Solvents , and Halogenated Pesticides / Herbicides in Drinking Water By Liquid-

78
Liquid Extraction and Gas Office of Research and Development Chlorinated
Solvents , and Halogenated Pesticid. Environmental Protection, pp.1–61.
EPA551.1, 1995. Determination of Chlorination Disinfection Byproducts , Chlorinated
Solvents , and Halogenated Pesticides / Herbicides in Drinking Water By Liquid-
Liquid Extraction and Gas Office of Research and Development Chlorinated
Solvents , and Halogenated Pesticid. Environmental Protection, pp.1–61.
EPA552, 1990. Determination of Haloacetic Acids in Drinking Water By Liquid- Office
of Research and Development. , (July), pp.1–32.
EPA552.2, 1995. By Liquid-Liquid Extraction , Derivatization and Gas Office of
Research and Development in Drinking Water By Liquid-Liquid Extraction ,
Derivatization. , pp.1–32.
Fang, J., Yang, X., et al., 2010. Characterization of algal organic matter and formation of
DBPs from chlor(am)ination. Water Research, 44(20), pp.5897–5906.
Fang, J., Ma, J., et al., 2010. Formation of carbonaceous and nitrogenous disinfection by-
products from the chlorination of Microcystis aeruginosa. Water Research, 44(6),
pp.1934–1940.
Ghernaout, D. et al., 2014. Coagulation and chlorination of NOM and algae in water
treatment : A review. iInternational journal of Enviromentañ Monitoring and
Analysis, 2(3), pp.23–34.
Gordon, B., Callan, P. & Vickers, C., 2008. WHO guidelines for drinking-water quality.
WHO chronicle, 38(3), p.564. Available at:
http://www.pubmedcentral.nih.gov/articlerender.fcgi?artid=4053895&tool=pmcentr
ez&rendertype=abstract%5Cnhttp://www.who.int/water_sanitation_health/dwq/fullt
ext.pdf%5Cnhttp://whqlibdoc.who.int/publications/2011/9789241548151_eng.pdf?u
a=1.
Grunwald, A. et al., 2002. Formation of organic by-products during chlorination of
natural waters. Journal of environmental monitoring : JEM, 4(6), pp.910–916.

79
Gutierrez, L. et al., 2016. Characterization of Skeletonema costatum intracellular organic
matter and study of nanomechanical properties under different solution conditions.
Colloids and Surfaces A: Physicochemical and Engineering Aspects, 506, pp.154–
161.
Harris, E.H. & Coleman, A.W., 2005. Portrait of a Species : Chlamydomonas reinhardtii
Thomas Pro. , 1610(August), pp.1601–1610.
HealthCanada, 2012. Guidelines for Canadian Drinking Water Quality Summary Table
Prepared by the Federal-Provincial-Territorial Committee on Drinking Water of the
Federal-Provincial-Territorial Committee on Health and the Environment March
2006. Environments, (October 2014), pp.1–16.
Hernández-zamora, M. et al., 2015. Bioremoval of the azo dye Congo Red by the
microalga Chlorella vulgaris. , pp.10811–10823.
Hong, H.C. et al., 2008. Yield of trihalomethanes and haloacetic acids upon chlorinating
algal cells, and its prediction via algal cellular biochemical composition. Water
Research, 42(20), pp.4941–4948. Available at:
http://dx.doi.org/10.1016/j.watres.2008.09.019.
Huang, J. et al., 2009. A comparison of the role of two blue-green algae in THM and
HAA formation. Water Research, 43(12), pp.3009–3018. Available at:
http://dx.doi.org/10.1016/j.watres.2009.04.029.
Hutzinger, O. et al., 2011. The Handbook of Environmental Chemistry, Available at:
http://site.ebrary.com/id/10440032.
IARC, 1999. Iarc Monographs on the Evaluation of Carcinogenic Risks To Humans. Re-
evaluation of some Organic Chemicals Hydrazine and Hydrogen Peroxide, 71,
pp.319–335.
IARC Working Group on the Evaluation of Carcinogenic Risks to Humans, 2010. IARC
monographs on the evaluation of carcinogenic risks to humans. Ingested nitrate and
nitrite, and cyanobacterial peptide toxins. IARC monographs on the evaluation of

80
carcinogenic risks to humans / World Health Organization, International Agency for
Research on Cancer, 94.
Imase, M. et al., 2013. International Biodeterioration & Biodegradation Estimating the
viability of Chlorella exposed to oxidative stresses based around photocatalysis.
International Biodeterioration & Biodegradation, 78, pp.1–6. Available at:
http://dx.doi.org/10.1016/j.ibiod.2012.12.006.
International Agency for Cancer Research, 2002. IARC Monographs on the evaluation of
carcinogenic risks to humans. Some drinking-water disinfectants and contaminants
including arsenic. International Agency for Cancer Research, Lyon, 2002, Volume
84. International Agency for Cancer Research, Lyon, 2002, Volume 84, 84, pp.15–
22.
Jančula, D. & MarŠálek, B., 2011. Critical review of actually available chemical
compounds for prevention and management of cyanobacterial blooms.
Chemosphere, 85(9), pp.1415–1422.
Jin, J., El-Din, M.G. & Bolton, J.R., 2011. Assessment of the UV/Chlorine process as an
advanced oxidation process. Water Research, 45(4), pp.1890–1896. Available at:
http://dx.doi.org/10.1016/j.watres.2010.12.008.
Jones, D.B. et al., 2012. The impact of bromide/iodide concentration and ratio on
iodinated trihalomethane formation and speciation. Water Research, 46(1), pp.11–
20. Available at: http://dx.doi.org/10.1016/j.watres.2011.10.005.
Knappe, D.R.U., Foundation., A.R. & Carolina., W.R.R.I. of the U. of N., 2004. Algae
detection and removal strategies for drinking water treatment plants, Denver, CO:
AWWA Research Foundation : American Water Works Association.
Koohestanian, A., Hosseini, M. & Abbasian, Z., 2008. The Separation Method for
Removing of Colloidal Particles from Raw Water. , 4(2), pp.266–273.
Korshin, G., Benjamin, M. & Chang, H.-S., 2004. Modeling DBP Formation Kinetics:
Mechanistic and Spectroscopic Approaches. , p.184.

81
Krasner, S.W. et al., 2006. Occurrence of a new generation of disinfection byproducts.
Environmental Science and Technology, 40(23), pp.7175–7185.
Krasner, S.W. et al., 2006. The Occurrence of a New Generation of Disinfection By-
Products S1 S2. Environmental science & technology, 40(23), pp.7175–7185.
Kurihara, M. et al., 2012. Brominated methane compounds and isoprene in surface
seawater of Sagami Bay : Concentrations , fl uxes , and relationships with
phytoplankton assemblages. Marine Chemistry, 134–135, pp.71–79. Available at:
http://dx.doi.org/10.1016/j.marchem.2012.04.001.
Lakaniemi, A. et al., 2011. Biogenic hydrogen and methane production from Chlorella
vulgaris and Dunaliella tertiolecta biomass. , pp.1–12.
Leblanc, C. et al., 2014. DIFFERENT SPECIATION FOR BROMINE IN BROWN
AND RED ALGAE , REVEALED BY IN. , 664, pp.652–664.
Lee, J. et al., 2013. Occurrence of disinfection by-products in tap water distribution
systems and their associated health risk. Environmental Monitoring and Assessment,
185, pp.7675–7691. Available at:
http://link.springer.com.ezproxy.ub.unimaas.nl/article/10.1007/s10661-013-3127-1.
Lelong, A. et al., 2012. Pseudo-nitzschia is a globally distributed diatom genus, some
species of which produce domoic acid (DA), the.pdf. Phycologia, 51(2), pp.168–
216.
Li, L. et al., 2012. Characterization of intracellular & extracellular algae organic matters
(AOM) of Microcystic aeruginosa and formation of AOM-associated disinfection
byproducts and odor & taste compounds. Water Research, 46(4), pp.1233–1240.
Available at: http://dx.doi.org/10.1016/j.watres.2011.12.026.
Liang, Y., Lui, Y.S. & Hong, H., 2012. Fatty acids and algal lipids as precursors of
chlorination by-products. Journal of Environmental Sciences (China), 24(11),
pp.1942–1946. Available at: http://dx.doi.org/10.1016/S1001-0742(11)61039-5.
82
Lin, J., Huang, C. & Wang, W.M., 2015. Effect of cell integrity on algal destabilization
by oxidation-assisted coagulation. SEPARATION AND PURIFICATION
TECHNOLOGY, 151, pp.262–268. Available at:
http://dx.doi.org/10.1016/j.seppur.2015.07.064.
Liu, C. et al., 2009. Chemosphere Photodegradation of etridiazole by UV radiation during
drinking water treatment. Chemosphere, 76(5), pp.609–615. Available at:
http://dx.doi.org/10.1016/j.chemosphere.2009.04.052.
Liu, X. et al., 2013. An Optimized Analytical Method for the Simultaneous Detection of
Iodoform, Iodoacetic Acid, and Other Trihalomethanes and Haloacetic Acids in
Drinking Water. PLoS ONE, 8(4).
Lui, Y.S. et al., 2011. Algal-derived organic matter as precursors of disinfection by-
products and mutagens upon chlorination. Water Research, 45(3), pp.1454–1462.
Available at: http://dx.doi.org/10.1016/j.watres.2010.11.007.
Lui, Y.S. et al., 2012. Fractionated algal organic materials as precursors of disinfection
by-products and mutagens upon chlorination. Journal of Hazardous Materials, 209–
210, pp.278–284. Available at: http://dx.doi.org/10.1016/j.jhazmat.2012.01.023.
Lv, H. et al., 2014. Temperature and nutrients are significant drivers of seasonal shift in
phytoplankton community from a drinking water reservoir, subtropical China.
Environmental Science and Pollution Research, 21(9), pp.5917–5928.
Lyon, B. a et al., 2014. Integrated Chemical and Toxicological Investigation of UV-
Chlorine/Chloramine Drinking Water Treatment. Environmental science &
technology, 48, pp.6743–53. Available at:
http://www.ncbi.nlm.nih.gov/pubmed/24840005.
Majewski, J., 2012. Methods for measuring ozone concentration in ozone-treated water. ,
(9), pp.253–255.
Mark, A., 2002. Survey of DOC and UV measurement practices with implications for
SUVA determination.

83
McGuire, M.L., McLain, J.L. & Obolensky, A., 2002. Information Collection Rule Data
Analysis. AWWA Research Foundation, p.628.
McKie, M.J. et al., 2015. Engineered biofiltration for the removal of disinfection by-
product precursors and genotoxicity. Water Research, 81(SEPTEMBER), pp.196–
207. Available at: http://linkinghub.elsevier.com/retrieve/pii/S0043135415300178.
Merel, S. et al., 2013. State of knowledge and concerns on cyanobacterial blooms and
cyanotoxins. Environment International, 59, pp.303–327.
Meza, B., Luz, E. & Bashan, Y., 2015. Involvement of indole-3-acetic acid produced by
Azospirillum brasilense in accumulating intracellular ammonium in Chlorella
vulgaris. Research in Microbiologoy, 166(2), pp.72–83. Available at:
http://dx.doi.org/10.1016/j.resmic.2014.12.010.
Michalak, A.M. et al., 2013. Record-setting algal bloom in Lake Erie caused by
agricultural and meteorological trends consistent with expected future conditions.
Proceedings of the National Academy of Sciences of the United States of America,
110(16), pp.6448–6452.
Moslemi, M., Davies, S.H. & Masten, S.J., 2012. Empirical modeling of bromate
formation during drinking water treatment using hybrid ozonation membrane
filtration. Desalination, 292, pp.113–118. Available at:
http://dx.doi.org/10.1016/j.desal.2012.02.015.
Munch, J.W. & Bassett, M.V., 2004. Determination of Nitrosamines in Drinking Water.
EPA Document, pp.1–47.
Nguvava, M. et al., 2016. Nutrient limitation in two marine diatoms inhibits release of
bromoform. , 38(4), pp.581–588.
Pan, Y. & Zhang, X., 2013. Four groups of new aromatic halogenated disinfection
byproducts: Effect of bromide concentration on their formation and speciation in
chlorinated drinking water. Environmental Science and Technology, 47(3), pp.1265–
1273.

84
Pan, Y., Zhang, X. & Zhai, J., 2015. Whole pictures of halogenated disinfection
byproducts in tap water from China’s cities. Frontiers of Environmental Science &
Engineering, 9(1), pp.121–130. Available at:
http://link.springer.com/10.1007/s11783-014-0727-0.
Papazi, A., Makridis, P. & Divanach, P., 2010. Harvesting Chlorella minutissima using
cell coagulants. , (November 2008), pp.349–355.
Pick, F.R., 2016. Blooming algae: a Canadian perspective on the rise of toxic
cyanobacteria. Canadian Journal of Fisheries and Aquatic Sciences, 73(7), pp.1–10.
Pivokonsky, M. et al., 2014. A comparison of the character of algal extracellular versus
cellular organic matter produced by cyanobacterium, diatom and green alga. Water
Research, 51, pp.37–46. Available at:
http://dx.doi.org/10.1016/j.watres.2013.12.022.
Pivokonsky, M. et al., 2015. The impact of algogenic organic matter on water treatment
plant operation and water quality: a review. Critical Reviews in Environmental
Science and Technology, 3389(October), pp.00–00. Available at:
http://www.tandfonline.com/doi/full/10.1080/10643389.2015.1087369.
Pivokonsky, M., Kloucek, O. & Pivokonska, L., 2006. Evaluation of the production ,
composition and aluminum and iron complexation of algogenic organic matter. , 40,
pp.3045–3052.
Public, A. & Association, H., 1992. APHA Method 4500-CL: Standard Methods for the
Examination of Water and Wastewater. , 552(4).
Rees, T.A. V & Victoria, J., 2006. Evidence for an extracellular L-amino acid oxidase in
... , (May).
Reynolds, C.S. & Walsby, A., 1975. Water-Blooms. Biological reviews, 50(4), pp.437–
481.
Richardson, S.D. et al., 2007. Occurrence, genotoxicity, and carcinogenicity of regulated

85
and emerging disinfection by-products in drinking water: A review and roadmap for
research. Mutation Research - Reviews in Mutation Research, 636(1–3), pp.178–
242.
Robert R. L. Guilard, J.H.R., 2014. A re-investigation of Chrysotila (Prymnesiophyceae)
using material collected from the type locality. , 53(October), pp.463–473.
Robert R. L. Guilard, J.H.R., 1962. STUDIES OF MARINE PLANKTONIC DIATOMS.
, 8(1140).
Roccaro, P. & Vagliasindi, F.G.A., 2010. Monitoring emerging chlorination by-products
in drinking water using UV-absorbance and fl uorescence indexes. , 23, pp.118–122.
Roccaro, P., Yan, M. & Korshin, G. V, 2015. Use of log-transformed absorbance spectra
for online monitoring of the reactivity of natural organic matter. Water Research,
84, pp.136–143. Available at: http://dx.doi.org/10.1016/j.watres.2015.07.029.
Rochaix, J., 2002. The three genomes of Chlamydomonas. , pp.285–293.
Rwehumbiza, V.M., Harrison, R. & Thomsen, L., 2012. Alum-induced flocculation of
preconcentrated Nannochloropsis salina : Residual aluminium in the biomass ,
FAMEs and its effects on microalgae growth upon media recycling. Chemical
Engineering Journal, 200–202, pp.168–175. Available at:
http://dx.doi.org/10.1016/j.cej.2012.06.008.
SDWF, 2012. Comparison Chart of Drinking Water: Standards from around the World. ,
pp.2–5.
Sommer, R. et al., 2008. Disinfection of Drinking Water by UV Irradiation : Basic
Principles - Specific Requirements - International Implementations. , (February),
pp.43–48.
Standardization Administration of the People’s Republic of China, 2006. Chinese
Sanitary Standards for Drinking Water (GB 5749-2006).pdf.

86
Summers, R.S., 1996. ASSESSING DBP YIELD: UFC.
Technologies, T., 2006. UV, An Effective Approved Method of Disinfection. , pp.1–5.
Trang, V.N. et al., 2014. Pilot study on the removal of TOC , THMs , and HAAs in
drinking water using ozone / UV – BAC. , 52(September 2012), pp.990–998.
US-EPA, 2006. National primary drinking water regulations: Long Term 2 Enhanced
Surface Water Treatment Rule. Federal Register, 71(3), pp.654–702. Available at:
http://www.epa.gov/EPA-WATER/2006/January/Day-05/w04a.pdf.
USEPA, 2011a. Analytical Methods Approved for Drinking Water Compliance
Monitoring of Organic Contaminants. , (June), pp.1–25.
USEPA, 2010. Comprehensive Disinfectants and Disinfection Byproducts Rules ( Stage
1 and Stage 2 ): Quick Reference Guide Overview of the Rules. , pp.2–5. Available
at: http://nepis.epa.gov/Exe/ZyPDF.cgi?Dockey=P100C8XW.txt.
USEPA, 2011b. EPA Drinking Water Guidance on Disinfection By-Products Advice
Note No. 4. Version 2. Disinfection By-Products in Drinking Water. , (4), pp.1–27.
USEPA, 1991. Guidance manual for compliance with the filtration and disinfection
requirements for public water systems using surface water sources.
USEPA, 1999a. Microbial and disinfection byproduct rules simultaneous compliance
guidance manual. , (August).
USEPA, 2006. National Primary Drinking Water Regulations Stage 2 Disinfectants and
Disinfection Byproducts Rule. Federal Register, 71(2), pp.388–493.
USEPA, 1999b. Wastewater Technology Fact Sheet Ozone Disinfection.
USEPA552.3, 2003. Method 552.3: Determination of Haloacetic Acids and Dalapon in
Drinking Water by Liquid-Liquid Microextraction, Derivatization, and Gas
Chromatography with Electron Capture Detection. , (1990), pp.1–55.

87
Vandamme, D. & Foubert, I., 2010. Flocculation of microalgae using cationic starch. ,
pp.525–530.
Vandamme, D., Foubert, I. & Muylaert, K., 2013. Flocculation as a low-cost method for
harvesting microalgae for bulk biomass production. Trends in Biotechnology, 31(4),
pp.233–239. Available at: http://dx.doi.org/10.1016/j.tibtech.2012.12.005.
Villacorte, L.O. et al., 2015. Characterisation of algal organic matter produced by bloom-
forming marine and freshwater algae. Water Research, 73, pp.216–230.
Villacorte, L.O. et al., 2015. ScienceDirect Characterisation of algal organic matter
produced by bloom-forming marine and freshwater algae. Water Research, 73,
pp.216–230. Available at: http://dx.doi.org/10.1016/j.watres.2015.01.028.
Wang, D. et al., 2015. Chemosphere UV / chlorine control of drinking water taste and
odour at pilot and full-scale. Chemosphere, 136, pp.239–244. Available at:
http://dx.doi.org/10.1016/j.chemosphere.2015.05.049.
Wang, P., Shen, H. & Xie, P., 2012. Can Hydrodynamics Change Phosphorus Strategies
of Diatoms?—Nutrient Levels and Diatom Blooms in Lotic and Lentic Ecosystems.
Microbial Ecology, 63(2), pp.369–382.
Wang, X. et al., 2014. Disinfection byproducts in drinking water and regulatory
compliance: A critical review. Frontiers of Environmental Science & Engineering,
9(1), pp.3–15.
Water, A. & Centre, Q., 2007. Effect of Chlorination on Microcystis aeruginosa Cell
Integrity and Subsequent Microcystin Release and Degradation. , pp.4447–4453.
Weinberg, H.S. et al., 2002. The Occurrence of Disinfection By-Products (DBPs) of
Health Concern in Drinking Water: Results of a Nationwide DBP Occurrence Study.
, (September), p.462p.
Wenhai, C. et al., 2016. Ecotoxicology and Environmental Safety IncreaseWenhai, C.,
Tengfei, C., Erdeng, D., Deng, Y., Yingqing, G., & Naiyun, G. (2016).

88
Ecotoxicology and Environmental Safety Increased formation of halomethanes
during chlorination of chloramphenicol in drinking . Ecotoxicology and
Environmental Safety, 124, pp.147–154. Available at:
http://dx.doi.org/10.1016/j.ecoenv.2015.10.016.
WHO, 1991. IARC Monographs on the Evaluation of Carcinogenic Risks to Humans.
Who, p.523.
WolrdChlorineCouncil, 2008. Drinking Water Chlorination. Wolrd Chlorine Council,
p.8.
Xie, P. et al., 2016. Chemosphere A mini review of preoxidation to improve coagulation.
Chemosphere, 155, pp.550–563. Available at:
http://dx.doi.org/10.1016/j.chemosphere.2016.04.003.
Xie, S.-H. et al., 2010. DNA damage and oxidative stress in human liver cell L-02 caused
by surface water extracts during drinking water treatment in a waterworks in China.
Environmental and molecular mutagenesis, 51(3), pp.229–235.
Xu, B. et al., 2010. Authors ’ response to comments on “ Inhibiting the regeneration of N
-nitrosodimethylamine in drinking water by UV photolysis combined with ozonation
” by F . Xiao. , 177(2), pp.1167–1169.
Xu, B. et al., 2009a. Inhibiting the regeneration of N -nitrosodimethylamine in drinking
water by UV photolysis combined with ozonation. , 168, pp.108–114.
Xu, B. et al., 2009b. Rapid degradation of new disinfection by-products in drinking water
by UV irradiation : N -Nitrosopyrrolidine and N -nitrosopiperidine. , 69, pp.126–
133.
Yang, D. & Li, W., 2016. Methanol-Promoted Lipid Remodelling during Cooling
Sustains Cryopreservation Survival of Chlamydomonas reinhardtii. , pp.1–18.
Yang, X., Guo, W. & Shen, Q., 2011. Formation of disinfection byproducts from
chlor(am)ination of algal organic matter. Journal of Hazardous Materials, 197,

89
pp.378–388. Available at: http://dx.doi.org/10.1016/j.jhazmat.2011.09.098.
Ying, A., Yonghong, B. & Zhengyu, H., 2015. Response of predominant phytoplankton
species to anthropogenic impacts in Lake Taihu. Journal of Freshwater Ecology,
30(1), pp.99–112. Available at: http://dx.doi.org/10.1080/02705060.2014.992052.
Yuan, R. et al., 2013. Enhanced photocatalytic degradation of humic acids using Al and
Fe co-doped TiO 2 nanotubes under UV / ozonation for drinking water purification.
Journal of Hazardous Materials, 262, pp.527–538. Available at:
http://dx.doi.org/10.1016/j.jhazmat.2013.09.012.
Zerbe, J. & Siepak, J., 2001. Drinking water quality standards and methods of its
enforcement in Poland. Przeglad lekarski, 58 Suppl 7, pp.5–9.
Zha, X. song et al., 2014. Effects of bromide and iodide ions on the formation of
disinfection by-products during ozonation and subsequent chlorination of water
containing biological source matters. Environmental Science and Pollution
Research, 21(4), pp.2714–2723.
Zhang, S.H. et al., 2010. Assessment of the cytotoxicity and genotoxicity of haloacetic
acids using microplate-based cytotoxicity test and CHO/HGPRT gene mutation
assay. Mutation Research - Genetic Toxicology and Environmental Mutagenesis,
703(2), pp.174–179. Available at: http://dx.doi.org/10.1016/j.mrgentox.2010.08.014.
Zhang, T.-Y. et al., 2016. Formation of organic chloramines during chlor(am)ination and
UV/chlor(am)ination of algae organic matter in drinking water. Water Research,
103, pp.189–196. Available at:
http://linkinghub.elsevier.com/retrieve/pii/S0043135416305486.
Zhang, Y.L. et al., 2014. Genotoxicity of disinfection by-products (DBPs) upon
chlorination of nine different freshwater algal species at variable reaction time.
Journal of Water Supply: Research and Technology - Aqua, 63(1), p.12 LP-20.
Available at: http://aqua.iwaponline.com/content/63/1/12.abstract.
Zhao, Y. et al., 2012. Occurrence and formation of chloro- and bromo-benzoquinones

90
during drinking water disinfection. Water Research, 46(14), pp.4351–4360.
Available at: http://dx.doi.org/10.1016/j.watres.2012.05.032.
Zheng, H. et al., 2012. Harvesting of microalgae by flocculation with poly ( c -glutamic
acid ). Bioresource Technology, 112, pp.212–220. Available at:
http://dx.doi.org/10.1016/j.biortech.2012.02.086.
Zheng, Q. et al., 2016. Characterization of natural organic matter in water for optimizing
water treatment and minimizing disinfection by-product formation. Journal of
Environmental Sciences, 42, pp.1–5. Available at:
http://linkinghub.elsevier.com/retrieve/pii/S1001074216300341.

91
Appendices
Appendix A:
Figure A-1 Growth of four different algae at Western University
Figure A-2 Coagulation jar test setup

92
Figure A-3 UV bench-scale apparatus
Figure A-4 Water sample exposed under collimated beam

93
Figure A-5 Collimated beam UV calibration spreadsheets-step (a)
Figure A-6 Collimated beam UV calibration spreadsheets-step (b)

94
Figure A-7 Chlorination bottle with PTFE cap and aluminum foil

95
Appendix B:
Figure B-1 Calibration Curve of Chloroform
Figure B-2 Calibration Curve of Bromoform
y = 0.1727x + 26.304 R² = 0.92076
0
50
100
150
200
250
300
350
0 200 400 600 800 1000 1200 1400 1600
Cocentraoo
n (ppb
)
Peak Area/1000
Calibraoon Curve of Bromoform

96
Figure B-3 Calibration Curve of Bromodichloroform
Figure B-4 Calibration Curve of MBAA
y = 0.1918x + 12.352 R² = 0.94222 0
50
100
150
200
250
300
350
0 200 400 600 800 1000 1200 1400 1600
Cocentraoo
n (ppb
)
Peak Area/1000
Calibraoon Curve of Bromodichloroform

97
Figure B-5 Calibration Curve of DCAA
Figure B-6 Calibration Curve of TCAA

98
Curriculum Vitae
Name: Tianyiru (Eve) Chen Post-‐secondary East China University of Science and Technology Education and Shanghai, Canada Degrees: 2010-‐2014 B.Sc.
Western University London, Ontario, Canada 2015-‐2016 M.E.Sc.
Related Work Teaching Assistant Experience Western University
2015-‐2016RR