Disinfection by-product formation and minimisation in ... › publications › UWSRA-tr23.pdf ·...
68
Disinfection By-product Formation and Minimisation in South East Queensland Drinking Water Nicole Knight 1 , Glen Shaw 1 , Ross Sadler 1 , Wasantha Wickramasinghe 2 October 2010 Urban Water Security Research Alliance Technical Report No. 23
Transcript of Disinfection by-product formation and minimisation in ... › publications › UWSRA-tr23.pdf ·...

Disinfection By-product Formation and Minimisation in South East Queensland Drinking Water Nicole Knight1, Glen Shaw1, Ross Sadler1, Wasantha Wickramasinghe2 October 2010
Urban Water Security Research AllianceTechnical Report No. 23

Urban Water Security Research Alliance Technical Report ISSN 1836-5566 (Online) Urban Water Security Research Alliance Technical Report ISSN 1836-5558 (Print) The Urban Water Security Research Alliance (UWSRA) is a $50 million partnership over five years between the Queensland Government, CSIRO’s Water for a Healthy Country Flagship, Griffith University and The University of Queensland. The Alliance has been formed to address South East Queensland's emerging urban water issues with a focus on water security and recycling. The program will bring new research capacity to South East Queensland tailored to tackling existing and anticipated future issues to inform the implementation of the Water Strategy. For more information about the:
UWSRA - visit http://www.urbanwateralliance.org.au/ Queensland Government - visit http://www.qld.gov.au/ Water for a Healthy Country Flagship - visit www.csiro.au/org/HealthyCountry.html The University of Queensland - visit http://www.uq.edu.au/ Griffith University - visit http://www.griffith.edu.au/
Enquiries should be addressed to: The Urban Water Security Research Alliance PO Box 15087 CITY EAST QLD 4002 Ph: 07-3247 3005; Fax: 07-3405 3556 Email: [email protected]
Authors: 1 – Griffith University; 2 – University of Queensland Knight, N.L., Shaw, G.R., Sadler, R.F., Wickramasinghe, W.A., (2010). Disinfection By-product Formation and Minimisation in South East Queensland Drinking Water. Urban Water Security Research Alliance Technical Report No. 23.
Copyright
© 2010 GU. To the extent permitted by law, all rights are reserved and no part of this publication covered by copyright may be reproduced or copied in any form or by any means except with the written permission of GU.
Disclaimer
The partners in the UWSRA advise that the information contained in this publication comprises general statements based on scientific research and does not warrant or represent the accuracy, currency and completeness of any information or material in this publication. The reader is advised and needs to be aware that such information may be incomplete or unable to be used in any specific situation. No action shall be made in reliance on that information without seeking prior expert professional, scientific and technical advice. To the extent permitted by law, UWSRA (including its Partner’s employees and consultants) excludes all liability to any person for any consequences, including but not limited to all losses, damages, costs, expenses and any other compensation, arising directly or indirectly from using this publication (in part or in whole) and any information or material contained in it.
Cover Photograph:
Description: North Pine Dam Photographer: Nicole Knight © Nicole Knight
Disinfection By-product Formation and Minimisation in South East Queensland Drinking Water Page i
ACKNOWLEDGEMENTS
This research was undertaken as part of the South East Queensland Urban Water Security Research Alliance, a scientific collaboration between the Queensland Government, CSIRO, The University of Queensland and Griffith University. Particular thanks go to: Dr Maria José Farré and colleagues at the Advanced Water Management Centre, The University of Queensland for assistance with NDMA formation potential experiments for Mt Crosby and North Pine Dam, as well as NDMA and THM minimisation experiments using UV/H2O2 and ozonation. Kalinda Watson from the Smart Water Research Centre and Cherie Yin Lam Ng from Hong Kong City University for research assistance. Stewart Carswell and Eva Comino from Queensland Health Forensic and Scientific Services for coordinating the statewide THM and HAA survey, including running analysis and collating data. Neil Holling from Queensland Health Forensic and Scientific Services for nitrosamine analysis and Vince Alberts and McKenzie Lim from Queensland Health Forensic and Scientific Services for trihalomethane analysis. The Smart Water Research Centre and Professor Joe Lee from the Australian Rivers Institute at Griffith University for provision of Laboratory space and resources. Arron Lethorn from Water Corporation in Western Australia for assistance with sampling Wanneroo Wastewater Treatment Plant. Seqwater staff: Allan Morris, Daniel Haynes, Dapo Kufeji, Rob Townsley, Craig Bolin and Simon Rotherham, for assistance with sampling and technical advice.
Disinfection By-product Formation and Minimisation in South East Queensland Drinking Water Page ii
FOREWORD
Water is fundamental to our quality of life, to economic growth and to the environment. With its booming economy and growing population, Australia's South East Queensland (SEQ) region faces increasing pressure on its water resources. These pressures are compounded by the impact of climate variability and accelerating climate change. The Urban Water Security Research Alliance, through targeted, multidisciplinary research initiatives, has been formed to address the region’s emerging urban water issues. As the largest regionally focused urban water research program in Australia, the Alliance is focused on water security and recycling, but will align research where appropriate with other water research programs such as those of other SEQ water agencies, CSIRO’s Water for a Healthy Country National Research Flagship, Water Quality Research Australia, eWater CRC and the Water Services Association of Australia (WSAA). The Alliance is a partnership between the Queensland Government, CSIRO’s Water for a Healthy Country National Research Flagship, The University of Queensland and Griffith University. It brings new research capacity to SEQ, tailored to tackling existing and anticipated future risks, assumptions and uncertainties facing water supply strategy. It is a $50 million partnership over five years. Alliance research is examining fundamental issues necessary to deliver the region's water needs, including: ensuring the reliability and safety of recycled water systems. advising on infrastructure and technology for the recycling of wastewater and stormwater. building scientific knowledge into the management of health and safety risks in the water supply
system. increasing community confidence in the future of water supply. This report is part of a series summarising the output from the Urban Water Security Research Alliance. All reports and additional information about the Alliance can be found at http://www.urbanwateralliance.org.au/about.html. Chris Davis Chair, Urban Water Security Research Alliance

Disinfection By-product Formation and Minimisation in South East Queensland Drinking Water Page iii
CONTENTS
Acknowledgements .................................................................................................................i
Foreword .................................................................................................................................ii
List of Figures.........................................................................................................................v
List of Tables..........................................................................................................................vi
List of Abbreviations ............................................................................................................vii
Executive Summary................................................................................................................1
1. Introduction ...................................................................................................................2 1.1. DBPs: History and Scope of the Problem...........................................................................2
1.2. Trihalomethanes: Toxicology..............................................................................................2
1.3. Trihalomethanes: Formation...............................................................................................3
1.4. Haloacetic Acids ..................................................................................................................4
1.5. Bromate ...............................................................................................................................4
1.6. Chlorite and Chlorate...........................................................................................................4
1.7. N-Nitrosodimethylamine: Toxicology and Prevalence........................................................4
1.8. NDMA Formation .................................................................................................................5
1.9. Emerging (Unregulated) DBPs ............................................................................................6
1.10. DBPs from Anthropogenic Contaminants............................................................................7
1.11. DBPs from Alternative Disinfection Methods.......................................................................7
1.12. Alternative Water Sources ...................................................................................................7
1.13. Disinfection Methods............................................................................................................7 1.13.1. Chlorination ...................................................................................................................... 7 1.13.2. Ozonation ......................................................................................................................... 7 1.13.3. Chloramination ................................................................................................................. 8 1.13.4. UV/H2O2 ........................................................................................................................... 8 1.13.5. Chlorine Dioxide ............................................................................................................... 8
1.14. Disinfection By-products from Individual Disinfection Methods...........................................9
1.15. Strategies for Controlling DBP Formation ...........................................................................9
2. Experimental Methods ................................................................................................10 2.1. Sampling, Preservation and Storage.................................................................................10
2.2. Sampling Sites ...................................................................................................................10
2.3. Reagents............................................................................................................................11
2.4. Water Treatment Procedures ............................................................................................11 2.4.1. Chlorination (for THM Formation Potential) .................................................................... 11 2.4.2. Chloramination (for THM Formation Potential) ............................................................... 11 2.4.3. Chlorination (for Maximum Nitrosamine Formation Potential) ........................................ 12 2.4.4. Chloramination (for Maximum Nitrosamine Formation Potential) ................................... 12 2.4.5. UV Treatment ................................................................................................................. 12 2.4.6. UV/H2O2 ......................................................................................................................... 12 2.4.7. Ozone............................................................................................................................. 12 2.4.8. ClO2/O3........................................................................................................................... 12 2.4.9. NH2Cl/O3 ........................................................................................................................ 13 2.4.10. Coagulation with Lime Softening .................................................................................... 13 2.4.11. DBP Removal and DBP Precursor Removal by Norit 1240W GAC and Norit W35
PAC ................................................................................................................................ 13
2.5. Analytical Methods and Analysis .......................................................................................13 2.5.1. Nitrosamines................................................................................................................... 13 2.5.2. Trihalomethanes............................................................................................................. 14

Disinfection By-product Formation and Minimisation in South East Queensland Drinking Water Page iv
2.5.3. Natural Organic Matter ................................................................................................... 14 2.5.4. Chlorine Quantitation...................................................................................................... 14 2.5.5. Chloramine Quantitation................................................................................................. 14 2.5.6. Hydrogen Peroxide Quantification .................................................................................. 14 2.5.7. Ozone Quantitation......................................................................................................... 14 2.5.8. Anion Analysis ................................................................................................................ 14
2.6. Quality Control and Uncertainties ......................................................................................14
3. Results and Discussion..............................................................................................15 3.1. NDMA Formation Potentials ..............................................................................................15
3.2. THM Formation Potentials .................................................................................................20
3.3. Natural Organic Matter Concentrations .............................................................................24
3.4. UV/H2O2 .............................................................................................................................25 3.4.1. NDMA............................................................................................................................. 25 3.4.2. THMs.............................................................................................................................. 26
3.5. Ozonation...........................................................................................................................28
3.6. Coagulation at High pH......................................................................................................31
3.7. Nitrosamines and MIEX Resin, Norit 1240W GAC and Norit W35 PAC ...........................35
4. Survey of THM and HAA Levels in Queensland Drinking Water Over One Year of Sampling .........................................................................................................36 4.1. Experimental Methods .......................................................................................................36
4.1.1. Sampling Sites................................................................................................................ 36 4.1.2. Trihalomethanes Analysis .............................................................................................. 38 4.1.3. Haloacetic Acids Analysis............................................................................................... 38
4.2. Overview ............................................................................................................................38
4.3. Regions Exceeding ADWG Values for tTHMs...................................................................45
4.4. Regions Exceeding ADWG Values for Haloacetic Acid (HAAs)........................................47
4.5. Conclusions from THM and HAA Survey...........................................................................51
5. Conclusions.................................................................................................................53
6. Recommendations ......................................................................................................55
ReferenceS............................................................................................................................56

Disinfection By-product Formation and Minimisation in South East Queensland Drinking Water Page v
LIST OF FIGURES Figure 1: A reaction mechanism responsible for the formation of chloroform in drinking water. ....................... 3 Figure 2: The five known nitrosamines which have been identified as disinfection by-products....................... 5 Figure 3: Simplified reaction showing NDMA formation in water from dimethylamine and
monochloramine. ............................................................................................................................... 6 Figure 4: An example from each of the main emerging classes of DBPs is shown. These are the
halonitromethanes, iodo-acids, iodo-THMs, aldehydes, halofuranones, haloamides, and haloacetonitriles. ............................................................................................................................... 6
Figure 5: Monochloramine, dichloramine and trichloramine are formed from reaction between ammonia and hypochlorous acid. ...................................................................................................... 8
Figure 6: Map of the Logan River catchment showing the proposed location of the Wyaralong dam on Teviot Brook(56). ............................................................................................................................... 10
Figure 7: NDMA formation potentials for West bank, Mt Crosby WTP are shown, demonstrating the decrease in formation potential observed for pre-chlorinated water samples, compared to samples which were not pre-chlorinated. ........................................................................................ 15
Figure 8: Relationship between NDMA formation potential and DOC/DON at site 2 (Teviot Brook). NDMA formation potential and DOC/DON vary inversely with each other over time....................... 16
Figure 9: NDMA formation potential as it varies with DOC/DON (R2 = 0.64). Samples taken from sites 1-3 (Teviot Brook and Logan River). ............................................................................................... 17
Figure 10: Molendinar WTPs source water NDMA formation potential for water with and without prior exposure to polyDADMAC during the treatment process. ............................................................... 18
Figure 11: NDMA formation potentials found for all regions included in this study, ranging from February 2009 to January 2010. ..................................................................................................... 20
Figure 12: tTHM formation potential over time for raw water from Lander’s Shute WTP. It was a generally observed trend that chloramination led to significantly lower tTHM concentrations than chlorination. ............................................................................................................................. 21
Figure 13: tTHM formation potential from chlorination and chloramination for raw water from Molendinar WTP over 3 months......................................................................................................................... 21
Figure 14: tTHM formation potentials for Teviot Brook and Logan River sites 2 and 4, from chlorination and chloramination over 3 months. ................................................................................................. 22
Figure 15: Mean concentrations of each of the four regulated THMs arising from chlorination for a number of source waters. Each site was sampled 4 times excluding Traveston Crossing, which was sampled twice. ............................................................................................................... 23
Figure 16: Mean concentrations of each of the four regulated THMs arising from chloramination for a number of source waters. Each site was sampled 4 times excluding Traveston Crossing, which was sampled twice. ............................................................................................................... 23
Figure 17: Variation in TOC, DOC and DON in Teviot Brook – site 3 source water. ........................................ 24 Figure 18: Decay curve showing decreasing NDMA concentration with increasing UV dose........................... 25 Figure 19: Change in NDMA concentration with advanced oxidation treatment. Samples were spiked
with NDMA and treated with increasing concentrations of [H2O2] while the UV dose was held constant at 30 mJ/cm2 for all samples except the first (untreated) replicates. ................................. 26
Figure 20: Variation in tTHM formation potential with increasing [H2O2] with UV irradiation pre-treatment, and before chlorination or chloramination. (i) tTHM formation potential decreases with UV irradiation alone, then further with H2O2 addition. (ii) H2O2 addition, after UV dosing, decreases tTHM formation potential dramatically............................................................................ 27
Figure 21: Lowering dissolved organic carbon and dissolved organic nitrogen by coagulation using polyDADMAC, ferric chloride or alum. Replicates are shown for two sampling events. .................. 31
Figure 22: Alum and FeCl3 were ineffective at removing NDMA precursors from Teviot Brook source water. PolyDADMAC contains NDMA precursors which led to high NDMA formation potentials for the same source water after exposure. NDMA formation potential did not vary with DOC:DON ratio, further indicating that NDMA precursors were essentially unaffected by the coagulation process................................................................................................................... 32
Figure 23: Concentration of four THMs as their formation potential varies with DOC after coagulation. (i) Data from Teviot Brook, water sampled 16/10/2009 (ii) data from Teviot Brook, water sampled 28/10/2009. ....................................................................................................................... 34
Figure 24: Map of Queensland showing all regions which were sampled as a part of this study. A detailed view of the boxed area of the Queensland map is shown in Figure 25. ............................. 37
Figure 25: South East Queensland, showing all regions sampled in this study. The major dams/lakes used for water supply in the area are also shown. .......................................................................... 37

Disinfection By-product Formation and Minimisation in South East Queensland Drinking Water Page vi
Figure 26: (i) Proportion of different drinking water disinfection methods employed in Queensland regions examined in this study. (ii) Proportion of different water sources utilised for drinking water across the regions studied here............................................................................................. 38
Figure 27: Variation in tTHM concentration between warmer and colder months, as well as between different disinfection methods. Upper and lower points of each box plot show the actual maxima and minima for each dataset, and the yellow triangle indicates the median tTHM concentration................................................................................................................................... 41
Figure 28: Distribution of chloroform concentrations for chlorinated, chloraminated and chlorinated/chloraminated drinking waters. Upper and lower points of each box plot show the actual maxima and minima for each dataset, and the yellow triangle indicates the median tTHM concentration. ........................................................................................................................ 41
Figure 29: Variation in BDCM concentrations in chlorinated, chloraminated and chlorinated/chloraminated drinking waters. Upper and lower points of each box plot show the actual maxima and minima for each dataset, and the yellow triangle indicates the median tTHM concentration. ........................................................................................................................ 42
Figure 30: Distribution of DBCM concentrations for chlorinated, chloraminated and chlorinated/chloraminated drinking waters. Upper and lower points of each box plot show the actual maxima and minima for each dataset, and the yellow triangle indicates the median tTHM concentration. ........................................................................................................................ 42
Figure 31: Distribution of bromoform concentrations for chlorinated, chloraminated and chlorinated/chloraminated drinking waters. Upper and lower points of each box plot show the actual maxima and minima for each dataset, and the yellow triangle indicates the median tTHM concentration. ........................................................................................................................ 43
Figure 32: Proportion of brominated to non-brominated THMs arising from different disinfection methods........................................................................................................................................... 43
Figure 33: Proportion of individual THMs from different water sources. ........................................................... 44 Figure 34: Variation in chloroform concentration in from E-WTP over 9 months of sampling. In this case
the other regulated THMs were generally undetected regardless of whether chlorination or chloramination were employed........................................................................................................ 44
Figure 35: World Health Organisation recommendations for THM concentrations in drinking water. Importantly, the sum of the ratio of each THM to its guideline value should not exceed one. ......... 45
Figure 36: Change in tTHM concentration in drinking water in Region A over 12 months................................ 46 Figure 37: Change in tTHM concentrations in Region E’s drinking water, over the one-year sampling
period. ............................................................................................................................................. 46 Figure 38: Variation in tTHM concentration in drinking water in Region T over ten months. ............................ 47 Figure 39: Worldwide guideline values for regulated HAAs (current in 2010)................................................... 49 Figure 40: Trichloroacetic acid concentration in drinking water of Region A over the twelve-month
monitoring period............................................................................................................................. 50 Figure 41: Trichloroacetic acid concentration in water from the Region E over the twelve-month
monitoring period............................................................................................................................. 51
LIST OF TABLES Table 1: Average concentrations of organic carbon and organic nitrogen for various SEQ sites. Data
are the mean of four independent sampling events in all cases except Traveston Crossing, which was sampled twice. ............................................................................................................... 24
Table 2: Preliminary data on DBP formation from ozonation, based on replicate samples (Raw water (1) and Raw water (2)) taken from Teviot Brook on 11/11/09. The table indicates concentrations of contaminants after dosing with approx. 2 mg/L ozone alone, 1.5 mg/L ClO2 followed by approx. 2 mg/L ozone, or 1.5 mg/L chloramine followed by approx. 2 mg/L ozone. Some initial parameters for untreated (raw) water sampled 18/11/09 are also presented. ....................................................................................................................................... 30
Table 3: Source waters and disinfection methods used in each of the regions studied................................. 36 Table 4: Summary of data for trihalomethane levels in Queensland drinking waters, averaged over
one year of sampling. ...................................................................................................................... 39 Table 5: Average annual THM concentrations (μg/L) for the year of sampling in Queensland locations
(BDCM is bromodichloromethane, DBCM is dibromochloromethane)............................................. 40 Table 6: Mean annual concentration of regulated haloacetic acids in the various Queensland regions
discussed in this study..................................................................................................................... 48
Disinfection By-product Formation and Minimisation in South East Queensland Drinking Water Page vii
LIST OF ABBREVIATIONS ADWG Australian drinking water guidelines AO Advanced oxidation BDCM Bromodichloromethane DBP Disinfection By-product DBCM Dibromochloromethane DOC Dissolved organic carbon DOM Dissolved organic matter DON Dissolved organic nitrogen GAC Granular activated carbon GCMS Gas chromatography with Mass Spectroscopy HAN Haloacetonitrile HHA Haloacetic acid HNM Halonitromethane H2O2 Hydrogen peroxide NDBA N-nitrosodibutylamine NDEA N-nitrosodiethylamine NDMA N-nitrosodimethylamine PAC Powdered activated carbon polyDADMAC poly(diallyldimethylammonium chloride) QWC Queensland Water Commission SEQ South East Queensland THM Trihalomethane tTHM Total trihalomethane TOC Total organic carbon UV Ultraviolet WHO World Health Organisation WTP Water treatment plant

Disinfection By-product Formation and Minimisation in South East Queensland Drinking Water Page 1
EXECUTIVE SUMMARY
Chemical by-products arising from water disinfection may be harmful to human health. Although there are potentially innumerable individual chemical species arising from the water disinfection process, the risk to human health is considered small when compared to the risks associated with drinking water which has not been treated for pathogen removal. The purpose of this study was to assess the prevalence of the four regulated trihalomethanes, as well as the potently carcinogenic nitrosamine, N-nitrosodimethylamine (NDMA) (whose regulation has been proposed by the NHMRC in the draft 2010 Australian Drinking Water Guidelines) in South East Queensland (SEQ) drinking water supplies. Toward this objective, NDMA and trihalomethane (THM) formation potential experiments were undertaken using source waters from a number of SEQ water treatment plants (WTPs), as well as directly from the Logan River, Teviot Brook and Mary River. The relationship between water parameters such as dissolved organic carbon (DOC) and dissolved organic nitrogen (DON), disinfection method, and the final concentration of particular disinfection by-products (DBPs) in the finished water were examined, with a number of general trends becoming apparent. NDMA formation potentials were consistently quite low (5 – 21 ng/L) from chloramination of raw waters, and not detected (< 5 ng/L) in chlorinated waters. NDMA was not detected in any SEQ finished waters (< 5 ng/L).THM formation potentials were consistently below the Australian Drinking Water Guideline of 250 g/L, however levels were higher for chlorinated waters than for chloraminated waters. A general analysis of THM concentrations present in a large number of Queensland source waters was also undertaken, using existing data collected by Queensland Health Forensic and Scientific Services. This THM survey identified a number of interesting trends, including the prevalence of highly brominated THMs in chlorinated bore waters, and the consistent compliance to guideline values for THMs in chloraminated waters, rather than chlorinated waters, in which Australian Drinking Water Guidelines were exceeded in a number of cases. This document concludes that NDMA does not appear to be a contaminant currently occurring in significant concentrations in SEQ drinking water, however, it is possible this will become more of an issue as water sources become more impacted by wastewater effluents. Trihalomethanes are predictably low in chloraminated water supplies, and exist over a wide concentration range in chlorinated waters. In addition to the above, advanced oxidation and coagulation procedures were assessed in relation to their impact on DBP formation. Ozone or UV/H2O2 pre-treatment was found to be effective in producing water with very low THM concentrations upon chlorination, although bromate formation was found to occur in significant concentrations in high bromide source waters upon ozonation. UV irradiation was found to be an excellent method for NDMA degradation in NDMA spiked source waters, and H2O2 was not required for this to be achieved. Coagulation using alum, ferric chloride or polyDADMAC was found to be ineffective in removing DBP precursors, irrespective of the low DOC and DON able to be attained with this treatment. In fact, coagulation with polyDADMAC gave rise to a greatly increased NDMA formation potential, and all three coagulants led to an increased tTHM formation potential when using high bromine source waters, due to the high concentration of brominated THMs (Br-THMs) formed. The quaternary amine anion exchangers, polyDADMAC and possibly MIEX resin (singlicate analysis taken of MIEX only), were found to contain NDMA precursors and produced significant concentrations of NDMA upon chloramination, however NDMA was not formed by these materials upon chlorination.

Disinfection By-product Formation and Minimisation in South East Queensland Drinking Water Page 2
1. INTRODUCTION
1.1. DBPs: History and Scope of the Problem The chemical disinfection of drinking water, beginning early in the last century by dosing water with chlorine, provided a dramatic improvement in public health in the regions in which it was employed. The incidence of water-borne disease fell remarkably, with the prevalence of cholera dropping by 90% in the USA, along with an 80% decrease in typhoid and a 50% decrease in amoebic dysentery(1). Although the public health benefits of water disinfection cannot be disputed, there are nonetheless unique problems arising from its implementation. In particular, disinfectants of all kinds used in drinking water treatment react to form chemical disinfection by-products (DBPs), and there is an epidemiological association between some of these chemical compounds and an increased prevalence of some cancers and reproductive effects. The chemical oxidants dosed into water are effective at killing pathogenic microorganisms, however, they also oxidize other organic material and halides naturally present in the water to form a complex mixture of innumerable compounds. These will vary significantly in composition and concentration between source waters and disinfection methods. Each of these compounds is unique and will have its own toxicological behaviour. The disinfectants commonly used in Australia include: chlorine, chloramines, and ozone. These three disinfectants all produce their own suite of DBPs, with some degree of overlap between their DBP profiles(2). The first DBPs were discovered in chlorinated drinking water in 1974 by Rook et al.(3). These were the trihalomethanes, and they were soon found to be ubiquitous in chlorinated drinking waters(1). The carcinogenicity of chloroform and mutagenicity of organic extracts of water were then reported in the late 1970s, leading ultimately to the introduction of regulations to control the allowable concentration of the four most commonly found THMs present in treated water in many developed countries around the world(4). This included Australia, whose guideline value for total trihalomethanes (tTHMs), specifically chloroform, bromodichloromethane, dibromochloromethane and bromoform remains at 250 g/L(5). Today, Australia regulates the concentration of a handful of DBPs, including the four THMs listed above, three chloroacetic acids, bromate, chlorite, and imminently chlorate and N-nitrosodimethylamine. The complexity of the problem is illustrated by the knowledge that more than 600 DBPs have been reported in the literature, and only a small number of these have been assessed as to their prevalence, toxicity or human health effects. Further confounding the issue is the over 50% of total organic halide (TOX) formed during chlorination of drinking water that has not yet been identified as DBPs(1), and similarly more than 50% of assimilable organic carbon formed during ozonation which remains unidentified as DBPs(6). The regulation of THMs rather than some other set of DBPs is perhaps more based on history than on toxicology, given they were the earliest and most readily discovered due to their relatively high concentrations and ubiquitous nature in chlorinated drinking waters. With this in mind, it is important to realise that an appropriate set of surrogate compounds for total drinking water toxicity from DBPs has not been established, and the tendency to use THMs as in indicator for the presence of other DBPs is by no means foolproof.
1.2. Trihalomethanes: Toxicology
The current ADWG value of 250 g/L for tTHMs is actually a measure of only four of the trihalomethanes possibly formed by water disinfection (chloroform, bromodichloromethane, dibromochloromethane and bromoform). While chloroform is often the most prevalent of all the THMs, its brominated or iodinated counterparts can be formed under circumstances when these halides are present in the source water, often arising from salt water intrusion(1). The Australian context has potential for regions with increased Br-THM and iodinated THM (I-THM) concentrations, due to the high salinity and low rainfall of many of our catchments, and the recent movement into desalinated water as an alternative water source.
Disinfection By-product Formation and Minimisation in South East Queensland Drinking Water Page 3
Much research has been conducted over the past 30 years toward understanding THMs in biological systems, including their mutagenic, carcinogenic and genotoxic properties(7). Chloroform has been found not to be mutagenic or genotoxic in a wide array of systems in vivo and in vitro. However, it is understood to be a non-genotoxic carcinogen whose mechanism of action includes cytotoxicity and regenerative cell proliferation(7). That is, chloroform is a likely human carcinogen only under high-exposure conditions that lead to cytotoxicity and cell regeneration(8, 9). Interestingly, the Br-THMs differ from chloroform in that they are all mutagenic after activation by glutathione S-transferase-theta (GSTT1-1), and are in fact dependent on the presence of this enzyme to exert their mutagenic effect(10). In vitro experiments have demonstrated that GSTT1-1 catalyses the covalent binding of bromodichloromethane (BDCM) to DNA and the formation of guanine adducts(11). The four regulated THMs are all carcinogenic in rodents(7, 12, 13). However, only chloroform and bromodichloromethane are carcinogenic in both mice and rats, and form tumours in multiple organ sites. Given that urinary bladder and colorectal tumours are the primary cancers associated with disinfected drinking water exposure through epidemiological studies, it is important to note that chloroform and dibromochloromethane do not produce tumours in these organs, however, bromoform and BDCM do form tumours in the large intestine of rats. Recent research is making it apparent that route of exposure is of great importance when assessing the risk associated with THMs(11, 14, 15). For example, BDCM blood concentrations in humans have been reported as being 25 – 130 times higher from dermal exposure than from oral exposure in controlled experiments in which subjects submerged one forearm in BDCM containing water for one hour, and compared the resulting blood concentration with that arising from consuming drinking water of the same BDCM concentration(16). Exposure by inhalation is also very important to understand in this context, with implications for showering and bathing with potable water.
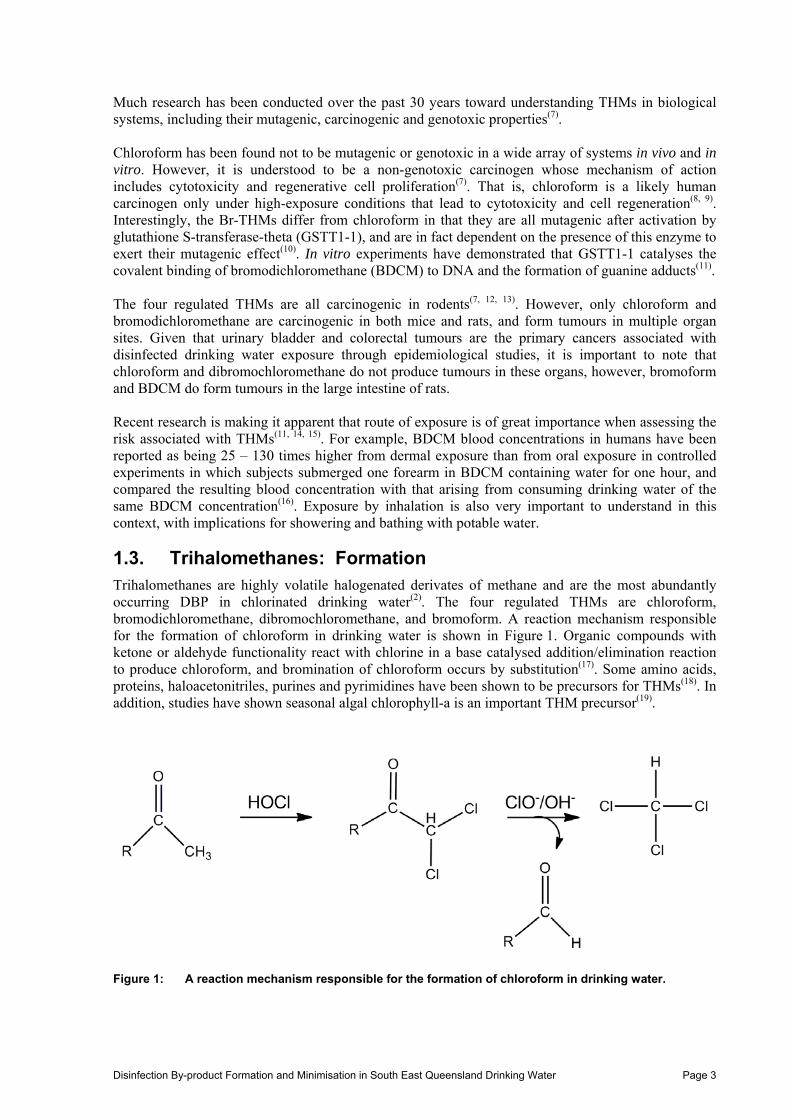
1.3. Trihalomethanes: Formation Trihalomethanes are highly volatile halogenated derivates of methane and are the most abundantly occurring DBP in chlorinated drinking water(2). The four regulated THMs are chloroform, bromodichloromethane, dibromochloromethane, and bromoform. A reaction mechanism responsible for the formation of chloroform in drinking water is shown in Figure 1. Organic compounds with ketone or aldehyde functionality react with chlorine in a base catalysed addition/elimination reaction to produce chloroform, and bromination of chloroform occurs by substitution(17). Some amino acids, proteins, haloacetonitriles, purines and pyrimidines have been shown to be precursors for THMs(18). In addition, studies have shown seasonal algal chlorophyll-a is an important THM precursor(19).
Figure 1: A reaction mechanism responsible for the formation of chloroform in drinking water.

Disinfection By-product Formation and Minimisation in South East Queensland Drinking Water Page 4
1.4. Haloacetic Acids The regulated haloacetic acids (HAAs) in Australia are comprised of the chlorinated species only, those being: monochloroacetic acid, dichloroacetic acid and trichloroacetic acid. Their guideline values are 0.15 mg/L, 0.1 mg/L and 0.1 mg/L respectively. Although they can be formed from chlorination, chloramination and chlorine dioxide, they are most prevalent as a by-product of chlorination. In bromide–containing source waters, disinfection may form bromoacetic acids(2). Monochloroacetic acid has been shown to be mutagenic in bacterial cells(20) and genotoxic in mammalian cells, however it has shown no evidence of carcinogenicity(21, 22). Dichloroacetic acid is only weakly mutagenic and weakly genotoxic, but is known to be carcinogenic. Trichloroacetic acid has generally given negative results for mutagenicity, and investigations into its genotoxicity have not been reproducible(23). Trichloroacetic acid is, however, carcinogenic(21). The mode of action for the carcinogenicity of dichloroacetic acid and trichloroacetic acid is as yet unknown, however it is not anticipated that the mechanism would be genotoxic in either case.
1.5. Bromate Although bromate is predominantly formed as a by-product of ozonation when source waters are high in bromide (>50 µg/L), it can also occur as a by-product of chlorine dioxide disinfection, or as a contaminant present in hypochlorite solutions(2, 24, 25). A number of studies of potassium bromate have found it is clastogenic, and causes oxidative damage and chromosomal mutations in the kidney(1). Bromate has been shown to be the most carcinogenic of all the regulated DBPs in laboratory animals. Research indicates that bromate causes DNA damage secondary to oxidative stress from intracellular bromate within kidney cells in which tumours arise(26-29). Bromate has been evaluated as a likely human carcinogen by the oral route of exposure, with insufficient data available to assess its carcinogenicity by inhalation(30). The ADWG guideline for bromate is currently 20 µg/L(5).
1.6. Chlorite and Chlorate Chlorite is a by-product of chlorine dioxide disinfection, which is not a favoured drinking water disinfection method in Australia, so will not be discussed in detail here. The ADWG for chlorite is 0.8 mg/L(5). Chlorate is also primarily found as a degradation product of chlorine dioxide treatment, however it is also inevitably found as a degradation product of sodium hypochlorite solutions, which are often used as the chlorine source for chlorination in Australia(24). There is no current ADWG value for chlorate in drinking water, however, the 2010 draft ADWGs suggest implementation of a guideline value of 0.3 mg/L(31). Toxicology data for chlorite and chlorate is limited at this time.
1.7. N-Nitrosodimethylamine: Toxicology and Prevalence The 2010 revision of the ADWGs calls for the introduction of a guideline concentration for NDMA in potable water. The value in the draft guidelines is 100 ng/L(31). NDMA is classified as a “probable human carcinogen” by the USEPA(32). The presence of NDMA in certain foods and beverages (for example; processed meats and beer) has been known for some time(33) and it has also been identified in a number of consumer products and as a contaminant in groundwater (from rocket fuel) as well as in tobacco smoke. However, more recently it has been identified as a DBP arising primarily from chloramination, although it can also come about in chlorinated waters which contain an appropriate source of amine precursors (e.g. ammonia)(34). Recent studies indicate that exposure to NDMA from ingestion of drinking water is likely to be minor compared to the level of exposure from food sources(35). Although NDMA generally forms at low nanogram per litre concentrations in drinking water, chlorinated wastewaters can form NDMA at much higher concentrations, possibly due to the presence of high concentrations of dimethylamine (50 – 500 nM in typical wastewaters)(1). Some studies have indicated that NDMA can continue to form in the distribution system, leading to much higher concentrations at the point of supply than at the point of leaving the WTP. In particular, a study in Canada reports an initial NDMA concentration of 67 ng/L at the plant, compared to 180 ng/L

Disinfection By-product Formation and Minimisation in South East Queensland Drinking Water Page 5
in the distribution system(36). The implication is that measurements of NDMA concentrations taken at the treatment plant may substantially underestimate the actual public exposure to the compound. The N-nitrosamines are well known for their ability to be metabolised into genotoxic agents of high potency. NDMA is the most thoroughly studied of the five nitrosamines that are known to occur as DBPs (Figure 2) and its notable genotoxicity has been reviewed elsewhere(37, 38). It has been shown to be genotoxic in a number of in vivo and in vitro systems, inducing gene and chromosomal mutations as well as DNA damage. NDMA is also activated to a mutagen by a number of cytochrome P450 enzymes(39). Nearly all the nitrosamines which have been tested for their carcinogenicity have shown various routes of inducing carcinogenic affects in a number of species(38, 40). The primary tumour sites are the esophagus and liver, as well as some carcinogenicity of the urinary bladder, brain and lungs. A low-dose exposure over a prolonged period of time provides the optimal conditions for nitrosamine carcinogenicity(40). The following nitrosamines have been identified in the USEPA’s Integrated Risk Information System(41) as probably human carcinogens: N-nitrosodiethylamine; NDMA; N-nitrosopyrrolidine; and N-nitrosodiphenylamine.
Figure 2: The five known nitrosamines which have been identified as disinfection by-products.
1.8. NDMA Formation The precursors for NDMA formation are still yet to be adequately defined. Dimethylamine, which is a known NDMA precursor, was found in a recent study investigating NDMA precursors in natural waters to account for only a small amount of the NDMA actually produced (Figure 3). Natural organic matter (NOM) encompasses a significant portion of the remaining precursors, however, these sources did not account for the total NDMA formed by chloramination of these waters(42). Further sources of NDMA precursors may arise from organic polymeric coagulants such as polyDADMAC, which may be used in the water treatment process(43). This, and possibly other quaternary amine anion exchangers, have been found to form NDMA upon exposure to chloramines, although much lower NDMA concentrations are formed by chlorination of these resins. Further to this, a free-chlorine contact time of 1 – 4 hours prior to ammonia addition has been shown to significantly reduce the NDMA formation arising from chloramination. Model compounds that have been shown to act as NDMA precursors in the presence of chloramines include: dimethylamine; tertiary amines with dimethylamine functionality; and dimethylamides(44).
CH3
CH3
N
N
O ON
N
ON
O
N
ON
N
N
N
O
N-nitrosopiperidine
N-nitrosodimethylamine N-nitrosodiphenylamine
N-nitrosomorpholine
N-nitrosopyrrolidine
Disinfection By-product Formation and Minimisation in South East Queensland Drinking Water Page 6
Figure 3: Simplified reaction showing NDMA formation in water from dimethylamine and monochloramine.
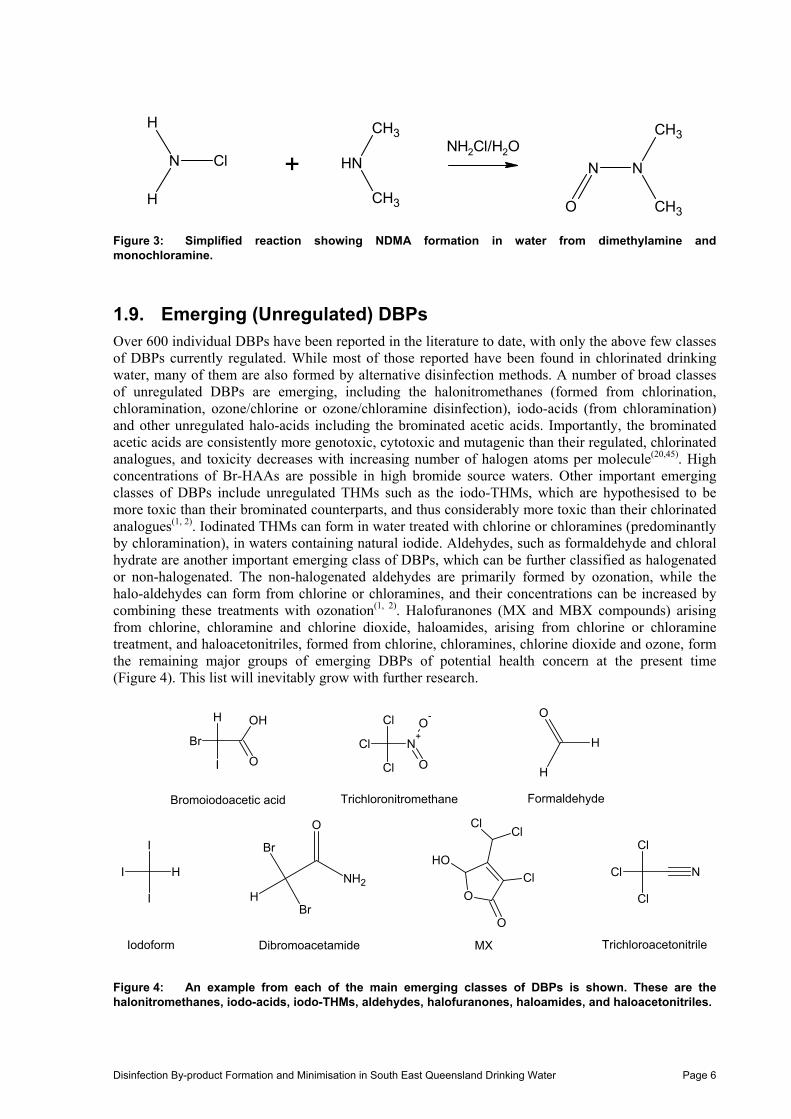
1.9. Emerging (Unregulated) DBPs Over 600 individual DBPs have been reported in the literature to date, with only the above few classes of DBPs currently regulated. While most of those reported have been found in chlorinated drinking water, many of them are also formed by alternative disinfection methods. A number of broad classes of unregulated DBPs are emerging, including the halonitromethanes (formed from chlorination, chloramination, ozone/chlorine or ozone/chloramine disinfection), iodo-acids (from chloramination) and other unregulated halo-acids including the brominated acetic acids. Importantly, the brominated acetic acids are consistently more genotoxic, cytotoxic and mutagenic than their regulated, chlorinated analogues, and toxicity decreases with increasing number of halogen atoms per molecule(20,45). High concentrations of Br-HAAs are possible in high bromide source waters. Other important emerging classes of DBPs include unregulated THMs such as the iodo-THMs, which are hypothesised to be more toxic than their brominated counterparts, and thus considerably more toxic than their chlorinated analogues(1, 2). Iodinated THMs can form in water treated with chlorine or chloramines (predominantly by chloramination), in waters containing natural iodide. Aldehydes, such as formaldehyde and chloral hydrate are another important emerging class of DBPs, which can be further classified as halogenated or non-halogenated. The non-halogenated aldehydes are primarily formed by ozonation, while the halo-aldehydes can form from chlorine or chloramines, and their concentrations can be increased by combining these treatments with ozonation(1, 2). Halofuranones (MX and MBX compounds) arising from chlorine, chloramine and chlorine dioxide, haloamides, arising from chlorine or chloramine treatment, and haloacetonitriles, formed from chlorine, chloramines, chlorine dioxide and ozone, form the remaining major groups of emerging DBPs of potential health concern at the present time (Figure 4). This list will inevitably grow with further research.
Figure 4: An example from each of the main emerging classes of DBPs is shown. These are the halonitromethanes, iodo-acids, iodo-THMs, aldehydes, halofuranones, haloamides, and haloacetonitriles.
Cl
Cl
Cl
O
O-
N+Br
H
I
OH
O
HI
I
I
ClCl
OH
O
O
Cl
H
H
O
Cl
Cl
Cl
N
HBr
Br
O
NH2
Bromoiodoacetic acid Trichloronitromethane Formaldehyde
Iodoform Dibromoacetamide MX Trichloroacetonitrile
H
H
N Cl +CH3
CH3
NHNH2Cl/H2O
CH3
CH3
NN
O

Disinfection By-product Formation and Minimisation in South East Queensland Drinking Water Page 7
1.10. DBPs from Anthropogenic Contaminants Although an in-depth discussion on the topic of DBP formation from anthropogenic contaminants is outside the scope of this report, it is an important issue to highlight as a necessary area for future research. DBPs arising from chlorine, chloramine or ozone treatment of existing micropollutants present in source waters are not well understood, but the current literature includes examples of DBPs which are the oxidation products of pharmaceuticals such as carbamazepine (from ozonation) and paracetamol (from chlorination) and anti-bacterial agents such as sulfamethoxazole. Pesticide-derived DBPs have also been identified, including oxidation products of S-triazine herbicides, and an oxidation product of chlorpyrifos (chlorpyrifos oxon), whose toxicity exceeds that of the parent pesticide. Laundry detergents and azo dyes have also been identified as the precursors to non-traditional chlorinated by-products in several settings(1).
1.11. DBPs from Alternative Disinfection Methods It is imperative to realise that alternative disinfection methods do not necessarily go hand-in-hand with less DBP formation, rather, they will be more susceptible to forming unidentified/unregulated DBPs, with unknown toxicity. With this in mind, it is a research priority to further investigate DBPs from alternative disinfection methods, in order to move toward to better understanding of these techniques before they are widely employed. Although UV radiation seems attractive in that it is not a chemical treatment method, it does form hydroxyl radicals which, as a highly reactive species, will form oxygenated DBPs(1). Membrane filtration may be promising as a truly non-chemical disinfection method, however, the need to maintain a residual disinfectant in the distribution system means a chemical disinfectant would still have to be added after this process.
1.12. Alternative Water Sources The necessity to employ alternative water sources such as desalinated sea water and recycled water brings new challenges to DBP research and the protection of public health. For example, chlorination of seawater or reverse osmosis permeate is believed to form bromoform and brominated haloacetic acids (e.g. monobromoacetic acid, dibromoacetic acid, bromochloroacetic acid) as the prevalent DBP species(46). Among DBPs identified in saline drinking waters, haloacetonitriles (HANs), mutagen X compounds (MX), halonitromethanes (HNMs) and cyanogen bromide (CNBr) pose potential concerns, especially when desalinated waters are blended with organic-matter rich source waters, which may be possible within the SEQ water grid, since the introduction of desalinated water in 2009.
1.13. Disinfection Methods
1.13.1. Chlorination
Chlorination of drinking water is achieved by either liquefied chlorine gas, sodium hypochlorite solution or calcium hypochlorite granules and on-site chlorine generators(47). Chlorine, irrespective of the form used for water dosing, dissolves to form hypochlorous acid and hypochlorite ion. Chlorination is employed primarily for microbial disinfection. However, chlorine also acts as an oxidant and can remove or assist in the removal of some chemicals. Some examples are: the decomposition of easily oxidized pesticides such as aldicarb; the oxidation of dissolved species (e.g., manganese(II)) to form insoluble products that can be subsequently removed by filtration; and the oxidation of dissolved species to more readily removable forms (e.g. arsenite to arsenate). A major disadvantage of chlorine is its ability to react with natural organic matter to produce THMs and other halogenated DBPs. However, by-product formation may be controlled by optimisation of the treatment strategy(47).
1.13.2. Ozonation
Ozone is a powerful oxidant and has many uses in water treatment, including oxidation of organic chemicals, and can be used as a primary disinfectant. Ozone gas is formed by passing air or pure
Disinfection By-product Formation and Minimisation in South East Queensland Drinking Water Page 8
oxygen through a high-voltage electric field. This ozone-enriched air is dosed directly into the water, typically for 10–20 minutes of contact time. Oxidation of organic chemicals, such as oxidisable pesticides, requires a residual ozone concentration of about 0.5 mg/L after a contact time of approximately 20 minutes. The ozone dose required may vary within a typical range of 2–5 mg/L. Ozone reacts with natural organic matter and increases its biodegradability. This conversion is measured as assimilable organic carbon. Since ozone is unable to retain a disinfection residual in the distribution system due to its instability, it is normally used with a subsequent filtration treatment, such as BAC, to remove biodegradable organics, and then dosed with chlorine to provide a residual. Ozone is effective for the degradation of a wide range of pesticides and other organic pollutants(47).
1.13.3. Chloramination
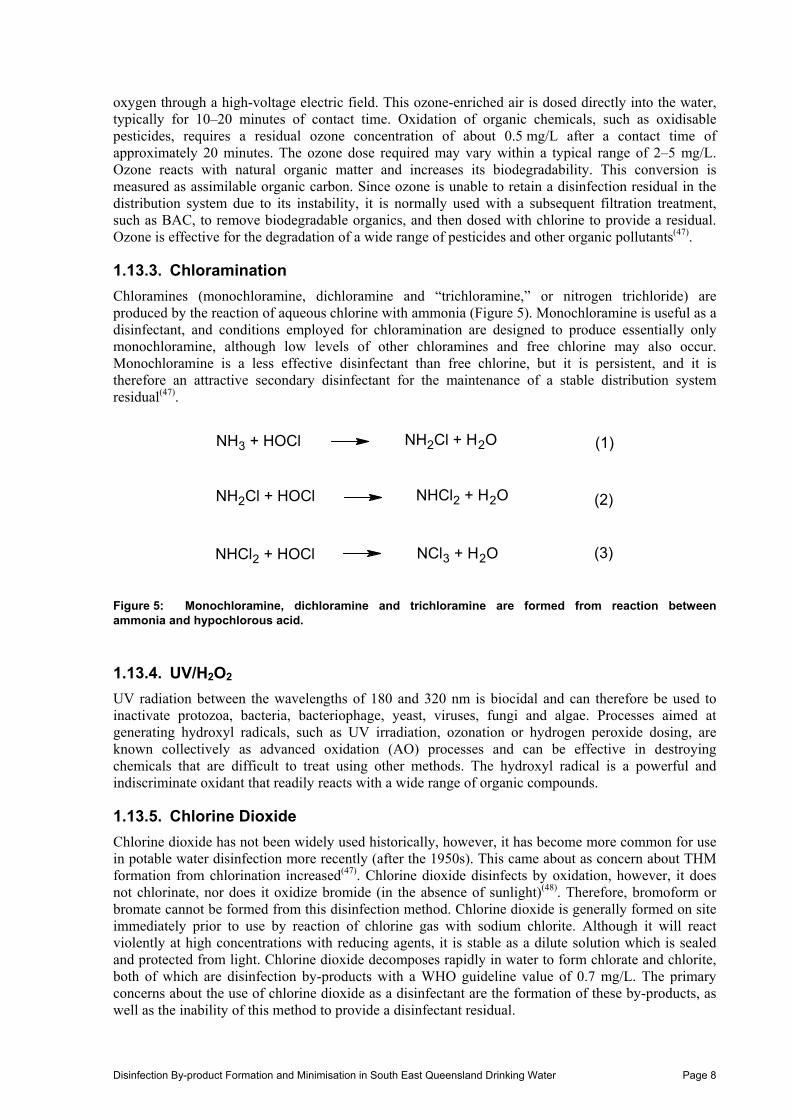
Chloramines (monochloramine, dichloramine and “trichloramine,” or nitrogen trichloride) are produced by the reaction of aqueous chlorine with ammonia (Figure 5). Monochloramine is useful as a disinfectant, and conditions employed for chloramination are designed to produce essentially only monochloramine, although low levels of other chloramines and free chlorine may also occur. Monochloramine is a less effective disinfectant than free chlorine, but it is persistent, and it is therefore an attractive secondary disinfectant for the maintenance of a stable distribution system residual(47).
Figure 5: Monochloramine, dichloramine and trichloramine are formed from reaction between ammonia and hypochlorous acid.
1.13.4. UV/H2O2
UV radiation between the wavelengths of 180 and 320 nm is biocidal and can therefore be used to inactivate protozoa, bacteria, bacteriophage, yeast, viruses, fungi and algae. Processes aimed at generating hydroxyl radicals, such as UV irradiation, ozonation or hydrogen peroxide dosing, are known collectively as advanced oxidation (AO) processes and can be effective in destroying chemicals that are difficult to treat using other methods. The hydroxyl radical is a powerful and indiscriminate oxidant that readily reacts with a wide range of organic compounds.
1.13.5. Chlorine Dioxide
Chlorine dioxide has not been widely used historically, however, it has become more common for use in potable water disinfection more recently (after the 1950s). This came about as concern about THM formation from chlorination increased(47). Chlorine dioxide disinfects by oxidation, however, it does not chlorinate, nor does it oxidize bromide (in the absence of sunlight)(48). Therefore, bromoform or bromate cannot be formed from this disinfection method. Chlorine dioxide is generally formed on site immediately prior to use by reaction of chlorine gas with sodium chlorite. Although it will react violently at high concentrations with reducing agents, it is stable as a dilute solution which is sealed and protected from light. Chlorine dioxide decomposes rapidly in water to form chlorate and chlorite, both of which are disinfection by-products with a WHO guideline value of 0.7 mg/L. The primary concerns about the use of chlorine dioxide as a disinfectant are the formation of these by-products, as well as the inability of this method to provide a disinfectant residual.
NH3 + HOCl NH2Cl + H2O (1)
NH2Cl + HOCl NHCl2 + H2O (2)
NHCl2 + HOCl NCl3 + H2O (3)
Disinfection By-product Formation and Minimisation in South East Queensland Drinking Water Page 9
1.14. Disinfection By-products from Individual Disinfection Methods
The primary known DBPs formed during chlorination are THMs, chlorinated acetic acids, chlorinated ketones and haloacetonitriles. These occur as a result of chlorination of naturally occurring organic precursors such as humic substances. Chloramination produces lower THM concentrations than chlorine but can potentially produce other DBPs, including cyanogen chloride and NDMA. Ozone oxidizes bromide to ultimately form brominated THMs and the potent carcinogen, bromate. A range of other DBPs, including aldehydes and carboxylic acids, may also be formed. Chlorate is inevitably produced as a degradation product in hypochlorite solutions as they age(24).
1.15. Strategies for Controlling DBP Formation General strategies for the control of DBP formation as advised by the World Health Organisation are: Altering process conditions (including removal of precursor compounds prior to disinfectant
application); Changing the disinfection method to increase suitability to the individual characteristics of the
source water; and Removing the DBPs formed, prior to water distribution. Changes to process conditions may include removing THM precursors prior to contact with chlorine, for example, by improving the coagulation procedure in place. DBP formation can also be reduced by lowering the applied chlorine dose, however, if this is done, it must not compromise disinfection efficiency. The pH attained during chlorination also alters the distribution of chlorinated by-products, for example, reducing the pH of chlorination lowers THM formation, but increases haloacetic acid formation. Conversely, an increase in pH reduces haloacetic acid production and increases THM formation. Bromate formation as a by-product of ozonation depends on several factors, including bromide concentration, ozone concentration and ozonation pH. It is not straightforward to remove bromide from raw water, and it is difficult to remove bromate once formed, thus ozonation of high bromide source waters can prove challenging. Bromate formation can be minimised by using lower ozone dose, shorter ozone contact time and forming a lower residual ozone concentration. Operating at an approximate pH of 6.5 then raising the pH after ozonation can also reduce bromate formation, and ammonia, monochloramine, or chlorine dioxide addition prior to ozonation can also be effective(49-53). It may be advisable to change from chlorine to monochloramine in situations with naturally high THM formation, at least in order to provide a more stable residual disinfectant within the distribution system, and to reduce THM formation at the treatment stage and within the distribution system. However, monochloramine treatment is associated with NDMA formation, although it reduces THM formation. One strategy for lowering NDMA formation while using chloramination is to ensure the water has a free chlorine contact time prior to ammonia addition(54). UV irradiation or membrane processes can be considered as alternatives to traditional disinfection. Neither of these provides any residual disinfection, therefore, a small dose of a persistent disinfectant such as chlorine or monochloramine is still required for disinfection during water distribution. Although it is possible to remove DBPs after they have been formed and prior to distribution, this is often a less attractive option for controlling DBP concentrations. Processes such as air stripping (aeration) to remove volatile DBPs such as THMs or adsorption onto activated carbon have been described(55).

Disinfection By-product Formation and Minimisation in South East Queensland Drinking Water Page 10
2. EXPERIMENTAL METHODS
Note: Sample site and analysis information for the THM and HHA survey is discussed in Section 4.
2.1. Sampling, Preservation and Storage Grab samples were taken in all cases apart from North Pine WTP, in which case some 24 hr composite samples were taken. All samples for NDMA experiments were transported and stored in 1L amber glass bottles at 4°C until use. Samples for THM experiments were transported and stored in 500 mL amber glass bottles, with Teflon lined screw-caps to protect against the loss of volatile THMs. Bottles were completely filled, with no headspace remaining. No dechlorinating agent was added to samples to be used for NDMA or THM formation potential experiments, however, all other samples for NDMA or THM analysis were dosed with 100 mg/L Na2SO3 or Na2S2O4 to remove residual chlorine and prevent further DBP formation. Sample bottles for NDMA and THM analysis were detergent-washed, then rinsed with purified water and finally washed in acetone and dried prior to use. Samples for nutrient analysis were stored in high-density polyethylene (HDPE) bottles at -20°C without preservative until such time as they were analysed. Samples for metals analysis were stored in 1% HNO3 in acid-washed HDPE bottles, and these were stored at 4°C until they were analysed. Samples for bromide, bromate, chlorite and chlorate anion analysis were stored in detergent-washed HDPE bottles without preservative, at 4°C until they were analysed.
2.2. Sampling Sites
Figure 6: Map of the Logan River catchment showing the proposed location of the Wyaralong dam on Teviot Brook(56).
4 3
1
2
4
3
1
2

Disinfection By-product Formation and Minimisation in South East Queensland Drinking Water Page 11
A significant focus of this project was on the region shown in Figure 6, the proposed Wyaralong dam site and Cedar Grove Weir. Sites sampled are labelled 1 to 4 and are as follows: site 1 – Teviot Brook “The Overflow”; site 2 – Teviot Brook “Edward O’Neil Bridge”; site 3 – Logan River, Cedar Grove Weir; site 4 – Logan River, Cusack Lane crossing. All advanced oxidation and coagulation experiments were undertaken with water sourced from site 2 – Teviot Brook. In addition to the above four sites, NDMA and THM formation potential experiments and direct NDMA measurements were taken using water from the following SEQ sources; North Pine WTP, East Bank Mt Crosby WTP, West Bank Mt Crosby WTP, Molendinar WTP, Lander’s Shute WTP and Traveston Crossing, Mary River. Samples were also obtained from Wanneroo WTP in Western Australia in order to study the affect of MIEX treatment on the quality of this source water.
2.3. Reagents Chemicals were obtained from the following sources and used without further purification: Merck - KH2PO4 (≥ 99%), Na2HPO4 (≥ 99%), NH4Cl (≥ 99.8%), Na2SO3 (≥ 95%),
dichloromethane (≥ 99.9%), methanol (≥ 99.8%), acetone (≥ 99%), potassium iodide (≥ 99.5%); Scharlau - anhydrous sodium sulphate (≥ 99%); HACH - DPD powder pillows, Free Ammonia Reagent Solution, Indigotrisulfonate accuvac
ozone test kit; Novachem - Nitrosamine stock mixed standard (200 g/mL in the following nitrosamines; N-
Nitrosodi-n-butylamine, N-Nitrosodi-n-propylamine, N-Nitrosodiethylamine, N-Nitrosodimethylamine, N-Nitrosomethylethylamine, N-Nitrosopiperidine, N-Nitrosopyrrolidine), N-Nitrosodimethylamine-d6 standard solution (1 mg/mL);
LECO - SPE cartridges EPA-M521; and Sigma-Aldrich - 1-decene (≥ 99.5%), NaOCl (≥ 4%), FeCl3.6H2O (≥ 98%),
poly(diallyldimethylammonium chloride) (polyDADMAC - 20% in H2O), Al2(SO4)3 (alum - ≥ 98%), CaO (≥ 98%) and H2O2 (≥ 6%) K2S2O8, NaClO2.
Purified water prepared by a Sartorius water purification system fitted with a UV light was used for all dilutions, solution preparation, and final glassware washing. Norit 1240W GAC and Norit W35 PAC were used in activated carbon experiments. Monochloramine, hypochlorite and chlorine dioxide solutions were prepared fresh daily, and all stock solutions were stored at 4C.
2.4. Water Treatment Procedures
2.4.1. Chlorination (for THM Formation Potential)
Samples were filtered through GF/A filter paper (retains particles ≥ 1.6 µm then thermally equilibrated to 22ºC. A final pH of 7.6 was attained by addition of 20 mM phosphate buffer into the 500 mL sample, as solid KH2PO4 and Na2HPO4. The final pH was measured using a Mettler Toledo pH meter. Sodium hypochlorite solution was added at a dose of 3 mg/L and, after mixing, the solution was allowed to react in sealed, amber glass bottles with no headspace for seven days. After this time, the free chlorine residual was measured and subsequently quenched by addition of 0.15 g Na2SO3. The mean free chlorine residual for these samples was 0.55 mg/L. These samples were stored at 4ºC in amber glass bottles with Teflon-lined screw caps, without headspace, until analysis.
2.4.2. Chloramination (for THM Formation Potential)
As for section 2.4.1, however, rather than dosing with 3 mg/L chlorine, the samples were dosed with 3.5 mg/L NaOCl followed by dosing with 0.95 mg/L NH3 (2.99 mg/L NH4Cl). The molar ratio of OCl-
:NH3 was approximately 1:1.2 (3.7:1 by weight). Chloramine residual was measured prior to quenching with 0.15 g Na2SO3, and this averaged 0.49 mg/L.

Disinfection By-product Formation and Minimisation in South East Queensland Drinking Water Page 12
2.4.3. Chlorination (for Maximum Nitrosamine Formation Potential)
Samples were thermally equilibrated to 22ºC, then 20 mL removed from each 1 L sample to give a volume of approximately 980 mL. Phosphate buffer was added as solid KH2PO4 and Na2HPO4, to give a final concentration of 10 mM and a pH of 7. Once the buffer was dissolved, 20 mL of a 17 mM stock solution of sodium hypochlorite (made fresh by adding 3.46 mL of 36 000 mg/L NaOCl to pH 8 purified water in a volumetric flask to give a final volume of 100 mL) was added to each 980 mL sample to give a final concentration of 0.34 mM free chlorine. After mixing, these samples were reacted in sealed 1 L amber glass bottles (protected from light) at room temperature for seven days. After this time, the free chlorine residual was measured (typical residual chlorine concentration was in the range 12 – 17 mg/L) and each 1 L sample subsequently quenched with 2.5 g Na2SO3. Samples were stored at 4ºC in sealed, amber glass bottles until extraction and analysis.
2.4.4. Chloramination (for Maximum Nitrosamine Formation Potential)
Samples were treated as discussed in section 2.4.3, with the exception that rather than treating with sodium hypochlorite solution, each 980 mL sample was treated with 20 mL of 17 mM stock solution of monochloramine (made fresh daily by dissolving 107 mg solid NH4Cl in pH 8 purified water, then slowly adding 3.46 mL of 36 000 mg/L NaOCl to the stirring solution and topping up with purified water in a volumetric flask to give a final volume of 100 mL) to give a final monochloramine concentration of 0.34 mM. Chloramine residual was measured prior to quenching with 2.5 g Na2SO3, and this was typically in the range 15 – 20 mg/L.
2.4.5. UV Treatment
Filtered 1 L samples with an existing, known, concentration of THMs or nitrosamines were subjected to a range of UV doses, and the change in DBP concentration measured. UV irradiation doses used were: 5, 20, 40 and 60 mJ/cm2. This was achieved by circulating the sample through a sealed reactor past an Ultraviolet Technology of Australasia, LC 20 UV lamp emitting light at 254 nm for up to 6 minutes, after which the sample was stored in sealed amber glass at 4ºC until analysis.
2.4.6. UV/H2O2
Each experiment included a primary step which was a H2O2 dose at a variable concentration within the range 0 - 30 ppm, followed by a UV dose of 30 mJ/cm2 (the UV dose remained constant for all experiments). Filtered, 1 L samples containing an existing, known concentration of THMs or nitrosamines were subjected to this treatment at a number of H2O2 concentrations. Raw (unchlorinated) samples without THMs present were also treated as described, and the effect of this treatment on their subsequent THM formation potential examined.
2.4.7. Ozone
All samples for ozonation were first treated with alum and CaO to reduce the DOC present, as detailed in Section 2.4.10. The pH was then adjusted to 7.5 using H2SO4. The samples were at 22C prior to ozonation. Ozone gas was generated using a Corona Discharge Ozone Generator M-1500 (Clearwater Tech. LLC.) through which high purity oxygen was passed. The ozone gas was then passed via Teflon tubing directly into a 1 L sample of source water sealed in a glass gas washing bottle, which was submerged in an ice bath. The ozone dose was approximately 0.4 mg/L/min in all cases, and this dose was applied continuously for 5 mins, after which the sample was left to react for a further 5 minutes without any additional ozone dosing. Outflow from the reaction vessel was passed through a potassium iodide solution to remove unreacted ozone before being vented via a fume hood. The ozone residual was measured after the 10 minute reaction time, and this averaged 1.2 mg/L ozone.
2.4.8. ClO2/O3
After coagulation, thermal equilibration and pH adjustment (as described in Section 2.4.7) samples were pre-treated with 1.5 mg/L ClO2 (the ClO2 solution was prepared fresh by reacting K2S2O8 with NaClO2, and kept cold until use). Each 1 L sample had a ClO2 contact time of 15 minutes prior to
Disinfection By-product Formation and Minimisation in South East Queensland Drinking Water Page 13
ozonation. The ozonation procedure was exactly as described in section 2.4.7. The ozone residual was measured after the 10 minute reaction time, and this averaged 1.5 mg/L ozone.
2.4.9. NH2Cl/O3
After coagulation, thermal equilibration and pH adjustment (as described in Section 2.4.7) samples were pre-treated with 1.56 mg/L NaOCl (as Cl2) for 5 minutes contact time (NaOCl solution was prepared fresh and kept cold until use), then dosed with 2.33 mg/L NH4Cl to form 0.022 mM monochloramine. The ozonation process (procedure exactly as described in section 2.4.7) was started within 1 minute of the sample’s exposure to ammonia. The ozone residual was measured after the 10-minute reaction time, and this averaged 1.3 mg/L ozone.
2.4.10. Coagulation with Lime Softening
The three coagulants studied were FeCl3.6H2O (ferric chloride), Al2(SO4)3 (alum) and poly(diallyldimethylammonium chloride) (polyDADMAC). 170 mg CaO was added to all 1 L samples to obtain a pH of 11, after which 30 mg/L of either ferric chloride or alum, or 3 mg/L polyDADMAC was added and the solution stirred for 2 minutes at 150 rpm, then stirred at 30 rpm for a further 30 minutes. The solution was then allowed to settle, and filtered through a GF/A glass fibre filter paper. After this procedure, aliquots of sample were taken for DOC and DON analysis, and THM and NDMA formation potential experiments conducted. THM formation potential experiments were performed by chlorination (2.4.1) and NDMA formation potential experiments were performed by excess chloramination (2.4.4).
2.4.11. DBP Removal and DBP Precursor Removal by Norit 1240W GAC and Norit W35 PAC
In order to determine what affinity (if any) Norit PAC and Norit GAC have for adsorbing the various nitrosamines, the following experiments were undertaken. Source water was spiked with a nitrosamine stock solution to give a final concentration of 100 ng/L in the following nitrosamines: N-Nitrosodi-n-butylamine, N-Nitrosodi-n-propylamine, N-Nitrosodiethylamine, N-Nitrosodimethylamine, N-Nitrosomethylethylamine, N-Nitrosopiperidine and N-Nitrosopyrrolidine. The samples were buffered to pH 7 using phosphate buffer, then stirred for 30 mins at 150 rpm with either 60 mg/L PAC (Norit W35) or 60 mg/L GAC (Norit 1240), after which the samples were extracted and analysed for nitrosamines as per “USEPA method 521.” This was compared to nitrosamine-spiked source water which was extracted without having been exposed to PAC or GAC. Secondly, the following experiments were conducted to investigate the potential for nitrosamine formation as a direct consequence of exposure to PAC or GAC: Purified water from a Sartorius water purification system fitted with a UV light was chloraminated as described in Section 2.4.4. However, immediately prior to the chloramination step (after buffering and thermal equilibration) the purified water sample was stirred for 30 mins at 150 rpm with 60 mg/L PAC (Norit W35) or 60 mg/L GAC (Norit 1240), after which the samples were filtered, before reacting for 7 days, then extracting and analysing for nitrosamines as per “USEPA method 521.” These data were compared to nitrosamine concentrations in purified water which was extracted without having been exposed to PAC or GAC.
2.5. Analytical Methods and Analysis
2.5.1. Nitrosamines
Nitrosamine analysis was conducted by first concentrating samples using solid phase extraction, then analysing by gas chromatography followed by chemical ionisation mass spectrometry, in accordance with USEPA Method 521.1(57).

Disinfection By-product Formation and Minimisation in South East Queensland Drinking Water Page 14
2.5.2. Trihalomethanes
Trihalomethane analysis was conducted by purging the volatile organics directly from the aqueous sample and subjecting the volatilised component to gas chromatography-mass spectrometry, in accordance with USEPA Method 524.2 revision 4.1(58).
2.5.3. Natural Organic Matter
All nitrogen chemistries were colorimetric with determination by a Lachat QC8000 Flow Injection Analyser. TOC (as non-purgeable organic carbon) was determined using a high temperature oxidation instrument (Elementar highTOC II). DOC was analysed as for TOC, with a pre-filtration step. Methods are outlined in detail in Standard methods for the examination of water and wastewater(59).
2.5.4. Chlorine Quantitation
Free and total chlorine residual was quantified using the HACH, DPD powder pillows procedure, based on Standard Method 4500-Cl G for drinking water(59).
2.5.5. Chloramine Quantitation
Chloramines and free ammonia residual was determined using the HACH Indophenol Method(60).
2.5.6. Hydrogen Peroxide Quantification
Residual H2O2 present after UV/H2O2 experiments was quantified spectrophotometrically, using a Varian, Cary 50 UV-VIS spectrophotometer, by reacting the remaining hydrogen peroxide with metavanadate in acidic solution to give a coloured product with a maximum absorbance at 450 nm(61).
2.5.7. Ozone Quantitation
Ozone in solution was quantified using the HACH accuvac protocol, the premise of which is that ozone bleaches indigotrisulfonate to give a decrease in absorbance (A600) with increasing ozone concentration. This HACH method is based on the method described in Standard Methods for examination of water and wastewater(59).
2.5.8. Anion Analysis
Bromide, bromate, chlorate and chlorite were analysed by ion chromatography using a Metrohm 861 Ion Chromatograph, with Na2CO3 solution as the mobile phase.
2.6. Quality Control and Uncertainties Quality controls employed for analytical methods were as outlined in the relevant USEPA methods, and include extracting a blank (purified water), matrix blank (untreated source water), spike (purified water spiked with nitrosamine standard), and matrix spike (source water spiked with nitrosamine standard) with each batch of nitrosamine SPE extractions, as well as use of the internal standard method for determining analyte concentration, and use of the surrogate recovery method to ensure an adequate extraction efficiency. Samples were always transported and stored at 4°C, protected from light, and processed within two weeks of the sampling date. Sampling glassware and plastic containers was kept scrupulously clean, being first detergent-washed, and then washed with purified water, followed by acetone. Standard solutions were remade regularly and disinfectant solutions were regularly standardised to monitor degradation. The method reporting limit for nitrosamine analysis was 5 ng/L, with an uncertainty of ± 2 ng/L. For tTHMs, the method reporting limit was 4 g/L, and 1 g/L for individual THMs. A 10% uncertainty was present for THM analysis, whereas an uncertainty of up to 15% was experienced for organic carbon and organic nitrogen analysis. The method reporting limit for bromate analysis was 20 g/L, while it was 0.2 mg/L and 50 g/L for chlorite and chlorate respectively.

Disinfection By-product Formation and Minimisation in South East Queensland Drinking Water Page 15
9/02/2009
16/02/2009
23/02/2009
2/03/2009
9/03/2009
16/03/2009
ND
MA
form
atio
n p
ote
ntia
l (ng
/L)
4
6
8
10
12
14
Water pre-chlorinated prior to chloraminationWater NOT prechlorinated prior to chloramination
3. RESULTS AND DISCUSSION
3.1. NDMA Formation Potentials Dosing with high concentrations of free chlorine (as hypochlorite) did not give rise to NDMA concentrations > 5 ng/L in any case examined in this study. Therefore, all NDMA formation potentials reported here are based on reaction with monochloramine as disinfectant, unless otherwise specified. Initial studies were based on treating source waters with the same disinfectant dose (chlorine or chloramine) and temperature and pH conditions commonly employed in a typical SEQ WTP, however, NDMA concentrations were consistently less than the method reporting limit (< 5 ng/L) for both chlorinated and chloraminated samples in this case. Therefore, maximum NDMA formation potentials are reported, in which a large excess of pre-formed monochloramine was used to dose the source water in order to ensure the maximum possible NDMA concentration was attained. Because of the often low concentrations of NDMA present in these samples (ppt range), large sample volumes were required for each experiment (1 L). Each 1 L sample was concentrated 1000x to a give a 1 mL extract, which was then analysed by chemical ionisation GCMS using a large volume sample injector. Mt Crosby (West bank) WTP provided an opportunity to examine the effect of pre-chlorination (prior to chloramination) on NDMA formation potential. At the time of sampling, some source water was pre-chlorinated at the filtration stage of treatment, while other filters were not dosed with chlorine. This enabled NDMA formation potentials to be measured for the same source water, under these different conditions. Figure 7 shows how NDMA formation potential was lowered with pre-chlorination in this system. This has been documented elsewhere(62), and may be attributed to chlorine oxidation of NDMA precursors prior to the addition of ammonia and subsequent formation of chloramines. This effect has been observed to be dependent on free chlorine contact time(54).
Figure 7: NDMA formation potentials for West bank, Mt Crosby WTP are shown, demonstrating the decrease in formation potential observed for pre-chlorinated water samples, compared to samples which were not pre-chlorinated.

Disinfection By-product Formation and Minimisation in South East Queensland Drinking Water Page 16
Sampling date1/06/2009
1/07/2009
1/08/2009
1/09/2009
1/10/2009
1/11/2009
Con
cent
ratio
n (n
g/L,
mg/
L)
0
5
10
15
20
25
Site 2 NDMA formation potential (ng/L)Site 2 DOC:DON (mg/L)
Over the sampling period at each site, the DOC and DON were monitored, with the aim of correlating these parameters to the THM and NDMA formation potentials for the source water. One dataset for water sampled from Teviot Brook is shown in Figure 8. This figure illustrates the generalisation that a lower DOC/DON ratio tends to give rise to higher NDMA formation potentials.
Figure 8: Relationship between NDMA formation potential and DOC/DON at site 2 (Teviot Brook). NDMA formation potential and DOC/DON vary inversely with each other over time.
Figure 9 shows the generally inverse relationship found between DOC/DON ratio and NDMA formation potential at site 2 (Teviot Brook). Lee et al (63) have reported this relationship at a number of locations in the USA and France with the aim of correlating NDMA formation potential to the ratio between DOC/DON, based on the hypothesis that DON promotes the formation of nitrogenous DBPs. It is suggested that DOC/DON ratios could be applied to estimate NDMA formation potential. However, Figure 9 shows, that while there is a loose relationship between these parameters in this case (R2 = 0.64) it is not sufficient for use as a predictive indicator for NDMA formation potential due to the high error in the correlation. Lee et al. found similar margins of error in correlating these variables(63). Although the relationship between DOC/DON and NDMA formation potential is of interest, it could not be used as a predictive indicator for NDMA formation with any certainty. The subject warrants more thorough investigation in order to define a more specific surrogate for the NDMA formation potential of a particular source water. Specific questions include: what is the source of DON; and what proportion of DON is available to act as NDMA precursors? DON is a complex mixture in itself, and therefore cannot be arbitrarily predicted to behave in a particular way when considering the question of DBP formation.

Disinfection By-product Formation and Minimisation in South East Queensland Drinking Water Page 17
DOC/DON (mg-C/mg-N)
2 4 6 8 10 12 14 16 18
ND
MA
co
ncen
trat
ion
(ng
/ m
g D
OC
)
0.0
0.5
1.0
1.5
2.0
2.5
3.0
3.5Site 2Site 1Site 3
Figure 9: NDMA formation potential as it varies with DOC/DON (R2 = 0.64). Samples taken from sites 1-3 (Teviot Brook and Logan River).
The relationship between DOC/DON ratio and NDMA formation potential for Molendinar and Landers Shute source waters was not applicable for regression analysis, due to the low correlation between parameters. This serves as further warning against simplifying the complex relationships between soluble organic matter in environmental waters and their DBP end products in an attempt to find convenient surrogates for these micropollutants. Molendinar WTP uses polyDADMAC after alum dosing to attain low DOC levels in the finished water. The combination of polyDADMAC with other, inorganic coagulants such as alum is known to potentially lead to DOC and DON levels significantly lower than either coagulant is capable of delivering on its own at an equivalent dose(64). This has been suggested to be because the polymer can act as a bridge between the polar dissolved organic matter (DOM) molecules and the surface of the aluminium hydroxide, leading to easy precipitation(65, 66). Both polyDADMAC and aluminium hydroxide tend to preferentially remove the highest molecular weight fraction of DOC and DON, and are less efficient of removing the low molecular weight fraction(64). PolyDADMAC has been implicated in NDMA formation as it may contain NDMA precursors which form NDMA upon exposure to disinfectant. Molendinar WTP uses chlorination alone as the disinfectant, and this could be instrumental in their having NDMA levels < 5 ng/L in the finished water over the sampling period in this study. However, in order to examine the effect source water exposure to polyDADMAC had on NDMA formation potential, samples were taken immediately prior to polyDADMAC dosing (after alum dosing), as well as immediately after polyDADMAC dosing, and their formation potentials compared to that of the raw source water. The raw water and water treated with alum consistently had comparable NDMA formation potentials across the four month sampling period, however, the water which had been exposed to polyDADMAC was found to have an approximately 3-fold increase in NDMA formation potential, relative to unexposed source water. Figure 10 indicates the change in NDMA formation potential observed over three separate sampling events.
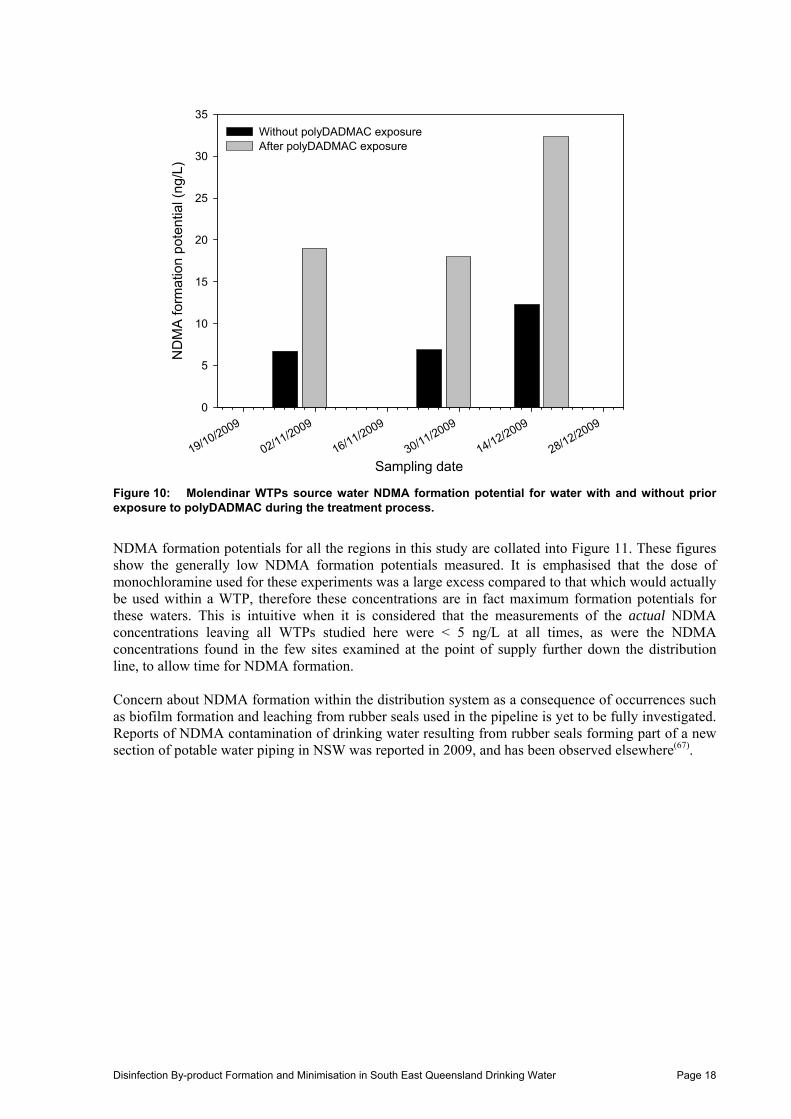
Disinfection By-product Formation and Minimisation in South East Queensland Drinking Water Page 18
Sampling date19/10/2009
02/11/2009
16/11/2009
30/11/2009
14/12/2009
28/12/2009
ND
MA
form
atio
n p
oten
tial (
ng/L
)
0
5
10
15
20
25
30
35
Without polyDADMAC exposure After polyDADMAC exposure
Figure 10: Molendinar WTPs source water NDMA formation potential for water with and without prior exposure to polyDADMAC during the treatment process.
NDMA formation potentials for all the regions in this study are collated into Figure 11. These figures show the generally low NDMA formation potentials measured. It is emphasised that the dose of monochloramine used for these experiments was a large excess compared to that which would actually be used within a WTP, therefore these concentrations are in fact maximum formation potentials for these waters. This is intuitive when it is considered that the measurements of the actual NDMA concentrations leaving all WTPs studied here were < 5 ng/L at all times, as were the NDMA concentrations found in the few sites examined at the point of supply further down the distribution line, to allow time for NDMA formation. Concern about NDMA formation within the distribution system as a consequence of occurrences such as biofilm formation and leaching from rubber seals used in the pipeline is yet to be fully investigated. Reports of NDMA contamination of drinking water resulting from rubber seals forming part of a new section of potable water piping in NSW was reported in 2009, and has been observed elsewhere(67).

Disinfection By-product Formation and Minimisation in South East Queensland Drinking Water Page 19
Teviot Brook - Site 1
Sampling date06-
Jul-09
13-Jul-
09
20-Jul-
09
27-Jul-
09
03-Aug-
09
10-Aug-
09
ND
MA
fo
rma
tion
pote
ntia
l (ng
/L)
8
10
12
14
16
18
North Pine WTP
Sampling date23-
Feb-09
02-Mar-0
9
09-Mar-0
9
16-Mar-0
9
23-Mar-0
9
ND
MA
fo
rma
tion
pote
ntia
l (ng
/L)
5.5
6.0
6.5
7.0
7.5
8.0
8.5
9.0
9.5Molendinar WTP raw water
Sampling date28-
Sep-09
12-Oct-0
9
26-Oct-0
9
09-Nov-0
9
23-Nov-0
9
07-Dec-
09
21-Dec-
09
ND
MA
fo
rma
tion
pote
ntia
l (ng
/L)
6
8
10
12
14
16
18
Teviot Brook - Site 2
Sampling date01-
Jun-09
01-Jul-
09
01-Aug-
09
01-Sep-
09
01-Oct-0
9
01-Nov-0
9
ND
MA
fo
rma
tion
pote
ntia
l (ng
/L)
0
5
10
15
20
25
Cedar Grove Weir - Site 3
Sampling date06-
Jul-09
13-Jul-
09
20-Jul-
09
27-Jul-
09
03-Aug-
09
10-Aug-
09
ND
MA
form
atio
n po
tent
ial (
ng/L
)
4
6
8
10
12
14
Logan River - Site 4
Sampling date01-
Jun-09
15-Jun
-09
29-Jun
-09
13-Jul-
09
27-Jul-
09
10-Aug-
09
ND
MA
for
ma
tion
pote
ntia
l (ng
/L)
2
4
6
8
10
12
14

Disinfection By-product Formation and Minimisation in South East Queensland Drinking Water Page 20
Landers Shute WTP
Sampling date01-Jun-09
01-Jul-09
01-Aug-09
01-Sep-09
01-Oct-09
ND
MA
for
ma
tion
pote
ntia
l (ng
/L)
4.5
5.0
5.5
6.0
6.5
7.0
7.5
8.0
Traveston Crossing
Sampling date24-Aug-09
31-Aug-09
07-Sep-09
14-Sep-09
21-Sep-09
ND
MA
form
atio
n po
tent
ial (
ng/L
)
10.0
10.2
10.4
10.6
10.8
11.0
Mt Crosby, East Bank WTP
Sampling date02-M
ar-09
09-Mar-0
9
16-Mar-0
9
23-Mar-0
9
30-Mar-0
9
ND
MA
form
atio
n po
tent
ial (
ng/L
)
7
8
9
10
11
12
13Mt Crosby, West Bank WTP
Sampling date09-Feb-09
16-Feb-09
23-Feb-09
02-Mar-0
9
09-Mar-0
9
16-Mar-0
9
ND
MA
fo
rma
tion
pote
ntia
l (ng
/L)
9.5
10.0
10.5
11.0
11.5
12.0
12.5
13.0
13.5
Figure 11: NDMA formation potentials found for all regions included in this study, ranging from February 2009 to January 2010.
3.2. THM Formation Potentials tTHM formation potentials were determined by chlorinating or chloraminating filtered source water using conditions of temperature, pH and disinfectant dose modelled on a typical SEQ WTP. Water temperature was typically between 21 – 22 °C and samples were buffered to pH 7.65 prior to exposure to disinfectant. For chloramination experiments, monochloramine was formed in situ by adding ammonia to water dosed with hypochlorite, rather than pre-forming the monochloramine as for the NDMA formation potential experiments. This was also done to replicate conditions of chloramination at SEQ WTPs. Chlorination experiments were conducted by addition of hypochlorite solution to the sample water. Care was taken to ensure there was no ‘headspace’ in the reaction vessels, to ensure liquid-gas partitioning of volatile THMs did not occur, or was minimal. Bottles were sealed with screw-caps containing Teflon liners to prevent analyte loss to the atmosphere. Samples were kept at 4°C from the time of quenching the reactions, until analysis, to further prevent volatilisation of THMs. THMs were then analysed by purge-and-trap followed by GCMS(58). Figures 12, 13 and 14 show the collated tTHM formation potential data for the most extensively studied regions included in this project, and indicates a generally observed trend that chlorination gives rise to greater THM concentrations than chloramination. This is well known, and has provided one of the motivations behind the move from chlorine to chloramine in modern water treatment(68, 69). Regardless, chlorination of raw source waters still led to tTHM concentrations below the ADWGs for all SEQ regions examined in this study (note that the ADWGs for THMs are comparatively high with respect to many other countries).

Disinfection By-product Formation and Minimisation in South East Queensland Drinking Water Page 21
Sampling date
1/06/2009
1/07/2009
1/08/2009
1/09/2009
1/10/2009
tTH
M f
orm
atio
n po
tent
ial (g
/L)
0
20
40
60
80
100Concentration of tTHMs formed from chlorinationConcentration of tTHMs formed from chloramination
Sampling date
5/10/2009
19/10/2009
2/11/2009
16/11/2009
30/11/2009
14/12/2009
tTH
M f
orm
atio
n po
ten
tial ( g
/L)
0
20
40
60
80
100
120
140
160
Concentration of tTHMs formed from chlorination Concentration of tTHMs formed from chloramination
Figure 12: tTHM formation potential over time for raw water from Lander’s Shute WTP. It was a generally observed trend that chloramination led to significantly lower tTHM concentrations than chlorination.
Figure 13: tTHM formation potential from chlorination and chloramination for raw water from Molendinar WTP over 3 months.

Disinfection By-product Formation and Minimisation in South East Queensland Drinking Water Page 22
Sampling date3/08/2009
17/08/2009
31/08/2009
14/09/2009
28/09/2009
12/10/2009
tTH
M f
orm
atio
n po
tent
ial (g
/L)
0
20
40
60
80
100
120
140
160
180Site 2 - chlorinated Site 2 - chloraminated Site 4 - chlorinated Site 4 - chloraminated
Figure 14: tTHM formation potentials for Teviot Brook and Logan River sites 2 and 4, from chlorination and chloramination over 3 months.
A further observation, which is discussed in the THM survey presented in Section 4, is that the tTHM concentrations arising from chlorination was much more variable compared with the tTHM concentrations arising from chloramination. Chloramination presented not only a low, but a relatively stable tTHM concentration over time (Figures 12, 13, 14). There was no discernable correlation between DOC and tTHM formation potential at the Wyaralong sites over the time studied, although bromoform and dibromochloromethane concentrations were observed to increase with decreasing DOC concentration, while chloroform and dichlorobromomethane concentrations were observed to increase with increasing DOC. This was also observed during the coagulation experiments, and is discussed further in section 3.6. The mean distribution of the concentrations of the four regulated THMs for the sites studied are shown in Figures 15 and 16. From these graphs, the high concentration of THMs in chlorinated waters compared with chloraminated waters can readily be observed, as can the relatively high concentration of brominated THMs formed from Teviot Brook source waters, occurring as a result of the high bromide concentration of this source water (0.3 – 0.8 mg/L over the time studied). This is particularly evident in the chloraminated example (Figure 16), in which the proportion of brominated THMs is much greater for Teviot Brook than for any of the remaining sites.

Disinfection By-product Formation and Minimisation in South East Queensland Drinking Water Page 23
Figure 15: Mean concentrations of each of the four regulated THMs arising from chlorination for a number of source waters. Each site was sampled 4 times excluding Traveston Crossing, which was sampled twice.
Figure 16: Mean concentrations of each of the four regulated THMs arising from chloramination for a number of source waters. Each site was sampled 4 times excluding Traveston Crossing, which was sampled twice.

Disinfection By-product Formation and Minimisation in South East Queensland Drinking Water Page 24
Sampling date
03-Aug-09
17-Aug-09
31-Aug-09
14-Sep-09
28-Sep-09
12-Oct-09
26-Oct-09
Co
ncen
trat
ion
(mg/
L)
0
2
4
6
8
10
12TOC DOC DON
3.3. Natural Organic Matter Concentrations
Figure 17: Variation in TOC, DOC and DON in Teviot Brook – site 3 source water.
Figure 17 shows the variation in organic carbon and organic nitrogen concentrations observed in Teviot Brook source water from August to October, 2009. Note the increase in organic nitrogen concentration that occurred in October. This may reflect an increase in watershed runoff resulting from the higher rainfall typical of the warmer months (Beaudesert in August 2009 had an approximate rainfall of 5 mm, followed by 22 mm and 38 mm in September and October respectively)(70). This waterway is impacted by agricultural runoff, some industry discharge as well as wastewater effluent. During this study, DON varied from 0.48 mg/L to 2.9 mg/L over the 3 months of monitoring, DOC varied from 3.2 mg/L to 9.9 mg/L, and TOC varied from 5 mg/L to 10 mg/L. Table 1 shows the average concentrations of TOC, DOC and DON in various source waters in SEQ, and their standard deviations. Importantly, the NDMA formation potentials determined from this source water increased with increasing DON, with the October samples forming the highest concentrations of NDMA (21 ng/L on 16/10/09 and 18 ng/L on 28/10/09).
Table 1: Average concentrations of organic carbon and organic nitrogen for various SEQ sites. Data are the mean of four independent sampling events in all cases except Traveston Crossing, which was sampled twice.
Concentration (mg/L)
Molendinar WTP
Landers Shute WTP
Traveston Crossing
Site1 (Teviot Brook)
Site 2 (Teviot Brook)
Site 3 (Cedar Grove Weir)
Site 4 (Logan River)
TOC 3.9 ± 0.58 1.6 ± 0.28 3.7 ± 1.6 6.9 ± 0.99 6.8 ± 1.76 4.9 ± 0.14 3.9 ± 0.81
DOC 3.8 ± 0.29 1.2 ± 0.14 2.8 ± 0.84 6.5 ± 0.84 6.5 ± 2.25 3.9 ± 1.06 3.55 ± 0.44
DON 0.28 ± 0.04 0.15 ± 0.07 0.4 ± 0.14 0.46 ± 0.04 1.03 ± 0.94 0.42 ± 0.06 0.55 ± 0.29

Disinfection By-product Formation and Minimisation in South East Queensland Drinking Water Page 25
UV dose (mJ/cm2)
0 10 20 30 40 50 60
[ND
MA
] (ng
/L)
70
80
90
100
110
120
130Sampled 8th September 2009Sampled 21st September 2009
y = 71 + 52e-0.04x
R2 = 0.96
3.4. UV/H2O2
3.4.1. NDMA
Figure 18: Decay curve showing decreasing NDMA concentration with increasing UV dose.
Source water taken from Teviot Brook (site 2) was spiked with NDMA (120 ng/L) and subsequently exposed to variable doses of UV radiation, in the absence of any other oxidant. Figure 18 shows the decay curve for NDMA concentration after exposure to increasing doses of UV radiation. Duplicate analyses were reproducible, with an R2 = 0.96. Notably, the UV dose range studied is comparable to that used for UV disinfection, and this dose range is also quite efficient in causing NDMA degradation. Specifically, a UV dose of 60 mJ/cm2 degraded approximately 42% of the NDMA present. Thus, for low concentrations of NDMA present as a drinking water contaminant, UV radiation may be an effective corrective measure. Hydrogen peroxide is not required to achieve this, nor does its presence improve the degree of NDMA degradation. This is supported by previous reports(71), which agree that generating hydroxyl radicals by adding hydrogen peroxide does not significantly increase NDMA destruction efficiency. Because NDMA photolysis may not actually destroy NDMA precursors (the major products of NDMA photolysis are dimethylamine and nitrite), concern has been raised about the potential for NDMA reformation within drinking water systems if chlorination/chloramination is performed after photolysis. However, the concentration of dimethylamine liberated by photolysis of low levels of NDMA will be small(71), and the low conversion efficiency of dimethylamine to NDMA ensures that any subsequent NDMA reformation should be insignificant. Figure 19 illustrates NDMA photolysis, showing a significant decrease in NDMA concentration upon UV dosing (30 mJ/cm2 over four minutes). In this case, the UV dose was kept constant, and a variable hydrogen peroxide dose applied. Hydrogen peroxide doses from 0 mg/L to 30 mg/L did not have an observable degradation affect on the NDMA present.

Disinfection By-product Formation and Minimisation in South East Queensland Drinking Water Page 26
Figure 19: Change in NDMA concentration with advanced oxidation treatment. Samples were spiked with NDMA and treated with increasing concentrations of H2O2 while the UV dose was held constant at 30 mJ/cm2 for all samples except the first (untreated) replicates.
3.4.2. THMs
Initial experiments were conducted in order to assess the effectiveness of UV/H2O2 in destroying THMs already formed in solution. tTHM concentrations which were formed from chlorination or chloramination of raw water were not lowered by irradiating the sample with UV light up to a dose of 60 mJ/cm2, either on its own or in conjunction with H2O2 up to a concentration of 30 mg/L. That is, the doses of UV and H2O2 used in this study are not capable of destroying or degrading THMs themselves, and the concentration of tTHMs remained essentially constant between samples regardless of UV or H2O2 dose. After these initial experiments, the remaining work in this area was concerned with the destruction of THM precursors, by pre-treatment with UV/H2O2, followed by subsequent chlorination or chloramination in order to assess the ability of these methods to lower THM formation potential. A constant UV dose of 30 mJ/cm2 was applied to the samples used for THM analysis shown in Figures 20 (i) and (ii), unless otherwise indicated. This UV dose was chosen to reflect typical UV doses employed for water disinfection (30 – 50 mJ/cm2)(72). These samples were treated with advanced oxidation (UV or UV/H2O2) with variable H2O2 concentration, and then treated with chlorine or chloramines after the advanced oxidation process, to determine the effect of advanced oxidation on removing THM precursors and thus leading to lower THM formation potential upon chlorination or chloramination. As these figures show, UV irradiation alone has a THM precursor lowering affect, but this is significantly enhanced by addition of hydrogen peroxide. A higher UV dose may be an alternative to the addition of hydrogen peroxide in attaining very low THM formation potential, however, this was not explored in this study. From these experiments a hydrogen peroxide dose of 5 mg/L is shown to be sufficient to reduce the THM formation potential to < 10 g/L. Lower doses still may also be just as effective, however this was not determined here.
[H2O2] (mg/L)
-10 0 10 20 30
[ND
MA
] (ng
/L)
80
100
120
140Sampled 10th August 2009Sampled 25th August 2009
UV dose 30 mJ/cm2
No UV or H2O2 dosing

Disinfection By-product Formation and Minimisation in South East Queensland Drinking Water Page 27
[H2O2] mg/L
0 10 20 30
tTH
M f
orm
atio
n p
ote
ntia
l (g
/L)
0
20
40
60
80
100
120
ChlorinationChloramination
No UV or H2O2
UV only
(ii)
Figure 20: Variation in tTHM formation potential with increasing [H2O2] with UV irradiation pre-treatment, and before chlorination or chloramination. (i) tTHM formation potential decreases with UV irradiation alone, then further with H2O2 addition. (ii) H2O2 addition, after UV dosing, decreases tTHM formation potential dramatically.
[H2O2] mg/L
-5 0 5
tTH
M f
orm
atio
n po
tent
ial (g
/L)
0
10
20
30
40
50
60
70
80
ChlorinationChloramination
No UV or H2O2
UV only
(i)
Disinfection By-product Formation and Minimisation in South East Queensland Drinking Water Page 28
3.5. Ozonation Concern over the high bromide ion concentration in Teviot Brook source water led to exploration of using a pre-oxidising step (using ClO2 or chlorine followed by ammonia) prior to ozonation, with the aim of lowering the bromate concentration formed in the finished water. Bromide ion reacts with hypochlorite ion to form HOBr, which can then be sequestered by ammonia to form bromamine, rather than reacting with ozone to form bromate(51), whereas chlorine dioxide is readily reduced to chlorite anion in aqueous solution, which appears to be the reactive species responsible for disrupting bromate formation upon ozonation(49,51,53,73). In both cases, the principle is to remove reactive bromine from the source water prior to ozonation in order to lower bromate formation(73). Due to time and resource constraints, this work provides preliminary data only (duplicate analysis of one sampling event only), and continuing work with Teviot Brook source water is being undertaken elsewhere under the direction of the Queensland Water Commission (QWC). At the time of sampling, construction of the Wyaralong dam was not complete. That is, Teviot Brook was an unimpeded stream. This may account for some of the large variability in parameters such as bromide level, iron level and DOC/TOC/DON observed over the time studied (Table 2). A bromide ion concentration consistently and significantly less than 0.300 mg/L is recommended for use with ozone(50). All samples underwent coagulation with lime softening at pH 11 using alum and calcium oxide prior to the oxidation treatment. This was found to be effective in lowering DOC and DON by more than half the concentration present in the source water (Table 2: Raw water (1) and Raw water (2)). tTHM concentrations were very low in chloraminated/ozonated samples, and were not detected in samples which underwent ozone treatment alone, or ClO2/O3 treatment. This agrees with literature findings(52,74). The method reporting limit for bromate analysis was 0.02 mg/L, therefore, levels below this were not able to be reported. Bromate had a mean concentration of 0.03 mg/L when ozone was used alone, however, it was < 0.02 mg/L in both replicates when ClO2 or NH2Cl were used prior to ozonation. Of concern is that the bromide concentration of the source water used for this testing was actually relatively low (0.293 mg/L on 11/11/09), compared to one week later (0.807 mg/L on 18/11/09), therefore the bromate concentration resulting from these ozonation procedures could be expected to be significantly higher at times when the source water is naturally higher in bromide. Both chloramine and chlorine dioxide pre-treatments gave rise to significant concentrations of chlorate. In fact about 70% of the ClO2 added was ultimately present as chlorate. This agrees with literature findings(73). The provisional WHO guideline value for both chlorite and chlorate is 0.7 mg/L, and the chlorine dioxide pre-treatment resulted in a chlorate concentration that exceeded this guideline (mean concentration of 1.20 mg/L). The chlorate concentration was also high in the chloramine treated samples (average 0.41 mg/L). Monochloramine is known to react with ozone to give chloride and nitrate, and chloride is not further oxidized by ozone to form Cl2, OCl-, or ClO3
-. Monochloramine was formed in solution in this experiment by adding NH4Cl to source water which had been exposed to hypochlorite (OCl-) for 5 minutes. This was allowed to react for a further 1 minute before proceeding with the ozonation. Some hypochlorite is likely to have remained unreacted to monochloramine, which would then react with ozone to form chlorate. In addition to this, chlorate is invariably present in waters which have been disinfected using hypochlorite solution, since it is a major degradation product of hypochlorite, and may be present in significant concentrations in sodium hypochlorite solutions(24). From this preliminary work the recommendation is to optimise the monochloramine formation and dose prior to ozonation, so that the desired bromate lowering effect is attained without forming high concentrations of chlorate. A lower dose of monochloramine combined with pre-forming the monochloramine rather than forming it in situ may provide a suitable solution. Alternatively, a study using NH3 alone for the pre-treatment, rather than monochloramine, prior to ozonation may also
Disinfection By-product Formation and Minimisation in South East Queensland Drinking Water Page 29
provide a suitable avenue for lowering bromate formation, without the risk of additional chlorate being formed(52). Ammonia effectively reacts with hypobromous acid (HOBr) to form bromamines, thereby quenching this active brominating species, particularly in low pH waters(75). One of the challenges faced experimentally was difficulty in controlling the ozone dose between experiments. This may be reflected in the variation in the ozone residuals determined between replicate experiments. A further experimental difficulty was in appropriately quenching the samples used for bromate, chlorite and chlorate analysis. The appropriate quenching agent (indigo trisulfonate) was not available in the timeframe available for these preliminary experiments to be conducted, and thus, the concentrations reported may represent a “worst case scenario” for these particular contaminants in this source water treated with the specified conditions. Also of importance is that these data were generated using Teviot Brook grab samples taken on only one day in summer 2009, prior to the construction of the Wyaralong dam, and thus, these data would be expected to vary significantly from similar experiments undertaken with Wyaralong dam source water at another time. These results are preliminary, and as such should not be used to influence decision-making relating to water treatment for the Wyaralong dam site, but should however, provide an impetus for further exploration of these methodologies as potentially useful in dealing with the particular challenges facing water treatment in the Teviot Brook region.

Disinfection By-product Formation and Minimisation in South East Queensland Drinking Water Page 30
Teviot brook 11/11/2009Raw water (1) Raw water (2) O 3 only (1) O 3 only (2) Chloramine/O 3 (1) Chloramine/O 3 (2) ClO 2 /Ozone (1) ClO 2 /Ozone (2)
Fe (mg/L) 1.6 2 - - - - - - Mn (mg/L) 0.06 0.16 - - - - - - Br- (mg/L) 0.293 0.293 - - - - - -
BrO3- (mg/L) - - 0.02 0.04 <0.02 <0.02 <0.02 <0.02
ClO2- (mg/L) - - <0.2 <0.2 <0.2 <0.2 <0.2 <0.2
ClO3- (mg/L) - - <0.05 <0.05 0.40 0.42 1.22 1.18
Chloroform (ug/L) <1 <1 <1 <1 4 5 <1 <1Bromodichloromethane (ug/L) <1 <1 <1 <1 1 <1 <1 <1Dibromochloromethane (ug/L) <1 <1 <1 <1 <1 <1 <1 <1Bromoform (ug/L) <1 <1 <1 <1 4 <1 <1 <1tTHM (ug/L) <4 <4 <4 <4 9 5 <4 <4
TOC (mg/L) 13 13 - - - - - - DOC (mg/L) 13 13 5.4 5.4 5.40 5.40 5.4 5.4DON (mg/L) 1.75 1.75 0.79 0.79 0.79 0.79 0.79 0.79Ozone residual (mg/L) - - 1.26 1.07 1.13 1.49 1.67 1.23
Teviot brook 18/11/2009Raw water (1) Raw water (2)
Fe (mg/L) 0.14 0.15Mn (mg/L) 0.15 0.14Br- (mg/L) 0.807 0.807
BrO3- (mg/L) - -
ClO2- (mg/L) - -
ClO3- (mg/L) - -
TOC (mg/L) 9.7 9.7DOC (mg/L) 9.7 9.7DON (mg/L) 0.84 0.84
Table 2: Preliminary data on DBP formation from ozonation, based on replicate samples (Raw water (1) and Raw water (2)) taken from Teviot Brook on 11/11/09. The table indicates concentrations of contaminants after dosing with approx. 2 mg/L ozone alone, 1.5 mg/L ClO2 followed by approx. 2 mg/L ozone, or 1.5 mg/L chloramine followed by approx. 2 mg/L ozone. Some initial parameters for untreated (raw) water sampled 18/11/09 are also presented.

Disinfection By-product Formation and Minimisation in South East Queensland Drinking Water Page 31
3.6. Coagulation at High pH All coagulation experiments were undertaken after lime softening (treatment with CaO) at a pH of approximately 11, due to the high Ca2+ and Mg2+ concentration of the Teviot Brook source water. All coagulants studied were chosen primarily for their possible suitability for use at high pH. Alum was selected also because of its prevalent use in water treatment in Australia, and low cost(76). Ferric chloride was found by literature survey to be an effective coagulant at high pH(77), and polyDADMAC was included because of its implication in NDMA formation from previous studies(78). Alum and ferric chloride (FeCl3) were shown to have very similar performance in lowering DOC and DON under these conditions (Figure 21). Specifically, alum removed a mean of 55% DOC and 80% DON, while FeCl3 removed a mean of 60% of DOC and 82% DON (duplicate samples taken two weeks apart). PolyDADMAC can be used very effectively in combination with another coagulant such as alum, to give DOC levels significantly lower than either coagulant on its own(76). However, in the experiments conducted here, polyDADMAC was studied without combination with a second coagulant. It was found to lower DOC by from 9% – 59%, and lower DON by a mean of 75% (duplicate samples taken two weeks apart). A much smaller dose of polyDADMAC was used relative to alum or FeCl3, however it is also a much more expensive reagent. An important note, however, is that regardless of the highly effective removal of organic nitrogen, there is no reduction in NDMA formation potential in samples having been exposed to alum or FeCl3 (Figure 22). This implies that the NDMA precursors present in the source water are not amenable to coagulation by these methods. PolyDADMAC has been shown previously to react in the presence of monochloramine to form NDMA(85). The results of this work agree with this finding, with the NDMA formation potential increasing to approximately six times the NDMA formation potential of the untreated source water (Figure 22). Again, it is important to note that despite the high efficiency of polyDADMAC in lowering DON and moderate efficiency in lowering DOC, this is not reflected in the measured NDMA formation potentials. Indeed, polyDADMAC is itself a significant source of NDMA precursors.
Figure 21: Lowering dissolved organic carbon and dissolved organic nitrogen by coagulation using polyDADMAC, ferric chloride or alum. Replicates are shown for two sampling events.

Disinfection By-product Formation and Minimisation in South East Queensland Drinking Water Page 32
Coagulant
No coagulation
polyDADMAC
Ferric chlorid
eAlum
ND
MA
fo
rmat
ion
po
tent
ial (
ng/L
)
0
20
40
60
80
100
120
140 Sampled 16/10/2009Sampled 28/10/2009
Similarly, THM formation potential did not decrease in samples which had been exposed to any of the coagulants tested, despite the significant reduction in DOC achieved (Figure 23(i-ii)). In fact, tTHM formation potential generally increased with decreasing DOC. These data were reproducible over the duplicate analyses undertaken. THM precursors (bromide ion) present in the source water were not amenable to coagulation by the methods examined. This data opposes the frequent finding that tTHM formation potential decreases with DOC/TOC(79, 80). This finding is explained by the high bromide concentration present in the Teviot Brook source water, leading to the formation of high concentrations of brominated THMs upon removal of organic material prior to oxidation(81, 82).
Figure 22: Alum and FeCl3 were ineffective at removing NDMA precursors from Teviot Brook source water. PolyDADMAC contains NDMA precursors which led to high NDMA formation potentials for the same source water after exposure. NDMA formation potential did not vary with DOC:DON ratio, further indicating that NDMA precursors were essentially unaffected by the coagulation process.
A factor responsible for the lack of success in removing the DBP precursors in these experiments may be their low molecular weight, which is understood to be the weight fraction least amenable to coagulation by traditional methods such as alum(83). MIEX resin has been found to be very effective in lowering both DOC and THM formation potential particularly when used in conjunction with alum, which is attributed to its high affinity for low molecular weight DOC, working in a complimentary manner with the high molecular weight DOC removal provided by alum(83,84). However, MIEX is a quaternary amine anion exchange resin, some of which (including polyDADMAC) have been shown to contain NDMA precursors or NDMA itself(78), so the risk of nitrosamine formation as a consequence of using this resin should be taken into account and investigated prior to utilisation of this water treatment method. From these experiments, it can be concluded that while coagulation using alum, FeCl3 or polyDADMAC is effective at lowering DOC and DON, none of these coagulants had any effect in lowering tTHM or NDMA formation potential, and in fact there was generally an increase in tTHM formation potential as a result of coagulation because of the high bromide concentration of the Teviot Brook source water, as well as an increase in NDMA formation potential when polyDADMAC was used.

Disinfection By-product Formation and Minimisation in South East Queensland Drinking Water Page 33
The bromide concentration in Teviot Brook source water ranged between 0.29 – 0.81 mg/L during this study. Bromide concentrations tend to be higher in times of low flow (higher salinity). Conversely, DOC concentrations tended to be higher at times of high flow (increased runoff). This high bromide concentration has the potential to form high concentrations of brominated DBPs, such as Br-THMs from chlorination or chloramination and bromate from ozonation. Research has found that DOM competes with bromide ion for oxidant (such as hypochlorite) during disinfection, therefore higher DOM waters will form lower concentrations of Br-THMs for a given bromide concentration(81, 82, 86). When this DOM is lowered by coagulation, bromide ion competes more effectively for oxidant, and therefore forms higher concentrations of Br-THMs. Consequently, although Cl-THMs will tend to be lowered by lowering DOM prior to addition of oxidant, Br-THMs tend to be increased. Thus, in low bromide waters we typically observe a decrease in tTHM with decreasing DOM, and in high bromide waters we may see an increase in tTHM with decreasing DOM. Note that during times of low flow, a low DOM concentration would be expected to naturally occur along with a high bromide concentration, therefore favouring high brominated DBP formation during disinfection. This outlines the importance of viewing THMs as individual chemical species with individual chemistry, rather than viewing them as a set of compounds with similar behaviour. With this in mind, as well as their unique and individual toxicology, it is recommended to regulate these compounds separately, with separate guideline values (as suggested by the WHO) rather than treating these four distinct chemical compounds as one. Figures 23 (i) and (ii) show how the formation potential of the four THMs varies with DOC concentration using Teviot Brook source water. Because of the naturally high bromide ion concentration in the source water, an increase in bromoform and dibromochloromethane concentration occurs with decreasing DOC, while a decrease in chloroform and bromodichloromethane concentration occurs concurrently, with decreasing DOC.

Disinfection By-product Formation and Minimisation in South East Queensland Drinking Water Page 34
DOC (mg/L)
3.43.63.84.04.2
TH
M c
onc
entr
atio
n (g
/L)
0
20
40
60
80
100
120
140
160
180tTHM Chloroform BromodichloromethaneDibromochloromethane Bromoform
Figure 23: Concentration of four THMs as their formation potential varies with DOC after coagulation. (i) Data from Teviot Brook, water sampled 16/10/2009 (ii) data from Teviot Brook, water sampled 28/10/2009.
DOC (mg/L)
3456
TH
M c
once
ntr
atio
n (
g/L)
20
40
60
140
160
180
tTHM Chloroform Bromodichloromethane Dibromochloromethane Bromoform
(i)
(ii)

Disinfection By-product Formation and Minimisation in South East Queensland Drinking Water Page 35
3.7. Nitrosamines and MIEX Resin, Norit 1240W GAC and Norit W35 PAC
Both Norit 1240W GAC and Norit W35 PAC were found to form low concentrations of NDMA and NDEA in purified water upon excess chloramination after exposure to the adsorbent and filtration. Concentrations typically ranged from 5 – 10 ng/L for both analytes (duplicate analyses). Conversely, neither form of activated carbon adsorbed NDMA itself, when added to nitrosamine spiked source water. Thus, these two activated carbons, which are used in drinking water purification, do not appear to be of use in removing NDMA where it is an existing contaminant. Water was sampled from Wanerroo WTP (in Perth) in order to investigate the affect of MIEX resin on nitrosamine formation potential. Wanerroo WTP treats the raw water with MIEX resin prior to traditional treatment and disinfection, due to the high DOM load of the source water. This treatment produces an acceptable DOM concentration in the finished water(83, 84). At the time of writing, single analyses only have been taken, and duplicate experiments are in progress. These preliminary findings indicated nitrosamines were undetected in the finished water (< 5 ng/L). However, interestingly, preliminary maximum formation potential experiments conducted by chloramination of both raw water and MIEX treated water from Wanneroo WTP showed a significant increase in NDMA formation potential in MIEX exposed water. While the raw water had an NDMA formation potential of < 5 ng/L, the MIEX exposed water had an NDMA formation potential of 25 ng/L. It should be stressed that these are maximum formation potential tests, using a disinfectant concentration much greater than would be used in practice. This indicates the presence of NDMA precursors in the MIEX resin itself, a phenomenon which has been observed in other quaternary amine resins such as polyDADMAC, but which has not previously been reported for MIEX resin. Preliminary maximum formation potential experiments conducted by chlorination of Wanneroo WTP raw and MIEX treated waters did not give rise to a measureable NDMA concentration, however formed NDBA (N-nitrosodibutylamine) at a concentration of approximately 50 ng/L in the MIEX exposed water. Chlorinated raw water did not form a detectable NDBA concentration. Replicate analyses are imperative in order to confirm this, and it is emphasised that all reported results pertaining to MIEX resin are preliminary. This indicates the possibility of a specific reaction between a component of MIEX resin and hypochlorite solution to form this nitrogenous contaminant in significant concentrations. However, it is important to point out that neither nitrosamine species were found in the actual finished water exiting the plant, nor were they detected in the single sample point taken several kilometres down the distribution line. The benefits in water quality may outweigh the disadvantages in this instance, however, a deeper understanding of the chemistry of MIEX resin in reaction with disinfectants is important to enable operators to make informed decisions regarding nitrosamine formation.
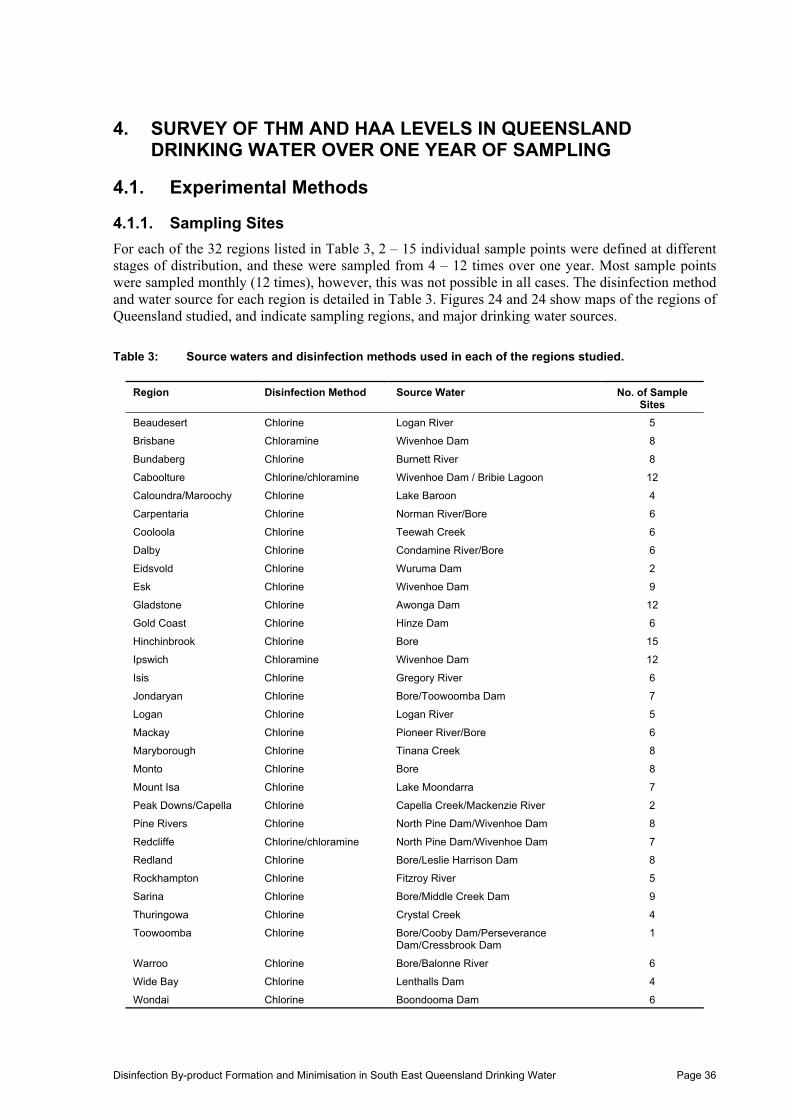
Disinfection By-product Formation and Minimisation in South East Queensland Drinking Water Page 36
4. SURVEY OF THM AND HAA LEVELS IN QUEENSLAND DRINKING WATER OVER ONE YEAR OF SAMPLING
4.1. Experimental Methods
4.1.1. Sampling Sites
For each of the 32 regions listed in Table 3, 2 – 15 individual sample points were defined at different stages of distribution, and these were sampled from 4 – 12 times over one year. Most sample points were sampled monthly (12 times), however, this was not possible in all cases. The disinfection method and water source for each region is detailed in Table 3. Figures 24 and 24 show maps of the regions of Queensland studied, and indicate sampling regions, and major drinking water sources.
Table 3: Source waters and disinfection methods used in each of the regions studied.
Region Disinfection Method Source Water No. of Sample Sites
Beaudesert Chlorine Logan River 5
Brisbane Chloramine Wivenhoe Dam 8
Bundaberg Chlorine Burnett River 8
Caboolture Chlorine/chloramine Wivenhoe Dam / Bribie Lagoon 12
Caloundra/Maroochy Chlorine Lake Baroon 4
Carpentaria Chlorine Norman River/Bore 6
Cooloola Chlorine Teewah Creek 6
Dalby Chlorine Condamine River/Bore 6
Eidsvold Chlorine Wuruma Dam 2
Esk Chlorine Wivenhoe Dam 9
Gladstone Chlorine Awonga Dam 12
Gold Coast Chlorine Hinze Dam 6
Hinchinbrook Chlorine Bore 15
Ipswich Chloramine Wivenhoe Dam 12
Isis Chlorine Gregory River 6
Jondaryan Chlorine Bore/Toowoomba Dam 7
Logan Chlorine Logan River 5
Mackay Chlorine Pioneer River/Bore 6
Maryborough Chlorine Tinana Creek 8
Monto Chlorine Bore 8
Mount Isa Chlorine Lake Moondarra 7
Peak Downs/Capella Chlorine Capella Creek/Mackenzie River 2
Pine Rivers Chlorine North Pine Dam/Wivenhoe Dam 8
Redcliffe Chlorine/chloramine North Pine Dam/Wivenhoe Dam 7
Redland Chlorine Bore/Leslie Harrison Dam 8
Rockhampton Chlorine Fitzroy River 5
Sarina Chlorine Bore/Middle Creek Dam 9
Thuringowa Chlorine Crystal Creek 4
Toowoomba Chlorine Bore/Cooby Dam/Perseverance Dam/Cressbrook Dam
1
Warroo Chlorine Bore/Balonne River 6
Wide Bay Chlorine Lenthalls Dam 4
Wondai Chlorine Boondooma Dam 6

Disinfection By-product Formation and Minimisation in South East Queensland Drinking Water Page 37
Figure 24: Map of Queensland showing all regions which were sampled as a part of this study. A detailed view of the boxed area of the Queensland map is shown in Figure 25.
Figure 25: South East Queensland, showing all regions sampled in this study. The major dams/lakes used for water supply in the area are also shown.

Disinfection By-product Formation and Minimisation in South East Queensland Drinking Water Page 38
4.1.2. Trihalomethanes Analysis
Trihalomethane analysis was conducted by extracting organics from the aqueous sample into hexane and analysing the extract by gas chromatography with electron capture detection, in accordance with the method outlined in APHA, AWWA, WEF Standards Methods for the examination of Water and Wastewater, 28th edition, 1992. This was achieved using a Hewlett Packard 5890 gas chromatograph with a DB1701 column with length 15 m and diameter 0.32 mm. The oven temperature was ramped from 60°C (held for 6 minutes) to 235°C. The carrier gas (hydrogen) pressure was programmed to maintain a pressure of 20 kPa. The method reporting limit was 4 g/L for total THMs, and 1 g/L for individual THMs. The uncertainty for the method was 10%.
4.1.3. Haloacetic Acids Analysis
Haloacetic acids were extracted from aqueous samples by partitioning into methyl tert-butyl ether (MTBE) after addition of sulfuric acid and sodium sulphate. The MTBE extracts were then methylated using methanolic sulfuric acid, then neutralised and analysed by gas chromatography using a GC 17A Shimadzu Gas Chromatograph with electron capture detector (ECD), and subsequently quantified by interpolation from a standard curve. The method reporting limit was 10 g/L for each haloacetic acid analyte, and the uncertainty for the method was 20%.
4.2. Overview A survey of THM and HAA concentrations in Queensland drinking water was undertaken in 2001-2002 by Queensland Health Forensic and Scientific Services in conjunction with a number of local authorities. We have acquired and evaluated these data to assess the overall compliance of the region to ADWG and WHO recommended guidelines, with the aim of providing insight into what specific regions were problematic and why. Although the data would not be expected to reflect current DBP concentrations in Queensland finished drinking waters, analysis of this large amount of data is nonetheless useful in terms of identifying trends, and understanding the relationships between source water parameters, disinfection methods, and DBP formation. Chlorine disinfection was used in the majority of locations examined, with a small percentage of regions having chloraminated drinking water, or a combination of chlorinated and chloraminated water (Figure 26 (i)). It is important to note that this is not a comprehensive study of the entirety of Queensland drinking water supplies, rather, it is focused on SEQ supplies, with some additional data from other Queensland regions. The raw water sources were primarily dams (41%), with rivers, bores, a combination of bore and surface waters, creeks and lakes making up the remainder (Figure 26 (ii)).
Figure 26: (i) Proportion of different drinking water disinfection methods employed in Queensland regions examined in this study. (ii) Proportion of different water sources utilised for drinking water across the regions studied here.
Dams 41%
Rivers 22%
Bores 20%
Bores/surface water 20%
Creeks 3%
Lakes 3%
Chlorination 83%
Chloramination 7%
Chloramination & chlorination 10%
(i) (ii)
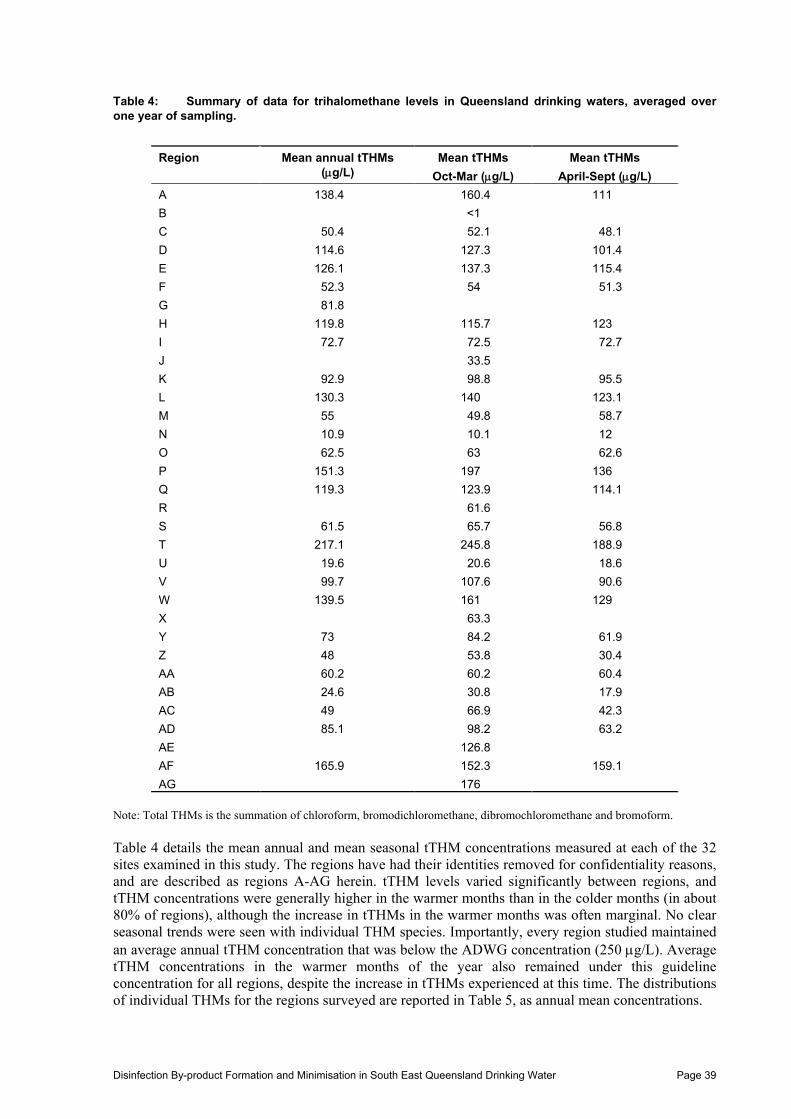
Disinfection By-product Formation and Minimisation in South East Queensland Drinking Water Page 39
Table 4: Summary of data for trihalomethane levels in Queensland drinking waters, averaged over one year of sampling.
Note: Total THMs is the summation of chloroform, bromodichloromethane, dibromochloromethane and bromoform. Table 4 details the mean annual and mean seasonal tTHM concentrations measured at each of the 32 sites examined in this study. The regions have had their identities removed for confidentiality reasons, and are described as regions A-AG herein. tTHM levels varied significantly between regions, and tTHM concentrations were generally higher in the warmer months than in the colder months (in about 80% of regions), although the increase in tTHMs in the warmer months was often marginal. No clear seasonal trends were seen with individual THM species. Importantly, every region studied maintained an average annual tTHM concentration that was below the ADWG concentration (250 g/L). Average tTHM concentrations in the warmer months of the year also remained under this guideline concentration for all regions, despite the increase in tTHMs experienced at this time. The distributions of individual THMs for the regions surveyed are reported in Table 5, as annual mean concentrations.
Region Mean annual tTHMs (g/L)
Mean tTHMs
Oct-Mar (g/L)
Mean tTHMs
April-Sept (g/L)
A 138.4 160.4 111
B <1
C 50.4 52.1 48.1
D 114.6 127.3 101.4
E 126.1 137.3 115.4
F 52.3 54 51.3
G 81.8
H 119.8 115.7 123
I 72.7 72.5 72.7
J 33.5
K 92.9 98.8 95.5
L 130.3 140 123.1
M 55 49.8 58.7
N 10.9 10.1 12
O 62.5 63 62.6
P 151.3 197 136
Q 119.3 123.9 114.1
R 61.6
S 61.5 65.7 56.8
T 217.1 245.8 188.9
U 19.6 20.6 18.6
V 99.7 107.6 90.6
W 139.5 161 129
X 63.3
Y 73 84.2 61.9
Z 48 53.8 30.4
AA 60.2 60.2 60.4
AB 24.6 30.8 17.9
AC 49 66.9 42.3
AD 85.1 98.2 63.2
AE 126.8
AF 165.9 152.3 159.1
AG 176

Disinfection By-product Formation and Minimisation in South East Queensland Drinking Water Page 40
Table 5: Average annual THM concentrations (μg/L) for the year of sampling in Queensland locations (BDCM is bromodichloromethane, DBCM is dibromochloromethane).
Figure 27 shows the annual concentration range for tTHMs found in chlorinated, chloraminated and chlorinated/chloraminated drinking waters. Chlorinated drinking waters had the widest range of tTHM concentrations, as well as the highest median and highest maximum tTHM levels compared to drinking water disinfected with chloramine or a combination of both chloramine and chlorine. Chloraminated/chlorinated drinking water had the narrowest range of tTHM concentration values, and a median tTHM level dramatically lower than chlorinated waters, although higher than that observed for solely chloraminated waters. Chloraminated water had the lowest levels of tTHMs in comparison to the other disinfectant methods, with 75% of samples having tTHM concentrations below 64 μg/L. The tTHM concentrations were higher in the warmer months than in the colder months for all three treatment processes.
Region Chloroform (μg/L) BDCM (μg/L) DBCM (μg/L) Bromoform (μg/L)
A 73 39 23 4
C 15 18 16 2
D 17 29 42 27
E 65 34 17 1
F 27 18 8 1
H 54 34 25 7
I 1 3 20 49
K 45 27 17 5
L 47 44 35 3
M 32 16 6 0
O 20 20 18 3
P 32 38 49 32
Q 50 40 28 3
S 24 20 17 2
T 110 69 35 3
U 1 2 5 12
V 39 34 24 3
W 113 22 5 1
Y 36 23 13 1
Z 33 14 10 5
AA 32 20 9 1
AB 9 12 7 6
AC 42 7 1 1
AD 31 29 23 3
AE 99 26 2 1
AF 118 30 6 1
AG 55 66 48 8

Disinfection By-product Formation and Minimisation in South East Queensland Drinking Water Page 41
0
10
20
30
40
50
60
70
80
90
Chlorinated Chloraminated Chloraminated/Chlorinated
Disinfection Method
Ch
loro
form
Co
nce
ntr
atio
n (
µg
/L)
Figure 27: Variation in tTHM concentration between warmer and colder months, as well as between different disinfection methods. Upper and lower points of each box plot show the actual maxima and minima for each dataset, and the yellow triangle indicates the median tTHM concentration.
Figure 28: Distribution of chloroform concentrations for chlorinated, chloraminated and chlorinated/chloraminated drinking waters. Upper and lower points of each box plot show the actual maxima and minima for each dataset, and the yellow triangle indicates the median tTHM concentration.
0
50
100
150
200
250
Spring/Summer(Oct/Mar)
Autumn/Winter(April/Sept)
Spring/Summer(Oct/Mar)
Autumn/Winter(April/Sept)
Spring/Summer(Oct/Mar)
Autumn/Winter(April/Sept)
Chlorination Chloramination Chloramination/Chlorination
Disinfection Method
tTH
M C
on
cen
tra
tion
(μ
g/
L)

Disinfection By-product Formation and Minimisation in South East Queensland Drinking Water Page 42
0
5
10
15
20
25
Chlorinated Chloraminated Chloraminated/chlorinated
Disinfection Method
DB
CM
Con
cent
ratio
n (μ
g/L)
0
5
10
15
20
25
30
Chlorinated Chloraminated Chloraminated/chlorinated
Disinfection Method
BD
CM
Co
nce
ntr
atio
n (μ
g/L
)
Figure 29: Variation in BDCM concentrations in chlorinated, chloraminated and chlorinated/chloraminated drinking waters. Upper and lower points of each box plot show the actual maxima and minima for each dataset, and the yellow triangle indicates the median tTHM concentration.
Figure 30: Distribution of DBCM concentrations for chlorinated, chloraminated and chlorinated/chloraminated drinking waters. Upper and lower points of each box plot show the actual maxima and minima for each dataset, and the yellow triangle indicates the median tTHM concentration.

Disinfection By-product Formation and Minimisation in South East Queensland Drinking Water Page 43
0% 10%
20%
30%
40%
50% 60%
70%
80%
90%
100%
Chlorinated Chloraminated Chloraminated/Chlorinated
Pro
port
ion
of t
TH
M (
%)
Non-brominated THMs
Brominated THMs
Figure 31: Distribution of bromoform concentrations for chlorinated, chloraminated and chlorinated/chloraminated drinking waters. Upper and lower points of each box plot show the actual maxima and minima for each dataset, and the yellow triangle indicates the median tTHM concentration.
Figures 28 – 31 show that chlorinated waters had the highest concentrations of chloroform in comparison to the other disinfectants, however chloraminated and chloraminated/chlorinated waters both had much higher DBCM and BDCM levels than chlorinated waters. Overall, concentrations of bromoform were the lowest of all THMs for all three treatment processes, although bromoform levels were higher in chlorinated water in comparison to chloraminated or chloraminated/chlorinated waters. Although the concentration of individual and total THMs varies with region and disinfection method, the proportion of brominated to non-brominated species was typically similar for all three treatment processes (Figure 32).
Figure 32: Proportion of brominated to non-brominated THMs arising from different disinfection methods.
0
2
4
6
8
10
12
14
16
Chlorinated Chloraminated Chloraminated/chlorinated
Disinfection Method
Bro
mo
form
Co
nce
ntr
atio
n (μ
g/L
)

Disinfection By-product Formation and Minimisation in South East Queensland Drinking Water Page 44
Sampling date
1/01/2007 1/03/2007 1/05/2007 1/07/2007 1/09/2007
Cho
rofo
rm c
once
ntra
tion
(g/
L)
0
20
40
60
80
100
120
Chloramination Chlorination
0%
20%
40%
60%
80%
100%
Bore Water Surface/Bore Water Surface Water
Water Source
Pro
port
ion o
f tT
HM
Bromoform
DBCM
BDCM
Chloroform
Factors other than disinfection method, such as DOC level and source water bromide concentration, will also impact on the distribution of the individual THMs in a given source water (81) therefore this must also be taken into account before drawing conclusions from these data. However, the following general trend was noted; often chloroform concentrations were highest, followed by BDCM, then DBCM and lastly bromoform. The significant exception to this was in regions where water supplies were supplemented with bore water, in which case bromoform was the predominant THM, and chloroform concentrations were comparatively low (Figure 33).
Figure 33: Proportion of individual THMs from different water sources.
Figure 34: Variation in chloroform concentration in from E-WTP over 9 months of sampling. In this case the other regulated THMs were generally undetected regardless of whether chlorination or chloramination were employed.
During the course of this survey, E-WTP changed disinfection method from chloramination to chlorination. The data for chloroform concentration is shown in Figure 34. This illustrates that a given source water may demonstrate a large change in chloroform (and potentially other DBP) concentration, based predominantly on the disinfection method employed, and that this appears dominant over other variations in source water that may be occurring over the same time.
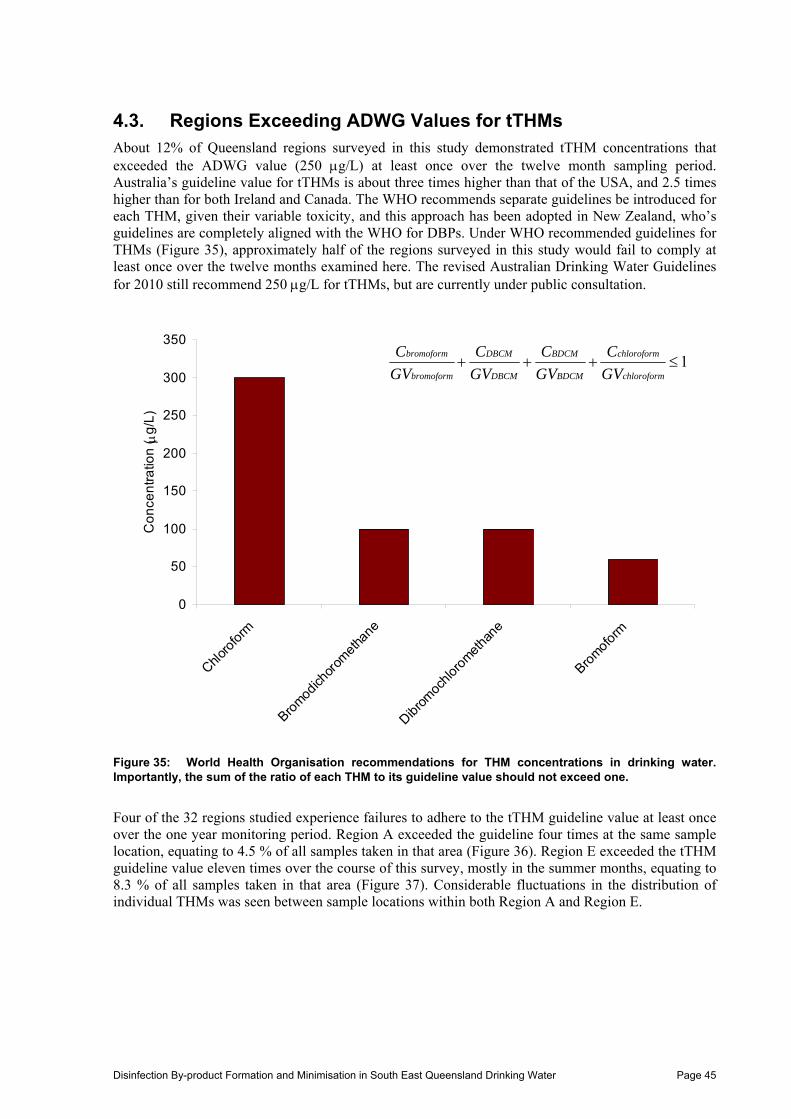
Disinfection By-product Formation and Minimisation in South East Queensland Drinking Water Page 45
4.3. Regions Exceeding ADWG Values for tTHMs About 12% of Queensland regions surveyed in this study demonstrated tTHM concentrations that exceeded the ADWG value (250 g/L) at least once over the twelve month sampling period. Australia’s guideline value for tTHMs is about three times higher than that of the USA, and 2.5 times higher than for both Ireland and Canada. The WHO recommends separate guidelines be introduced for each THM, given their variable toxicity, and this approach has been adopted in New Zealand, who’s guidelines are completely aligned with the WHO for DBPs. Under WHO recommended guidelines for THMs (Figure 35), approximately half of the regions surveyed in this study would fail to comply at least once over the twelve months examined here. The revised Australian Drinking Water Guidelines for 2010 still recommend 250 g/L for tTHMs, but are currently under public consultation.
Figure 35: World Health Organisation recommendations for THM concentrations in drinking water. Importantly, the sum of the ratio of each THM to its guideline value should not exceed one.
Four of the 32 regions studied experience failures to adhere to the tTHM guideline value at least once over the one year monitoring period. Region A exceeded the guideline four times at the same sample location, equating to 4.5 % of all samples taken in that area (Figure 36). Region E exceeded the tTHM guideline value eleven times over the course of this survey, mostly in the summer months, equating to 8.3 % of all samples taken in that area (Figure 37). Considerable fluctuations in the distribution of individual THMs was seen between sample locations within both Region A and Region E.
0
50
100
150
200
250
300
350
Chlor
ofor
m
Brom
odich
orom
etha
ne
Dibro
moc
hlor
omet
hane
Brom
ofor
m
Co
nce
ntr
atio
n (
g/L
)
1chloroform
chloroform
BDCM
BDCM
DBCM
DBCM
bromoform
bromoform
GV
C
GV
C
GV
C
GV
C

Disinfection By-product Formation and Minimisation in South East Queensland Drinking Water Page 46
Month sampled
February March
AprilJune
JulyAugust
September
October
November
December
February
tTH
M c
once
ntra
tion
( g
/L)
0
100
200
300
400
500
Site 1 Site 2Site 3Site 4Site 5Guideline Value
M onth sam pled
MarchApril
MayJune
July
August
September
October
November
December
January
February
March (13th m
onth)
tTH
M c
once
ntra
tion
(g/
L)
0
50
100
150
200
250
300
350
S ite 1S ite 2S ite 3S ite 4S ite 5S ite 6S ite 7S ite 8G uide line Value
Figure 36: Change in tTHM concentration in drinking water in Region A over 12 months. Figure 37: Change in tTHM concentrations in Region E’s drinking water, over the one-year sampling period.

Disinfection By-product Formation and Minimisation in South East Queensland Drinking Water Page 47
Month Sampled
March July October December
tTH
M c
onc
entr
atio
n (
g/L
)
50
100
150
200
250
300
350
Site 1Site 2Site 3Site 4Site 5Site 6Site 7Site 8Guideline Value
Region T exceeded the guideline concentration for tTHMs ten times over twelve months of monitoring, which was 31.3 % of all samples taken (Figure 38). Region T’s tTHM levels were the highest of all the regions surveyed. The distributions of the individual THMs were similar between sample locations in this region. Finally, region P experienced 3 incidences of non-compliance to guidelines for tTHMs over the survey period, equating to 7.1 % of all samples taken in the area.
Figure 38: Variation in tTHM concentration in drinking water in Region T over ten months.
4.4. Regions Exceeding ADWG Values for Haloacetic Acid (HAAs) Approximately 18% of surveyed regions had samples that exceeded the HAA ADWG guideline values at least once over the twelve month sampling period. The trichloroacetic acid guideline value was exceeded in 88% of these cases, with 12% of failures being attributed to high dichloroacetic acid. Monochloroacetic acid concentrations were consistently within Australian Drinking Water Guideline values. Interestingly, only chlorinated waters had chloroacetic acid concentrations that exceeded the guideline values. Overall, mean annual concentrations of HAAs were low in comparison to their guideline values, as shown in Table 6. Over the monitoring period, the total concentration of non-regulated HAAs (monobromoacetic acid and dibromoacetic acid) was generally below the total concentration of regulated HAAs.

Disinfection By-product Formation and Minimisation in South East Queensland Drinking Water Page 48
Table 6: Mean annual concentration of regulated haloacetic acids in the various Queensland regions discussed in this study.
Region Monochloroacetic Acid Dichloroacetic Acid Trichloroacetic Acid
A BDL 30 55
B BDL 10 10
C BDL 6 5
D BDL 25 32
E BDL 4 11
F BDL 39 36
G BDL 18 28
H BDL BDL BDL
I BDL BDL BDL
J BDL 28 36
K BDL 16 28
L BDL 6 18
M BDL BDL BDL
N BDL 10 7
O BDL 11 12
P BDL 17 19
Q BDL 6 7
R BDL 8 8
S BDL 11 45
T BDL BDL BDL
U BDL 14 18
V BDL 55 81
W BDL 15 10
X BDL 9 15
Y BDL BDL 3
Z BDL 7 10
AA BDL 3 3
AB BDL BDL BDL
AC BDL 16 17
AD BDL 16 17
AE BDL 25 31
AF BDL 31 55
AG BDL 11 10
Figure 39 shows that Australia’s guideline value for monochloroacetic acid of 150 g/L is lenient when compared to the WHOs suggested guideline of 20 g/L. However, concentrations found across SEQ were all below the detection limit of 5 g/L. Thus, the introduction of stricter guidelines would appear to have little effect on compliance in these regions of Queensland. Similarly, Australia’s guideline value for dichloroacetic acid of 100 g/L is high when compared to the WHOs recommended guideline of 50 g/L, and in fact, about 19% of regions fail to comply with this stricter guideline over the twelve month monitoring period. Conversely, Australia’s guideline value for trichloroacetic acid (100 g/L) is more stringent than the WHOs recommendation of a maximum of 200 g/L. Although the Australian trichloroacetic acid guideline value was exceeded a number of times in the above regions, over the twelve months of monitoring, the WHO recommended concentration was rarely exceeded (1%). That is, trichloroacetic acid concentrations almost always complied with the WHOs guideline value. Incidence of non-compliance to guideline values for trichloroacetic acid would probably be rare if WHO recommendations were adopted in Australia, however incidence of non-compliance to guideline values for dichloroacetic acid would be likely to increase.

Disinfection By-product Formation and Minimisation in South East Queensland Drinking Water Page 49
0
20
40
60
80
100
120
140
160
180
200
ADWG WHO and NZ USA
Co
nce
ntr
atio
n (μ
g/L
)Monochloroacetic Acid
Dichloroacetic Acid
Trichloroacetic Acid
Total HAA
Figure 39: Worldwide guideline values for regulated HAAs (current in 2010).
Again, four regions experienced at least one failure to adhere to the ADWGs for HAAs over the one-year monitoring period, with two of these regions being the same as those that failed to adhere to tTHM guidelines (Regions A and E). All sample locations in Region A had trichloroacetic acid concentrations in excess of guideline values over the sampling period. The trichloroacetic acid guideline value was exceeded ten times over the twelve months, equating to 15% of all samples taken. Figure 40 shows most failures in Region A occurred in the summer months.

Disinfection By-product Formation and Minimisation in South East Queensland Drinking Water Page 50
Month sampled
February March
AprilJune
JulyAugust
September
November
December
January
February (13th m
onth)
Tric
hlo
roa
cetic
aci
d c
once
ntr
atio
n (g
/L)
0
50
100
150
200
250
Site 1Site 2Site 3Site 4Site 5Guideline Value
Figure 40: Trichloroacetic acid concentration in drinking water of Region A over the twelve-month monitoring period.
Four sample locations in Region E had trichloroacetic acid concentrations exceeding ADWG recommendations over the sampling period. The trichloroacetic acid guideline value was exceeded ten times over the twelve-month monitoring period, which equals 7% of all samples taken in the area. Figure 41 shows that, in this case also, most failures occurred in the summer months. One sampling location in Region H had a single trichloroacetic acid failure over the monitoring period, in September (1.5% of all samples taken in that area). Finally, two sample locations had trichloroacetic acid failures in region AF, exceeding the guideline four times (8% of all samples taken in the area).

Disinfection By-product Formation and Minimisation in South East Queensland Drinking Water Page 51
Month Sampled
MarchApril May
JuneJully
August
September
October
November
December
January
February
Tric
hlo
roa
cetic
aci
d c
on
cen
tra
tion
(g
/L)
0
20
40
60
80
100
120
Site 1Site 2Site 3Site 4Site 5Guideline Value
Figure 41: Trichloroacetic acid concentration in water from the Region E over the twelve-month monitoring period.
4.5. Conclusions from THM and HAA Survey THM and HAA levels varied between different suppliers' water and overall THM and HAA levels were within the regulatory limits for the majority of the time. tTHM levels were highest in chlorinated water, whereas levels in chloraminated/chlorinated water were much lower. Chloraminated water had the lowest levels of tTHMs in comparison to the other disinfectants. In chlorinated waters, there was wide variation in chloroform levels between samples whereas levels of the brominated THMs were more constant. Concentrations of chloroform may be more irregular because its formation increases over time, thus concentrations are dependent on residence time, chlorine residual and the structural integrity of the distribution system(87). Concentrations of chloroform in chloraminated and chloraminated/chlorinated waters were considerably more stable, although the average proportion of brominated to non-brominated species was similar, overall, for all three treatment processes.

Disinfection By-product Formation and Minimisation in South East Queensland Drinking Water Page 52
Results showed that there were clear differences in the concentrations of total and individual THMs formed in bore and surface waters. Thus, a great deal of the variation in THM speciation and concentration among regions can be attributed to the water source. Surface water formed a higher proportion of chlorinated THMs species, whereas bore water had a higher proportion of brominated THM species. The low levels of natural organic matter and high bromide levels characteristic of many bore water sources produce a naturally high bromide:organic matter ratio(88). As bore water sources have low organic content they require minimal disinfectant, generating a high bromide:chlorine ratio. These ratios increase the proportion of brominated THMs, leading to a decrease in chlorinated THMs(89). Australia’s tTHM guideline value is higher than the tTHM limits in Canada, the United Kingdom, European Union, and USA, as well as the WHO recommendation(47). The results presented here indicate that the majority of average regional tTHM concentrations are compliant with ADWG, however, compliance falls drastically when compared against international and WHO guidelines. Regions with chlorinated water were the only regions that exceeded the ADWG for THMs. Chloraminated water produced the lowest tTHM levels in the regions examined here, with all samples complying with the ADWG. The current revision of the ADWG still recommends 250 g/L as the guideline for total THMs, however this proposed guideline is currently in the process of receiving public comment. The majority of regions were compliant with ADWG for HAA concentrations, with primarily the trichloroacetic acid guideline value being exceeded. Only chlorinated waters experienced non-compliant trichloroacetic acid concentrations. Overall, average concentrations of regulated HAAs were very low in comparison to their guideline values. Over the monitoring period, the total concentration of non-regulated HAAs (monobromoacetic acid and dibromoacetic acid) was generally below the total concentration of regulated HAAs. Australia’s guideline value for monochloroacetic acid is 7.5 times higher than the WHOs recommendation, however, average concentrations were all below the detection limit of 5 g/L, thus, the introduction of stricter guidelines would have little effect on compliance in this region. tTHM levels generally increased during the warm season for all three treatment methods. Similar trends have been found in several other studies(90-92). This seasonal fluctuation was found in the tTHM levels, while individual THMs levels did not appear to follow any clear seasonal trends. This observation may be explained by seasonal variations in water temperature, natural organic matter and water quality. Higher water temperatures promote the production of THMs, thus tTHM concentrations are normally higher in summer. Additionally, seasonal factors that lead to an increase in natural organic matter during summer are increased biological activity, rainfall and thus runoff(93). Krasner and colleagues found bromide levels may also increase during drought(94) although, due to the short time frame over which data was collected, this could not be assessed. Given Australia’s high guideline value for tTHMs compared to international drinking water sources and WHO recommendations, public comment may suggest that the revised ADWG for THMs be altered to be more consistent with international guidelines. The introduction of individual guidelines rather than simply a tTHM guideline would allow water quality to be more appropriately assured from a public health perspective. Given than the four regulated THMs have very different toxicology, intuitively they should have individual guideline values, or alternatively a tTHM guideline value which is based conservatively on the most toxic THM. Toxicity arising from THMs cannot accurately be monitored by measuring only a tTHM concentration. Under a system with individual guideline values for each of the four regulated THMs, lower toxicity THMs would be allowed at greater concentrations than the higher toxicity THMs, rather than assuming an acceptable distribution of the four separate species and only taking into account their total concentration.

Disinfection By-product Formation and Minimisation in South East Queensland Drinking Water Page 53
5. CONCLUSIONS
The major conclusions arising from this work are as follows. NDMA was not found in any potable water samples taken during the one year of this study. This is not to imply that the study was comprehensive in monitoring the entire distribution system, but certainly, treated water leaving the WTPs consistently had NDMA <5 ng/L. The prevalence of NDMA formation within the distribution system was not thoroughly addressed here, however, one sample point some distance down the distribution line of each WTP studied was also monitored, and these also consistently had NDMA concentrations <5 ng/L. The authors recommend a larger scale monitoring program looking specifically at NDMA formation within the distribution system; the impact of mixing waters which have been exposed to different disinfectants and which have come from different sources is important to understand in order to address this knowledge gap. NDMA formation potentials determined by excess chlorination of all raw source waters did not give rise to measureable NDMA concentrations (<5 ng/L) in any case. NDMA formation potentials from excess chloramination of all source waters were in every case between 5 – 21 ng/L. This is a maximum formation potential, that is, the disinfectant concentrations were approximately 10-fold higher than would be used in practice. These results suggest finished waters from SEQ WTPs are unlikely to require additional treatment to adhere to the introductory guideline value of 100 ng/L for NDMA. NDMA formation potentials were found to be lowered by longer free-chlorine contact times prior to the addition of ammonia. This is balanced by the possibility of higher THMs formation with longer free-chlorine contact time. Although a loose, inversely proportional relationship between DOC/DON ratio and NDMA formation potential was observed (higher DON leading to higher NDMA formation potential), this correlation was weak, therefore the simple measurement of DOC and DOC could not be used as a surrogate for predicting NDMA formation potential. Total trihalomethane concentrations did not exceed the ADWG value when chloramination was employed as the disinfection method. However, several regions in SEQ using chlorination as the disinfectant did experiences failures to adhere to guidelines for tTHMs over the one-year sampling period studied. Chlorine is effectively used in many parts of SEQ without subsequently high THM concentrations. It is recommended that water treatment practices in the regions which failed to consistently meet guideline values are reviewed, with the aim of improving water treatment methods toward better DBP management. This is not to say a change in disinfection method (to chloramination) is necessarily required, rather, changes to standard operating procedures such as dosing with chlorine when waters have appropriately low DOC concentrations or using lower concentrations of disinfectant may be sufficient. Improving local expertise within the WTP toward better DBP management may be an appropriate approach. THM formation potential experiments confirmed that, chlorination forms higher concentrations of THMs than chloramination. In no instance did THM formation potential experiments using SEQ source waters form tTHM concentrations higher than the ADWGs. However, the ADWGs allow high tTHM concentrations (250 g/L) compared to many other parts of the world and WHO recommendations(47). The authors recommend this guideline should ultimately be reviewed to be aligned with the WHO, however accept that many chlorinating SEQ WTPs would currently fail to comply with this. Thus, further effort needs to be put into lowering THM concentrations in potable water, preferably by lowering organic matter and/or bromide in the source water prior to disinfection. Importantly, every currently available disinfection method forms disinfection by-products, most of which have not been identified or adequately characterised for their toxicity(1). With this in mind, a wide-spread change to alternative disinfection methods such as chloramination cannot be recommended until such a time as their DBP profiles are better understood. Advanced oxidation experiments found that UV irradiation at a dose similar to that used for disinfection (UV dose of up to 60 mJ/cm2 was studied here) was effective in reducing existing NDMA

Disinfection By-product Formation and Minimisation in South East Queensland Drinking Water Page 54
concentrations in raw water. This outcome did not require H2O2 and the degree of NDMA destruction was not improved by the presence of H2O2. Therefore, UV disinfection would be expected to be sufficient to remove low levels of NDMA present as a contaminant in potable water sources. THMs were not able to be destroyed by either UV radiation or UV in conjunction with H2O2. Their concentration remained essentially constant in chlorine or chloramine disinfected water irrespective of advanced treatment. However, application of advanced treatment to raw waters prior to chlorine or chloramine treatment was very effective in removing THM precursors, and subsequent THM formation was low. tTHM formation potential was lowered by pre-treatment with UV irradiation, and further dramatically lowered by pre-treatment with UV in conjunction with H2O2. Irrespective of whether the subsequent treatment was chlorination or chloramination, at H2O2 concentrations of 5 mg/L and UV dose of 30 mJ/cm2, the THM formation potential was similar, and low (approximately 10 g/L). Pre-treatment by advanced oxidation may be an excellent means of reducing tTHM levels in regions with particular difficulties minimising these compounds. Ozonation experiments were preliminary only, and results have not been verified. These preliminary data suggests that the high bromine source waters of Teviot Brook may produce significant bromate concentrations upon ozonation. However, pre-treatment with chlorine dioxide or hypochlorite/ammonia prior to ozonation may decrease bromate formation sufficiently to allow ozonation to be used as the disinfection method. Pre-treatment was found to lower bromate formation in preliminary trials, however, these results are yet to be confirmed. Chlorate concentrations were found to be high in these trials, indicating the treatment protocols would need to be optimised to minimise both bromate and chlorate before considering their use in a ‘real-world’ setting. THM formation was very low or undetected using these ozonation strategies. DBP minimisation by coagulation using alum, ferric chloride or polyDADMAC proved to be ineffective using Teviot Brook source waters. Although a notable decrease in DOC and DON was attained with these coagulants, the NDMA formation potential of the treated water remained constant with and without coagulation, except in the instance of coagulating with polyDADMAC, in which case the NDMA formation potential was dramatically increased. This organic polymer (polyDADMAC) should therefore be used with caution. Importantly, polyDADMAC did not cause an increase in NDMA formation potential when reacted with chlorine, rather, the increase in NDMA formation potential was exclusive to reaction with chloramine. In support of this, Molendinar WTP, which uses polyDADMAC in the treatment process and chlorine as the disinfectant, had consistently undetectable NDMA in the finished water over the four month sampling period (<5 ng/L). Although it is typically found that lowering DOC will lead to lower tTHMs, this was found not to be the case in waters with high bromide concentration(80, 81, 85). In fact, high bromide waters that underwent coagulation with alum, ferric chloride or polyDADMAC all exhibited an increased tTHM formation potential despite a significantly lowered DOC concentration. This comes about as a consequence of DOM competing for oxidant with bromide, therefore, lower DOM waters will give rise to higher brominated THM formation. When bromide levels are sufficiently high, coagulation will lead to an increase in tTHM concentration, since there will be a greatly increased Br-THM concentration, despite a probably lower chloroform concentration with decreased DOC. That is, lowering DOC will tend to lower more highly chlorinated THMs, and also tend to increase more highly brominated THMs. MIEX resin, as a quaternary amine anion exchanger, may also be expected to contain NDMA precursors, as has been shown with polyDADMAC. Wanneroo WTP (in Perth) is a full-scale MIEX water treatment plant, which uses chlorination only as the disinfection method(82). Again, the finished water had no detectable NDMA present (<5 ng/L). However, similarly to polyDADMAC, the NDMA formation potential determined by reacting MIEX exposed water with chloramine was significantly increased relative to the raw water. However, again, no NDMA was formed when MIEX was reacted with hypochlorite, which is supported by the findings at Wanneroo WTP. This suggests that polyDADMAC, MIEX resin, and possibly other quaternary amine anion exchangers, should only be used in conjunction with chlorination rather than chloramination.

Disinfection By-product Formation and Minimisation in South East Queensland Drinking Water Page 55
6. RECOMMENDATIONS
NDMA formation potentials are lowered in chloraminated waters which have a free-chlorine contact time prior to ammonia addition, relative to chloraminated waters which do not have a free-chlorine contact time. Therefore, when chloramination is used, a free-chlorine contact time should be employed, to the extent that a significant increase in THM formation is not experienced. For regions experiencing high THM concentrations in the finished water, the authors’ primary recommendation is to review the Standard Operating Procedures within the plant to ensure best practice is being employed. For example, chlorine dosing should be of an appropriate concentration, and occur at a point of the treatment process with the lowest practically attainable DOC concentrations. If THMs are still problematic once these fundamental considerations are in place, due to, for example, high bromide concentrations in the raw water, a change in disinfection method may be appropriate. Chloramination consistently yields lower tTHMs than chlorination of the same source water, therefore chloramination is a recommended disinfection method in naturally high THM forming waters. Pre-treatment of raw waters by UV combined with hydrogen peroxide may be an excellent alternative means of reducing tTHM formation upon chlorine or chloramine disinfection. For waters with trace concentrations of NDMA present as a contaminant, UV treatment would be expected to be sufficient for its removal. This study found that the polymeric coagulant, polyDADMAC, formed NDMA when exposed to chloramines, but not when exposed to chlorine. Similarly, MIEX resin exposed water (from Wanneroo WTP) formed NDMA when exposed to chloramines, but not when exposed to chlorine. Therefore, the authors recommend that these resins be used only when chlorine is utilised as the disinfectant, and when there is no possibility of the polyDADMAC/MIEX exposed water mixing with chloraminated water within the distribution system. Bromide in source waters will form higher concentrations of brominated THMs when lower DOM concentrations are present during disinfection than when higher concentrations of DOM are present. Therefore, coagulation (to lower DOM concentration) in high bromide source waters leads to increased brominated THM formation, particularly if chlorination is used as the disinfection method. If it is not possible to remove some of the bromide prior to treatment, chloramination may be a better alternative than chlorination for high bromide source waters.

Disinfection By-product Formation and Minimisation in South East Queensland Drinking Water Page 56
REFERENCES
1. Richardson, S. D., Plewa, M. J., Wagner, E. D., Schoeny, R., and DeMarini, D. M. (2007) Mutation Research-Reviews in Mutation Research 636, 178-242.
2. Richardson, S. D. (1998) Drinking water disinfection by-products. in Encyclopedia of Environmental Analysis and Remediation (Meyers, R. A. ed.), Wiley. pp 1398-1421.
3. Bellar, T. A., Lichtenberg, J. J., and Kroner, R. C. (1974) Journal American Water Works Association 66, 703-706.
4. Loper, J. C. (1980) Mutation Research/Reviews in Genetic Toxicology 76, 241-268. 5. National Health and Medical Research Council. (2004) Australian Drinking Water Guidelines. 6. Stevens, A. A., Moore, L. A., Slocum, C. J., Smith, B. L., Seeger, D. R., and Ireland, J. C. (1989) Acs
Symposium Series 219, 681-695. 7. World Health Organisation, IARC. (1999) Some Chemicals that Cause Tumours of the Kidney of Urinary
Bladder in Rodents and Some other Substances. 8. Hard, G. C., Boorman, G. A., and Wolf, D. C. (2000) Toxicol. Sci. 53, 237-244. 9. Templin, M. V., Larson, J. L., Butterworth, B. E., Jamison, K. C., Leininger, J. R., Mery, S., Morgan, K.
T., Wong, B. A., and Wolf, D. C. (1996) Toxicol. Sci. 32, 109-125. 10. DeMarini, D. M., Shelton, M. L., Warren, S. H., Ross, T. M., Shim, S. Y., Richard, A. M., and Pegram,
R. A. (1997) Environmental and Molecular Mutagenesis 30, 440-447. 11. Ross, M. K., and Pegram, R. A. (2004) Toxicology and Applied Pharmacology 195, 166-181. 12. World Health Organisation, IARC. (1991) Coffee, Tea, Mate, Methylxanthines and Methylglyoxal. 13. World Health Organisation, IARC. (1999) Re-evaluation of Some Organic Chemicals, Hydrazine and
Hydrogen Peroxide (Part one, part two, part three). 14. Ross, M. K., and Pegram, R. A. (2003) Chemical Research in Toxicology 16, 216-226. 15. Zwiener, C., Richardson, S. D., De Marini, D. M., Grummt, T., Glauner, T., and Frimmel, F. H. (2006)
Environmental Science and Technology 41, 363-372. 16. Leavens, T. L., Blount, B. C., DeMarini, D. M., Madden, M. C., Valentine, J. L., Case, M. W., Silva, L.
K., Warren, S. H., Hanley, N. M., and Pegram, R. A. (2007) Toxicol. Sci., 190. 17. Scully, F. E., White, W. N. Boethling, R. S. (1994) Reactions of drinking water contaminants with
aqueous chlorine and monochloramine. Water contamination and health: integration of exposure assessment, toxicology, and risk assessment (Wang, R. G. M. ed.), Decker, New York. pp 45-65.
18. Scully, F. E., Jr. (1985) Contribution of Proteins to the Formation of Trihalomethanes on chlorination of natural waters. Water Chlorination: Environmental Impact and Health Effects (Jolley, R. L., Condie, L. W., Johnson, J. D., Katz, S., Minear, R. A., Mattice, J. S., Jacobs, V. A. ed.), Lewis Publishers, Chelsea, MI., 807-819.
19. Oliver, B. G., and Shindler, D. B. (1980) Environmental Science and Technology 14, 1502-1505. 20. Kargalioglu, Y., McMillan, B. J., Minear, R. A., and Plewa, M. J. (2002) Teratogenesis Carcinogenesis
and Mutagenesis 22, 113-128. 21. DeAngelo, A. B., Daniel, F. B., Most, B. M., and Olson, G. R. (1997) Journal of Toxicology and
Environmental Health 52, 425-445. 22. Plewa, M. J., Kargalioglu, Y., Vankerk, D., Minear, R. A., and Wagner, E. D. (2002) Environmental and
Molecular Mutagenesis 40, 134-142. 23. World Health Organisation, IARC. (2004) Some Drinking-water Disinfectants and Contaminants,
including Arsenic. 24. Bolyard, M., Fair, P. S., and Hautman, D. P. (1992) Environmental Science and Technology 26, 1663-
1665. 25. Richardson, S. D., Thruston, A. D., Rav-Acha, C., Groisman, L., Popilevsky, I., Juraev, O., Glezer, V.,
McKague, A. B., Plewa, M. J., and Wagner, E. D. (2003) Environmental Science and Technology 37, 3782-3793.
26. Sai, K., Takagi, A., Umemura, T., Hasegawa, R., and Kurokawa, Y. (1991) Japanese Journal of Cancer Research 82, 165-169.
27. Sai, K., Tyson, C. A., Thomas, D. W., Dabbs, J. E., Hasegawa, R., and Kurokawa, Y. (1994) Cancer Letters 87, 1-7.
28. Sai, K., Uchiyama, S., Ohno, Y., Hasegawa, R., and Kurokawa, Y. (1992) Carcinogenesis 13, 333-339. 29. Umemura, T., Takagi, A., Sai, K., Hasegawa, R., and Kurokawa, Y. (1998) Archives of Toxicology 72,
264-269. 30. United States Environmental Protection Agency. (2001) Integrated Risk Information System. Bromate
(CAS RN 15541-45-4). 31. National Health and Medical Research Council (2010) Draft - Australian Drinking Water Guidelines.

Disinfection By-product Formation and Minimisation in South East Queensland Drinking Water Page 57
32. United States Environmental Protection Agency. (1987) Integrated Risk Information System. N-nitrosodimethylamine (CAS RN 62-75-9)
33. Jakszyn, P., and Gonzalez, C. A. (2006) World Journal of Gastroenterology 12, 4296-4303. 34. World Health Organisation. (2006) N-Nitrosodimethylamine in drinking-water. 35. Fristachi, A., and Rice, G. (2007) Journal of Water and Health 5, 341-355. 36. Charrois, J. W. A., Arend, M. W., Froese, K. L., and Hrudey, S. E. (2004) Environmental Science and
Technology 38, 4835-4841. 37. Liteplo, R. G., and Meek, M. E. (2001) Journal of Environmental Science and Health Part C-
Environmental Carcinogenesis and Ecotoxicology Reviews 19, 281-304. 38. World Health Organisation, IARC. (1978) Some N-Nitroso Compounds. 39. Fujita, K., and Kamataki, T. (2001) Mutation Research-Fundamental and Molecular Mechanisms of
Mutagenesis 483, 35-41. 40. Brown, J. L. (1999) Occupational Medicine-State of the Art Reviews 14, 839-848. 41. United States Environmental Protection Agency, Integrated Risk Information System.
http://www.epa.gov/IRIS/. 42. Gerecke, A. C., and Sedlak, D. L. (2003) Environmental Science and Technology 37, 1331-1336. 43. Wilczak, A., Assadi-Rad, A., Lai, H. H., Hoover, L. L., Smith, J. F., Berger, R., Rodigari, F., Beland, J.
W., Lazzelle, L. J., Kinicannon, E. G., Baker, H., and Heaney, C. T. (2003) Journal American Water Works Association 95, 94-106.
44. Mitch, W. A., and Sedlak, D. L. (2002) Environmental Science and Technology 36, 588-595. 45. Giller, S., LeCurieux, F., Erb, F., and Marzin, D. (1997) Mutagenesis 12, 321-328. 46. Agus, E., Voutchkov, N., and Sedlak, D. L. (2009) Desalination 237, 214-237. 47. World Health Organisation. (2008) Guidelines for drinking-water quality incorporating 1st and 2nd
addenda, Vol 1., 3rd Ed. 48. United States Environmental Protection Agency. (1999) Alternative disinfectants and oxidants. 49. Belluati, M., Danesi, E., Petrucci, G., and Rosellini, M. (2007) Desalination 203, 312-318. 50. Bonacquisti, T. P. (2006) Toxicology 221, 145-148. 51. Buffle, M.-O., Galli, S., and von Gunten, U. (2004) Environmental Science and Technology 38, 5187-
5195. 52. Krasner, S. W. Y., Rich; Gabelich, Christopher J.; Liang, Sun. (2007) Evaluation of alternative bromate
control strategies. in Annual Conference, American Water Works Association. 53. Pinkernell, U., and von Gunten, U. (2001) Environmental Science and Technology 35, 2525-2531. 54. Charrois, J. W. A., and Hrudey, S. E. (2007) Water Research 41, 674-682. 55. Trolio, R., Walker, R., McNeil, S., Huynh, T., Jismi, N. (2006) Novel Approaches to Trihalomethane
Management. in 69th Annual Water Industry Engineers and Operators’ Conference, Bendigo, WA. 56. Houghton, D., Richardson, D. (2006) Wyaralong Dam Initial Advice Statement WBM Pty Ltd. 57. Munch, J. W., and Bassett, M. V. (2006) Journal of Aoac International 89, 486-497. 58. Munch, J. W. (1995) Measurement of purgeable organic compounds in water by capillary column gas
chromatography/mass spectrometry. (United States Environmental Protection Agency). 59. Eaton, A. D., Franson, M. A. H. (ed) (2005) Standard methods for the examination of water and
wastewater American Public Health Association, American Water Works Association, Water Environment Federation.
60. Harp, D. L., Wiese, P., Franklin, S. (2001) US Patent 6315950 - Controlling chlorination of wastewater and chloramination of drinking water. HACH company.
61. Nogueira, R. F., Oliveira, M. C., and Paterlini, W. C. (2005) Talanta 66, 86-91. 62. Schreiber, I. M., and Mitch, W. A. (2005) Environmental Science and Technology 39, 3811-3818. 63. Lee, W., Westerhoff, P., and Croue, J. P. (2007) Environmental Science and Technology 41, 5485-5490. 64. Lee, W., and Westerhoff, P. (2006) Water Research 40, 3767-3774. 65. Lurie, M., and Rebhun, M. (1997) Water Science and Technology 36, 93-101. 66. Montgomery, J. M. (1985) Water treatment principles and design Wiley, New York. 67. Morran, J., Whittle, M., Leach, J., Harris, M. (2009) Water 36, 9-101. 68. LeBel, G. L., Benoit, F. M., and Williams, D. T. (1997) Chemosphere 34, 2301-2317. 69. United States Environmental Protection Agency. (2001) Controlling disinfection by-products and
microbial contaminants in drinking water. 70. Australian Government, Bureau of Meteorology. (2010) Monthly rainfall Beaudesert.
http://www.bom.gov.au/. 71. W. A. Mitch, J. O. Sharp, R. R. Trussell, R. L. Valentine, L. Alvarez-Cohen, D. L. Sedlak, (2003) N-
nitrosodimethylamine (NDMA) as a drinking water contaminant: A review, Environmental Engineering Science, 20(5), 389-404.
72. Malcolm Pirnie, I., Carollo engineers, P.C., The Cadmus group, Inc., Linden, K.G., Malley (Jr), J.P. (2003) Ultraviolet disinfection guidance manual. (United States Environmental Protection Agency).

Disinfection By-product Formation and Minimisation in South East Queensland Drinking Water Page 58
73. Newkirk, D., Zhou, X., Neemann, J. (2006) Use of chlorine dioxide and ozone for control of disinfection by-products in water supplies.
74. Rice, R. G., Gomez-Taylor, M. (1986) Environmental health perspectives 69, 31-44. 75. Grosvenor, T. (1999) Water engineering and management. 76. Gebbie, P. (2006) An Operator's Guide to Water Treatement Coagulants. in 31st Annual QLD Water
Industry Workshop - Operations Skills, University of Central Queensland - Rockhampton. 77. Alvarez, M. B., Voorhees, J. R., and Rynning, M. A. (1999) Florida Water Resources Journal, 18-22. 78. Mitch, W. A., Sharp, J. O., Trussell, R. R., Valentine, R. L., Alvarez-Cohen, L., and Sedlak, D. L. (2003)
Environmental Engineering Science 20, 389-404. 79. Uyak, V., and Toroz, L. (2005) Environmental Technology 26, 261-266. 80. Uyak, V., Yavuz, S., Toroz, I., Ozaydin, S., and Genceli, E. A. (2007) Desalination 216, 334-344. 81. Rathbun, R. E. (1996) Science of the Total Environment 192, 111-118. 82. Westerhoff, P., Song, R., Amy, G., and Minear, R. (1998) Journal - American Water Works Association
90, 82-94. 83. Smith, P., Botica, C., Lange, R., and Tattersall, J. (2001) Design and Construction of the World's First
Large Scale MIEX Water Treatment Plant. in Proceedings of the 19th Federal AWA Convention Black and Veatch Australia and Water Corporation of Western Australia.
84. Slunjski, M., Cadee, K., and Tattersall, J. (2000) MIEX® Resin Water Treatment Process. in AquaTech, Amsterdam.
85. Park, S.-H., Wei, S., Mizaikoff, B., Taylor, A. E., Favero, C. d., and Huang, C.-H. (2009) Environmental Science and Technology 43, 1360-1366.
86. Ichihashi, K., Teranishi, K., and Ichimura, A. (1999) Water Research 33, 477-483. 87. Krasner, S. (2001) Chemistry and occurrence of disinfection by-products. Microbial Pathogen and
Disinfection By-Products in Drinking Water: Health Effects and Management of Risks (Craun, G., Hauchman FS, Robinson, and DE eds.), Washington, DC:ILSI Press. 197–210.
88. Matthess, G. (1982) Properties of Groundwater, John Wiley and Sons, New York. 89. Amy, G., Tan, L, Davis, MK. (1991) Water Research 25, 191-202. 90. Chen, W. J. W., C.P., and (1998) Journal of the American Water Works Association 90, 151-163. 91. Krasner, S. W., McGuire, M. J. Jacangelo, J. G. Patania, N. L. Reagan, K. M. Aieta, E. M. (1989) Journal
- American Water Works Association 81, 41-53. 92. McGuire, M., Meadow, RG. (1988) Journal of the American Water Works Association 80, 61-68. 93. Aiken, G. C., E. (1995) Journal - American Water Works Association 87, 36-45. 94. Krasner, S. W., Sclimenti, M. J., and Means, E. G. (1994) Journal of the American Water Works
Association, 86, 34-47.

Urban Water Security Research Alliance
www.urbanwateralliance.org.au