Dishwasher improvement at ASKOpublications.lib.chalmers.se/records/fulltext/124430.pdfDishwasher...
79
Dishwasher improvement at ASKO Developing a simplified test method to determine the influence of spray arm speed and pressure Master of Science Thesis in Product Development PETER TSOUKNIDAS XIANG ZHANG Department of Product and Production Development Division of Product Development CHALMERS UNIVERSITY OF TECHNOLOGY Göteborg, Sweden, 2010
Transcript of Dishwasher improvement at ASKOpublications.lib.chalmers.se/records/fulltext/124430.pdfDishwasher...

Dishwasher improvement at ASKO Developing a simplified test method to determine the
influence of spray arm speed and pressure
Master of Science Thesis in Product Development
PETER TSOUKNIDAS
XIANG ZHANG
Department of Product and Production Development
Division of Product Development
CHALMERS UNIVERSITY OF TECHNOLOGY
Göteborg, Sweden, 2010


MASTER OF SCIENCE THESIS IN PRODUCT DEVELOPMENT
DISHWASHER IMPROVEMENT AT ASKO
Developing a simplified test method to determine the
influence of spray arm speed and pressure
PETER TSOUKNIDAS
XIANG ZHANG
Department of Product and Production Development
Division of Product Development
CHALMERS UNIVERSITY OF TECHNOLOGY
Gothenburg, Sweden, 2010

Dishwasher improvement at ASKO
Developing a simplified test method to determine the influence of spray arm speed
and pressure
PETER T. TSOUKNIDAS
XIANG ZHANG
© PETER T. TSOUKNIDAS, XIANG ZHANG, 2010.
Examiner: Lars Almefelt, Chalmers University of Technology
Supervisor: Marcel Michaelis, Chalmers University of Technology
Industrial supervisor: Patrik Ivarsson, ASKO Appliances AB
Department of Product and Production Development
Chalmers University of Technology
SE-412 96 Göteborg
Sweden
Telephone + 46 (0)31-772 1000
Cover:
[Standardized test method used at ASKO to measure performance,
Page no. 12 for further reading in the report.]
Chalmers Reproservice
Göteborg, Sweden 2010

FOREWORD
This master’s thesis was conducted at the request of ASKO Appliances AB. The
expected outcome was considered to be of such value to the company that a
non-disclosure agreement was established to protect proprietary information.
Therefore, some information has been masked in the public version of the report. This
includes the exact experiment levels and values, which have been replaced by relative
terms in order for the reader to be able to follow the working process, as well as some
specific details regarding the construction of the test method.


ABSTRACT
This thesis report describes how a dishwasher was modified and used as a test rig
together with a new test method to find the relation between cleaning performance
and the rotation speed of the spray arms as well as the water pressure. All tests were
conducted using an ASKO D5900 dishwasher.
First off, the tests were planned in detail. To ensure that the tests would be reliable and
not overly redundant proper Design of Experiments methods were used. A simplified
test method was developed that would be easier and faster to use than the standard
tests currently used by dishwasher developers.
When the test rig was to be built several concepts for changing rotation speed and
water pressure were generated through brainstorming sessions and the use of
morphological matrices based on system design thinking. Kesselring matrices were
used during the final selection. The selected concepts were further developed to suit
an actual implementation in the dishwasher.
The test rig was built and used to implement the cleaning performance test. Several
pre-tests were conducted to evaluate the test method and data analysis method. The
first test was implemented and showed a trend of relation between cleaning
performance and rotation speed and pressure. Performance increased as the rotation
speed decreased and the pressure increased, but due to large deviations the results
were not found to be reliable. The deviation of the results was too large to be
conclusive by statistical standards. This was the reason for a second test
implementation where influencing variables like time and temperature were more
accurately controlled. Stable results were acquired during the second test, which
supported the results from the first test. The prototype was then tested using European
standard dishwasher test methods to determine the external validity of the test method
at ASKOs facilities in Vara. Sound tests were also conducted. Finally, some tests were
done at a higher pressure level using a stronger pump in order to see if the trend was
continuing at even higher pressure levels.
The test results showed that performance increases with higher water pressure and
lower rotation speed. The cost of higher pressure is an increasing sound level. The test
method proved to be reliable.
Keywords: dishwasher, improvement, pressure, rotation speed, DOE, test method.

TABLE OF CONTENTS
1 – INTRODUCTION ................................................................................................... 1
1.1 Background........................................................................................................ 1
1.2 Project purpose and goal ................................................................................ 1
1.3 Scope and limitations ....................................................................................... 2
2 – PRODUCT AND EXPERIMENT DEVELOPMENT ............................................. 3
2.1 Design of Experiments ..................................................................................... 3
2.1.1 Planning the experiment ............................................................................... 3
2.1.2 Validity .......................................................................................................... 4
2.1.3 Regarding the design selection ..................................................................... 5
2.2 Product Development methods ...................................................................... 7
2.2.1 System design ............................................................................................... 7
2.2.2 Product development procedure ................................................................... 8
2.2.3 Morphological matrix ................................................................................... 9
2.2.4 Brainstorming ............................................................................................... 9
2.2.5 Kesselring matrix ........................................................................................ 10
3 – TEST RIG AND EXPERIMENT DEVELOPMENT ............................................ 11
3.1 Designing the experiment.............................................................................. 11
3.2 Development of Simplified test method ...................................................... 12
3.2.1 Design parameters ....................................................................................... 13
3.3 Development of test rig .................................................................................. 19
3.3.1 Development procedure .............................................................................. 19
3.3.2 Rotation speed actuator ............................................................................... 21
3.3.3 Rotation speed sensor ................................................................................. 27
3.3.4 Water pressure actuator ............................................................................... 30
3.3.5 Water pressure sensor .................................................................................. 33
3.4 Test environment documentation ................................................................. 36
3.5 Experiment Execution .................................................................................... 38
4 – INTERMEDIATE RESULTS ................................................................................ 39
4.1 Performance .................................................................................................... 39
4.2 Sound level tests ............................................................................................ 41

4.3 Energy consumption ...................................................................................... 41
5 – FURTHER IMPROVED EXPERIMENT ............................................................. 43
5.1 Research for new experiment ....................................................................... 44
5.1.1 Test of new plates ........................................................................................ 44
5.1.2 Test of old and new marker ......................................................................... 44
5.1.3 Stabilizing time and temperature ................................................................ 45
5.1.4 New pressure measurements ....................................................................... 45
5.1.5 New Experiment Execution ........................................................................ 45
5.2 Cleaning performance results ....................................................................... 46
5.3 Validation tests at ASKO ................................................................................ 48
5.4 Sound tests at ASKO ..................................................................................... 49
5.5 High pressure tests ........................................................................................ 51
6 - DISCUSSION ......................................................................................................... 53
6.1 The simplified test method ............................................................................ 53
6.2 Design of Experiments ................................................................................... 54
6.3 Regarding the test rig ..................................................................................... 54
6.4 Results from the first experiment ................................................................. 54
6.5 Results from the improved experiment ....................................................... 55
7 - CONCLUSIONS .................................................................................................... 57
REFERENCES ............................................................................................................ 58
APPENDIX .................................................................................................................. 60

TABLE OF FIGURES
Figure 1.1: Factors influencing dishwasher performance 1
Figure 2.1: Example of central composite designs 6
Figure 2.2: Example of response surface plot 6
Figure 2.3: Example of response surface plotted as contour lines 7
Figure 2.4: Basic system design workflow according to Stevens et al. 8
Figure 2.5: Product development procedure according to Ulrich & Eppinger 8
Figure 2.6: Example of morphological matrix 9
Figure 2.7: Example of Kesselring matrix 10
Figure 3.1: Preliminary levels of experiment 12
Figure 3.2: Painting patterns tested on plates 14
Figure 3.3: Final painting pattern 15
Figure 3.4: Painting of test plates 15
Figure 3.5: Plate placement in lower and upper baskets 16
Figure 3.6: Program flowchart 17
Figure 3.7: Indicator plate before and after threshold filter was applied 19
Figure 3.8: Description of analysis method 19
Figure 3.9: Concept Frictioner 21
Figure 3.10: Concept heavyArm 22
Figure 3.11: Concept Turbine 22
Figure 3.12: Concept ExMotor 22
Figure 3.13: Concept InMotor 22
Figure 3.14: Concept Turbine 23
Figure 3.15: Concept Internal axis version 1 24
Figure 3.16: Concept external axis 24
Figure 3.17: Concept Internal axis version 2 24
Figure 3.18: Upper bearing holder and motor holder 25
Figure 3.19: Lower bearing holder 25
Figure 3.20: Timing belt and pulleys mounted in machine 26
Figure 3.21: Concept click-Counter 27
Figure 3.22: Concept Bike computer 27
Figure 3.23: Concept Listen 28
Figure 3.24: Concept Light 28
Figure 3.25: Concept Bike Computer 29
Figure 3.26: Bike computer mounted 30
Figure 3.27: Concept Restrictor 31
Figure 3.28: Concept Holy 31
Figure 3.29: Concept PowerMotor 31
Figure 3.30: Concept Restrictor 32
Figure 3.31: Different temporary pressure sensor constructions 33
Figure 3.32: The fourth working water pressure sensor 33
Figure 3.33: Results from preliminary water pressure tests 34
Figure 3.34: New experiment levels 35

Figure 3.35: Pressure measurements 35
Figure 3.36: Spray arm holes used for pressure tests 36
Figure 3.37: Sensor rig circuit 36
Figure 3.38: Sensor rig 37
Figure 3.39: Sound meter placement 38
Figure 4.1: Performance scores of first experiment 39
Figure 4.2: Response surface plot of results from the first experiment 40
Figure 4.3: Response surface contour plot of results from the first experiment 40
Figure 4.4: Results from sound test at Chalmers laboratory 41
Figure 4.5: Power usage contra input water temperature 42
Figure 5.1: New experiment levels 45
Figure 5.2: Performance scores of improved experiment 46
Figure 5.3: Response surface plot of final results 47
Figure 5.4: Contour plot of final cleaning performance results 48
Figure 5.5: Standardized tests at ASKO 48
Figure 5.6: Sound test setup at ASKO 50
Figure 5.7: Results of sound tests 51
Figure 5.8: Results of higher pressure test 52
Figure 6.1: Contour plot of performance level (red) and sound level (blue) 55
Figure 6.2: Suggestion for lower sound level 56
Figure 6.3: Suggestion for better performance 56
INDEX OF TABLES
Table 3.1: Substances tested for usability in simplified test 14
Table 3.2: Camera specifications 18
Table 3.3: Rotation actuator Kesselring matrix results 23
Table 3.4: Rotation sensor Kesselring matrix results 28
Table 3.5: Water pressure actuator Kesselring matrix results 31
Table 4.1: Detailed results from first test 39
Table 5.1: Evaluation of possible sources of error 43
Table 5.2: Detailed performance results from improved experiment 47
Table 5.3: Results from standardized tests at ASKO 49
Table 5.4: Dishwasher sound level test – very low pressure level 50
Table 5.5: Dishwasher sound level test – low pressure level 50
Table 5.6: Dishwasher sound level test – middle pressure level 50
Table 5.7: Dishwasher sound level test– background noise test 51
Table 5.8: Results of higher pressure test 52

1
1 – INTRODUCTION
Dishwashers are used for cleaning dishes and other eating utensils in restaurants and
private residences. A dishwasher is a complex cleaning system that integrates many
components both mechanical and electrical. Dishwasher manufacturers are
continuously improving their products to satisfy consumer demands. Characteristics
that consumers find attractive in a dishwasher are high cleaning performance, low
sound level, short cleaning time and low energy consumption among others1.
1.1 Background
ASKO Appliances AB is a Swedish company located in Vara. They develop and
manufacture household appliances such as refrigerators, washing machine and
dishwashers of high quality and high performance. ASKO strives to be a leader in
dishwasher technology and they are constantly working on improving their products1.
A lot of effort is put into improving the washing performance. The main parameters
influencing the dishwasher performance are: use of detergents/chemicals, water
temperature, washing time and mechanical impact on the dishes1. The parameters and
their relative importance can be seen in Figure 1.1.
Figure 1.1: Factors influencing dishwasher performance
Keeping an environmental friendly profile has a high priority at ASKO. Decreasing
water and energy consumption is beneficial since it lowers the usage costs for the
customer and makes the product more environmental friendly.
1.2 Project purpose and goal
The cleaning performance is the most important competitive factor. One way of
influencing the performance is by making changes in the mechanical impact on the
dishes (as can be seen in Figure 1.1). The two main factors influencing the mechanical
impact on the dishes are the rotation speed of the spray arms and the water pressure in
the spray arms. Structured tests to determine how these factors influence the
performance have not been done at ASKO. The rule of thumb, generally adopted at the
company, is that higher pressure and lower rotation speed increase the performance.
1 Patrik Ivarsson, ASKO Appliances AB

2
ASKO would like to confirm their theories regarding these factors.
This project was to focus on exploring the effect of mechanical impact on dishes, more
specifically how the rotation speed and water pressure in the dishwasher spray arms
influence the washing performance. The two parameters are naturally coupled since the
spray arm is driven by the water pressure alone. The goal of the project was to explore
the interrelation between these parameters through testing. A simplified test method to
measure dishwasher performance was to be developed to be used at Chalmers while
conducting the tests. Methods for altering rotation speed and pressure were to be
developed and implemented. All variables that could have an influence on the washing
performance were to be documented. Sound measurements were to be made in order to
see how changes in pressure and speed would influence the overall sound level of the
machine. The results were to be such that they could be used at ASKO to improve their
products.
1.3 Scope and limitations
The experiment was limited to one specific dishwasher model, the ASKO D5900. The
focus was on improving the performance through mechanical impact on the dishes;
none of the other influencing factors seen in Figure 1.1 should be altered. The only
parameters that were to be altered were the spray arm rotation speed and the water
pressure. Sound level measurements were to be conducted within the limitations of the
laboratory environment.

3
2 – PRODUCT AND EXPERIMENT DEVELOPMENT
In the following, a description of development methods used to develop the test rig and
designing the experiment are provided.
2.1 Design of Experiments
This section gives a brief overview of the field of Design of Experiments (DOE). The
methods described can be used in experiments ranging from very simple to highly
complex.
2.1.1 Planning the experiment
In order to be reliable an experiment needs to be both well planned and well
documented. Good planning also saves time and resources. The basic theory when
designing an experiment is to follow these steps (Weber & Skillings, 2000):
Clarify the goal
Why is the experiment conducted? What is the phenomenon of interest? This needs to
be clearly defined before any further work can be done.
Select dependent variables
Dependent variables, or response variables, are the main variables of interest. These are
affected by the independent variables. The effect of the independent variables on the
dependent ones is what is studied in the experiment, so one could say that the dependent
variables are the 'result variables'.
Identify independent variables
Independent variables are all variables that affect the system and the dependent
variables. These need to be found and evaluated. One or more of these will be used to
induce an effect on the dependent variables. They are called the controlled variables.
The controlled variables are varied in such a manner as to enable studies of their effect
on the dependent variables.
Other variables must be evaluated as to decide if they are to be kept constant or, if their
influence on the dependent variables is insignificant enough to be disregarded, to be left
uncontrolled. In some cases it can be difficult to identify all independent variables.
Some might not be found when planning the experiment and thus be left uncontrolled.
This will affect the validity of the experiment negatively. It is important to continuously
document all variables in order to be able to determine unexpected influences and
identify sources of error during the analysis.
Some claim that there should be only one controlled independent variable so as to

4
isolate the effects of this as much as possible (Shuttleworth, 2008). On the one hand,
this makes it easier to determine the results, and simplifies the test procedure. On the
other hand, there might be interactions between independent variables that cannot be
found if they are studied separately in different experiments. A so-called factorial
experiment (see section 2.1.3 Factorial experiment) might then be preferable where an
arbitrary number of controlled independent variables are allowed (Wikipedia, Design of
Experiments). Isolating independent variables, thus missing the interaction between
them which occur in the actual process studied, can lead to lower external validity. The
decision of which variables to control, keep constant and leave uncontrolled is of
highest importance to the outcome of the experiment.
Set levels
Each independent variable should have predefined levels between which they are to be
varied. These are experiment-specific and should be derived from the experiment goal.
Test design
Selecting how the independent variables should be varied is also an important issue.
There are a lot of different methods that have been developed to optimize the testing to
get as good results as possible with as few tests as possible. Some of the most common
ones are presented in section 2.1.3.
The experiment can then be conducted and the result analyzed. The result of the
experiment is an indication or description of the causal link between the independent
and dependent variables.
2.1.2 Validity
It is important to address the question about experiment validity. Is the test efficiently
isolating the phenomenon studied? Is it a good representation of the real-life
phenomenon?
Validity is usually divided into internal and external validity. Internal validity is a
measurement of how well the experiment isolates the variables of interest and makes it
possible to determine cause and effect. External validity concerns how well the
experiment generalizes, i.e. if the test results correspond to the real-life phenomenon
(Shuttleworth, 2008). External validity should not be confused with ecological validity.
Ecological validity is a measurement for how well the experiment resembles the
real-life situation (Wikipedia, Ecological validity). Ecological validity is not
considered to affect the external or internal experiment validity.
When designing an experiment one wants a certain level of validity, but in many cases it
is difficult to get both high internal validity and high external validity. One might
increase the level of internal validity by keeping some independent variables constant
which are not controlled in real-life, but in doing so you decrease the external validity.
This is an effect the test designer should keep in mind when designing the experiment.

5
2.1.3 Regarding the design selection
When conducting an experiment the choice of design is important. One wants to do as
few tests as possible, but still get statistically reliable results. This section describes
some of the most common test setups.
Factorial experiment
A factorial experiment (also referred to as a full factorial experiment or fully-crossed
experiment (Wikipedia, Factorial experiment)) is an experiment of one or more
variables which vary in an equal number of steps (called levels) from a minimum to a
maximum. The tests are performed with every possible combination of these levels of
variables (Milton & Arnold, 2006). An experiment with four variables which each can
have two different values would be called a 24 factorial experiment. To complete this
experiment one would have to do 16 tests. The general form is LV, where L is the
number of levels and V the number of variables that are to be altered.
Fractional factorial design
Using a factorial design of an experiment often results in a very large number of
experiments. This might not be time- or cost-efficient. One method to handle this
problem is to use a fractional factorial design. The idea is to only conduct a part of all
experiments of a factorial experiment (Milton & Arnold, 2006). The experimenter
could choose which parts of the complete matrix of test combinations to perform based
on a priori knowledge, or reduce the number of variables by merging two or more
variables into one (Wikipedia, Fractional factorial experiment). The selection of which
variables to merge should be done with the importance of the different variables in
mind. Variables of high importance should not be merged (Milton & Arnold, 2006). A
factorial design of, for example, 27 can by this method be reduced to, for instance, 2
5,
thus reducing the number of tests from 128 to 32.
When using a fractional factorial design, there is a risk of the effects of variables
becoming indistinguishable from one another if the variable selection is not done
properly (Milton & Arnold, 2006).
Central composite design
Central composite design can be used instead of a full factorial design. The difference is
the placement of testing points, as can be seen in Figure 2.1, where three levels are
used. Figure 2.1 a, b and c describe different placement of the testing points around the
variable span of interest. This design method is beneficial since it reduces the number
of variable combination testing points (Wikipedia, Central composite design). In the
case of three levels it reduces the number of points from 9 to 8 (compared to a full
factorial design).

6
Figure 2.1: Example of central composite designs
Response surface
A response surface is a graphical way of presenting the response influenced by two or
more variables (Montgomery, 2005). In Figure 2.2 is an example of two variables and
their response plotted as a response surface.
Figure 2.2: Example of response surface plot
The plot can be used to find a maximum (or minimum) in a relatively quick way with
few experiments. The more levels used in the experiment, the more accurate the
response surface becomes. If too few levels are used, there is a risk of missing a local
minimum or maximum and thereby getting inaccurate results.
There is a mathematical method for finding the maximum (or minimum) which could
be used to reduce the number of experiments. The method is called the method of
steepest ascent (steepest descent) and is carried through by plotting the response for an
experiment of two variables, and then finding the direction of steepest ascent. The
limits for the experiment are then moved in that direction and the procedure is repeated.
This will eventually lead to a point where no direction can be determined, which will be
assumed to be the maximum (or minimum) (Montgomery, 2005). This method is
suitable for tests where one has very accurate response data.
Another way of presenting a response surface is as a contour plot (displayed in Figure

7
2.3). It is used to present a function or a curve based on two variables as a number of
lines at which the response is at an equal value level. These lines are called isolines
(Courant, Robbins & Stewart, 1996). Generally, there is a set particular value between
each contour line (Wikipedia, Contour line). That means if the lines are close together
the magnitude of the change is large: the variation is steep. Whereas a sparse line shows
that the change is slight.
Figure 2.3: Example of response surface plotted as contour lines
2.2 Product Development methods
In this section some methods for product development and decision support methods
that were used while developing the test method and test rig are described.
2.2.1 System design
System design starts with requirements definition and division into different
subsystems. The division into subsystems makes project workflow more practical,
efficient, flexible and secure. For each subsystem every component should be defined
that contains units, interfaces, time and cost. The design should follow top-down
hierarchy as shown in Figure 2.4 Thereby the independent interfaces can be tested
(Stevens et al., 1998).
All the components are integrated after they have passed the testing in the subsystem
integration process. This is an opposite design direction, as shown in Figure 2.4. All the
subsystem should be assembled together as a new system.

8
Figure 2.4: Basic system design workflow according to Stevens et al.
2.2.2 Product development procedure
When designing a new system, product development methodology should be
implemented. This section describes product development methodology as written by
Ulrich and Eppinger, 2008. Product development methods are commonly used tools for
concept development, system level design and components design. The process can be
seen in Figure 2.5.
Figure 2.5: Product development procedure according to Ulrich & Eppinger
Problems can be formulated by the experimenter or collected from customers and users
(Ulrich & Eppinger, 2008) (University of Leeds, Problem Identification).
The problems are then reformulated as target specifications which are to represent goals
and aspirations for the project of solutions for the problems defined. The target
specifications can be derived from the developers themselves, users or from
regulations.
The concept generation process begins with a set of needs and target specifications and
results in a set of concepts from which a final selection will be made. A good concept
generation leaves the team with confidence that the full space of alternatives has been
explored. In this phase, the use of morphological matrices and brainstorming, which are
based on external and internal searching, are helpful when generating the initial
concepts.
The next step is concept selection. In this phase the Kesselring matrix could be used to
evaluate the concepts. Some concepts might be combined together to generate a new
and improved concept. Finally, a winning concept is selected.
The target specifications will then be revised to become final specifications after a

9
product concept has been chosen.
2.2.3 Morphological matrix
In the product design process the morphological matrix is a very common design
method to hinge ideas when one has an glimpse of “what you wish to do” and “how you
might go about doing it” (Fargnoli, Rovida & Troisi, 2006). It can be used to combine
different part-solutions into a complete solution.
The form of a matrix is comprised by a single left-hand column and several right
columns. The left-hand column is used in listing the parameter essential to design as
shown in Figure 2.6. To the right of each element in the column is a row containing the
possible ways of achieving that particular parameter. Illustrations can be used in the
matrix to get direct impression.
Figure 2.6: Example of a morphological matrix
2.2.4 Brainstorming
Brainstorming is a popular creativity tool (Baiduzhidao, Brainstorming) that helps
designers generate creative solutions to a problem (Ulrich & Eppinger, 2008). It is
particularly useful when the designers want to develop new ways of looking at things.
In a brainstorming group, it helps designers to utilize the diverse experience of all group
members to solve the problem (Mindtools, Brainstorming).
Individual brainstorming can sometimes be more effective than brainstorming in a
group since it often results in ideas of better quality (Mindtools, Brainstorming).

10
2.2.5 Kesselring matrix
The Kesselring matrix is a design tool which connects each specification with different
concepts. The Kesselring matrix is applied to evaluate different concepts in a form. To
use the matrix for this purpose, designers have to carefully establish the specification
and assign the weight value in the left-hand column. To the right of each element in the
column is a row containing the weight value of specific concepts as, Figure 2.7 shows.
If every element has received its relevant weight value, the designer can get the final
scores by summing up all elements in the same column.
Figure 2.7: Example of Kesselring matrix

11
3 – TEST RIG AND EXPERIMENT DEVELOPMENT
The entire project was divided into subsystems and subtasks in order for it to be easier
to develop and find optimal solutions for each part. After system functional tests, the
new dishwasher system could be used in the dishwasher cleaning performance test. The
main subsystems and subtasks are:
Designing the experiment
Creating a simplified test method
Test rig construction
o Rotational speed actuator
o Rotational speed sensor
o Pressure actuator
o Pressure sensor
Test environment documentation
These subsystems and subtasks were developed independently but with the coming
integration in mind.
3.1 Designing the experiment
The goal of the experiment was to explore the influence of the rotation speed of the
spray-arms and the water pressure on the dishwasher cleaning performance. The
purpose was to answer the following question: Can a higher cleaning performance be
achieved by changing the water pressure or the spray-arm rotation speed?
The cleaning performance was selected to be the dependant variable. This was the
obvious choice considering the goal of the experiment. How this was measured is
described in section 3.2. The experiment goal also gives that the controlled independent
variables were to be the water pressure in the spray-arms, and the rotation speed of
these. It was decided that both variables should be controlled in the same experiment,
since it was thought that this would increase the external validity. All other independent
variables, such as temperature and humidity, were kept constant and closely monitored
(see Chapter 3.2 Development of simplified test method).
The levels of interest in the experiment were set, according to instructions from ASKO,
from low rotation speed to high rotation speed with very low pressure to very high
pressure. This is a span set around the original machine settings.
It was decided to use a modified form of factorial design with 3 levels as depicted in
Figure 3.1. (This was later changed, see 3.3.4 Water pressure actuator)

12
Figure 3.1: Preliminary levels of experiment
The tests were made in arbitrary order. The results were then analyzed using JMP
Statistical Discovery Software v. 8.0 (JMP) which automatically calculates accuracy in
different factor spans and presents the result in a 3D response surface plot.
The response surface steepest ascent method was not applicable in the experiment
because of the relatively low accuracy. It was decided that it was more important to get
a larger general picture of the interrelations of the rotational speed and pressure than
being able to pinpoint the exact maximum. It was also decided to do all testing points
since not enough dependable a priori knowledge was available to be able to exclude any
points (as in a fractional factorial design).
3.2 Development of Simplified test method
The standardized test methods used at ASKO (and at other appliances developers) to
measure the dishwasher cleaning performance are intricate and strictly defined.
Specified amounts of foodstuff are placed on different types of plates and glasses. They
are then subjected to heating and drying in microwave ovens before they are placed in
the dishwasher. The dishes are washed using a specific detergent and a specific
program, and are then examined and graded by an expert. Performing the planned
experiment using these methods requires more time and resources than what was
available for the master’s project. Therefore, a simplified test method was developed to
be used at the lab facility at Chalmers. The purpose of the simplified test method was to
save time and resources and still deliver an accurate and reliable test result. The test
method had to be able to detect changes in input and indicate this with notable changes
in output, but not so large changes so that the output becomes saturated.
A table of requirements was set up listing all the needs of a functional test in a
structured way. These were graded in order to verify which parameters were most

13
important. The entire target specification can be found in Appendix A. The target
specifications was reviewed and consulted several times during the development of the
simplified test method.
3.2.1 Design parameters
By dividing the simplified test method into its main components or functions the design
parameters available for alteration were revealed. A performance indicator that would
be able to reflect results of changing water pressure and rotational speed of the
cleansing arms was determined to be dependent on several parameters. Through
empirical studies and tests the influence of the different parameters on the final result
could be determined. Solutions for how to practically alter these parameters were then
acquired through research and brainstorming sessions. These were then put in a
morphological matrix in order to be able see the alternatives in a structured and easy
way and make a selection (see Appendix B). The final selections are presented below.
Indicator
The indicator is the object that is placed in the dishwasher with the soiling agent applied
to it. The spontaneous choice of indicator was glasses, dishes or other kitchenware,
which would have a high degree of ecological validity. Custom made indicators with
different shapes, materials and textures were considered as well. The simplicity and
high ecological validity of regular plates were the main reasons to why white plates
with a diameter of 25 cm were chosen. These are standard plates used in the
standardized tests at ASKO (Artzberg, European standard plates). They are easy to
come by, naturally fit in the dishwasher and provide an easy way of applying a soiling
agent as well as placing them in the machine in a consequent way. Both European
standard plates and Australian standard plates were tested, but the European proved to
have the right surface properties. Cutlery and other kitchenware of more complex forms
were disregarded to keep the test as simple as possible. Plates were thought to be a
satisfying representative for all kitchenware used in a dishwasher.
Soiling agent
The soiling agent is the substance placed on the indicator plate. It should be resistant
enough not to be removed completely in the washing process, but not as tough as not to
be removed at all. A lot of research in this project was made to find either food or
synthetic paint that would fit the requirements of the test. Table 3.1 displays the
different substances that were regarded and the factors influencing their applicability.
Through preliminary simplified washing tests and research the decision was made to
use paint from artistic markers, applied using the marker itself.

14
Table 3.1: Substances tested for usability in simplified test
Substance Reasoning Result
Egg + High ecological validity
- Difficult to apply and measure accurately
- Difficult to analyze
- Relatively costly to use in large quantities
- Not tough enough without treatment (heating)
Not selected
Balsamic
vinegar glace
+ High ecological validity
- Time-consuming to apply
- Difficult to analyze
Not selected
UV-pen + Quick and easy to apply
+ Easy to standardize
+ Relatively cheap
+ UV-light could be used to detect even the tiniest spots
- Not tough enough to withstand washing
- Low ecological validity
Not selected
Spray-paint + Quick to apply
+ Easy to standardize
+ Relatively cheap
- Too tough to get off during washing
- Difficult to apply
- Low ecological validity
Not selected
Permanent
markers
+ Quick and easy to apply
+ Easy to standardize
+ Relatively cheap
- Too tough to get off during washing
- Low ecological validity
Not selected
Artistic
markers
+ Quick and easy to apply
+ Easy to standardize
+ Relatively cheap
- Low ecological validity
Selected for tests
Another factor of interest is the application method. Given the decision of using
markers painting was seen to be the most obvious choice. The painting process was
made as standardized as possible. Templates were made to cover the plates while
painting. Some different patterns and sizes were tested, which can be seen in Figure 3.2.
The pattern depicted in Figure 3.2a. was tried on the small plates in the upper basket
and figure 3.2b. and 3.2c. were tested on the larger plates in the lower basket.
Figure 3.2: Painting patterns tested on plates

15
The final choice of pattern, a simple square, can be seen in Figure 3.3. 3.3a. depicts the
pattern for the large plates and 3.3b. for the small ones. This pattern was decided to be
the best choice since it would cover a larger area of the plate, making differences in the
surface less important. It would also be easier and faster to analyze the result using the
computer vision method (see Analysis method below).
Figure 3.3: Final painting pattern
The templates were made from thick building plastics and masking tape, as can be seen
in Figure 3.4.
During the initial tests it was noticed that variances in the plate surface influenced the
result a lot. Plates that were more worn were harder to clean than less worn ones.
Observations were also made of differences on the same plate. Therefore it was decided
to use the same area of the plates every time. To ensure that the same area was painted
every time permanent markings were made (see Figure 3.4) within which the indicator
paint was applied. The masking tape had to be replaced approximately every 10th
test
run since its adhesive ability decreased due to the repeated painting. The permanent
markings had to be repainted roughly every 8th
test run.
Figure 3.4: Painting of test plates
16
There is also the influence of the preparation method. The soiling agent could be
prepared for instance by drying, heating, burning or freezing (see morphological matrix
in Appendix B). This would affect the properties of different soling agents, especially
foodstuff2.
Using the markers, heating the paint using a hairdryer resulted in the paint being much
harder to remove. This method of regulating the adhesiveness of the paint was very
difficult to standardize, and was therefore rejected. Another method that would be
applicable was letting the paint dry for different amounts of time. Tests were made in
order to determine if the amount of time the paint was allowed to dry had an effect on
the result. Paint was allowed to dry for 10, 5, 2 and 1 minutes before the machine was
started. No differences in the result could be observed by visual inspection, but further
investigations were needed. A more structured test was done using the computer vision
analysis method (see Analysis method below) and the standard test setup (see Chapter
3.5 Experiment Execution). The plates were cleaned with detergent using the
Quickwash-program, then rinsed clean from detergent using the Quickwash-program
again, without detergent. The tests differed in the amount of time the paint was allowed
to dry. With 20 minutes drying time 83% of the paint was removed, and with no drying
time 92% was removed. Apparently, the waiting time was an important independent
variable, so this was kept constant throughout the experiment.
Dishwasher environment
When considering the dishwasher environment, ecological validity was thought to have
a substantial influence on the external validity. Placement, spray angles and such would
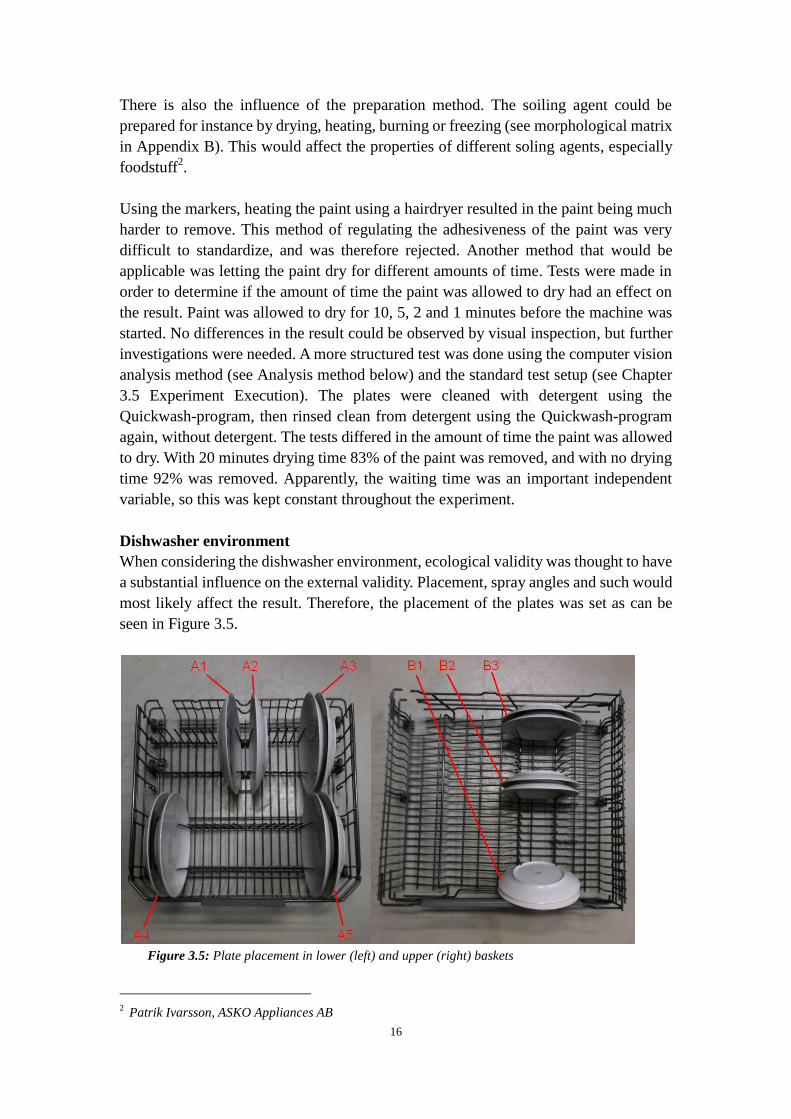
most likely affect the result. Therefore, the placement of the plates was set as can be
seen in Figure 3.5.
Figure 3.5: Plate placement in lower (left) and upper (right) baskets
2 Patrik Ivarsson, ASKO Appliances AB

17
It was decided to place plates A3, A4, A5, B1, B2 and B3 behind another plate to better
mimic the real life situation of a fully loaded dishwasher. The placement was not altered
during the experiment; all plates had their specific placement. The rest of the machine
was left empty. It was properly cleaned several times before the experiment
commenced. The filters were cleaned at a regular basis (once per day, approx. every
fifth test run).
The detergent used to clean the plates between each test run was Sun Professional
Maskindisk (Supplier: DiverseyLever). ASKO standard testing detergent (Ref.
detergent Type B, Batch: GSMB 177-280, 07.12.2009) was tested but it was not
capable of removing the paint.
Program
The program used during the experiment was the Quickwash program which takes
about 12 minutes to run. It first takes in water heating it up to 30 degrees C while
spraying the dishes. It then empties this water. After this it takes in water (without
heating it) and sprays the dishes for a couple of minutes and empties the water again.
This is done twice. (see flowchart in Figure 3.6)
Figure 3.6: Program flowchart
The Quickwash program time varies somewhat depending on differences in input water
temperature. This was considered to be a part of the inherit system behavior and to
contribute to a higher ecological validity, even though this would leave the time
variable uncontrolled.
Analysis method
Different methods for analyzing the result were tested. One method that was tested was
visual inspection by an analyst, where the analyst estimates how large a percentage of
the marked area was cleaned during the test. The indicator plate was inspected spot by

18
spot, where each of the 28 painted squares in the grid (as can be seen in Figure 3.2b.)
was graded between 0 and 1 in steps of 0.05. The grades for all squares were added and
then divided by 28 to acquire a relative score. After some initial tests it was apparent
that the grading could vary somewhat each time the analyst estimated an indicator plate.
The grading also varied depending on different analysts. The accuracy of the analysis
method was approximated to ± 10%.
To get better accuracy, tests were made with a computer analyzing the indicator plates.
This was done by photographing the plates with a digital camera from a set angle and in
a specific lighting, and by importing the data to a computer. A digital single-lens reflex
(DSLR) camera was used to take all photos of the plates (see Table 3.2). The cameras
capability was sufficient for the test. All camera settings were kept constant during the
tests. A tripod was used to hold the camera, keeping it stable and at the right distance,
which was approximately 1.5 meters between lens and plate surface.
Table 3.2: Camera specifications
Camera Model Canon 400D
Lens Model Sigma 24-70mm 1:2.8 EXDG
Program Manual
Focus AI focus 70mm
Shutter speed, aperture and ISO 1/40 second, F6.3, iso400
Distance between lens and plate surface 1.5 meter
The photos were imported to a computer and photo editing software (GIMP 2.6.8) was
then used to manually cut out the painted area. In order to find the edges of the painted
area they were marked with a permanent marker that was not removed during the test.
These permanent markings also guaranteed that the same area of the plate was used
every time, thus eliminating the problem with the surface of the plates influencing the
results (see Soiling agent).
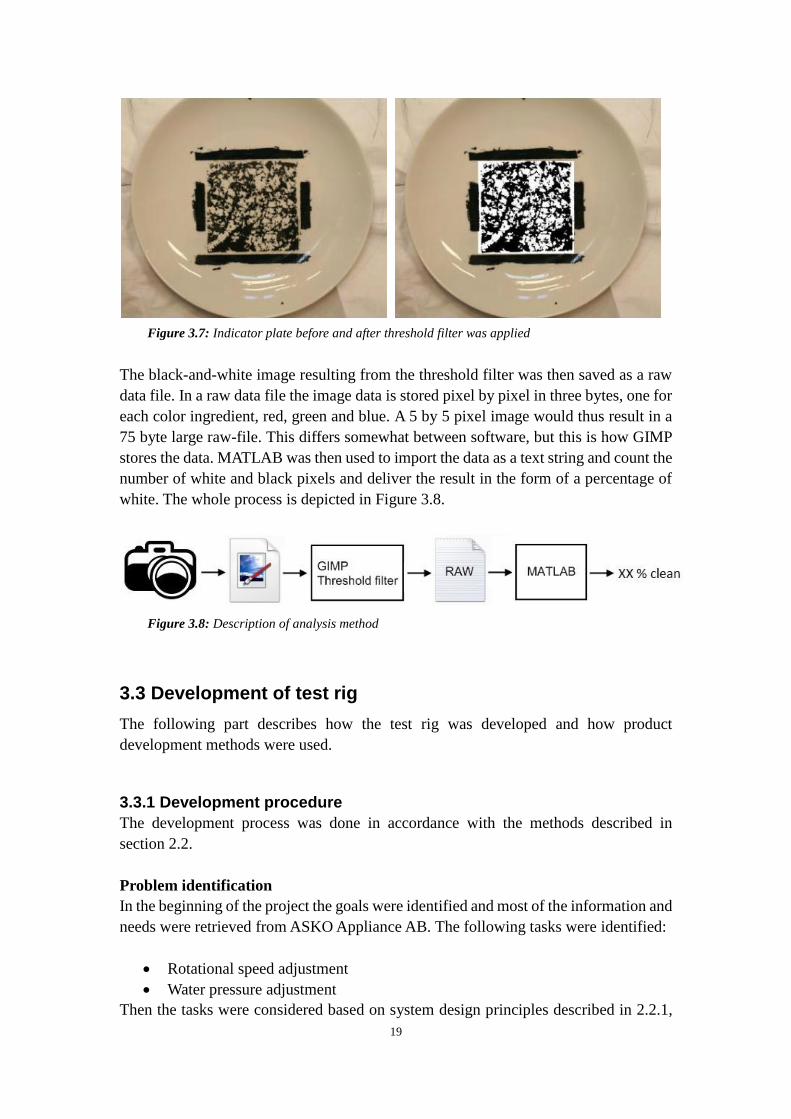
A threshold-filter was then applied to the cropped image (can be seen in Figure 3.7).
The filter sets the color to either black or white depending on the threshold level, pixel
by pixel. The threshold was set manually by visually inspecting the result and selecting
a best fit. These manual tasks were recognized as a source of inaccuracy. In order to
determine how much these influenced the result a series of tests were made. Two
analysts got a set of five images of plates which they were to analyze three times each
and then compare the results. The average standard deviation was less than 1 %.
19
Figure 3.7: Indicator plate before and after threshold filter was applied
The black-and-white image resulting from the threshold filter was then saved as a raw
data file. In a raw data file the image data is stored pixel by pixel in three bytes, one for
each color ingredient, red, green and blue. A 5 by 5 pixel image would thus result in a
75 byte large raw-file. This differs somewhat between software, but this is how GIMP
stores the data. MATLAB was then used to import the data as a text string and count the
number of white and black pixels and deliver the result in the form of a percentage of
white. The whole process is depicted in Figure 3.8.
Figure 3.8: Description of analysis method
3.3 Development of test rig
The following part describes how the test rig was developed and how product
development methods were used.
3.3.1 Development procedure
The development process was done in accordance with the methods described in
section 2.2.
Problem identification
In the beginning of the project the goals were identified and most of the information and
needs were retrieved from ASKO Appliance AB. The following tasks were identified:
Rotational speed adjustment
Water pressure adjustment
Then the tasks were considered based on system design principles described in 2.2.1,
20
thus the tasks were divided into subtasks or subsystems.
Rotation speed actuator
Rotation speed sensor
Water pressure actuator
Water pressure sensor
From the literature study and company visits, important values were derived: less
energy consumption, little water usage, low sound level and so forth. Furthermore,
there were some other important values that should be dealt with during the whole
project, such as safety.
In addition, the project workflow should be considered as well to determine every step
in the project to avoid extra steps or missing some steps, the workflow is easy to follow
and useful for estimating the workload.
Target requirement specifications
Most of the requirements for the adjustment of water pressure and rotation speed were
from ASKO and other safety requirements from Chalmers. But whatever the origin
they were set in a way so that they were possible to validate and verify.
In order to achieve the goal, some parameters of dishwasher which had the largest
potential in adjusting pressure and rotation speed within the timeframe and did not
hinder other functions, were put in focus. Some of the parameters of dishwasher were
excluded early, because of their strong effect on whole washing system or other
problems.
Concept generation and screening
The brainstorming and morphological matrix methods were used when generating the
initial concepts (see Appendix B). To be able to select the best concepts a Kesselring
matrix was used. The requirements were listed and rated on a scale from 1 to 10 on their
relative importance to the overall goal, from trivial factors to highly prioritized factors.
Concepts were then rated on how they fulfilled the requirements, also on a scale from 1
to 10. This rating was based on engineering analysis and logical evaluation. The two
best concepts for each subsystem were selected for further development. Some of the
key requirements were explored further for each concept. For details on the selection
see Appendix C.
Selection of final concept
The final selection was made based on further studies of the primarily chosen concepts.
This was done by re-looping the Kesselring matrix and adjusting the values according
to the latest findings. Integrating with ASKO’s requirements on the solution, the final
requirement specifications were accomplished which included weighting depending on
their significance. The different requirements have to the greatest possible extent been

21
connected to metrics.
Final specifications and system construction
The final specifications were made specific enough to be usable during the part
selection and detailed construction. In the final stage the prototype was built based on
the final specifications.
3.3.2 Rotation speed actuator
Established target specification for rotation actuator:
FR1 Possible to achieve target value
FR2 Quick to prepare for use
FR3 Measure velocity with high accuracy
FR4 Not affect other parameter
FR5 Affect other function as little as possible
FR6 Robust enough to withstand washing procedure
FR7 Durable
FR8 Be able to work in different temperatures
FR9 Be water proof
FR10 Physically possible to produce prototype within time frame
FR11 Low cost
FR12 Be safe to use
D1 Should be easy to set the value
D2 Modify the dishwasher as little as possible
Initial concepts
Several design parameters were set in the left columns in the morphological matrix,
such as adjustment system and influence method. Then, more possible methods were
filled in the matrix form. All the details are shown in Appendix B. The following
concepts were generated:
Concept: Frictioner
Friction is created between the
rotating spray-arm and some
part attached to the machine
base, which causes the rotation
to decrease. The friction could
be regulated by increasing the
force applied to the spray-arm.
Concept: HeavyArm
Figure 3.9: Concept Frictioner

22
Weights are added to the tips of the spray-arm in order to make it rotate slower. The
weights can be varied to attain different speeds.
Figure 3.10: Concept HeavyArm
Concept: Turbine
Air-pressure is used in a completely separated and closed system to propel turbine-like
propellers that are directly connected to the spray-arms. The pressure in the system can
be regulated by using a potentiometer.
Figure 3.11: Concept Turbine
Concept: ExMotor
An external electrical motor is used to
regulate the speed. The motor is connected
to an axis inside or outside the machine
which is connected to the spray-arms
through timing belts. The motor is regulated
either by using a potentiometer or pulse
width modulation through a microcontroller.
Concept: InMotor
A waterproof motor is placed in the
machine in direct connection to the
spray-arm axis. A hole is cut out in the
bottom in order for it to fit. The motor is
regulated by using a potentiometer.
Concept selection
A Kesselring matrix was used in selecting the concepts for further development; all
details are shown in Appendix C. The winning concepts were the “External motor”
and “Turbine” as can be seen in Table 3.3. Although the “Heavy arm” concept got a
Figure 3.12: Concept ExMotor
Figure 3.13: Concept InMotor

23
higher score, it was disregarded due to its inability to increase the rotation speed.
Table 3.3: Rotation actuator Kesselring matrix results
Concepts Frictioner Ex-motor In-Motor Turbine Heavy arm
Scores 564 715 603 614 643
Concept: Turbine
Air-pressure is used in a completely
separated and closed system to propel
turbine-like propellers that are directly
connected to the spray-arms. The system is
connected to an existing air pressure
source and a mechanical valve is added to
be able to regulate the air flow. Positive air
flow would make the blades rotate faster
and negative air flow would slow them
down. The positive or negative air flow
could be controlled by switching inlet.
Construction time: This system would be quite difficult to construct and take several
days in the prototype lab.
Modification level: A lot of space would be required by the air system, which could
influence the spray pattern in the machine. It might also lead to larger modifications in
the basket system and the indicator plate placement.
Robustness: It is hard to estimate how such a complex system would hold out during the
experiment.
Usability: It would probably be quite easy to set the desired levels of speed, and all
desired levels could be set.
Cost: A rough estimation of the cost of the parts that could not be acquired in-house is
500 SEK.
Concept: ExMotor
The concept has been divided into three versions of the original idea, depending on the
different placement of the axis. The basic idea is still the same with an external motor
that can be used to set the wanted speed. The motor is controlled using a potentiometer
to regulate the effect of the motor.
Figure 3.14: Concept Turbine

24
Figure 3.15: Concept Internal axis version 1
Figure 3.16: Concept external axis Figure 3.17: Concept Internal axis version 2
Construction time: Approximately 3 days
Modification level: It would probably not influence the performance of the dishwasher.
It would lead to some modifications of the basket system.
Robustness: If it is made from stainless components it would be robust.
Usability: It would probably be quite easy to set the desired levels of speed, and all
desired levels could be set.
Cost: Motor ~300 SEK + timing belt and pulleys ~600 SEK + bearings ~150
= ~1050 SEK
Final selection
The “Internal axis version 2” was selected for the rotation actuator subsystem. This

25
was considered the best mainly because of its less complex construction and
robustness. A hole in the top of the machine would leak less water than a hole in the
machine wall. It would also be easier to connect the motor to the axis as specified in
the “Internal axis version 2” compared to the other two “ExMotor” derived concepts.
Detailed construction - ExMotor
One drawback of the construction was that both spray arms would be rotated in the
same direction. This was accepted as a loss of ecological validity in favor of the
simplicity of the construction.
A hole was drilled into the top of the dishwasher in the back left corner. A
construction made of wood and a 1 mm steel plate (as can be seen in Figure 3.20) was
fastened on top of the hole. This allowed for an easy connection between the motor
and the axis. A steel axis with a diameter of 8 mm was used, which was supported by
two bearings, one in the upper wooden holder (Figure 3.18) and one in the lower
wooden holder (Figure 3.19). The lower wooden holder was fastened to the back of
the machine using a bent steel plate.
Figure 3.18: Upper bearing holder and motor holder Figure 3.19: Lower bearing holder
The bearings had an inner diameter of 8 mm and an outer diameter of 22 mm. They
were slightly lowered into tapered holes in the wooden holders to keep in place. The
bearings took up the radial loads. The axial load caused by the weight of the axis and
the timing belt pulleys was handled by the motor, which had a maximum limit of 5 N
of axial load.
Two T5/18-2 (Pitch: 5mm, Number of teeth: 18, Flanges: 2) timing belt pulleys were
fastened on the axis at the height of the spray arms. These were connected to larger
T5/36-2 pulleys, which had been fastened on the spray arms, by a 5 mm wide timing
belt. This gave the pulley system a gear ratio of 2:1. The pulleys were made 10 mm
thick in order to fit around the spray arm holders without hindering the rotation. The
construction can be seen in Figure 3.20.

26
Figure 3.20: Timing belt and pulleys mounted in machine
When selecting a motor it was decided that a DC-motor was the best choice since the
rotation speed could then easily be regulated by changing the input voltage. To select
a motor that could be regulated within the desired rotation speed range with sufficient
torque, some rough calculations were made. The motor would have to be strong
enough to rotate the spray arms even at the highest water pressure level. The torque
induced by the water pressure was measured using a force gauge. This was fastened
by a thread at a distance of 0.2 meter from the spray arm center. The gauge indicated
that the force was less than 2 N on both the upper and lower spray arm. This gives that
the torque needed to counter both spray arms would be 2 * 2 * 0.2 = 0.8 Nm. Since
the gear ratio was 2:1 only half the torque would be needed, 0.4 Nm. This was
considered the maximum torque needed, not including extra torque needed to counter
the friction.
The spray arm rotation speed needed was masked rpm. Since the gear ration between
the timing belt pulleys was 2:1 the motor would have to be able to rotate at least twice
the highest speed, i.e. masked rpm.
The motor selected was a Micro Motors s.r.l. model HL149, with a maximum torque
of 0.15 Nm, a gear ratio of 43.3:1 and a rotation speed of 55 rpm at 24 V DC.
The motor was fitted atop of the axis. This can be seen in Figure 3.20.
27
3.3.3 Rotation speed sensor
Established target specification for rotation sensor:
FR1 Be able to measure rotational speed
FR2 Quick to prepare for use
FR3 Measure velocity with high accuracy
FR4 Not affect other parameter
FR5 Affect other function as little as possible
FR6 Robust enough to withstand washing procedure
FR7 Durable
FR8 Be able to work in different temperatures
FR9 Be water proof
FR10 Physically possible to produce prototype within time frame
FR11 Low cost
FR12 Be safe to use
FR13 Easy to replace
D1 Should be easy to get the value
D2 Modify the dishwasher as little as possible
Initial concepts:
Several design parameters were set in the left columns in the morphological matrix,
such as measuring method, placement and so forth. Then more possible methods were
filled in the matrix form. All the details are shown in Appendix B. Finally some
concepts have been generated as shown below:
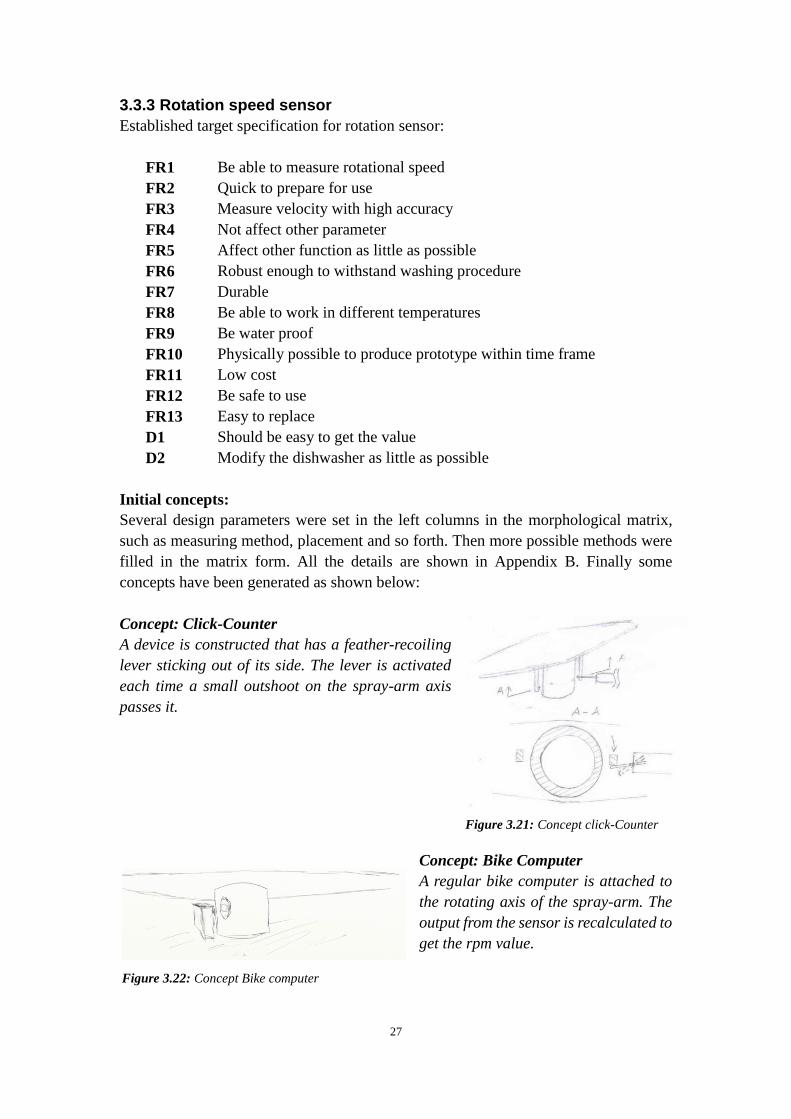
Concept: Click-Counter
A device is constructed that has a feather-recoiling
lever sticking out of its side. The lever is activated
each time a small outshoot on the spray-arm axis
passes it.
Concept: Bike Computer
A regular bike computer is attached to
the rotating axis of the spray-arm. The
output from the sensor is recalculated to
get the rpm value.
Figure 3.21: Concept click-Counter
Figure 3.22: Concept Bike computer

28
Concept: Listen
A person is trained to hear the rotation of the
washer arm while the machine is running. A
timer is used and the number of laps is
counted during a specific time-span.
Concept: Lookie lookie
A replacement hatch is made from plexiglas through which a person can see the spray
arms rotate and count the number of laps during a specific time-span.
Concept: Light
A black line is painted along one side of
the spray-arm axis. A light-sensitive
sensor is used to detect if the painted
section is placed in front of it. A
microcontroller is used to acquire data
from the sensor and count the number
of laps.
Concept selection
Kesselring matrix was used to select the concepts for further development, all details
can be found in Appendix C. As can be seen in Table 3.4 the concepts “Bike
computer” and “Listen” were selected.
Table 3.4: Rotation sensor Kesselring matrix results
Concepts Click
counter
Bike
computer
Listen Light sensor Lookie
Scores 657 822 907 730 814
Concept: Listen
By placing the ear against the machine you can hear the water splashing on the walls of
the dishwasher and count the laps. A watch is used to time a set number of laps. The
rotation speed can then be calculated using the following formula:
𝜔 = 𝑛
𝑡
ω: Rotation speed of spray arm [rpm]
n: Number of laps
t: Time [minutes]
Figure 3.23: Concept Listen
Figure 3.24: Concept Light

29
Construction time: No construction time.
Modification level: No modification needed.
Robustness: Quite robust.
Usability: Very simple to use, but it might take a few minutes to set the desired speed
level.
Cost: 0 SEK
Concept: Bike Computer
A regular wireless bike computer is
used to transmit the speed to a
receiver outside the dishwasher. The
value indicated by the computer
could be multiplied with a constant
to obtain the actual rotation speed.
Construction time: This device
could be set up in less than an hour.
Modification level: The sensor could be placed so that it doesn’t influence the system at
all.
Robustness: The device was made to withstand outdoor use, so it should be quite
robust.
Usability: Very simple to use.
Cost: ~150 SEK
Final selection
The “Bike computer” concept was selected as the best solution for the rotation speed
sensor, mainly because it would be much easier and quicker to acquire the
measurement.
Detailed construction – Bike Computer
A bike computer (Velleman Model: BC15S) was used to measure the rotation speed. It
was attached to the axis on the outside of the machine, thus elimination the risk of
getting damaged by water, as can be seen in Figure 3.26.
Figure 3.25: Concept Bike Computer

30
Figure 3.26: Bike computer mounted
3.3.4 Water pressure actuator
Established target specification for water pressure actuator:
FR1 Possible to achieve target value
FR2 Quick to prepare for use
FR3 Measure velocity with high accuracy
FR4 Not affect other parameter
FR5 Affect other functions as little as possible
FR6 Robust enough to withstand washing procedure
FR7 Durable
FR8 Be able to work in different temperatures
FR9 Be water proof
FR10 Physically possible to produce prototype within time frame
FR11 Low cost
FR12 Be safe to use
D1 Should be easy to set the value
D2 Modify the dishwasher as little as possible
Initial concepts:
Several design parameters were set in the left columns in the morphological matrix,
such as power source and data communication method. Then more possible methods
were filled in the matrix form. All the details are shown in Appendix B. Some
concepts have been generated as follows:
Concept: PowerMotor
To be able to increase the water pressure the motor is replaced with a more powerful
one. Due to its size it may not fit underneath the dishwasher and could be placed behind
instead.

31
Concept: Restrictor
The water is partly blocked by a metal restrictor
plate with a small hole in it. By varying the size
of the hole, different pressures can be acquired.
Concept: ArmVolume
Different sets of sprayer arms are constructed with different inner volume. The volume
is regulated to get different pressure.
Concept: Holy
Holes are made in the pipe that leads to the
spray arm in order to decrease the
pressure.
Concepts selection
A Kesselring matrix was used to select the concepts for further development; all
details are shown in Appendix C. The “power motor” and the “Restrictor” were
selected, as can be seen in Table 3.5.
Table 3.5: Water pressure actuator Kesselring matrix results
Concepts Power motor Restrictor Arm volume Holy
Scores 755 709 595 566
Concept: PowerMotor
The original motor should be replaced with a more
powerful one which can be controlled to run at different
power levels.
Construction time: Help would probably be needed from
specialists at ASKO which would take some time to
organize and would be costly for ASKO.
Modification level: The larger motor would not fit in the
regular compartment and would have to be placed
behind the dishwasher. This could possibly increase the sound level of the machine.
Robustness: Since the motor is a standard part made specifically for a dishwasher it
Figure 3.27: Concept Restrictor
Figure 3.28: Concept Holy
Figure 3.29: Concept PowerMotor

32
would probably be quite robust.
Usability: It would be easy to regulate the desired pressure level, and it could be set to
any level in the span of interest.
Cost: Parts could be obtained from ASKO. No external costs.
Concept: Restrictor
Thin circular plates with different sized holes should be
manufactured. These are to be placed between the spray arm
water input and the water pipe. The hole partly shuts off the
water supply, thus decreasing the pressure in the water exiting
the spray arm.
Construction time: These could easily be constructed from
metal or plastic in a day or two.
Modification level: It is a bit uncertain how the change in
pressure will affect the rest of the machine. It might cause the
motor to run slower. Apart from that the influence on the rest
of the system would be minimal.
Robustness: The wear on the restrictors would be minimal, they would be very robust.
Usability: It would take some time to get them set at the right pressure level. Once this
is done they will be very simple to change and use. It is not certain that all pressure
levels could be attained.
Cost: Plastic or metal plates could be obtained for free from Chalmers.
Final selection
For the pressure actuator subsystem the Restrictor concept was selected due to its
simplicity and low influence on the overall sound level.
Detailed construction - Restrictor
The restrictor plates were constructed using 2 mm thick plastic that was cut into
circular plates that would fit inside the spray arm holder (diameter of 21 mm).
Different sized holes were drilled in the center of the plates. Different sizes were
tested and finally 7.1 mm and 8.2 mm holes were used which gave a pressure level of
“very low” and “low” respectively in the lower spray arm. Due to the extra space
required by the plates a thin layer had to be rasped off of the bottom of the spray arm
holder. Tests were made with very thin aluminum plates, but they were too weak to
withstand the pressure without bending.
Figure 3.30: Concept
Restrictor

33
3.3.5 Water pressure sensor
It was thought that the easiest and most accurate way of measuring the pressure would
be to use a standard pressure meter. Therefore, no concepts were developed for a
pressure sensor.
A pressure sensor was required to be able to set the spray arm pressure at the desired
levels. A temporary sensor was constructed in order to verify the initial theory
supporting the Restrictor concept. Using this temporary sensor a relative measurement
could be attained, which would then be supported by a more accurate pressure sensor
measurement later on. The reason why this temporary sensor was made was that
constructing and fine-tuning the restrictors would take some time, and the more
precise pressure sensor could not be borrowed for that amount of time. The temporary
sensor was constructed using an air pressure sensor placed in a chamber separated
from the water by a membrane. A 500 ml PET-bottle was used as pressure cell and
tough plastic bags as membrane. The construction was sealed using glue. See Figure
3.32. Several models were constructed before a usable one was obtained. See Figure
3.31.
Figure 3.31: Different temporary pressure sensor constructions
Figure 3.32: The fourth working water pressure sensor

34
First sensor (Figure 3.31a.)
Pressure cell volume: 0.5*10-3
m3
Membrane area: 8.5*10-3
m2
Sensor: ASKO DW20
Results: Not usable. The signal was saturated due to a too large membrane. It could be
improved by using a smaller membrane or a pressure sensor with a larger measuring
span.
Second sensor (Figure 3.31b.)
Pressure cell volume: 0.58*10-3
m3
Membrane area: 0.35*10-3
m2
Sensor: ASKO DW20
Results: Not usable. Too small changes in signal due to a too small membrane. It
could be improved by using a larger membrane or a more sensitive sensor.
Third sensor (Figure 3.31c.)
Pressure cell volume: 0.4*10-3
m3
Membrane area: 2.8*10-3
m2
Sensor: ASKO DW20
Results: Not usable. The sensor values showed signs of drifting and did not return to a
zero level between tests. This was probably caused by a leak or a damaged sensor.
Fourth sensor (Figure 3.31d.)
Pressure cell volume: 0.5*10-3
m3
Membrane area: 8.5*10-3
m2
Sensor: ELFA pressure sensor SPD-015-G-2
Results: The results can be seen in Figure 3.33.
The initial tests resulted in an implied relationship between the hole diameter and the
pressure as can be seen in Figure 3.33.
Figure 3.33: Results from preliminary water pressure tests

35
It was detected that the restrictors could not be used to increase the pressure, only to
decrease it. This meant that either the experiment boundaries had to be changed or
another concept would have to be selected for development. Reasoning that the
Restrictor concept would be easier and faster to implement and that the competing
concept, using a more powerful motor, would make sound tests unusable (which were
thought to be very important at ASKO), it was decided to change the experiment
boundaries. The new pressure levels were set as in Figure 3.34.
Figure 3.34: New experiment levels
Some different restrictors were prepared for the
more accurate pressure test. The pressure sensor
used was an Elite Digital Manometer HM3500,
DLG300 (serial no. 1020203) used at ASKO
(see Figure 3.35). It was set to measure the 10
seconds average pressure in kPa. The standard
deviation of the readings was 0.21 kPa.
The sensor was placed over the holes indicated
in Figure 3.36. A simplification was made; the
same size of restrictors was used in the upper
and lower spray arm. This meant that the
pressure levels for the upper spray arm would
not be evenly distributed across the pressure
span. It would be very difficult and time-consuming to match the restrictors to get the
exact wanted levels in both the upper and lower spray arms, so this simplification was
accepted considering the time gain. The results from the upper test could thus not be
evaluated in the same way as for the lower one.
The two extra spray holes in the bottom of the machine that provide extra water on the
dishes from below were covered using glue.
Figure 3.35: Pressure measurements

36
Figure 3.36: Spray arm holes used for pressure tests
3.4 Test environment documentation
Independent variables which were to be kept constant were strictly monitored and
documented.
Temperature
The room temperature and in-machine air temperature were measured, but could not
be kept constant. This was not considered a problem since it varied very little and was
thought to have little influence on the dependent variable.
Input water temperature at the water tap was also measured. This varied somewhat
during the day due to variations in water usage in the building. The influence of the
water temperature on the machine was considered to have minor effects on the results,
but it would affect the washing-time which in turns would affect the results.
Humidity
Room and in-machine humidity was measured and documented. These variables
could not be controlled but were quite stable during the tests.
The temperature and humidity measurements were done using a simple measuring
station built as depicted in Figure 3.37. This allowed for quick and accurate reading of
sensor values.
Figure 3.37: Sensor rig circuit

37
The circuit is depicting three National Semiconductor temperature sensors model
LM35 TO-92 (accuracy ±0.5°C) and two Sencera humidity sensors model H25K5A
(accuracy ±5%RH). A photo of the rig can be seen in Figure 3.38.
Figure 3.38: Sensor rig
Water properties
Water properties, such as chemical composition and water hardness, could not be
controlled. This was recognized as a source of inaccuracy. The water hardness was
considered to be at a fairly constant level throughout the experiment, and was
measured to 3 ºdH.
Time
Due to the construction of the dishwasher program washing time varied depending on
the input water temperature. Colder input water resulted in the machine taking longer
time to heat it to the set level, thus prolonging the washing procedure. The time was
measured using the machines built-in time indicator. The small changes in washing
time were considered to have a minor effect on the test results. This was considered an
acceptable source of inaccuracy since it was thought that using a pre-set program
would contribute to the ecological validity, as mentioned earlier.
Sound level
Sound tests were made during the experiment to see how a change of spray arm
rotation speed or water pressure would influence the general machine sound. For this
purpose a Reed sound level meter model ST-805 was used to measure sound levels in
dBA and dBC. It was run in slow mode which presented the 1 second averages with
an accuracy of ±1.5 dB. The measurement was taken during the washing period of the
program at a distance of 200 mm from the machine front, as indicated in Figure 3.39.
The results are presented in chapter 4.2 Sound level tests.

38
Figure 3.39: Sound meter placement
Energy and water usage
For every test-run the approximate energy usage was measured. The amount of water
used by the machine was also measured. Energy and water usage were seen as system
indicators rather than independent variables related to the washing performance. They
were collected to verify that the system was running as it should.
3.5 Experiment Execution
A defined order of when and how to do each step in the test was set before the
experiment commenced. This was done to minimize the risk of inaccuracies in the
result due to variances in how the test was performed. One entire test run is described
step by step below.
First, the plates were washed clean using approximately 10 ml Sun detergent and
dried using paper. They were then painted within the specified area using the template
and left to dry for 10 minutes.
While the plates were drying the air, in-machine and input water temperatures were
measured as well as the humidity. The correct restrictors were put in place in the
machine and the energy measurement instrument was set to zero.
When 10 minutes had elapsed the speed of the spray arms were set by fine tuning the
output voltage from the power supply unit while checking the rotation speed on the
bike computer. The plates were set in place and the Quick program started. After the
first water intake sound measurements were made when the spray arms were rotating.
When the machine had finished the energy usage was read and the output water was
measured, which had been collected in a bucket. Photos of the plates were taken and
the plates were put in the machine again while the results were analyzed.
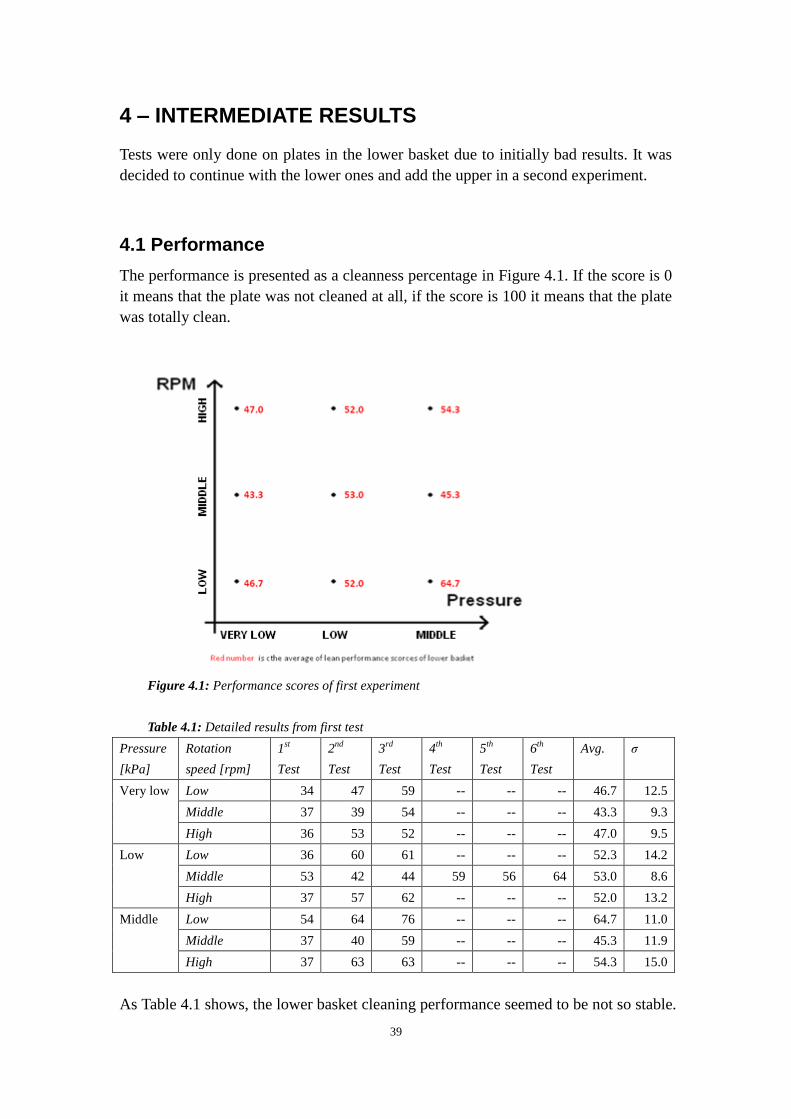
39
4 – INTERMEDIATE RESULTS
Tests were only done on plates in the lower basket due to initially bad results. It was
decided to continue with the lower ones and add the upper in a second experiment.
4.1 Performance
The performance is presented as a cleanness percentage in Figure 4.1. If the score is 0
it means that the plate was not cleaned at all, if the score is 100 it means that the plate
was totally clean.
Figure 4.1: Performance scores of first experiment
Table 4.1: Detailed results from first test
Pressure
[kPa]
Rotation
speed [rpm]
1st
Test
2nd
Test
3rd
Test
4th
Test
5th
Test
6th
Test
Avg. σ
Very low Low 34 47 59 -- -- -- 46.7 12.5
Middle 37 39 54 -- -- -- 43.3 9.3
High 36 53 52 -- -- -- 47.0 9.5
Low Low 36 60 61 -- -- -- 52.3 14.2
Middle 53 42 44 59 56 64 53.0 8.6
High 37 57 62 -- -- -- 52.0 13.2
Middle Low 54 64 76 -- -- -- 64.7 11.0
Middle 37 40 59 -- -- -- 45.3 11.9
High 37 63 63 -- -- -- 54.3 15.0
As Table 4.1 shows, the lower basket cleaning performance seemed to be not so stable.

40
The standard deviation is quite large at almost every point. E.g. the standard deviation
is nearly 15 % at low pressure level with low rotation speed.
The test result proved inconclusive, so some improvements to the test method would
have to be made in order to get more stable data. During this test, one can see a trend
that middle pressure with low rotation speed could enhance the cleaning performance.
The cleaning performance is improving when the water pressure was increased. In
addition the rotation speed only affected the cleaning performance to some extent in
this experiment. The response surface figure and its sectional view are represented in
Figure 4.2 and 4.3.
Figure 4.2: Response surface plot of results from the first experiment
Figure 4.3: Response surface contour plot of results from the first experiment

41
In the Figure 4.3, the contour lines show the level of cleaning performance at two
variables is a curve with a constant value. As can be seen, at a rotation speed between
high speed level and middle speed level cleaning performance changes very little with
increasing pressure, whereas at a low rotation speed the pressure has a lot more
influence on the performance. Still, this is only an indicator since the variation was
very high.
4.2 Sound level tests
The results from the sound tests are presented in Figure 4.4.
Figure 4.4: Results from sound test at Chalmers laboratory
The differences between testing points are not very large. In fact most changes are
smaller than the measurement equipment accuracy of ±1.5 dB. This indicates that the
sound level does not change much depending on pressure or rotation speed within the
span that was tested. The measured sound levels cannot be seen as absolute values,
since the machine could not be isolated from all other sound sources in the laboratory.
The ambient sound level in the laboratory was perceived to be fairly constant during
the tests. As can be seen in the difference between the dB(A) and dB(C) levels, there
was a large contribution of sound below the range of human hearing.
Taking both equipment inaccuracies and unpredictable laboratory ambient sound into
account it was decided to make more accurate sound tests at ASKO. The result from
these can be seen in chapter 5.4.
4.3 Energy consumption
The energy consumption varied between 0.13 and 0.17 kWh. This was due to different

42
test run time, which depended on the input water temperature. The power
consumption/input water temperature relation is plotted in Figure 4.5.
Figure 4.5: Power usage contra input water temperature
The graph suggests that the power consumption is proportional to the inverse of the
temperature of the input water.

43
5 – FURTHER IMPROVED EXPERIMENT
Since the measurements from the first experiment were subject to large inaccuracies,
it was decided to try to analyze the sources of these inaccuracies and try to control
them. In order to do this, a table of potential sources of errors was made and the
estimated influence of each of these was analyzed (see Table 5.1). Suggested solutions
to the potential problems were generated through brainstorming.
Table 5.1: Evaluation of possible sources of error
Potential source of error Evaluation Solution
Painting Paint Paint properties might change when
markers have been used a lot.
Do a test with a new and an old
marker. If this influences: only use
new markers.
Plates Worn and scratched plates might
give an uneven result.
Do tests with new plates.
Drying Drying time does influence the
result.
Is already kept constant.
Time In machine Time is not constant during tests due
to the dishwasher program. This
must be kept constant.
Use special settings in machine and
use an external timer to keep time in
machine constant.
Drying This has been done using paper
which might influence the surface of
the plate.
Let plates dry without touching the
surface.
Temperature Room Has little effect on dishwasher
performance.
No changes needed.
Input water Does affect the time variable. Does not need to be controlled if the
temperature in the machine is
controlled as described below.
In machine Affects the performance a lot, and
should be better controlled.
The machine should be set to run until
it reaches 30° C before the dishes are
put in.
Humidity Uncertain how the humidity affects
the results. Humidity has been
constant during tests.
No changes needed.
Detergent Build-up This might be the reason for the drift
in the previous results. Should be
avoided.
Wash plates one time extra without
detergent between every run.
Wear on
plates
Surface properties might change
during test due to wear caused by
repeated washing with detergent.
New plates should be washed several
times before use, to get them stable.
Water Properties Chemical composition of water
changes constantly. It is difficult to
evaluate the effects of this.
If none of the other solutions work, all
tests could be done at ASKO where
strictly controlled water is used.

44
The outcome of this analysis was that time and temperature should be fixed, new
plates should be used and the machine should be cleaned more properly between test
runs.
5.1 Research for new experiment
Some research was done on how to stabilize the results according to the solutions
from Table 5.1. Tests were done with new plates and paint. All changes to the
experiment are described in detail below.
5.1.1 Test of new plates
In order to avoid problems with differences in plate surface influencing the results
new plates were tested. The plates tested were:
Färgrik Tallrik 27 cm, Color: white, IKEA ID: 301.462.75
Lugn Tallrik 23 cm, Color: beige, IKEA ID: 133.123
Dinera Tallrik 32 cm, Color: beige, IKEA ID: 100.570.67
Before the plates were tested they were washed with detergent several times. The first
tests proved fruitless; the plates were totally cleaned from all paint already after 30
seconds of washing. Apparently the surface was too smooth for any paint to stick. In
an attempt to make the surface more rough, the plates were scraped using a dish
sponge. The sponge was too soft to affect the surface and the plates were still cleaned
from all paint.
Steel wool was used to very lightly scrape the plates. This resulted in more paint
being left on the plates after the washing procedure, but the results were very
unstable. To scrape the plates evenly across the surface proved difficult. Several
attempts were made to stabilize the results but without success.
Finally, it was decided to use the same set of plates as in the previous experiment,
since they had proved stable enough independently, even though the surface
properties varied within the set.
5.1.2 Test of old and new marker
Tests were made to determine if the properties of the marker changed during use. A
whole test run was done with a new marker at machine standard speed and pressure.
The test was re-done using an old, almost finished, marker. There was a difference of
7% in the average plate score. The old paint was slightly more difficult to remove than
the new one. It was decided that markers should be used until it was about 10 % full,
then change to a new one to avoid this drift.

45
5.1.3 Stabilizing time and temperature
To get the desired temperature level a temperature sensor was placed in the machine,
the Quick-wash program was started and then stopped when the water temperature
reached 30 ° C. The program was aborted, while keeping the hatch closed, and the
service mode was accessed. The prepared plates were then inserted and the machine
water pump was started. Time was controlled using an external analogue clock. This
procedure was predicted to decrease inaccuracies due to changes in time and
temperature.
5.1.4 New pressure measurements
To ensure that the pressure levels were still correct, the pressure was measured again
using the same equipment as before. Pressure levels had dropped a little bit. The
levels were adjusted accordingly, and the restrictors slightly modified to get the
desired levels, but the name of pressure level were named as same. The new pressure
levels can be seen in Figure 5.1.
Figure 5.1: New experiment levels
5.1.5 New Experiment Execution
The plates were washed clean using 5 ml Sun detergent, and then washed again
without detergent to remove all residual detergent. They were put in a stand, at a 90°
angle, to dry for 20 minutes. They were then painted within the specified area using
the template and left to dry for 10 minutes. One template for each plate was used to be
able to do the painting as simultaneously as possible.
While the plates were drying the correct restrictors were put in place in the machine
and the regular Quick-wash program was started. Input water and room temperature
was documented. The start of the program was timed so that the temperature in the
machine would reach 30° C when the 10 minutes were up. The machine was stopped
and set into service mode which allowed for access to specific machine functions.
Spray arm speed was set using the power supply unit and the bike computer. The

46
plates were put in place and the machine was then set to run the water pump. The
plates were cleaned for three minutes, which was timed using an analogue clock.
Photos of the plates were taken and the plates were put in the machine again while the
results were analyzed.
5.2 Cleaning performance results
Due to the uneven pressure levels in the upper spray-arm these results could not be
used. Only the lower basket results were analyzed. The evaluation methods were the
same as for the first experiment. If the plate was not cleaned at all, it got a score of 0,
and if the plate was totally cleaned a score of 100. The new test result can be seen in
Figure 5.2.
Figure 5.2: Performance scores of improved experiment

47
Table 5.2: Detailed performance results from improved experiment
Pressure [kPa] Rotation speed
[rpm]
1st test 2
nd test 3
rd test 4
th test Avg. σ
Very low Low 30.6 33.9 -- -- 32.3 2.4
Middle 26.9 28.1 -- -- 27.5 0.9
High 20.6 27.3 -- -- 23.9 4.8
Low Low 40.7 34.9 -- -- 37.8 4.1
Middle 27.2 33.4 30.5 32.7 30.9 2.8
High 30.7 34.4 -- -- 32.5 2.6
Middle Low 46.7 44.7 -- -- 45.7 1.4
Middle 34.2 35.8 -- -- 35.0 1.2
High 38.3 35.3 -- -- 36.8 2.2
In the improved experiment, the standard deviation of the cleaning performance was
much lower than in the intermediate result. The standard deviation between two tests
at the same point is between 0.9 and 4.8 as Table 5.2 shows.
During the new test, it was confirmed that high pressure at low rotation speed could
enhance the cleaning performance, as suggested in the intermediate results. In
opposite, the cleaning performance was decreased a lot at low pressure and high
rotation speed. This trend is obvious considering Figure 5.2 and 5.3.
Figure 5.3: Response surface plot of final results
As can be seen in Figure 5.4 the contour lines indicate that the worst rotation speed is
between middle speed and high speed. In another hand, the performance is more
sensitive to changes in water pressure at lower rotation speeds. This is indicated by
the density of contour lines around lower speeds in Figure 5.4.

48
Figure 5.4: Contour plot of final cleaning performance results
5.3 Validation tests at ASKO
The external validity of the test method was evaluated by performing some of the test
points using the standardized test method at ASKO (see Figure 5.5). This was done to
see how well the simplified test method generalizes, if the simplifications using fewer
plates and paint concur with the standardized test methods. Due to the cumbersome
procedure of the standardized test the only points tested were very low pressure with
high speed and middle pressure with low speed. Two tests were made on each point.
Figure 5.5: Standardized tests at ASKO

49
The expected outcome was that the lower pressure setting would acquire the worst
results while the higher pressure setting would acquire better results.
This was confirmed by the validation tests. Results are measured relative a standard
machine, 1 would mean equal to standard machine and 1.05 would mean 5% better
than the standard. The test results are presented in Table 5.3.
Table 5.3: Results from standardized tests at ASKO
Pressure [kPa] Rotation speed [rpm] 1st Test 2
nd Test
Very low High 0.76 0.78
Middle Low 1.07 1.12
The higher pressure and lower rotation speed enhanced the cleaning performance by 7
to 12% compared to the reference dishwasher. On the other hand, the cleaning
performance went down 22 to 24% at the lower pressure level. This means a span of
approximately 33%. These figures can be compared to the simplified test, which
indicates an improved performance of approximately 15% at high pressure and low
speed and a loss of performance by around 35% at low pressure and high speed, i.e. a
span of 50 %. The simplified test method appears to be valid, but more sensitive than
the standard method.
5.4 Sound tests at ASKO
More accurate sound tests were made at ASKO to document how changes in pressure
and rotation speed affect the machine sound level. The tests were made according to
ISO 3743 in a reverberation room built for this purpose. The machine was placed in a
wooden cabinet used when testing according to standard IEC60704-2-3, as can be
seen in Figure 5.6, to mimic the kitchen environment. An insulated plastic can was put
on top of the motor to block out as much of the motor sound as possible. The machine
was fully loaded with clean dishes.
The test was run two times at every preset level of speed and pressure. Three tests
were then run at different speed levels without any water in order to determine how
much of the sound that was coming from the motor and spray arm pulley system. The
results are presented in tables 5.4-5.7.

50
Figure 5.6: Sound test setup at ASKO
In the third test at very low pressure and at the second tests at low pressure and middle
pressure (all marked in red) there was a change in sound due to that a part of the spray
arm holder broke down and had to be replaced. The accuracy at the same level was
quite high and can be seen if the first and second tests in Table 5.4 are compared.
Results in A-weighted sound power level relative to 1 pW.
Table 5.4: Dishwasher sound power level test – very low pressure level
Pressure level Rotation speed [rpm] First Test [dB(A)] Second Test [dB(A)] Third Test [dB(A)]
Very low Low 44.86 44.85 46.00
Very low Middle 45.33 45.15 46.07
Very low High 46.63 46.71 46.95
Table 5.5: Dishwasher sound power level test – low pressure level
Pressure level Rotation speed [rpm] First Test [dB(A)] Second Test [dB(A)]
Low Low 46.32 46.34
Low Middle 47.10 46.53
Low High 47.86 47.34
Table 5.6: Dishwasher sound power level test – middle pressure level
Pressure level Rotation speed [rpm] First Test [dB(A)] Second Test [dB(A)]
Middle Low 48.67 48.02
Middle Middle 48.97 48.40
Middle High 49.83 48.72

51
Table 5.7: Dishwasher sound power level test – background noise test
Pressure level Rotation speed [rpm] Sound Test [dB(A)]
0 Low 33.31
0 Middle 37.90
0 High 42.00
Studying the frequency plot of the tests of Table 5.7 it was found that the pulley
system contributed a lot to the background noise. This means that the tests cannot be
seen as exact levels for the D5900, but the influence of rotation speed and water
pressure can still be seen. This is depicted as a contour plot in Figure 5.7.
Figure 5.7: Results of sound tests
As the plot describes, the sound level is rising more rapidly at higher pressure levels.
It appears that the rotational speed has less influence as the pressure increases. The
water pressure obviously has the largest influence on sound power level.
5.5 High pressure tests
Some further tests were done to see if the trend of better cleaning performance would
continue at even higher pressure levels. A more powerful water pump was put in the
machine which could increase the water pressure in the lower spray arm. This
pressure level is marked as high pressure level. Because of a difference in pump
structure, the cleaning performance was not directly comparable to the previous
experiment result. Therefore two of the same points as in the previous tests were done
again so that the relative score could be compared. The new test was implemented at
the middle pressure level and high pressure level and rotation speed as low speed
level and high speed level. The test procedure was exactly the same as for the
improved test.

52
The results are shown in Table 5.8. As can be seen in Figure 5.8 it seems that the
initial hypothesis is valid. The best cleaning performance was acquired at highest
water pressure and lowest rotation speed.
Table 5.8: Results of higher pressure test
Pressure [kPa] Rotation speed [rpm] 1st test [%] 2nd Test [%] Average [%] σ
Middle Low 19.0 19.1 19.1 0.1
High 15.4 15.5 15.5 0.1
High Low 26.6 26.6 26.6 0.0
High 20.8 20.7 20.8 0.1
Figure 5.8: Results of higher pressure test

53
6 - DISCUSSION
6.1 The simplified test method
The test method, i.e. the use of plates, paint and camera, proved adequate for
performing the tests. The small changes made in the independent variables could be
detected as changes in the dependent variable without it getting saturated. The method
was successfully used to map the influence of pressure and rotation speed on the
dishwasher performance. It is hard to stabilize all influencing variables, a dishwasher
system is quite complex and many factors influence the results.
The internal validity was considered high enough for the results to be reliable. At the
final stage the standard deviation was as low as 3%. This inaccuracy could probably
be traced back to the painting of the plates, which was hard to standardize, but this
could not be scientifically proved. The high internal validity was achieved at some
cost of ecological validity. Some parameters that are not constant in real-life were
kept constant during the tests. The use of an almost empty dishwasher and the use of
paint instead of food to soil the plates also lowered the ecological validity. However,
this fact did not seem to influence the external validity, considering the good results
from the standardized tests at ASKO. Exploring the two independent variables,
rotation speed and pressure, in the same experiment contributed to the high external
validity. The results indicate that they are closely coupled.
Although the method cannot be used to evaluate dishwasher performance for external
use, due to the global standardization, it can be useful as an alternative for in-house
tests. It can be prepared and performed quicker than the standardized method. One
test-run can be done and analyzed in 60-90 minutes, whereas the standardized test
takes several hours. Little or no training is needed to do the analysis. Another benefit
of the developed method is that it can detect smaller changes in washing performance.
Smaller changes in mechanical structure of the dishwasher, for instance, can be
evaluated using the method.
One drawback is that the paint is very sensitive to the use of chemicals. The plate
surface also influences the results a lot. Further investigations could be made to try to
find or construct plates that have more homogenous surface. This could improve the
test method and enable the experimenter to draw conclusions about performance at
different positions in the dishwasher. In order to use the method one has to try
different detergents and plates to find a level that is fitting for the experiment. When a
desired level of cleanness has been found smaller changes in the span can be made by
changing the washing time.

54
6.2 Design of Experiments
The choice of a factorial design with three levels for each variable was suitable for the
conducted experiment. Considering the relatively small differences in response
between the levels, having more levels would not improve the experiment. The
accuracy of the test method would also limit the usefulness of more levels. Displaying
the results as a response surface using JMP made the data easily interpretable.
Automated interpolation of data and calculation of accuracy saved a lot of time. Not
having control of every detailed calculation was not seen as a problem.
6.3 Regarding the test rig
The test rig worked well during all the experiments. It was built using relatively low
cost parts and was still robust enough to withstand the washing procedure. There were
some minor problems with leakage at the top where a hole for the axis had been made,
but this did not influence the tests. There were also some problems with rust on the
axis getting the lower bearing to jam. The bearing had to be replaced and the axis had
to be dried properly when the machine was not in use. A stainless-steel axis should
have been used.
The rotation speed actuator and sensor were easy and quick to set up and use. They
worked perfectly. The pressure actuator was also simple to use and very simple to
construct. It enabled proper sound tests to be made without changing motor sound
influencing the results. The drawback of using this method was that the pressure could
not be increased. This altered the experiment plan, and an additional experiment with
another motor had to be done in order to confirm the performance trend.
Even though the test rig was not a highly complex system to develop, using proper
development methods was beneficial since it ensured that the final result would fulfill
all requirements and be usable for the experiments. It also ensured that all possible
solutions were explored, and that the best suited for the task was selected.
6.4 Results from the first experiment
The results from the first tests were inconclusive. One might say that the tests
indicated that the dishwasher performance was better at higher pressure and lower
speed, but the inaccuracies were too large to draw any certain conclusions. It was
obvious that more testing was needed and that the test method would have to be
improved. The assumption that the changes in the dishwasher program time, caused
by changes in input water temperature, would not affect the results was erroneous.
This initial test showed how sensitive the test method was and how large inherent
variances the dishwasher system had. These variances explain the reason for the large
variances in the standardized tests.

55
The sound level measurements were not accurate enough either. Good measurements
were very hard to acquire in the noisy environment at the facilities at Chalmers. The
use of the sound meter gave an indication of that sound level did change depending on
rotation speed and water pressure and that further sound tests would be of interest.
6.5 Results from the improved experiment
The final results were quite satisfying. The relative washing performance could be
charted with good precision. The reliability of the tests was thought to be fairly high.
Enough points were made to acquire a low standard deviation; less than 2.5% at most
testing points, but a bit more than 4% at a few. Regarding external validity, the results
from the standardized tests at ASKO support the final results. There was only time to
do four tests, but they were all indicating the same conclusions (see Chapter 5.3
Validation tests at ASKO).
One drawback of the higher pressure is the higher sound level. A tradeoff has to be
made between washing performance contra sound level and energy usage. Figure 6.1
could be used for this purpose.
Figure 6.1: Contour plot of performance level (red) and sound level (blue)

56
As can be seen in Figure 6.2 the sound level could be lowered by more than two
decibel while still performing as well as before if the rotation speed is lowered from
middle speed level to low speed level, and decreasing the pressure to low pressure
level. Using a smaller motor could lower both production costs and energy usage as
well. If the pressure is kept at the current level and the rotation speed is decreased to
low speed level, as depicted in Figure 6.3, the performance could be increased by
about 10% without increasing the sound level.
Figure 6.2: Suggestion for lower sound level Figure 6.3: Suggestion for better performance

57
7 - CONCLUSIONS
The reliability of the results are thought to be high enough for it to be used as basis for
decisions regarding the rotation speed and water pressure in new developed
dishwasher models at ASKO. It was proved that higher water pressure and lower
rotation speed could increase the washing performance. The charts presented in
Chapter 6 should be used to find a proper trade-off between sound level and cleaning
performance. Different proposals will have to be tested since the exact levels differ
from model to model, but the general trend should be the same. Research should be
done exploring what other characteristics are affected by the changes before any
changes are made.
The developed simplified test method could be used at ASKO to test new
modifications to dishwashers in order to save time and resources. For instance when
testing a new water pump motor. It should be seen as a complement to their
standardized methods.
Future work that would be of interest includes doing sound tests at higher pressure
levels. These tests could be a bit difficult to do without changing the sound levels. It
would also be interesting to see how the energy consumption changes with an
increasing pressure. If this is significant compared to the effect of changing input
water temperature and water usage or not.

58
REFERENCES
Baiduzhidao. Brainstorming. Retrieved 12 April 2010 from Baiduzhidao:
http://zhidao.baidu.com/question/473887
Courant, R., Robbins, H. & Stewart, I. (1996): What Is Mathematics? An Elementary
Approach to Ideas and Methods. Oxford University Press
Fargnoli, M., Rovida, E. & Troisi, R. (2006). The morphological matrix: Tool for the
development of innovative design solutions. Politecnico di Milano, Department of
Mechanics
Institute for Transport Studies, University of Leeds. Problem Identification. Retrieved
8 April 2010 from leeds.ac.uk:
http://www.konsult.leeds.ac.uk/public/level1/sec08/index.htm
Milton, J.S. & Arnold, J.S. (2003): Introduction to probability and statistics.
McGraw-Hill
Mindtools. Brainstorming. Retrieved 12 April 2010 from Mindtools:
http://www.mindtools.com/brainstm.html
Montgomery, D.C. (2009): Design and Analysis of Experiments, 7th Ed. John Wiley &
Sons
Shuttleworth, M. (2008). Experimental Research. Retrieved 5 April 2010 from
Experiment Resources:
http://www.experiment-resources.com/experimental-research.html
Stevens, R., Brook, P., Jackson, K. & Arnold, S. (1998), System engineering coping
with complexty. Pearson Education
Ulrich, K.T. & Eppinger, S.D. (2008), Product design and development. McGraw Hill
Weber, Donald & Skillings, John H. (2000): A first course in the design of
experiments: a linear models approach. CRC Press
Wikipedia. Central composite design. Retrieved 21 November 2009 from Wikipedia:
http://en.wikipedia.org/wiki/Central_composite_design
Wikipedia. Contour line. Retrieved 27 April 2010 from Wikipedia:
http://en.wikipedia.org/wiki/Contour_line
Wikipedia. Design of Experiments. Retrieved 18 November 2009 from Wikipedia:

59
http://en.wikipedia.org/wiki/Design_of_experiments
Wikipedia. Ecological validity. Retrieved 28 November 2009 from Wikipedia:
http://en.wikipedia.org/wiki/Ecological_validity
Wikipedia. Factorial experiment. Retrieved 19 November 2009 from Wikipedia:
http://en.wikipedia.org/wiki/Factorial_experiment
Wikipedia. Fractional factorial experiment. Retrieved 19 November 2009 from
Wikipedia: http://en.wikipedia.org/wiki/Fractional_factorial_design

60
APPENDIX
Appendix A: Target specification Design of experiment methodology Specifications
Requirement Value range Weight 1 - 10
FR1 Minimize the number of test runs < 45 times 7
FR2 Fit our test profile Y/N 8
FR3 Give highly reliable results Y/N 8
D1 Be relatively simple to use 5
D2 Be supported by earlier experiments 6
Simplified test method Specifications
Requirement Value range Weight 1 - 10
FR1 Physically possible to implement Y/N 9
FR2 Be quick to prepare < 30 min Y/N 6
FR3 Easy and quick to reset value < 30 min Y/N 7
FR4 Easy to determine result Y/N 8
FR5 Possible to grade relatively accurate Y/N 8
FR6 Low cost Y/N 5
D1 High ecological validity 8
D2 Safe to use 7
Rotation speed actuator Specifications
Requirement Value range Weight 1- 10
FR1 Possible to achieve target value masked Y/N 9
FR2 Quick to prepare for use < 30 min Y/N 6
FR3 Measure velocity with high accuracy ± 0.5 RPM Y/N 6
FR4 Not affect other parameter Y/N 9
FR5 Affect other function as little as possible Y/N 8
FR6 Robust enough to withstand washing procedure Y/N 7
FR7 Durable > 300h Y/N 6
FR8 Be able to work in different temperatures 5 - 90 ℃ Y/N 5
FR9 Be water proof Y/N 8
FR10 Physically possible to produce prototype within
time frame
< 3 days Y/N 5
FR11 Low cost < 1500 SEK Y/N 3
FR12 Be safe to use Y/N 6
D1 Should be easy to set the value 7
D2 Modify the dishwasher as little as possible 6

61
Rotation speed sensor Specifications
Requirement Value range Weight 1 - 10
FR1 Be able to measure rotation speed masked Y/N 9
FR2 Quick to prepare for use < 30 min Y/N 6
FR3 Measure velocity with high accuracy ± 0.5 RPM Y/N 6
FR4 Not affect other parameter Y/N 9
FR5 Affect other function as little as possible Y/N 8
FR6 Robust enough to withstand washing procedure Y/N 7
FR7 Durable > 300h Y/N 6
FR8 Be able to work in different temperatures 5 ~ 90 ℃ Y/N 5
FR9 Be water proof Y/N 8
FR10 Physically possible to produce prototype within
time frame
< 1day Y/N 5
FR11 Low cost < 300 SEK Y/N 3
FR12 Be safe to use Y/N 6
FR13 Easy to replace < 60 min Y/N 5
D1 Should be easy to get the value 7
D2 Modify the dishwasher as little as possible 6
Water pressure actuator Specifications
Requirement Value range Weight 1 - 10
FR1 Possible to achieve target value masked Y/N 9
FR2 Quick to prepare for use < 30 min Y/N 6
FR3 Measure velocity with high accuracy ± 0.5 kPa Y/N 6
FR4 Not affect other parameter Y/N 9
FR5 Affect other function as little as possible Y/N 8
FR6 Robust enough to withstand washing procedure Y/N 7
FR7 Durable > 300h Y/N 6
FR8 Be able to work in different temperatures 5 - 90 ℃ Y/N 5
FR9 Be water proof Y/N 8
FR10 Physically possible to produce prototype within
time frame
< 3 days Y/N 5
FR11 Low cost Y/N 3
FR12 Be safe to use Y/N 6
D1 Should be easy to set the value 7
D2 Modify the dishwasher as little as possible 4

62
Water pressure sensor Specifications
Requirement Value range Weight 1 - 10
FR1 Be able to measure pressure masked Y/N 9
FR2 Quick to prepare for use < 30 min Y/N 6
FR3 Measure pressure with high accuracy ± 0.5 kPa Y/N 6
FR4 Not affect other parameter Y/N 9
FR5 Affect other function as little as possible Y/N 8
FR6 Robust enough to withstand washing procedure Y/N 7
FR7 Durable > 300h Y/N 6
FR8 Be able to work in different temperatures 5 ~ 90 ℃ Y/N 5
FR9 Be water proof Y/N 8
FR10 Physically possible to produce prototype within
time frame
< 1day Y/N 5
FR11 Low cost < 600 SEK Y/N 3
FR12 Be safe to use Y/N 6
FR13 Easy to replace < 30 min Y/N 5
D1 Should be easy to get the value 7
D2 Modify the dishwasher as little as possible 6

63
Appendix B: Morphological Matrix Simplified test method Morphological matrix
Rotation speed actuator Morphological matrix

64
Water pressure actuator Morphological matrix
Rotation speed sensor and water pressure sensor Morphological matrix

65
Appendix C: Kesselring Matrix Rotation speed actuator Kesselring matrix
Concept Frictioner Ex-motor In-Motor Turbine Heavy arm
Rotation speed actuator Weight
Demands 1-10 Value
Possible to achieve target value 9 0* 0 8 72 8 72 8 72 0* 0
Should be easy to set the value 7 1 7 7 49 7 49 5 35 2 14
Quick to prepare for use 6 8 48 9 54 9 54 8 48 8 48
Not affect other parameter 9 10 90 10 90 10 90 10 90 10 90
Affect other function as little as possible 8 10 80 8 64 6 48 7 56 9 72
Possible to produce prototype within time
frame
5 5 25 6 30 1 5 2 10 5 25
Modify the dishwasher as little as possible 6 7 42 5 30 3 18 2 12 7 42
Be able to work in different temperatures 5 4 20 8 40 3 15 5 25 8 40
Be water proof 8 8 64 9 72 6 48 6 48 9 72
Durable 6 5 30 8 48 8 48 8 48 9 54
Robust enough to withstand washing
procedure
7 8 56 7 49 9 63 8 56 9 63
Low cost 3 10 30 7 21 5 15 6 18 9 27
Be safe to use 6 8 48 8 48 5 30 8 48 9 54
Measure velocity with high accuracy 6 4 24 8 48 8 48 8 48 7 42
Total Pass/Failure 564 715 603 614 643
* it cannot achieve all the values

66
Rotation speed sensor Kesselring matrix
Concept Click counter Bike computer Listen Light sensor Lookie Lookie
Rotation speed sensor Weight
Demands 1-10 Value
Be able to measure rotation speed 9 9 81 9 81 9 81 9 81 9 81
Should be easy to get the value 7 7 49 9 63 9 63 7 49 9 63
Quick to prepare for use 6 7 42 9 54 10 60 7 42 9 54
Easy to replace 5 5 25 8 40 10 50 5 25 7 35
Not affect other parameter 9 6 54 9 81 10 90 9 81 8 72
Affect other function as little as possible 8 8 64 10 80 10 80 10 80 9 72
Possible to produce prototype within time
frame
5 7 35 9 45 10 50 7 35 9 45
Modify the dishwasher as little as possible 6 7 42 8 48 10 60 7 42 10 60
Durable 6 6 36 8 48 10 60 8 48 9 54
Be able to work in different temperatures 5 7 35 7 35 10 50 7 35 8 40
Be water proof 8 5 40 8 64 10 80 6 48 8 64
Robust enough to withstand washing
procedure
7 7 49 9 63 9 63 8 56 9 63
Low cost 3 7 21 8 24 10 30 6 18 9 27
Be safe to use 6 6 36 8 48 10 60 6 36 8 48
Meassure velocity with high accuracy 6 8 48 8 48 5 30 9 54 6 36
Total Pass/Failure 657 822 907 730 814
* it cannot achieve all the values

67
Water pressure actuator Kesselring matrix
Concept Power motor Restrictor Arm volume Holy
Water pressure actuator Weight
Demands 1-10 Value
Possible to achieve target value 9 9 81 4 36 3 27 0** 0
Should be easy to set the value 7 8 56 2 14 1 7 3 21
Quick to prepare for use 6 9 54 10 60 4 24 4 24
No affect other parameters* 9 10 90 10 90 10 90 5 45
Affect other function as little as possible 8 10 80 10 80 10 80 10 80
Possible to produce prototype within time
frame
5 7 35 9 45 4 20 8 40
Modify the dishwasher as little as possible 4 6 24 8 32 4 16 6 24
Durable 6 9 54 9 54 9 54 8 48
Robust enough to withstand washing
procedure
7 9 63 9 63 9 63 9 63
Be water proof 8 9 72 10 80 10 80 9 72
Be able to work in different temperatures 5 7 35 10 50 10 50 10 50
Low cost 3 5 15 9 27 2 6 9 27
Be safe to use 6 8 48 9 54 10 60 9 54
Meassure velocity with high accuracy 6 8 48 4 24 3 18 3 18
Total Pass/Failure 755 709 595 566
* Except Rotation speed
** It cannot achieve all values

68