Disentangling invasion processes in a dynamic shipping–boating
15
Disentangling invasion processes in a dynamic shipping–boating network ANAI ¨ S LACOURSIE ` RE-ROUSSEL,* DAN G. BOCK,† MELANIA E. CRISTESCU,† FRE ´ DE ´ RIC GUICHARD,* PHILIPPE GIRARD,‡ PIERRE LEGENDRE§ and CHRISTOPHER W. M C KINDSEY – *Department of Biology, McGill University, 1205 Docteur Penfield, Montre ´al, Que ´bec, Canada H3A 1B1, †Great Lakes Institute for Environmental Research, University of Windsor, Windsor, Ontario, Canada N9B 3P4, ‡De ´partement de Ge ´ographie, Universite ´ de Montre ´al, C.P. 6128, Succursale Centre-Ville, Montre ´al, Que ´bec, Canada H3C 3J7, §De ´partement de Sciences Biologiques, Universite ´ de Montre ´al, C.P. 6128, Succursale Centre-Ville, Montre ´al, Que ´bec, Canada H3C 3J7, –Coastal and Benthic Ecology, Institut Maurice-Lamontagne, Fisheries and Oceans Canada, C.P. 1000 Mont-Joli, Que ´bec, Canada G5H 3Z4 Abstract The relative importance of multiple vectors to the initial establishment, spread and population dynamics of invasive species remains poorly understood. This study used molecular methods to clarify the roles of commercial shipping and recreational boating in the invasion by the cosmopolitan tunicate, Botryllus schlosseri. We evaluated (i) single vs. multiple introduction scenarios, (ii) the relative importance of shipping and boating to primary introductions, (iii) the interaction between these vectors for spread (i.e. the presence of a shipping-boating network) and (iv) the role of boating in determining population similarity. Tunicates were sampled from 26 populations along the Nova Scotia, Canada, coast that were exposed to either shipping (i.e. ports) or boating (i.e. marinas) activities. A total of 874 individuals (c. 30 per population) from five ports and 21 marinas was collected and analysed using both mitochondrial cytochrome c oxidase subunit I gene (COI) and 10 nuclear microsatellite markers. The geographical location of multiple hotspot populations indicates that multiple invasions have occurred in Nova Scotia. A loss of genetic diversity from port to marina populations suggests a stronger influence of ships than recreational boats on primary coastal introductions. Population genetic similarity analysis reveals a dependence of marina populations on those that had been previously established in ports. Empirical data on marina connectivity because of boating better explains patterns in population similarities than does natural spread. We conclude that frequent primary introductions arise by ships and that secondary spread occurs gradually thereafter around individual ports, facilitated by recreational boating. Keywords: population connectivity, population dynamics, primary introduction, spread, tunicate Received 10 February 2012; revision received 9 May 2012; accepted 25 May 2012 Introduction Human activities have become drivers of global ecosys- tem change by facilitating the transport and introduc- tion of species outside of their natural ranges, some of which may survive, establish and become invasive (Grosholz 2002). A better understanding of invasion processes is fundamental to describing the structure and function of such populations and mitigating their impacts (Carlton 2003). Only a few studies have investi- gated post-establishment spread (Estoup et al. 2004; Viard et al. 2006; Goldstien et al. 2010; Bock et al. 2011). As successful eradication of invasive species is uncom- mon, many recent studies have focused on gaining a better understanding of the initial stages of the invasion process to limit the likelihood of new intro- ductions attributed to human vectors (Lodge et al. 2006). Successful invasions are generally thought to result from complex interactions between primary Correspondence: Anaı ¨s Lacoursie `re-Roussel, Fax: (418) 775 0718; E-mail: [email protected] ȑ 2012 Blackwell Publishing Ltd Molecular Ecology (2012) 21, 4227–4241 doi: 10.1111/j.1365-294X.2012.05702.x
Transcript of Disentangling invasion processes in a dynamic shipping–boating

Molecular Ecology (2012) 21, 4227–4241 doi: 10.1111/j.1365-294X.2012.05702.x
Disentangling invasion processes in a dynamicshipping–boating network
ANAIS LACOURSI ERE-ROUSSEL,* DAN G. BOCK,† MELANIA E. CRISTESCU,† FREDERIC
GUICHARD,* PHILIPPE GIRARD,‡ PIERRE LEGENDRE§ and CHRISTOPHER W. M C KINDSEY–
*Department of Biology, McGill University, 1205 Docteur Penfield, Montreal, Quebec, Canada H3A 1B1, †Great Lakes Institute
for Environmental Research, University of Windsor, Windsor, Ontario, Canada N9B 3P4, ‡Departement de Geographie,
Universite de Montreal, C.P. 6128, Succursale Centre-Ville, Montreal, Quebec, Canada H3C 3J7, §Departement de Sciences
Biologiques, Universite de Montreal, C.P. 6128, Succursale Centre-Ville, Montreal, Quebec, Canada H3C 3J7, –Coastal and
Benthic Ecology, Institut Maurice-Lamontagne, Fisheries and Oceans Canada, C.P. 1000 Mont-Joli, Quebec, Canada G5H 3Z4
Corresponde
E-mail: anais
� 2012 Black
Abstract
The relative importance of multiple vectors to the initial establishment, spread and
population dynamics of invasive species remains poorly understood. This study used
molecular methods to clarify the roles of commercial shipping and recreational boating
in the invasion by the cosmopolitan tunicate, Botryllus schlosseri. We evaluated (i) single
vs. multiple introduction scenarios, (ii) the relative importance of shipping and boating
to primary introductions, (iii) the interaction between these vectors for spread (i.e. the
presence of a shipping-boating network) and (iv) the role of boating in determining
population similarity. Tunicates were sampled from 26 populations along the Nova
Scotia, Canada, coast that were exposed to either shipping (i.e. ports) or boating
(i.e.marinas) activities. A total of 874 individuals (c. 30 per population) from five ports and 21
marinaswascollectedandanalysedusingbothmitochondrialcytochromecoxidase subunit
I gene (COI) and 10 nuclear microsatellite markers. The geographical location of
multiple hotspot populations indicates that multiple invasions have occurred in Nova
Scotia. A loss of genetic diversity from port to marina populations suggests a stronger
influence of ships than recreational boats on primary coastal introductions. Population
genetic similarity analysis reveals a dependence of marina populations on those that
had been previously established in ports. Empirical data on marina connectivity
because of boating better explains patterns in population similarities than does natural
spread. We conclude that frequent primary introductions arise by ships and that
secondary spread occurs gradually thereafter around individual ports, facilitated by
recreational boating.
Keywords: population connectivity, population dynamics, primary introduction, spread, tunicate
Received 10 February 2012; revision received 9 May 2012; accepted 25 May 2012
Introduction
Human activities have become drivers of global ecosys-
tem change by facilitating the transport and introduc-
tion of species outside of their natural ranges, some of
which may survive, establish and become invasive
(Grosholz 2002). A better understanding of invasion
processes is fundamental to describing the structure
nce: Anaıs Lacoursiere-Roussel, Fax: (418) 775 0718;
well Publishing Ltd
and function of such populations and mitigating their
impacts (Carlton 2003). Only a few studies have investi-
gated post-establishment spread (Estoup et al. 2004;
Viard et al. 2006; Goldstien et al. 2010; Bock et al. 2011).
As successful eradication of invasive species is uncom-
mon, many recent studies have focused on gaining
a better understanding of the initial stages of the
invasion process to limit the likelihood of new intro-
ductions attributed to human vectors (Lodge et al.
2006). Successful invasions are generally thought to
result from complex interactions between primary

4228 A. LACOURSI E RE- ROUSSEL E T A L.
introductions and secondary spread. Although interac-
tions between multiple human vectors in the invasion
process have often been proposed (Floerl et al. 2009),
empirical examples are largely lacking.
Commercial shipping is considered the most impor-
tant vector for primary introduction of marine invasive
species (International Maritime Organization 2004;
Hewitt et al. 2009). Following primary introductions,
recipient regions (e.g. ports) may, in turn, become
donor regions—sources for propagules for spread (Carl-
ton 1996). The likelihood that invaders are transported
via a given pathway is dependent on a species’ life his-
tory traits. For example, species with long planktonic
larval stage and a tolerance to a large range of salinities
and temperatures, such as the European green crab,
Carcinus maenas, (Broekhuysen 1936; Eriksson et al.
1975; Yamada 2001), or with resistant resting stages,
such as dinoflagellate cysts (Casas-Monroy et al. 2011),
are likely to be introduced via ballast water. When life
history traits do not favour introduction by this path-
way, rapid expansion of such species’ ranges may occur
by alternative shipping pathways (e.g. fouling). A clas-
sic example is tunicates. The short larval stage in this
group of organisms should limit their transport via bal-
last water and thus their rapid expansion at the global
scale is somewhat perplexing (Lambert 2005; Carver
et al. 2006). Following introduction and establishment,
marine species may subsequently spread beyond the
boundaries of primary recipient regions through natural
(e.g. currents) or anthropogenic (e.g. recreational boats,
aquaculture) mechanisms. While the importance of rec-
reational boats for secondary spread of biofouling spe-
cies has been well recognized (Floerl 2002), recent
studies from New Zealand on the solitary tunicate, Sty-
ela clava, suggest that recreational boats may be a more
important vector for primary introductions than was
previously assumed (Goldstien et al. 2010). However,
the relative importance of recreational boats to species
spread has been suggested to vary greatly among regions
(Minchin et al. 2006; Lacoursiere-Roussel et al. 2012).
Genetic structure may be used to evaluate hypotheses
about vectors of introductions and pathways based on a
weight of evidence approach (Dupont et al. 2009, 2010;
Goldstien et al. 2010; Bock et al. 2011). For example,
when species become locally abundant but clustered in
a limited number of distinct areas, population connec-
tivity evaluated at different spatial scales may be esti-
mated using genetic markers to provide evidence of
vector importance, as has been recently shown for port
and marina populations of the invasive tunicate,
S. clava, in New Zealand (Goldstien et al. 2010).
Although genetic diversity is expected to decline from
native to invasive ranges (Allendorf & Lundquist 2003),
propagules from multiple genetically distinct source
populations can generate hotspots of genetic diversity in
areas of primary introductions (Novak & Mack 1993,
2005; Zalewski et al. 2010; Tonione et al. 2011). Second-
ary spread may occur in a stepping-stone manner
(Reusch et al. 2010), resulting in a loss of genetic diversity
with distance and ⁄ or steps in the invasion (Holland
2000). Thus, comparing genetic diversity among loca-
tions within invaded ranges may identify diversity hot-
spots and infer areas of primary introductions and
secondary spread and ultimately help identify vectors
that are important at each step of the invasion process.
Tunicates, for which rapid and global invasions have
been recorded in recent years, are one of the best taxa
to study the effects of anthropogenic vectors on the
spread of biofouling species for a number of reasons
(Lambert & Lambert 1998). First, the high availability of
artificial and off-bottom substrates in ports and marinas
(Glasby et al. 2007; Tyrrell & Byers 2007) makes these
habitats suitable for colonization by invasive tunicates,
many of which seem to be largely dependent on dis-
turbed and ⁄ or anthropogenic habitat (Lambert 2005).
Second, colonial tunicates have a restricted capacity for
natural dispersal, limiting their potential for natural sec-
ondary spread (Svane & Young 1989; Ayre et al. 1997).
Third, the enclosed structural environment of ports and
marinas may limit natural connectivity among popula-
tions (Floerl & Inglis 2003). Frequently visited by
human vectors, ports and marinas are therefore consid-
ered hubs for species introductions (Carlton & Geller
1993). The spread of tunicate species is thus believed to
be a function of connectivity among hub habitats
through human-mediated maritime activities.
The colonial tunicate Botryllus schlosseri has long been
recognized as a model system to study cell biology
(Rinkevich 2002; De Tomaso & Weissman 2004). Its large
distributional range, high abundance and low capacity
for natural dispersal have made it a model for studying
dispersal via marine anthropogenic vectors at regional
scales (Grosberg 1987; Lopez-Legentil et al. 2006).
Recent work has shown that this colonial tunicate con-
sists of at least five morphologically cryptic but geneti-
cally distinct species (B. schlosseri species A–E; Bock
et al. 2012). Among these, only one, B. schlosseri, species
A (hereafter referred to as B. schlosseri) is invasive and
widespread globally, occurring on all continents except
Antarctica (Van Name 1945). Its origin is thought to be
most likely Europe or the Pacific Ocean (Berrill 1950;
Carlton 2005; Lejeusne et al. 2011). Molecular data indi-
cate that B. schlosseri extends its spatial range through
maritime transport (Lopez-Legentil et al. 2006), but the
importance between multiple potential maritime vectors
has not been evaluated empirically. In the past, B. sch-
losseri has only been reported anecdotally on ships (Ber-
rill 1950; Skerman 1960). More recently, the species was
� 2012 Blackwell Publishing Ltd

INV ASI ON ACROSS A SHI PPING–BOATING NETWORK 4229
not observed in hull fouling and ballast water surveys
of 60 and 77 vessels in Canada, respectively (Humphrey
2008; Sylvester & MacIsaac 2010; Sylvester et al. 2011).
In contrast, with respect to recreational boats, it has been
reported as the dominant tunicate species in eastern
Canada (Lacoursiere-Roussel et al. 2012) and one of the
dominant tunicate species in western Canada (Clarke
Murray et al. 2011) and New Zealand (Lacoursiere-
Roussel et al. 2012). In eastern Canada, despite its first
appearance in the early 1900s, B. schlosseri has only
recently increased remarkably in abundance and is char-
acterized by having a patchy distribution (Carver et al.
2006; Sephton et al. 2011).
In this study, we use mitochondrial and nuclear
markers of B. schlosseri to investigate the role of com-
mercial shipping and recreational boating in the inva-
sion process of the species. Specifically, we first use
phylogeographic and population genetic diversity of
B. schlosseri collected in multiple port and marina loca-
tions in eastern Canada to evaluate the likelihood of
single vs. multiple primary introductions. A single hot-
spot population—characterized by high genetic diver-
sity and private haplotypes and alleles—will support
the hypothesis that an introduction occurred within
a single location, whereas multiple distinct hotspots
(i.e. distinct geographically structured genetic signatures)
will support the hypothesis of multiple introductions
across several locations. If population differentiation is
not detected, spread from prior introduction(s) may
have already occurred among sampling sites and ⁄ or
multiple introductions from similar genetic pools may
have occurred. In the latter case, differentiating between
primary introductions and secondary spread will not be
possible. The relative location of hotspot populations is
used to indicate where primary introductions have
probably occurred. This information along with data on
shipping and boating networks is used to identify the
most likely vectors associated with primary introduc-
tion(s) (i.e. commercial ships or recreational boats). The
existence of a shipping–boating network is then evalu-
ated based on the genetic similarity between hotspot
populations and those established through secondary
spread (i.e. non-hotspot populations). Finally, the role
of recreational boats in the secondary spread of B. sch-
losseri is further evaluated based on the relationship
between population genetic similarity and the strength
of boating connectivity between populations.
Materials and methods
Study area and sample collection
Botryllus schlosseri colonies were sampled from five
commercial ports (i.e. locations with predominantly
� 2012 Blackwell Publishing Ltd
commercial shipping activities; N = 150 individuals)
and 21 marinas (i.e. locations with recreational boating
activities; N = 724 individuals) on the coast of Nova
Scotia, Canada, during 2008–2009 (Table 1). Although
we surveyed all eight major ports of the province,
B. schlosseri was not observed during collector plate
and dive surveys (a minimum of 12 diving sites per
harbour) in Liverpool (geographic coordinates: 44�02¢N,
64�41¢W) and Sheet Harbour (44�54¢N, 62�30¢W). In Hal-
ifax Harbour (44�38¢N, 63�32¢W), only one individual
was found on one collector plate, and none were
observed in the 24 wharf sites surveyed during diving
operations. Consequently, these ports were not assumed
to be a potential source of recruits for secondary
spread. Port and marina sampling sites were distributed
among three distinct regions: Open Coast (ports P1 and
P2, marinas M1–M8), Strait of Canso (port P3, marinas
M9–M14) and Bras d’Or Lake (port P4, marinas M16–
M21; Table 1; Fig. 1). Each region includes one or two
port(s) surrounded by marinas. The Open Coast is
exposed to the Atlantic Ocean; the Strait of Canso has a
rock-filled causeway that limits natural dispersal
between the Atlantic and Gulf of St. Lawrence sides of
the strait (although recreational boats may cross the
Canso Causeway through a canal), and Bras d’Or Lake
is a semi-closed saltwater environment that is heavily
used by recreational boaters. Two locations, P5 and
M15, could not be unambiguously associated with one
of the three defined geographical regions and thus were
not considered for regional scale analyses.
Sampling was carried out using 10 settlement collec-
tors positioned as far as possible from each other in
each port and marina surveyed. All collectors were sus-
pended in the water column from buoys or floating
dock structures and included an upside-down 20-cm
diameter plastic flowerpot base on top of three
10 · 10 cm PVC recruitment plates and a rock (if sus-
pended from floating docks) or a buoy (if anchored to
the bottom), each separated vertically by at least 10 cm.
Prior to sampling, average per cent cover of B. schlosseri
was estimated for each collector plate. To avoid analy-
sing the same colonies multiple times, single tissue frag-
ments were taken from each collector structure
(i.e. plates and rock ⁄ buoy) in marinas. However, to
increase the sample sizes in ports, multiple individuals
were collected from the same plates and the genetic dis-
tinctiveness of specimens evaluated prior to down-
stream analyses using 10 nuclear microsatellite loci.
Repeated multilocus genotypes were identified using
GENECAP (Wilberg & Dreher 2004) and the probability of
identical genotypes arising by chance via sexual repro-
duction calculated under Hardy–Weinberg expectations
and the more conservative scenario of sibling reproduc-
tion, following Waits et al. (2001). All samples were

Table 1 Locations from which Botryllus schlosseri was collected in Nova Scotia, Canada (Fig. 1), with N, sample size; Nh, number of
haplotypes; Q, haplotype diversity; p, nucleotide diversity; NA, number of alleles; NP, number of private alleles; Ar, allelic richness;
HE, expected heterozygosity in each location
Site Location
mtDNA Microsatellite
N Nh Haplotypes Q p N NA NP Ar HE
Ports
P1 Yarmouth 29 3 Bs2, HO, HB 0.478 0.0140 29 52 3 3.81 0.5991
P2 Shelburne 9 2 Bs2, HO 0.389 0.0134 10 31 0 — 0.5323
P3 Point Tupper, Port Hawkesbury and Mulgrave* 18 4 Bs2, HO, Bs13, Bs15 0.608 0.0179 16 39 0 3.44 0.5822
P4 Little Narrows 63 1 Bs2 0.000 0.0000 61 39 1 2.66 0.4604
P5 Sydney 30 4 Bs2, HO, Bs4, Bs16 0.524 0.0163 29 46 3 3.36 0.5202
Total 149 7 0.500 0.0123 145 62 7 3.32 0.5388
Marina
M1 Digby Marina 16 3 Bs2, HO, HA 0.242 0.0086 15 35 0 3.11 0.4714
M2 Lunenburg Yacht Club 40 3 Bs2, HO, Bs14 0.381 0.0093 34 34 0 2.86 0.4783
M3 Mahone Bay Classic Boat Marina 34 4 Bs2, HO, Bs8, Bs14 0.437 0.0106 31 48 2 3.46 0.5480
M4 Oak Island Marina 33 3 Bs2, HO, Bs8 0.402 0.0107 30 35 0 2.89 0.4801
M5 South Shore Marine 30 3 Bs2, HO, Bs14 0.570 0.0175 21 36 0 3.12 0.5175
M6 Chester Yacht Club and The Ripe Loft Restaurant* 36 3 Bs2, HO, Bs14 0.541 0.0178 31 32 1 2.53 0.4302
M7 Hubbards Yacht Club 31 2 Bs2, HO 0.232 0.0080 24 36 0 2.89 0.4793
M8 Shining Waters 29 3 Bs2, HO, HA 0.394 0.0139 22 34 0 2.70 0.3708
M9 Ballantyne’s Cove 35 2 Bs2, HO 0.393 0.0135 31 40 0 3.22 0.5351
M10 Cribbon’s Point 34 3 Bs2, HO, Bs8 0.169 0.0022 36 42 1 3.08 0.5046
M11 Guysborough Marina 28 2 Bs2, HO 0.254 0.0087 31 40 0 3.09 0.4792
M12 Canso Marina 33 2 Bs2, HO 0.492 0.0169 31 48 1 3.50 0.5310
M13 Petit de Grat Marina 40 2 Bs2, HO 0.385 0.0132 29 42 0 3.35 0.4857
M14 Isle Madame Boat Club 35 2 Bs2, HO 0.292 0.0101 34 39 0 3.08 0.4716
M15 Lennox Passage Yacht Club 37 1 Bs2 0.000 0.0000 19 37 0 2.99 0.4609
M16 St Peters Marina 37 2 Bs2, HB 0.279 0.0037 33 38 0 2.81 0.3776
M17 Barra Strait Marina 41 2 Bs2, Bs8 0.139 0.0003 38 32 0 2.57 0.4420
M18 Baddeck Marine and Bras d’Or Yacht Club* 37 2 Bs2, Bs8 0.054 0.0001 30 36 1 2.76 0.4230
M19 Cape Breton Boat Yard and Inverary resort* 39 1 Bs2 0.000 0.0000 26 27 1 2.36 0.3909
M20 Whycocomagh Harbour 37 2 Bs2, Bs8 0.468 0.0009 31 29 0 2.58 0.3946
M21 Ross Ferry Marina 37 2 Bs2, Bs8 0.054 0.0001 22 31 0 2.64 0.4447
Total 719 6 0.294 0.0079 599 67 7 2.93 0.4627
*Multiple ports or marinas are pooled together when short geographical distances separated the shipping and ⁄ or boating traffic.
4230 A. LACOURSI E RE- ROUSSEL E T A L.
preserved in 95–100% ethanol prior to genetic analyses.
Genomic DNA (gDNA) was extracted from four to six
zooids following Elphinstone et al. (2003).
DNA amplification, sequencing and genotyping
Mitochondrial DNA. A partial sequence of the COI gene
was amplified using the universal primers LCO1490 and
HCO2198 (Folmer et al. 1994). Because these primers
failed to amplify consistently, we designed a species-
specific primer (BsCOIR: 5¢-GTATTTTATTTTTAGAATT
TGGTCAAG-3¢), which was used with the universal
HCO2198 primer. PCR amplifications were performed
in 25 lL reaction volumes, consisting of 1· PCR
buffer (with 1.5 mM MgCl2; Genscript), 0.2 mM dNTPs,
0.4 lM of each primer, 0.5 U of Taq DNA polymerase
(Genscript), and 1 lL (c. 50–100 ng) gDNA. Thermal
cycling parameters consisted of an initial denaturation
step at 94 �C for 5 min, followed by 35 amplification
cycles (94 �C for 30 s, 50 �C for 30 s, 72 �C for 45 s), and
a final elongation step at 72�C for 5 min. PCR products
were purified using the Solid Phase Reversible Immobi-
lization method (Deangelis et al. 1995). Sequencing reac-
tions were performed using the HCO2198 primer
(Folmer et al. 1994), BigDye Terminator 3.1 chemistry,
and an ABI 3130XL automated sequencer (Applied Bio-
systems, Foster City, CA, USA). The BsCOIR primer was
used to reverse-sequence and confirms all sequences
that contained ambiguous sites. The alignment was con-
structed and edited using CODONCODE ALIGNER v. 2.0.6
(CodonCode Corporation, Dedham, MA, USA).
Microsatellites. A total of 10 polymorphic microsatellite
loci: BS321 (Pancer et al. 1994), PB29, PB49, PB41, PBC1
� 2012 Blackwell Publishing Ltd

M1
M3M2
46°N
66°W
45°N
44°N
66°W 65°W 64°W
44°N
46°N
48°N
64°W 62°W 60°W
M5
M6M7
M8M11 M12 M14M13
M21M18
M19
M20
M10M9
M4 USA
CanadaP1
P2
P3
P4
P5
P3
M10
M11M12M13
M14
B
(b)
M17
M16
M15
M16
M20P4
M19M18
M21
M17
C
(c)
Bs2
HO
Bs8
HB
Bs4
Bs16
Bs15
HA
Bs13
Bs14
(a)
P1 P2
M1
M2M3
M9
M4M5 M6 M7
M8
A
Fig. 1 (a) Site locations and relative frequencies of Botryllus schlosseri haplotypes from five ports (P; large circles) and 21 marinas (M;
small circles) in Nova Scotia, Canada. Map A shows the Open Coast region, Map B the Strait of Canso region and Map C the Bras
d’Or Lake region. Stars represent the port sampling sites.
INV ASI ON ACROSS A SHI PPING–BOATING NETWORK 4231
(Stoner et al. 1997), Bsm1, Bsm2, Bsm4, Bsm6 and Bsm9
(Molecular Ecology Resources Primer Development
Consortium et al. 2010) was examined. PCR amplifica-
tions were performed in 10 lL reaction volumes, con-
sisting of 1· PCR buffer with 1.5 mM MgCl2 (Genscript),
0.125 mM of each dNTP, 0.5 lM of each primer, 0.2 U of
Taq DNA polymerase (Genscript) and 1 lL (c. 50–
100 ng) gDNA. Forward primers were labelled with
one of four fluorophores (6FAM, VIC, NED or PET)
according to Schuelke (2000). Thermal cycling parame-
ters consisted of an initial denaturation at 95 �C for
3 min, 10 cycles of 35 s at 95 �C, 35 s at an initial
annealing temperature of 60 �C that decreased by 1 �C
in each of 10 cycles, and 45 s at 72 �C followed by 35
cycles of 35 s at 95 �C, 35 s at 52 �C, 45 s at 72 �C, and
a final extension for 10 min at 72 �C. Fragment analysis
of PCR products was performed on an ABI 3130XL
automated sequencer (Applied Biosystems), with Gene-
Scan-500 LIZ internal size standard (Applied Biosys-
tems). Individuals which failed to amplify at four or
more loci after two attempts were dropped from the
� 2012 Blackwell Publishing Ltd
data set, leaving 744 specimens for the microsatellite
data analysis. The alleles for each locus were scored
manually using GENEMAPPER� v.4.0 (Applied Biosys-
tems).
Data analysis
Within and among population diversity. Mitochondrial
DNA: Individual B. schlosseri COI haplotypes were iden-
tified using COLLAPSE v. 1.2 (Posada 2004) and arranged
using a parsimony haplotype network using TCS v. 1.21
(Clement et al. 2000). The best-fit model of nucleotide
substitution (TrN + I) was selected using MODELTEST v.
3.7 (Posada & Crandall 1998) under the Akaike Informa-
tion Criterion (AIC; Posada & Buckley 2004). Sequence
divergences between haplotypes were corrected using
the Tamura and Nei substitution model in MEGA v.4.0
(Tamura et al. 2007). Haplotype (Q) and nucleotide (p)
diversities were computed for each sampling location
using DNASP v.5 (Rozas et al. 2003). Genetic differentia-
tion among populations was examined by computing

4232 A. LACOURSI E RE- ROUSSEL E T A L.
population pairwise UST values with 10 000 permuta-
tions using ARLEQUIN v. 3.5 software (Excoffier & Lischer
2010). To test for correlation between Rousset’s (1997)
genetic distance [UST ⁄ (1 ) UST)] and geographic dis-
tances under the isolation by distance (IBD) model,
geneticists often use the Mantel test. This test was
shown by Legendre & Fortin (2010) to have lower power
than canonical redundancy analysis (RDA). Thus, the
two distance matrices were transformed into rectangular
matrices using principal coordinate analysis (PCoA) and
the relationship between these latter matrices deter-
mined using RDA. The canonical relationship (R2) was
tested with 10 000 permutations. The PCoA was com-
puted using the pcoa() function of the APE package in R
(Paradis et al. 2011), whereas the RDA test was per-
formed using the rda() function of the VEGAN package in
R (Oksanen et al. 2011). Geographic distances were cal-
culated as the minimum along-coast distances between
sampling locations estimated using GOOGLE EARTH v.4.3
(beta).
Microsatellites: Distinctiveness of specimens was eval-
uated using GENECAP (Wilberg & Dreher 2004). Confor-
mance to Hardy–Weinberg equilibrium (HWE)
expectations and linkage disequilibrium (LD) was eval-
uated for each locus and locations using 10 000 permu-
tations in GENEPOP (Raymond & Rousset 1995), with
significance levels adjusted for multiple comparisons by
sequential Bonferroni corrections (Rice 1989). The total
number of alleles (NA), private alleles (NP), allelic rich-
ness (Ar) and expected heterozygosities (HE) were calcu-
lated using FSTAT v. 2.9.3.2 (Goudet 2002). The approach
used by FSTAT to calculate Ar incorporates a rarefaction
method (Mousadik & Petit 1996) that compensates for
unequal sample sizes.
Genetic differentiation among populations was deter-
mined by calculating pairwise FST values and tested
with 10 000 permutations in ARLEQUIN. While F-statistics
use the population as the unit of comparison, the Bayes-
ian clustering approach implemented in STRUCTURE
v.2.3.1 (Pritchard et al. 2000) uses the individual as the
unit, assessing whether it belongs to one or more
genetic clusters (K), irrespective of sampling location.
For the STRUCTURE analysis, we assessed likelihoods for
models with K ranging from 1 to 26 (total sites). We
used the admixture model, with correlated allele fre-
quencies and no prior population information. For each
value of K, we carried out five independent Markov
Chain Monte Carlo (MCMC) runs, with 105 iterations
discarded as burn-in followed by an additional 106 iter-
ations. We chose the optimal K by comparing the log-
likelihood of the data given the number of clusters
[ln P(X|K)] (Pritchard et al. 2000) and by examining the
standardized second-order rate change of ln P(X|K),
DK, as per Evanno et al. (2005). The STRUCTURE results
were displayed graphically using DISTRUCT v. 1.1 (Rosen-
berg 2004). IBD was first evaluated from the fitted curve
for Rousset’s (1997) genetic distance as a function of
geographic distances obtained from a general additive
model using the MGCV package in R. Models were com-
pared using the maximum likelihood AIC. The depen-
dence predicted under IBD between Rousset’s (1997)
genetic distance [FST ⁄ (1 ) FST)] and geographic dis-
tances was tested by transforming the two distance
matrices into rectangular matrices by PCoA and evalu-
ating the relationship between them using RDA. The
canonical relationship (R2) was tested using 10 000 per-
mutations. PCoA and the RDA test were computed
using R functions as described earlier.
Human vector and intrapopulation variability
Variation in genetic diversity between populations in
ports and marinas was first compared using Student’s
t-test with all regions confounded, and a two-way
fixed-effect ANOVA to test for the effect of regions (ports
vs. marinas X regions). Genetic diversity was obtained
from haplotype, nucleotide diversities, allelic richness
and expected heterozygosity. The interdependence
between port and marina populations was tested from
the relationship between genetic differentiation (esti-
mated by pairwise FST) and geographic distances for
each marina and the nearest port. The relationship
between propagule pressure from human vectors and
genetic diversity was tested by linear regression of the
number of international ship arrivals (natural loga-
rithm-transformed) and the averaged number of boats
per marina in 2009. The number of ship arrivals
included international merchant and non-merchant ves-
sels reported to Transport Canada and the Canadian
Coast Guard (S. Bailey, unpublished). The number of
boats in marinas was estimated as the average number
of boats counted in each marina during each of three
visits (in June, August and October 2009).
Population similarity from boating connectivity
Boating patterns were first obtained from questionnaires
asked directly to 37 marina managers randomly distrib-
uted among the total of about 50 marinas in Nova Sco-
tia. Questions targeted were as follows: (i) How many
berths within the marina? and (ii) How many visitors
within the last 5 years? The relationship between Rous-
set’s genetic distance and marina connectivity by recrea-
tional boats and geographic proximity was evaluated
using partial RDA, as recommended by Legendre &
Fortin (2010), after the distance matrices were trans-
formed into rectangular matrices by PCoA. The connec-
tivity between pairs of marinas was estimated by
� 2012 Blackwell Publishing Ltd

INV ASI ON ACROSS A SHI PPING–BOATING NETWORK 4233
completing a total of 374 interviews with boat owners
from 37 marinas in Nova Scotia between June and Octo-
ber 2009 (the boating season is limited to between May
and October). Questions identified which marinas the
owners had visited during the 6 months preceding the
study. As interviews were carried out only with boaters
who were present during at least one of four sporadic
visits made to the marinas, there was probably a bias of
targeting boats that are frequently occupied. Supple-
mentary details about the questionnaire and specific
patterns of boating activities in Nova Scotia are given in
Lacoursiere-Roussel et al. (2012). Connectivity was esti-
mated as the number of trips recorded between pairs of
marinas. Trips between marina pairs were assumed to
be independent. Because of the great geographical dis-
tances separating populations in eastern and western
Nova Scotia, the difference between the eastern and
western regions was represented by a binary variable in
the RDA, whereas the relationships among pairs of sites
within each region were represented by MEM spatial
eigen functions (Dray et al. 2006).
Fig. 2 Parsimony network for mtDNA haplotype of Botryllus
schlosseri sampled in ports and marinas in Nova Scotia, Can-
ada. Circles show sampled haplotypes, with circle size propor-
tional to haplotype frequency. Haplotype numbers correspond
to previous records (see text). Lines represent one mutation
and small black dots depict hypothetical haplotypes that are
not present in the data set. Asterisks denote private haplotypes
sampled in ports. Colour code is as per Fig. 1.
Results
Population diversity and differentiation
Mitochondrial DNA. Partial COI sequences were
obtained for 868 Botryllus schlosseri individuals, includ-
ing 149 from ports, and 719 from marinas (Table 1).
After alignment and trimming, a final length of 524 bp
was used. Ten haplotypes were observed within the
data set. Among these, Bs2 and Bs4 have previously
been reported from Nova Scotia, Bs8 from Washington
(USA), HA and HO from both Nova Scotia and Europe,
and HB from Europe (Lopez-Legentil et al. 2006;
Lejeusne et al. 2011). The remaining four haplotypes
(Bs13–Bs16; GenBank accession numbers: JN561069–
JN561072) are new. Sequence divergence between
haplotypes ranged from 0.2% to 4.7%. The statistical
parsimony network confirmed the generally high
sequence divergence and revealed the existence of 28
different mutational steps between the 10 haplotypes
(Fig. 2). Haplotypes Bs4, Bs13, Bs15 and Bs16 were the
only private haplotypes and were found within two
populations sampled in ports. Haplotype Bs2 was the
most common in Nova Scotia (76.38%), and was found
in all the populations surveyed (Table 1). The second
most common haplotype was HO (18.20%), followed by
Bs8 (2.65%), Bs14 (1.15%), HB (0.92%) and HA (0.23%).
Moderate genetic structure was observed within the
data set, with 25.6% of pairwise UST values remaining
significant after sequential Bonferroni correction
(Appendix S1, Supporting information). The spatial
distribution of haplotypes was marked by a geographic
� 2012 Blackwell Publishing Ltd
discontinuity. For instance, HA, Bs8 and HB were
shared between populations separated by 663, 724 and
1144 km, respectively (Fig. 1; Table 1). Test of canoni-
cal R2 in RDA showed that the IBD model was not sig-
nificant (P > 0.1).
Microsatellites. Genotypes were obtained for 744 B. sch-
losseri individuals, including 145 from ports and 599
from marinas (Table 1). A total of 77 alleles were recov-
ered from among the 10 nuclear microsatellite loci. Clo-
nal genotypes were found in populations that were far
apart (Appendix S2, Supporting information) and devi-
ations from HWE were observed at multiple loci and
sampling locations. However, there were no systematic
deviations from HWE for loci across populations or at
all loci within populations (Appendices S2 and S3, Sup-
porting information). No linkage disequilibrium was
detected, confirming that each of the 10 microsatellite
100%
50%
0%
M1 M2 M3 M4 M5 M6 M7 M8 M9 M10 M11 M12 M13 M14 M15 M16 M17 M18 M19 M20 M21 5P4P3P1P P2
Open coast region Strait of Canso Bras d’Or Lake
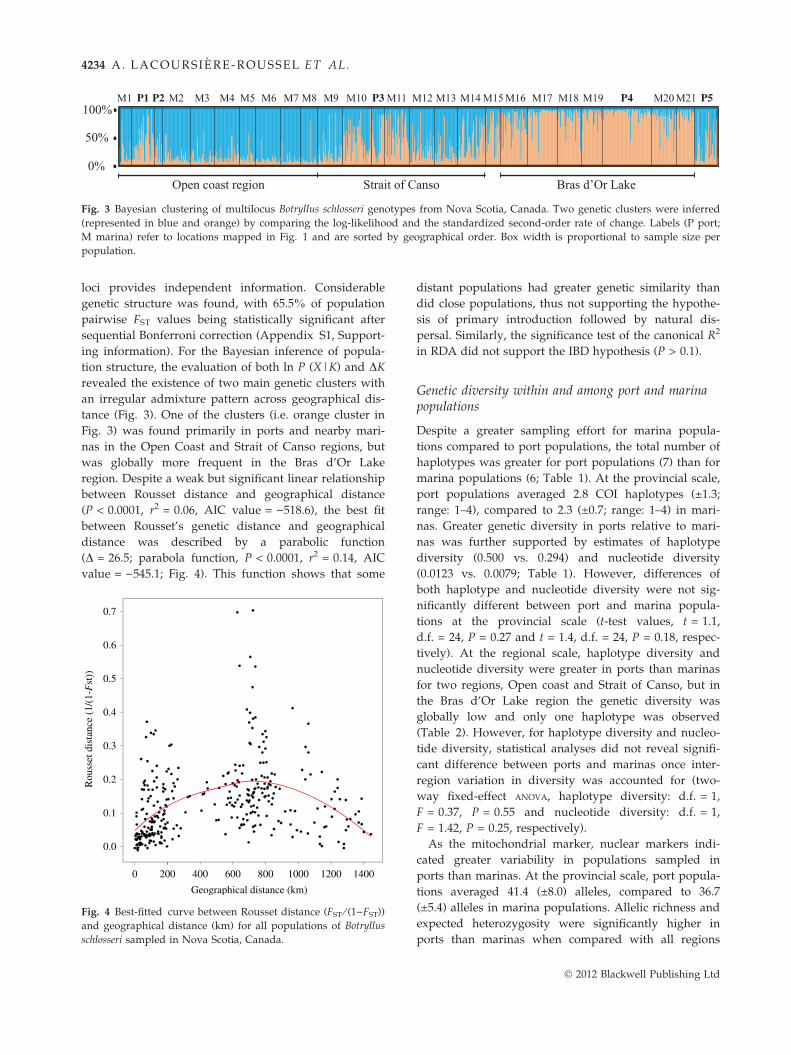
Fig. 3 Bayesian clustering of multilocus Botryllus schlosseri genotypes from Nova Scotia, Canada. Two genetic clusters were inferred
(represented in blue and orange) by comparing the log-likelihood and the standardized second-order rate of change. Labels (P port;
M marina) refer to locations mapped in Fig. 1 and are sorted by geographical order. Box width is proportional to sample size per
population.
4234 A. LACOURSI E RE- ROUSSEL E T A L.
loci provides independent information. Considerable
genetic structure was found, with 65.5% of population
pairwise FST values being statistically significant after
sequential Bonferroni correction (Appendix S1, Support-
ing information). For the Bayesian inference of popula-
tion structure, the evaluation of both ln P (X|K) and DK
revealed the existence of two main genetic clusters with
an irregular admixture pattern across geographical dis-
tance (Fig. 3). One of the clusters (i.e. orange cluster in
Fig. 3) was found primarily in ports and nearby mari-
nas in the Open Coast and Strait of Canso regions, but
was globally more frequent in the Bras d’Or Lake
region. Despite a weak but significant linear relationship
between Rousset distance and geographical distance
(P < 0.0001, r2 = 0.06, AIC value = )518.6), the best fit
between Rousset’s genetic distance and geographical
distance was described by a parabolic function
(D = 26.5; parabola function, P < 0.0001, r2 = 0.14, AIC
value = )545.1; Fig. 4). This function shows that some
Geographical distance (km)
800 12000 400
Rou
sset
dis
tanc
e (1
/(1-
Fst
))
0.0
0.1
0.2
0.3
0.4
0.5
0.6
0.7
200 600 1000 1400
Fig. 4 Best-fitted curve between Rousset distance (FST ⁄ (1)FST))
and geographical distance (km) for all populations of Botryllus
schlosseri sampled in Nova Scotia, Canada.
distant populations had greater genetic similarity than
did close populations, thus not supporting the hypothe-
sis of primary introduction followed by natural dis-
persal. Similarly, the significance test of the canonical R2
in RDA did not support the IBD hypothesis (P > 0.1).
Genetic diversity within and among port and marinapopulations
Despite a greater sampling effort for marina popula-
tions compared to port populations, the total number of
haplotypes was greater for port populations (7) than for
marina populations (6; Table 1). At the provincial scale,
port populations averaged 2.8 COI haplotypes (±1.3;
range: 1–4), compared to 2.3 (±0.7; range: 1–4) in mari-
nas. Greater genetic diversity in ports relative to mari-
nas was further supported by estimates of haplotype
diversity (0.500 vs. 0.294) and nucleotide diversity
(0.0123 vs. 0.0079; Table 1). However, differences of
both haplotype and nucleotide diversity were not sig-
nificantly different between port and marina popula-
tions at the provincial scale (t-test values, t = 1.1,
d.f. = 24, P = 0.27 and t = 1.4, d.f. = 24, P = 0.18, respec-
tively). At the regional scale, haplotype diversity and
nucleotide diversity were greater in ports than marinas
for two regions, Open coast and Strait of Canso, but in
the Bras d’Or Lake region the genetic diversity was
globally low and only one haplotype was observed
(Table 2). However, for haplotype diversity and nucleo-
tide diversity, statistical analyses did not reveal signifi-
cant difference between ports and marinas once inter-
region variation in diversity was accounted for (two-
way fixed-effect ANOVA, haplotype diversity: d.f. = 1,
F = 0.37, P = 0.55 and nucleotide diversity: d.f. = 1,
F = 1.42, P = 0.25, respectively).
As the mitochondrial marker, nuclear markers indi-
cated greater variability in populations sampled in
ports than marinas. At the provincial scale, port popula-
tions averaged 41.4 (±8.0) alleles, compared to 36.7
(±5.4) alleles in marina populations. Allelic richness and
expected heterozygosity were significantly higher in
ports than marinas when compared with all regions
� 2012 Blackwell Publishing Ltd

Table 2 Genetic diversity values for Botryllus schlosseri in port
(P) and marina (M) locations pooled for each of three main
regions in Nova Scotia, Canada (see text). The diversity indices
considered are: haplotype diversity (Q), nucleotide diversity
(p), allelic richness (Ar) and expected heterozygosity (HE)
Region
Port vs.
marina Q p Ar HE
Open coast P 0.434 0.0137 3.81 0.5657
M 0.400 0.0121 2.95 0.4720
Strait of Canso P 0.608 0.0179 3.44 0.5822
M 0.331 0.0108 3.22 0.5012
Bras d’Or Lake P 0.000 0.0000 2.66 0.4604
M 0.166 0.0009 2.62 0.4121
INV ASI ON ACROSS A SHI PPING–BOATING NETWORK 4235
confounded (t-test values, t = 2.1, d.f. = 23, P = 0.05 and
t = 2.9, d.f. = 24, P = 0.007, respectively; Table 1), and
once inter-region variation in diversity was accounted
for (two-way fixed-effect ANOVA, d.f. = 1, F = 7.58,
P = 0.014 and d.f. = 1, F = 12.36, P = 0.002 respectively;
see Table 2 and Fig. 5).
Comparing the pairs formed by each marina and the
nearest port, a highly significant linear relationship was
detected between the genetic similarity (pairwise FST) of
tunicate populations and geographical distance
(r2 = 0.66, P < 0.001; Fig. 6). At the provincial scale,
despite the low number of ports that gave extremely
low power to the tests, a positive linear relationship
between genetic diversity and the number of interna-
tional ship arrivals was significant for haplotype diver-
sity (r2 = 0.77, P < 0.05) and there was a similar but not
statistically significant trend for nucleotide diversity
and expected heterozygosity (r2 = 0.67, P = 0.09 and
r2 = 0.75, P = 0.06, respectively). The relationship
between the number of boats in marinas and genetic
diversity at the provincial scale was only significant for
nucleotide diversity (r2 = 0.20, P = 0.04); within regions,
the number of boats within marinas was a poor predic-
tor of genetic diversity (P > 0.1 in all cases).
Strait oOpen coast region
P1 P2 P3
Fig. 5 Expected heterozygosity (black) and allelic richness (grey) in
Nova Scotia, Canada. Details on sampling locations are given in Fig.
� 2012 Blackwell Publishing Ltd
Population connectivity from boating activity
The open coast region is the largest region in Nova
Scotia (N = 20 marinas), averaging 84.4 berths per marina
and 66.1 boat visitors per year per marina. Marinas
within the Strait of Canso averaged 34.7 berths and 46.9
visitors per year (N = 7 marinas). In contrast, Bras d’Or
Lake is a small highly visited region, averaging 22.7
berths per marina but 248 visitor per year per marina
(N = 10 marinas). After excluding boats that did not
visit at least two sampled populations, a total of 285
questionnaires were used to test the relationship
between boat connectivity among populations and
genetic population similarity (test of canonical R2 in
RDA). We obtained a total of 503 marina pair records.
At the provincial scale, total variation of the model was
0.72 and population similarity was mainly controlled by
the east–west factor (R2adj = 0.20, P < 0.01). Both geo-
graphical proximity and boat connectivity failed to
explain a significant proportion of population genetic
similarity (P > 0.1, R2adj = )0.03 and P > 0.1, R2
adj = 0.08,
respectively). At the regional scale, the total variance of
the model was 0.16, 0.01 and 0.03 for the Open Coast,
Strait of Canso and Bras d’Or Lake regions, respec-
tively. Within regions, geographical proximity was also
not significant for any region and no trends were
apparent except for Bras d’Or Lake (Open Coast:
P = 0.44, R2adj = 0.07; Strait of Canso: P = 0.57,
R2adj = )0.04; and Bras d’Or Lake: P = 0.12, R2
adj = 0.67).
Except for the semi-enclosed environment of the Bras
d’Or Lake region, the influence of boating connectivity
better explained the similarity among populations than
did geographic proximity (Open Coast: P = 0.09,
R2adj = 0.65; Strait of Canso: P = 0.19, R2
adj = 0.48; and
Bras d’Or Lake P = 0.47, R2adj = 0.38).
Discussion
Both mitochondrial and nuclear markers provided evi-
dence that multiple cryptic primary introduction events
Bras d’Or Lakef Canso
P4 P5
marina (M) and port (P) populations of Botryllus schlosseri in
1 and Table 1.

Geographical distance from nearest port (km)
200 3001000
0.15
0.10
0.05
0.00
Pair
wis
e F
st
Fig. 6 Plot of pairwise FST to the geographical distance (km)
between marina and nearest port population pairs (r2 = 0.66,
P < 0.001).
4236 A. LACOURSI E RE- ROUSSEL E T A L.
of Botryllus schlosseri have occurred in Nova Scotia. This
hypothesis is supported by (i) heterogeneity of geo-
graphical admixture between Bayesian clusters and (ii)
the geographical pattern of several distinct hotspot pop-
ulations. In the specific case of B. schlosseri, high hetero-
zygote deficiency had been globally observed (i.e.
United States, Israel, Croatia, New Zealand, France,
Portugal and UK; Stoner et al. 1997, 2002; Pancer et al.
1994; Ben-Shlomo et al. 2001; Rinkevich et al. 2001; Paz
et al. 2003) and deviations from HWE have been sug-
gested to be a result of substructured populations
and ⁄ or non-random matting characteristics, which does
not support the hypothesis of multiple introductions
(Chakraborty & Jin 1992; Ben-Shlomo et al. 2001).
Despite a lower sampling effort in ports than in mari-
nas, hotspot populations characterized by high genetic
variability and private haplotypes and alleles (>2 pri-
vate alleles) were only detected in populations exposed
to shipping activities (i.e. sites P1, P3, and P5). These
three populations were within invaded ports exposed
to the highest level of shipping activity in Nova Scotia.
P1, P3 and P5 received 178, 453 and 108 international
ship arrivals in 2007, respectively, while P2 and P4
received only 56 and 27 arrivals, respectively (S. Bailey,
unpublished). This provides evidence that ships were
the main vectors of the B. schlosseri introductions on the
east coast of Canada. More generally, the results also
support the importance of propagule pressure associ-
ated with shipping activity, suggesting that the greater
the shipping activity, the greater the propagule pres-
sure, and the greater the probability of successful estab-
lishment occurring in favourable environments
(Lockwood et al. 2005; Von Holle & Simberloff 2005;
Davidson et al. 2008).
Few marinas showed genetic characteristics of popu-
lations associated with primary introductions. Although
most data suggest that primary introduction occurs in
ports, the relatively high level of genetic diversity and
the presence of private alleles in some marinas (e.g. M3,
M16, M18) is also consistent with the scenario of
primary introductions occasionally occurring through
recreational boating. Marina M3 received 205 visitors
per year on average, making it one of the most visited
marinas within Nova Scotia. Three other sampled mari-
nas also experienced relatively high levels of boating
activity, including M18 (1550 visitors), M16 (727 visi-
tors) and M6 (280 visitors). This again highlights the
potential importance of propagule pressure to the intro-
duction of B. schlosseri.
Results presented here further suggest that ports act
as invasion hubs from which populations undergo sec-
ondary spread to nearby marinas. Marina populations
typically showed lower genetic diversity relative to port
populations. This finding, together with the high simi-
larity between marinas and the nearest port popula-
tions, supports the hypothesis of a dependency of
marina populations on populations colonized previ-
ously within ports. When shipping and boating net-
works determine population dynamics, weak
relationships between the age of introduction and
genetic diversity may be found (Goldstien et al. 2011).
Except for the semi-closed Bras d’Or Lake region, natu-
ral spread—evaluated as the correlation between geo-
graphical proximity and genetic similarity—did not
seem to be important to the spread of B. schlosseri,
whereas there was a trend for boating connectivity to
explain population similarity within regions. Given the
observed rapid intra-coastal dispersal (Lambert & Lam-
bert 1998), results from boat fouling surveys (Laco-
ursiere-Roussel et al. 2012) and the low natural
dispersal of tunicates (Svane & Young 1989; Ayre et al.
1997), this suggest that recreational boats are the most
likely vector for the spread of B. schlosseri among mari-
nas. The other main putative vector for the spread of
exotic species in coastal areas, bivalve aquaculture
(McKindsey et al. 2007), is likely not locally important
as aquaculture is not well developed in the study area,
culture sites are relatively distant from marinas, stock
transfers are limited (about 20 per year in the province,
including scientific permits), and stock and associated
equipment must be cleaned prior to transfer. Our
results suggest that modelling population connectivity
because of recreational boats could be improved by
integrating trip directionality and seasonal patterns of
boat trips. The latter may also alter the risk of spread-
ing biofouling species by altering boating trends and
establishment probability because of seasonal variability
of environmental conditions and hull biofouling on rec-
reational boats (Lacoursiere-Roussel et al. 2012).
Sudden and strong dominance by a species may
result from Allee effects, biotic interactions, spatial and
� 2012 Blackwell Publishing Ltd

INV ASI ON ACROSS A SHI PPING–BOATING NETWORK 4237
temporal environmental heterogeneity (e.g. warming
trends; Stachowicz et al. 2002), adaptation (Sax &
Brown 2000), and ⁄ or multiple introductions (Lee 2002;
Roman & Darling 2007; Roman 2011). The mechanisms
by which genetic diversity shapes invasion success is
currently a subject of much debate (Roman & Darling
2007). Multiple introductions may alter invasiveness by
sustaining population viability (by overcoming genetic
drift and inbreeding effects), respond to selection (new
pre-adapted traits) and ⁄ or improve adaptation to new
environments (Frankham et al. 2002; Kolbe et al. 2007;
Roman & Darling 2007; Facon et al. 2008; Roman 2011).
Some successful invasions have, however, resulted from
single founding events because of the selection of
advantageous features (Ross & Keller 1995; Ross et al.
1996; Tsutsui et al. 2000). The results reported in the
present study are consistent with range expansion due
to multiple cryptic introductions.
Simple estimates of species abundances in different
locations typically suggested insight into the identifica-
tion of potential vectors, as abundance is logically a
function of propagule pressure. However, here we
underline that high local abundance of B. schlosseri has
been found even at very low genetic diversity. For
example, in M20, although genetic diversity was low
(Table 1), the average cover of B. schlosseri on collector
plates was 92.7%. At a local scale, high genetic diver-
sity associated with multiple introductions may hence
not be essential for successful invasion by the colonial
tunicate. Surprisingly, the relationship between domi-
nance (calculated from the average cover of B. schlosseri
for each location) and allelic richness was significant
and negative (P = 0.03 and R2adj = 0.15). Similarly,
B. schlosseri was almost absent from Halifax, one of the
main commercial ports in eastern Canada. In Nova Sco-
tia, as the observed genetic diversity was low compared
to the native area (i.e. Lopez-Legentil et al. (2006) found
16 haplotypes within 181 individuals throughout
Europe vs. 10 haplotypes among 868 individuals in the
present study), continual maritime transport will proba-
bly increase genetic diversity over time. Sustained ship-
ping–boating activities may nevertheless facilitate the
introductions of B. schlosseri within uninvaded areas
and alter its abundance. As the probability of a boat
becoming colonized is a function of abundance within
source regions (Lacoursiere-Roussel et al. 2012), a better
understanding of anthropogenic effects on population
dynamics is fundamental to mitigating the propagation
of invasive species.
The probability that multiple vectors interact within
the invasion process increases when species traits allow
for a range of pathways to result in introductions. Bal-
last water, hull biofouling, sea chests, ballast tank sedi-
ments and sediments associated with anchors, and
� 2012 Blackwell Publishing Ltd
anchor chains are all potential constituents of a path-
way linking multiple shipping activities (Carlton 1985;
Eldredge & Carlton 2002; Gollasch 2002; Godwin et al.
2004). For B. schlosseri, the longer survivorship of buds
(bud life was estimated to up to 150 days when unat-
tached and 35 days when attached; Rabinowitz &
Rinkevich 2004) suggests that hull biofouling and float-
ing debris and buds in ballast tanks are a more proba-
ble pathways of introduction than are larvae in ballast
tanks (free-swimming larvae generally survive <36 h
and seem better adapted for site selection and settle-
ment than dispersal; Berrill 1950). During an eastern
Canadian ship survey, B. schlosseri was not observed
either in ballast water (Humphrey 2008) or as hull bio-
fouling on ships (Sylvester et al. 2011). Further vector
studies are hence fundamental to (i) better understand-
ing the complete pathway of dispersal, (ii) develop ade-
quate management strategies and (iii) interpret
population structure considering that the level of propa-
gule release may vary greatly among pathways (Voisin
et al. 2005).
The invasion pattern observed in eastern Canada
may also be driven by unknown seasonal effects on
population dynamics (Carver et al. 2006). Winter may
have pronounced effect on genetic variability of bio-
fouling species by altering reproductive patterns (Millar
1971; Grosberg 1988), natural larval dispersal distance
(David et al. 2010) and survivorship because of low
water temperature (Skerman 1958; Ben-Shlomo et al.
2001), ice cover and artificial structure removal (e.g.
floating docks in marinas are removed each winter).
Moreover, in the realm of maritime transport in eastern
Canada, although primary introductions from ships
may occur during winter, recreational boating activity
is virtually absent at this time (October through May).
Cold winters may thus increase the importance of the
role of shipping relative to that of boating for primary
introductions in the region. Decreasing latitudinal
genetic diversity has been observed for B. schlosseri
along European Atlantic Coasts but it had been previ-
ously suggested to be a consequence of Pleistocene gla-
ciations (Ben-Shlomo et al. 2006). The winter effect on
marine fouling populations has not been well investi-
gated and thus cannot be considered further in this
case study.
Targeting source location(s), pathway(s) and vector(s)
is essential for successful management of invasive spe-
cies (Grosholz 2002; David & Gollasch 2008). Our
results indicate that frequent introductions of B. schlos-
seri arose from commercial ships and that secondary
spread occurred gradually thereafter around individual
ports via boating. This conclusion is likely to be
applicable to invasive dispersal processes that may
occur for many other marine biofouling organisms. The

4238 A. LACOURSI E RE- ROUSSEL E T A L.
interaction of multiple human vectors may have greatly
promoted the global expansion of B. schlosseri. The
present study shows that even when high dominance
may occur at low genetic diversity, interactions among
multiple human activities may quickly promote species
dominance at large scale. Such a gene flow demon-
strates that the interaction among human vectors may
sustain population connectivity and lead to successful
invasion.
Acknowledgements
We thank Tanya Hansen, Maryse Plante-Couture, Raphael
Estrada Anaya, Sophie Comtois, Jean-Charles Fleurent, Katie
Kenny-Foeldessy, Claude Nozeres and Francois Roy for their
essential help to collect specimens and distribute question-
naires. Benedikte Vercaemer, Dawn Sephton and Joanne Keays
helped with field set-up. Corey Chivers and Sharyn Goldstien
provided statistical support and insightful comments, respec-
tively. We thank managers of marinas for their help and for
giving us permission to distribute questionnaires, and also to
boat owners for filling out the surveys on a voluntary basis.
We also thank anonymous reviewers for useful comments.
Funding for this study was provided by the NSERC Canadian
Aquatic Invasive Species Network (CAISN), Fisheries and
Ocean Canada, and an NSERC discovery grant to MEC. ALR
was further supported by scholarships from McGill University,
Quebec-Ocean and Fonds de recherche sur la nature et les
technologies (FQRNT).
References
Allendorf FW, Lundquist LL (2003) Introduction: population
biology, evolution, and control of invasive species.
Conservation Biology, 17, 24–30.
Ayre DJ, Davis AR, Billigham M, Llorens T, Styan C (1997)
Genetic evidence for contrasting patterns of dispersal in
solitary and colonial ascidians. Marine Biology, 130, 51–61.
Ben-Shlomo R, Douek J, Rinkevich B (2001) Heterozygote
deficiency and chimerism in remote populations of a
colonial ascidian from New Zealand. Marine Ecology Progress
Series, 209, 109–117.
Ben-Shlomo R, Paz G, Rinkevich B (2006) Postglacial-period
and recent invasions shape the population genetic of
Botryllid ascidians along European Atlantic Coasts.
Ecosystem, 9, 1118–1127.
Berrill NJ (1950) The Tunicata. With an Account of the British
Species. Ray Society, London.
Bock DG, Zhan A, Lejeusne C, MacIsaac HJ, Cristescu ME
(2011) Looking at both sides of the invasion: patterns of
colonization in the violet tunicate Botrylloides violaceus.
Molecular Ecology, 20, 503–516.
Bock DG, MacIsaac HJ, Cristescu ME (2012) Multilocus genetic
analyses differentiate between widespread and spatially
restricted cryptic species in a model ascidian. Proceedings of
the Royal Society B-Biological Sciences, 279, 2377–2385.
Broekhuysen GJ (1936) On development, growth, and
distribution of Carcinus maenas (L.). Archives Neerlandaises de
Zoologie, 2, 257–339.
Carlton JT (1985) Trans-oceanic and interoceanic dispersal of
coastal marine organisms – the biology of ballast water.
Oceanography and Marine Biology: An Annual Review, 23, 313–
371.
Carlton JT (1996) Biological invasions and cryptogenic species.
Ecology, 77, 1653–1655.
Carlton JT (2003) Community assembly and historical
biogeography in the North Atlantic Ocean: the potential role
of human-mediated dispersal vectors. Hydrobiologia, 503, 1–8.
Carlton JT (2005) Setting Ascidian invasions on the global
stage. Proceedings of the International Invasive Sea Squirt
Conference. Woods Hole Oceanographic Institution, Woods
Hole, Massachusetts.
Carlton JT, Geller JB (1993) Ecological roulette: the global
transport of nonindigenous marine organisms. Science, 261,
78–82.
Carver CE, Mallet AL, Vercaemer B (2006) Biological synopsis
of the colonial tunicates, Botryllus schlosseri and Botrylloides
violaceus. Canadian Manuscript Report of Fisheries and Aquatic
Sciences, 2747, v + 42.
Casas-Monroy O, Roy S, Rochon A (2011) Ballast sediment-
mediated transport of non-indigenous species of
dinoflagellates on the East Coast of Canada. Aquatic
Invasions, 3, 231–248.
Chakraborty R, Jin L (1992) Heterozygote deficiency,
population substructure and their implications in DNA
fingerprinting. Human Genetics, 88, 267–272.
Clarke Murray C, Pakhomov EA, Therriault TW (2011)
Recreational boating: a large unregulated vector transporting
marine invasive species. Diversity and Distributions, 17, 1161–
1172.
Clement M, Posada D, Crandall KA (2000) TCS: a computer
program to estimate gene genealogies. Molecular Ecology, 9,
1657–1659.
David M, Gollasch S (2008) EU shipping in the dawn of
managing the ballast water issue. Marine Pollution Bulletin,
56, 1966–1972.
David GK, Dustin JM, Riginos C (2010) Latitudinal variability
in spatial genetic structure in the invasive ascidian, Styela
plicata. Marine Biology, 157, 1955–1965.
Davidson IC, McCann LD, Fofonoff PW, Sytsma MD, Ruiz GM
(2008) The potential for hull-mediated species transfers by
obsolete ships on their final voyages. Diversity and
Distributions, 14, 518–529.
De Tomaso AW, Weissman IL (2004) Evolution of a
protochordate allorecognition locus. Science, 303, 977.
Deangelis MM, Wang DG, Hawkins TL (1995) Solid-phase
reversible immobilization for the isolation of PCR products.
Nucleic Acids Research, 23, 4742–4743.
Dray S, Legendre P, Peres-Neto PR (2006) Spatial modelling: a
comprehensive framework for principal coordinate analysis
of neighbour matrices (PCNM). Ecological Modelling, 196,
483–493.
Dupont L, Viard F, Dowell M, Wood S, Bishop J (2009) Fine
and regional-scale genetic structure of the exotic ascidian
Styela clava (Tunicata) in southwest England, 50 years after
its introduction. Molecular Ecology, 18, 442–453.
Dupont L, Viard F, Davis MH, Nishikawa T, Bishop JDD
(2010) Pathways of spread of the introduced ascidian Styela
clava (Tunicata) in Northern Europe, as revealed by
microsatellite markers. Biological Invasions, 12, 2707–2721.
� 2012 Blackwell Publishing Ltd

INV ASI ON ACROSS A SHI PPING–BOATING NETWORK 4239
Eldredge LG, Carlton JT (2002) Hawaiian marine bioinvasions:
a preliminary assessment. Pacific Science, 56, 211–212.
Elphinstone MS, Hinten GN, Anderson MJ, Nock CJ (2003) An
inexpensive and high throughput procedure to extract and
purify total genomic DNA for population studies. Molecular
Ecology Notes, 3, 317–320.
Eriksson S, Evans S, Tallmark B (1975) On the coexistence of
scavengers on shallow, sandy bottoms in Gullmar Fjord
(Sweden). Adaptations to substratum, temperature and
salinity. Zoon, 3, 121–124.
Estoup A, Beaumont M, Sennedot F, Moritz C, Cornuet JM
(2004) Genetic analysis of complex demographic scenarios:
spatially expanding populations of the cane toad, Bufo
marinus. Evolution, 58, 2021–2036.
Evanno G, Regnaut S, Goudet J (2005) Detecting the number of
clusters of individuals using the software Structure: a
simulation study. Molecular Ecology, 14, 2611–2620.
Excoffier L, Lischer HEL (2010) Arlequin suite ver 3.5: a new
series of programs to perform population genetics analyses
under Linux and Windows. Molecular Ecology Resources, 10,
564–567.
Facon B, Pointier JP, Jarne P, Sarda V, David P (2008) High
genetic variance in life-history strategies within invasive
populations by way of multiple introductions. Current
Biology, 18, 363–367.
Floerl O (2002) Intracoastal spread of fouling organisms by
recreational vessels. PhD Thesis. James Cook University,
Townsville, Australia.
Floerl O, Inglis GJ (2003) Boat harbour design can exacerbate
hull fouling. Austral Ecology, 28, 116–127.
Floerl O, Inglis GL, Dey K, Smith A (2009) The importance of
transport hubs in stepping-stone invasions. Journal of Applied
Ecology, 46, 37–45.
Folmer O, Black M, Hoeh W, Lutz R, Vrijenhoek R (1994) DNA
primers for amplification of mitochondrial cytochrome c
oxidase subunit I from diverse metazoan invertebrates.
Molecular Marine Biology and Biotechnology, 3, 294–299.
Frankham R, Ballou JD, Briscoa DA (2002) Introduction to
Conservation Genetics. Cambridge University Press,
Cambridge, UK.
Glasby TM, Connel SD, Holloway MG, Hewitt CL (2007)
Nonindigenous biota on artificial structures: could habitat
creation facilitate biological invasions? Marine Biology, 151,
887–895.
Godwin LS, Eldredge LG, Gaut K (2004) The assessment of hull
fouling as a mechanism for the introduction and dispersal of
marine alien species in the main Hawaiian Islands. Bishop
Museum Technical Report No. 28. pp. 105. Honolulu, Hawaii.
Goldstien SJ, Schiek DR, Gemmell NJ (2010) Regional
connectivity and coastal expansion: differentiating pre-
border and post-border vectors for the invasive tunicate
Styela clava. Molecular Ecology, 19, 874–885.
Goldstien SJ, Dupont L, Viard F et al. (2011) Global
phylogeography of the widely introduced north pacific
ascidian Styela clava. PLoS ONE, 6, e16755.
Gollasch S (2002) The importance of ship hull fouling as a
vector of species introductions into the North Sea. Biofouling,
18, 105–121.
Goudet J (2002) FSTAT, A Program to Estimate and Test Gene
Diversities and Fixation Indices Version 2.9.3.2. Available from
http://www2.unil.ch/popgen/softwares/fstat.htm.
� 2012 Blackwell Publishing Ltd
Grosberg RK (1987) Limited dispersal and proximity-
dependent mating success in the colonial ascidian Botryllus
schlosseri. Evolution, 41, 372–384.
Grosberg RK (1988) Life-history variation within a population
of the colonial ascidian Botryllus schlosseri. I. The genetic and
environmental control of seasonal variation. Evolution, 42,
900–920.
Grosholz E (2002) Ecological and evolutionary consequences of
coastal invasions. Trends in Ecology & Evolution, 17, 22–27.
Hewitt CL, Gollasch S, Minchin D (2009) The vessel as a vector
– biofouling, ballast water and sediments. In: Biological
Invasions in Marine Ecosystems Ecological, Management, and
Geographic Perspectives (eds Rilov G and Crooks JA), pp. 117–
131. Springer-Verlag, Berlin, Germany.
Holland BS (2000) Genetics of marine bioinvasions.
Hydrobiologia, 420, 63–71.
Humphrey DB (2008) Characterizing ballast water as a vector for
nonindigenous zooplancton transport. MSc Thesis. University of
British Columbia, British Columbia, Canada.
International Maritime Organization (2004) International
convention for the control and management of ships’ ballast
water and sediments. Adopted 13 February 2004, pp 141.
Kolbe JJ, Larson A, Losos JB (2007) Differential admixture
shapes morphological variation among invasive
populations of the lizard Anolis sagrei. Molecular Ecology,
16, 1579–1591.
Lacoursiere-Roussel A, Forrest B, Guichard F, Piola R,
McKindsey CW (2012) Modeling biofouling from boat and
source characteristics: a comparative study between Canada
and New Zealand. Biological invasions, (in press), doi:
10.1007/s10530-012-0230-0.
Lambert G (2005) Ecology and natural history of the
protochordates. Canadian Journal of Zoology, 83, 34–50.
Lambert CC, Lambert G (1998) Non-indigenous ascidians in
southern California harbors and marinas. Marine Biology,
130, 675–688.
Lee C (2002) Evolutionary genetics of invasive species. Trends
in Ecology & Evolution, 17, 386–391.
Legendre P, Fortin M-J (2010) Comparison of the Mantel test
and alternative approaches for detecting complex
multivariate relationships in the spatial analysis of genetic
data. Molecular Ecology Resources, 10, 831–844.
Lejeusne C, Bock DG, Therriault TW, MacIsaac HJ, Cristescu
ME (2011) Comparative phylogeography of two colonial
ascidians reveals contrasting invasion histories in North
America. Biological Invasions, 13, 635–650.
Lockwood JL, Cassey P, Blackburn T (2005) The role of
propagule pressure in explaining species invasions. Trends in
Ecology & Evolution, 20, 223–228.
Lodge DM, Williams S, MacIsaac HJ et al. (2006) Biological
invasions: recommendations for US policy and management.
Ecological Applications, 16, 2035–2054.
Lopez-Legentil S, Turon X, Planes S (2006) Genetic structure of
the star sea squirt, Botryllus schlosseri, introduced in southern
European harbours. Molecular Ecology, 15, 3957–3967.
McKindsey CW, Landry T, O’Beirn FX, Davies IN (2007)
Bivalve aquaculture and exotic species: a review of
ecological considerations and management issues. Journal of
Shellfish Research, 26, 281–294.
Millar RH (1971) The biology of ascidians. Advances in Marine
Biology, 9, 1–100.

4240 A. LACOURSI E RE- ROUSSEL E T A L.
Minchin D, Floerl O, Savigny D, Occhipinti-Ambrogi A (2006)
Small craft and the spread of exotic species. In: The Ecology
of Transportation: Managing Mobility for the Environment (eds
Davenberg J and Davenport JL), pp. 99–118. Springer,
Dordrecht.
Molecular Ecology Resources Primer Development
Consortium, Abdoullaye D, Acevedo I et al. (2010)
Permanent genetic resources added to molecular ecology
resources database 1 August 2009–30 September 2009.
Molecular Ecology Resources, 10, 232–236.
Mousadik A, Petit RJ (1996) High level of genetic
differentiation for allelic richness among populations of the
argan tree [Argania spinosa (L.) Skeels] endemic to Morocco.
Theoretical and Applied Genetics, 92, 832–839.
Novak SJ, Mack RN (1993) Genetic variation in Bromus
tectorum (Poaceae): comparison between native and
introduced populations. Heredity, 71, 167–176.
Novak SJ, Mack RN (2005) Genetic bottlenecks in alien plant
species: influences of mating systems and introduction
dynamics. In: Species Invasions: Insights into Ecology,
Evolution, and Biogeography (eds Sax DF, Stachowicz JJ and
Gaines SD), pp. 201–228. Sinauer Associates, Sunderland,
Massachusetts.
Oksanen J, Blanchet G, Kindt R et al. (2011) vegan: Community
ecology package. R package version 1.17–11. Available from:
http://cran.r-project.org/package=vegan.
Pancer Z, Gershon Z, Rinkevich B (1994) Direct typing of
polymorphic microsatellites in the colonial ascidian Botryllus
schlosseri. Biochemical and Biophysical Research Communications,
203, 646–651.
Paradis E, Bolker B, Claude J et al. (2011) ape: Analyses of
phylogenetics and evolution. R package version 2.7-2. Available
from: http://cran.r-project.org/.
Paz G, Douek J, Mo C, Goren M, Rinkevich B (2003) Genetic
structure of Botryllus schlosseri (Tunicata) populations from
the Mediterranean coast of Israel. Marine Ecology Progress
Series, 250, 153–162.
Posada D (2004) COLLAPSE (Version 1.2). A Tool for
Collapsing Sequences to Haplotypes. Available from: http://
darwin.uvigo.es/.
Posada D, Buckley TR (2004) Model selection and model
averaging in phylogenetics: advantages of Akaike
Information Criterion and Bayesian approaches over
likelihood ratio tests. Systematic Biology, 53, 793–808.
Posada D, Crandall KA (1998) MODELTEST: testing the model
of DNA substitution. Bioinformatics, 14, 817–818.
Pritchard JK, Stephens M, Donnelly P (2000) Inference of
population structure using multilocus genotype data.
Genetics, 155, 945–959.
Rabinowitz C, Rinkevich B (2004) In vitro delayed senescence
of extirpated buds from zooids of the colonial tunicate
Botryllus schlosseri. Journal of Experimental Biology, 207, 1523–
1532.
Raymond ML, Rousset F (1995) GenePop (version 3.4):
population genetics software for exact test and ecumenicism.
Journal of Heredity, 86, 248–249.
Reusch TB, Bolte S, Sparwel M, Moss AG, Javidpour J (2010)
Microsatellites reveal origin and genetic diversity of
Eurasian invasions by one of the world’s most notorious
marine invader, Mnemiopsis leidyi (Ctenophora). Molecular
Ecology, 19, 2690–2699.
Rice WR (1989) Analyzing tables of statistical tests. Evolution,
43, 223–225.
Rinkevich B (2002) The colonial urochordate Botryllus schlosseri:
from stem cells and natural tissue transplantation to issues
in evolutionary ecology. BioEssays, 24, 730–740.
Rinkevich B, Paz G, Douek J, Ben-Shlomo R (2001)
Allorecognition and microsatellite allele polymorphism of
Botryllus schlosseri from the Adriatic Sea. In: The Biology of
Ascidians (eds Sawada H, Yokosawa H and Lambert CC), pp.
426–435. Springer-Verlag, Tokyo.
Roman J (2011) Diluting the founder effect: cryptic invasions
expand a marine invader’s range. Proceeding of the Royal
Society B, 273, 2453–2459.
Roman J, Darling JA (2007) Paradox lost: genetic diversity and
the success of aquatic invasions. Trends in Ecology &
Evolution, 22, 454–464.
Rosenberg NA (2004) DISTRUCT: a program for the graphical
display of population structure. Molecular Ecology Notes, 4,
137–138.
Ross KG, Keller L (1995) Ecology and evolution of social-
organization – insights from fire ants and other highly
eusocial insects. Annual Review of Ecology and Systematics, 26,
631–656.
Ross KG, Vargo EL, Keller L (1996) Social evolution in a new
environment: the case of introduced fire ants. Proceedings of
the National Academy of Sciences of the United States of America,
93, 3021–3025.
Rousset F (1997) Genetic differentiation and estimation of gene
flow from F-statistics under isolation by distance. Genetics,
145, 1219–1228.
Rozas J, Sanchez-DelBarrio JC, Messeguer X, Rozas R (2003)
DnaSP, DNA polymorphism analyses by the coalescent and
other methods. Bioinformatics, 19, 2496–2497.
Sax DF, Brown JH (2000) The paradox of invasion. Global
Ecology and Biogeography, 9, 363–371.
Schuelke M (2000) An economic method for the fluorescent
labeling of PCR fragments. Nature Biotechnology, 18, 233–234.
Sephton D, Vercaemer B, Nicolas JM, Keays J (2011)
Monitoring for invasive species tunicates in Nova Scotia,
Canada (2006–2011). Aquatic Invasions, 6, 391–403.
Skerman TM (1958) Marine fouling at the port of Lyttelton.
New Zealand Journal of Science, 1, 224–257.
Skerman TM (1960) Ship-fouling in New Zealand waters: a
survey of marine fouling organisms from vessels of the
coastal and overseas trades. New Zealand Journal of Science, 3,
620–648.
Stachowicz JJ, Terwin JR, Whitlatch RB, Osman RW (2002)
Linking climate change and biological invasions: ocean
warming facilitates nonindigenous species invasions.
Proceedings of the National Academy of Sciences of the United
States of America, 99, 15497–15500.
Stoner DS, Quattro JM, Weissman IL (1997) Highly polymorphic
microsatellite loci in the colonial ascidian Botryllus schlosseri.
Molecular Marine Biology and Biotechnology, 6, 163–171.
Stoner DS, Ben-Shlomo R, Rinkevich B, Weissman IL (2002)
Genetic variability of Botryllus schlosseri invasions to the east
and west coasts of the USA. Marine Ecology Progress Series,
243, 93–100.
Svane I, Young CM (1989) The ecology and behaviour of
ascidian larvae. Oceanography and Marine Biology: An Annual
Review, 27, 45–90.
� 2012 Blackwell Publishing Ltd

INV ASI ON ACROSS A SHI PPING–BOATING NETWORK 4241
Sylvester F, MacIsaac HJ (2010) Is vessel hull fouling an
invasion threat to the Great Lakes? Diversity and
Distributions, 16, 132–143.
Sylvester F, Kalaci O, Leung B et al. (2011) Invasion vectors:
can simple models explain a complex problem? Journal of
Applied Ecology, 48, 415–423.
Tamura K, Dudley J, Nei M, Kumar S (2007) MEGA4:
molecular evolutionary genetics analysis (MEGA) software
version 4.0. Molecular Biology and Evolution, 24, 1596–1599.
Tonione MA, Reeder N, Moritz CC (2011) High genetic
diversity despite the potential for stepping-stone
colonizations in an invasive species of gecko on Moorea,
French Polynesia. PLoS ONE, 6, e26874.
Tsutsui ND, Suarez AV, Holway DA, Case TJ (2000) Reduced
genetic variation and the success of an invasive species.
Proceedings of the National Academy of Sciences of the United
States of America, 97, 5948–5953.
Tyrrell MC, Byers JE (2007) Do artificial substrates favor
nonindigenous fouling species over native species? Journal of
Experimental Marine Biology and Ecology, 342, 54–60.
Van Name WG (1945) The north and south American ascidians.
Bulletin of the American Museum of Natural History, 84, 1–463.
Viard F, Ellien C, Dupont L (2006) Dispersal ability and
invasion success of Crepidula fornicata in a single gulf:
insights from genetic markers and larval-dispersal model.
Helgoland Marine Research, 60, 144–152.
Voisin M, Engel C, Viard F (2005) Differential shuffling of
native genetic diversity across introduced regions in a brown
alga: aquaculture vs. maritime traffic effects. Proceedings of
the National Academy of Sciences of the United States of America,
102, 5432–5437.
Von Holle B, Simberloff D (2005) Ecological resistance to
biological invasion overwhelmed by propagule pressure.
Ecology, 86, 3212–3218.
Waits LP, Luikart G, Taberlet P (2001) Estimating the
probability of identity among genotypes in natural
populations: cautions and guidelines. Molecular Ecology, 10,
249–256.
Wilberg MJ, Dreher BP (2004) GENECAP: a program for
analysis of multilocus genotype data for non-invasive
sampling and capture-recapture population estimation.
Molecular Ecology Notes, 4, 783.
Yamada SB (2001) Global Invader: the European Green Crab.
Oregon Sea Grant, Corvallis, OR.
Zalewski A, Michalska-Parda A, Bartoszewicz M, Kozakiewicz
M, Brzezinski M (2010) Multiple introductions determine the
genetic structure of an invasive species population:
� 2012 Blackwell Publishing Ltd
American mink Neovison vison in Poland. Biological
Conservation, 143, 1355–1363.
This study forms part of A.L.R’s Ph.D. project on the effect of
maritime activities on biodiversity, population connectivity and
invasion success. C.W.M. studies human - coastal ecology
issues with an emphasis on exotic species and aquaculture-
environment interactions. D.G.B. and M.E.C. are molecular
ecologist investigating the evolutionary consequences of aqua-
tic invasions. F.G. is a theoretical ecologist interested in non-
linear and spatial dynamics of coastal ecosystems. P.L. is a
quantitative ecologists who develops methods of spatial analy-
sis for numerical ecology; he also writes computer software.
P.G. is a molecular ecologist studying the impacts of local
dynamics and individual behaviours on the evolution of eco-
systems.
Data accessibility
COI sequences: Genbank accessions JN561069–JN561072.
Microsatellite data, COI data by population and by individual,
boating connectivity by population: DRYAD entry doi:10.5061/
dryad.n3v10.
Supporting information
Additional supporting information may be found in the online
version of this article.
Appendix S1 Pairwise UST (above diagonal) and FST (below
diagonal) comparisons between B. schlosseri populations
obtained for the mitochondrial COI marker (UST) and 10
nuclear microsatellite loci (FST).
Appendix S2 Clonal genotypes observed in the dataset.
Appendix S3 Genetic diversity at 10 microsatellite loci for 21
sites of Botryllus schlosseri.
Please note: Wiley-Blackwell is not responsible for the content
or functionality of any supporting information supplied by the
authors. Any queries (other than missing material) should be
directed to the corresponding author for the article.