Disdrometer Performance Optimization for Use in Urban ...
32
Prime Archives in Symmetry 1 www.videleaf.com Book Chapter Disdrometer Performance Optimization for Use in Urban Settings Based on the Parameters That Affect the Measurements Ferran Mocholí Belenguer 1 *, Antonio Martínez-Millana 2 , Antonio Mocholí Salcedo 3 , Víctor Milián Sánchez 4 and María Josefa Palomo Anaya 4 1 Traffic Control Systems Group, ITACA Institute, Universitat Politècnica de València, Spain 2 SABIEN Group, ITACA Institute, Universitat Politècnica de València, Spain 3 Department of Electronic Engineering, ITACA Institute, Universitat Politècnica de València, Spain 4 Chemical and Nuclear Engineering Department, Institute of Industrial, Radiological and Environmental Safety, Universitat Politècnica de València, Spain *Corresponding Author: Ferran Mocholí Belenguer, Traffic Control Systems Group, ITACA Institute, Universitat Politècnica de València, Valencia 46022, Spain Published January 20, 2021 This Book Chapter is a republication of an article published by Ferran Mocholí Belenguer, et al. at Symmetry in February 2020. (Mocholí Belenguer, F.; Martínez-Millana, A.; Mocholí Salcedo, A.; Milián Sánchez, V.; Josefa Palomo Anaya, M. Disdrometer Performance Optimization for Use in Urban Settings Based on the Parameters that Affect the Measurements. Symmetry 2020, 12, 303.) How to cite this book chapter: Ferran Mocholí Belenguer, Antonio Martínez-Millana, Antonio Mocholí Salcedo, Víctor Milián Sánchez, María Josefa Palomo Anaya. Disdrometer
Transcript of Disdrometer Performance Optimization for Use in Urban ...

Prime Archives in Symmetry
1 www.videleaf.com
Book Chapter
Disdrometer Performance Optimization
for Use in Urban Settings Based on the
Parameters That Affect the
Measurements
Ferran Mocholí Belenguer1*, Antonio Martínez-Millana
2,
Antonio Mocholí Salcedo3, Víctor Milián Sánchez
4 and María
Josefa Palomo Anaya4
1Traffic Control Systems Group, ITACA Institute, Universitat
Politècnica de València, Spain 2SABIEN Group, ITACA Institute, Universitat Politècnica de
València, Spain 3Department of Electronic Engineering, ITACA Institute,
Universitat Politècnica de València, Spain 4Chemical and Nuclear Engineering Department, Institute of
Industrial, Radiological and Environmental Safety, Universitat
Politècnica de València, Spain
*Corresponding Author: Ferran Mocholí Belenguer, Traffic
Control Systems Group, ITACA Institute, Universitat Politècnica
de València, Valencia 46022, Spain
Published January 20, 2021
This Book Chapter is a republication of an article published by
Ferran Mocholí Belenguer, et al. at Symmetry in February 2020.
(Mocholí Belenguer, F.; Martínez-Millana, A.; Mocholí Salcedo,
A.; Milián Sánchez, V.; Josefa Palomo Anaya, M. Disdrometer
Performance Optimization for Use in Urban Settings Based on
the Parameters that Affect the Measurements. Symmetry 2020,
12, 303.)
How to cite this book chapter: Ferran Mocholí Belenguer,
Antonio Martínez-Millana, Antonio Mocholí Salcedo, Víctor
Milián Sánchez, María Josefa Palomo Anaya. Disdrometer

Prime Archives in Symmetry
2 www.videleaf.com
Performance Optimization for Use in Urban Settings Based on
the Parameters That Affect the Measurements. In: Prime
Archives in Symmetry. Hyderabad, India: Vide Leaf. 2021.
© The Author(s) 2021. This article is distributed under the terms
of the Creative Commons Attribution 4.0 International
License(http://creativecommons.org/licenses/by/4.0/), which
permits unrestricted use, distribution, and reproduction in any
medium, provided the original work is properly cited.
Author Contributions: conceptualization, Ferran Mocholí
Belenguer, Antonio Martínez Millana and Antonio Mocholí
Salcedo; methodology, Ferran Mocholí Belenguer, Antonio
Martínez Millana and Antonio Mocholí Salcedo; software,
Ferran Mocholí Belenguer, Antonio Martínez Millana and
Antonio Mocholí Salcedo; validation, Ferran Mocholí
Belenguer, Antonio Martínez Millana, Antonio Mocholí
Salcedo,Víctor Milián Sánchez and María Josefa Palomo Anaya;
formal analysis, Ferran Mocholí Belenguer, Antonio Martínez
Millana and Antonio Mocholí Salcedo; investigation, Ferran
Mocholí Belenguer, Antonio Martínez Millana and Antonio
Mocholí Salcedo; resources, Ferran Mocholí Belenguer, Antonio
Martínez Millana and Antonio Mocholí Salcedo; data curation,
Ferran Mocholí Belenguer, Antonio Martínez Millana and
Antonio Mocholí Salcedo; writing—original draft preparation,
Ferran Mocholí Belenguer.; writing—review and editing, Ferran
Mocholí Belenguer.; visualization, Ferran Mocholí Belenguer
and María Josefa Palomo Anaya; supervision, Ferran Mocholí
Belenguer; project administration, Ferran Mocholí Belenguer;
funding acquisition, Antonio Mocholí Salcedo.
Funding: This research has been funded by the Universitat
Politècnica de València through its internal project ‘Equipos de
detección, regulación e información en el sector de los sistemas
inteligentes de transporte (ITS). Nuevos modelos y ensayos de
compatibilidad y verificación de funcionamiento', which has
been carried out at the ITACA Institute.
Conflicts of Interest: The authors declare no conflict of interest.
Prime Archives in Symmetry
3 www.videleaf.com
Abstract
There are currently different types of commercial optical
disrometers to measure the rainfall intensity, of which many are
commonly used for monitoring road conditions. Having
information about the amount of rain, the composition of the
precipitation particles and visibility are essential to avoid
accidents, which requires intelligent systems that warn drivers
and redirect traffic. However, few studies related to Intelligent
Transport Systems (ITS) have been performed, what causes that
these devices are not optimized for this type of applications.
Therefore, this paper analyzes and evaluates the operating mode
of these equipment through their theoretical model, which will
allow the design of prototypes of disdrometers with different
characteristics. In addition, this model will be implemented in a
simulation program, through which an exhaustive study
analyzing how the type of precipitation and its intensity affect
the measures provided by the model will be conducted. In this
way, the results will help optimize its operation to be thus used
in urban settings, which will allow obtaining more accurate real-
time information, better traffic management and a reduction in
the number of accidents.
Keywords
Disdrometer; Precipitation; Rain; Safety; Traffic
Introduction
For a long time, many series of rainfall records have been made
throughout the world [1,2]. These records, which are expressed
in mm or kg / m2 and collected during a certain time period, have
been useful for meteorology and climatology and are of special
interest to many sectors such as hydrology, agriculture or vehicle
traffic management systems [3]. However, although recording
the amounts of precipitation of liquids and solids constitutes a
knowledge base in several fields of study, the precipitation
intensity (PI) has become a variable of the same importance at
present.

Prime Archives in Symmetry
4 www.videleaf.com
The precipitation intensity is defined by the World
Meteorological Organization as the amount of precipitation
collected per unit time, and it is widely known that the rainfall
and snowfall intensity information is extremely relevant in cases
of severe weather [4,5]. In fact, high precipitation intensities in
the form of liquid or solid directly affect transport, since roads
and other infrastructure can be blocked in cases of insufficient
drainage and runoff [6]. Moreover, the probability of having an
accident while it rains or snows is greater than when it does not
[7], which is mainly due to the lack of visibility.
Hence, appropriate short-term forecasts could reduce these risks
and allow the sending of warnings to drivers to take precautions
or avoid certain routes. This is the reason why many types of
instruments and measuring techniques have been developed and
are in operation today. In this way, there are different types of
instrument that measure precipitation micro-physical parameters
and divide into remote sensing and in-situ [8].
Depending on how they work, all types of rain gauges can be
divided into two large groups:
Catching instruments.
No-catching instruments.
The first type catches the precipitation through a well-defined
hole size and measures the equivalent mass or volume of water
that has accumulated in a given time interval. In this sense, the
precipitation intensity is retrieved from the amount of
precipitation. On the contrary, the no-catching instruments
calculate the precipitation intensity by mathematically
integrating all particles transiting through a cross section in a
given time. Optical, acoustic and electromagnetic rain sensors
are typical examples of this group.
Nevertheless, although many calibration practices have been
developed, especially for the rain gauges of the first group, there
is currently no standard or accepted calibration reference for any
type of rain gauge. Therefore, CIMO-XIII (The Thirteenth
Session of the Commission for Instruments and Methods of

Prime Archives in Symmetry
5 www.videleaf.com
Observation) adopted the measurement range and uncertainties
related to the precipitation intensity recommended by an expert
group of researchers who published that information in the
Guide to Instruments and Methods of Observation of the World
Meteorological Organization [9]. These data are shown in Table
1.
Table 1: Uncertainties adopted by CIMO-XIII.
Full range 0.02 – 2000 mm · h-1
Rainfall threshold detected 0.02 – 0.2 mm · h-1
Output averaging time One minute
Uncertainty required in the measurement:
From 0.2 to 2 mm · h-1
From 2 to 2000 mm · h-1
0.1 mm · h-1
5%
Accordingly, as these are commonly used on roads to warn and
therefore prevent accidents accidents and there are no studies
with the purpose of optimizing their operation for these
applications, we think that there is clearly a need to have an
adaptive and optimized system capable of measuring the
intensity of precipitation meticulously depending on the type of
rain, wind and other parameters. In this way, these devices could
be adapted according to the boundary conditions, always
providing the most accurate measurements. In addition,
minimum and specific requirements could be established so that
they could be installed and used in ITS applications. These
requirements would be as follows:
It should be a simple low-cost system implemented with
commercial materials.
It should use optoelectronic systems, since the analysis
performed by many authors suggests that these systems
provide better results [10-11].
It should be capable of operating both at fixed stations in
the road network and onboard a vehicle to provide
information to the driver and activate the fog lights or
windscreen wipers when required.
There are some disdrometer models such as Parisivel that could
meet these specifications, but Grossklaus et al. [10] presented a

Prime Archives in Symmetry
6 www.videleaf.com
model of a disdrometer that satisfied these requirements in a
better way. Indeed, a few years later, the company Eigenbrodt
manufactured the optical disc ODM470 by following the
specifications indicated by them. Thus, this manuscript will
theoretically analyze the operation of this equipment and
evaluate the effects of a series of parameters on it, such as the
precipitation intensity, drop size distribution, period sampling
method, estimation method, measurement time, wind speed, type
of converter and many others. For this, a program exclusively
designed by our work group has been implemented, which
enables to simulate the behavior of the equipment by varying its
parameters.
Materials and Methods Operating Principle
The principle of operation of the aforementioned disdrometer is
the slight decrease in light intensity when the raindrops pass
through a cylindrical sensitive volume of length and diameter
[12]. At one end of the cylinder, there is a light source, which
is usually an IR LED diode with a control system that enables
the diode to maintain its level of illumination constant. At the
other end, there is a photodetector, which is a photodiode with a
signal conditioning circuit in most cases. To achieve a
homogeneously illuminated sensitive volume, a suitable optical
lens system composed of a collimator and Fresnell lens is also
required. This scheme is shown in Figure 1, which can
simultaneously measure the size and flight time of the droplets
through the sensitive volume.
Figure 1: Implementation of an optical disdrometer.

Prime Archives in Symmetry
7 www.videleaf.com
During a precipitation event, important fluctuations will be
observed in the photodetector whenever a particle interferes with
the light beam emitted by the LED. The amplitude of these
fluctuations depends on the size of the particles, while the
duration of the fluctuations is depending on raindrop fall speed.
Moreover, the number of fluctuations is proportional to the
number of particles that pass between the LED and the
photodetector. The only constraints that may occur are the
system dependence on the frequency of sampling of the signal
and the resolution in the illumination level measurement.
However, the operating ranges of different instruments and our
analysis will demonstrate that these constraints will not be an
inconvenience that limits the system operation.
Drop Size Measurement
If there is no drop inside the sensitive volume, the illumination
that reaches the photodetector will induce an output signal,
which will be taken as a reference. When raining, each drop
through the sensitive volume produces a reduction of light
received by the photodetector, and the corresponding signal is
proportional to the quotient between the area of the section-line
of the drop and the area of the section-line of the sensitive
volume. Hence, the range of amplitudes of the signal may vary
between 0 and the amplitude of the reference signal. Depending
on the type of photodetector and signal conditioning, the
magnitude to be measured can be a voltage, a current intensity or
a frequency, which also conditions the type of microcontroller to
manage the operation of the disdrometer. Nevertheless, the
maximum sensor response will occur for a particle of at least
diameter as shown in Figure 1.
The tests performed by different authors [10] show that the
homogeneity and isotropy of light in the sensitive volume are
essential for the correct interpretation of the data. Unfortunately,
most lighting sources have some anisotropy and
inhomogeneities. Thus, inhomogeneities along the length of the
optical volume such as those due to the divergence of light must
be minimized. In our model, we consider the ideal case of a

Prime Archives in Symmetry
8 www.videleaf.com
perfectly collimated source, so the errors estimated must be
improved to consider this effect.
As indicated, the slight decrease in light signal is proportional
to the quotient between the area of the section-line of the drop
and the area of the section-line of the sensitive volume.
Moreover, the optical volume sensitivity can be accurately
calibrated using metal spheres of different diameters. Figure 2
shows the relative theoretical attenuation as a function of the
quotient between the droplet diameter d and diameter of the
sensitive volume.
Figure 2: Theoretical relationship between light attenuation and the droplet
diameter.
Signal Duration Measurement
The drops that penetrate the sensitive volume are detected as
soon as the signal variation of the photodetector exceeds a
defined threshold. Thus, the microcontroller will continuously
monitor the value of this signal and indicate the instants of entry
and exit of the drop in the measurement volume.

Prime Archives in Symmetry
9 www.videleaf.com
The precision in the measurement of these times only depends on
the maximum measurement speed of the system and the
minimum variation of the signal that can be detected. Depending
on the clock frequency, hardware and implemented
programming, we will finally be able to obtain a value of the
time between measures , which represents the maximum
delay in the detection of a drop that is entering or leaving the
sensitive volume and consequently the determination of the
signal duration. In other words, the output time minus input time
in the volume has an error of . However, this error can
be considered unsystematic.
Data Processing
As long as the drops that impact tangentially on the sensitive
volume are ignored, the errors in the diameter estimation will be
conditioned by the characteristics of the measuring instrument.
The response of the photodetectors is established by the surface
covered by each drop; the cause of its variation is linked to the
square of the diameter of those drops as shown in Figure 1.
Meanwhile, conventional digital systems work with A/D
converters, whose resolution is a function of their number of bits
( ), which results in measurement levels. Then, the
surface resolution of the detector is given by
. Most
studies propose an 8-bit converter, but we will compare the
results obtained when using 8-bit and 10-bit converters.
Over time, some techniques have been proposed to estimate the
precipitation intensity from the information provided by the
sensors, but in all cases, the drops are classified according to
their size. The two most commonly used techniques are
presented below: time technique and counting technique.
Time Technique
It is known that during sampling time T, a certain number of
drops have fallen through the sensitive volume with a cumulative
transition time of ∑ . Illingworth and Stevens [13] showed that
for each droplet size, the fraction of time ∑
indicated the

Prime Archives in Symmetry
10 www.videleaf.com
number of drops directly within sensitive volume . However,
this relation is only valid if there are many raindrops evenly
distributed in space and if sampling time is large compared to
the time of the droplet transition. In this case, the number density
of raindrops is expressed as:
∑
(1)
This calculation does not depend on the wind speed because an
increase in wind speed increases the number of drops that reach
the disdrometer in the same proportion when the transit time
decreases. Meanwhile, the number density of drops is defined
by considering only those droplets whose centers are within the
volume. Thus, the time of transition of the raindrops that reach
the sensitive volume is defined as the time that passes from when
the center of a drop enters the sensitive volume to when it leaves
this volume. Then, the total duration of the signal must be
converted to transition time from the center of a drop as:
(2)
where d is the diameter of the drop and D is the diameter of the
sensitive volume.
Counting Technique
The droplet size spectra can also be determined by using the
number of drops that penetrate the sensitive volume. By knowing
local wind speed and assuming that the vertical velocity of the
raindrops is , we can calculate the effective velocities of the
drops. Length and diameter of the sensitive volume define
the area of the side view of this volume. Multiplying this
area by the effective rate of passage of the droplets of a certain
size gives an imaginary amount of air that passes through the
disdrometer during sampling time . This volume contains all
droplets of a given size that reach the sensitive volume of the
disdrometer within a sampling period:

Prime Archives in Symmetry
11 www.videleaf.com
√ [ ] (3)
The number density of drops of identical size is obtained as the
quotient of the total number of drops detected divided by volume
:
(4)
The counting technique requires more assumptions than the time
technique. For example, in this technique, the local wind speed
must be known. Nevertheless, the terminal fall rate of raindrops
can be estimated by the empiric formula [14]:
(5)
where is the diameter of the drop in centimeters, and the
resulting drop rate is obtained in . This parameterization
has been chosen against other options because it is the most
novel. However, the results do not significantly differ from those
offered by other authors [15], so any of them could be used.
To study the advantages and disadvantages of the two
techniques, numerical simulations of measurements with the
same precipitation model were performed, and the results are
shown below.
Precipitation Intensity Calculation
The precipitation intensity (PI) can be obtained from the droplet
size spectrum by applying:
∑ (6)
where is the mean mass of the droplets that are
classified within the same size. The precipitation intensity has
units of
if is given in , is measured in
,
Prime Archives in Symmetry
12 www.videleaf.com
and is measured in . The value of can
be determined by assuming a spherical shape of the drops. Thus,
it is quite simple to calculate the mass of a spherical drop from
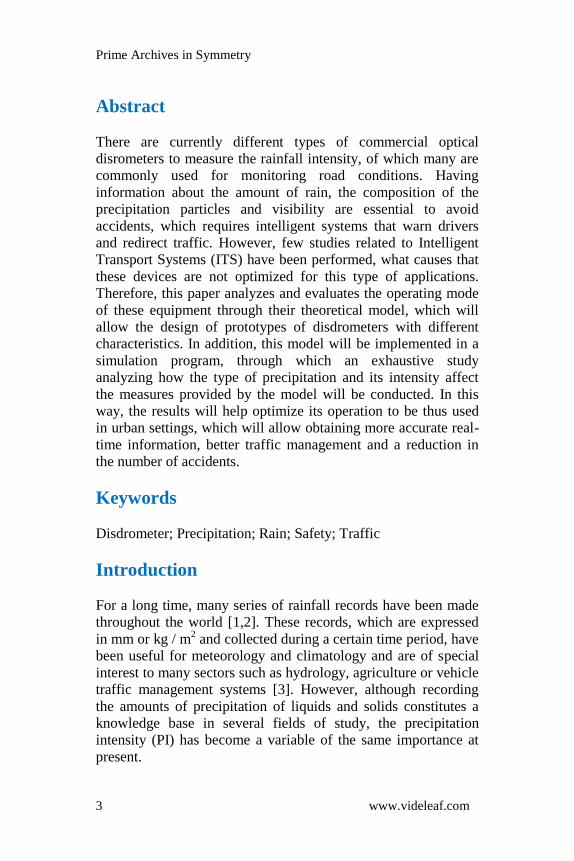
its straight section. However, large and real droplets have an
oblong shape due to their aerodynamic properties. This effect has
been analyzed [13], which verifies that the vertical cross-
sectional area of a drop decreases when it deforms (elongates),
which starts approximately for a 1,5 mm drop diameter. This
effect causes a lower estimate of the drop volume. Figure 3
shows similar results to those obtained by Pruppacher and Pitter
[16].
Figure 3: Effect of the drop oblateness.
Rain can wet the outer lenses of the disdrometer due to splashes
of large drops. The droplets that wet the lens will cause
electronic signals that will be characterized by their small
amplitudes and long durations. This type of disturbance can
cause an overestimation of the number density of small drops.
To prevent this effect, we propose to perform a special filtration.
Using this filter, those signals whose duration exceeds a defined
time period are eliminated. This threshold is set as the maximum

Prime Archives in Symmetry
13 www.videleaf.com
possible duration of the signal generated by a drop of the
detected size with respect to its terminal velocity and applying a
time factor of 1,5. The filter time is called and is adjustable
in our model, although it will not act in any case, since the
aforementioned splashes are not simulated.
Edge Effects
In the work of Grossklaus et al. [17-19] a series of phenomena
that affect rainfall estimation are presented, which are called the
edge effects.. One of these main effects is the equivocal
detection of water drops, which results in the cases detailed
below, but there are other edge effects such as those due to drops
just grazing the sensitive volume which also systematically
influence the disdrometer measurements. However, as all of
them can be described statistically, a correction is possible.
Hence, all of these effects and the techniques proposed for their
correction are considered and implemented in our model.
In normal precipitation, drops of a wide range of sizes may be
mixed. Therefore, the sensitive volume of the disdrometer should
be sufficiently large to provide a reasonable probability of
correctly measuring large droplets, which significantly
contribute to the rainfall intensity. However, only the amount of
shadow produced is measured, regardless of whether it is caused
by one or more drops on the sensitive volume at any given time.
These coincidences have two effects:
Two small drops can be detected as a larger drop. In this
case, a larger amount of water than the one that actually
contains the two smaller drops is detected.
The time of the transition detected as a consequence of
the coincidence of two drops is larger than that
corresponding to a drop of larger diameter, which
simulates a greater probability of large drops and
consequently an exaggerated contribution to the
determination of the precipitation intensity.
Nevertheless, as these effects have a systematic influence on the
measurement performed by the disdrometer, a statistical analysis

Prime Archives in Symmetry
14 www.videleaf.com
enables to correct these effects. This error variance of the
disdrometer measurements is estimated considering the
following effects that contribute to this variance [10]:
The iterative procedure to compensate for the fringe
effects is based on the assumption that these effects
occur according to their mean statistics. The Monte
Carlo studies are used to quantify the portion of the total
error variance produced by the random occurrence of the
fringe effects. This will be referred to in the following as
(fringe effects).
The Monte Carlo simulations also consider the
inhomogeneity and anisotropy of the sensitive volume.
The variance that is caused by this effect is therefore
incuded in the variance obtained from the Monte Carlo
model.
The total error variance also includes a sampling error
due to the fact that even at a constant rainfall the number
of drops penetrating the sensitive volume varies from
one measurement to another. This sampling error has not
been considered in the Monte Carlo simulations. This
variance that is only caused by the sampling error will be
called . The value of was determined analytically.
Numerical Model
To quantify the edge effects, the measurements made by the
disdrometer were numerically modeled. Hence, our research
team (Group of Traffic Control System, ITACA Institute,
Universitat Politècnica de València, Spain) designed a
simulation program in VisualBasic. This program enables to
optimize the starting geometric data, such as the diameter or
length of the sensitive volume. The maximum and minimum
values of the droplet size to be measured and the resolution in
the measurement of the diameters (number of bits of the
converter) are also adjustable.
Next, a series of data on the type of precipitation, such as the
wind speed and precipitation intensity, must be provided. Since

Prime Archives in Symmetry
15 www.videleaf.com
the droplet size distribution follows rules that depend on where
the test is performed, it was decided to use a gamma function as
law. This distribution was chosen because it was the same used
by Grossklaus et al. [17-19] and Marshall and Palmer [20] in
their studies, which has proven to describe satisfactorily the
concentrations of the smaller droplets. From this gamma
function, the parameters and must be entered, and the
system calculates the value of for the indicated precipitation
intensity. To facilitate its use, two distributions of standard
precipitation droplets, namely, stratiform and convective, are
placed. In this way, although many studies analyzed this gamma
distribution [20-25], in our study, the parameters used to
describe these spectra were taken from Ulbrich [21-22], which
can be seen in Table 2.
Table 2: Drop surface distribution parameters.
Type of precipitation N0 (m
-3cm-1-µ) µ
Convective 7.54 x 10⁶ 1.63
Stratified 1.96 x 10⁵ 0.18
The next information to be supplied is the sampling time, time
resolution and number of tests to perform. Finally, to correct
possible edge effects, the value of must also be provided
and indicate whether the effects of an excess of time of presence
of the drop and the effect of the size of the drop on the duration
time of each signal should be compensated.
With all of this information, the program begins by calculating
the drop distribution that corresponds to the indicated intensity
and type of precipitation. The distribution of droplet size in
natural rainfall is irregular. However, simple mathematical
formulas are often recommended to describe these distributions.
According to Marshall and Palmer [20], the normally used
parameterization only requires two parameters:
(7)
where is the concentration of droplets with diameters
between and ; is the cut-off point for parameter

Prime Archives in Symmetry
16 www.videleaf.com
; and is the slope parameter. Nevertheless, this
formulation does not represent a maximum of medium-sized rain
drops as occurs in actual measurements. Therefore, the
distributions of three parameters have been introduced (gamma
distributions use a third parameter that defines the shape of a
drop size distribution). In this way, Figure 4 represents the
distribution of the size of drops for different types of
precipitation, which are characterized by and , as stated in
different works such as that of Ulbrich or Martin [10].
Figure 4: Gamma function of the drop size distribution for different μ values.
Ulbrich [21-22] shows that there is a definite relationship
between parameters and . This relationship is given by:
(9)
Therefore, the gamma distribution can be described using only
two parameters.
With this information, a drop distribution is assigned according
to the size to obtain the PI specified in the data. By applying an
iterative procedure on the value of the gamma function, we
determine the number of drops that correspond to the central
value diameter of each existing band between the minimum and

Prime Archives in Symmetry
17 www.videleaf.com
maximum drop values. At the beginning of each iteration the
analytical model is initialized with a drop size distribution that is
assumed to be true. Then, the measurement of the simulated
spectrum of the disdrometer is compared with its actual
measurement. The convergence is achieved if these spectra differ
by less than 2%. A new iteration starts again after the initial
spectrum is modified according to the results of the previous
iteration. In most cases, the convergence should be achieved in
less than three iterations. The best results are achieved by using
the same drop size distribution measured as the spectrum of the
first iteration.
This number of drops is randomly assigned between the diameter
values in the considered band. For each drop, the terminal and
global velocities are determined (sum of the terminal and that
due to the wind). This step also assigns the position of the space
occupied by each of these drops at the initial time. With this
information, it is possible to obtain the moments where the drop
is in contact with the sensitive volume, which enables one to
check whether at a given time, there are simultaneously several
drops within the sensitive volume, and whether they can appear
overlapping.
From these data, the rain signal is generated and repeated as
many times as the number of trials to simulate. In our case, we
worked with 20 or 200 simulations depending on the case.
At this point, the simulation of the behavior of the disdrometer is
ready to begin. For this purpose, sampling period is divided
into subperiods of ; for each of these instants, the area
covered by the drops in the sensitive volume is determined.
Therefore, for each drop, we determine whether it is in contact,
totally or partially, with the sensitive volume.
If the drop is completely inside the sensitive volume, the surface
covered by the drop corresponds to the circle that represents its
straight section:
(
) (10)

Prime Archives in Symmetry
18 www.videleaf.com
If the drop passes while rubbing the surface or only partially
penetrates it, as shown in Figure 5, the covered surface is:
[ [
(
)
√
] [
(
)
√
]] (11)
where:
(12)
Figure 5: Representation of the surface covered by the passage of a drop
through the sensitive volume.
From the measurements of the obstructed surface at each
sampling instant and considering the resolution of the system, a
series of discrete values is obtained for the drop size (function of

Prime Archives in Symmetry
19 www.videleaf.com
the maximum surface obstructed) and duration of the signal. We
assign each drop to any of the discrete drop sizes.
With this information, the filters to eliminate excessively large or
small drops and temporary filters that enable one to eliminate the
signals corresponding to splashes on the lenses are applied.
Then, the corresponding corrections are applied to drops that
pass while rubbing the sensitive volume. Finally, we can
calculate the PI using the time and counting techniques.
Results
Figure 6 shows an example of the signals generated by the
system for 1 second as a consequence of a stratiform rain of a
precipitation intensity of . From this general signal, a
series of time intervals was extracted, where the signals that can
induce errors in the estimation of the precipitation are
appreciated. Thus, Figure 7 shows the case of a signal
corresponding to a droplet that passes while rubbing the sensitive
volume (A) and the case of a time interval where several drops
simultaneously pass through the sensitive volume (B). Both
types of signals will lead to errors in the precipitation estimation,
and their effects must be corrected to make the measurement as
accurate as possible.
Figure 6: Signals generated by the passage of the droplets through the sensitive
volume for 1 s with a precipitation intensity of 10 mm/h.

Prime Archives in Symmetry
20 www.videleaf.com
Figure 7: Superposition of several droplets simultaneously passing through the
sensitive volume. (A) Signals generated by the passage; (B) A droplet that rubs
the sensitive volume.
To determine the values that optimize the operation of the
system, the following analyses were performed for different
precipitation intensities (PIs):
The drop distribution was obtained according to their
size: maintaining a constant number of drops of each
size, we randomly generated different spatial and
temporal distributions (200 analyses) to estimate the
variations that could arise in the determination of the
measured as a function of the position of the drops at the
initial time.

Prime Archives in Symmetry
21 www.videleaf.com
The effect of considering different sampling times of 1-
120 seconds was analyzed. To minimize the effect of the
spatial and temporal distribution of the drops on the
measurement, the average of 200 measurements with
different distributions was analyzed.
The effect of the type of gamma distribution applied was
analyzed by comparing the results of the stratiform and
convective distribution.
The effect of the wind speed on the results of the
counting and time estimation systems was analyzed.
These measurements were performed for a PI of
5 with measurement periods of 5 seconds,
resolution of 0.1 milliseconds and an average of 20
measurements.
The results were compared for 8- and 10-bit converters
and an average of 20 measurements.
In this way, the main objective was to analyze the different
aspects that can influence the quality of the readings offered by
the optical disdrometers, such as the number of bits of the AD
converters, sampling time, type of measurement technique,
intensity of wind and precipitation. The results obtained from
these analyses are shown in Figures 8-14, which represent:
The values of the precipitation measured with respect to
the actual precipitation for different types of
precipitation and measurement techniques (Figures 8-9).
Estimation of precipitation measurement error for
different sampling times, measurement technique and
type of precipitation (Figure 10).
Estimate of the PI versus the real PI when working with
10-bit AD converters for different types of precipitation
and measurement techniques (Figures 11-12).

Prime Archives in Symmetry
22 www.videleaf.com
Figure 8: PI estimation for stratiform rainfall using the (A) time technique and
(B) counting technique.

Prime Archives in Symmetry
23 www.videleaf.com
Figure 9: PI estimation for convective rainfall using the (A) time technique and
(B) counting technique.
Prime Archives in Symmetry
24 www.videleaf.com
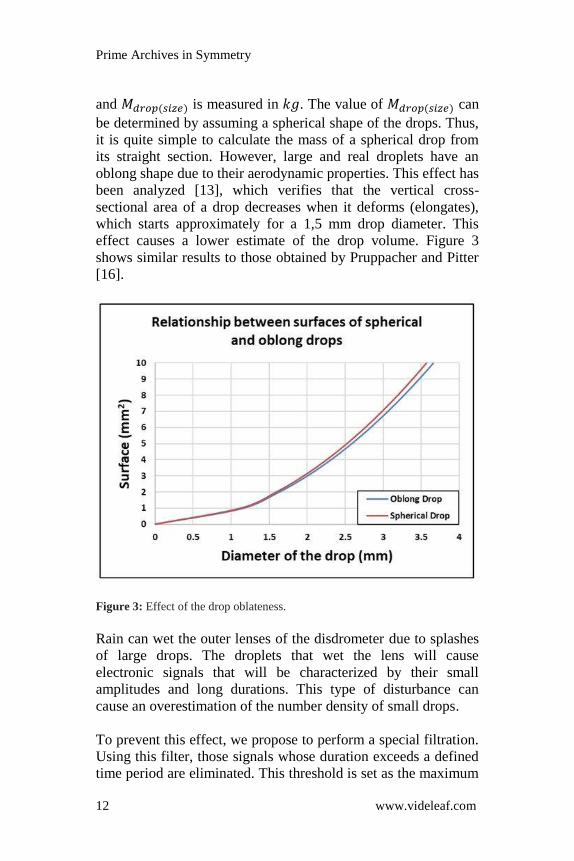
Figure 10: PI estimation errors of the counting and time techniques for
different sampling times for (A) stratiform rain and (B) convective rain.
Figure 11: Estimated PI with 10-bit converters for stratiform rainfall, different
precipitation intensities and different wind speeds: (A) time technique and (B)
counting technique.

Prime Archives in Symmetry
25 www.videleaf.com
Figure 12: Estimated PI with 10-bit converters for convective rainfall, different
precipitation intensities and different wind speeds: (A) time technique and (B)
counting technique.
Estimate of the IP versus the real IP when working with 8-bit
AD converters for different types of precipitation and
measurement techniques (Figures 13-14).

Prime Archives in Symmetry
26 www.videleaf.com
Figure 13: Estimated PI with 8-bit converters for stratiform rainfall, different
precipitation intensities and different wind speeds: (A) time technique and (B)
counting technique.

Prime Archives in Symmetry
27 www.videleaf.com
Figure 14: Estimated PI with 8-bit converters for convective rainfall, different
precipitation intensities and different wind speeds: (A) time technique and (B)
counting technique.
Discussion
Traffic accidents have an adverse effect both on an individual
and societal level resulting in costs due to person injuries and
property damage, increased travel times and emissions due to
congestion. Indeed, the safety impact of weather conditions has
been actively studied in different studies [26-28], which
conclude that accident risks are significantly heightened during
rainy, snowy and icy road conditions. According to Salli et al.
[29] the accident risk is more than four times higher for these
conditions compared to bare road surface. However, a study
based on data from the National Highway Traffic Safety
Administration showed that rain and wet roads cause more car
accidents and injuries than snow, sleet or fog. Therefore,
checking road conditions, especially rain, and properly warning
users of it could help reduce the risk of landslides, collisions or
other unwanted traffic accidents.

Prime Archives in Symmetry
28 www.videleaf.com
Today, multiple options allow for quickly checking whether
storms will slow down travel or keep the wheels running safely
and smoothly. Sophisticated levels of information help time a
drive and warn of pending weather-related dangers, learn
whether an umbrella would be handy to bring along, or if a
snowstorm is brewing. New technologies have simplified the
search for this type of information and now this is can be
consulted by anyone. However, despite the fact that disdrometers
have been used for many years on roads around the world, their
performance has not been optimized for these scenarios. Hence
the interest of this paper.
Accordingly, this research has analyzed the different aspects that
can influence the quality of the readings offered by the optical
disdrometers (such as number of bits of the AD converters,
sampling time, type of measurement technique, wind intensity
and precipitation), has conducted an in-depth analysis of their
impact on results and has proposed what should be the optimal
values to use in each case, which will help in the design and
implementation of future optical dysdrometers. Thus, this study
aims to be a guide for the new disdrometers to be installed,
which will allow obtaining more precise and detailed
information on the state of the roads. In this way, an accident
reduction, better traffic management and better quality of
information provided to users will be achieved.
With the indicated computer model, a set of numerical
simulations has been performed, where adequate measures were
taken to limit the effect of multiple occupancies of the sensitive
volume, tangential incidences and presence of drops in the
sensitive volume in the initial and final instants of the sampling
period.
In this way, under these conditions and considering the results,
the following conclusions are extracted:
The use of the counting technique always results in an
estimate of precipitation the time technique.
The time technique usually overestimates of the
precipitation values, except for precipitation intensities
above 50 mm/h.

Prime Archives in Symmetry
29 www.videleaf.com
The counting technique provides very close estimated PI
values to the actual values, which are slightly below
them.
The PI measurement with 8-bit A/D converters provides
better results with the time technique than with the
counting technique. The latter usually underestimates the
PI.
The PI measurement with 10-bit A/D converters
provides better results with the counting technique than
with the time technique. In this case, the latter usually
overestimates the PI values.
For measurements using the time technique, the results
show that it is better to work with 8-bit A/D converters.
For measurements using the counting technique, the
results show that it is better to work with 10-bit A/D
converters.
The edge effects have a smaller influence on the
convective precipitation. The reason is that for a given
precipitation intensity, the numerical density in the
convective rain is less than that in the stratiform rainfall,
and multiple occupations are less frequent.
In the counting technique, the effect of the wind on the
PI estimation is practically negligible. In the time
technique, there is a decrease in the PI estimation when
the wind speed increases.
In conclusion, with the results of this study, the design and
operation of the optical disdrometers could be optimized by
knowing at any time, depending on the type of precipitation and
the wind, which should be the type of estimation and the number
of bits of the AD converter to be used. In addition, an estimate of
the error made is also provided, which allows even more its
correction. In this way, the results will allow to assess the
convenience of using this type of system in ITS environments,
which is our field of work. However, knowing these data, its
conFigureuration can also be optimized for other scenarios.
Consequently, its application in urban and interurban
environments would help to have more accurate information in
real time, which would make it easier for management centers to
apply the corresponding measures when there are adverse
meteorological phenomena. These would result in an

Prime Archives in Symmetry
30 www.videleaf.com
improvement of the information provided to users and therefore,
in an increase in road safety and a decrease in the number of
accidents due to these causes.
References
1. Frasson RPDM, da Cunha LK, Krajewski WF. Assessment
of the thies optical disdrometer performance. Atmos Res.
2011; 101: 237-255.
2. Krajewski WF, Kruger A, Caracciolo C, Golé P, Barthes L,
et al. DEVEX -disdrometer evaluation experiment: basic
results and implications for hydrologic studies. Adv Water
Resour. 2006; 29: 311-325.
3. Peng Y, Jiang Y, Lu J, Zou Y. Examining the effect of
adverse weather on road transportation using weather and
traffic sensors. PLoS One. 2018; 13: e0205409.
4. Ibrahim A, Hall F. Effect of adverse weather conditions on
speed-flow-occupancy relationships. Transportation research
record, no. 1457, TRB. Washington, D.C.: National
Research Council. 1994.
5. Rakha H, Arafeh M, Park S. Modeling inclement weather
impacts on traffic stream behavior. Int J Transp Sci Technol.
2012; 1: 25-47.
6. Cruse R, Flanagan D, Frankenberger J, Gelder B, Herzmann
D, et al. Daily estimates of rainfall, water runoff, and soil
erosion in Iowa. J Soil Water Conserv. 2006; 61: 191-199.
7. Malin F, Norros I, Innamaa S. Accident risk of road and
weather conditions on different road types. Accid Anal Prev.
2019; 122: 181-188.
8. Lolli, S. Rain Evaporation Rate Estimates from Dual-
Wavelength Lidar Measurements and Intercomparison
against a Model Analytical Solution. J. Atmos. Ocean.
Technol. 2017; 829.
9. World Meteorological Organization. Guide to
meteorological instruments and methods of observation.
WMO-No. 8. Geneva: WMO. 2014.
10. Martin Grossklaus, Klaus Uhlig, Lutz Hasse. An Optical
Disdrometer for Use in High Wind Speeds. Institut für
Meereskunde, Universität Kiel, Kiel, Germany. 1998
11. Hauser D, P Amayenc, B Nutten, P Waldteufel. A new
optical instrument for simultaneous measurement of raindrop

Prime Archives in Symmetry
31 www.videleaf.com
diameter and fall speed distributions. J. Atmos. Oceanic
Technol. 1984; 1: 256–269.
12. Kathiravelu G, Lucke T, Nichols P. Rain drop measurement
techniques: a review. Water 2016, 8: 29.
13. Illingworth AJ, Stevens CJ. An optical disdrometer for the
measurement of raindrop size spectra in windy conditions. J
Atmos Ocean Technol. 1987; 4: 411-421.
14. Atlas D, Ulbrich CW. Path- and area-integrated rainfall
measurement by microwave attenuation in the 1–3 cm band.
J Appl Meteorol. 1977; 16: 1322-1331.
15. G.B. Foote and P.S. Du Torr. How fast do raindrops fall?
Weather Guys Editor. Terminal Velocity of Raindrops Aloft.
Journal of applied Meteorology. 2013; 8: 249-253.
16. Pruppacher HR, Pitter RL. A semi-empirical determination
of the shape of cloud and rain drops. J Atmos Sci. 1971; 28:
86-94.
17. Hasse L, Grossklaus M, Uhlig K. Measurement of
precipitation at sea, precipitation measurement and quality
control. Kiel, Slovakia: Institut für Meereskunde. 1993.
18. Hasse L, Grossklaus M, Isemer HJ, Uhlig K. New ship rain
gage. Instruments and observing methods, report No 57.
WMO/TD No 588. Geneva: World Meteorological
Organisation. 1998; 97-101.
19. Hasse L, Grossklaus M, Uhlig K, Timm P. A ship rain gauge
for use in high wind speeds. J Atmos Ocean Technol. 1998;
15: 380-386.
20. Marshall JS, Palmer WMK. The distribution of raindrops
with size. J Meteorol. 1948; 5: 165-166.
21. Ulbrich CW. Natural variations in the analytical form of the
raindrop size distribution. J Clim Appl Meteorol. 1983; 22:
1764-1775.
22. Ulbrich CW. The effects of drop size distribution truncation
on rainfall integral parameters and empirical relations. J
Clim Appl Meteorol. 1985; 24: 580-590.
23. Gertzman HS, Atlas D. Sampling errors in the measurement
of rain and hail parameters. J Geophys Res. 1977; 82: 4955-
4966.
24. Brawn D, Upton G. Estimation of an atmospheric gamma
drop size distribution using disdrometer data. Atmos Res.
2008; 87: 66-79.

Prime Archives in Symmetry
32 www.videleaf.com
25. Zhang G, Vivekanandan J, Brandes EA, Meneghini R, Kozu
T. The shape–slope relation in observed gamma raindrop
size distributions: statistical error or useful information? J
Atmos Ocean Technol. 2003; 20: 1106-1119.
26. Peng YC, Abdel-Aty M, Lee J. Analysis of the impact of
fog-related reduced visibility on traffic parameters. J Transp
Eng. 2018; 144: 04017077.
27. Alves de Souza B, da Silva Rocha Paz I, Ichiba A, Willinger
B, Gires A, et al. Multi-hydro hydrological modelling of a
complex peri-urban catchment with storage basins
comparing C-band and X-band radar rainfall data.
Hydrological Sciences Journal. 2018; 63: 1619–1635.
28. Tabary P, Boumahmoud AA, Andrieu H, Thompson RJ,
Illingworth AJ, et al. Evaluation of two "integrated"
polarimetric Quantitative Precipitation Estimation (QPE)
algorithms at C-band. J. Hydrol. 2011; 405: 248–260.
29. R Salli, M Lintusaari, H Tiikkaja, M Pöllänen.
Keliolosuhteet ja henkilöautoliikenteen riskit [Wintertime
road conditions and accident risks in passenger car traffic].
28 April 2008. Tampere University of Technology,
Department of Business Information Management and
Logistics. 2008.