Discussion Paper No. 81 - Centre for Development Studies · Changes in the mode of labour due to...
61
Changes in the mode of labour due to shift in the land use pattern Omana Cheriyan Discussion Paper No. 81 Kerala Research Programme on Local Level Development Centre for Development Studies Thiruvananthapuram
Transcript of Discussion Paper No. 81 - Centre for Development Studies · Changes in the mode of labour due to...

Changes in the mode of labourdue to shift in the land use pattern
Omana Cheriyan
Discussion Paper No. 81
Kerala Research Programme on Local Level DevelopmentCentre for Development Studies
Thiruvananthapuram

Changes in the mode of labourdue to shift in the land use pattern
Omana Cheriyan
EnglishDiscussion Paper
Rights reservedFirst published 2004Editorial Board: Prof. P. R. Gopinathan Nair, H. ShajiPrinted at:Kerala Research Programme on Local Level DevelopmentPublished by:Dr K. N. Nair, Programme Co-ordinator,Kerala Research Programme on Local Level Development,Centre for Development Studies,Prasanth Nagar, Ulloor,Thiruvananthapuram
Cover Design: Defacto Creations
ISBN No: 81-87621-84-2
Price: Rs 40US$ 5
KRPLLD 2004 0500 ENG

Contents
1 Introduction 5
2 Land-Labour Linkages in Kerala - A review of studies 11
3 Changes in the land use pattern 22
4 Study area 31
5 Socio-economic profile of labour 40
6 Conclusion 58
References 60

5
ACKNOWLEDGEMENTS: I wish to place on record my deep sense of gratitude and indebtedness toDr K. N. Nair, Programme Co-ordinator, KRPLLD, but for whose expert guidance, whole hearted support,patient help, and valuable comments on the draft report, this work would never have come to light. Dr K.Ramachandran Nair was instrumental in initiating me to this project. Dr P. R. Gopinathan Nair gave expertadvice and valuable suggestions for the conduct of the study. Dr G. Christopher extended great support incompleting this work. I am thankful to them all. I am highly indebted to Dr P. J. Philip, Principal, St. ThomasCollege, Kozhencherry for his valuable guidance in the planning and execution of this project. But for theservices of Ajith Kumar, who assisted me in the collection of data and of K. H. Abdul Rasheed whose expertisein computer operations was of great help, both my post graduate students, it would not have been possible toprepare this project report. My colleagues especially Prof. Oommen Zachariah and Prof. Thomas George,gave me moral support. Sri. Radhachandran, former President and Smt. Omana Kunjamma, Member of theMezhuveli Panchayat and the farmers of the study area heartily co-operated and supported the study; Iacknowledge my deep gratitude to all of them.
Omana Cheriyan is Head of the Department of Economics, St. Thomas College, Kozhencherry.
Changes in the mode of labourdue to shift in the land use pattern
Omana Cheriyan
1. Introduction
The unique features of Kerala agriculture are predominance of cash crops, homesteadsystem of cultivation, inter-cropping of annual and perennial crops, shrinkage of areaunder rice crop and dominance of small holders. The fall in area under cultivation of manycrops is due mainly to increased cost of production and shortage of farm workers. Theland area not cultivated either lies fallow or has been shifted to non-agricultural uses.
During the past three decades the agricultural sector of Kerala has undergone wide-rangingchanges in terms of ownership of land, cropping pattern, cultivation practices, productivityand intensity of cultivation. In earlier periods, the choice of cropping pattern was guidedby agronomic considerations and consumption needs of farmers, but now it seems thatmarket forces mainly determine the emerging trend. Official figures show that agriculturalincome in Kerala, which had registered steady growth up to the mid-seventies, began todecline thereafter and widely fluctuated during the ’eighties (Mahesh 1999). This changeis attributed mainly to the shift in area from seasonal/annual crops to high-value-yieldingperennial cash crops with long gestation periods. By the end of the ’eighties cash cropsstarted generating higher income to the farm sector. Therefore, during the past five yearsagricultural income has again started rising. This sustainable performance and the traditionalcropping pattern of the state are challenged by liberalisation, privatisation, globalisation andopening up of the Indian Economy.
What is the effect of the structural changes in the land-holding pattern in the 1970’s withrespect to (a) the distribution of households in different size classes (b) the incidence and

6
forms of tenancy (c) the size-distribution of operational holdings (d) and the mode oflabour in the Kerala economy. According to Nair et al., there are certain contrasts in thepattern of land holding changes in the 1970’s vis-a vis that in the’ fifties and’ sixties as wellas in the inter-state differences in the pattern of land holding structure in the’seventieswhich resulted in rapid marginalisation of land holding in most parts of India, due mainly toa disproportionate proliferation of marginal holdings-both ownership and operational (Nairet al. 1990). The change in the distribution of households has been a factor accounting fora decline in the average size of ownership holdings and the change in the structure of landholdings in the’seventies compared to those of preceding two decades.
The structural changes in land holdings in the’fifties and the’sixties as revealed from thevarious rounds of the NSS may be briefly summarised as follows: (1) The number as wellas the proportion of households in the marginal size groups of holdings declined; (II) Thenumber of small holdings increased but their share in total holdings declined. The areaunder this size group has increased in absolute terms and also as a proportion to total area;(III) In the case of medium-sized holdings, the trend noted was the same as that for smallholdings; and (IV) The number as well as the proportion of big and large holdings declined;the area under these holdings also declined both in absolute terms and as a proportion tototal area. These trends were observed to be similar in all the states. Decline was noticed inthe incidence of tenancy as also in the proportion of landless households.
What had been the effect of these changes in the land holding pattern on land distribution?This question has been analysed with the pattern of intra-generational economic mobilityof agricultural households as a proximate explanation for change in land distribution. Intra-generational economic mobility is taken to mean the mobility (upward or down ward) ofthe household with respect to size-class of operated area during the life time of the head ofthe household. Such an analytical focus for an analysis of land distribution has come froma study of Cain and the dynamic methodology in the studies of the Russian peasant societyby A. C. Chayanov and T. Shanin. The empirical literature on peasant economic mobilityhas been guided by two contrasting approaches namely the orthodox Marxist and neo-populist. Some essential elements of these two approaches are set out in fig. 1.1
Under the orthodox Marxist approach the dominant tendency is for peasant households tomove away from the centre of the distribution in both directions (Centrifugal mobility).This has the dynamic consequences of producing a polarization tendency within the peasantrywhich leads to its social class differentiation and increase in inequality of land/wealth. Theorthodox neo- populist approach envisages a contrary pattern in which households at theextremes of the distribution tend to move towards the centre (Centripetal mobility) of thedistribution, which in turn is reflected in diminishing degree of inequality. In the neo-populist approach, the pattern of mobility is a combination of centrifugal and centripetalpatterns of mobility giving rise to a pattern of multi-directional mobility. Multi-directionalmobility has the dynamic consequence of producing neither a polarization nor a middlingtendency but only a cyclical tendency within the peasantry. This in turn may lead to anincrease in inequality of land or wealth in certain phases of the cyclical movement but nolinear trend in inequality.

7
Fig. 1.1
Two Contrasting Theoretical Approaches to Studying the Dynamics of Peasant Mobility
1. Orthodox Marxist (Orthodox Populist 2.Neo-populist Approach Approach) Approach Approach (Kautsky, Lenin) (Chayanov, Shanin)
OBSERVABLEPHENOMENON/LEVELS OFANALYSIS
Time path ofhouseholdmobility
Time path ofhouseholdmobility
Time path ofhouseholdmobility
Siz
e-cl
ass
ofla
nd/W
ealt
h
Siz
e-cl
ass
ofla
nd/W
ealt
h
Siz
e-cl
ass
ofla
nd/W
ealt
h
(A) DOMINANTPATTERN OFMOBILITY
(B) DYNAMICCONSEQUENCE
(C) DIRECTIONALCHANGE IN THEMEASURE OF INEQUALITY
(a) CentrifugalMobility
PolarizationTendency andhence Social
ClassDifferentiation
of the Peasantry
Inequality tendsto increase
(b) CentrepetalMobility
Levelling/MiddlingTendency andhence Social
Homogenization ofthe Peasantry
Inequality tends todecrease at first
and remains stablethereafter
(a)+(b): Multidirectional(Cyclical Mobility)
Cyclical Tendency andDemographic
Differentiation of thePeasantry
Inequality may increasebut no linear trend

8
The present study is concerned with an analysis of the pattern of mobility of agriculturallabourers and marginal farmers underlying the distributional change. A study by Padhi andNair (1992) reveals that in almost all the states in India, household distribution emerged asthe single most important component accounting for the observed change in the averagesize of the owned land. This seems to suggest that household mobility, across size classesshould be an important element in analysing changes in land distribution. To what extentwould the redistributive land reforms in Kerala initiated in the 1970s have changed thedistribution of land by affecting the pattern of household mobility particularly at the lowerend of the land distribution scale?
The term marginal farmers represents farmers owning small plots of land and cultivatingparcels of leased-in land with (a) family labour (b) minimum production of output equivalentto his subsistence (c) his social relations determined by kinship, customs and conditions(d) his dependence on the market for selling the produce of the leased-in plot. Agriculturallabourers in our context are traditionally-trained, crop-specific labourers displaced fromthe farm sector due to change in the land use pattern and reduction in area under ricecultivation. These lessees are residual farm workers owning tiny plots of lands, but dislikedspatial dislocation and migration to non-farm activities. They come under the lowest sizeclass distribution.
If it is true that the pattern of household mobility has to be an important component in anydynamic analysis of change in land distribution, the essential problem here is that there isno unique one-to-one correspondence between a certain observed change in land distributionand the underlying pattern of household mobility i.e., a particular pattern of distributionalchange is compatible with a wide variety of underlying pattern of economic mobility, thepossibility is in general brought out in fig 1 where an observed increase in inequality iscompatible with both centrifugal mobility as well as a more complex pattern of multi-directional mobility. This point would be discussed in greater detail, later.
John Harris discovered that small peasants along with their own family labour, hire outsideagricultural workers and that they are not capitalist farmers. (Hariss, 1982). Their subsistencelogic and efficient management of farms indicate the Chayanovian theory that family farmshave the capacity to engage in production without receiving profit or rent. The co- existenceof capitalist and peasant agriculture as demonstrated by John Harris and Ishikawa indicatesthe possibility of developing an alternative agricultural model of development with highproductivity. Vaidyanadhan arrives at the conclusion that Indian peasant households sustainthemselves with a combination of farm commercialisation and non-agrarian activitiesemanating from rural prosperity. (Vaidyanathan, A 1977).
Objectives of the study
The present study has the following major objectives:1. Analysis of the historical background of vettila (betel) cultivation in Pathanamthitta
district and examine the economic viability of this non-traditional activity. The termsand conditions of leasing-in land for vettila cultivation would also be examined.

9
2. Assessment of the economic viability of a general shift of cultivation of small holders inthe area to betel vine.
3. Study of the nature and extent of market for non-traditional items like vettila.4. Verification of the extent to which commercial production has emerged among
agricultural labourers and small farmers in the area.5. Analysis of the reactions of trade unions to this emerging mode of cultivation by
agricultural labourers and marginal farmers.
Methodology
The study is conducted on the basis of an intensive empirical analysis of information aboutlabour use patterns and economics of, non-traditional types of small scale cultivation in aselected area in Pathanamthitta district. For the collection of data field investigations, suchas household surveys, interviews with knowledgeable persons in the locality andparticipatory learning methods, were used.
Information was collected on the following items
a. Distribution of land holdings owned and operated among agricultural labourers.b. Area of wet land leased-out and fallow land.c. Land use pattern and Income and Expenditure of farms; andd. Employment pattern of agricultural labourers.
Participatory Approach RRA/PRA
This is an alternative to the conventional method of questionnaire and survey successfullyused in understanding local processes and social and institutional relations. The methodsused range from field-based appraisals to assessment of areas and groups. The approachaims at promotion of interactive learning, shared knowledge and flexible but structuredanalysis.
It allows local people to discuss and cross-check local conditions. It is a developmentmodel as it empowers local people.
In the present study some of the techniques of RRA have been used for data collection.Some of the methods used in the study are local analysis of secondary data, directobservation, transect walk, time line, case studies and linkage diagrams.
The study area and its land use pattern
The study was conducted in Padopattakulanji in Kulanada Panchayat, Ayithil in MezhuveliPanchayat and Oonnukallu in Chenneerkara Panchayat all in the Pathanamthitta district.
In Pathanamthitta district, the unique pattern of cultivation of leased-in wetlands byagricultural laboures and marginal farmers is widespread. These cultivators grow non-
10
traditional crops such as vettila (betel), fruits, vegetables, tapioca and flowers. Theprecipitous decline in the price of rubber has thrown rubber tappers in the area intounemployment. Some of them have, along with other agricultural labourers, ventured intofarming on leased-in land.
The investigations began with a farmer’s seminar on Dec. 14th, 1999. Forty-two agriculturallabourers, who practise leased-in cultivation, in Mezhuveli, Kulanada, and ChenneerkaraPanchayats attended the meeting. Presidents and the ward members of the concernedPanchayats and Agricultural Officers of the state government also participated. The meetingextended full support for the study.

11
2. Land-Labour Linkages in Kerala: A review of studies
Kerala economy was characterised by a higher share of wage labour than in the otherstates in India at the time it began to embark on a nationally-determined programme ofeconomic development (Kannan, 1998). This was due to the predominance of cash cropcultivation and labour-intensive occupations in the service sector. Comfortable workingconditions and high wage rates left the employers with little surplus. Employers could goin for technological change in their production process and, if the attempts were resistedby organised labour militancy, they could migrates to regions outside Kerala wheretechnological changes were not resisted and where lower wage rates prevailed. Labourunions and the state itself had very little power to thwart such decisions. Therefore thedilemma faced by Kerala in the ’sixties and the ’seventies was primarily the following:“halting of technological changes in labour-intensive activities during a period of risinglabour cost failed to realise the goal of protecting employment and resulted in the loss ofpotential output and employment of such changes in the long run.”
The distributive issues have been so central to the question of economic development inKerala and its unique achievements in the sphears of land reform, education, health careand public distribution of food grains by the early ’seventies (UN/CDS 1975). The highlycontested nature of distributive issues in a regime of low accumulation has given rise tolow per capita income and persistence of high unemployment. But the social developmentpolicies of the government and social welfare – basically ‘poor relief’ programmes resultedin a general decline in the incidence of poverty (Kannan 1998). The inflow of large amountsby way of remittance from Keralites working in Gulf countries enhanced the sphere ofcirculation in the Kerala economy and expanded its tiny construction industry and relatedactivities. A strongly unionised labour force, factors like the interrelated nature of thelabour market (Krishnan 1991) enabled continued rise in wage rates. As the social profileof the younger generation of the labour force changed, social preferences for employmentalso changed. Younger members in the labour force started opting out of the casual labourmarket despite higher wage rates. Their preference was for stable employment. Generationof new employment opportunities was low because of the inability of the state to attractnew investments and decline in the technologically stagnant labour- intensive occupations.The only sector in which some increase in employment was evident was the service sector.Such a situation produced, since the mid-eighties, a new dilemma for the Kerala economywhich may be characterised as under:
An accelerated process of social development taking place in the context of demographictransition resulted in a mismatch between labour supply and labour demand.
The result has been the emergence of a vast reservoir of reasonably educated young,socially conscious labour force and of a technologically stagnant economy surviving onthe expansion of the service sector resulting from international remittances.

12
The social cost of halting technological changes has been extremely high; it could neitherprotect current employment nor lead to a long-term transformation of such industries/activities into higher forms of production and output growth (Kannan, 1998). Since theearly’ nineties, coinciding with a rapid and large-scale process of liberalisation of the Indianeconomy, concerted efforts were begun by the state to attract new investment. Kerala alsowitnessed the emergence of some other favourable factors. The continued inflow ofremittances from workers in the Gulf region resulted in a steady growth of bank depositscreating a large pool of loanable funds for investment purposes. The availability of educatedand skilled labour has added to the attraction of Kerala as an investment friendly placereversing its earlier image as a labour-problem state. There has been a perceptible drop inthe incidence of industrial disputes in the state. Yet Kerala has the state failed to attract newinvestment. This paradox has placed the state in a poor light. This could lead to increasinglabour costs as a part of the consumption of poorer house holds is met from state supporteither directly or indirectly.
Gains of Unionisation and State Intervention
Unionisation of labour which began in the early ‘thirties has been a remarkable achievementof Kerala as it gave workers, especially workers in rural areas, a distinct identity as membersof collective organisations. The land reform measures initiated by the state in the late’fifties and enacted in the late ‘sixties, abolished tenancy and curtailed the power of landowners over landless agricultural labourers. Notable achievements of unionisation werefixed hours of work, impersonal, employer-worker relationship, non-wage benefits andloosening of the linkages as between land, labour and credit (Kannan, 1988 and 1992).Other achievements were a sustained increase in wage rates, political support to formlabour co-operatives and initiation by the government of a number of labour welfare measures.The benefits from these measures accounted for a little more than one-fifth of theconsumption of rural labour households during the early ’eighties (Kannan, 1995).
Widespread unionisation of labour coincided, during the period from the early’sixties to themid-eighties, with strong demographic transition and sustained social development thatincreased labour supply (Rajan, et al. 1993).
Wage gain but job loss
The high profile of labour indicating wage rates and terms of work was also felt in agriculture.During the ‘seventies, when rice cultivators introduced mechanisation of agriculturaloperations, the situation was one of excess labour supply and declining employmentopportunities. Rural labour relations became tense throughout the ‘seventies in Kerala. Inthe face of increasing wage cost without a commensurate increase in labour productivity,farmers resorted to a strategy of crop substitution in favour of low-labour-absorbing crops.By the mid-nineties, the area under rice cultivation registered a forty percent decline. Thedecline in employment due to decline in area, was around thirty-five million man days

13
between the mid-’seventies and the early ‘eighties and around fifty million man-days by themid-’nineties (Natarajan, 1982). That part of the agricultural sector which cultivated seasonalcrops stagnated since the mid-’seventies to the mid’eighties thereby imposing an additionalconstraint on the enhancement of employment in the economy as a whole (Kannan andPushpangadan, 1988 and 1990). Labour unions in the organised sector, both public andprivate, opposed technological changes. Payment of wages to workers even in activitieswhich did not require labour inputs was ensured, during the period subsequent to theintroduction of new technology (Kannan, 1998). A similar strategy was also adopted bythe ‘head-load workers’ who emerged during the ’seventies as one of the most powerfulunions in Kerala. A similar system was enforced in rice cultivation in the wetland region ofKuttanad. In this case farmers were made to agree to make payments to traditionalploughmen (who did animal ploughing of fields) when tractors were introduced for suchploughing. This perhaps contributed a great deal to an unfavourable image of labour inKerala especially among prospective investors.
The union strategy which was successful in the initial phase failed to arrest the decline inemployment because of (1) insignificant new investment (2) large scale migration of labour-intensive manufactures to places outside Kerala and (3) shift of cultivation to a less-labour-absorbing cropping pattern. The political clout enjoyed by the labour unions enabledthem to advocate the case of formation of labour co-operatives as a strategy to preventsharp declines in employment. Almost all co-operatives were riddled with several problemsthreatening their survival without government support. The labour unions did not have along term strategy when faced with a situation of labour displacement. In desperation,they resorted to a short-sighted strategy of protecting ‘insiders’. Thus farmers were forcedto employ agricultural field labourers from within the locality as opposed to those from‘outside’ the locality (Alexander 1975, Tharamangalam 1981). Successful prevention ofentry of outsides made it possible for members to trade their membership for a ‘price’ thatwas estimated to be the equivalent of around two year’s earnings (Nambiar, 1995). Sucha strategy could only benefit those sections of workers who had some critical control overthe production process. But there were many others mostly women, who did not havesuch critical control and they lost in the game (Kannan, 1992).
Neither employment nor output growth
Decline in employment in labour-intensive manufactures and deceleration in that part ofthe agricultural sector which cultivates seasonal crops as well as the inability of the state toattract new investment in commodity producing sectors were the characteristic featuresof the Kerala economy during the ’seventies. The primary sector registered negativegrowth during this period (Table 2.1). The cumulative effect of all these was the emergenceof large scale unemployment and underemployment as the most serious socio-economicproblem in Kerala. Therefore, on the one side there was excess supply of labour force andon the other, scarcity of labourers was experienced in several sectors.
14
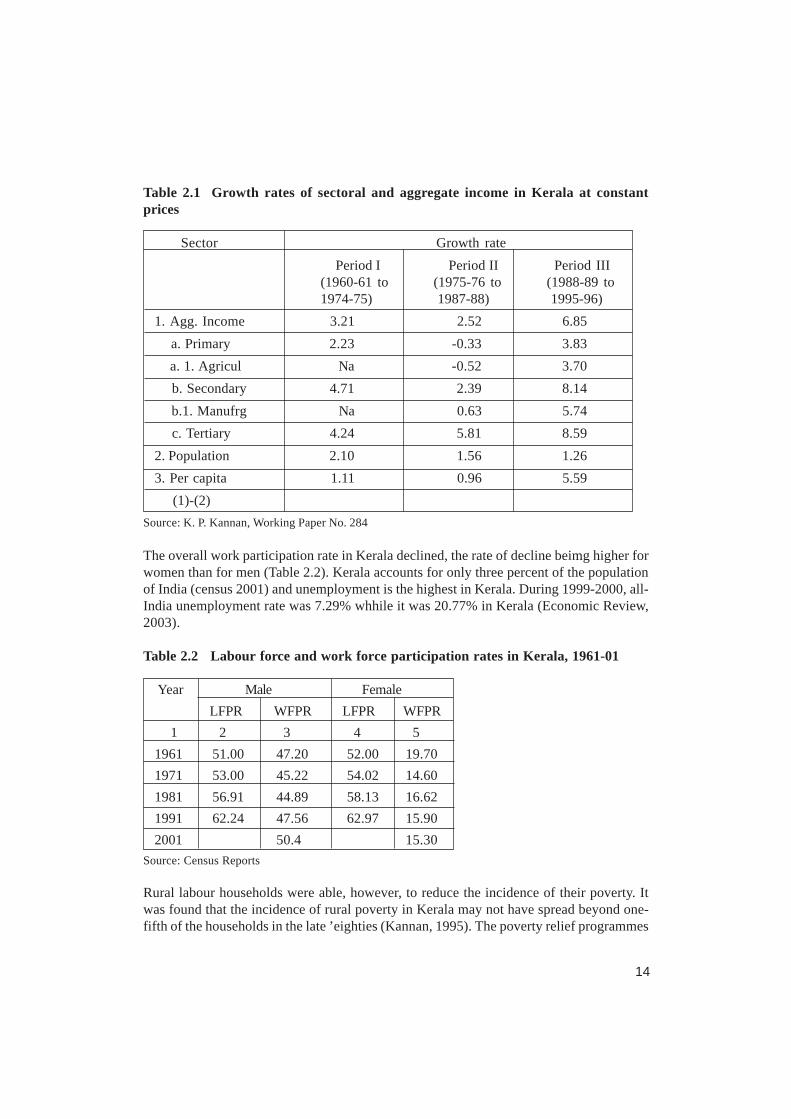
Table 2.1 Growth rates of sectoral and aggregate income in Kerala at constantprices
Sector Growth rate
Period I Period II Period III(1960-61 to (1975-76 to (1988-89 to1974-75) 1987-88) 1995-96)
1. Agg. Income 3.21 2.52 6.85
a. Primary 2.23 -0.33 3.83
a. 1. Agricul Na -0.52 3.70
b. Secondary 4.71 2.39 8.14
b.1. Manufrg Na 0.63 5.74
c. Tertiary 4.24 5.81 8.59
2. Population 2.10 1.56 1.26
3. Per capita 1.11 0.96 5.59
(1)-(2)
Source: K. P. Kannan, Working Paper No. 284
The overall work participation rate in Kerala declined, the rate of decline beimg higher forwomen than for men (Table 2.2). Kerala accounts for only three percent of the populationof India (census 2001) and unemployment is the highest in Kerala. During 1999-2000, all-India unemployment rate was 7.29% whhile it was 20.77% in Kerala (Economic Review,2003).
Table 2.2 Labour force and work force participation rates in Kerala, 1961-01
Year Male Female
LFPR WFPR LFPR WFPR
1 2 3 4 5
1961 51.00 47.20 52.00 19.70
1971 53.00 45.22 54.02 14.60
1981 56.91 44.89 58.13 16.62
1991 62.24 47.56 62.97 15.90
2001 50.4 15.30
Source: Census Reports
Rural labour households were able, however, to reduce the incidence of their poverty. Itwas found that the incidence of rural poverty in Kerala may not have spread beyond one-fifth of the households in the late ’eighties (Kannan, 1995). The poverty relief programmes

15
and the sustained process of social development were made possible by remittances fromKerala labour force working in the Gulf countries. In a survey conducted by the Bureau ofEconomics and statistics it was revealed that sixty-five percent of the emigrant labourwere of rural origin and were unskilled or semiskilled. The impact of demographic transitionon the labour market situation is the zero rate of growth in the younger age group of 15-29years since 1990, which means there is no net addition to the annual entrants this agegroup of the labour force (Bhat and Irudaya Rajan 1990). Shift in social expectation of theyounger generation in the rural areas has contributed to the reported scarcity of labour inthe rural casual labour market. Farmers from all over Kerala have been reporting a shortageof labour for casual and manual unskilled work in agriculture. In a village study of theagricultural labour households in a wetland rice growing region of Kerala in the late eighties(Francis 1990), it was found that the participation rate of the younger age group (16-30years) in agricultural activities was only fifty-one percent where as it was seventy percentfor all other age groups. Of the total unemployed, 88 percent were in the younger agegroup (Francis 1990); the others just could not ‘afford’ to be unemployed.
Distributional change in land holdings
The size class distribution of land for 1980 – 81 and 1986-’87 given in Table 2.3. Therehas occurred an increase in number and the proportion of land area under marginal holdings.
Table 2.3 Percentage Distribution of Number of Holdings and Area Operated byMajor Size Group of Holdings
Size Group (In Hectares) 1980 – 81 1986 - 87
No. of Holding Area No. of Holdings Area
Marginal Holding (<1) 89.2 41.6 91.5 46.1
Small Holding (1 – 2) 6.9 22.0 5.7 21.5
Semi-medium holding (2 – 4) 2.9 18.4 2.1 15.3
Medium Holding (4 – 10) 0.9 10.9 0.5 7.4
Large Holding (> 10) 0.1 7.2 0.0 9.7
Lorenz Ratio .609 .620
Source: Govt. of Kerala Agricultural Census 1985-86, Dept. of Economics and Statistics,Thiruvananthapuram
It might have come about through upward mobility of previously landless households intothis category through market/non-market means, subdivision of holdings within this group,downward mobility of households previously belonging to higher size classes throughsubdivision or loss of land via market or non-market channels, etc. Similarly the shares inthe number of holdings and areas of a few larger-holding categories have declined.
The time–profile of formation of households may be seen from row-total percentages inTable 2.4. We find that nearly 50 percent of households had come into existence by 1970

16
and the other 50 percent after 1970. Thus 1970 emerge as the median year of formation ofsample households. As regards the initial landholding position of old and new householdswe see that the proportion of households in the bottom three size–classes increases and inthe top three size–classes decreases. Such a relative proliferation of smaller initial operatedholding among younger households is reflected in a steady decline in the average size ofinitial operated area as the average age of the sample households decreases (Table 2.4 Lastcolumn). This can be said to be a reflection of aggregate downward inter-generationalmobility due to increasing scarcity of land as time passes by.
Table 2.4 Percentage distribution of sample households by two broad size classes ofoperated area at point of origin/in 1970 and by year of origin
Year of origin Size class in acres Total Row total Average operated < .5 > .5 area (Acres)
By 1970 29.8 78.2 100 531 1.8849.2
1971-75 41.5 58.5 100 154 1.4814.3
1976-80 45.0 55.0 100 198 1.3016.3
1981 and after 49.7 50.3 100 197 1.0418.2
Column total 417 671 108038.6 62.2 100 100.0 1.36
Source: abridged from Sakti Prasad Padhi and Nair K. N. C. D. S. working paper No. 245.
Table 2.5 Intra-generational change in decile shares and in Inequality
Point of origin/ Decile shares (%) Absolute Proportional1970 operated Point of gain (+)/Loss(-) gain/lossHolding decile origin/in 1970 In 1987 in (%) shares (%)
Poorest 0.45 0.50 +0.05 +11.11
2 0.81 0.84 +0.03 +.03.70
3 2.00 2.04 +0.04 +02.00
4 3.50 3.55 +0.05 +01.43
5 4.58 4.64 +0.06 +01.31
6 6.38 6.37 -0.01 -00.15
7 8.99 8.89 -0.10 -01.11
8 14.51 14.62 +0.11 +00.75
9 18.60 18.67 +0.27 +01.45
Wealthiest 40.18 39.82 -0.36 -00.89Source: Sakti Prasad Padhi and Nair K. N. C. D. S. working paper No. 245

17
Table 2.5 shows the distributional change for the same households over time in decileshares between point of origin (1970) and 1987 for an unchanging household distribution.Here the bottom five deciles have registered small gains and the wealthiest decile a slightloss. The net result of all this is reflected in a slight decline in the intra-generational inequalityof land distribution. Inter-generational economic mobility, reduction in intra-generationalinequality in land distribution and the re-emergence of tenancy in the 1990s are indicativeof another round of agrarian reform which may remove the mismatch between those whoown land, but keep them fallow and those who have labour.
Incidence of tenancy
During early seventies and eighties, both in terms of households and area, there has been asharp decline in the incidence of tenancy (Nair et al. 1990). The proportion of householdsleased-in-land in Kerala declined from 17.7 to 12.7 percent.The proportion of leased-inarea to owned area declined from 9.1 to 2.3 percent. In the case of households leasing outland, it declined from 6.5 percent to 1.7 percent (Table 2.7). The decline in area leased outwas from 3.0 to 0.4 percent. Though the incidence of tenancy has declined the changes inthe landholding pattern, and the changed character of labour market, which produced aparadoxical situation in Kerala, may have been the reasons for changes in the informallease market.This is reflected partly in the change in the distribution of leased-in-landacross size group of holdings and partly in terms of lease.
Table 2.6 Percentage of Households Leasing-in Land to All Households
States Households Leased-in Area to Owned Area
1971 1981 1971 1981
Andhra Pradesh 20.95 19.74 9.08 6.51
Assam 49.17 14.09 23.23 6.87
Bihar 33.48 17.22 16.17 10.42
Gujarat 13.74 9.01 4.31 2.00
Haryana 29.41 22.28 27.80 19.65
Himachal Pradesh 25.62 16.95 11.23 2.94
Jammu & Kashmir 13.15 5.40 8.03 2.79
Karnataka 27.68 16.95 17.14 6.62
Kerala 17.67 12.70 9.10 2.28
Madhya Pradesh 23.26 12.29 8.25 3.80
Maharashtra 14.69 16.70 6.78 5.57
Orissa 14.75 16.81 14.70 8.04
Punjab 27.52 23.03 34.33 18.98

18
Rajasthan 14.81 9.70 5.50 4.34
Tamil Nadu 31.16 29.22 13.99 13.37
Uttar Pradesh 24.96 21.27 13.76 11.09
West Bengal 30.63 27.09 21.57 12.29
All India 23.72 18.53 10.69 7.46
Source: K. N. Nair, N. Navaneetham and A. C. Dhas w.p. No. 237 Page. No. 17
Table 2.7 Percentage of Households Leasing-out Land to All Households
States Households Leased-in Area to Owned Area
1971 1981 1971 1981
Andhra Pradesh 12.05 6.17 8.93 6.00
Assam 12.00 3.15 8.18 1.78
Bihar 15.80 7.44 6.78 4.95
Gujarat 3.79 2.32 2.29 1.67
Haryana 11.63 9.40 8.05 10.64
Himachal Pradesh 8.94 9.74 4.09 6.91
Jammu & Kashmir 3.73 1.54 3.21 0.97
Karnataka 11.05 5.81 7.90 5.01
Kerala 6.47 1.68 3.00 0.43
Madhya Pradesh 7.67 3.19 3.62 3.29
Maharashtra 5.02 3.10 3.20 2.70
Orissa 13.11 6.71 7.04 5.45
Punjab 13.67 8.35 17.69 11.07
Rajasthan 5.78 5.49 4.09 3.14
Tamil Nadu 8.44 7.78 8.88 5.89
Uttar Pradesh 10.06 6.71 6.41 4.79
West Bengal 9.48 3.71 8.95 2.48
All India 9.87 5.53 5.77 4.29
Source: K. N. Nair, N. Navaneetham and A. C. Das w.p. No. 237 Page No. 18.

19
Table 2.8 Percentage Distribution of Area Leased in by Size Class of Operationalholding in Kerala
Year 0-2.02 2.03-4.04 4.05-6.07 6.08-10.12 > 10.13 All size
1971 69.13 17.93 9.77 2.60 0.58 100
1981 76.55 2.65 4.60 3.21 12.99 100
Source: Abridged from Nair. K. N. (1990 working paper 237)
The distribution of leased in area across size categories of holdings in Kerala shows amixed trend (Table 2.8). There have been significant changes in the forms of tenancyduring the ’seventies. The distribution of leased in areas has moved in favour of the highersize group of holdings.
Table 2.9 Leased-In Operated Area according to Terms of Lease: Kerala and India
State Terms of Lease For Total
Kerala For Fixed For Fixed for share of For usufruct- other
Money produce Produce uary mortgage terms
1971 13.04 39.81 7.33 3.38 36.44 100
1981 3.41 0.00 13.17 2.44 80.98 100
All India
1971 15.4 11.6 47.9 3.1 22 100
1981 10.9 6.3 45 2.2 34 100
Source: Abridged from Nair K. N. (1990 working paper 237)
For the country as a whole, the proportion of area leased-in for share of produce wasabout 48 percent in 1971 (Table 2.9) and it slightly declined to 45 percent by 1981. Thecorresponding proportions in Kerala were 7 and 13 percent. The percentage of area leased-in for other terms has shown substantial increase. The other terms include the leases,which had been only verbally contracted and not recorded on any document. The increasewas spectacular in Kerala, from 36 percent to 81 percent. The quantitative and qualitativechanges in tenancy have also influenced the type of households who are involved in thelease market. According to the 37th round of NSS (Table 2.10) 29 percent of the operatedarea leased out in Kerala was by self-employed households in agriculture, 12 percent byagricultural labour households and 59 percent by other households. As regards the type ofhouseholds leasing-in land about 30 percent of the area leased in was by sections otherthan the self employed or the agricultural labour. Table 2.11 shows a mixed trend indistributional pattern.

20
Table 2.10 Percentage of Area Leased Out and Area Leased in by DifferentHousehold Type in Kerala in 1982
Percentage of area leased out by Percentage of area leased in
Self Emplo- Agri- Others Total Self Emplo- Agri- Others Totalyed in cultural yed in cultural
agriculture Labour agriculture Labour
Kerala 29.27 12.20 58.54 100 56.14 13.60 30.26 100
All India 34.35 19.39 46.26 100 85.25 7.51 7.24 100
Source: Govt. of India (1989): Same aspects of household ownership holding, 37th round Jan-Dec 1982No. 330. Dept. of statistics Ministry of Planning.
Table 2.11 Percentage Distribution of Operational Holdings and Area OperatedOver 5 Broad Categories of Operational Holdings (Kerala)
Marginal Small Small Medium Medium Large
<1.01 ha 1.02 – 2.02 ha 2.03 – 4.04 ha 4.05-10.12 ha > 10.13 ha
No. of Area No. of Area No. of Area No. of Area No. of Areahold- oper- hold- oper- hold- oper- hold- oper- hold- oper-ing ated ing ated ing ated ing ated ing ated
1970-71 86.2 40.1 8.9 24.8 3.66 20.1 1.13 12.3 0.1 2.96
1981-82 88.9 45.5 7.3 24.1 12.9 18.5 10.8 10.1 0.07 2.93
Source: Govt. of India (1988): Sarvekshana, Vol. 12, No. 1., Issue No. 36, July, Department of StatisticsMinistry of Planning.
Table 2.12 Percentage Distribution of Increments to Work Force in Kerala Sector 1977-’78 to 1987-’88
Sector Rural Total
M F P M F P
Primary 27.4 14.8 26.7 19.4 9.5 18.1
(Agriculture) 12.5 -59.8 9.2 10.7 -5.8 8.6
Secondary 16.9 -110.7 12.2 24.4 -5.5 20.9
(Manufacturing) -15.4 -115.1 -19.7 2.8 -12.6 0.9
Tertiary 55.7 186.0 61.1 56.1 96.0 60.9
All sectors 100.0 100.0 100.0 100.0 100.0 100.0
Source: Abridged from Mathew (1996:206) based on N.S.S. 32nd and 43rd rounds.

21
The socio-economic status of these families has changed. The old regime of high populationgrowth, low per capita income growth, higher incidence of rural poverty, relatively lowsocial development, dependence on primary sector as well as labour-intensive manufacturein the secondary sector for employment and a trade unionist strategy of concentrating onwage bargaining and formal employment status supported by political parties has givenway, by the eighties, to a regime of low population growth, low incidence of absolutepoverty, relatively high social development, higher incidence of unemployment and highgrowth of the service sector that has emerged as the single largest provider of newemployment (Table 2.12). This shift in the socio-economic regime is the major incentivefor the changed mode of labour on a subsistence strategy.

22
3. Changes in Land Use Pattern
The land use pattern in Travancore-Cochin and Malabar up to1956 shows that only wetlandsand most fertile and convenient regions had been brought under cultivation by the end ofthe 19th century Kerala. Rice, coconut, pulses and vegetables accounted for the bulk ofthe crops grown. Cultivation was mainly for subsistence or for local trade. Thecommercialisation of agriculture commenced in the closing years of the 19th century andthe early part of the 20th century with the entry of European capital into the plantationsector, mainly tea, coffee, rubber and cardamom. K N Raj says “The process of raisingland values was further helped by the growth of population and infra-structural investmentsin irrigation, communication and transport, particularly in regions with obviously too highcommercial potential. With rising values of land and expanding opportunity for trade inagricultural produce came also the inflow of finance from outside the agrarian societythrough urban traders and moneylenders” (Raj, K.N. 1985)
After the formation of the Kerala state there has been diversification in the cropping pattern.In addition to rice and tapioca a number of other garden land crops have contributed to thestate’s food supply. As regards cash crops, cultivation pepper, ginger and other traditionalexport crops has virtually stagnated. Cardamom and tea have not shown any substantialincrease areawise. Areas under coconut and coffee have increased slightly. The singlecrop which has gained immensely during the past 30 years as rubber, with a four foldincrease in area. The institutional promotion and guidance encouraged farmers to take torubber cultivation. The steady increase in rubber prices and the assurance given to rubbergrowers by the government of an expanding rubber market due to industrialisation of thecountry were clear signals that rubber was a dependable cash crop. In consequence,rubber cultivation spread from the High Ranges to midlands and even to marshy coastallands.
Even though rice is the single largest crop grown in Kerala even today, its area under ricecultivation has gone down by 150% in the past three decades. Rising cost of cultivation,stagnating rice prices and lucrative alternative uses of paddy lands are the main reasons forthe wise decline.
Changes in land use patterns during the past 30 years bring out three important patterns.Firstly, the area put to non- agricultural purposes has increased mainly due to populationpressures and emerging living styles. Secondly, area under forest has dwindled due toexpansion of plantations, river valley projects and encroachment of farmers into forestlands.Thirdly, consequent to the rise in the cost of cultivation of traditional crops, more land iseither left fallow or used to grow less labour absorbing crops.
With the passing of the Agrarian Relations Act in 1960 and the Land Reform Act in 1963,

23
tenancy rights were conferred on cultivators. Most owner cultivators of the 1960’s andthe 1970s had been tenants until the late 1950s. Fixity of tenure granted by the Kerala LandReforms Act conferred ownership rights upon them. Most of these farmers, who belongedto the lower middle class, proceeded to cultivate their holdings intensively to sustainthemselves and produce a substantial marketable surplus. Leasing out lands on a year-to-year basis also developed in Kuttanad.
The latest trend namely commercialisation of small holdings suggests substantial capitalentry. Small holdings have switched over to perennial crops like rubber. Large holdingshave pursued a diversified approach. The largest size group has shifted to coconut andrubber, discontinuing tapioca cultivation. The main shifts in the land-use patterns havehappened only after 1982 and the intensity of the conversion has been very high.
The incidence of tenancy has shown a declining trend in all states. For the country as awhole, about 38% of the land leased out was by households self-employed in agricultureabout 19% by agricultural labour house holds and the remaining by other households.
The disparity in control over land has to be viewed in relations to the changes taking placein the land lease market. The land lease market has been working in the reverse direction inseveral states. This reverse flow of tenancy is largely an outcome of the emerging technologyin agriculture according to the studies with reference to Punjab by Gill S. S (1989) &Singh Igbal. In order to realise the economies of scale in the new technology, the mediumand large holding have entered the lease markets. However, in the case of small and marginalholdings, the ownership of work animals for cultivation has become increasingly difficultand the number of work animals in most part of the country has shown a sharp decline inthe seventies. Also non-farm employment opportunities have increased in regions of rapidgrowth of agriculture. In such a situation, it must have been advantageous for non-cultivatingowners of small holdings to lease out their land. The tenancy relation that has emerged inagriculture is however, qualitatively different from that of the past.
The incidence of tenancy has shown a declining trend in all the states in India. The form oftenancy has also undergone change. In a few states, commercial tenancy has gainedimportance. In all the states, the area leased under ‘other terms’ (implying mainly oraltenancy) has shown substantial increase.
There have been qualitative and quantitative changes in tenancy. According to the 31stround of the NSS, at the all-India level 34 percent of the operated area leased-out was byhouseholds who were self-employed in agriculture; about 19 percent by agricultural labourhouseholds and about 46 percent by other households. Regarding the type householdswhich leased in land, the survey showed that it was agriculture. A marked exception to thisis Kerala where about 30 percent of the area leased was by others. The extent to whichallocation of land through the land-lease market has affected the size distribution of operationalholding in Kerala is shown in Table 3.1.

24
Table 3.1 Distribution of operational holdings reporting leased-in area and ofdistribution of leased-in area Size Group of Operational Holdings: Kerala
Broad Size % of operational holdings % distribution of Area Leased in Class Operati- reportings leased in area area leased in onal holdings during any season during Khari and Any part Major
Rabi of the part of year year
0.002-0.20 7 94 42 39
0.21 -0.50 6 94 67 67
0.51 -1.00 4 99 41 41
1.01 -2.00 10 87 128 115
2.01 -4.00 7 99 51 51
4.01-10.00 17 81 41 41
10.01 and above 60 89 24 24
All Sizes 7 91 394 379
Source: Sarvekshana January-March 1997.
According to the report of Sarvekshana January- March 1997, for the broad size class ofoperational holdings of 10 hectares and above, the proportion of operational holding reportingleased-in area during any season was 60 percent. The proportion of area leased in duringboth the seasons was 89 percent. The area leased in during any part of the year by this sizegroup was 24 hects. For size-class 1.01 to 2.00 hect the area leased in are 128 hect., thehighest for any size class.

25
Tab
le-3
.2
Lan
d U
se P
atte
rn i
n K
eral
a 19
95-’
96(A
rea
figu
res
in P
erce
ntag
e)
Cla
ssif
icat
ion
of L
and
1975
-76
1980
-81
1985
-86
1990
-91
1994
-95
1995
-96
1997
-98
1998
-99
1999
-00
1. T
otal
geo
grap
hica
l are
a10
0.00
100.
0010
0.00
100.
0010
0.00
100.
0010
0.00
100.
0010
0.00
2. F
ores
t27
.84
27.8
427
.84
27.8
427
.84
27.8
427
.83
27.8
027
.80
3. L
and
put
to n
on-a
gric
ultu
ral
uses
6.67
6.94
7.17
7.65
8.31
8.06
8.24
8.60
9.60
4. B
arre
n an
d un
cult
ivab
le la
nd2.
022.
212.
141.
501.
201.
111.
000.
700.
70
5. P
erm
anen
t pas
ture
s an
d ot
her g
razi
ng la
nds
0.51
0.14
0.11
0.05
0.04
0.03
0.02
0.02
0.00
7
6. L
and
unde
r m
isce
llan
eous
tre
e cr
ops
2.17
1.64
1.29
0.89
0.83
0.69
0.57
0.50
0.50
7. C
ulti
vabl
e w
aste
2.92
3.32
3.23
2.43
2.12
1.91
1.67
1.61
1.50
8. F
allo
w o
ther
tha
n cu
rren
t fa
llow
0.59
0.69
0.72
0.68
0.79
0.75
0.71
0.81
0.80
9. C
urre
nt f
allo
w0.
941.
121.
111.
141.
231.
321.
511.
801.
90
10.
Net
are
a so
wn
56.3
456
.10
53.8
157
.83
57.6
458
.29
58.4
458
.16
57.6
0
11. T
otal
cro
pped
are
a76
.72
74.2
573
.77
78.3
278
.46
78.9
476
.41
75.1
077
.20
Sou
rce:
Eco
nom
ic R
evie
w 2
001,
Sta
te P
lann
ing
Boa
rd.
26
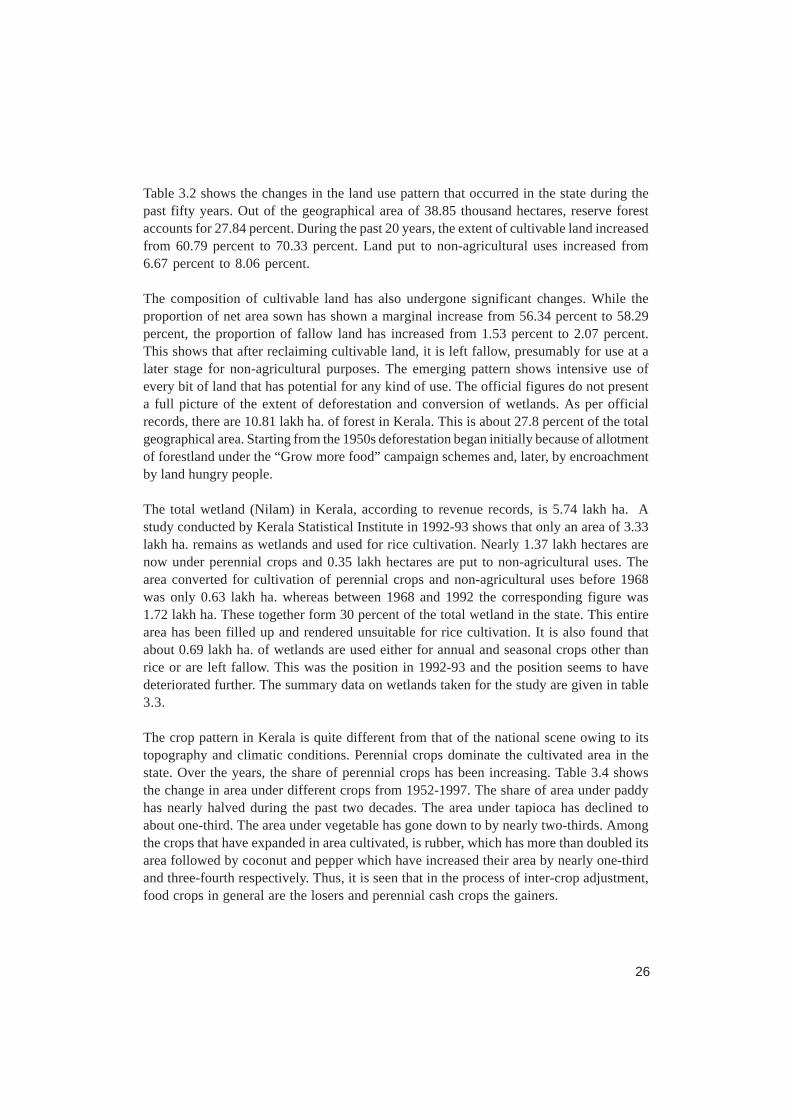
Table 3.2 shows the changes in the land use pattern that occurred in the state during thepast fifty years. Out of the geographical area of 38.85 thousand hectares, reserve forestaccounts for 27.84 percent. During the past 20 years, the extent of cultivable land increasedfrom 60.79 percent to 70.33 percent. Land put to non-agricultural uses increased from6.67 percent to 8.06 percent.
The composition of cultivable land has also undergone significant changes. While theproportion of net area sown has shown a marginal increase from 56.34 percent to 58.29percent, the proportion of fallow land has increased from 1.53 percent to 2.07 percent.This shows that after reclaiming cultivable land, it is left fallow, presumably for use at alater stage for non-agricultural purposes. The emerging pattern shows intensive use ofevery bit of land that has potential for any kind of use. The official figures do not presenta full picture of the extent of deforestation and conversion of wetlands. As per officialrecords, there are 10.81 lakh ha. of forest in Kerala. This is about 27.8 percent of the totalgeographical area. Starting from the 1950s deforestation began initially because of allotmentof forestland under the “Grow more food” campaign schemes and, later, by encroachmentby land hungry people.
The total wetland (Nilam) in Kerala, according to revenue records, is 5.74 lakh ha. Astudy conducted by Kerala Statistical Institute in 1992-93 shows that only an area of 3.33lakh ha. remains as wetlands and used for rice cultivation. Nearly 1.37 lakh hectares arenow under perennial crops and 0.35 lakh hectares are put to non-agricultural uses. Thearea converted for cultivation of perennial crops and non-agricultural uses before 1968was only 0.63 lakh ha. whereas between 1968 and 1992 the corresponding figure was1.72 lakh ha. These together form 30 percent of the total wetland in the state. This entirearea has been filled up and rendered unsuitable for rice cultivation. It is also found thatabout 0.69 lakh ha. of wetlands are used either for annual and seasonal crops other thanrice or are left fallow. This was the position in 1992-93 and the position seems to havedeteriorated further. The summary data on wetlands taken for the study are given in table3.3.
The crop pattern in Kerala is quite different from that of the national scene owing to itstopography and climatic conditions. Perennial crops dominate the cultivated area in thestate. Over the years, the share of perennial crops has been increasing. Table 3.4 showsthe change in area under different crops from 1952-1997. The share of area under paddyhas nearly halved during the past two decades. The area under tapioca has declined toabout one-third. The area under vegetable has gone down to by nearly two-thirds. Amongthe crops that have expanded in area cultivated, is rubber, which has more than doubled itsarea followed by coconut and pepper which have increased their area by nearly one-thirdand three-fourth respectively. Thus, it is seen that in the process of inter-crop adjustment,food crops in general are the losers and perennial cash crops the gainers.

27
Table 3.3 Conversion of wet lands in Kerala
Pattern of Land Use Area Percentage(in lakh hectares)
1. Area classified as wet land (Nilam)(As per basic tax register) 5.74 100.00
2. Area under perennial crops 1.37 23.80
3. Area under non-agricultural uses 0.35 6.10
4. Area under annual & Seasonal crops 0.49 8.50
5. Fallow land 0.20 3.50
6. Rice 3.33 58.10
7. Area converted for perennial cropsand non agricultural uses
a) Before 1968 0.63 11.00
b) 1968 to 1992 1.09 18.90
c) Total 1.72 29.90
Source: Conversion of Paddy land, Kerala, Kerala Statistical Institute, Thiruvananthapuram – 1994
Except rice and plantation crops most of the other crops are raised under a multi-tiercropping system in and around homesteads. In most of the homesteads coconut is thebase crop and other crops like pepper, plantain, arecanut, tapioca, and tubers are grown asinter-crops. Thus one acre of coconut garden may contain in addition to the coconut trees,fifty cents of tubers, thirty cents of plantain, ten cents of pepper, five cents of ginger etc.This mixed cropping system has given way to the mono-cropping system and affectedcrop diversity in homestead farms. Rubber is the monocrop typically cultivated inhomesteads.
The state has about 5.74 lakh ha. wetlands according to old village records (Mahesh).Nearly 4 lakh ha. Of this area was being used for rice cultivation and a small portion forsugarcane, banana and plantains, etc. The area under rice touched a maximum by the mid-seventies mainly through stabilisation of area under winter and summer crops. The physicalarea under rice has been continuously on the decline during past two decades. The net areasown under rice is now only 2.5 lakh ha. The decline is still continuing (Table 3.5).aqTable 3.5 Change in Area under Rice Cultivation (Area in Lakh Hectares)

28
Table 3.4 Area under Principal Crops 1957-58 to 1996-97
Name of crop utilisation 1957-58 1975-76 1985-86 1995-96 1996-97(Forcast)
Net cultivated area 1840 2189 2191 2265 -
Gross cropped area 2211 2981 2867 3067 -
Rice 767 885 678 471 431
Sugar Cane 9 8 8 6 6
Pepper 91 108 122 191 173
Ginger 9 12 16 13 14
Arecanut 50 77 59 71 73
Banana-Plantain 41 52 43 73 72
Cashew 44 109 138 103 101
Tapioca 214 327 203 114 142
Coconut 463 693 705 914 1005
Tea 40 38 35 35 -
Coffee 17 42 66 82 -
Rubber 100 207 330 449 -
Total food grains - 926 712 583 -
Total food crops - 1909 1606 1441 -
Total non-food crops - 1072 1261 1626 -
Source: Statistics since independence, Dept. Economics and Statistics. , 1998.
Table 3.5 Change in Area under Rice Cultivation (Area in Lakh Hectares)
Season 1975-76 1980-81 1985-86 1990-91 1995-96
Autumn 3.97 3.49 2.80 2.36 1.87
Winter 3.84 3.54 3.13 2.59 2.25
Summer 1.04 0.98 0.85 0.65 0.60
Total 8.85 8.02 6.78 5.60 4.70
Source: Dept. Economics and Statistics, Kerala, 1997.
The total area under food grains in general was only 4.31 lakh hectares in the year 1996-97. The production of rice declined from 9.53 lakh mts in 1995-96 to 8.7 lakh mts in 1996-

29
Area (000 Ha)
Production (000 T)
Productivity (Kg/Ha)
123412341234
123123
123123123
97 (Graph 3.1). Though the total area under rice declined, the area under high- yieldingvariety has not declined. As a result, the average productivity of the State has remainedabove the national average. According to Economic survey 1997 during 1996-97, the areaunder high yielding variety (Viruppu 40 percent, Mundakan 36 percent and Puncha 24percent) is retained.
Graph 3.1 Area, Production and Productivity of Rice in Kerala
Year
Table 3.6 Distribution of working force in Kerala
Item 1951 1991No. Of Percen No.Of Percenworkers tage workers tage
Cultivators 10.12 23.22 10.16 12.24
Agricultural Labourers 11.15 25.57 21.21 25.55
Life stock, Forestry, Fishing, Huntingand plantation orchards and allied activities 2.34 6.06 7.67 9.24
Mining and Quarrying - - 0.82 0.99
a) Processing servicing and Repairsin Household industry 4.71 10.80 2.14 2.58
b) Manufacturing processing servicingand repairs in other sectors 4.10 9.40 9.62 11.59Construction 0.58 1.33 3.32 4.00
Trade and Commerce 2.89 6.63 10.50 12.64
Transport, storage and communication 1.39 3.19 4.97 5.99
Other services 6.02 13.80 12.60 15.18
Total main workers 43.60 100.00 83.01 100.00
Source: Statistics since independence, Dept. Economics and Statistics, 1998.
1991-92 1992-93 1993-94 1994-95 1995-96
123123123123123123123123123123123123123
123123123123123123123123123123123123123123123123123123123123123123123123123123123123123123123
123123123123123123123123123123123
123123123123123123123123123123123123
1212121212121212121212121212121212121212121212121212121212121212
123123123123123123123123123123
121212121212121212121212
123123123123123123123123123123123123123123123123123123123123123123123123123123123123123123123
123123123123123123123123123123
123123123123123123123123123123123123
123123123123123123123123123123123123123123123123123123123123123123123123123123123123123123123123
123123123123123123123123123123
12121212121212121212121212
123123123123123123123123123123123123123123123123123123123123123123123123123123123123123123123123
123123123123123123123123123123123
2000
1500
1000
500
0

30
In 1951, 23.22 percent of the working force were cultivators and in 1991 it declined to12.24 percent. Agricultural labourers constituted 26 percent of the working force both in1951 and in 1991. The increase in the construction working force may be the result ofimmigrant construction workers from the neighbouring state of Tamil Nadu.
The emerging land use/crop pattern and the distribution of the working force in the statethus show the following features.
The area of wetlands has declined considerably. A portion of the shift of wetlands has beenfor non-agricultural activities. The remaining portion is still available for re-conversion torice. This is the area now covered by seasonal crops. Perennial crops have already coveredthe rest of the area. Thus the overall effect of reduction of wetland is the reduction of areaunder rice. Vast areas previously under a multiple crop system are now covered by themono-crop system. Perennial cash crops dominate the farm sector. One section ofagricultural labourers who had worked in these farm sectors became rubber tappers andanother continued as casual agriculture labour. High wage rates greatly reduce the numberof workdays. Fall in rubber prices reduces the number of tapping days. Agricultural labourersand rubber tappers cultivate seasonal crops on a lease basis. The area under lease on ‘otherterms’ is bringing about a new pattern of agrarian relations in Kerala.

31
4. The Study Area
General profile
The study was conducted in Padopattakulanji of Kulanada panchayat, Ayithil ward ofMezhuveli panchayat, and Oonnukallu of Chenneerkara panchayat. Kulanada, Chenneerkaraand Mezhuveli are adjacent panchayats situated on the south-western part of Pathanamthittadistrict. The study area of these panchayats comes under southern midland zone.
The study area : A profileFig. 4.1
Figure 4.1 shows the map of the three panchayats, the spotted part in the map representingthe study area. The three panchayats are in Kozhencherry Taluk. Box 4.1 shows the generalprofile of the study area. The three panchayats together has a total area of 55.44 sq. kmand the total population of the study area comes to about 10,700 as per panchayat records.There are three U.P. schools, five L.P. schools and five anganvadis in the study area. Thetopography of the study area consists of hills, slopes, planes, low-lying wetlands and
MULAKUZHAGRAMA PANCHAYAT
ARANMULAGRAMA PANCHAYAT
MALLAPUZHASSERYGRAMA PANCHAYAT
ELANTHOORGRAMA PANCHAYAT
PATHANAMTHITTAMUNCIPALITY
OMALLOORGRAMA PANCHAYAT
E
NS
W
CHENNEERKARA
STUDY AREAAC
HE
NC
OV
IL R
IVE
R
MEZHUVELIKULANADA
VENMONY
M.C. ROAD

32
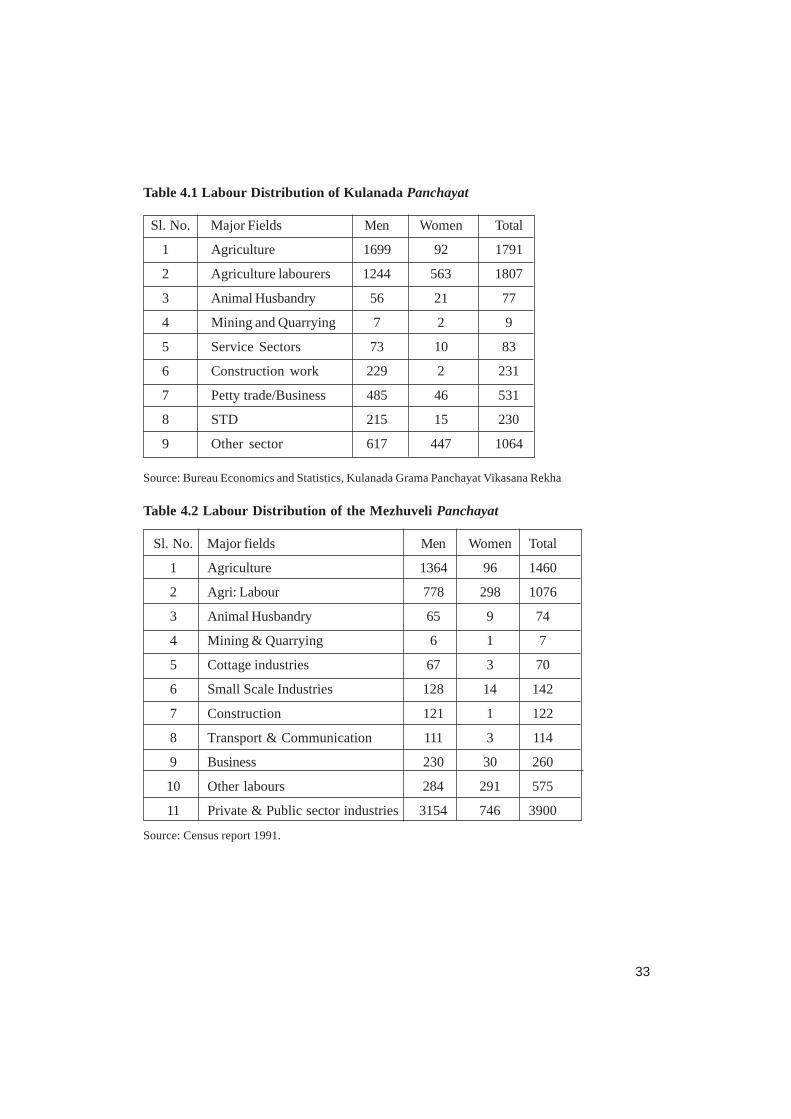
watershed areas. Agriculture is the main means of livelihood for 3598 persons of Kulanadapanchayat of whom 1807 are agricultural labourers (Table 4.1). A small proportion ofpopulation is engaged in non-agricultural activities like quarrying, running petty trades,STD service stations. Table 4.2 shows that 7,800 persons are working in different sectorsin the Mezhuveli Panchayat- 2,536 people in the agricultural sector, (1,076 people asagricultural labourers) and 3,900 people in government services and private service sector.A small proportion is engaged in other activities such as quarrying, cottage and small scaleindustries, business and petty trade.
The three panchayats are bounded by Aranmula and Mallapuzhasserry panchayats on theNorth, Elanthoor and Omalloor panchayat on the east, the Achenkovil River on the Southand Mulakuzha and Venmony panchayats on the west (Figure 4.1). Nedumpoyka andKarayathu Padi of Ramanchira padasekharam of Kulanada panchayat. Ayithil Ettupara Padavuand Pulumthitta of ward 6 of Mezhuveli panchayat and Kuttikadu fields of ward 6 andPanackal fields of ward 6 of Nallanikunnu area of Chenneerkara panchayat were selectedas the sample. A general profile of the study area is given in box 4.1.
General profile of the study areaBox 4.1
Name : Padopattukulanji Ward – 6
Ayithil Ward – 6
Ooonnukallu Ward - 6
Block : Kulanada
Elanthoor
Panchayats & Area
Kulanada : 21.5 Sq. Km
Mezhuveli : 14.44 Sq. Km
Chenneerkara : 19.5 Sq. Km
District : Pathanamthitta
State : Kerala
Population : 10700
(Panchayat Record 2001)
No. Of Schools : 13
U P Schools : 3
Source: Primary Analysis
LPS : 5Anganvadi : 5PWD Roads
Pannil - Raman ChiraElavanthitta - KozhencherryElavumthitta - ElanthoorElavumthitta - Ramanchira
Panchayat Roads
Punnakunnu - PookaithaPookaitha - ChakkalamannilPunnnakunnu - ChakkalamannilElavumthitta - AyithilElavumthitta - MuttathukonamKulakkada - OdiyoozhumMulloor - KulakkadaOonnukal - Mathoor
33
Table 4.1 Labour Distribution of Kulanada Panchayat
Sl. No. Major Fields Men Women Total
1 Agriculture 1699 92 1791
2 Agriculture labourers 1244 563 1807
3 Animal Husbandry 56 21 77
4 Mining and Quarrying 7 2 9
5 Service Sectors 73 10 83
6 Construction work 229 2 231
7 Petty trade/Business 485 46 531
8 STD 215 15 230
9 Other sector 617 447 1064
Source: Bureau Economics and Statistics, Kulanada Grama Panchayat Vikasana Rekha
Table 4.2 Labour Distribution of the Mezhuveli Panchayat
Sl. No. Major fields Men Women Total
1 Agriculture 1364 96 1460
2 Agri: Labour 778 298 1076
3 Animal Husbandry 65 9 74
4 Mining & Quarrying 6 1 7
5 Cottage industries 67 3 70
6 Small Scale Industries 128 14 142
7 Construction 121 1 122
8 Transport & Communication 111 3 114
9 Business 230 30 260
10 Other labours 284 291 575
11 Private & Public sector industries 3154 746 3900
Source: Census report 1991.

34
Table 4.3 Changes in Agricultural Land Area, 1951-1991; Mezhuveli Panchayat.
Land Area As per 1951 1991 PercentageCensus (Ha.) Census (Ha.) increase/decrease
Wetland 303.00 179.00 (-) 40.90
Gardenland 1037.00 1258.40 + 21.30
Fallow land 100.00 6.60 93.30
Source: Resource Map Mezhuveli Panchayat
Table 4.4 Change in the Number of Agricultural Labourers, 1951-‘91; MezhuveliPanchayat
1951 Census 1991 census DeclinePercentage
Men 3601 1363 6212
Women 3607 96 97.33
Total 7208 1460 79.74
Source: Mezhuveli Grama Panchayat – Vikasana Rekha
Land use pattern and labour distribution of the panchayats
Once Mezhuveli was a place of farmers. All foods crops for local consumption weregrown in the locality itself. Coconut, rice and plantains were the important farm products.Other farm products like tapioca, colacasia, yam and pulses were also cultivated. Fiftyyears ago, 365 hectares were under rice cultivation. From 1950 onwards plantains beganto be widely cultivated in rice fields. The main crop of garden lands is coconut. But owingto widespread diseases of coconut, cultivations have reduced the area under this crop.Rubber is at present the major cash crop of these areas. Nearly 124 hectares of wetlandwere converted into garden land over the period 1951 and 1991. The major wetland cropof rice has dwindled for a variety of reasons - crop diseases, attack of pest and insects,natural calamities, lack of high yielding verities of seeds, high price of fertilizers, pesticidesand insecticides, non-availability of labourers in time, high wage rates and low price ofrice. The process of conversion is still going on. Conversion of wetland into garden landsand bringing fallow lands under cultivation have increased the area of garden lands byabout 21 percent in this panchayat. This is shown in Table 4.3 and Graph 4.1
Table 4.4 and Graph 4.2 show changes in the number of full-time agricultural labourers,both men and women, in Mezhuveli panchayat between 1951 and 1991. Forty years havebrought about nearly 80 percent decline in the number of full time agriculturists in thepanchayat. In agriculture the number of women laboures was equal to the number of menlabourers in 1951. But in 1991 the numbers have come down for both; but the decline in

35
the case of women has been phenomenal. It constituted only 2.7 percent of the number in1951. The total area of Mezhuveli panchayat (1444 Ha.) is 0.037 percent of the total landarea of the Kerala State. Land use pattern of Mezhuveli panchayat is shown in Table 4.6and graph 4.3. Uncultivable fallow land consists of Kavu, playgrounds etc. Buildings includingresidential houses of farmers which consist of 64 hectares are also included in the resourcemap. The major crop is rubber, which covers 49.42 percent of the total land area. Thearea under rice declined by about two-fifths. Those areas which are not converted fornon-agricultural purpose are cultivated with crops like tapioca, betelvine, arecanut, plantainsand vegetables. The areas under these crops are on the increase in recent years. Small andmarginal farmers and agricultural labourers together come to 2536 persons as shown inTable 4.2. Agricultural labourers especially rice farm workers, displaced from rice cultivation,dislike spatial dislocation for livelihood activities.
Table 4.5 Land Resource according to Geographic Position
Sl. No. Geographical Area PercentageArea (Hectares)
1 Highland 186 12.88
2 Midland 860 59.56
3 Lowland 398 27.56
Total 1444 100.00
Source: Resource Map of Mezhuveli Panchayat 1991.
0
200
400
600
800
1000
1200
1400
Area
Wetland Garden Land Fallow
Graph 4.1 Changes in Agricultural Land Area (1951-1991)

36
Table 4.6 Land Use Pattern of Mezhuveli Panchayat
Sl. No. Pattern of Land Use Area (Ha) Percentage
1. Rice(single crop) 66.00 4.60
2. Rice(double crop) 105.00 7.32
3. Rice (three crop) 1.40 0.10
4. Fallow(uncultivable) 6.60 -
5. Fallow(cultivable) 2.70 -
6. Rubber 709.00 49.42
7. Mixed cropping 470.00 32.76
(including- coconut)
8. Coconut 17.00 1.18
9. Tapioca 38.00 2.65
10. Cashew 19.00 1.32
11. Betel vine 3.90 0.27
12. Arecanut 1.40 0.10
13. Plantain 2.70 0.19
14. Vegetables 1.30 0.09
Total 1434.70 100
Source: Resource Map 1991.
Graph 4.2 Change in the Number of Agricultural Labourers (1951-1991)
0
500
1000
1500
2000
2500
3000
3500
4000
No. of Workers
1951 1991
Year
37
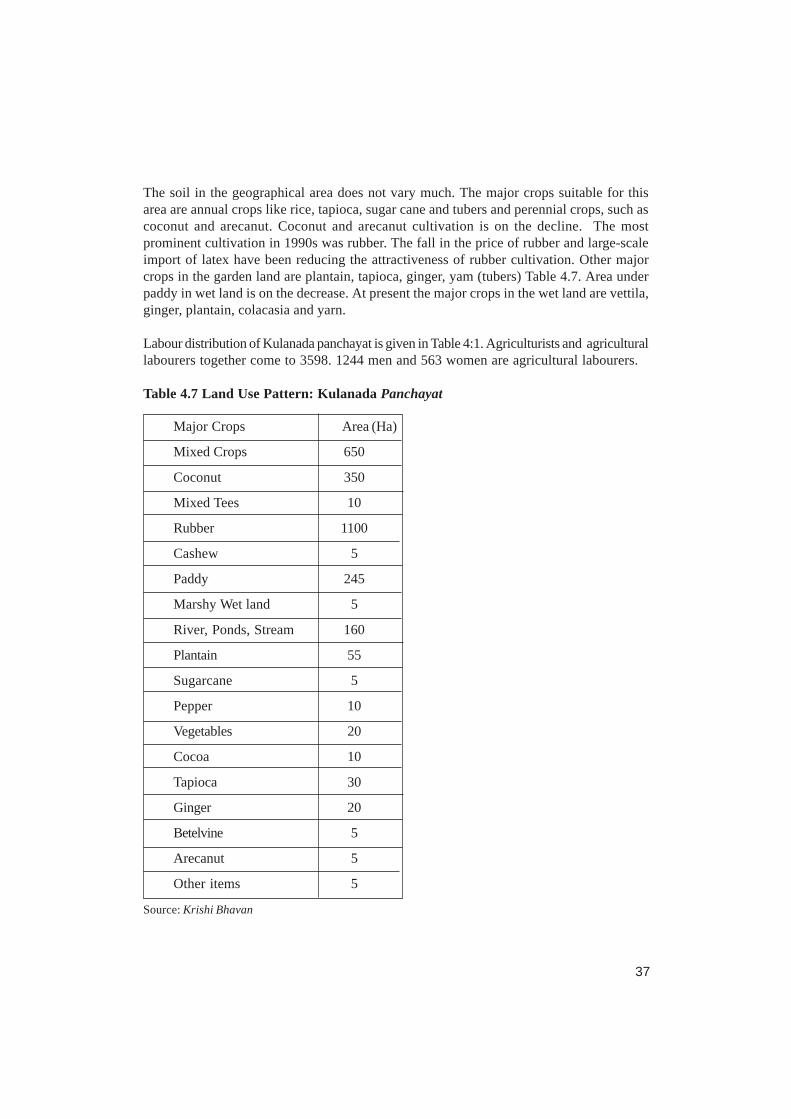
The soil in the geographical area does not vary much. The major crops suitable for thisarea are annual crops like rice, tapioca, sugar cane and tubers and perennial crops, such ascoconut and arecanut. Coconut and arecanut cultivation is on the decline. The mostprominent cultivation in 1990s was rubber. The fall in the price of rubber and large-scaleimport of latex have been reducing the attractiveness of rubber cultivation. Other majorcrops in the garden land are plantain, tapioca, ginger, yam (tubers) Table 4.7. Area underpaddy in wet land is on the decrease. At present the major crops in the wet land are vettila,ginger, plantain, colacasia and yarn.
Labour distribution of Kulanada panchayat is given in Table 4:1. Agriculturists and agriculturallabourers together come to 3598. 1244 men and 563 women are agricultural labourers.
Table 4.7 Land Use Pattern: Kulanada Panchayat
Major Crops Area (Ha)
Mixed Crops 650
Coconut 350
Mixed Tees 10
Rubber 1100
Cashew 5
Paddy 245
Marshy Wet land 5
River, Ponds, Stream 160
Plantain 55
Sugarcane 5
Pepper 10
Vegetables 20
Cocoa 10
Tapioca 30
Ginger 20
Betelvine 5
Arecanut 5
Other items 5
Source: Krishi Bhavan

38
The density of population in Kulanada Panchayat is 1069 which is marginally higher thanthat of Pathanamthitta district as a whole at 1026. In Kulanada Panchayat people used tofollow mixed cropping but now an area of 1100 hectares is under rubber. In the plains anarea of 350 hectares is under coconut. In the areas which once used to be double-croppedpaddy lands, plantains, betelvine, and vegetables are cultivated at present. Conversion ofwetland for cultivation of unorthodox crops like betelvine, vegetables and plantain iswidespread.
Graph 4.3 Average State Productivity Compared with Mezhuveli Panchayat
0
2000
4000
6000
8000
10000
12000
14000
16000
18000
20000
Productivity(Kg/Ha)
Under the betelvine development project of the Krishi Bhavan, and each plot gets a subsidyof Rs. 500 to Rs. 750 for the construction of support pandal. There is also a crop insuranceproject in operation. Other schemes available are employment scheme for young men andwomen in the agricultural sector, schemes for distribution of vegetables seeds for schoolsunder the Vegetable Development Project and free soil testing by Krishi Bhavan. Using thedifferent projects of Krishi Bhavan and People’s Plan Programme, unorthodox crops arebecoming popular in the area. The labour days for the agricultural labourers and marginalisedsection of farmers are consequently on the increase.
The study area has an undulating topography with slopes and valleys and rolling hills,interspersed with low-lying wet lands. The land slopes down the hilly area to the paddyfields, and it rises and falls in roller-coaster fashion, trapping small sections of paddy landsin between. The soil in the hamlets ranges from laterite to clay. The hilly areas are mainlyrocky with laterite and red soil in between. In the valleys laterite soil is seen. Clay andsandy alluvial soil are found in the low-lying plains and wetlands (Box 4.2).
123123123123123
Mezhuveli
State
123123123123123123123123123
123123123123123123
121212
123123123123123123123123123123123123123123123123123123123123123123123123123123123123123123123
12121212121212121212121212121212121212121212121212121212121212121212121212
123123123123123
121212
123123123123123123123
121212121212121212121212121212
123123123
1212
123123123123123
123123123123123123123
123123123123123123123
1212121212121212121212
123123123
123123

39
Box 4.2 Generalised Transect of the Study Area
Terrain Hills Slopes & Valleys Wet Land Slopes & valleys Hills
Soil Rocky Soil Sandy clay Laterite soil RockleyRead Soil Laterite Soil and Clay
Laterite Soil Alluvial soil
Water Scarcity Scarcity Abundant Scarcity Tap waterof water of water supply canal of water Tube wells
Tap water Deep wells irrigation steamsTube wells Streams ponds Deep wells
streams
Vegeta- Rubber Rubber Paddy Rubber Rubbertion Cashew Cashew Plantain Cashew Cashew
Natural trees Coconut Betelvine Natural trees CoconutArecanut Tapioca ArecanutTubers Ginger TubersPlantain PlantainGinger Ginger
Habita- Isolated huts All ---- All Isolatedtion SC communities communities Huts
Colonies scattered scattered SChouses houses Colonies
Liveli- Agricultural Farming --- Farming Agriculturalhood labourers service service labourerspattern Rural hollow bricks Hollow bricks Rural
farmers plantation plantation farmersQuarrying construction construction quarryingTapping work work tapping

40
5. Socio-Economic Profile of Labour
Political economy of labour
As maintained earlier, the downward trend in the primary commodities production sector,particularly the food production sector (rice and tapioca) for the past two decades needsto be arrested The reversal of this trend is inevitable to augment the income of farmers andto increase the employment days of the agricultural and other rural labourers.
Though wage rates have increased over time, the earnings of labourers have declined asthe number of days of employment fell more rapidly than rise in wage rates. With thedecline in area under rice, the traditionally trained crop-specific labourers switched to non-farm activities. Seasonal labour shortages and wage rates remaining higher than productivitycompelled small and marginal farmers to leave land either fallow or to switch over to lesslabour-intensive crops. As a result of the area decline and the subsequent fall in the days ofemployment, the younger generation preferred non-farm employment while the elderly leftthe sector in search of employment avenues in other sectors. Of late there is a change inlivelihood pattern. To avoid spatial dislocation and to retain their status of self-employment,marginal farmers and agricultural labourers have turned increasingly to cultivation of leased-in lands. In this endeavour they face little competition from cultivators. The interfacebetween supply of and demand for labour on the one hand and the intervening factors onthe other are schematically presented in chart 5.1.
On the one hand, there is high incidence of unemployment and on the other, changing jobexpectations of the younger generation. As mentioned earlier there has been virtually littlenet addition to the number of annual entrants in the group of 15-29 go to the labour forcesince 1990. It is this phenomenon of the shift in the social expectation of the youngergeneration in the rural areas that has contributed to the reported scarcity of labour in therural casual labour market (Kannan, 1990). Seventy-six percent of the young unemployedhad an educational attainment of secondary school level and above (Francis 1990). Despitean increase in area under coconut, plucking of coconuts, a manual unskilled job has becomedifficult because of scarcity of labour. The younger generation of women opts out oftraditional items of labour such as manual defibring of coconut husks and hand-spinningof coir. Younger members of fishing households prefer mechanized crafts. A whole rangeof rural unskilled manual work experiences scarcity of labour despite increasing wagerates. The rapid growth rates in wages for the rural unskilled labour (Table 5.1) comparedto that of skilled labour testifies to this phenomenon.
Some demand for labour in the rural labour market, especially for workers in constructionactivities, is now being met by immigrant labour from the nearby state of Tamil Nadu.Workers are on the look out for opportunities of stable employment even if that involves acompromise in earnings. A desperate search for stable employment, which ensures a regularincome, is the characteristic of the labour situation in Kerala.

41
Chart 5.1 Labour Market Conditions and Factors of Adjustment
Higher Productivity of Labour
More Labour Days Self Employment
Fallow Land Leased in Cultivation of Labour
Shift of Labour to Non-Farm Activity Spatial Dislocation of labour
Less Intense Use of Land Diversification Livelihood of work problem
Low labour High Cost of Higher Wage Rate in Relation Absorption Production to Labour Productivity
Decline in Paddy Field Casual Workers Wage in Money Employment Workers
Wage in Cash and kind Change in Cropping pattern
Agricultural Labour Ownership Right of Land
Land Legislation Act
Bonded Labour No Ownership Right of Land
Single family Labour Fixity of Labour Wage in Terms of Basic Necessity
Non Availability of Labour in Time

42
Table 5.1 Growth Rate in Money Wages of Rural Labour in Kerala 1963-64 to 1995-96
Category Period Whole Period
I II III
Paddy field labour-men 10.13 15.48 14.30 10.11
Paddy field labour-women 13.47 12.04 16.95 10.42
Rural construction, unskilled-men 10.49 14.13 13.13 10.28
Rural construction unskilled-women 10.66 14.40 14.17 10.94
Rural Construction, skilled men (Carpenter) 8.87 14.61 11.40 9.89
Rural construction- skilled men (mason) 9.14 14.60 11.24 9.80
Consumer Price Index for agricultural labourers 10.56 8.99 10.15 7.26
Source: Kannan K. P. w.p. 284, Page 29.
The staff resistance by labour unions, which was the characteristic of the labour markettill the mid eighties, has given way to tacit acceptance, a sign of changing preferences ofthe younger generation of the labour force as well as the failure of earlier union strategies.In this contest Kerala has lost a generation’s time (25 years) in modernizing and upgradingits labour-intensive occupations. This failure has thrown up its own dilemmas in the newcontext of economic liberalization. When the earlier strategy of protecting currentemployment failed and the economy could not generate adequate employment, governmentresorted to extensive relief programmes. In the new context of economic liberalization therationale of these programmes is being increasingly questioned mainly due to the fiscalcrisis of the government.
In this political economy of labour, the subsistence of marginal farmers and casual labourershas been adversely affected. The distributional change in the land holding pattern thathappened during the period between ‘seventies and the ’eighties has resulted in inter-generational economic mobility of households and reduced intra-generational inequality inland distribution (Nair 1992). As regards the incidence of tenancy, 56 percent of lesseesare households of the self-employed in agriculture. The leases are oral and not recorded inany documents. The distributional changes during late ’eighties show that the socio-economicstatus of these households has undergone significant change. Most of the cultivators havebecome lessors in the nineties due to various reasons already analyzed.
Economics of lease cultivation
The methodology followed for the collection of data from the three study area (namelyMezhuveli, Chenneerkara, and Kulanada) is given below. Two schedules were preparedfor surveying the economic profile of the lessees and lessors and one for recording the

43
cost of cultivation of crops such as betel, banana and tapioca. Another schedule wasprepared for conducting case studies of a few farmers who had been cultivating betel forthe last 50 years or more. The details were collected from 125 farmers of these threeregions: Padopattakulanji of Kulanada panchayat, Aythil of Mezhuveli panchayat, andOonnukallu of Chenneerkara panchayat. All the lessees and lessors in the Padasekarams ofNedumpoyka and Karayathupadi of Kulanada, Aythil Ettupara Padavu and Pulumthitta ofMezhuveli Panchayat and Kuttikadu fields and Panackal fields of Nallanikunnu ofChenneerkara Panchayat were surveyed for the preparation of the economic profile ofthese farmers. Cost of cultivation is worked out using farm management concepts. Theconcepts of cost used in the analysis are:
cost A1 : paid out cost - cash and kind expenses actually incurred by the cultivator.Cash and kind expenses include the following items. Wages paid to hiredlabour, value of seed, manure and fertilizer and insecticides, transportationcharge.
Cost A2 : Cost A1 plus rent of land taken on lease.
Cost B : Cost A2 plus imputed value of rent on owned land and interest.
Cost C : Cost B plus the imputed value of family labour employed on the farm.
Concept of profit/loss
Profit or loss has been worked out on the basis of the various cost concepts by deductingthe corresponding figures from gross income. An owner operator is concerned with grossincome minus Cost A1 and a tenant operator with gross income minus Cost A2. Thisconstitutes the return to the farm operator and his family labour. Gross income minus CostB shows the return from family labour only. The net income arrived at on Cost C gives thepure profit or loss for the entrepreneurial work of the operator.
Basis of evaluation
The following are the bases for evaluation of inputs and outputs followed in the presentstudy.
Farm labour
Most of the labour is imputed labour valued at existing wage rate. Human labour is assessedin terms of days of 8 hours each. Gift labour is valued at the same rate as family labour.
Rent paid on leased in holding
Rent is paid for a year on a verbal contractual basis. Table 5.2 shows the distribution ofsample lessee households of by size class of owned land, in 1970 at the point of origin.The proportion of households, formed earlier than 1970, was only 25.1 percent (whoowned less than 30 cents of land). About 72 percent were marginal farmers owning 31–300 cents of land. All the households formed during and after 1970 were of landless
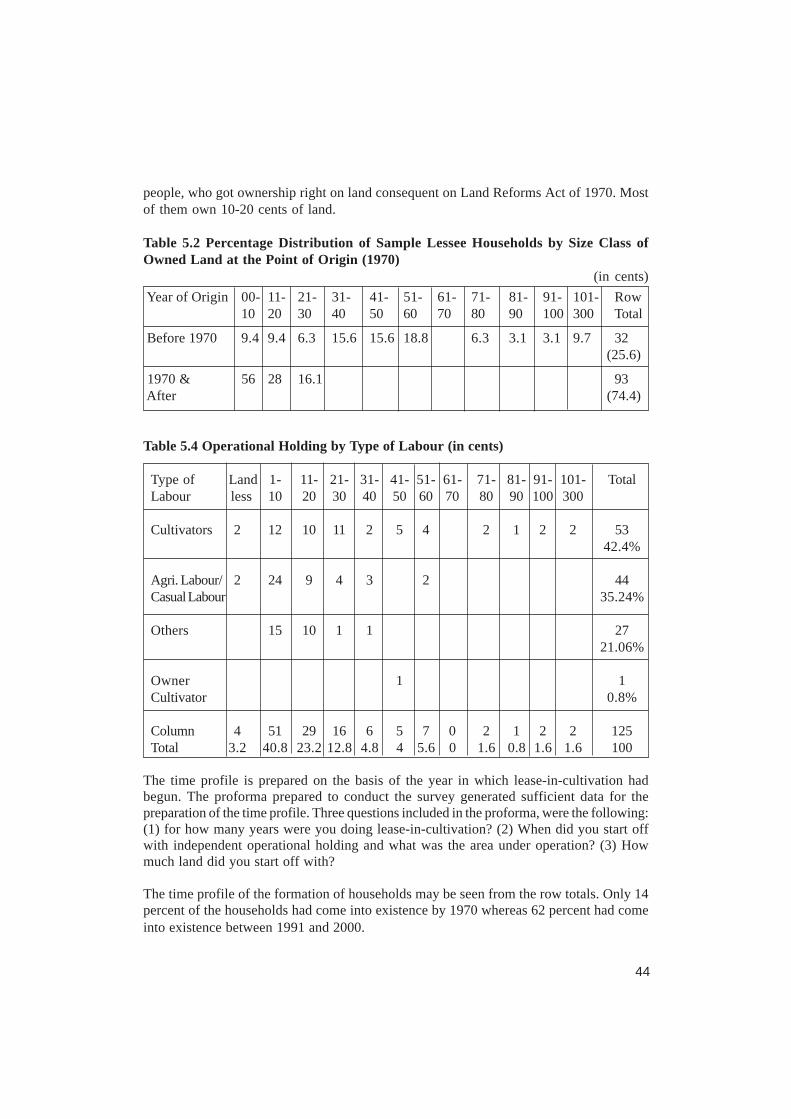
44
people, who got ownership right on land consequent on Land Reforms Act of 1970. Mostof them own 10-20 cents of land.
Table 5.2 Percentage Distribution of Sample Lessee Households by Size Class ofOwned Land at the Point of Origin (1970)
(in cents)
Year of Origin 00- 11- 21- 31- 41- 51- 61- 71- 81- 91- 101- Row10 20 30 40 50 60 70 80 90 100 300 Total
Before 1970 9.4 9.4 6.3 15.6 15.6 18.8 6.3 3.1 3.1 9.7 32 (25.6)
1970 & 56 28 16.1 93 After (74.4)
Table 5.4 Operational Holding by Type of Labour (in cents)
Type of Land 1- 11- 21- 31- 41- 51- 61- 71- 81- 91- 101- TotalLabour less 10 20 30 40 50 60 70 80 90 100 300
Cultivators 2 12 10 11 2 5 4 2 1 2 2 5342.4%
Agri. Labour/ 2 24 9 4 3 2 44Casual Labour 35.24%
Others 15 10 1 1 2721.06%
Owner 1 1Cultivator 0.8%
Column 4 51 29 16 6 5 7 0 2 1 2 2 125Total 3.2 40.8 23.2 12.8 4.8 4 5.6 0 1.6 0.8 1.6 1.6 100
The time profile is prepared on the basis of the year in which lease-in-cultivation hadbegun. The proforma prepared to conduct the survey generated sufficient data for thepreparation of the time profile. Three questions included in the proforma, were the following:(1) for how many years were you doing lease-in-cultivation? (2) When did you start offwith independent operational holding and what was the area under operation? (3) Howmuch land did you start off with?
The time profile of the formation of households may be seen from the row totals. Only 14percent of the households had come into existence by 1970 whereas 62 percent had comeinto existence between 1991 and 2000.
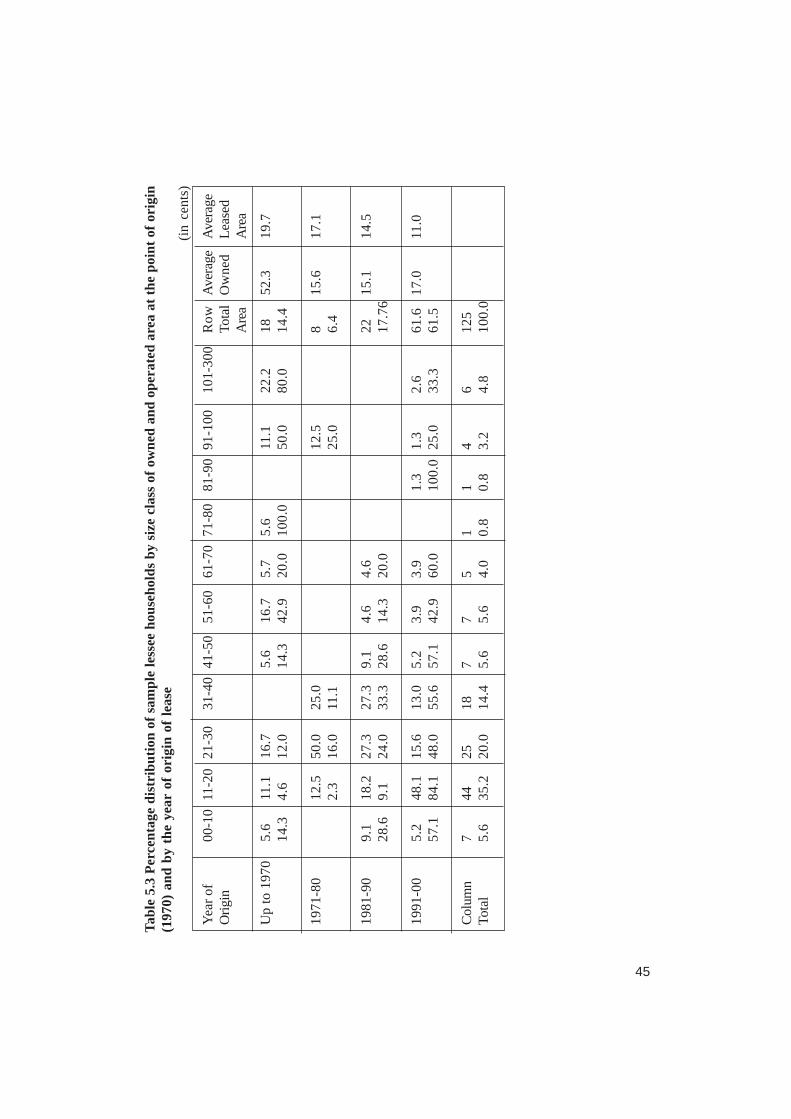
45
Tab
le 5
.3 P
erce
ntag
e di
stri
buti
on o
f sa
mpl
e le
ssee
hou
seho
lds
by s
ize
clas
s of
ow
ned
and
oper
ated
are
a at
the
poi
nt o
f or
igin
(197
0) a
nd b
y th
e ye
ar o
f or
igin
of
leas
e(i
n ce
nts)
Yea
r of
00-1
011
-20
21-3
031
-40
41-5
051
-60
61-7
071
-80
81-9
091
-100
101-
300
Row
Ave
rage
Ave
rage
Ori
gin
Tota
lO
wne
dL
ease
dA
rea
Are
a
Up
to 1
970
5.6
11.1
16.7
5.6
16.7
5.7
5.6
11.1
22.2
1852
.319
.714
.34.
612
.014
.342
.920
.010
0.0
50.0
80.0
14.4
1971
-80
12.5
50.0
25.0
12.5
815
.617
.12.
316
.011
.125
.06.
4
1981
-90
9.1
18.2
27.3
27.3
9.1
4.6
4.6
2215
.114
.528
.69.
124
.033
.328
.614
.320
.017
.76
1991
-00
5.2
48.1
15.6
13.0
5.2
3.9
3.9
1.3
1.3
2.6
61.6
17.0
11.0
57.1
84.1
48.0
55.6
57.1
42.9
60.0
100.
025
.033
.361
.5
Col
umn
744
2518
77
51
14
612
5To
tal
5.6
35.2
20.0
14.4
5.6
5.6
4.0
0.8
0.8
3.2
4.8
100.
0

46
During the seventies and the eighties 6 percent and 18 percent households had undergonedistributional changes. Seventy percent of the households of all years had come underthree size classes namely 11-20 cents, 21-30cents and 31-40 cents i.e. the number oflessees are the highest under these groups. The total area under lease has been decreasingbut the number of households engaged in lease cultivation is increasing. It shows thathouseholds could not afford to lease in large areas due to lack of finance. Further, a shifthas taken place in the category of households engaged in lease cultivation. An upwardmobility of the households engaged in lease in cultivation is observed in the study.
Table 5.3 depicts the type of operational holding and the type of labourers engaged infarming activities. It reveals that a new set of labour class has taken up lease operation.The lessors and lessees in agriculture of the ’eighties are no more in cultivation. Incidenceof high unemployment and shift in the social expectation of the younger generation may bethe factors which have given place to the emergence of a new pattern of labour. Cultivationis undertaken on a commercial basis, and the items cultivated are those which have highmarket demand.
A cultivator, according to the definition by census 2001, is one who is engaged in cultivationof land owned or held from government or held from private persons or institutions forpayment in money, kind or share. Cultivation involves ploughing, sowing, harvesting andproduction of cereals and millet, crops such as paddy, wheat, jower, bajra, ragi, etc. andother crops such as sugar cane, tobacco, groundnuts, tapioca etc. and pulses raw jute andkindred fibre crop, cotton cinchona and medicinal plants, fruit-growing, vegetable-growingor keeping orchard or groves etc. An agricultural labour is one who works in anotherperson’s land for wages in cash or kind or share. An agricultural labour has no right oflease or contract on land on which he/she works. Others are all those who are engaged inany economic activity but are not cultivators or agricultural labourers.
Table 5.5 Land Area Owned by Lessors in Different size classes
Size Class (Cents) No. Of PercentagePersons
00-50 18 18.95
50-100 21 22.11
100-150 18 18.95
150-200 16 16.84
200-250 10 10.53
250-300 3 3.16
300-400 2 2.11
400-500 4 4.21
500-600 3 3.16

47
Table 5.6 Wetland Area Kept Fallow by Lessors in Different Size Classes
Size Class No. Of(Cents) Persons
00-50 4
50-100 9
100-150 4
150-200 2
200-250 1
250-300 1
300-400 0
400-500 1
The demand for labour is influenced, inter alia, by the land holding structure and thecropping pattern (Nair 1999). The structure of land holdings of the lessor class in thestudy area is given in Table 5.5. The structure of the land holdings of the 83 lessors revealsthat 88 percent of the holdings are less than a hectare in size and that only 12 percent ofholdings are above 2 hectares. A highly skewed distribution of land towards sub-marginaland marginal holdings reduces the demand for hired labour as family labour substitutes toa very great extent hired labour requirement. Among the different size classes 22 personsare keeping their land fallow. Of these 20 persons land holdings are below one hectare insize (Table 5.6).
Most owner cultivators of 1960s and 70s, who belonged to the lower middle class proceededto cultivate their holdings intensively to sustain themselves and produce a substantialmarketable surplus. Their socio-economic positions are of a very solid nature. Their childrenhave mostly gained employment in and outside India. Very few of them continue as second-generation farmers. Remittances from various parts of the world have strengthened theirfinancial base and many families have a changed priority for land use. Cultivation for themis not for earning a livelihood but for maintaining the ownership right. The land holdingsstructure of lessees explains the safety on the part of the lessor for leasing and the landleasing is mainly for one crop year only. The primary analysis of the data reveals that thereare only 4 land hungry persons altogether in the three study areas (Table 5.4). Two arefulltime lease land operators and two are agricultural/casual labourers doing part time leaseland cultivation. The socio-economic status of agricultural labourers in general and that ofthe oldest labourer living in the study area is given in chart-5.2. According to table 5.7 and5.8 there are 125 lease land cultivators among the different size classes. The row totalexplains that 53 are cultivators 44 are agricultural/casual labourers, 27 are others. There isone owner cultivator doing vettila. Table 5.7 reveals that among the different size classesof 10 each, there are 125 vettila cultivators. Among them 64 persons comes under the sizeclass 1-10. In alternate years 25 each do banana and tapioca cultivation.
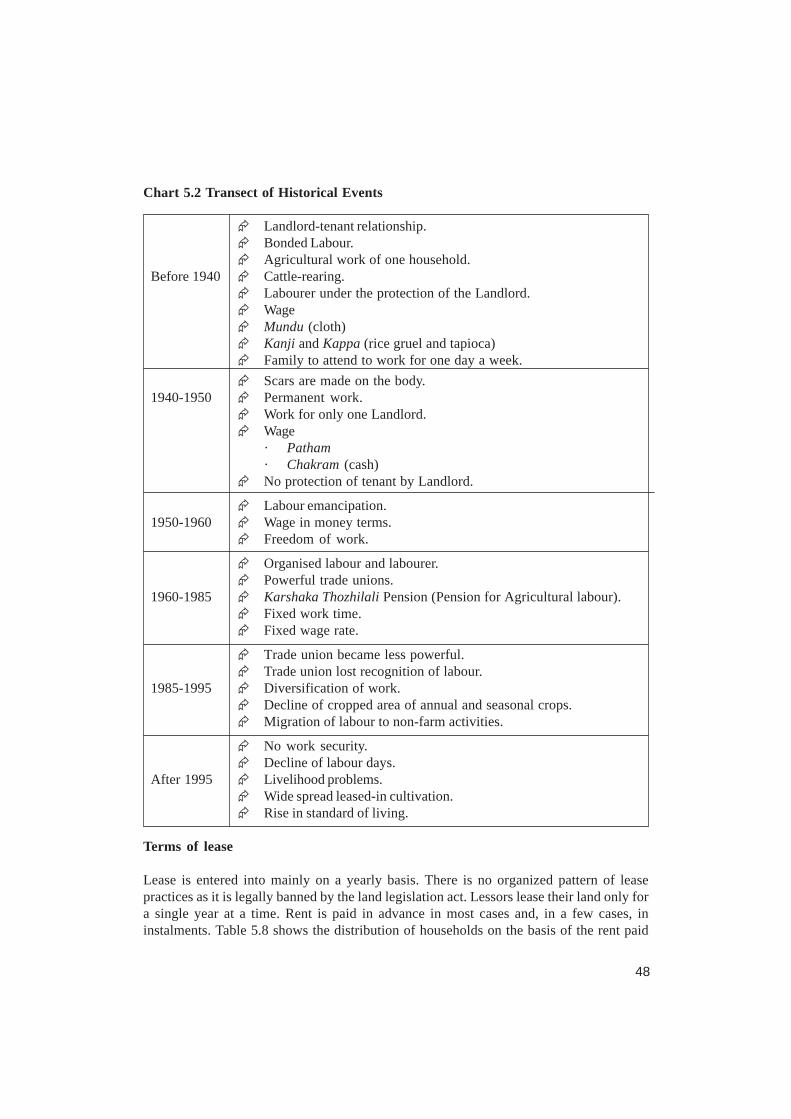
48
Chart 5.2 Transect of Historical Events
� Landlord-tenant relationship.� Bonded Labour.� Agricultural work of one household.
Before 1940 � Cattle-rearing.� Labourer under the protection of the Landlord.� Wage� Mundu (cloth)� Kanji and Kappa (rice gruel and tapioca)� Family to attend to work for one day a week.
� Scars are made on the body.1940-1950 � Permanent work.
� Work for only one Landlord.� Wage
· Patham· Chakram (cash)
� No protection of tenant by Landlord.
� Labour emancipation.1950-1960 � Wage in money terms.
� Freedom of work.
� Organised labour and labourer.� Powerful trade unions.
1960-1985 � Karshaka Thozhilali Pension (Pension for Agricultural labour).� Fixed work time.� Fixed wage rate.
� Trade union became less powerful.� Trade union lost recognition of labour.
1985-1995 � Diversification of work.� Decline of cropped area of annual and seasonal crops.� Migration of labour to non-farm activities.
� No work security.� Decline of labour days.
After 1995 � Livelihood problems.� Wide spread leased-in cultivation.� Rise in standard of living.
Terms of lease
Lease is entered into mainly on a yearly basis. There is no organized pattern of leasepractices as it is legally banned by the land legislation act. Lessors lease their land only fora single year at a time. Rent is paid in advance in most cases and, in a few cases, ininstalments. Table 5.8 shows the distribution of households on the basis of the rent paid

49
for their leased out land. About two-thirds of the lessees who come under the size class 1-10 cents pay a rent from Rs. 500 to Rs.2000. For the size class 11-20, lessees (whoconstitute 22 percent) pay rents between Rs. 1000 and Rs 4000. When we take the rowtotal 44.8 percent of the lessees pay a rent of Rs. 1000 for the first three size classes.Lessees could not move to higher size classes, as there is financial shortage, lack of riskinsurance coverage and unorganized cultivation practices.
Table 5.7 Distribution of sample households by the size class of their operationalholdings and by the type of cultivation
Type of Cultivation 1-10 11-20 21-30 31-40 41-50 51-60 Total
Vettila Number 80 26 10 3 5 1 125Percent 64.00 20.80 8.00 2.40 4.00 0.80 100.0
Banana Number 12 6 4 2 1 25Percent 48.00 24.00 16.00 8.00 4.00 100.0
Tapioca Number 8 8 5 1 2 1 25Percent 32.00 32.00 20.00 4.00 8.00 4.00 100.0
Total Number 100 40 19 6 7 3 175Percent 57.14 22.86 10.86 3.43 4.00 1.71 100.0
Vettila (betel) occupies a place of reverence in our daily life. In our state from very oldendays, there existed the practice of chewing vettila. Thamboolam (chewing betel and nut)after every feast is our tradition. Arecanut and coin folded in vettila is used for offeringDakshina in marriage ceremonies and in poojas in temples. Children on Vidyarambham(initiation to education) also offer Vettila, Arecanut and Coin as Gurudakshina (obeisanceto Guru) Bleached vettila which contains reducing sugars and vaporizing oils and givessweet scent and taste is used in Ayurvedic Medicines. The price of bleached leaves isthrice that of green ordinary leaves. Hence in some states small vettila bleaching units arein operation.
Betel vines are highly remunerative. After 90 days of planting vettila begins to yield asteady income for about six years on a continuous basis.
Pandalam, in Pathanamthitta district, is a very vibrant market for vettila. Traders fromdifferent parts of the state come here to purchase vettila from farmers. It is marginalfarmers and agricultural labourers who cultivate vettila in preference to vegetables. Sincevettila has both a domestic and international market.
Karnataka, West Bengal, Tamil Nadu, Andhra Pradesh, Assam and Uttar Pradesh cultivatebetel vines besides Kerala. In Kerala about 400 hectares are under this crop. It is a cropthat needs great care and attention. It needs appropriate temperature, humidity, shade,support plants and timely and adequate manuring. Appropriate atmospheric conditions for

50
vettila cultivation are found on the south-western hot temperate, coastal zone and on thehills of Assam. Cultivation of betelvines is done in wetlands also in tiny plots and that tooby lessee farmers, in our study area. The maximum duration of this wetland cultivation istwelve to fifteen months.
Table 5.8 Two-way distribution of households on the basis of rent paid
Rent 1-10 11-20 21-30 31-40 41-50 51-60 Total Percentage
500 5 51.00 4.00
1000 48 7 1 5685.71 12.50 1.78 44.80
1500 17 9 1 1 2860.71 32.11 3.51 3.51 22.40
2000 9 7 1 1752.94 41.18 5.88 13.16
2500 3 31 1 837.50 37.50 12.50 12.50 6.40
3000 1 2 2 520.00 40.00 40.00 4.00
3500 2 2 450.00 50.00 3.20
4000 1 1 250.00 50.00 1.60
Total 79 28 10 3 4 163.20 22.4 8.00 2.40 3.20 0.80 125 100.00
Economics of Betel Vine Cultivation
The total area of land under betel vines in our study area 13.65 acres for the 125 farmersinterviewed. Taking Rs. 4 as the price per bundle of Vettila.
Gross income per cent = Rs. 1934.21Cost A1(Paid out Cost) per Cent = Rs. 577.63Cost A2 (A1+Rent Paid) Per Cent = Rs. 692.49Cost B (A2+Rent of Owned Land = Rs. 692.49Cost C (A2 or B +Imputed value of labour) = Rs 1504.91Profit of the tenant operator per cent = Rs 1241.73Return from imputed labour (Cost C-B) = Rs 812.42Pure profit = Rs 429.31
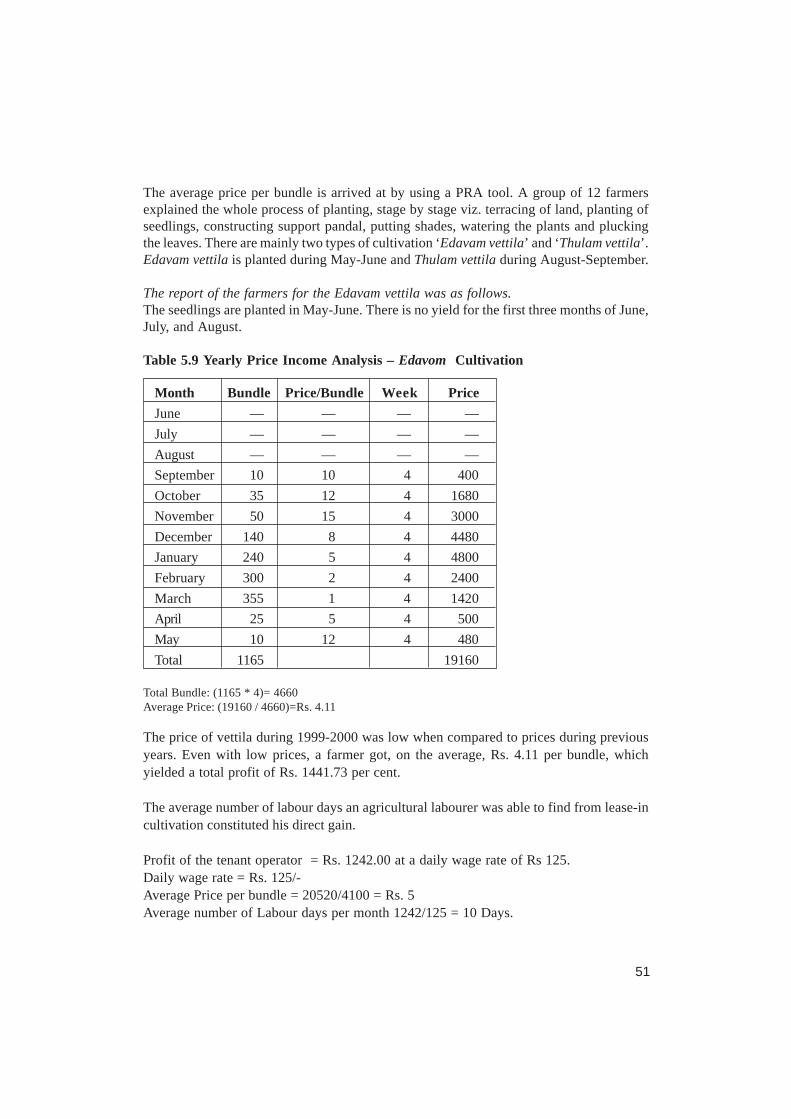
51
The average price per bundle is arrived at by using a PRA tool. A group of 12 farmersexplained the whole process of planting, stage by stage viz. terracing of land, planting ofseedlings, constructing support pandal, putting shades, watering the plants and pluckingthe leaves. There are mainly two types of cultivation ‘Edavam vettila’ and ‘Thulam vettila’.Edavam vettila is planted during May-June and Thulam vettila during August-September.
The report of the farmers for the Edavam vettila was as follows.The seedlings are planted in May-June. There is no yield for the first three months of June,July, and August.
Table 5.9 Yearly Price Income Analysis – Edavom Cultivation
Month Bundle Price/Bundle Week Price
June — — — —
July — — — —
August — — — —
September 10 10 4 400
October 35 12 4 1680
November 50 15 4 3000
December 140 8 4 4480
January 240 5 4 4800
February 300 2 4 2400
March 355 1 4 1420
April 25 5 4 500
May 10 12 4 480
Total 1165 19160
Total Bundle: (1165 * 4)= 4660Average Price: (19160 / 4660)=Rs. 4.11
The price of vettila during 1999-2000 was low when compared to prices during previousyears. Even with low prices, a farmer got, on the average, Rs. 4.11 per bundle, whichyielded a total profit of Rs. 1441.73 per cent.
The average number of labour days an agricultural labourer was able to find from lease-incultivation constituted his direct gain.
Profit of the tenant operator = Rs. 1242.00 at a daily wage rate of Rs 125.Daily wage rate = Rs. 125/-Average Price per bundle = 20520/4100 = Rs. 5Average number of Labour days per month 1242/125 = 10 Days.

52
-1000
0
1000
2000
3000
4000
5000
6000
Jun Jul Aug Sep Oct Nov Dec Jan Fe
month
To
tal P
rice
Graph 5.1 Time Profile Showing Edavom Cultivation
Most of the lessees prefer Edavam Cultivation because June, July, and August are leanmonths during which they hardly get labour days, whereas the Thulam cultivation startsat the peak season of employment during which they get up to about 15 days of work permonth on an average.
Table 5.10 Yearly Price Income Analysis – Thulam Cultivation
Month Bundle Price/Bundle Week Price
October — — — —
November — — — —
December — — — —
January 20 5 4 400
February 70 2 4 560
March 200 1 4 800
April 200 5 4 4000
May 90 12 4 4320
June 200 5 4 4000
July 210 6 4 5040
August 25 10 4 1000
September 10 10 4 400
Total 10 25 4 4100

53
-1000
0
1000
2000
3000
4000
5000
6000
Oct Nov Dec Jan Feb Mar Apr May Ju
Month
To
tal P
rice
Graph 5.2 Time Profile Showing Thulam Cultivation
0
2
4
6
8
10
12
Days
Jan Feb Mar Apr May Jun Jul Aug Se
Month
Graph 5.3 Annual Days of Employment of a Wage Earner

54
Table 5.11 Average Income Earned by a Wage Earner
Month Daily No. Totalwage of days income
January 125 11 1375
February 125 8 1000
March 125 11 1375
April 125 10 1250
May 125 10 1250
June 125 5 625
July 125 5 625
August 125 7 875
September 125 10 1250
October 125 12 1500
November 125 11 1375
December 125 11 1375
Average income = Rs. 1156Average labour days per month = 9 Days
0
2
4
6
8
10
12
14
Days
Jan Feb Mar Apr May Jun Jul Aug S
Month
Graph 5.4 Annual Labour Days of Employment of a Rubber Tapper

55
0
2
4
6
8
10
12
Days
Jan Feb Mar Apr May Jun Jul Aug Sep OMonth
Graph 5.5 Annual Labour Days of Employment of a Hollowbrick Company Labourer
On an average, a lessee farmer gets 19 labour days per month. The net income per monthis about Rs. 2500. The profit of the lessee including his imputed labour is Rs.1242. Formost of the farmers lease-in cultivation is part-time occupation.
The entrepreneurial ability of a tenant operator to go in for lease-in cultivation is acceptedby the end of the first episode of cultivation. If he gets the same land for cultivation for asecond time, some of the paid out costs and a sizable amount of imputed labour will be lessfor him than during the initial episode. On the whole a tenant operator goes in for a secondtime cultivation with more vigor, vitality and confidence.
The economic and social mobility of 25 farmers who are doing plantain and tapioca cultivationhas also been studied.
The pure profit for the entrepreneurial work of the tenant operator and his profit includingthe return from imputed labour for banana and tapioca are as follows.
Banana cultivation
Gross income/cent = Rs. 523.06Cost A1 = Rs. 125.08Cost A2 = Rs. 218.68Cost B = Rs.218.68Cost C = Rs.387.50Cost A2 and B are the samebecause all farmers are lessees.Profit of the tenant operator = Rs.304.38Pure profit = Rs. 135.56

56
Tapioca cultivation
Total Lessees : 5Gross income = Rs.343.43Cost A1 = Rs. 43.05Cost A2 = Rs. 79.92Cost B = Rs. 79.92Cost C = Rs. 237.49Profit = Rs.261.52Pure profit = Rs. 105.94
Opinion of trade union leaders
Unionisation of the labour force meant also the organisation of a vast mass of workers inthe informal sectors of the economy. The process of unionization, which began in theearly’ thirties, made hardly any distinction between urban and rural workers, workers ininformal and formal sectors, men and women, and primary, secondary and tertiary sectors.
INTUC, CITU, AITUC and Karshaka Morcha of BMS are strongly in favour of lease-incultivation of fallow land as it enhances the number of days of employment and theproductivity of wetlands in general. The weakening of trade unions has had a positiveeffect on the development of the agricultural and the industrial sectors. The formation ofThozhil Sena at the panchayat level is advocated by Peelipose Thomas of INC and Prof. TK G Nair of CPI (M). They are, however, against institutionalising the process of lease-incultivation. According to them, there has been a 50 percent increase in the number oflabour days of the lessee farmers. The socio-economic status of the working class as awhole and the marginalised farmers in particular has been enhanced as a result of theincrease in the number of labour days of employment.
Case study analysis
Simon (82 years) is unable to trace the background of his own Betel vine cultivation. Fromthe time his memory began, his father had been doing betel vine cultivation. In those times,both garden lands and wetlands were easily available on lease at low rent. But at presentonly wetland is available on lease. It means that almost the whole of garden land is undercommercial crops. Some of the wetlands have also been used for rubber cultivation. Rotationof crop is practised for wetland cultivation. Crops like plantain, tapioca, bittergourd, ginger,green chilly are being cultivated in wetlands on rotation basis. But betel vine is cultivated ona continuous basis in a few plots. Simon and his three sons are putting a combined effortat cultivation. Ill-health due to old age is not allowing Simon to participate actively incultivation. He has two acres of garden land and 60 cents of wetland. He had only 10 centsof garden land to begin with. The additions to wealth are mainly from Betel vine cultivation.The social status that the household now enjoys is also the result of betel vine cultivation.Simon’s only daughter was married off decently and is leading a comfortable life. His threesons have pucca houses. The educational status is limited to primary school for his first
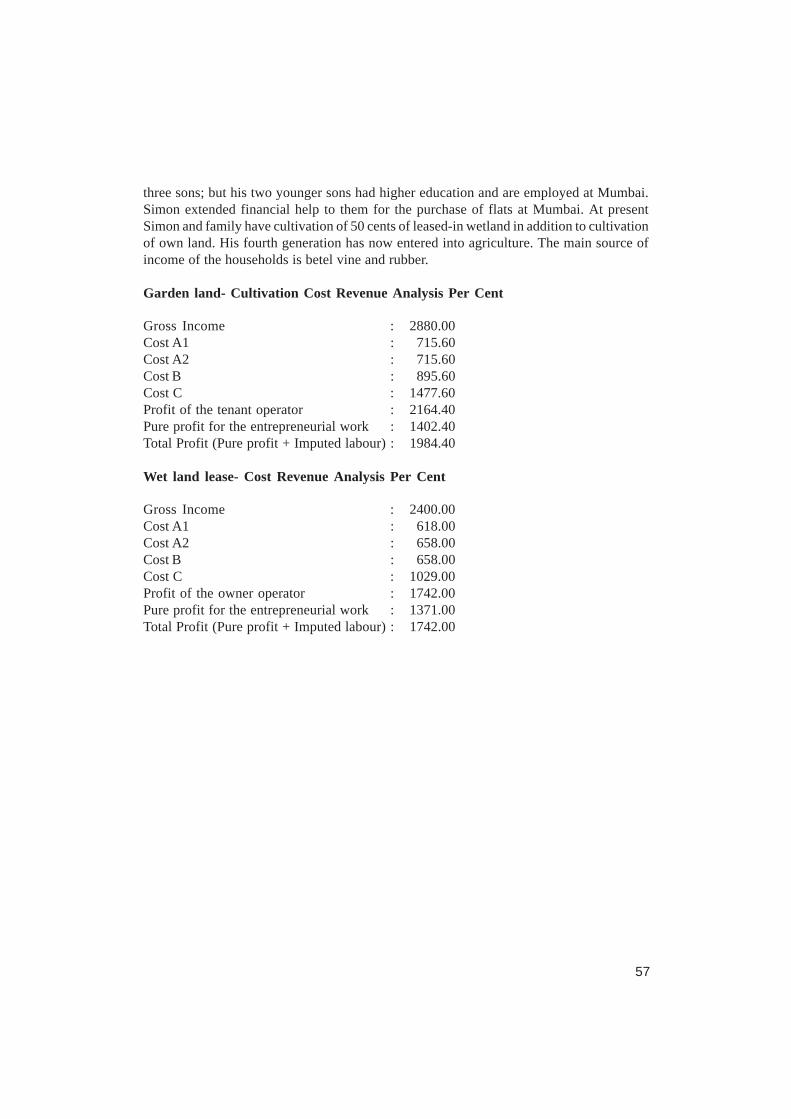
57
three sons; but his two younger sons had higher education and are employed at Mumbai.Simon extended financial help to them for the purchase of flats at Mumbai. At presentSimon and family have cultivation of 50 cents of leased-in wetland in addition to cultivationof own land. His fourth generation has now entered into agriculture. The main source ofincome of the households is betel vine and rubber.
Garden land- Cultivation Cost Revenue Analysis Per Cent
Gross Income : 2880.00Cost A1 : 715.60Cost A2 : 715.60Cost B : 895.60Cost C : 1477.60Profit of the tenant operator : 2164.40Pure profit for the entrepreneurial work : 1402.40Total Profit (Pure profit + Imputed labour) : 1984.40
Wet land lease- Cost Revenue Analysis Per Cent
Gross Income : 2400.00Cost A1 : 618.00Cost A2 : 658.00Cost B : 658.00Cost C : 1029.00Profit of the owner operator : 1742.00Pure profit for the entrepreneurial work : 1371.00Total Profit (Pure profit + Imputed labour) : 1742.00
58
6. Conclusion
In Kerala, agriculture and its labour are at the cross roads. On the one side, during the pastthree decades, the agricultural sector has undergone wide changes in terms of ownershipand distribution of land holdings, cropping and land use patterns, cultivation practices,productivity and intensity of cultivation. On the other side, the state economy is characterizedby a high wage share due to predominance of cultivation of cash crops, labour-intensiveagro-processing activities in industry and bloating of the service sector consisting of tradeand transportation and other social services. Ownership right was conferred on the landlesslabourers by the Agrarian Relations Act of 1970 which resulted in wide distributionalchanges in the landholding pattern between the ’seventies and ’eighties. Inter-generationaleconomic mobility of households increased leading to a small reduction in intra-generationalin equalities in land distribution. During 1970’s and the 1980s, the incidence of tenancybecame the highest among households of the self employed in agriculture. In the late’nineties it was the highest among displaced agricultural labourers and marginal farmers.In the ’nineties, the lessors are happened to be mostly the lessees of the eighties. Keralafailed in modernizing and upgrading its labour force. There is a mismatch between laboursupply and demand of labour. A shift in the socio-economic regime has produced aparadoxical situation in the Kerala economy. On the one hand, there is high incidence ofunemployment and, on the other, changing job expectations of the younger generation.This shift in the social expectations of the younger generation in the rural areas and theimpact of demographic transition on the labour market is zero rate of growth in the youngerage group of 15 to 29 years of age who opt for agriculture. These developments havecontributed to scarcity of labour in the rural casual labour market. Labourers preferemployment of high social status and regular income. The kind of resistance offered bylabour unions to employers’ decisions on wage and working conditions till the mid-’eightieshas given way to acceptance particularly by the new entrants to the labour force. In themeantime, Kerala has lost a generation time (25 years) in modernizing and upgrading itslabour-intensive occupations.
The aforesaid factors have thrown up further dilemmas in the new context of economicliberalization. When the earlier strategy of protecting current employment failed and theeconomy could not generate adequate new employment, the state government. resorted toextensive ‘Poor - Relief Programmes’. In the new context of economic liberalization therationale of these programmes is being increasingly questioned mainly due to the financialcrisis of the government. Unlike the shift of labourers from agriculture to industry, thelessee model sought to overcome the impasse’ by making strong intervention in theagricultural sector through mobilization of labourers and farmers and by making use of thesocial and political environment which came into being with the introduction of PeoplesPlanning in the state. Change in the mode of labour identified in the study area broughtabout a transformation in the rural community by way of increase in the number of labourdays of employment, increase in income, shift in economic opportunity from hired toimputed labour, thereby increasing specialization in livelihood, reduction in out-migrationof rural labour in search of work and adoption of cultivation of unorthodox crops.

59
The widespread cultivation of vettila in the three panchayats reveals that people concentratein the cultivation of crops for which there is a viable and profitable market. The market forvegetable items is highly unstable. Further, the Kerala vegetable market is under the clutchesof traders who collaborate with farmers of Tamil Nadu.
Absentee landlordism had led to the Land ceiling Act of 1969. For a few years thereafterthere was intensive use of land for agricultural purposes. Eventually, a class of absenteeland holders emerged. These absentee owners helped the formation of the lesseedevelopment model which resulted in increase in production and productivity and openingup of employment avenues in the agricultural sector. Cultivation on leased-in land hasbecome a widespread phenomenon throughout the State.

60
Reference
Alexander K. C. “Nature and Background of the Agrarian Unrest in Kuttanad, Kerala”,Journal of Kerala Studies, June Part. 2 1975.
Bhat Mari P. M. and S.Irudaya Rajan. “Demographic Transition in Kerala Revised”Economic and Political Weekly Vol. XXV, No. 36, Sept. 1-8, 1990
Cain Mead. “Risk and Insurance, Perspectives on Fertility and Inequality Rural India andBangladesh”, Centre for Policy Studies, (The Population Council) w.p. No, 67. 1981.
Chayanov. A. V. “The Theory of Peasant Economy”, ed. 1987.
Francis Shaji K. “Dynamics of Rural Labour Market: An Analysis of Emerging AgriculturalLabour Shortage in a Kerala Region, Thiruvananthapuram” Centre for DevelopmentStudies, M.Phil Thesis Submitted to the Jawaharlal Nehru, New Delhi. 1990.
Govt. of India, Sarvekshana, Journal of National Sample Survey Organization, Dept. ofStatistics Ministry of Planning. 1997.
Hariss John. “Capitalism and Peasant Farming” Oxford University Press, Delhi. 1982.
Kannan K. P. “Public Intervention and Poverty Alleviation: A study of the DecliningIncidence of Rural Poverty in Kerala, India, Development and Change”, Vol. 26, No. 4,Oct. 1995.
Kannan K. P. “Labour Institution and Development Process in Kerala” in Papola T. S. andGerry Rodgers (eds), Labour Institutions and Economic Development in India, Geneva:International Institute of Labour Studies. 1992.
Kannan K. P. “Of Rural Proletarian Struggles: Mobilization and Organization of RuralWorkers in South-West India”, Delhi, Oxford University Press. 1988.
Kannan K. P. “Political Economy of Labour and Development in Kerala” w.p. No. 284,Centre for Development Studies Thiruvananthapuram. 1998.
Kannan K. P. and K. Pushpangadan. “Agricultural Stagnation in Kerala: An ExploratoryAnalysis” Economic and Political Weekly, Sept. 24, 1988.
Kannan K. P. and K. Pushpangadan. “Dissecting Agricultural Stagnation: An AnalysisAcross Seasons, Crops and Regions” Economic and Political Weekly, Vol. XXV. No. 36,Sept. 18,1990.
Krishnan T. N. “Demographic Transition in Kerala: Faces and Factors”, Economic andPolitical Weekly, Special No. August 1976.
Mahesh R. “Causes and Consequences of Change in Cropping Pattern; A Location SpecificStudy”, Discussion Paper, No. 11. 1999.
Naboothiri Eashwaram. M. Phil Dissertation Cochin University. 1986.
Nair K. N., K.Navaneetham and AC Dhas. “Structural Changes in Landholding in India”:

61
S study based on N. S. S. Data w.p. No, 237. Centre for Development StudiesThiruvananthapuram. 1990.
Nambiar. A. C. K. “Unorganized Labour Unionism: The Case of Head Load Workers inKerala” The Indian Journal of Labour Economics, Vol. No. 38, N0. 4, Oct-Nov. 1995.
Natarajan, S. “Labour Input in Rice Farming in Kerala, An Inter Regional and Inter-Temporal Analysis”, in Pillai P. P. (ed.). 1982.
Padhi, Sakti Prasad and K.N. Nair. “Dynamics of Land Distribution: An AlternativeApproach and Analysis with Reference to Kerala” w.p. No. 245. 1929.
Philip P. J. “Changes in the Land Use Pattern in Kerala” Unpublished M.Phil DissertationKerala University. 1987.
Raj K. N. “An Introductory Overview of Commercialization of Indian Agriculture” w.p.No. 208, CDS Thiruvananthapuram. 1985.
Rajan Irudaya S., U.S Mishra U. S. and P.S Sarma. “Demographic Transition and LabourSupply in India, Productivity”, Vol. 34, Apr-June N0. 1, 1993.
Sanal S. K. “Trends in Some Characteristics of Landholdings for a Few State I and II”Sarvekshana, Journal of National Sample Survey Organization, Vol. No. 1 & 2. 1977.
Shanin T. “The Awkward Class: Political Sociology of Peasantry in Developing Society,Rusia 1920-25”, London Oxford University Press. 1972.
Tharamangalam Jose. “Agrarian Class Conflict: The political Mobilization of AgriculturalLabourers in Kuttanad, South- India”, University of British Colombia Press, Vancouver.1981.
Thorner, Basile Kerbley and R.E.F., Smith, Delhi; Oxford University Press.
United Nations. “Poverty, Unemployment and Development Policy: A Case of SelectedIssues wit Special Reference to Kerala”, New York United Nations/CDS 1975.
Vaidaynathan A. “Absorption of Human Labour in Agriculture” Centre for DevelopmentStudies Thiruvananthapuram, Monograph. 1977.
Vyas V. S. “Some Aspects of Structural Change in Indian Agriculture”,Indian Journal ofAgricultural Economics. Vol. 39(1). 1979.
Journals and Periodicals
Census of India 1991 and 2001.
Chandini S. “Vettila Krishi” Publication Section, Kerala Agriculture University, Mannuthi.
Conversion of Paddy Land, Kerala, Kerala Statistical Institute Thiruvananthapuram. 1994.
Economic Survey, State Planning Board. 1997.

62
Economic Review, State Planning Board Thiruvananthapuram. 1997.
Economic Review, State Planning Board Thiruvananthapuram. 2000.
Economic Review, State Planning Board Thiruvananthapuram. 2001.
Economic Review, State Planning Board, Thiruvanthapuram. 2003.
Govt. of India, Sarvekshana Journal of the National Sample Survey, Vol No. 5, No. 3 & 4Issue No. 16, Dept. of Statistics, Ministry of Planning. 1982.
Govt. of India, Sarvekshana Journal of the National Sample Survey Organization, Vol 12(I), Issue No. 36, Dept. of Statistics, Ministry of Planning. 1989.
Kerala in Maps, Dept. of Mathematics, University of Kerala,Thiruvananthapuram. 1960.
Kumar Mohan S. and Kumar Gireesh K. G. Labour and Development Under People’s Plan.The Experience of Kunnathukal Grama Panchayat. Kerala State Planning Board,Thiruvananthapuram
Land Resource of Kerala State, Land Use board, Thiruvananthapuram 1995.
Mathrubhoomi Daily, December 21, 1999.
People’s Plan Vikasana Rekha, Kulanada Grama Panchayat.
People’s Plan Vikasana Rekha, Chennerkara Grama Panchayat.
People’s Plan Vikasana Rekha, Mezhuveli Grama Panchayat.
Resource base of perspective plan, Kerala State Land Use Board Vikas Bhavan
Statistics Since Independence, Dept. of Economics and Statistics. 1997.


![MODEL ANSWERS 81-K ODE O 81-Kkseeb.kar.nic.in/docs/2015/81-K - RF.pdf · MODEL ANSWERS: 06. 04. 2015 ]: 81-K Date : 06. 04. 2015 ] CODE NO. : 81-K Subject : MATHEMATICS ( / Kannada](https://static.fdocuments.in/doc/165x107/5acbdb0e7f8b9a93268bcab0/model-answers-81-k-ode-o-81-rfpdfmodel-answers-06-04-2015-81-k-date-.jpg)

![hpw tk^v äp Cuäv · t]cv. PESTICIDE DETECTED. IoS\min\nbpsS Afhv. RESIDUE LEVEL (ppm) 1. Chairman (Saji cheriyan) Venmani krishibhavan. Karuna Palliative centre. Alapuzha Bittergourd](https://static.fdocuments.in/doc/165x107/5f927ccd9e2b3f77bf1731a4/hpw-tkv-p-cuv-tcv-pesticide-detected-iosminnbpss-afhv-residue-level-ppm.jpg)