Discussion Paper No. 583
61
Discussion Paper No. 583 UNLUCKY OR BAD? ECONOMIC POLICY AND ECONOMIC GROWTH Evan Osborne May 2003 The Institute of Social and Economic Research Osaka University 6-1 Mihogaoka, Ibaraki, Osaka 567-0047, Japan
Transcript of Discussion Paper No. 583

Discussion Paper No. 583
UNLUCKY OR BAD? ECONOMIC POLICY AND ECONOMIC GROWTH
Evan Osborne
May 2003
The Institute of Social and Economic Research Osaka University
6-1 Mihogaoka, Ibaraki, Osaka 567-0047, Japan

Unlucky or Bad? Economic Policy and Economic Growth
Evan Osborne
Institute of Social and Economic Research, Osaka University, and
Wright State University, Dayton, Ohio, USA
Contact Information:
Wright State University, Dept. of Economics, 3640 Col. Glenn Hwy., Dayton, OH,
45435, USA.
Phone: +1 937 775 4599
Fax: +1 937 775 2441

Unlucky or Bad? Economic Policy and Economic Growth
EVAN OSBORNE
May, 2003
Abstract
Cross-country growth regressions have in recent years become a major growth
industry. The most common purpose of this work has been to investigate the
determinants of economic growth. But it is also possible to use the existing growth data
to determine the extent to which policy choices help or hinder growth. This paper
generates estimates of the net contribution of policy to growth for a wide variety of
countries. It also provides the ability to “see” in an almost photographic way what
substantial economic reform looks like, to test whether countries have meaningfully
reformed. The findings also provide grist for speculation on the virtues of gradual versus
dramatic, total economic reform.
Key words: growth, growth regression, development, economic reform.
Journal of Economic Literature classification numbers: O11, O47, O57.

1
The problem of economic growth is perhaps one of the most fundamental in all of
economics. Thinking about why nations become (and, more compellingly, do not
become) wealthy has occupied many of the greatest minds in the field at least since the
days of Hume, Smith and Ricardo. In much of the twentieth century, with the advent of
modern neoclassical techniques, the thinking about development was dominated by the
need to spur adequate investment. The basic description of the problem took several
forms technically, but whether seen as mobilizing adequate savings to achieve a target
investment rate (Domar, 19461), of moving through a sequence of stages, the most critical
of which is an investment “takeoff” (Rostow 1960), of adding enough capital stock to
draw away surplus labor (Lewis, 1954; Fei and Ranis, 1964), or of convergence via
capital accumulation to a steady-state equilibrium (Solow, 1956), the key task was always
explicitly or implicitly to accumulate physical capital. This is an idea that is pregnant
with implications, because it is not much of a leap from this characterization of the
problem to a belief that a command authority, e.g. a government ministry or a multilateral
aid organization, ought to be in charge of that mobilization.
More recently, owing to the increase in the amount and quality of the available
data, a substantial and rapidly growing empirical literature has emphasized human capital
(Lucas, 1988, Romer, 1986). The presence of both specific and general human capital is
according to this literature critical although not necessarily sufficient to achieving
economic growth. In addition, the role of policy has in recent years commanded attention.
1. Easterly (1999) argues that Harrod-Domar models became extraordinarily influential
in policy circles despite the fact that Domar (1957) later argued that he did not intend his
work to be used in development.

2
Policy has always been important, even in the models revolving around physical and
human capital, but the focus of work such as Barro (1991) has been on the potential of
policy to do harm. In particular, he finds that government distortions, failure to maintain
openness to foreign trade and investment, and excessive government spending (and, he
speculates, the taxes needed to fund it) destroy growth.
But Barro’s work and the literature it has spawned focuses mostly on standard,
ceteris paribus analysis. Without question, this has been important, in that it has
established what Yusuf and Stiglitz (2001) term a consensus up to a point about what
sorts of policies promote growth. But there has been little attempt to quantify the effects
of policy in explaining the wealth and poverty of nations. Countries that manage
economic policy well (poorly) can promote (squelch) growth, but how much? This paper
attempts to answer that question. Using standard growth regressions, it is able to make
(necessarily speculative) estimates of how much countries have in the last several
decades suffered and benefited from their government policies. The results are not only
of theoretical interest, in that they suggest the magnitude of the income created or
destroyed by policy, but raise issues of importance in terms of promoting economic
reform. There is controversy over the virtues of radical versus gradual reform in
dysfunctional economies. The findings allow some inferences about the virtues of the
two approaches. In addition, if political constraints are assumed to rule out radical,
“shock therapy” reform, the results are of interest in suggesting which reforms can
provide the most immediate benefit for struggling nations. Section 1 lays out the extent
of development failure, Section 2 presents the basic empirical approach, Section 3

3
extends the analysis by controlling for different effects at different levels of development,
and Section 4 lays out some implications for improved economic policy.
1. The nature of the problem
The best place to begin the discussion is perhaps to note how difficult the struggle
to modernize has been for a disappointingly large fraction of the world’s poorest
countries. Table 1 depicts two measures of the absence of progress over the last thirty-
five years. The first list consists of those countries whose per capita incomes were in the
bottom half of the by-country distribution in 1960 but had by 1995 moved past the global
median in 1985 – US$2463.2 The right-hand portion lists the 32 nations that have
achieved at least two-percent average annual growth in per capita income between 1960
and 1995. Note that this latter standard is none too exacting – it means that the standard
of living roughly doubles in 35 years. In light of the prevalence poverty throughout much
of the world, the brevity of these lists has to be counted as a substantial failure. Whether
it is a failure of the advice rendered to poor countries or their failure to heed it is an open
question, but the widespread criticism in recent years in development organizations such
as the World Bank of decades of mistakes, combined with references to lost years and
even lost decades in countries throughout the developing world, suggests the former. A
compelling question naturally arises: what does it take to get economic policy right?
The stylized facts of the most prosperous economies are an extremely complex
division of labor, the use of substantial amounts of machinery that enhances the marginal
productivity of work, and a high endowment of human capital. The latter variable is
2. All dollar figures in the paper are expressed in 1985 prices.

4
greater both in absolute quantity and, by at least one measure, in quality as well in
wealthier nations. Table 2 lists the average capital stock per worker, the population’s
average years of schooling and the student-teacher ratio in primary school for each third
of the distribution of national per capita gross domestic product. Workers in the richest
countries have the most capital to work with and have the most and the highest-quality
schooling. While there is some controversy over whether high educational levels are an
effect or a cause of prosperity (Bils and Klenow, 2000), it seems hard to imagine that a
poorly educated society has brighter prospects than a well-educated one, other things
equal. As noted in the introduction, in the case of both types of capital, the theoretical
basis for growth arising from accumulation of these factors is high.
Indeed, another implication of the Romer (1986) school of thought is that the
convergence prediction of the neoclassical model – that, due to a common production
technology, nations should as they accumulate capital see their standards of living
converge roughly to the production frontier – is false. Wealthy nations with significant
stocks of human capital and flows of research activity can generate ever-greater
prosperity that allows them to further distance themselves from the vast bulk of nations
not so characterized. To make the leap from stagnation to modern, technologically
sophisticated growth in this view may in fact be quite difficult. Exhibit A in this
argument is generally held to be the failure of the bulk of the world’ countries to
converge as predicted. Of the countries that were not developed at the end of World War
II, only a handful – concentrated in East Asia and Europe with a few other bright spots in
places like Mauritius and Chile – have managed to escape the poverty trap.

5
But it is possible that ordinary policy mistakes have been of such a magnitude that
they explain a significant portion of the failure to converge. Why would we expect a
nation plagued by macroeconomic chaos, crippling rent-seeking and other problems of
what I will call malgovernance to be converging toward anything but abject misery?
Given that the advice handed out by economists differs from what it once was with
respect to the balance between markets and planning, and that governments may be
subject to incentives far removed from maximizing the growth of per capita income, there
is no reason to suppose that countries are immune to long periods of bad economic policy.
The extent of such activities is of course, an empirical question.
2. The Basic Empirical Model
The analysis begins by noting that the standard approach in growth regressions
has been to treat all countries the same regardless of their current standard of living. The
effect of a marginal increase in human capital or inflation is assumed to be the same for a
country with a per capita of $1000 as $10,000. This is done by specifying growth as the
dependent variable and the various state variables of the economy as independent
variables. But there may be diminishing returns to physical or human capital, and policy
or the other state variables may affect countries differently depending on where they are
in the global income distribution. To capture the full effect for countries at different
levels of income it will be necessary later to test for these effects.
The data for the regressions are the updated appendix to the widely used Barro-
Lee (1994) cross-country data sets. The data contain national-level observations over
five-year intervals dating from 1960 to 1995. Empirically, the first task is to establish the

6
overall relation between economic growth and its theoretical determinants. The approach
is somewhat similar to that of Barro (2000), who takes the neoclassical growth model as
his starting point and argues that at any moment in time an economy has potential as well
as actual output. While the similarity in terminology to traditional Keynesian analysis of
the business cycle is obvious, the words mean something different here. Potential output
is defined by the available production technology as well as the choices that governments
have made, for both good and ill, in economic policy and the country’s ability to engage
in exchange with other countries. A government that provides the most productive pure
public goods, enforces property rights and controls externalities while avoiding
distortions and avoiding the costly disincentives of excessive or inappropriate taxation
will have a higher level of potential output, as will a country that can trade with other
countries on favorable terms. All of these things determine the economy’s steady-state
output once the neoclassical capital-accumulation process has ended. Actual output, on
the other hand, is a function of the amount of physical and human capital an economy
possesses relative to the Solow steady-state equilibrium. Countries should over time
converge to their potential output, and the speed at which they do so will depend on the
rate of growth of capital.
With that framework in mind, the following equation is first estimated for the
entire Barro-Lee sample:
GROWTH = a0 + a1 PCGDP + a2 INVGDP + a3 PREMIUM + a4 GCGDP +
a5 TRADESHOCK + a6 OPENNESS + a7 HUMCAP + a8 INSTABILITY +
a9 INFLATION + a10 DEMOCRACY (1)

7
GROWTH is the five-year average growth rate of per capita gross domestic
product. INVGDP is the five-year average of investment as a percentage of GDP, and is
a direct measure of the addition of capital stock. The variables determining potential
output are PREMIUM, GCGDP, TRADESHOCK, OPENNESS, INSTABILITY and
INFLATION. PREMIUM is a measure of the black-market premium charged to the
country’s official exchange rate. It is log(Black-market rate/official rate). Barro (1991)
argues that it is a proxy for the level of governmental distortions, e.g. subsidies, taxes,
monopoly privileges, foreign-exchange and import restrictions, in the economy. A
greater number of such distortions is assumed to lower the economy’s potential output.
GCGDP is government consumption spending other than on defense and education.
TRADESHOCK is the growth rate of the country’s export prices minus that of its import
prices. OPENNESS is the measure of openness to foreign trade and investment used by
Sachs and Warner (1995).
Political choices, structures and events can also affect growth. INSTABILITY is
the Barro/Lee formulation of political instability during the period, defined as one-half
times the combined number of assassinations and revolutions during the five-year
interval. DEMOCRACY is the Barro (2000) index of democracy, which ranges from 0 to
1. The effects of greater electoral competition on economic growth are not clear.
Wittman (1989) argues that greater democracy amounts to more competitive political
markets which, like more competitive product markets, ought to yield greater efficiency.
But Cheung (1998) believes that democracy in poor countries is a recipe for disaster, in
that it allows pressure groups to more easily mobilize to engage in predatory activities.

8
INFLATION is the average inflation rate during the five-year period. Inflation might
harm a country’s growth potential for all sorts of reasons: the noise it introduces into the
price system, hindering its ability to effectively coordinate economic activity; the
introduction of a distortionary tax on holding currency; the increased difficulty of long-
range forecasting and hence the introduction of a bias against long-term contracting; the
transaction costs of inflation management; and a host of others. A summary of these
theoretical arguments can be found in Heymann and Leijonhufvud (1995).
The final variable is HUMCAP, a measure of the country’s human capital. It is
the country’s average schooling divided by its primary student-teacher ratio, with this
figure then multiplied by life expectancy. There is a significant modeling issue with
respect to how to incorporate human capital into the analysis. On the one hand, it can be
seen as just another production factor, like physical capital and labor. If so, the
appropriate measure is the rate of change of human capital, analogous to investment as
the rate of change of physical capital, either in the current period or lagged. The
alternative is more appropriate to the analysis of the literature descended from Romer
(1986), in which human capital generates knowledge, which then becomes a public good
raising productivity of other inputs throughout the economy. In that case a higher level of
human capital should generate more knowledge and hence faster growth. Both
estimation methods were tried. With respect to the growth of human capital, both one-
period and two-period growth rates were used in an attempt to proxy for the rate of
growth of the productive factor. In none of the cases was this variable significant. On
the other hand, using the contemporaneous stock of human capital is sometimes
9
significant in ways detailed below. Thus throughout the stock instead of the growth rate
of HUMCAP is used.
The results using OLS are presented in Table 2.3 All of the variables are
statistically significant in the expected direction. The negative sign on PREMIUM
indicates that a greater level of distortions retards growth. Interestingly, the sign on
OPENNESS is independently significant. If the static distortionary effects of trade
restrictions are incorporated in PREMIUM, then some other effect is being captured by
the significance of OPENNESS. Some candidates, many of which have been emphasized
in recent years in the international-trade literature, include economies of scale from
exporting to wealthier and larger markets, learning by doing through foreign economic
interaction, and the ability to tap foreign capital markets and advanced technology
through foreign investment. The simple measure of openness used here does not allow
discrimination among these (not necessarily exclusive) hypotheses. But in any case open
economies seem to grow faster even for a given level of other distortions. DEMOCRACY
is not a significant predictor of growth.
In addition, the change in a country’s relative export prices positively influences
growth, as expected. Both the addition to physical capital and the level of human capital
positively influence it. Political instability, which might disrupt the stability of property
rights, negatively affects growth. Government consumption, which has ambiguous
effects on growth in theory, appears to negatively affect it in practice. And consistent
3. The data are in cross-sectional time-series form. A generalized random-effects
regression was conducted, and the results were almost indiscernible from those reported
here.

10
with years of macroeconomic thinking, inflation is toxic to growth. Finally, the
neoclassical growth model finds support, as in the past, with the negative sign of PCGDP.
After standardizing for other considerations, poorer countries grow faster. Convergence
begins with a period of rapid growth (other things equal), which slows down as the
production frontier is approached, a result consistent with intuition about the once rapidly
growing economies of northeast Asia.
3. Differences by Per Capita Income
To test whether the effects of changes in the state variables are the same for
poorer and richer countries, interaction variables are used, where the interaction is with
dummy variables representing, respectively, the top and bottom fifths of the total
distribution over the 35-year sample of per capita GDP. The geographic and temporal
distribution of observations included in the regression is presented in Table 5. The
poorest fifth is unsurprisingly dominated by sub-Saharan African nations, while the
richest fifth is dominated by nations in Europe. The interaction variables INTER1PREM,
INTER1GC, INTER1INFL, INTER1INST, INTER1INV, INTER1HC, and INTER1OPEN
represent the interaction of being in the top fifth of per capita income with
LOGPREMIUM, GCGDP, INFLATION, INSTABILITY, INVGDP, HUMCAP and
OPENNESS respectively. The INTER2 variables represent interaction with a presence in
the bottom fifth of the distribution. The results were also tested with dummy-variable
interactions for the top and bottom third, respectively, and the results are similar.
The results for the various models are broadly similar, with none of the interaction
terms significant, with two exceptions. For the poorest countries, INTER2PREM is

11
significant with a positive sign, suggesting that governmental distortions are less
damaging to the poorest countries. And INTER1INV has a negative sign, suggesting that
the richest countries get less of a GDP payoff for a given level of physical capital and the
other independent variables, which suggests diminishing returns to capital. Other than
that, the basic model is quite resilient in explaining the sources of economic growth. The
two significant interaction terms will be incorporated in the calculation of policy-related
losses below. Table 6 lists the re-estimation of (1) incorporating these two interaction
terms.
4. Evaluating economic policy
The regression results provide an opportunity to measure the effect of economic
mismanagement, as well as economic misfortune. Several of the variables – PREMIUM,
GCGDP, and OPENNESS – are unequivocally results of conscious policy choices, and
one more, INFLATION, is certainly arguably such a result. One other, TOFTSHOCK, is
a variable that is largely out of the hands of government officials, except insofar as the
government can encourage a change in the country’s trade patterns. It will be useful to
contrast the effects of this relatively independent variable with those of the policy
variables.
The value in expectation of the loss imposed by a particular form of inefficiency
is simply the regression coefficient times the value of that variable for that country.
Table 6 lists the ten worst performers with respect to each of the policy variables over the
period 1990-1995, expressed as annual growth in gross domestic product foregone. The

12
final column lists the total sums of the losses incurred from mistaken policy. The losses
are expressed as deviations from the mean.
The first thing to note is that the losses from bad government policy are hardly
negligible for the poorest-performing countries, in excess of five percentage points per
year for Zambia, which is the worst-governed country for the period 1990-1995. The
costs of bad government policy are substantial. It is worth noting that the figures are
defined for a given level of human capital and investment. Those variables, particularly
the latter, are subject to government policy choices as well, and the data do not lend
themselves to analyzing why countries choose to build more or less human capital, or to
court or punish investment. But presumably malgovernance with respect to these factor-
accumulation variables would make the problem worse.
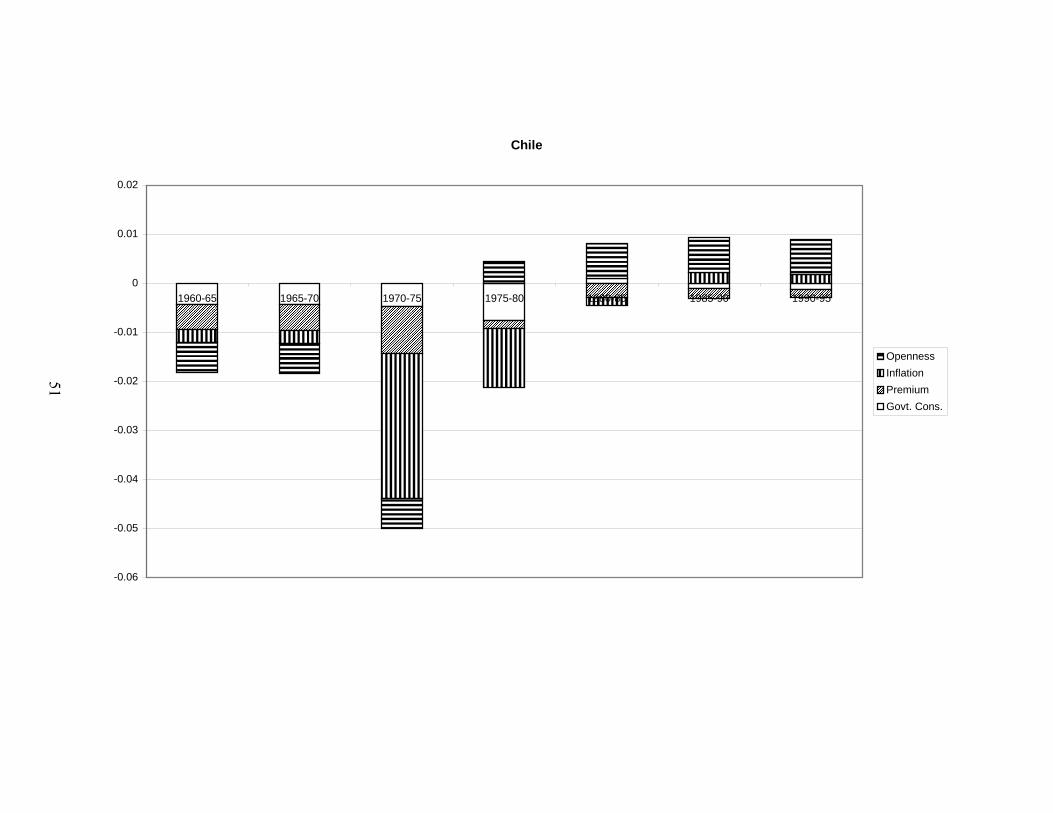
The second finding of interest is that there does not seem to be one component
that dominates in terms of contributing to poor growth performance. Figure 1 contains
the depiction of the components of losses from poor economic policy contained in Table
7. Inspection reveals that there is no overall dominant component; each of the
components in some cases does significant damage. In addition, no particular component
of bad governance necessitates the others. Table 8 is the correlation matrix for the four
components of the four components listed in Table 7. The top portion of the table is for
the entire sample, and the bottom portion is for the subset containing all observations in
which nations had negative per capita growth during a five-year period. In neither case is
the correlation overwhelming, with the possible exception of OPENNESS and PREMIUM.
Many nations are not overwhelmed by many policy problems simultaneously. This result
can perhaps be interpreted as making the transition to more sound policy somewhat easier.

13
Another interesting exercise is to talk about the unluckiest countries, in the sense
of having suffered because of adverse developments in their terms of trade. The losses
from terms of trade shocks during 1990-95 are contained in Table 9. There is of course
no reason why a country cannot be both unlucky and badly governed, and so Nigeria is
on the lists both of countries that suffered from poor governance and from adverse
international economic developments from 1990 to 1995. Two other countries, Syria and
Gabon, suffered unusually poor terms of trade shocks during this period as well as one
component of bad governance.
These experiments can also be carried out for the entire sample period. Table 10
depicts the same figures as in Table 7, only for the full 1960-1995 period. It again
reveals the extraordinary costs of malgovernance for many of the countries that have
suffered from it. Even a loss of one percentage point a year amounts, over thirty-five
years, to a per capita gross domestic product that is forty percent lower. Those pondering
the mystery of why seemingly promising countries like Argentina (itself once one of the
wealthiest countries in the world) and India have struggled so mightily in the postwar
period have a promising explanation in poor government policies.
To again assess who which countries have benefited from terms-of-trade
adjustments presumably out of their control, Table 11 depicts the average annual gains or
penalties to growth from adverse terms-of-trade developments from 1960-1995. The
most noteworthy finding is how small the losses other relative to those from bad policy.
Each of the individual components of the costs of malgovernance has had more dramatic
effects than terms of trade shocks, and there is not a single country that has lost more than
three tenths of a percentage point of average annual per capita growth between 1960 and

14
1995. This is a significant finding in light of the argument that one still frequently hears
that developing countries are systematically handicapped by their dependence on
commodities, which allegedly are subject to systematically adverse developments in
relative prices. In fact, the list of countries that have benefited most from changes in
international relative prices over the full sample period is dominated by developing
countries.
As before, the correlation matrix for events associated with policy (i.e., between
PREMIUM, INFLATION, GCGP and OPENNESS) is calculated, and presented in Table
12. Other than the relation between PREMIUM and INFLATION, there is no
overwhelming sense in the full sample of coincidence among the various components.
The lesson that emerges is compelling: bad policy is costly. In that sense, the
increasing emphasis, at least in their public statements, that multilateral organizations and
OECD countries are placing on sound policy as a condition for substantially enhanced
development assistance is undoubtedly a step forward form past practices. Some
evidence (Alesina and Weder, 2002) indicates that not only was sound policy not a
condition in the past for substantial development assistance, there was even a negative
correlation between corruption and aid, and conditioning aid on policy may be effective
more as a payoff than as a further contribution to development, in that development
assistance may contribute negatively to growth (Osborne, 2003).
5. Lessons for economic reform
The last ten to fifteen years have demonstrated that the process of economic
reform is surprisingly complex. It is true that the Washington Consensus, substantial
15
market reform as a condition for IMF and other multilateral assistance, has been
substantially accepted among the most influential development economists, as well as
many government officials in developing countries. From Carlos Salinas in Mexico to
the nominally Peronist Carlos Menem in Argentina to Yoweri Museveni in Uganda, the
list of leaders who embraced market-based reforms, whether out of original conviction or
conversion, is lengthy and until recently was growing. However, acceptance by the
public of such measures, particularly in Latin America, is another matter. Recent election
results in Venezuela, Ecuador and Brazil suggest public impatience with the inability of
reform, or at least the appearance of reform, to quickly deliver increased prosperity. In
Argentina the timeline is somewhat different, in that there were several years of rapid
growth followed by a spectacular collapse, but the public sentiment for expanding or
even maintaining economic reform is quite possibly fading.
If good policy pays off (as the above evidence suggests), but not quickly enough
given political constraints, this is a significant problem for those in charge of making
policy. Indeed, if one assumes that a government wants to enact the reform program that
will be most effective, this amounts to maximizing economic growth over the long term
against the constraint of political resistance. But as we have seen different components
of reform contribute to reform in different amounts. Each component – inflation,
distortions, openness, government spending – can be thought of as generating marginal
benefits in the form of higher growth as well as marginal costs in the form of both
political resistance and the political transaction costs of implementation. To conquer
hyperinflation will harm some constituencies, but probably not many – those who benefit
from inflation management, perhaps, but few others. Untangling the web of government

16
distortions, each of which benefits one or more constituencies in obvious ways while
imposing costs on other disparate, poorly organized groups that may well be unknown to
them, is arguably a far more difficult task. The same logic holds for lower government
spending. Increasing openness is a more complex case, as each trade or investment
barrier benefits some domestic constituency, but if most or all such barriers can be
eliminated at a stroke the benefits may flow immediately and obviously to many groups
as well. The optimal path of reform clearly must take these considerations into account.
Theory has a fair amount to say about which steps should be taken when. There
are two independent issues. First, should reform even be gradual, or instead of the “big
bang” type? Only if gradual reform is recommended does sequencing even become an
issue. With respect to the first question, Fernandez and Rodrik (1991) specifically model
political resistance by sectors of the population, and find that one-shot reform is preferred
when losers are substantial and who the winners and losers are is difficult to predict.
Gradualism in such an environment invites mobilization by the losers and hence potential
failure. Dewatripont and Roland (1995) find that gradual reforms are generally more
likely to survive politically, particularly if winners can be generated and politically
cultivated in the early stages.
But such work is of course only helpful if the existence or absence of those
conditions can be established before reform begins. Given the difficulty of identifying
such conditions, and then identifying the constituencies likely to support reform, the
empirical relevance of such work is somewhat muted. But other work specifically tackles
the proper ordering of reform steps. In general, it finds that macroeconomic stabilization,
by which is meant control of budget deficits and inflation and the establishment of a more

17
realistic exchange rate, ought to come first along with trade liberalization. Financial-
market liberalization should come later. This literature is surveyed in (World
Development, 1997) and Krueger (2000, “Second stage”). In any event, political
opposition may compel a partial liberalization in the early stages, and when that is
combined with the theoretical arguments in favor of gradualism the question arises, what
first?
This amounts to asking, of the four measured components of malgovernance
tackled here, which one would contribute the most good? The analysis above suggests
that there is no ironclad recipe for choosing among tackling inflation, government
distortions, the closed nature of the economy and excessive government spending. In
different countries different problems do different amounts of damage. Thus, each
country must examine its own costs from malgovernance to see which policies exact the
greatest costs in terms of foregone growth. For example Zambia, the country with the
greatest total losses during the 1990-1995 period in Table 7, lost .014896 points of
growth (relative to the mean) to excessive spending, .016545 points to inflation, 0071508
points to closure of the economy to foreign trade and investment, and .0142833 points to
government distortions. If one reform must be chosen, and assuming (perhaps heroically)
no feedback effects to other costs, control of inflation would seem to be the most urgent
task from the point of view of benefits. (The political costs of implementing various
types of reform are another matter.)
Some interesting results come from investigating the path of those countries that
have actually engaged in the greatest amount of reform. One way to do that is to examine
the countries whose total losses from malgovernance have decreased by the greatest

18
amount between the 1960-1965 and 1990-1995 periods. Table 13 lists the values for
LOSSTOTAL for each five-year period between 1960 and 1995 for the ten nations with
the greatest positive change in that variable between 1960-65 and 1990-95. Among the
nations listed are several exemplars for either dramatic economic reform or successful
policy, which is an indication that the measurements of distortion and reform used in this
paper are consistent with the general understanding of these concepts. In particular,
Indonesia can be seen to have begin dramatic reform after 1970, Korea in roughly 1965
or 1970, Chile in the 1975-1980 period, Israel after 1985, Ireland after 1970, New
Zealand after 1985 and Uganda after 1990. In addition two countries, the Central African
Republic and Tunisia, have reform patterns that are less sudden and will be discussed in
more detail below.
The details of reform are somewhat different in various countries. Figs. 2-11
depict the contribution, positive or negative, of each policy component to growth relative
to the mean. In Indonesia, where the net contribution of policy changed by the greatest
amount between 1960 and 1995, the most significant contributions were made by
conquering inflation after 1970 and opening up to the world economy after 1975. Korea
made modest cuts in government distortions after 1965 and opening up the economy after
1970. Inflation was never a significant contributor to poor policy there. After 1985,
government consumption actually went from being a modest boost to growth to a modest
negative. This might be because as it became wealthier Korea underwent the well-known
tendency of wealthier countries to expand the reach of government (Peltzman, 1980).
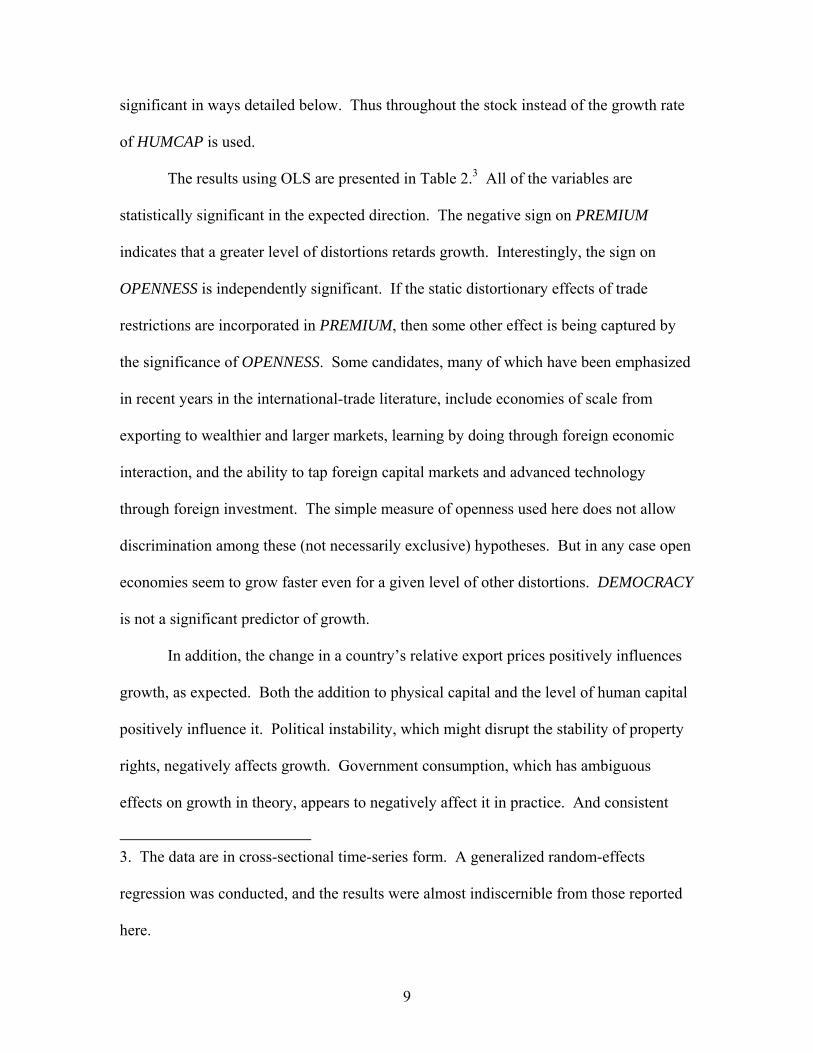
In Chile, interestingly, the obviously radical reforms after 1975 in fact at first
simply returned the country to the status quo before the Allende government took power

19
in 1970. But the reform was broad-based, with inflation, distortions and openness
contributing far more substantially to growth after 1975 than before. Only government
consumption worsened its negative impact on growth. In Israel, it was inflation and
openness that were doing the most damage by 1985, and whose repair was the most
dramatic change in policy. As in Korea and Chile, government consumption rose after
the dramatic reform period, and it is possible that this involved extending the social-
spending safety net to make reform more palatable, a possibility that has been suggested
for Chile in particular (Valdés, 1995).
Ireland made dramatic improvements in openness after 1970, and steady but
modest improvements in government consumption. New Zealand’s post-1985 reform, so
obvious in Fig. 9, again revolved mostly around opening the economy. Openness is also
important in Uganda after 1990, with OPENNESS changing from a small drain to a major
boost to the economy. Inflation is also a big part of the story there, changing from a
major to a tiny drag on economic performance. In the Philippines openness is again a
major part of the reform after 1985, with a significant improvement in each subsequent
five-year period. There was major improvement in the cost of government distortions
between 1985 and 1990, followed by a slight retrenchment in the next period.
Several implications emerge from this pattern. First, openness is a part of each of
the successful reform efforts. While the imprecision of the measurement of OPENNESS
merits caution as to the exact size of the effects from opening up in each case, it is clear,
that if a reform is substantial it generally includes this step. In most cases, opening up is
in fact one of the first things that is done. The same is true of inflation – if it is a
significant problem, tackling it seems to be a necessary first step. In each case where

20
reform took hold and inflation was a problem, its elimination occurred early in the
process. In one case, Indonesia, major reforms in openness occurred after inflation was
conquered.
The importance of inflation conquest in successful reform is not surprising.
Inflation is costly in a very visible way – all segments of the population are affected by it,
it is not invisible to the average citizen in the way that government distortions or trade
barriers might be, and many people are largely defenseless against it. To slay the
inflation dragon is to chalk up a substantial success in economic reform, which may give
governments that achieve it the credibility to engage in further reforms.
The tackling of government distortions also reveals interesting problems. In
several countries (Indonesia and Israel) distortions appear to have been addressed after
other problems – a sequential approach. In the Central African Republic and Korea, it
appears that distortions were never seriously addressed. In one – Tunisia – they were
addressed before other problems, but even in 1995 distortions were in that country
relative to the global mean a drag on economic growth. By the measure used, two
countries – New Zealand and Ireland – had no distortions to tackle. In only two countries
– Chile and the Philippines – was a simultaneous solution to distortions and inflation
and/or openness successfully achieved.
That inflation-fighting is such a big part of successful reform is unsurprising. In
addition to the aforementioned immediate political benefits, there are a number of
relatively simple remedies available on the shelf for purging inflation, especially
hyperinflation. Adopting significantly tighter monetary policies, more exotic hard-
currency systems such as the currency board, and in several Latin American countries

21
outright dollarization have all had significant success in curbing hyperinflation.
Admittedly, in at least on case – Argentina – the currency-board option has been blamed
for exacerbating if not outright causing the economic collapse in that country in late 2001
and early 2002. On the other hand, such systems have been argued to be successful in
Lithuania, Estonia and Hong Kong, among other places. The verdict on dollarization is
still out – the preliminary evidence from Latin America is that they are overwhelmingly
successful in slaying hyperinflation, but their long-term effects are unknown.
The relatively low transaction costs of inflation fighting, combined with the
payoffs in higher growth and the immediate political approval from same, surely explain
why gradualist nations emphasize it in the early stages. In addition, the relative rareness
of distortion removal in the early stages of gradual reform provide some support for the
framework sketched here of the growth and political benefits versus political- and
transaction-costs framework. This is buttressed by the relative unimportance in early
stages of reform of lower government consumption spending. In Indonesia, government
spending declined in the period after other reforms, before rising again after 1985. In
Chile it actually expanded during the first five-year period, but eventually declined after
1985. Similar initial deteriorations occurred in Israel and Uganda, if reform is dated as
beginning after 1985 and 1990 respectively in those countries. In the Philippines
government consumption does not appear to have been a part of the reform process at all,
while in Tunisia, Ireland and New Zealand it was not a big part of the problem. Only in
the Central African Republic was government consumption tackled early in the reform
process, and there the reform was quite gradual. That government consumption is such a
small part of these reforms is of interest in light of the emphasis it often receives in IMF

22
reform programs. Of course, to be fair often the demands to slash government spending
are not because spending per se is high but because deficits are huge. However, absent
chronic deficits of that sort, substantial cuts in spending may rank relatively low in terms
of immediate importance in economic reform.
Gradual vs. total
Is radical reform practical? The feasibility of empirical analysis suffers from an
inability to differentiate it from gradual reform in the data. The analysis here does allow
at least an attempt. Reform must be defined by a change from policies that are hostile to
those that are friendly to growth. The calculated policy loss LOSSTOTAL can serve as a
proxy for that variable. I will define the scope of reform as any change in LOSSTOTAL
from one five-year period to the next of at least 0.01, i.e. a change of at least one
percentage point in the growth-friendliness of policies. The list of countries who have
engaged in it by that measure is found in Table 14. There are three such changes between
1965 and 1970 (Venezuela, Brazil and Taiwan), four between 1970 and 1975 (Indonesia,
Egypt, Senegal and Korea) and between 1975 and 1980 (Chile, Cameroon, Indonesia and
Sri Lanka), two between 1980 and 1985 (Chile and Mauritania), five between 1985 and
1990 (Bolivia, Israel, Ghana, Costa Rica and the Central African Republic) and 14
between 1990 and 1995 (Argentina, Poland, Uganda, Mexico, Venezuela, Paraguay,
Bolivia, Israel, Turkey, Ghana, Uruguay, Tunisia, Gambia and the Philippines). That the
measure is a useful proxy for the phenomenon is supported by the huge increase in such
reforms in the 1990s, which is generally judged to be the time when the pressures of

23
globalization, the desires of multilateral agencies and ODA donor countries and the
desires of the body politic (particularly in the former Soviet bloc) are generally held to
have created a great deal of momentum for market-friendly policies.
It is possible to (roughly) distinguish between gradual reform and shock therapy
by looking at the changes in the components of LOSSTOTAL. In so doing, two questions
present themselves: is each type of reform sustained, and does it generate higher
economic growth? Nine of the 17 reforms involved only two of the four components,
while eight involved three or four. First, it was worth noting that ten years out, in all 17
cases the growth penalty was less than before reforms began, suggesting that in either
case reform can hold. But the average growth penalty in the modest-reform countries had
improved by 1.29980 percentage points during this period, while in the more dramatically
reformed economies it had improved by 3.25151 points. Of course, the proof of the
pudding is in growth, not the estimated growth penalty. During the five-year period
beginning ten years after the onset of reform, the gradual-reform countries by the above
criteria grew an average of 3.00 percent per year, versus 2.42 percent in the five-year
period prior to reform while the shock-therapy countries grew an average of 3.68 percent,
versus prior growth of 2.86 percent. Of course, the small number of observations in this
respect make firm conclusions hazardous, but both methods do seem to provide some
payouts down the road, with a modest edge to radical reform.
6. Conclusion
If the findings are to be believed, policy matters – a lot. The notion that a select
group of nations might, because of their knowledge and technological infrastructure, leap

24
irretrievably beyond the ability of poorer nations to catch up at least to a first
approximation is an appealing one in light of the results of fifty years or more of
surprisingly difficult efforts to develop. But the notion of an impassable barrier between
rich nations growing ever more prosperous and a large group nations mired in hopeless
poverty would, if true, argue against any nations ever advancing from poverty to
prosperity. That significant numbers of nations have made some progress, and that a few
have completely made the transition from underdeveloped to developed is a sign that all
is not lost. The prime implication of the findings here is that good policy, however it is to
be achieved, is effective in making substantial improvements to growth rates. This
appears to be true whether reform is gradual or sudden, although there does seem to be
slight room in the data for preferring sudden reform. In any case, the importance of
sound policy ought to be elevated to a dominant level in the discussion of improving the
lot of the world’s poor.

References
Alesina, Alberto and Weder, Beatrice. “Do Corrupt Governments Receive Less
Foreign Aid?” American Economic Review, 92 (4), September 2002, 1126-1137.
Barro, Robert J. Determinants of Economic Growth: A Cross-Country Empirical
Study. Cambridge, MA: MIT Press, 2000.
Barro, Robert J. “Economic Growth in a Cross-Section of Countries.” Quarterly
Journal of Economics 106 (2), May 1991, 407-443.
Bils, Mark and Klenow, Peter J. “Does Schooling Cause Growth?” American
Economic Review 90 (5), December 2000, 274-280.
Cheung, Steven N.S. “The Curse of Democracy as an Instrument of Reform in
Collapsed Communist Economies.” Contemporary Economic Policy 16 (2), April 1998,
247-249.
Dewatripont, Mathias and Roland, Gerard. “The Design of Reform Packages
Under Uncertainty.” American Economic Review 85 (5), December 1995, 1207-1223.
Domar, Evsey. “Capital Expansion, Rate of Growth, and Employment”,
Econometrica, 14, April 1946, 137-47.
Domar, Evsey. Essays in the Theory of Economic Growth. Oxford: Oxford
University Press, 1957.
Easterly, William. “The Ghost of Financing Gap: Testing the Model of Financing
Used in the International Financial Institutions.” Journal of Development Economics 60
(2), December 1999, 423-438.
Fei, John C.H. and Ranis, Gustav. Development of the Labor Surplus Economy:
Theory and Policy. Homewood, Ill: R.D. Irwin 1964.
25

Fernandez, Raquel and Rodrik, Dani. “Resistance to Reform: Status-Quo Bias in
the Presence of Individual-Specific Uncertainty.” American Economic Review 81 (5),
December 1991, 1146-1155.
Heymann, Daniel, and Leijonhufvud, Axel. High Inflation: The Arne Ryde
Memorial Lectures. Oxford: Clarendon Press, 1995.
Krueger, Anne O. “Agenda for Future Research: What we Need to Know.” In
Krueger, Anne O., ed., Economic Policy Reform: The Second Stage. Chicago: University
of Chicago Press, 2000, 585-594.
Lewis, W. Arthur. “Economic Development with Unlimited Supplies of Labor.”
The Manchester School 22 (2), May 1954, 139-191.
Lucas, Robert E. Jr. “On the Mechanics of Economic Development.” Journal of
Monetary Economics 22 (1), July 1988, 3-42.
Osborne, Evan. “Rethinking Foreign Aid.” Cato Journal 22 (2), Fall 2002, 297-
316.
Peltzman, Sam. “The Growth of Government.” Journal of Law and Economics
23 (2), October 1980, 209-287.
Romer, Paul M. “Increasing Returns and Long-Run Growth.” Journal of
Political Economy 94 (5), October 1986, 1002-1037.
Rostow, W.W. The Stages of Economic Growth: A Non-Communist Manifesto.
Cambridge. U.K.: Cambridge University Press, 1990.
Sachs, Jeffrey and Warner, A. “Economic Reform and the Process of Global
Integration.” Brookings Papers on Economic Activity, 1, 1995, 1-118.
26

Solow, Robert M. “A Contribution to the Theory of economic Growth.” The
Quarterly Journal of Economics 70 (1), February 1956, 65-94.
Valdés, Juan Gabriel. Pinochet’s Economists: The Chicago School in Chile.
Cambridge, UK: Cambridge University Press, 1995.
Wittman, Donald. “Why Democracies Produce Efficient Results.” Journal of
Political Economy 97 (6), December 1989, 1395-1424.
Yusuf, Shahid and Stiglitz, Joseph. “Development Issues: Settled and Open.” In
Gerald M. Meier and Joseph Stiglitz, eds., Frontiers if Development Economics: The
Future in Perspective. Washington: The World Bank, 2001, 227-268.
27

28
Table 1
Growth in the developing world, 1960-1995
Below-median climbers Most rapid growth Per capita Y 1960 1995 Annual per capita growth rate Seychelles 1253 4260 S. Korea 6.86 Swaziland 1240 2629 Singapore 6.72 Tunisia 1095 3160 Taiwan 6.29 Indonesia 641 2499 Hong Kong 6.15 Jordan 1158 3197 Malta 5.36 S. Korea 898 9145 Thailand 4.81 Sri Lanka 1253 2536 Malaysia 4.64 Thailand 940 4869 Botswana 4.48 Portugal 4.31 Indonesia 3.96 Lesotho 3.76 China 3.75 Seychelles 3.56 Greece 3.51 Syria 3.19 Tunisia 3.07 Jordan 2.94 Barbados 2.80 Morocco 2.71 Turkey 2.60 Egypt 2.60 Cape Verde 2.57 Brazil 2.56 Mauritius 2.54 Pakistan 2.40 Colombia 2.32 Panama 2.30 Gabon 2.20 Swaziland 2.17 Mexico 2.13 Sri Lanka 2.03 Dom. Rep. 2.03

29
Table 2
Physical and human capital, by national per capita income
Bottom third Middle third Top third
Non-residential 1627.80 8408.68 30,289.23 capital stock, (n = 10) (n = 19) (n = 31) 1990 Average years 3.05 5.73 7.89 of schooling, (n = 30) (n = 33) (n = 48) 1995 Primary student- 44.03 28.55 21.41 teacher ratio, (n = 30) (n = 33) (n = 48) 1995 Sources: Penn World Tables 5.6 (physical capital), Barro and Lee (1994) (human capital)

30
Table 3
OLS results, entire sample Variable Coefficient Standard Error CONSTANT .0241222 .0067432 PCGDP*** -6.48e-06 1.10e-06 INVGDP*** .1110481 .0240248 PREMIUM* -.0018652 .0010576 GCGDP*** -.1143939 .0252939 TRADESHOCK*** .0832733 .0257677 OPENNESS*** .0138895 .0040703 HUMCAP** 1.98e-06 6.75e-07 INSTABILITY* -.0141174 .007702 INFLATION*** -.0281259 .0071934 DEMOCRACY -.0004643 .0052111 F: 17.98*** R2: 0.3493 N: 346 Note: * denotes statistical significance at the ten-percent level. ** denotes statistical significance at the one-percent level. *** denotes statistical significance at the 0.1-percent level.

31
Table 4
Geographical and temporal distribution of per capita income
Poorest fifth (below $816.60)
Middle Sub-Saharan Eur./N.
S. Asia East Africa East Asia Latin Amer. Amer. Total 1960 1 0 4 1 1 0 7 1965 1 0 8 1 0 0 10 1970 1 0 7 1 0 0 9 1975 0 0 8 0 0 0 8 1980 0 0 8 0 0 0 8 1985 0 0 13 0 0 0 13 1990 0 0 7 0 0 0 7 Total 3 0 55 3 1 0 62
Top fifth (above 6807.2)
Middle Sub-Saharan S. Asia East Africa East Asia Latin Amer. Europe Total 1960 0 0 0 0 3 3 3 1965 0 2 0 0 2 4 4 1970 0 3 0 0 3 7 7 1975 0 4 0 1 5 12 12 1980 0 4 1 2 6 16 16 1985 0 2 1 3 4 16 16 1990 0 2 1 2 5 15 15 Total 0 17 3 8 28 0 73

Table 5
Regression Results
Top fifth
Variable Coefficients PREMIUM -.0013522* -.0013636* -.0012824* -.0012493* -.0015188* -.0013196* -.0012861* -.0012591* GCGDP -.1095196*** -.1052964*** -.1119875*** -.1116001*** -.1047702*** -.1075777*** -.1102927*** -.1119689*** INFLATION -.0299949*** -.0304655*** -.0292873*** -.0299961*** -.0302654*** -.0308095*** -.030057*** -.029743*** INSTABILITY -.0140906* -.0138494* -.0143462* -.0138278* -.0142824* -.01408* -.0141127* -.0142784* INVGDP .0930784*** .0924124*** .0933907*** .0927042*** .0981478*** .0899006*** .0926308*** .0933675*** HUMCAP .00000139** .00000148** .00000154** .00000143** .00000139** .00000175** .00000142** .00000140** OPENNESS .015067*** .0149436*** .0147649*** .0151598*** .0144974*** .0148969*** .0153538*** .0149408*** TOFTSHOCK .0691863*** .069556*** .0699264*** .0692126*** .0609432*** .0695487*** .0689953*** .074587*** PCGDP -.00000459*** -.00000445*** -.00000483*** -.00000483 -.00000400*** -.00000456*** -.00000470*** -.00000484*** CONSTANT .0237669*** .0229764*** .0243904*** .0246634*** ..0212466*** .0233844*** .0241665*** .024788*** INTER1PRE .0004215 - - - - - - - INTER1GC - -.0705123 - - - - - - INTER1INFL - - -.0178962 - - - - - INTER1INST - - - -.0084581 - - - - INTER1INV - - - - -.0392014* - - -
32

Table 5 (continued)
Top fifth
Variable Coefficients INTER1HC - - - - - -.00000551 - - INTER1OPEN - - - - - -.0018991 - INTER1TT - - - - - - -.0700875 N 487 487 487 487 487 487 487 487 R2 .3577 .3591 .3583 .3575 .3626 .3584 .3575 .3449 F 26.51*** 26.67*** 26.58 26.48 27.08*** 26.59*** 26.49*** 26.59***
Bottom fifth
PREMIUM -.0018659** -.0013168* -.0012426* -.0012801* -.0012559* -.0012423* -.0012323* -.0012224* GCGDP -.1022232*** -.1057736*** -.1119918*** -.1111923*** -.1110792*** -.1096271*** -.1114181*** -.1121667*** INFLATION -.0296984*** -.0296478*** -.0300588*** -.0290463*** -.0298885*** -.0295879*** -.0297585*** -.0300572*** INSTABILITY -.0150719* -.0146726*** -.01414* -.0131193* -.0142314* -.0147174* -.0143447* -.0142904* INVGGDP .0877031*** .0913523*** .0933768*** .0903788*** .0931822*** .0911466*** .0923011*** .093261*** HUMCAP .00000141** .00000140** .00000142** .00000138** .00000141** .00000141** .00000141** .00000144** OPENNESS .013868*** .0150124*** .0151217*** .0151371*** .0150959*** .0152334*** .0154135*** .0152491*** TOFTSHOCK .0684828*** .0690617*** .0693247*** .0680788** .069182*** .0697726*** .0696151*** .0782199***
33

Table 5 (continued)
Variable Coefficients PCGDP -.00000508*** -.00000487*** -.00000485*** -.00000485*** -.00000486*** -.00000487*** -.00000486*** -.00000486*** CONSTANT .0249556*** .024754*** .0247058*** .0251914*** .0247206*** .0252052*** .0248409*** .0247126*** INTER2PRE .0026683* - - - - - - - INTER2GC - -.0146201 - - - - - - INTER2INFL - - .0007989 - - - - - INTER2INST - - - -.0239171 - - - - INTER2INV - - - - -.0046387 - - - INTER2HC - - - - - -.00000249 - - INTER2OPEN - - - - - - -.0037755 - INTER2TT - - - - - - - -.0450959 N 487 487 487 487 487 487 487 487 R2 .3577 .3580 .3574 .3589 .3574 .3579 .3575 .3583 F 26.51*** 26.55*** 26.47*** 26.65*** 26.47*** 26.53*** 26.48*** 26.58***
34

Table 6
Regression results, with interaction terms
Variable Coefficient Standard Error
CONSTANT* .0127393 .0050774
PCGDP*** -3.35e-06 7.20e-07
INVGDP*** .1279158 .0182063
PREMIUM** -0.0020454 0.0007124
GCGDP*** -0.0552653 0.0162408
TRADESHOCK*** 0.075532 0.02177
OPENNESS*** . 0.0122968 0.0032949
HUMCAP* 1.10e-06 5.03e-07
INSTABILITY* -0.0135358 0.0065842
INFLATION*** -0.0217672 0.0052823
INTER1INV** -0.0522926 0.0200165
INTER2PREM* 0.0022576 0.011876
F: 23.74***
R2: 0.3472
N: 503
Note: * denotes statistical significance at the ten-percent level.
** denotes statistical significance at the one-percent level.
*** denotes statistical significance at the 0.1-percent level.
35

Table 7 Policy losses, 1990-1995
PREMIUM GOV. CONSUMPTION INFLATION TOTAL (including OPENNESS) 1. Sudan -.018012 Bangladesh -.0288824 D.R. Congo -.0881611 Zambia -.0528751 2. Iraq -.0157129 Congo -.0264371 Brazil -.0602273 Bangladesh -.0412315 3. Zambia -.014283 Seychelles -.0153241 Nicaragua -.0192669 Congo -.0406117 4. Iran -.0139607 Zambia -.014896 Suriname -.0176086 Nicaragua -.0333811 5. Rwanda -.0123634 Gambia -.0145059 Zambia -.016545 Malawi -.0333646 6. Afghanistan -.0116902 Malawi -.0129835 Peru -.0130841 Nigeria -.0278548 7. Burundi -.0101165 India -.011956 Turkey -.0127837 Algeria -.0235717 8. Tanzania -.0100075 Egypt -.011014 Uruguay -.0098094 Zimbabwe -.023245 9. Syria -.0097141 Cameroon -.0090921 Mozambique -.0076283 Egypt -.0216799 10. Haiti -.0094832 Guyana -.008683 Congo -.0075382 India -.0206507 Countries with maximum losses from lack of openness (.0071508): Iraq, Congo, Senegal, Myanmar, Chad, Mauritania, Zimbabwe, Cote D’Ivoire, Papua New Guinea, Kenya, Trinidad and Tobago, Nigeria, Algeria, Cameroon, Gabon, Zambia, Haiti, Madagascar, Malawi, Burundi, D.R. Congo, Sierra Leone, Somalia, Mozambique, Bangladesh, Iran, India, Pakistan
36

37
Table 8
Correlation of components of malgovernance, 1990-95
Full sample
PREMIUM INFLATION OPENNESS INFLATION 0.3666 OPENNESS -0.5728 -0.1457 GCGDP 0.2806 0.0586 -0.4522
Negative per capita growth
PREMIUM INFLATION OPENNESS INFLATION 0.6109 OPENNESS -0.5329 -0.2466 GCGDP 0.2447 0.4819 -0.3147

38
Table 9
Losses from terms of trade shocks, 1990-1995
1. Yemen -.0128522 2. Trinidad and Tobago -.0089113 3. Syria -.0077276 4. Comoros -.00705 5. Nigeria -.0063427 6. Mozambique -.0063083 7. Angola -.0048 8. Guinea-Bissau -.0046544 9. Guinea -.0042862 10. Gabon -.0034569

Table 10
Policy losses, entire sample period
PREMIUM GOV. CONSUMPTION INFLATION TOTAL (including OPENNESS) 1. D.R. Congo -.0122629 Bangladesh -.0196369 Argentina -.0198353 Zambia -.031146 2. Tanzania -.0106803 Zambia -.0152793 D.R. Congo -.0181369 Uganda -.0259174 3. Ethiopia -.00973 Guyana -.0127932 Peru -.0138244 Argentina -.0245935 4. Poland -.0092194 Cent. Afr. Rep. -.0111499 Nicaragua -.0103602 India -.0223809 5. Sudan -.0090739 India -.0107055 Uruguay -.0091125 Nigeria -.0211238 6. Malawi -.0088354 Panama -.0083839 Bolivia -.0082233 Ghana -.0171532 7. Zambia -.0084939 Malawi -.0083092 Chile -.0070161 Uruguay -.0152309 8. Rwanda -.0078205 Togo -.007987 Uganda -.0056179 Chile -.0151685 9. Bangladesh -.0075058 Nigeria -.0064362 Indonesia -.0055085 Algeria -.0136571 10. Nepal -.0074826 Cameroon -.0055758 Israel -.0052582 Cent. Afr. Rep. -.0136571 11. Ghana -.0074071 Sri Lanka -.0045808 Turkey -.004231 Sri Lanka -.0123975 12. Hungary -.0073461 Egypt -.0044096 Ghana -.0034466 Kenya -.011222 13. Algeria -.0072049 Kenya -.0041309 Zambia -.0031905 Bolivia -.0105097 14. Nigeria -.0069961 Costa Rica -.0038931 Sierra Leone -.0030815 Pakistan -.0102893 15. Burundi -.0067901 Uganda -.0032936 Mexico -.0023561 Burundi -.010203 16. Iraq -.006649 Chile -.0030952 Iceland -.0017781 Costa Rica -.0095969 17. Iran -.0061675 Bolivia -.0028805 Mozambique -.0014082 Togo -.0091251 18. Pakistan -.0056121 Burkina Faso -.0027812 Ecuador -.0011974 Paraguay -.0089928 19. Sri Lanka -.0054044 Ghana -.0025502 Colombia -.0010542 Dom. Republic -.0088553 20. Zimbabwe -.0051847 Philippines -.0010618 Suriname -.0010542 Cameroon -.0082892 21. Syria -.0051125 Algeria -.0008865 Nigeria -.0005407 Israel -.0079563 22. Chile -.0050871 Ecuador -.000756 Tanzania -.000205 Philippines -.0071179 23. El Salvador -.0050643 Sweden -.0007465 Jamaica -.0001461 Turkey -.0066875 24. Dom. Rep. -.0045662 Mauritius -.0006513 Venezuela .0001497 Tunisia -.005536 25. Argentina -.0043291 Nicaragua -.000635 Costa Rica .0004618 Indonesia -.0051368 26. Yugoslavia -.0042262 Honduras -.0004637 Paraguay .000541 Iran -.0050051 27. Kenya -.0041586 Denmark -.0004298 Iran .0005945 Colombia -.0043421 28. Botswana -.0041427 Madagascar -.0003237 Malawi .0006956 Burkina Faso -.0038689 29. Brazil -.0041158 Paraguay -.0002802 Dom. Republic .0007439 Ecuador -.0028875 30. Paraguay -.0039924 Tunisia -.0001063 Portugal .0008047 Honduras -.0017107 31. Jamaica -.0037313 Pakistan .0005149 Greece .0008985 Venezuela -.0005113
39

Table 10 (continued)
Policy losses, entire sample period
PREMIUM GOV. CONSUMPTION INFLATION TOTAL (including OPENNESS) 32. Lesotho -.0037192 Cyprus .0008778 Philippines .0010388 Jamaica -.0001289 33. Ecuador -.0034773 Jordan .0011225 Madagascar .0010563 Syria .0002564 34. Turkey -.0033647 Uruguay .0013182 Korea .0010737 Mexico .0006368 35. Indonesia -.0033255 Portugal .0013263 Syria .0011797 New Zealand .0080982 36. Tunisia -.0033255 Zimbabwe .0013794 Kenya .0011949 Korea .0085963 37. Israel -.0029391 U.K. .0015656 Congo .0011979 Cyprus .0092031 38. Bolivia -.0028373 Indonesia .0017776 Myanmar .001245 Jordan .0094892 39. Costa Rica -.0027941 Peru .0018034 Zimbabwe .0012955 Portugal .0097122 40. Colombia -.0024809 Burundi .0018116 El Salvador .0012966 Greece .0116128 41. South Africa -.002416 Thailand .0019013 South Africa .0013178 Malaysia .0153013 42. Philippines -.0022117 Austria .002063 Egypt .0013549 Sweden .0153017 43. Korea -.0019039 Dom. Rep. .0021201 Bangladesh .0013698 Denmark .0156429 44. Afghanistan -.0018385 Ireland .0025293 Lesotho .0014509 Thailand .0158535 45. Morocco -.001818 New Zealand .0026407 Swaziland .0015276 Ireland .0159626 46. Uruguay -.0015518 Finland .0029071 Spain .0015803 U.K. .0173859 47. Cyprus -.0006754 Colombia .0029425 Algeria .0015851 Austria .0181553 48. Greece -.0003031 Malaysia .0031164 Nepal .0016521 Spain .0184582 49. Venezuela -.0002153 France .0036493 Gambia .0016656 Finland .0188725 50. Jordan -.0001181 Jamaica .0037186 Guatemala .0016681 Italy .0196585 51. Portugal .0015044 Norway .0037281 Haiti .0017638 France .0198412 52. Congo .0017881 Israel .0039904 Trin. & Tobago .0017714 Norway .0198748 53. Senegal .0017881 Italy .0041861 Italy .0017944 Australia .0198962 54. Cote D’Ivoire.0017881 Spain .0042052 Botswana .0018046 Belgium .0223842 55. Benin .0017963 Venezuela .0048155 Sri Lanka .0018474 Canada .022394 56. Mexico .0019827 Greece .0049405 Burundi .0019263 Netherlands .0233248 57. Cameroon .0023342 Mexico .0051376 India .001957 U.S. .0243614 58. Honduras .0025404 Argentina .0054557 Pakistan .0019588 Switzerland .0245606 59. Guatemala .002625 Australia .005684 Mauritius .0019674 60. Malaysia .002854 Canada .0059382 New Zealand .0019838 61. Haiti .0030167 Trin. & Tobago .00607 Honduras .001984 62. Niger .0033434 Turkey .0061693 Ireland .002023
40

Table 10 (continued)
Policy losses, entire sample period
PREMIUM GOV. CONSUMPTION INFLATION TOTAL (including OPENNESS) 63. Cen. Afr. Rep..0033473 Belgium .0064832 Mauritania .0020695 64. Burkina Faso .0033473 Netherlands .0066627 Hungary .0020851 65. Togo .0033473 Korea .006751 Cameroon .0021032 66. Chad .0040476 Iran .0077188 U.K. .0021423 67. Thailand .0051632 Switzerland .0077392 Barbados .0022061 68. Oman .0055031 U.S. .0078275 Cote D’Ivoire .002217 69. Spain .006596 Singapore .0085003 Mali .0022776 70. Hong Kong .006785 Syria .0090726 Finland .0022875 71. Belgium .0069053 Gabon .0022902 72. Japan .0069903 Hong Kong .002292 73. Austria .0070068 Ethiopia .0023104 74. Sweden .0023703 75. Fiji .0023898 76. Denmark .0023948 77. Jordan .002408 78. Australia .0024239 79. Cent. Afr. Rep. .0024316 80. Norway .0024687 81. Senegal .0024851 82. France .0025139 83. Morocco .002527 84. Kuwait .0025408 85. Tunisia .0026902 86. Papua N.G. .0026171 87. Chad .0026583 88. Togo .0026656 89. Benin .0026889 90. Taiwan .0027102 91. Thailand .0027121 92. China .0027155 93. Burkina Faso .0027159
41

Table 10 (continued)
Policy losses, entire sample period
PREMIUM GOV. CONSUMPTION INFLATION TOTAL (including OPENNESS) 94. Niger .0027542 95. Canada .0027779 96. Japan .0028114 97. U.S. .002856 98. Belgium .0029188 99. Cyprus .0029239 100. Netherlands .0029843 101. Austria .0030086 102. Luxemburg .0030094 103. Saudi Arabia .003046 104. Switzerland .0031435 105. W. Germany .0032239 106. Malta .0032274 107. Malaysia .003254 108. Singapore .0032775 109. Panama .0033705 Note: Australia, Canada, Denmark, Finland, France, Ireland, Italy, Netherlands, New Zealand, Norway, Switzerland, U.K., U.S. and W. Germany had equal estimated bonus from PREMIUM, .0076011. Note: OPENNESS
42

43
Table 11
Terms of trade losses, 1960-1995 (ttloss or losstt?) 1. Ghana -.0027388 2. Sri Lanka -.0021854 3. Nicaragua -.0019535 4. Malawi -.0018178 5. India -.0017208 6. Mozambique -.0016464 7. Uganda -.0015207 8. D.R. Congo -.0015109 9. Japan -.0015015 10. Mauritania -.0013217 11. Chile -.0012711 12. Zambia -.001258 13. Madagascar -.0012034 14. Cote D’Ivoire -.0011165 15. South Africa -.0011071 16. Pakistan -.0010054 17. Niger -.0009912 18. Brazil -.000983 19. Taiwan -.0008842 20. Cameroon -.0008494 21. Thailand -.0008333 22. Sierra Leone -.0008267 23. Peru -.0008257 24. Egypt -.0007956 25. Mauritius -.0007643 26. Papua New Guinea -.000747 27. Argentina -.0006731 28. Bangladesh -.0006689 29. Cent. Afr. Rep. -.0006579 30. Italy -.0005702 31. Togo -.0005658 32. U.S. -.0005317 33. Benin -.0005181 34. Australia -.0005132 35. Costa Rica -.0004919 36. Philippines -.0004432 37. Ethiopia -.0003988 38. Jamaica -.0003966 39. Dom. Republic -.000368 40. Gambia -.0003083 41. Trin. & Tobago -.0002961 42. Canada -.0002779 43. Guatemala -.0002383 44. Ireland -.000201 45. Belgium -.0001941 46. Malaysia -.0001529 47. Spain -.0001515 48. Netherlands -.0001025 49. Denmark -.0000928 50. Sweden -.0000881 51. Senegal -.0000331 52. Austria -.0000255

44
Table 11 (continued) 53. Chad .0000687 54. Mali .0000996 55. Israel .0000997 56. Uruguay .0001097 57. El Salvador .000115 58. U.K. .0001285 59. Norway .0001343 60. Korea .0001864 61. Greece .000215 62. France .000231 63. Colombia .0002367 64. Finland .0003122 65. Jordan .0003866 66. Kenya .000468 67. Morocco .0004759 68. New Zealand .0005161 69. Indonesia .0007275 70. Paraguay .0007363 71. Switzerland .0007987 72. Algeria .0008011 73. Honduras .0008217 74. Panama .0008687 75. Mexico .0008838 76. Angola .0009083 77. Nigeria .0009897 78. Rwanda .0010205 79. Venezuela .001264 80. Iceland .0013467 81. Ecuador .0014354 82. Tunisia .0016663 83. Burkina Faso .0017934 84. Syria .0018756 85. Congo .0020704 86. Iran .0022896 87. Gabon .0023834 88. Bolivia .0028734

45
Table 12
Correlation of components of malgovernance, 1960-1995 [redo 90-5 with components, not losses]
Full sample
PREMIUM INFLATION OPENNESS INFLATION 0.1677 - OPENNESS -0.2268 -0.1651 GCGDP 0.0790 0.0161 -0.3064
Negative per capita growth
PREMIUM INFLATION OPENNESS INFLATION 0.1779 OPENNESS -0.1327 -0.1115 GCGDP 0.0106 -0.0686 -0.1844

Table 13
Successful reform: Value of LOSSTOT in each five-year interval 1965-70 1970-75 1975-80 1980-85 1985-90 1990-95 1990-5 Change
1. Indonesia -.030431 -.0309901 -.000881 .009903 .0092 .006098 .00601 .036441 2. Korea -.007256 -.000848 .010531 .012981 .016904 .017369 .023761 .031017 3. Chile -.018092 -.018434 -.049918 -.016838 .003626 -.000316 .007058 .02515 4. Israel -.010399 -.002959 -.002688 -.011932 -.027665 -.00025 .013466 .023865 5. Cent. Afr. Rep. -.032787 -.029149 -.034761 -.025594 -.021843 -.009438 -.011672 .021115 6. Tunisia -.009538 -.009543 -.006078 -.003984 -.004327 -.001425 .00941 .018948 7. Ireland .006428 .017759 .017748 .017691 .018437 .022174 .024768 .01834 8. New Zealand .00741 .007028 .006858 .004588 .005584 .014794 .023693 .016283 9. Uganda -.017973 -.01579 -.018534 -.029676 -.023176 -.025364 -.002997 .014976 10. Philippines -.007432 -.004313 -.009758 -.008946 -.010773 -.002747 .007412 .014844
46

47
Table 14
Gradual and radical reform 1965
Taiwan Government, Premium Brazil Government, Inflation Venezuela Government, Premium, Openness
1970 Indonesia Premium, Inflation, Openness Egypt Government, Premium Senegal Government, Premium Korea Government, Premium, Openness 1975 Chile Premium, Inflation, Openness Cameroon Premium Indonesia Premium, Inflation, Openness Sri Lanka Government, Premium, Openness 1980 Chile Government, Openness Mauritania Government, Premium 1985 Bolivia Government, Premium, Inflation, Openness Israel Premium, Inflation, Openness Ghana Government, Premium, Inflation, Openness Costa Rica Government, Inflation, Openness Cent. Afr. Rep. Government, Inflation 1990 Argentina Government, Premium, Inflation, Openness Poland Government, Premium, Inflation, Openness Uganda Inflation, Openness Mexico Government, Premium, Inflation, Openness Venezuela Premium, Openness Paraguay Premium, Inflation, Openness Bulgaria Government, Premium, Inflation Israel Government, Premium, Inflation, Openness Turkey Government, Premium, Openness Ghana Government, Premium, Inflation, Openness Uruguay Government, Inflation, Openness Tunisia Premium, Inflation, Openness Gambia Government, Premium, Inflation, Openness Philippines Government, Premium, Openness

���������������������������������������������������������������������������������������������������������������������
������������������������������������������������������������������������������������ ���������������������������������������������������������������������������������������������������������������������������������������������������������������������
������������������������������������������������������������������������������������������������������������������������������������������������������������������������������������������������������������������������������������������������������������������
������������������������������������������������������������������������������������
���������������������������������������������������������������������������������������������������������������������������������������������������������������
������������������������������������������������������������������������������������������������������������������
�������������������������� ��������������������������������������������������������������������������
������������������������������������������������������������������������������������������������������������������������������������������
������������������������������������������������������������������������������������������������������������������������������������������������������������������������������������������������������
������������������������������������������������������������������������ ���������������������������������������������������������������������������������������������������������������������������������������������
���������������������������������������������������������������������������������������������������������������������������������
����������� �������������������
������������������������������������������������������������������������������
������������������������������������������������������������������������������������������������������������������������������������������������������������������������������������������������������������������������������������������
������������������������������������������������������
������������������������������������������������������������������������������������������������������
������������������� �����������������������������������������������������
���������������������������������������������������������
������������
���������� �����������������
������������������������������������������������������������
����������������������� �������������������������������������������
������������������������������������������������������������������������
���������������������������������������
������������������������������������������������������������������������������������������
������������������������������������������������������������������������������������������������������������
������������������������������������������� �����������������������������������������������������������������������������������������������������������������������������
���������������������������������������������������������������������������������������������������������������������������������
���������������������������������������������������������������������������������������������������������������������������������
������������������������������������������� �����������������������������������������������������������������������������������
Fig. 1 - Components of lost growth
-100%
-80%
-60%
-40%
-20%
0%
20%
Zambia Bangladesh Congo Nicaragua Malawi Nigeria Algeria Zimbabwe Egypt India
�������� Openness
�������� Inflation
������ Gov. Cons.Premium
48

���������������������������������������������������
������������������ ���������������������������������
���������������������������������������
������������������������������������������������������������
��������������������������������������������������������������������������������
������������������������������������������������������������
��������������������� ���������������������������������������
������������������������������������������������������������
�������������������� �������������������������������������
���������������������������������������������������������������������
������ ����
������������������
���������������
���������������������������������������������������������������������������������������������������������������������������������������������������������������������
������������������������������������������������������������ ���������������������������������������������������������������������������������������������������������������������
���������
������
��������������������
������������������
���������������
Indonesia
-0.04
-0.035
-0.03
-0.025
-0.02
-0.015
-0.01
-0.005
0
0.005
0.01
0.015
1960-65
1965-70
1970-75
1975-80
1980-85
1985-90
1990-95
Govt. Cons.
���Inflation����Premium
���Openness
49

��������������������������������������������������������������������������������
������������������������������������������������������������������������
������������������������������������������������������������������������
������������������������������������������������������������������������������������������������������������������������������������
���������������������������������������������������������������������������������������������������������������������������������������������������������������� ������
������������
������� �����������������
����������������������������������������������������������������������������������������������������
����������������������������������������
���������������������������
��������������������
���������������������������� ����������
��������������������
��������� �����������������������
����
����������������
���
������������
��������������������������������������������
������������������������������
���������� ��������������������������
����������������������������������������������������������������������������������������������������������������
����������������������������������������������������������������
���������������������������������������������������������������������������������������������������
��������������������������������������������������������������������������������������������������������������������������������
��������������������������������������������������������������������������������������������������������������������������������
���������������������������������������������������������������������������������������������������
��������������������������������� �����������������������������������������������������������������������������������������������
Korea
-0.015
-0.01
-0.005
0
0.005
0.01
0.015
0.0219
60-6
5
1965
-70
1970
-75
1975
-80
1980
-85
1985
-90
1990
-95
���Openness
����Inflation
���Premium����Govt. Cons.
50
��������������������������������������������
���������������������������������
����������������������������������������������������������������������������
����������������
������������������ �����
���������������
����������������
������������������������
������������������
����������������������������������������������������������������������������������������������������������������������������������������������������������������������������������������������������������������������������������������
������������������������������������������������������������������������������������������������
������������
��������������������
����������������
������������������������������������������������
���������������������������������������
������������������������������������������������
������������������������������������
���������������������������������������������
����������������������������� ���������������������������
���������������� ��������������������������������������������
Chile
-0.06
-0.05
-0.04
-0.03
-0.02
-0.01
0
0.01
0.02
1960-65 1965-70 1970-75 1975-80 1980-85 1985-90 1990-95
���Openness
����Inflation
���PremiumGovt. Cons.
51

������������������������������������
������������������
��������������������������������������������
����������������������������������������
������������������ �����
���������������
��������
������������������������
���������������������������
������������������������
������������������������������������������������������������������������������������������������������������
���������������������������������������������������������������������������������������������������������������������������������������������������������������������������������������������������������������������������
������������������������
������������
����������������������������������������������������������������
������������������������������������������������
��������������������������������������������������������������������
��������������������������������������������������������������������
���������������������������������������������������
������������������������� �����������������������
�������������������� ��������������������������������������������������������
Israel
-0.04
-0.03
-0.02
-0.01
0
0.01
0.02
1960-65
1965-70
1970-75
1975-80
1980-85
1985-90
1990-95 ���Openness
����Inflation
���PremiumGovt. Cons.
52

��������������������������������������������������������������������������������������������������������
����������������������������������������������������������������������������������������������������
���������������������������������������������������������������������������������������������������
������������������������������������������������������������������������������������������������������������������������
����������������������������������������������������������������������������������������������������������������
������������������������������������������������������������������������������������
���������������������������� ��������������������������������������������������������������������������������
��������������������������������
������������������������������������������������
������������������
����������������
��������������������
������������������������������������������������
����������� �����������������������������
����������������������������������������������������������������������������
��������������������������������������������������������������������������������
���������������������������������������������������������
����������������������������������������������������������������������������
��������������������������������������������������������������������������������
������������������������������������������������������������
��������������������� �����������������������������������������������������������
Central African Republic
-0.04
-0.035
-0.03
-0.025
-0.02
-0.015
-0.01
-0.005
0
0.005
0.01
1960-65 1965-70 1970-75 1975-80 1980-85 1985-90 1990-95
���Openness
����Inflation
���PremiumGovt. Cons.
53

��������������������������������������������������������������������������������������������������������������������������������
������������������������������������������������������������������������������������������������
������������������������������������������
�������� ������������������������
������������������
��������������������
����������������������������������������������������������������������������
����������������������������������������������������������������������������
���������������������������������������������
������������������������������������������������
������������������������������������
������������������������������������
���������������� ��������������������������������������������
��������������������������������������������������������������������������������������������������������������������������������
��������������������������������������������������������������������������������������������������������������������������������
������������������������������������������������������������������������������������������������
��������������������������������������������������������������������������������������������������������������������������������
��������������������������������������������������������������������������������������������������������������������������������
���������������������������������������������������������
�������������������������������������� ��������������������������������������������������������������������������������������������������������������
Tunisia
-0.015
-0.01
-0.005
0
0.005
0.01
0.015
1960-65
1965-70
1970-75
1975-80
1980-85
1985-90
1990-95
���Openness
����Inflation
���PremiumGovt. Cons.
54

������������������������������������������������������������������������������������������������������������������������������������
������������������������������������������������������������������������������������������������������������������������������������
���������������������������������������������������������������������������������������������������
������������������������������������������������������������������������������������������������������������������������������������
������������������������������������������������������������������������������������������������������������������������������������
������������������������������������������������������������������������������������������������������
���������������������������������� ��������������������������������������������������������������������������������������������������
����������������������������������������������������
������������������������������������������������ ��������� ��������
����������������
���������������������������������������
��������������� �����������������������������������������
����������������������������������������������������������������������������������������������������
������������������������������������������������������������������������
���������������������������������������������������������������������������������������
��������������������������������������������������������������������������������������������������������������������
����������������������������������������������������������������������������������������������������������������
���������������������������������������������������������������������������������������
������������������������������ ��������������������������������������������������������������������������������������
Ireland
-0.01
-0.005
0
0.005
0.01
0.015
0.02
0.025
0.03
1960-65 1965-70 1970-75 1975-80 1980-85 1985-90 1990-95
���Openness
����Inflation
���PremiumGovt. Cons.
55

������������������������������������������������������������������������������������������������������������������������������������
������������������������������������������������������������������������������������������������������������������������������������
���������������������������������������������������������������������������������������������������
������������������������������������������������������������������������������������������������������������������������������������
������������������������������������������������������������������������������������������������������������������������������������
���������������������������������������������������������������������������������������������������
���������������������������������� ��������������������������������������������������������������������������������������������������
��������������������������������������������������������
������������������������������������������������
������������������ ��������
����������������
���������������������
���������������� ��������������������������������������������
����������������������������������������������������������������������������������������������������
����������������������������������������������������������������������������������������������������
���������������������������������������������������������������������������
����������������������������������������������������������������������������������������������������
����������������������������������������������������������������������������������������������������
���������������������������
������������������������������ ��������������������������������������������������������������������������������������
New Zealand
-0.01
-0.005
0
0.005
0.01
0.015
0.02
0.025
0.03
1960-65
1965-70
1970-75
1975-80
1980-85
1985-90
1990-95
���Openness
����Inflation
���PremiumGovt. Cons.56

����������������������������������������������������������������������������������������������������������������������������
��������������������������������������������������������������������������������������������������������
���������������������������������������������������������������������
��������������������������������������������������������������������������������
������������������������������������������������������������������������������������
���������������������������������������������������������������
�������������������������� ��������������������������������������������������������������������������
��������������������������������������������
��������������������������������������������
������������������������ ���������������������������������������
���������������������������������������������������������������������������������������������������������������������
��������������������������������������������������������������������������������������������������������������������������������������������������������������������
���������������������������������������������������������������������������������������������������������������������������������������������������������������������������������������������������������
������������������������
������������������������������������������������������������������������������������
����������������������������������������������������������������������������������������
���������������������������������������������������������������
������������������������������������������������������������������������������������
����������������������������������������������������������������������������������������
������������
�������������������������� ��������������������������������������������������������������������������
Uganda
-0.035
-0.03
-0.025
-0.02
-0.015
-0.01
-0.005
0
0.005
0.01
1960-65
1965-70
1970-75
1975-80
1980-85
1985-90
1990-95
���Openness
����Inflation
���PremiumGovt. Cons.
57

������������������������������������������������������������������������������������������������������������
������������������������������������
������������������������
����������������������������
������������������������������������������������
������
����
��������������������������������������������������������������������
����������������������������������������������������������������
������������
��������������������
������������������������������������
���������������������������������������
�������� ��������������������
��������������������������������������������������������������������������������������������������������������������������������������������������������
������������������������������������������������������������������������������������������������������������������������������������������������������������
������������������������������������������������������������������������������������������������������������������
��������������������������������������������������������������������������������������������������������������������������������������������������������
������������������������������������������������������������������������������������������������������������������������������������������������������������
������������������������������������������������������������������
��������������������������������������������� �����������������������������������������������������������������������������������������������������������������������������������
Philippines
-0.015
-0.01
-0.005
0
0.005
0.01
1960-65
1965-70
1970-75
1975-80
1980-85
1985-90
1990-95
���Openness
����Inflation
���PremiumGovt. Cons.
58