Discriminating between Commercial and Residual Hydrocarbon …€¦ · ·...
5
79 th EAGE Conference & Exhibition 2017 Paris, France, 12-15 June 2017 We B3 10 Discriminating between Commercial and Residual Hydrocarbon Saturation Integrating Pre-stack Seismic and CSEM P. Alvarez (RSI), L.M. MacGregor* (Rock Solid Images), A. Alvarez (RSI), F. Bolivar (RSI), R. Keirstead (RSI), T. Martin (RSI) Summary We present an example from the Hoop area of the Barents Sea showing a sequential quantitative integration approach to integrate seismic and CSEM attributes using a rock physics framework, which allows us to discriminate between commercial and non-commercial (residual) hydrocarbon saturation. A dataset consisting of 2D GeoStreamer® seismic and towed streamer electromagnetic data that were acquired concurrently in 2015 by PGS provide the surface geophysical measurements used in this study. Two wells in the area: Wisting Central (7324/8-1) and Wisting Alternative (7324/7-1S) provide calibration for the rock physics modelling and the quantitative integrated analysis. In the first stage of the analysis, we invert pre-stack seismic and CSEM data separately for impedance and anisotropic resistivity respectively. We then apply the multi-attribute rotation scheme (MARS) to estimate rock properties from seismic data. This analysis verified that the seismic data alone cannot distinguish between commercial and non-commercial hydrocarbon saturations. Therefore, in the final stage of the analysis we invert the seismic and CSEM derived properties within a rock physics framework. The inclusion of the CSEM-derived resistivity information within the inversion approach allows for the separation of these two possible scenarios. Result show excellent correlation with known well outcomes.
Transcript of Discriminating between Commercial and Residual Hydrocarbon …€¦ · ·...

79th EAGE Conference & Exhibition 2017 Paris, France, 12-15 June 2017
We B3 10
Discriminating between Commercial and Residual
Hydrocarbon Saturation Integrating Pre-stack Seismic and
CSEM
P. Alvarez (RSI), L.M. MacGregor* (Rock Solid Images), A. Alvarez (RSI), F. Bolivar (RSI), R.
Keirstead (RSI), T. Martin (RSI)
Summary
We present an example from the Hoop area of the Barents Sea showing a sequential quantitative integration
approach to integrate seismic and CSEM attributes using a rock physics framework, which allows us to
discriminate between commercial and non-commercial (residual) hydrocarbon saturation. A dataset consisting
of 2D GeoStreamer® seismic and towed streamer electromagnetic data that were acquired concurrently in 2015
by PGS provide the surface geophysical measurements used in this study. Two wells in the area: Wisting Central
(7324/8-1) and Wisting Alternative (7324/7-1S) provide calibration for the rock physics modelling and the
quantitative integrated analysis. In the first stage of the analysis, we invert pre-stack seismic and CSEM data
separately for impedance and anisotropic resistivity respectively. We then apply the multi-attribute rotation
scheme (MARS) to estimate rock properties from seismic data. This analysis verified that the seismic data alone
cannot distinguish between commercial and non-commercial hydrocarbon saturations. Therefore, in the final
stage of the analysis we invert the seismic and CSEM derived properties within a rock physics framework. The
inclusion of the CSEM-derived resistivity information within the inversion approach allows for the separation of
these two possible scenarios. Result show excellent correlation with known well outcomes.

79th EAGE Conference & Exhibition 2017 Paris, France, 12-15 June 2017
Introduction
The integration of pre-stack seismic inversion attributes with controlled source electromagnetic (CSEM)
attributes using a rock physics framework constitutes one of the most modern and complete methodologies
to carry out geophysical reservoir characterization. Seismic provides the structural framework and, from
AVO information, the possibility to derive P- and S-wave impedance volumes. These two valuable,
independent measurements can be linked to porosity and lithology, however, the seismic data cannot
distinguish between low- and high-saturated hydrocarbon saturation due to their similar AVO responses.
In contrast, CSEM data provide a lower resolution measure of resistivity, which, when constrained with
the structural framework and seismically derived volumes of porosity and lithology, can be linked to fluid
saturation allowing the separation between commercial and non-commercial hydrocarbon accumulations.
This paper presents a case study in which the integration of seismic, CSEM and well-log data has been
applied to distinguished between these two scenarios. This separation would not be possible to achieve if
only seismic reservoir characterization approaches were applied. The study area is located in the Hoop
area of the Barents Sea, Norway.
Location, data sets and workflow
The area in question covers a significant oil discovery in the Hoop Fault Complex on the Bjarmeland
Platform in the Barents Sea, Norway. A densely-sampled dataset consisting of six lines of 2D
GeoStreamer® seismic and towed streamer EM data were acquired concurrently in 2015 by PGS, using
the system depicted in Figure 1a (Englemark et al., 2014). The survey area lies in water depths of
approximately 400m. Two public domain wells in the area provide calibration for the integrated analysis.
Oil bearing sands were encountered in the Realgrunnen interval at well 7324/8-1 (Wisting Central),
whereas the same interval was dry in nearby well 7324/7-1S (Wisting Alternative). Two additional wells
have been drilled in the immediate vicinity: 7324/7-2 (Hanssen) yielded a small oil discovery, and 7324/8-
2 (Bjaaland) was dry (residual saturation). The results from these wells were used to validate and
corroborate the accuracy of the reservoir property predictions (Figure 1b).
Figure 1. a) Sketch of the CSEM and 2D seismic data acquisition approach. b) Detailed view of the studied
area showing the location of the 2D GeoStreamer® seismic and towed streamer CSEM data (blue lines),
as well as the calibration wells (Central and Alternative) and the validation wells (Hanssen and Bjaaland).
The magenta outlines show the updated interpretation of the extension of the proven reservoirs in the area
(data courtesy NPD), which were discovered by the Central and Hanssen wells. The white outlines show
the previous interpretation of the extension of the proven reservoirs in the area.
The workflow used to carry out the quantitative interpretation of well-log, seismic and CSEM data involves
as a first stage the inversion of pre-stack seismic data and then the quantitative estimation of rock property
and facies volumes by combining well log data and seismic inversion attributes. Resistivity volumes are
then estimated from the seismically derived properties at different fluid saturations by applying rock
physics relationships calibrated at the wells. In the next step, the CSEM data are inverted and the transverse
resistance calculated from the resulting resistivity by vertically integrating the resulting resistivity volumes
across the interval of interest. The seismically and CSEM derived electrical properties can then be
compared to infer areas that may be hydrocarbon charged. Finally, a global search inversion algorithm is
applied to estimate a hydrocarbon saturation volume that honours all the geophysical measurements.

79th EAGE Conference & Exhibition 2017 Paris, France, 12-15 June 2017
Seismic Reservoir Characterization
The multi-attribute rotation scheme (MARS) (Alvarez et al. 2015), was used to estimate rock properties
and facies volumes from well log and seismic inversion attributes. This workflow uses a numerical solution
to estimate a transform to predict petrophysical properties from elastic attributes. The transform is
computed from well-log-derived elastic attributes and petrophysical properties, and posteriorly applied to
seismically-derived elastic attributes. The resultant litho-fluid facies, clay content and total porosity
sections for the line 5001P1009 (see Figure 1b), along with the corresponding well log information for the
Central and Alternative wells is shown in Figure 2. Notice the good match between the seismic and well-
log-derived petrophysical property in the calibration wells demonstrating that both were correctly
predicted. In addition, the well trajectory of the Hanssen and Bjaaland wells are also shown (no log
information is available for these wells). The former was catalogued as a discovery well and the latter as a
dry well (only found residual saturation). The litho-fluid facies section suggests that hydrocarbon fluid is
present in both locations, and highlights the fact that seismic data alone cannot distinguish between
commercial and non-commercial hydrocarbon saturations, leaving a significant ambiguity in prospect de-
risking.
Figure 2. For line 5001P1009 (Figure 1b), sections of litho-fluid facies (top), clay content (middle) and
total porosity (bottom) along wells Central and Alternative derived after apply the MARS analysis to elastic
attributes. The curves overlaid in the top panel are Vclay (left) and Sw (right) and in the middle and bottom
panels are volume of clay (left) and total porosity (right).
Derivation of resistivity from CSEM data
To resolve the interpretation ambiguity in the seismic interpretation, we used resistivity information
derived from CSEM data. A 2.5D inversion approach, in which the earth structure is 2D and the source is
a 3D point dipole, was therefore applied. The CSEM data for six frequencies (0.2Hz, 0.8Hz, 1Hz, 1.4Hz,
2.2Hz, and 2.6Hz) were inverted using an Occam approach (Constable et al., 1987; Key, 2016). Nineteen
to twenty-three source-receiver pairs per frequency were included in inversion. The inversion was
performed in stages. Firstly, an unconstrained inversion was run to examine the resistivity structure
obtained in the absence of any a priori information. Seismic data were then used to condition the inversion
of the CSEM data by adding structural constraint in the form of breaks in the smoothness requirement at
selected seismic horizons, thereby improving the resolution of the CSEM result. Figure 3 shows the CSEM-
derived vertical resistivity in the same windows of analysis used in the seismic quantitative interpretation,
for the unconstrained and constrained inversions run. A qualitative interpretation of the CSEM inversion
79th EAGE Conference & Exhibition 2017 Paris, France, 12-15 June 2017
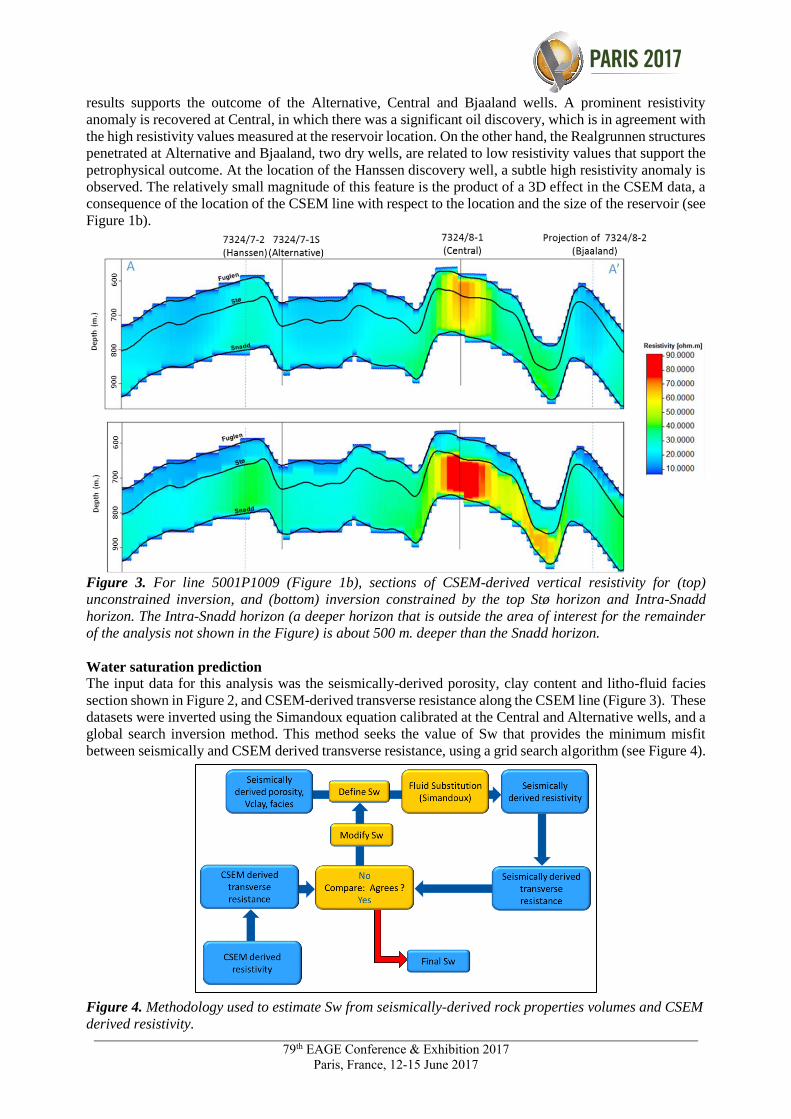
results supports the outcome of the Alternative, Central and Bjaaland wells. A prominent resistivity
anomaly is recovered at Central, in which there was a significant oil discovery, which is in agreement with
the high resistivity values measured at the reservoir location. On the other hand, the Realgrunnen structures
penetrated at Alternative and Bjaaland, two dry wells, are related to low resistivity values that support the
petrophysical outcome. At the location of the Hanssen discovery well, a subtle high resistivity anomaly is
observed. The relatively small magnitude of this feature is the product of a 3D effect in the CSEM data, a
consequence of the location of the CSEM line with respect to the location and the size of the reservoir (see
Figure 1b).
Figure 3. For line 5001P1009 (Figure 1b), sections of CSEM-derived vertical resistivity for (top)
unconstrained inversion, and (bottom) inversion constrained by the top Stø horizon and Intra-Snadd
horizon. The Intra-Snadd horizon (a deeper horizon that is outside the area of interest for the remainder
of the analysis not shown in the Figure) is about 500 m. deeper than the Snadd horizon.
Water saturation prediction
The input data for this analysis was the seismically-derived porosity, clay content and litho-fluid facies
section shown in Figure 2, and CSEM-derived transverse resistance along the CSEM line (Figure 3). These
datasets were inverted using the Simandoux equation calibrated at the Central and Alternative wells, and a
global search inversion method. This method seeks the value of Sw that provides the minimum misfit
between seismically and CSEM derived transverse resistance, using a grid search algorithm (see Figure 4).
Figure 4. Methodology used to estimate Sw from seismically-derived rock properties volumes and CSEM
derived resistivity.

79th EAGE Conference & Exhibition 2017 Paris, France, 12-15 June 2017
It is important to mention that only potential reservoir rocks as indicated by the seismic litho-fluid facies
(green facies in Figure 2 to the top), were considered to have variable Sw during the inversion process. In
this way the quantitative seismic interpretation result not only provides information about the clay content
and total porosity of the rocks, necessary for the Simandoux equation, but also about the location and
thickness of the potential pay sand, thus maintaining seismic resolution in the final result. However, note
that since only Sw varies during the inversion, it is implicitly assumed that the porosity and Vclay as
defined by the seismic data are correct.
Finally, the resulting Sw profile was mapped back in its correct position using the seismically-derived
litho-fluid facies volume to generate a hydrocarbon saturation section along the line (Figure 5). Excellent
correlation with known well results was achieved. The integration of seismic, CSEM, and well data predicts
very high hydrocarbon saturations at Wisting Central, consistent with the findings of the well. The slightly
lower saturation at Hanssen is related to 3D effects in the CSEM data, but the outcome of the well is
predicted correctly. There is no significant saturation at Wisting Alternative, again consistent with the
findings of the well. At Bjaaland, although the seismic indicate the presence of hydrocarbon bearing sands,
the integrated interpretation result again predicts correctly that this well was unsuccessful.
Figure 5. For line 5001P1009 (Figure 1b), sections of hydrocarbon saturation obtained from a joint
interpretation of CSEM, seismic and well-log data, with hydrocarbon saturation curves overlaid. Notice
that the seismic data alone cannot distinguish between commercial and non-commercial (residual)
hydrocarbon saturation. The inclusion of the CSEM resistivity information within the inversion approach
allows for the separation of these two possible scenarios.
Conclusions
This case study shows successful inversion of the seismic and CSEM derived properties within a rock
physics framework. The well and seismic data were integrated to produce a litho-fluid facies volume
identifying areas of clean oil or fizz gas sand; however, the seismic data cannot distinguish between
commercial and non-commercial hydrocarbon saturation. The inclusion of the CSEM resistivity
information allows for the separation of these two possible scenarios resulting in an excellent correlation
with known well results.
Acknowledgments
RSI would like to thank PGS for providing the 2D GeoStreamer® and Towed Streamer EM data used in
this study. The authors thank their colleagues at RSI for many useful discussions. The CSEM inversion
was undertaken using MARE2DEM, developed by Kerry Key at the Scripps Institution of Oceanography.
Reference
Alvarez, P., F. Bolivar, M. Di Luca, and T. Salinas, [2015]. Multi-attribute rotation scheme: A tool for
reservoir property prediction from seismic inversion attributes, Interpretation, 3, SAE9-SAE18
Constable, S., R. Parker, and C. Constable, [1987]. Occam's inversion: A practical algorithm for
generating smooth models from electromagnetic sounding data. Geophysics 52, 289-300.
Englemark, F., J. Mattsson, A. McKay, and Z. Du, [2014]. Towed streamer EM comes of age, First Break,
32, 75-78.
Key, K., Z. Du, J. Mattsson, A. McKay, and J. Midgley, [2014], Anisotropic 2.5 D inversion of Towed
Streamer EM data from three North Sea fields using parallel adaptive finite elements. In 76th EAGE
Conference and Exhibition.