Discrete Probability Distributions (Random Variables and Discrete Probability Distributions)
Upload
claud-millerCategory
view
268download
2
Discrete Probability Discrete Probability DistributionsDistributions
Chapter6666
Discrete Distributions Uniform Distribution Bernoulli Distribution Binomial Distribution Poisson Distribution
Copyright © 2010 by The McGraw-Hill Companies, Inc. All rights reserved.
McGraw-Hill/Irwin
Discrete DistributionsDiscrete Distributions
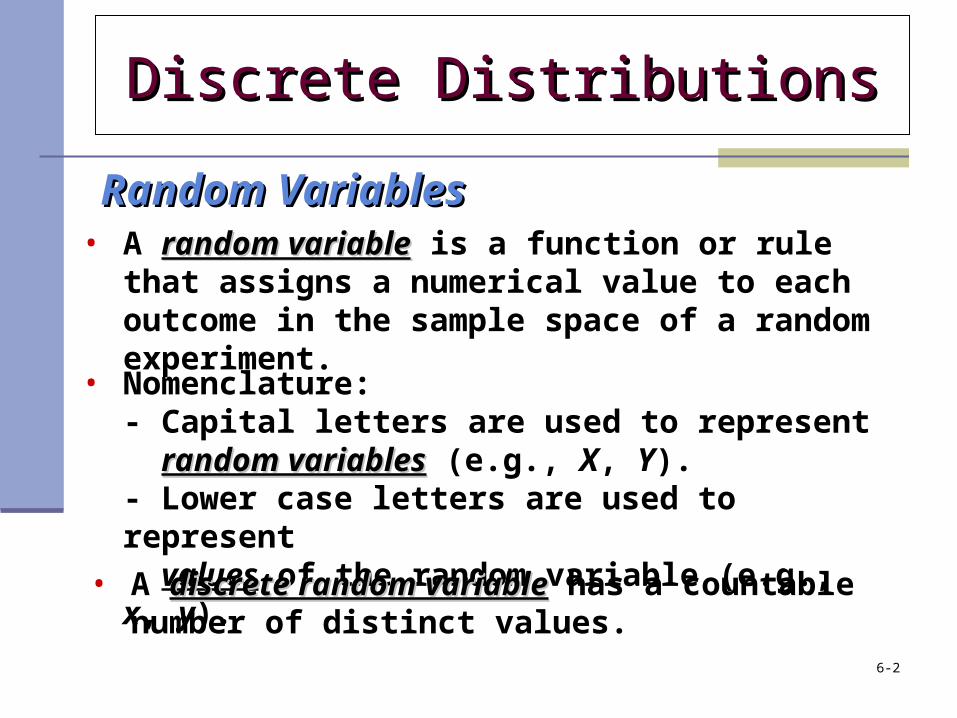
• A random variablerandom variable is a function or rule that assigns a numerical value to each outcome in the sample space of a random experiment.
Random VariablesRandom Variables
• Nomenclature:- Capital letters are used to represent random variablesrandom variables (e.g., X, Y).- Lower case letters are used to represent values of the random variable (e.g., x, y).
• A discrete random variablediscrete random variable has a countable number of distinct values.
6-2
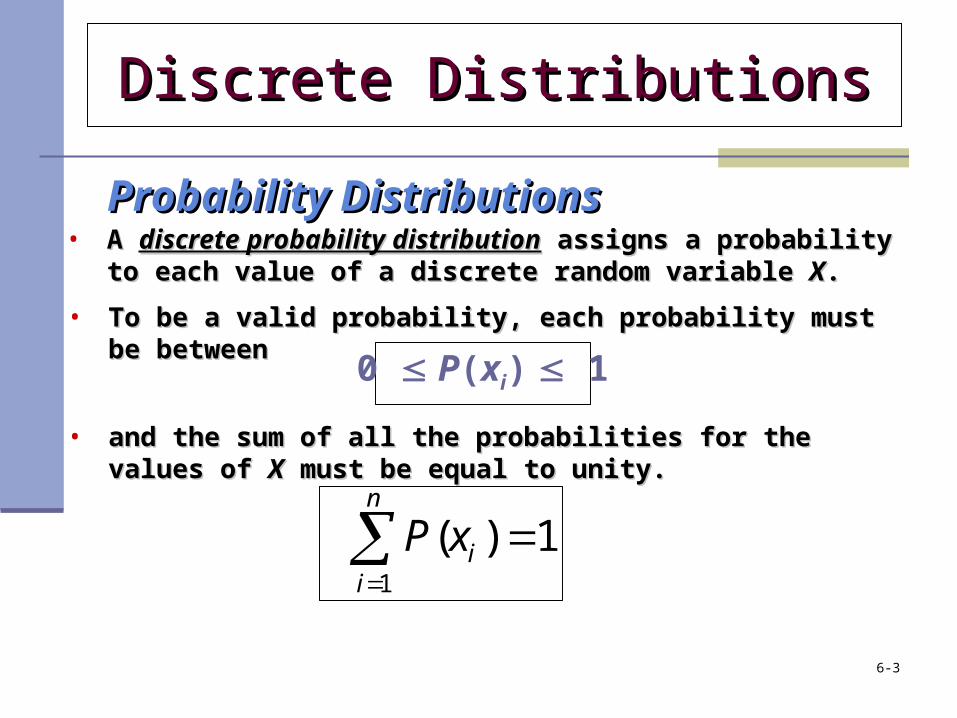
Probability DistributionsProbability Distributions• A A discrete probability distributiondiscrete probability distribution assigns a probability to each assigns a probability to each
value of a discrete random variable value of a discrete random variable XX..
• To be a valid probability, each probability must be betweenTo be a valid probability, each probability must be between
0 P(xi) 1
• and the sum of all the probabilities for the values of and the sum of all the probabilities for the values of XX must be must be equal to unity. equal to unity.
1
( ) 1n
ii
P x
Discrete DistributionsDiscrete Distributions
6-3
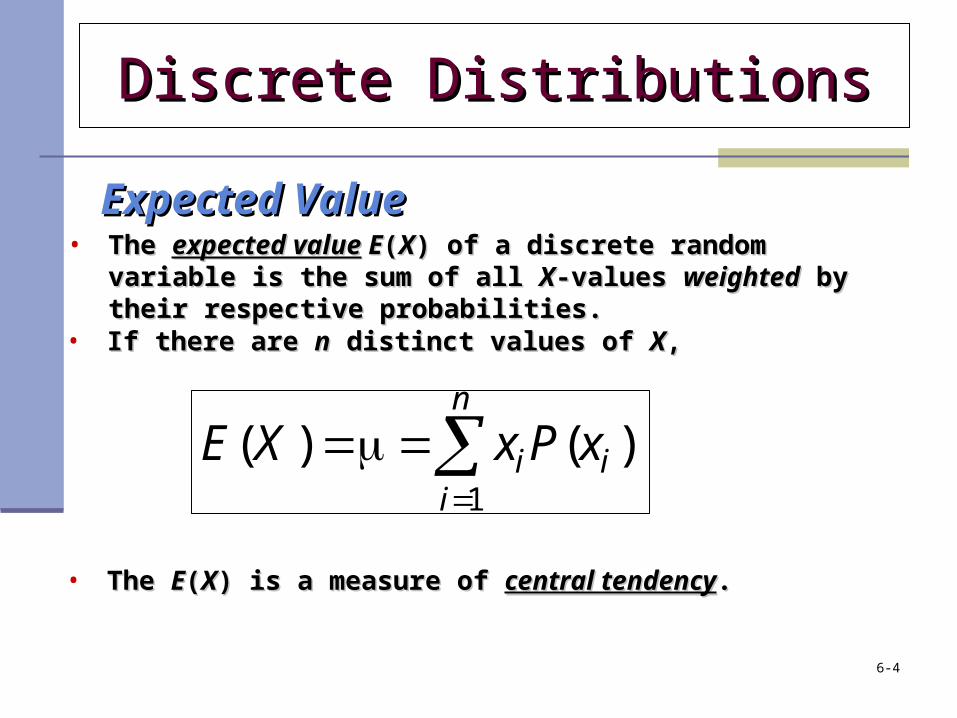
• The The expected valueexpected value E E((XX) of a discrete random variable is the ) of a discrete random variable is the sum of all sum of all XX-values -values weightedweighted by their respective probabilities. by their respective probabilities.
• The The EE((XX) is a measure of ) is a measure of central tendencycentral tendency..
• If there are If there are nn distinct values of distinct values of XX, ,
1
( ) ( )n
i ii
E X x P x
Discrete DistributionsDiscrete Distributions
Expected ValueExpected Value
6-4
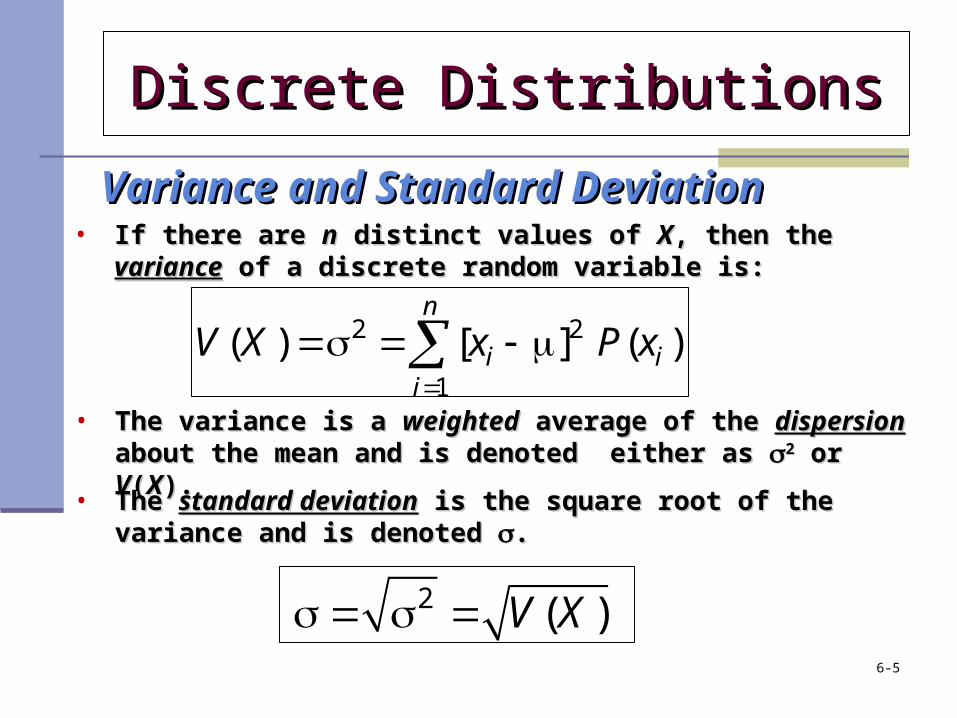
• If there are If there are nn distinct values of distinct values of XX, then the , then the variancevariance of a of a discrete random variable is:discrete random variable is:
• The variance is a The variance is a weightedweighted average of the average of the dispersiondispersion about the about the mean and is denoted either as mean and is denoted either as 22 or or VV((XX).).
2 2
1
( ) [ ] ( )n
i ii
V X x P x
• The The standard deviationstandard deviation is the square root of the variance and is the square root of the variance and is denoted is denoted ..
2 ( )V X
Discrete DistributionsDiscrete Distributions
Variance and Standard DeviationVariance and Standard Deviation
6-5
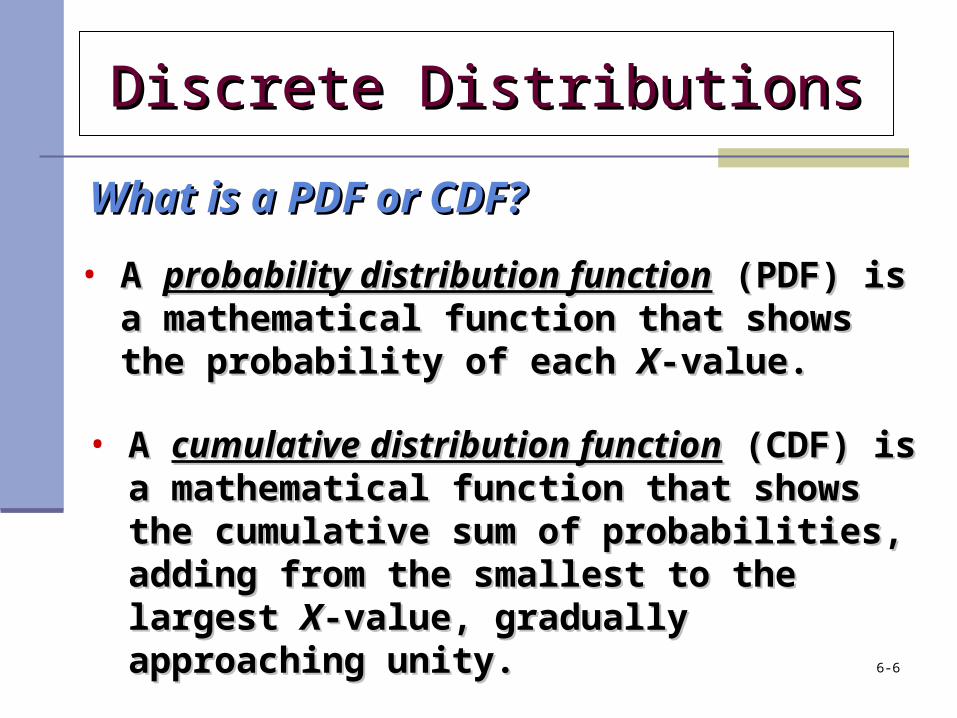
• A A probability distribution functionprobability distribution function (PDF) is a (PDF) is a mathematical function that shows the mathematical function that shows the probability of each probability of each XX-value.-value.
• A A cumulative distribution functioncumulative distribution function (CDF) is a (CDF) is a mathematical function that shows the mathematical function that shows the cumulative sum of probabilities, adding from cumulative sum of probabilities, adding from the smallest to the largest the smallest to the largest XX-value, gradually -value, gradually approaching unity.approaching unity.
Discrete DistributionsDiscrete Distributions
What is a PDF or CDF?What is a PDF or CDF?
6-6
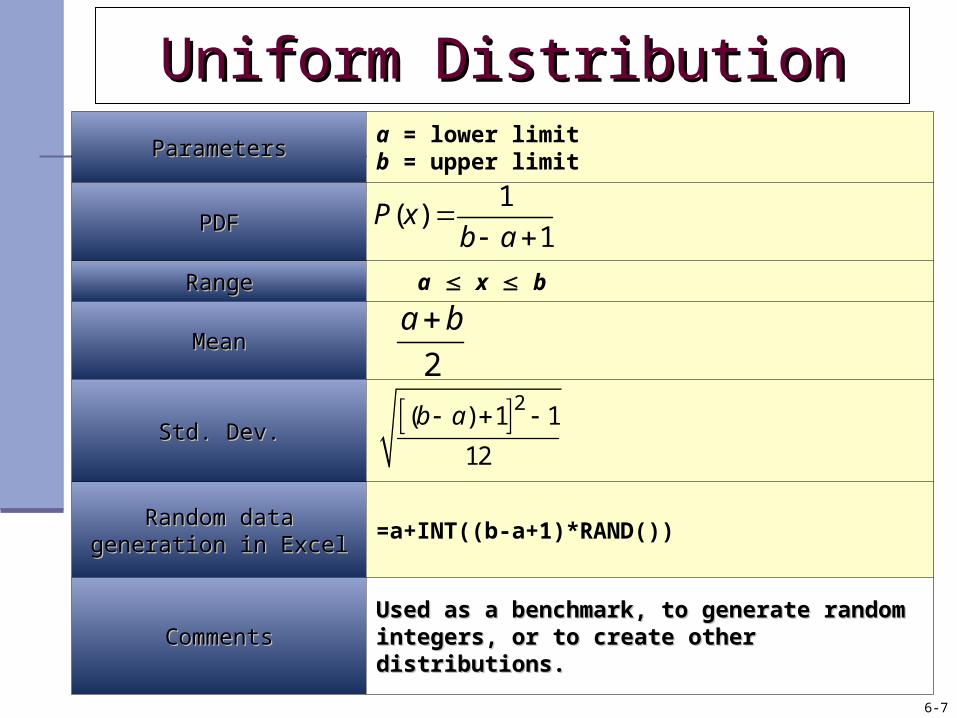
ParametersParametersa = lower limitb = upper limit
PDFPDF
RangeRange a x b
MeanMean
Std. Dev.Std. Dev.
Random data generation in Random data generation in ExcelExcel
=a+INT((b-a+1)*RAND())
CommentsCommentsUsed as a benchmark, to generate random Used as a benchmark, to generate random integers, or to create other distributions.integers, or to create other distributions.
2( ) 1 1
12
b a
1( )
1P x
b a
2
a b
Uniform DistributionUniform Distribution
6- 6-7
Copyright © 2010 by The McGraw-Hill Companies, Inc. All rights reserved.
6-8
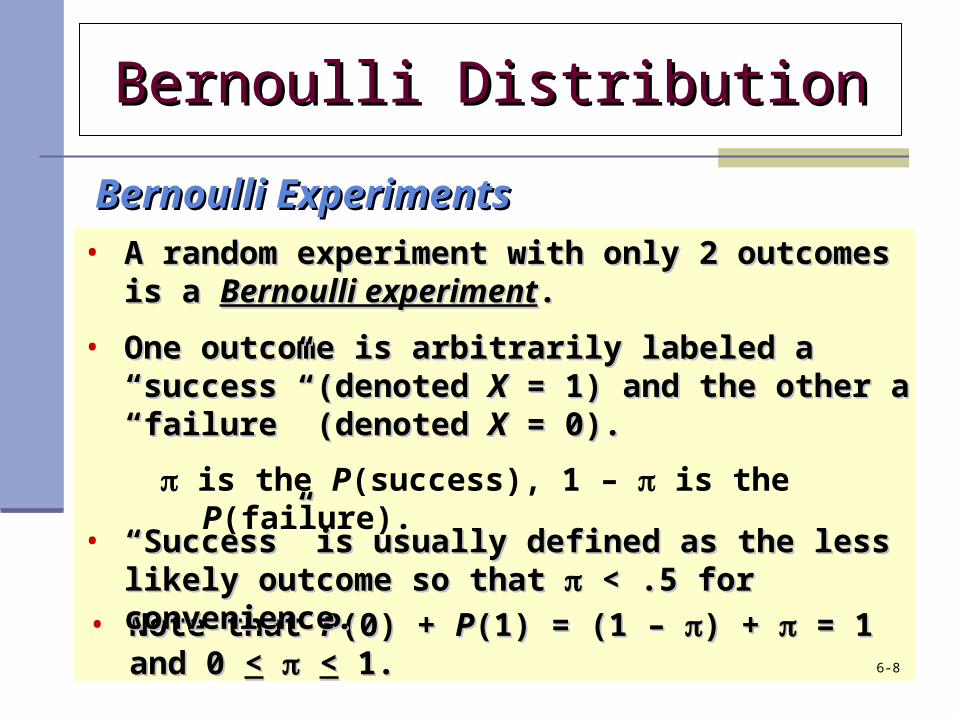
• A random experiment with only 2 outcomes is a A random experiment with only 2 outcomes is a Bernoulli experimentBernoulli experiment..
• One outcome is arbitrarily labeled a One outcome is arbitrarily labeled a “success” (denoted “success” (denoted XX = 1) and the other a “failure” = 1) and the other a “failure” (denoted (denoted XX = 0). = 0).
is the P(success), 1 – is the P(failure).
• Note that Note that PP(0) + (0) + PP(1) = (1 – (1) = (1 – ) + ) + = 1 and 0 = 1 and 0 << << 1. 1.
• ““Success” is usually defined as the less likely Success” is usually defined as the less likely outcome so that outcome so that < .5 for convenience. < .5 for convenience.
Bernoulli ExperimentsBernoulli Experiments
Bernoulli DistributionBernoulli Distribution
6-8
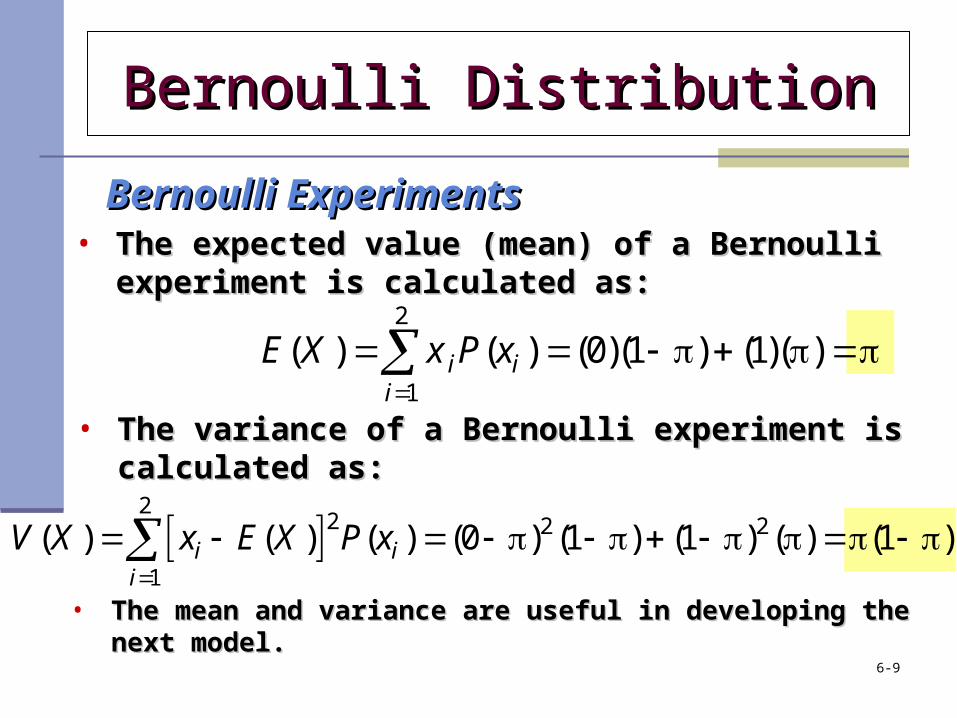
2
2 2 2
1
( ) ( ) ( ) (0 ) (1 ) (1 ) ( ) (1 )i ii
V X x E X P x
• The expected value (mean) of a Bernoulli experiment The expected value (mean) of a Bernoulli experiment is calculated as:is calculated as:
2
1
( ) ( ) (0)(1 ) (1)( )i ii
E X x P x
• The variance of a Bernoulli experiment is calculated The variance of a Bernoulli experiment is calculated
as:as:
• The mean and variance are useful in developing the next model.The mean and variance are useful in developing the next model.
Bernoulli DistributionBernoulli Distribution
Bernoulli ExperimentsBernoulli Experiments
6-9
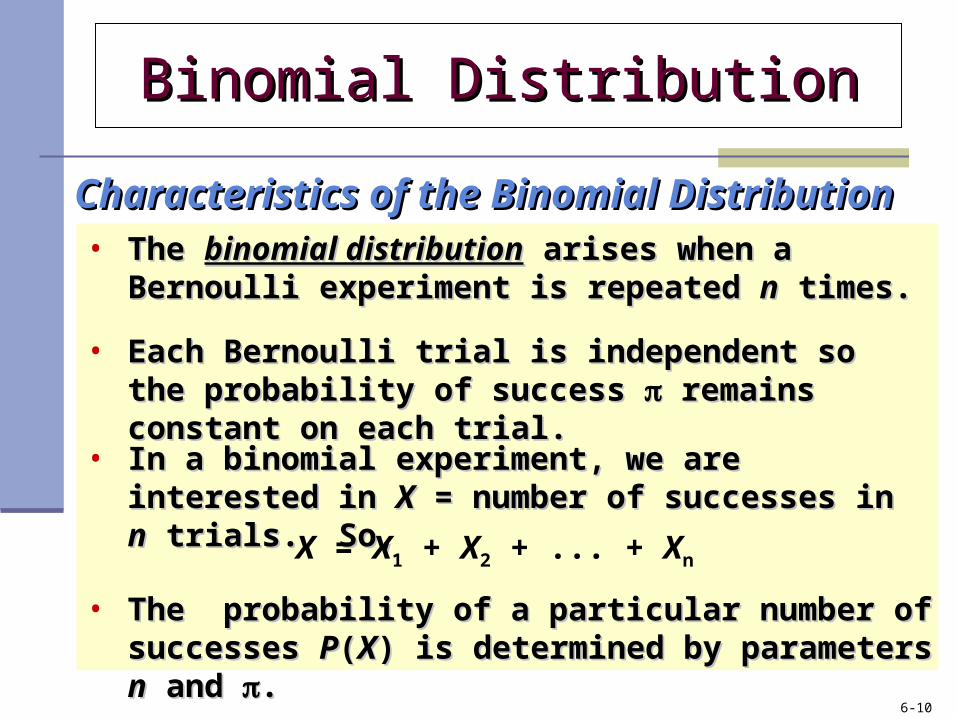
• The The binomial distributionbinomial distribution arises when a Bernoulli arises when a Bernoulli experiment is repeated experiment is repeated nn times. times.
• Each Bernoulli trial is independent so the probability Each Bernoulli trial is independent so the probability of success of success remains constant on each trial. remains constant on each trial.
• In a binomial experiment, we are interested in In a binomial experiment, we are interested in XX = = number of successes in number of successes in nn trials. So, trials. So,
X = X1 + X2 + ... + Xn
• The probability of a particular number of successes The probability of a particular number of successes PP((XX) is determined by parameters ) is determined by parameters nn and and ..
Binomial DistributionBinomial Distribution
Characteristics of the Binomial DistributionCharacteristics of the Binomial Distribution
6-10
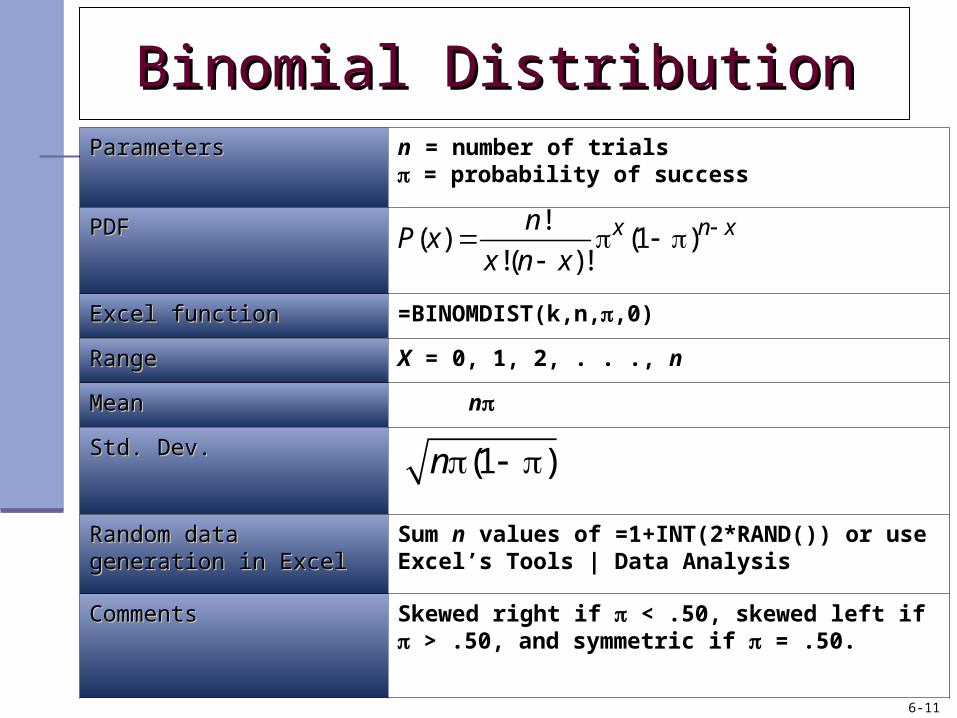
ParametersParameters n = number of trials = probability of success
PDFPDF
Excel functionExcel function =BINOMDIST(k,n,,0)
RangeRange X = 0, 1, 2, . . ., n
MeanMean n
Std. Dev.Std. Dev.
Random data generation in Random data generation in ExcelExcel
Sum n values of =1+INT(2*RAND()) or use Excel’s Tools | Data Analysis
CommentsComments Skewed right if < .50, skewed left if > .50, and symmetric if = .50.
!( ) (1 )
!( )!x n xn
P xx n x
(1 )n
Binomial DistributionBinomial Distribution
6-11 6-11
• The The Poisson distributionPoisson distribution was named for was named for French mathematician SimFrench mathematician Siméon Poisson (1781-éon Poisson (1781-1840).1840).
• The Poisson distribution describes the The Poisson distribution describes the number of occurrences within a randomly number of occurrences within a randomly chosen unit of time or space.chosen unit of time or space.
• For example, within a minute, hour, For example, within a minute, hour, day, square foot, or linear mile.day, square foot, or linear mile.
Poisson DistributionPoisson Distribution
Poisson ProcessesPoisson Processes
6-12
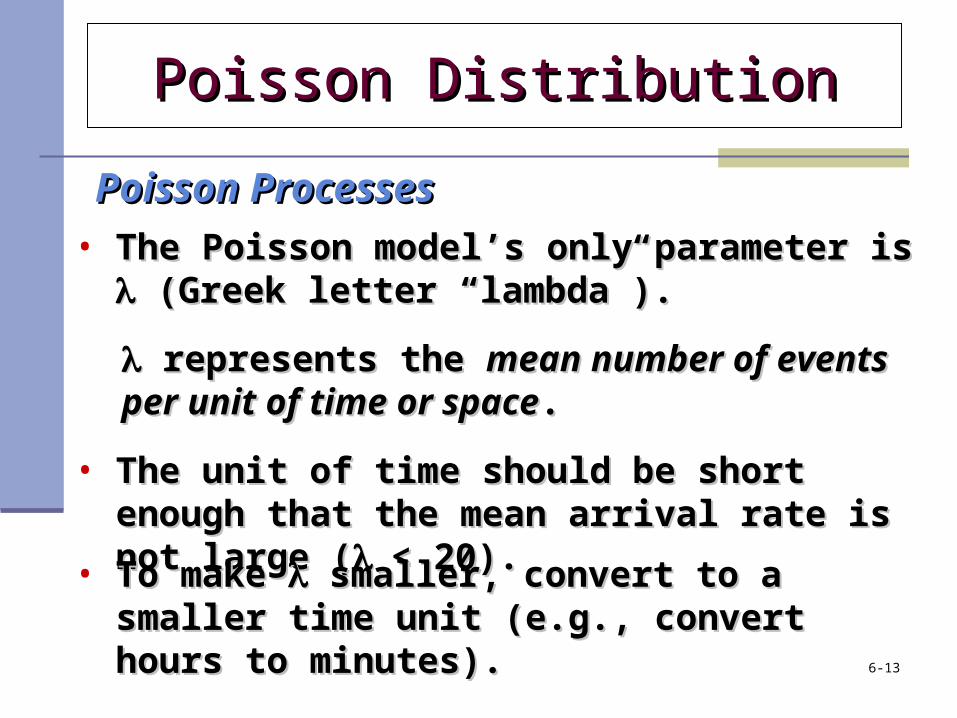
represents the represents the mean number of events per mean number of events per unit of time or spaceunit of time or space..
• The unit of time should be short enough that The unit of time should be short enough that the mean arrival rate is not large (the mean arrival rate is not large (< 20).< 20).
• To make To make smaller, convert to a smaller time smaller, convert to a smaller time unit (e.g., convert hours to minutes).unit (e.g., convert hours to minutes).
• The Poisson model’s only parameter is The Poisson model’s only parameter is (Greek letter “lambda”).(Greek letter “lambda”).
Poisson DistributionPoisson Distribution
Poisson ProcessesPoisson Processes
6-13
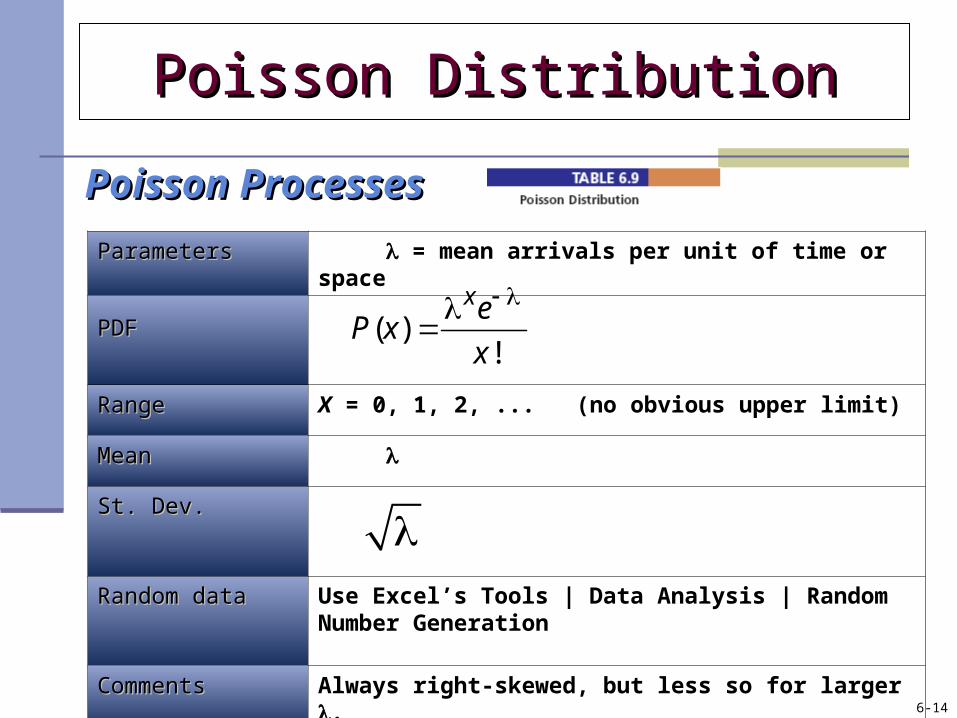
ParametersParameters = mean arrivals per unit of time or space
PDFPDF
RangeRange X = 0, 1, 2, ... (no obvious upper limit)
MeanMean
St. Dev. St. Dev.
Random dataRandom data Use Excel’s Tools | Data Analysis | Random Number Generation
CommentsComments Always right-skewed, but less so for larger .
( )!
xeP x
x
Poisson DistributionPoisson Distribution
Poisson ProcessesPoisson Processes
6-14