Discrete intrinsic localized modes in a microelectromechanical ...
70
Discrete intrinsic localized modes in a microelectromechanical resonator Authors: Adarsh Ganesan, Cuong Do and Ashwin A. Seshia Intrinsic Localized Modes (ILMs) or Discrete Breathers (DBs) are produced through a non-linear vibration localization phenomenon. While Anderson localization is due to lattice defects, the nonlinearity of lattices provides the basis for ILM excitation. Over the past two decades, these ILMs have been realized in a wide range of physical systems including photonic crystals, nonlinear atomic lattices, anti-ferromagnets, coupled Josephson junction arrays and coupled cantilevers. This paper brings out the feasibility of exciting ILMs in a standalone mechanical resonator. Through piezoelectric driving and optical visualization, various intriguing features of ILMs have been recorded. The ILMs in our system are observed as spectral bushes and their frequencies are much lower than that of the drive frequency. The excitation of ILMs is mediated through large amplitude instability following autoparametric excitation of a sub-harmonic mode. The spatial prevalence of discrete ILM excitations is at antinodes of the sub-harmonic mode. Further, the ILMs have been observed to be time-variant and various events including attraction-repulsion (or splitting-merging) of ILMs and hopping occur during the time evolution of ILMs. Intrinsic localized modes (ILM) or Discrete Breathers (DBs) have been a subject of interest for the last two decades ever since the pioneering generalization by Takeno and co-workers [1-3]. Such nonlinear vibration energy localization phenomenon has had much impact in condensed matter physics [4-6] and led to the understanding and control of physical processes [7-10] involving high density vibration energy. The key features concerning ILMs are nonlinearity [1-3] and discreteness [11-12]. Also, these ILMs are not externally imposed as in the case of Anderson localization [13-14] rather due to intrinsic nonlinearity. More recently, the presence of ILMs in a wide range of physical systems including photonic crystals [15], nonlinear atomic lattices [16], anti-ferromagnets [17] and coupled Josephson junction arrays [18] has been demonstrated. Particularly, in the mechanical domain, ILMs have been experimentally realized through the elastic coupling of cantilevers [19]. Regardless of these empirical evidences for the existence of ILMs in various physical systems, ILMs have largely been a subject of ‘theoretical’ physics. This can be attributed to the lack of experimental techniques for the controlled probing of both the nonlinearity and discreteness of ILMs. This paper brings out the feasibility of exciting travelling ILMs in a standalone microelectromechanical resonator. Using the combination of Laser Doppler Vibrometry (LDV) and piezoelectric driving, we observed the two-dimensional transport of ILMs on mechanical structure
Transcript of Discrete intrinsic localized modes in a microelectromechanical ...
Discrete intrinsic localized modes in a microelectromechanical resonator
Authors: Adarsh Ganesan, Cuong Do and Ashwin A. Seshia
Intrinsic Localized Modes (ILMs) or Discrete Breathers (DBs) are produced through a non-linear
vibration localization phenomenon. While Anderson localization is due to lattice defects, the
nonlinearity of lattices provides the basis for ILM excitation. Over the past two decades, these
ILMs have been realized in a wide range of physical systems including photonic crystals, nonlinear
atomic lattices, anti-ferromagnets, coupled Josephson junction arrays and coupled cantilevers.
This paper brings out the feasibility of exciting ILMs in a standalone mechanical resonator.
Through piezoelectric driving and optical visualization, various intriguing features of ILMs have
been recorded. The ILMs in our system are observed as spectral bushes and their frequencies are
much lower than that of the drive frequency. The excitation of ILMs is mediated through large
amplitude instability following autoparametric excitation of a sub-harmonic mode. The spatial
prevalence of discrete ILM excitations is at antinodes of the sub-harmonic mode. Further, the ILMs
have been observed to be time-variant and various events including attraction-repulsion (or
splitting-merging) of ILMs and hopping occur during the time evolution of ILMs.
Intrinsic localized modes (ILM) or Discrete Breathers (DBs) have been a subject of interest for the last
two decades ever since the pioneering generalization by Takeno and co-workers [1-3]. Such
nonlinear vibration energy localization phenomenon has had much impact in condensed matter
physics [4-6] and led to the understanding and control of physical processes [7-10] involving high
density vibration energy. The key features concerning ILMs are nonlinearity [1-3] and discreteness
[11-12]. Also, these ILMs are not externally imposed as in the case of Anderson localization [13-14]
rather due to intrinsic nonlinearity. More recently, the presence of ILMs in a wide range of physical
systems including photonic crystals [15], nonlinear atomic lattices [16], anti-ferromagnets [17] and
coupled Josephson junction arrays [18] has been demonstrated. Particularly, in the mechanical
domain, ILMs have been experimentally realized through the elastic coupling of cantilevers [19].
Regardless of these empirical evidences for the existence of ILMs in various physical systems, ILMs
have largely been a subject of ‘theoretical’ physics. This can be attributed to the lack of experimental
techniques for the controlled probing of both the nonlinearity and discreteness of ILMs.
This paper brings out the feasibility of exciting travelling ILMs in a standalone
microelectromechanical resonator. Using the combination of Laser Doppler Vibrometry (LDV) and
piezoelectric driving, we observed the two-dimensional transport of ILMs on mechanical structure

and many interesting features of ILMs are recorded. This seemingly simple device (and other similar
devices) can therefore form an experimental testbed for the future experimental investigations of
ILMs. Such devices can be fabricated using conventional semiconductor micromachining techniques.
Also, the complementary visualization of ILM transport within a single resonator element at
microscopic resolution can lead to intriguing and surprising concepts concerning the behaviour of
ILMs. The concept concerning the ILM excitation in a micromechanical resonator is presented next.
Theory- Our single mechanical resonator can be modelled as a nonlinear lattice. The equations of
motion of each element in the resonator can then be written as [2],
�̈�𝑛 + 𝑄−1�̇�𝑛 + [1 − 𝐻𝑐𝑜𝑠(𝜔𝑑𝑡)]𝑢𝑛 + 𝛼𝑢𝑛3 + �̂�𝑢𝑛
2�̇�𝑛 −1
2𝐷(𝑢𝑛+1 − 2𝑢𝑛 + 𝑢𝑛−1) = 0 (1)
where 𝑢𝑛 describes the displacement of 𝑛𝑡ℎ oscillator from the initial position with 𝑛 = 0,1,2, … , 𝑁
and fixed boundary conditions 𝑢0 = 𝑢𝑁+1 = 0; 𝑄 is the quality factor of mechanical resonance; 𝐻
represents the parametric excitation threshold; 𝜔𝑑 is the drive frequency; 𝛼 captures the cubic
nonlinearity of individual oscillators and �̂� is the nonlinear damping coefficient; 𝐷 describes the
coupling between oscillators. Under weak random noise, the dynamics presented in eq. (1) have
been solved in [20] and found to result in spatio-temporally evolving ILM excitation.
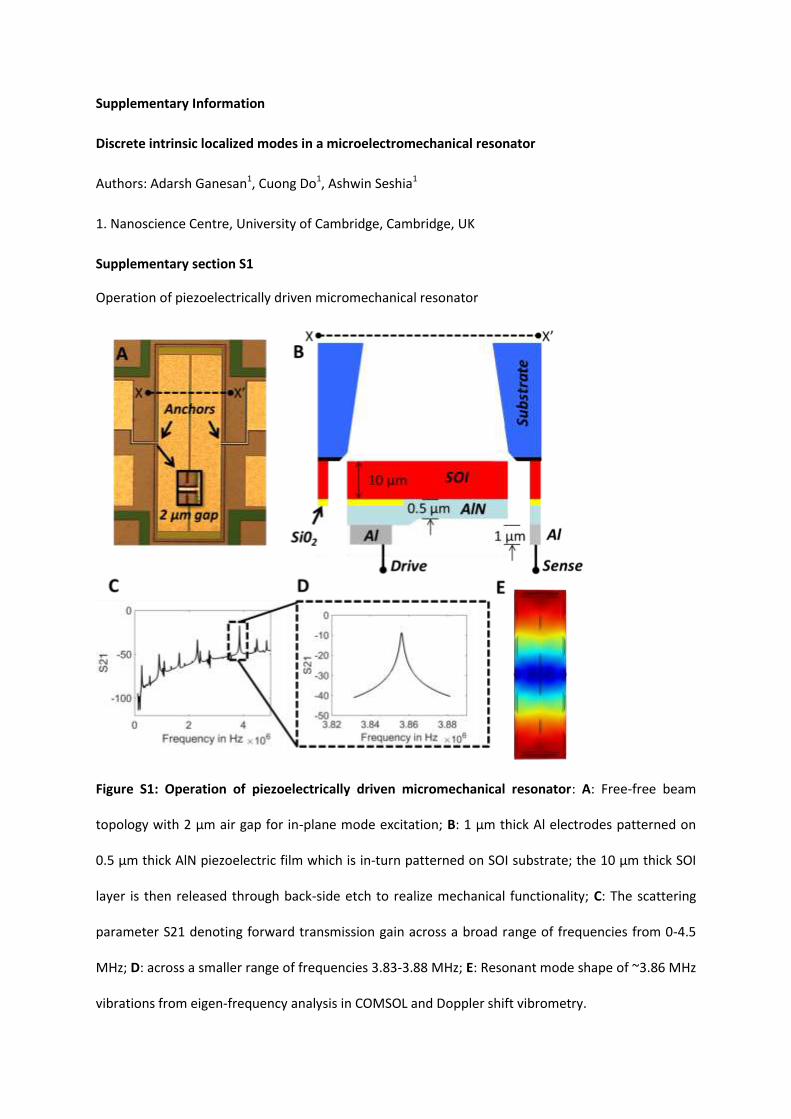
For the experimental realization of ILMs, a 1-D extensional-compressional mechanical mode (Figure
S1) (eigen-frequency 3.86 𝑀𝐻𝑧) of free-free beam structure of dimensions 1100 µ𝑚 × 350 µ𝑚 ×
11 µ𝑚 (Figure 1A) is considered. A 0.5 µ𝑚 thick AlN layer is harnessed for the piezoelectric
excitation of the structure (Figure S1). An electrical signal for driving the mechanical mode is fed
through one of the split electrodes. Through optical visualization using LDV, an insightful
assessment of ILM behaviour can be carried out. Due to the capture area limitation with our
vibrometry setup, only one half of the device is imaged. The measurements are carried out at a
spatial resolution of 35 µ𝑚 and 125 𝐻𝑧 spectral resolution which leads to a reasonable temporal
resolution of 1 minute. Higher temporal resolution can be reached by compromising the spatial or
spectral resolution to probe fast moving ILMs.
At the drive power level 0 𝑑𝐵𝑚, the frequency spectrum consists of just the drive tone. In contrast,
at 10 𝑑𝐵𝑚, the excitation of low frequency ILMs and the sub-harmonic mode is also observed along
with the drive tone (Figure 1B). The sub-harmonic mode is auto-parametrically excited through
coupling to the drive mode. Also, during this process, an apparent increase in the background noise
floor is observed in the frequency spectrum. This observation of an elevated noise floor (Figure 1B) is
qualitatively linked to the observation of ILM excitation. Figure 1C shows elevated displacement
amplitudes at frequencies 𝜔𝑖 (ILM) and 𝜔𝑑/2 upon crossing the drive power threshold for auto-
parametric excitation. The displacement profiles at the tones 𝜔𝑑 and 𝜔𝑑/2 are shown in figure 1D.
Figure 1D also provides evidence for hysteresis observed in the displacement response of the sub-
harmonic mode. Despite this, ILM displacements of forward and backward amplitude sweep are
almost equal. This may be due to either reduced displacement of sub-harmonic and driven modes or
a stochastic ILM destruction process. The RMS displacement profile (Figure 1E), in the spectral range
35 − 75 𝑘𝐻𝑧, indicate the presence of ILMs at a discrete point. The weighted distribution of all
spectral lines corresponding to ILM excitation in the range 35 − 75 𝑘𝐻𝑧 indicates the presence of
two spectral bushes. The dominant and weak spectral bushes are observed in the frequency ranges
50 − 70 𝑘𝐻𝑧 and 40 − 50 𝑘𝐻𝑧 respectively.
It is also to note that the spatial average frequency spectrum (Figure 2A) at the drive power level
presents an ensemble of three sub-processes: auto-parametric excitation of sub-harmonic mode
(Figure 2a1); excitation of low frequency ILMs (Figures 2a2 and 2a3) and the individual inherent
coupling of ILMs with sub-harmonic (Figure 2a4) and driven modes (Figure 2a5). The coupling results
in the splitting of sub-harmonic and driven modes at the location of ILM excitation (Figure 2a2) and
the resultant spectral lines are spaced away by twice the frequency of ILMs (Figures 2a4 and 2a5).
Due to sub-harmonic excitation, the overall vibration mode shape is a merger of sub-harmonic and
driven mode shapes. Since the sub-harmonic excitation is significantly higher in magnitude, the
vibration mode shape simply corresponds to sub-harmonic mode shape (Figure 2b1). Hence, the
maximal displacements are associated with both the antinodes of sub-harmonic mode. The
displacement profiles corresponding to a large set of ILM experiments (Supplementary S2) indicate
the prevalence of ILM excitations at the spatial locations of maximal displacement (Figure 2b2). In
order to understand the drive frequency and amplitude dependence on ILMs and the corresponding
modulation of drive tone, frequency detuning and amplitude control measurements were taken. The
drive amplitude does not influence the shape of frequency spectrum (3.7 − 4 𝑀𝐻𝑧) and hence, also
the ILMs (Figures 2c1-2c3). The drive frequency similarly did not influence the ILMs (Figures 2c4-2c6)
observed and the additional tones 𝜔𝑑 ± 𝜔𝑖 follow the drive tone 𝜔𝑑. Although the ILM behaviour is
not drastically influenced by drive amplitude and frequency, there is some minor modulation
around 𝜔𝑑 ± 𝜔𝑖 due to ILMs (𝜔𝑖) (Figures 2c1-2c6). This can be due to the temporal changes in ILMs
during the course of experiments.
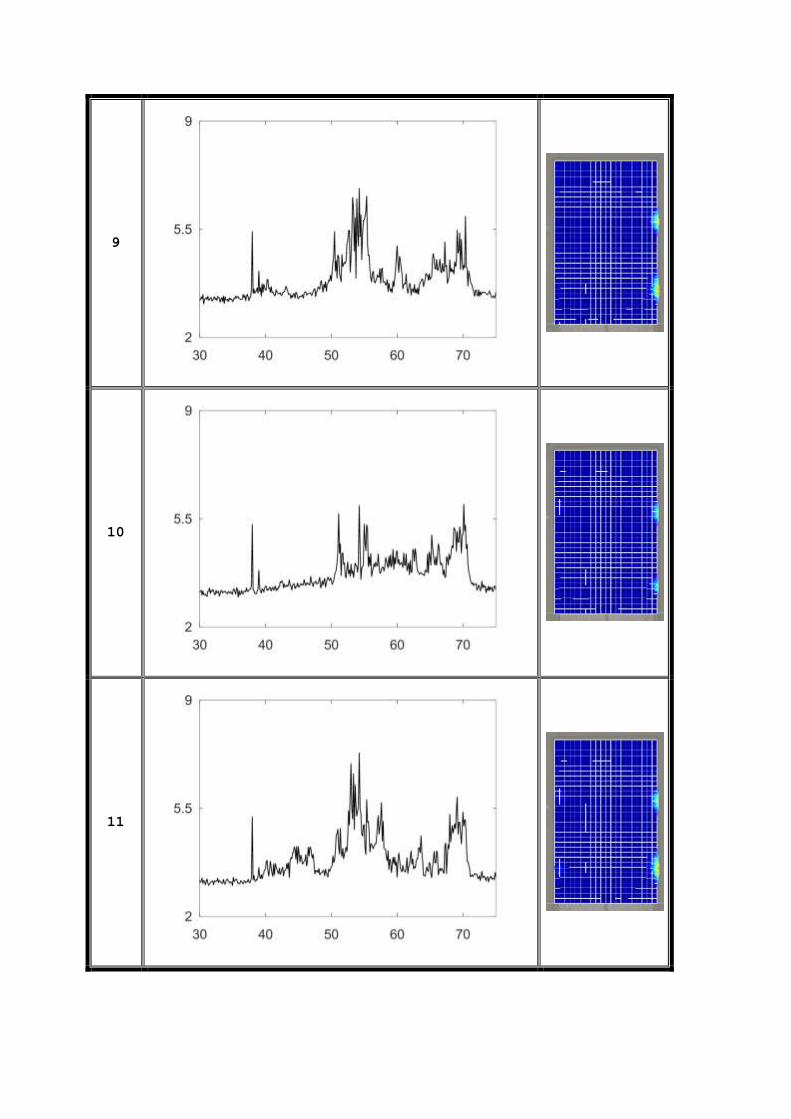
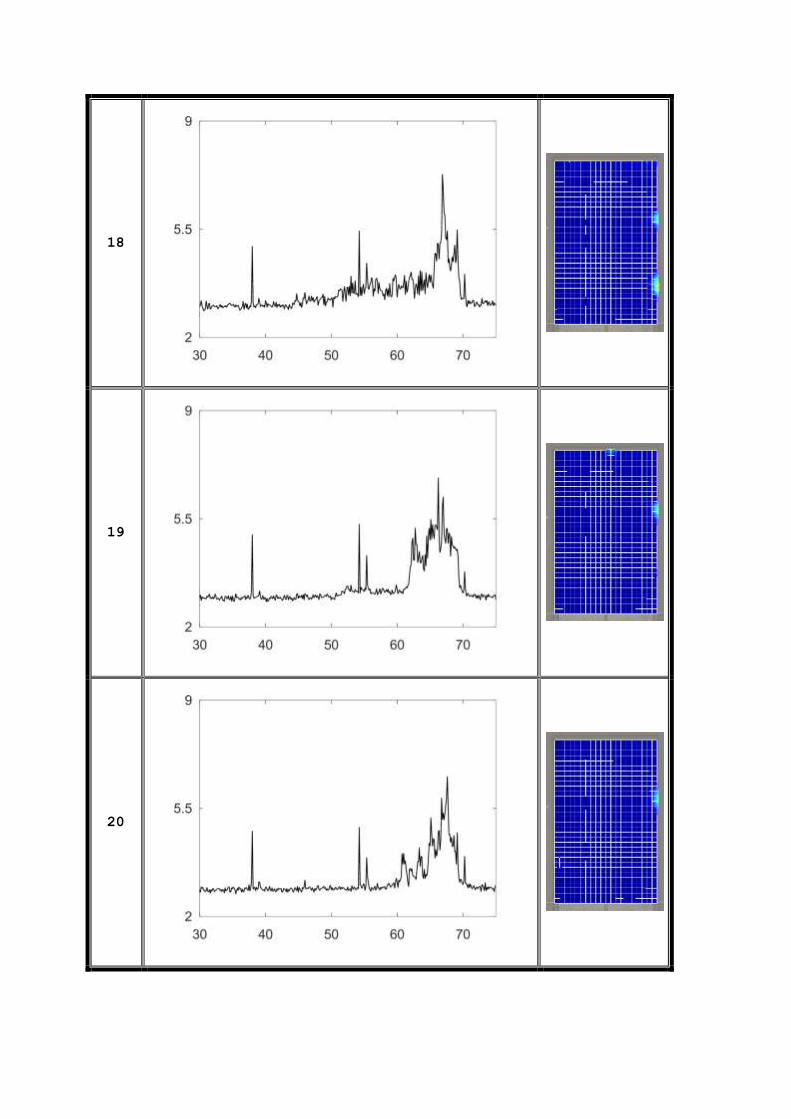
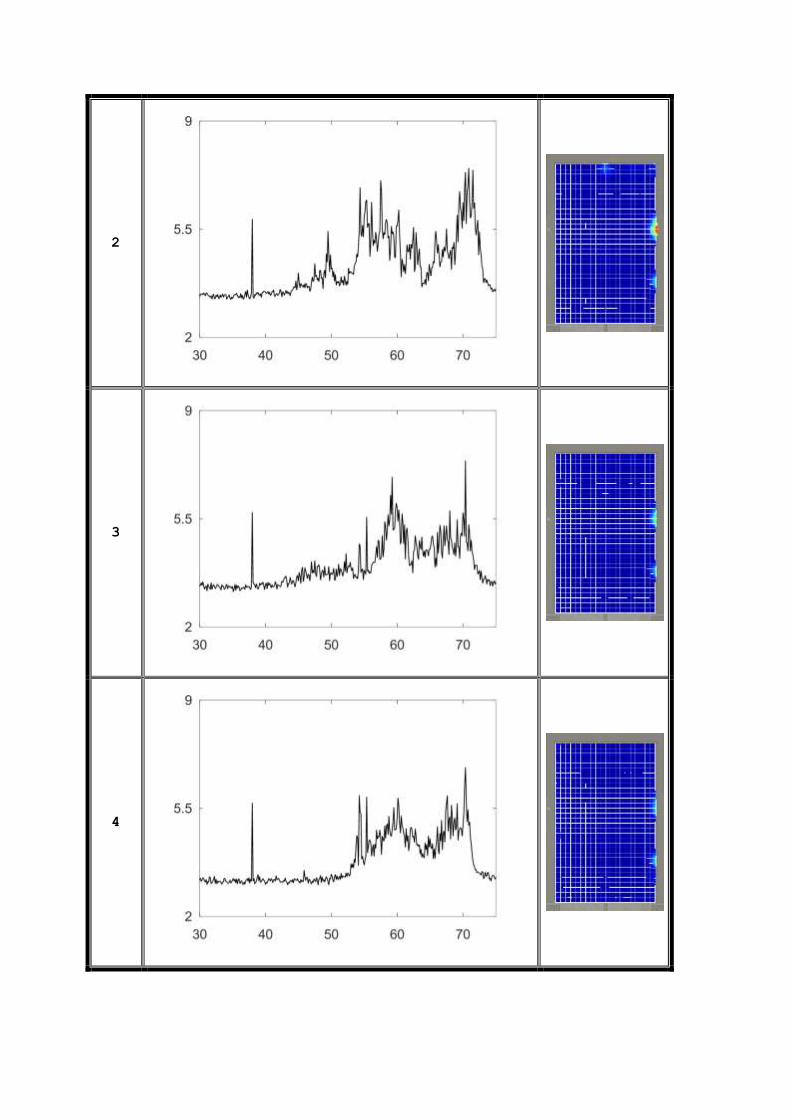
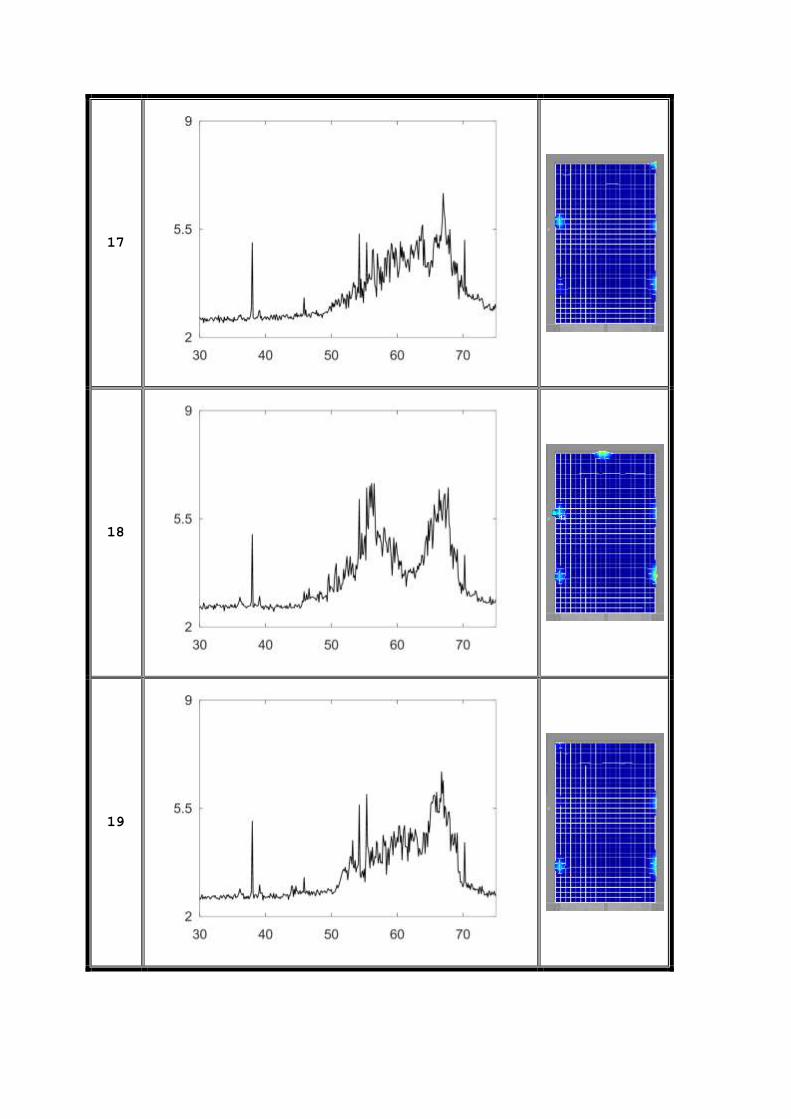
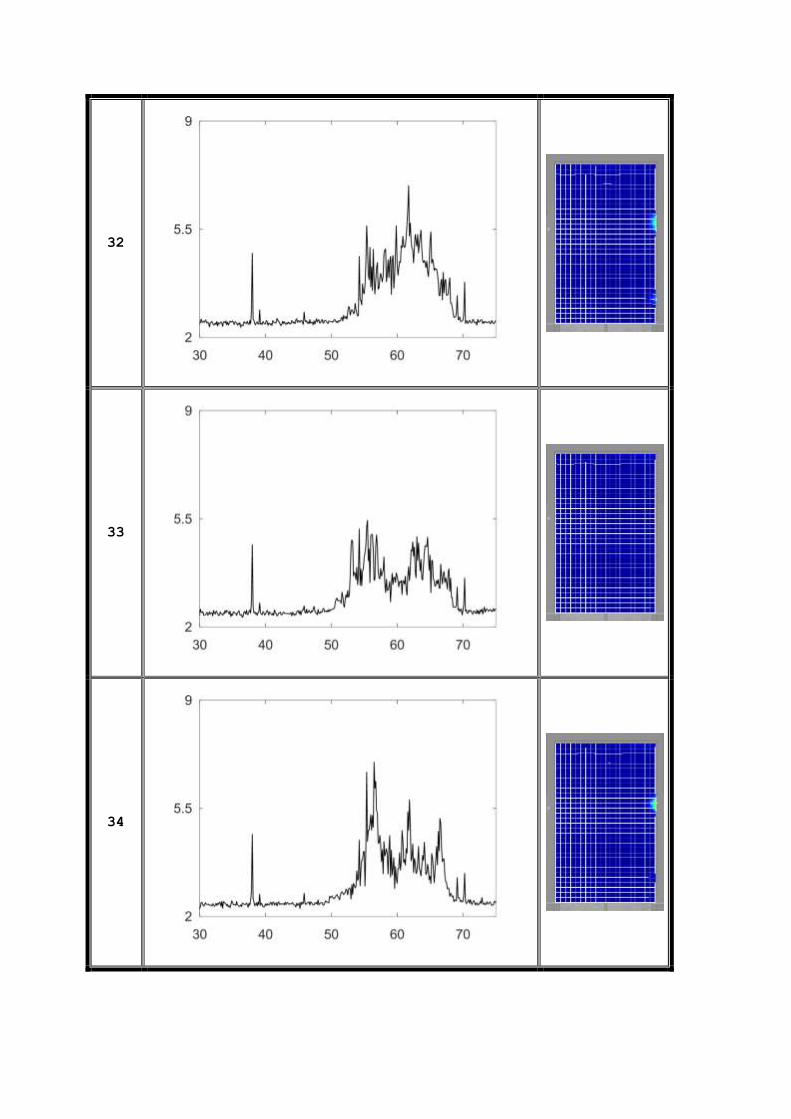
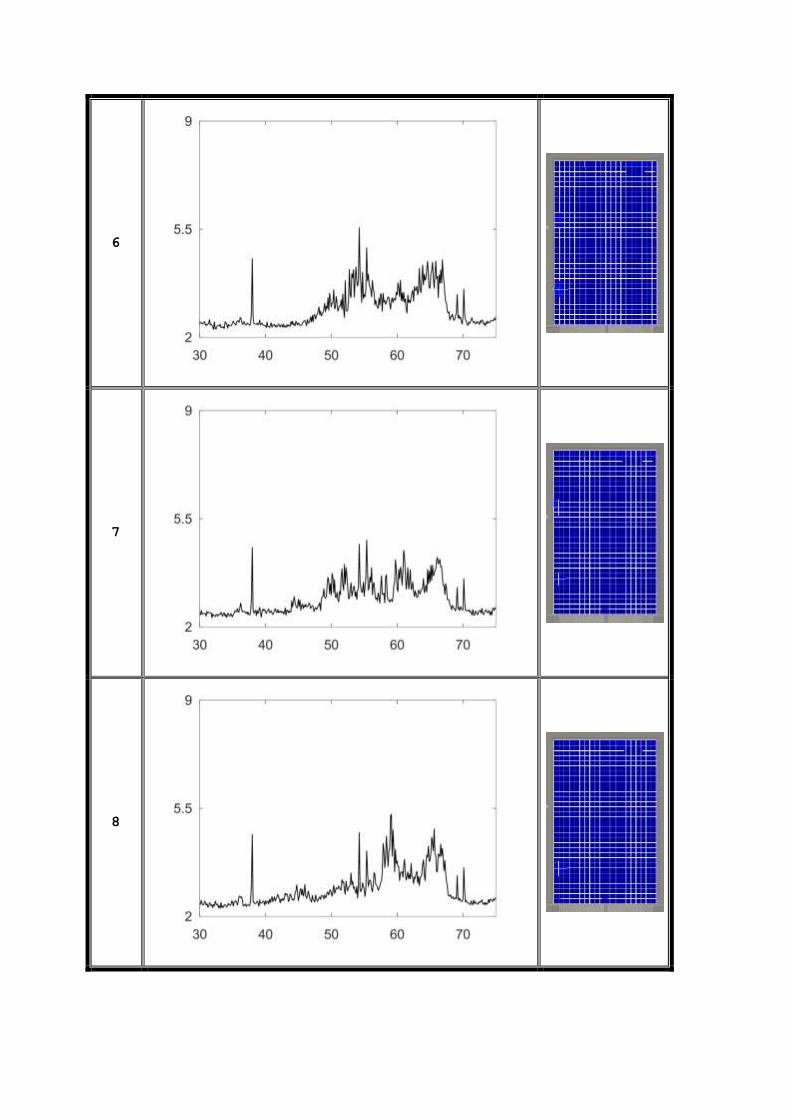
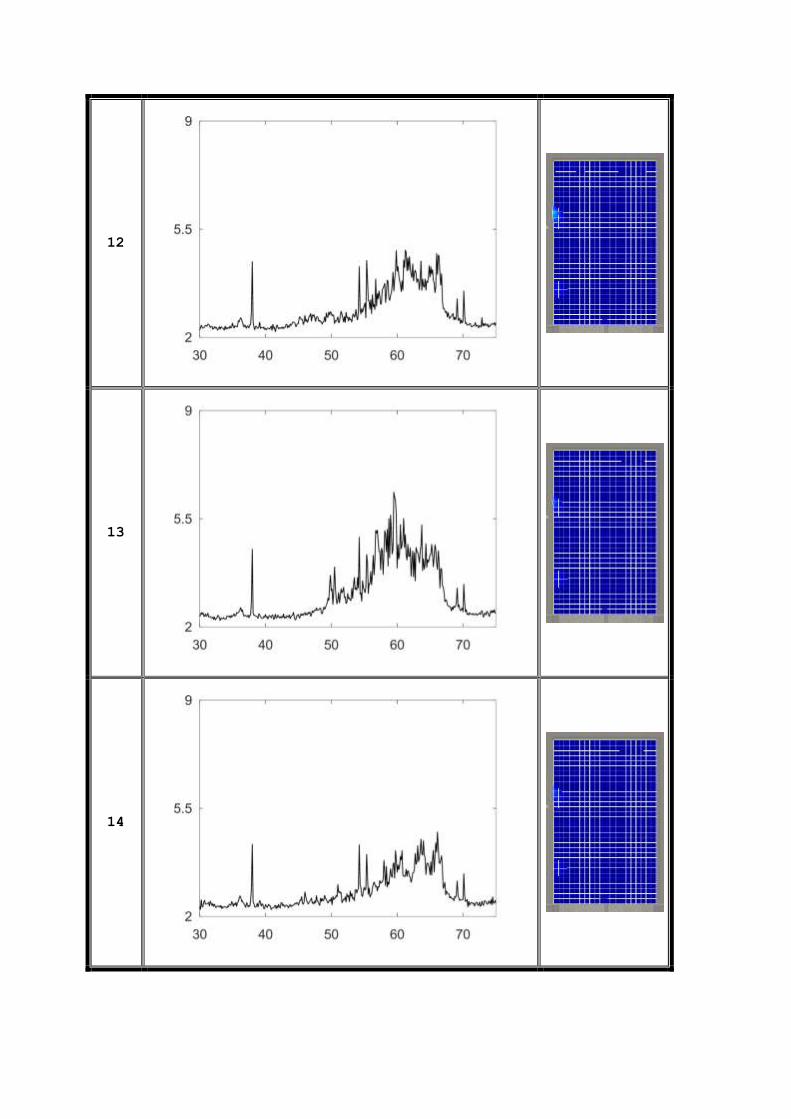
In order to validate the temporal dependence of ILMs, the displacements in the spectral range
35 − 75 𝑘𝐻𝑧 were imaged every minute for about 30-60 minutes from the time when the drive
signal is introduced. This entire process was carried out several times. (The entire set of
experimental data is provided in the supplementary material S2.) The RMS displacement patterns

(supplementary S2) provide the evidence for variations in spatial locations corresponding to ILMs.
During these measurements, a number of interesting features of ILMs were recorded and a few are
presented below.
1 – Spatial stabilization – In run 2, from 32th minute, there is an evidence for locking of ILMs at a
spatial location 𝑎1 for a long period of atleast 20 minutes (Figure 3-A).
2 – Hopping – In run 3, from 35𝑡ℎ to 37𝑡ℎ minute, the ILMs are seen to hop from points 𝑏1 and 𝑏2 to
𝑏3 respectively (Figure 3-B).
3 – Attraction-repulsion of breathers – In run 4, from 7𝑡ℎ to 9𝑡ℎ minute, the ILMs at the points 𝑐1
and 𝑐3 tend to coalesce and separate due to attraction and repulsion respectively and as a result,
the displacement at 𝑐3 increases and decreases and corresponding decrease and increase in the
displacement is observed at 𝑐4 (Figure 3-C). This behaviour may also be conceived as ‘ILM Splitting’
[20].
In summary, we have experimentally observed both the discreteness and nonlinearity of ILMs in a
micromechanical resonator. Unlike the ILMs in coupled cantilevers [19], the ILMs in our system are
observed as spectral bushes and their frequencies are much smaller than that of the drive. The
excitation of ILMs in our mechanical resonator is mediated via autoparametric excitation of a sub-
harmonic mode and the concomitant apparent increase in noise floor around the carrier. The
inherent property of noise sensitive ILM excitation, can also present a basis for in-depth
fundamental investigations and characterization of stochastic processes through ILM responses. Our
results also showcase different compulsive features of ILMs including hopping, attraction-repulsion
and single and spatial stabilization. Such features can be individual subjects for future experimental
investigations. The various physical aspects of ILMs reported in this letter also motivate the
development of a predictive first-principles model.
Acknowledgements
Funding from the Cambridge Trusts is gratefully acknowledged.
Authors’ contributions
AG and CD designed the device and performed the experiments; AG and AAS analyzed the results
and wrote the manuscript; AAS supervised the research.

References
[1] A. S. Dolgov, Sov. Phys. Solid State 28, 907 (1986)
[2] A. J. Sievers and S. Takeno, Phys. Rev. Lett. 61, 970 (1988)
[3] J. B. Page, Phys. Rev. B 41, 7835 (1990)
[4] P. M. Chaikin and T. C. Lubensky, Principles of Condensed Matter Physics (Cambridge University
Press, Cambridge, England, 1995), Chap. 10.
[5] A. M. Kosevich, B. A. Ivanov, and A. S. Kovalev, Phys. Rep. 194, 117 (1990).
[6] H.-J. Mikeska and M. Steiner, Adv. Phys. 40, 191 (1991).
[7] A. S. Davydov, Physica scripta 20, 387 (1979).
[8] A. S. Davydov, Biology and Quantum Mechanics (Pergamon, New York, 1982)
[9] H. Kellouai et al., Journal of biological physics 21, 25 (1995).
[10] Davydov’s Soliton Revisited: Self-Trapping of Vibrational Energy in Protein, edited by P. L.
Christiansen and A. C. Scott (Plenum Press, New York, 1990), Sec. IV.
[11] S. Flach, K. Kladko, and R. S. MacKay, Phys. Rev. Lett. 78, 1207 (1997)
[12] W.-Z. Wang et al., Phys. Rev. Lett. 76, 3598 (1996)
[13] E. Abrahams et al., Phys. Rev. Lett. 42, 673 (1979).
[14] J. Billy et al., Nature 453, 891 (2008).
[15] J. W. Fleischer et al., Nature 422, 147 (2003).
[16] B. I. Swanson et al., Phys. Rev. Lett. 82, 3288 (1999).
[17] M. Sato, and A. J. Sievers, Nature 432, 486 (2004).
[18] E. Trias, J. J. Mazo, and T. P. Orlando, Phys. Rev. Lett. 84, 741 (2000).
[19] M. Sato et al., Phys. Rev. Lett. 90, 044102 (2003).
[20] E. Kenig et al., Phys. Rev. E 80, 046202 (2009).

Figure 1: Observation of Intrinsic Localized Modes. A: Signal 𝑆𝑖𝑛(𝜔𝑑 = 3.86 𝑀𝐻𝑧) is applied on a
free-free beam microstructure; B: At 𝑆𝑖𝑛 = 0 𝑑𝐵𝑚, the spectral line is present at 3.86 𝑀𝐻𝑧 and at
𝑆𝑖𝑛 = 10 𝑑𝐵𝑚, additional spectral lines are observed at 𝜔𝑖, 𝜔𝑑 ± 𝜔𝑖, 𝜔𝑑
2,
𝜔𝑑
2± 𝜔𝑖; C: Displacement
levels at the frequencies 𝜔𝑖 (corresponding to the maximum displacement in the spectral range
35 − 75 𝑘𝐻𝑧) and 𝜔𝑑
2= 1.93 𝑀𝐻𝑧 for forward and backward amplitude sweep; D: Displacement
profiles at the frequencies 𝜔𝑑 = 3.86 𝑀𝐻𝑧 and 𝜔𝑑
2= 1.93 𝑀𝐻𝑧; E: Left: RMS displacement profile
(averaged over the spectral range 35 − 75 𝑘𝐻𝑧); E: Right: The spatial average frequency spectrum
over a specific one minute interval. Note: The displacement profiles are normalized to the maximum
displacement in the structure as color-coded.

Figure 2: Spatio-spectral features of Intrinsic Localized Modes. A: Spatial average spectrum (Log
scale) at the drive power level 𝑆𝑖𝑛(𝜔𝑑 = 3.86 𝑀𝐻𝑧) = 20 𝑑𝐵𝑚; a1: Spatial average spectrum
(Linear scale) indicating the significant excitation of sub-harmonic mode via auto-parametric
resonance; a2: Displacement profile of ILM at frequency 57.6 𝑘𝐻𝑧 indicating the elevated
displacement at the point 𝑥; a3-a4: Spectrum at the point 𝑥, zoomed into the frequency ranges
0 − 70 𝑘𝐻𝑧; 3.7 − 4 𝑀𝐻𝑧 and 1.85 − 2 𝑀𝐻𝑧 respectively; b1: Resultant vibration pattern
(averaged over the spectral range 0 − 5 𝑀𝐻𝑧) of the beam; b2: The RMS displacement profiles
(averaged over the spectral range 35 − 75 𝑘𝐻𝑧) at the 12𝑡ℎ , 14𝑡ℎ and 16𝑡ℎ minutes of run 2 and at
the 10𝑡ℎ minute of run 3 indicating the spatial prevalence of ILMs; c1-c3: The spatial average spectra
for the drive power levels 𝑆𝑖𝑛(𝜔𝑑 = 3.86 𝑀𝐻𝑧) = 12, 16 and 20 𝑑𝐵𝑚 respectively; c4-c6: The
spatial average spectra for the drive frequencies 𝜔𝑑 = 3.85, 3.855 and 3.86 𝑀𝐻𝑧 respectively.
Note: The displacement profiles are normalized to the maximum displacement in the structure- i.e.
Red corresponds to 1 and blue corresponds to 0.

Figure 3: Temporal dependence of Intrinsic Localized Modes. A correspond to spatial stabilization
feature; B correspond to the attraction-repulsion feature; C correspond to the hopping feature. Note
1: The RMS displacement profiles (averaged over the spectral range 35 − 75 𝑘𝐻𝑧) are normalized to
the maximum displacement in the structure. Note 2: The RMS displacement profiles are selected
from the supplementary section S2.
Supplementary Information
Discrete intrinsic localized modes in a microelectromechanical resonator
Authors: Adarsh Ganesan1, Cuong Do1, Ashwin Seshia1
1. Nanoscience Centre, University of Cambridge, Cambridge, UK
Supplementary section S1
Operation of piezoelectrically driven micromechanical resonator
Figure S1: Operation of piezoelectrically driven micromechanical resonator: A: Free-free beam
topology with 2 μm air gap for in-plane mode excitation; B: 1 μm thick Al electrodes patterned on
0.5 μm thick AlN piezoelectric film which is in-turn patterned on SOI substrate; the 10 μm thick SOI
layer is then released through back-side etch to realize mechanical functionality; C: The scattering
parameter S21 denoting forward transmission gain across a broad range of frequencies from 0-4.5
MHz; D: across a smaller range of frequencies 3.83-3.88 MHz; E: Resonant mode shape of ~3.86 MHz
vibrations from eigen-frequency analysis in COMSOL and Doppler shift vibrometry.

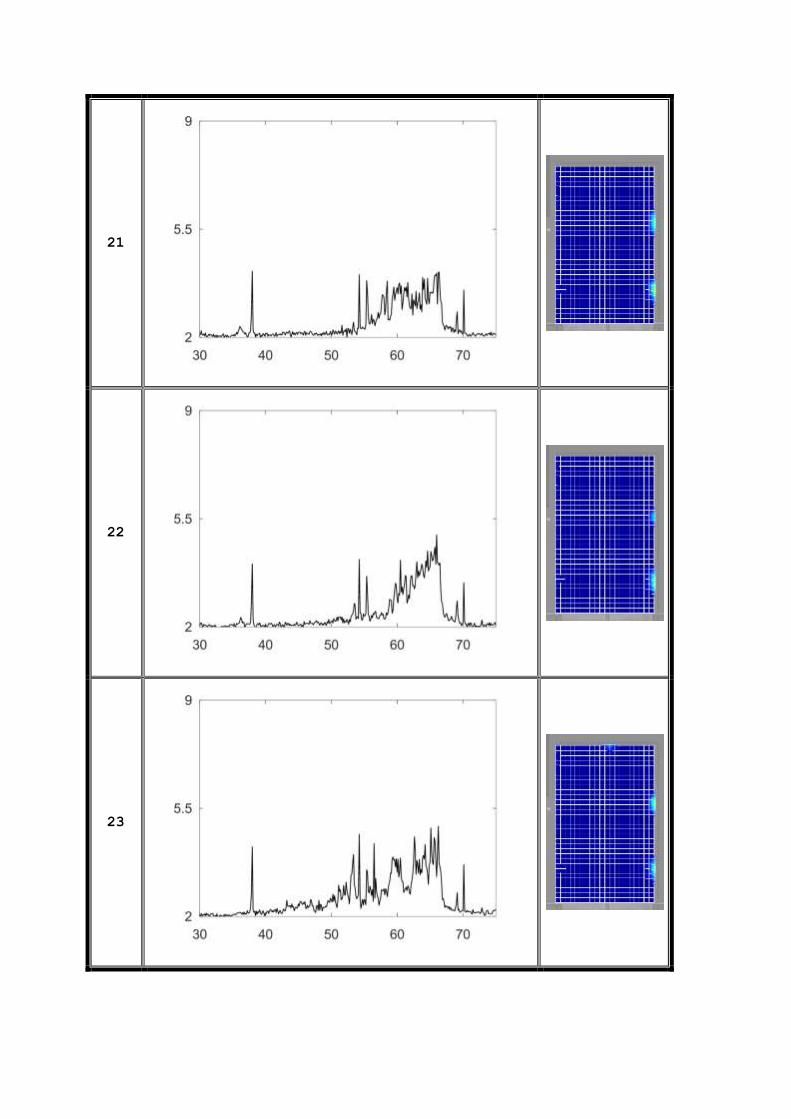
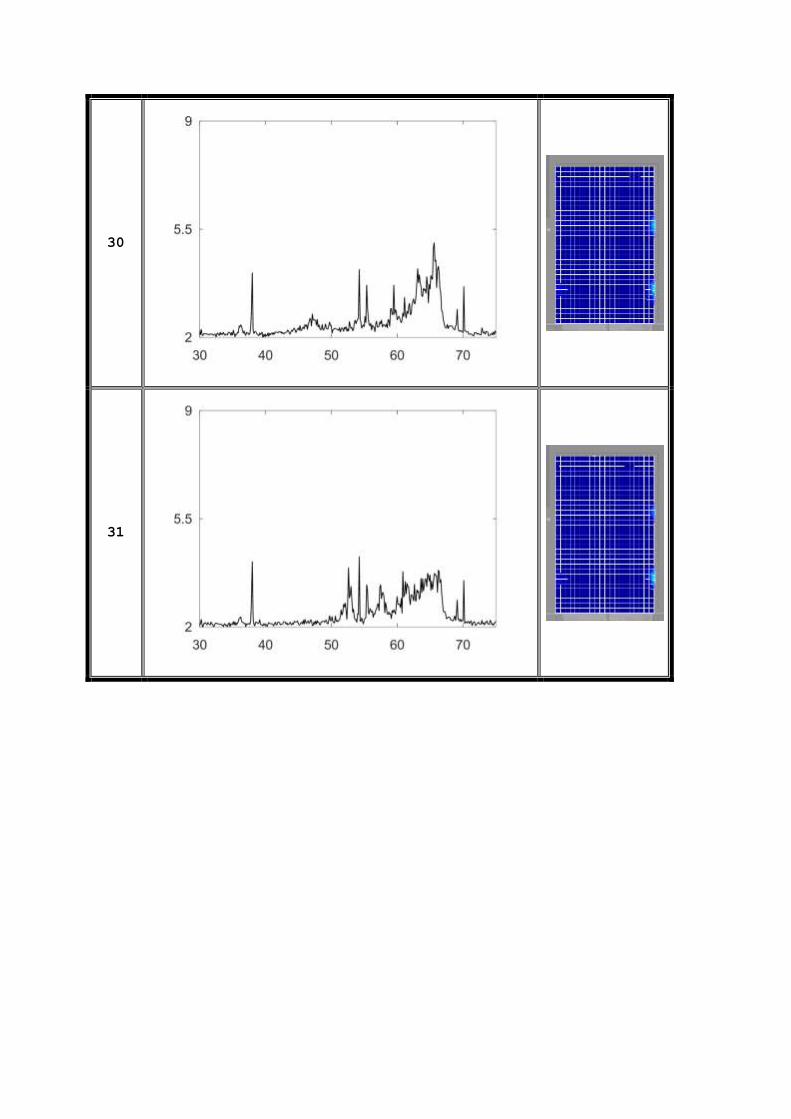
Supplementary section S2
Frequency responses and RMS surface displacement profiles obtained using Laser Doppler
Vibrometry at different drive conditions
Run 1
Time Displacement (in pm) vs. Frequency
(in kHz)
RMS Surface
Displacment
1
2

3
4
5

6
7
8
9
10
11

12
13
14

15
16
17
18
19
20

21
22
23

24
25
26

27
28
29

30
Run 2
Time Displacement (in pm) vs. Frequency
(in kHz)
RMS Surface
Displacment
1
2
3
4

5
6
7

8
9
10

11
12
13

14
15
16
17
18
19

20
21
22

23
24
25

26
27
28

29
30
31
32
33
34

35
36
37

38
39
40

41
42
43

44
45
46

47
48
49

50
51
52
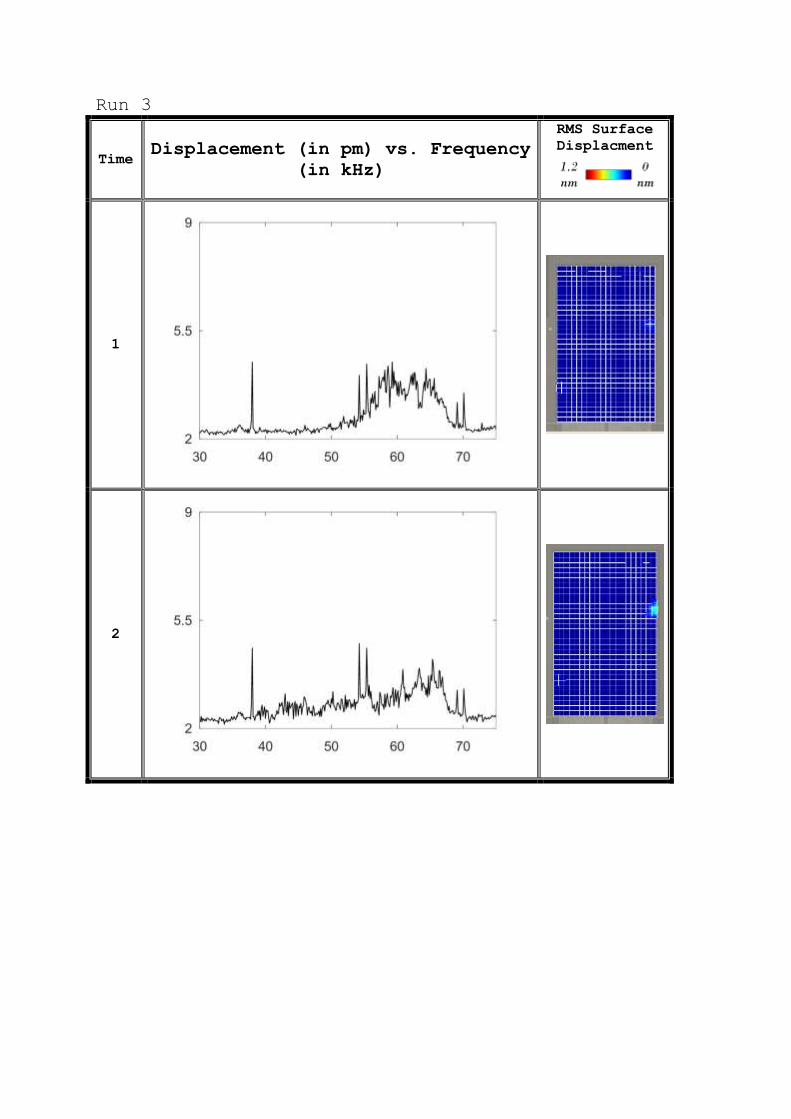
Run 3
Time Displacement (in pm) vs. Frequency
(in kHz)
RMS Surface
Displacment
1
2

3
4
5
6
7
8

9
10
11
12
13
14

15
16
17

18
19
20

21
22
23

24
25
26

27
28
29

30
31
32

33
34
35

36
37
38

39
40
41

42
43
44

45
46
47

48
49
50

51
52
53

54
55
56

57
58
59

60
61
62

63
64
65

Run 4
Time Displacement (in pm) vs. Frequency
(in kHz)
RMS Surface
Displacment
1
2

3
4
5

6
7
8

9
10
11

12
13
14

15
16
17

18
19
20
21
22
23

24
25
26

27
28
29
30
31