
DISCOVERY OF A POSSIBLE COOL WHITE DWARF COMPANION...
11
DISCOVERY OF A POSSIBLE COOL WHITE DWARF COMPANION FROM THE AllWISE MOTION SURVEY Sergio B. Fajardo-Acosta 1 , J. Davy Kirkpatrick 1 , Adam C. Schneider 2 , Michael C. Cushing 2 , Daniel Stern 3 , Christopher R. Gelino 1 , Daniella C. Bardalez-Gagliuffi 4 , Kendra Kellogg 5 , and Edward L. Wright 6 1 IPAC, Mail Code 100-22, Caltech, 1200 E. California Boulevard, Pasadena, CA 91125, USA; [email protected], [email protected], [email protected] 2 University of Toledo, 2801 W. Bancroft Street, MS 113, Toledo, OH 43606, USA; [email protected], [email protected] 3 Jet Propulsion Laboratory, California Institute of Technology, 4800 Oak Grove Drive, MS 169-221, Pasadena, CA 91109, USA; [email protected] 4 University of California at San Diego, 9450 Gillman Drive# 40282, La Jolla, CA 92092, USA; [email protected] 5 Western University, 226-376-3530, 454 Castlegrove Boulevard, London, ON N6G 1K8, Canada; [email protected] 6 University of California at Los Angeles, Departmentof Physics andAstronomy, P.O. Box 951547, Los Angeles, CA 90095-1547, USA; [email protected] Received 2016 April 22; revised 2016 September 16; accepted 2016 September 17; published 2016 November 17 ABSTRACT We present optical and near-infrared spectroscopy of WISEA J061543.91-124726.8, which we rediscovered as a high motion object in the AllWISE survey. The spectra of this object are unusual; while the red optical (λ>7000 Å) and near-infrared spectra exhibit characteristic TiO, VO, and H 2 O bands of a late-M dwarf, the blue portion of its optical spectrum shows a significant excess of emission relative to late-M-type templates. The excess emission is relatively featureless, with the exception of a prominent and very broad Na I D doublet. We find that no single, ordinary star can reproduce these spectral characteristics. The most likely explanation is an unresolved binary system of an M7 dwarf and a cool white dwarf. The flux of a cool white dwarf drops in the optical red and near-infrared, due to collision-induced absorption, thus allowing the flux of a late-M dwarf to show through. This scenario, however, does not explain the Na D feature, which is unlike that of any known white dwarf, but which could perhaps be explained via unusual abundance or pressure conditions. Key words: brown dwarfs – solar neighborhood – stars: individual (WISEA 0615–1247) – stars: low-mass – subdwarfs – white dwarfs 1. INTRODUCTION The study and census of our Solar neighborhood is important to advance our understanding of low-mass stars and brown dwarfs, which are the most numerous known objects in the Galaxy. As such,they shed light on the low-end of the initial mass function, and on star formation efficiency. The search for our nearest neighbors lets us study objects in great detail, because they are the closest, brightest objects of their class. The detailed study of late-type dwarfs, brown dwarfs, subdwarfs, and white dwarfs has historically relied on the identification of objects based on their optical through mid-infrared colors. These studies have been enhanced by recent surveys for high proper motion objects, because these surveys have no color bias, and can therefore identify objects with unusual character- istics not found through color-based searches. The object 2MASS J06154357-1247221=WISEA J061543.91-124726.8, which we henceforth designate WISEA 0615-1247, was originally discovered as a high proper motion star by Lépine (2008) and designated by him as PM I06157 -1247 in a re-analysis of southern hemisphere digitized sky surveys. Lépine (2008) finds proper motion components for WISEA 0615-1247 of μ α =452±10 mas yr -1 , and μ δ =-421±10 mas yr -1 from measurements spanning an epoch range of 39.2 years (see Table 1). The object was rediscovered by Kirkpatrick et al. (2014) due to its high motion in the AllWISE Data Release of the Wide-Field Infrared Survey Explorer (WISE; Wright et al. 2010). The colors of the object, namely J-K s =0.937±0.058 mag, from the Two Micron All-Sky Survey (2MASS; Skrutskie 1997), and J-W2= 1.685±0.040 mag (from 2MASS J and the WISE 4.6 μm bandpass W2; see Table 1), are shown as the red symbol in Figure 1. This figure compares these colors with those of 47,936 high motion sources (Kirkpatrick et al. 2014, 2016). WISEA 0615-1247 lies ∼0.2 mag below or blueward in J-K s color relative to the normal sequence of field objects, possibly hinting at a cool subdwarf nature. Early-L subdwarfs have colors J-W2 ranging from 1.1 to 1.8 mag, and J-K s on average 0.23 mag below the normal sequence of field objects (see Figure 7 in Kirkpatrick et al. 2016). The suggested sub–dwarf classification of the object is similar to that by Lépine (2008), based on the reduced proper motion of the object in the V bandpass. In order to elucidate the nature of the object, we obtained optical and near-infrared spectroscopy. The spectrum, as discussed below, proved to be unique. We propose a binary scenario that we believe best explains the observed data, although it invokes a cool white dwarf companion unlike any heretofore cataloged. 2. OBSERVATIONS 2.1. Proper Motion The AllWISE Source Catalog 7 lists R.A. Motion=593± 73 mas yr -1 and decl. Motion=-322±78 mas yr -1 for WISEA 0615-1247 (Table 1). In order to confirm this motion, we measured the displacement of the object between the 2MASS and AllWISE positions, to yield μ α =436.9± 6.4 mas yr -1 and μ δ =-406.8±6.5 mas yr -1 (Table 1). This proper motion is in rough agreement, within the errors, with the AllWISE motions. We carried out an additional estimate of the motion of the object, via a χ 2 minimization fit to its positions in The Astrophysical Journal, 832:62 (11pp), 2016 November 20 doi:10.3847/0004-637X/832/1/62 © 2016. The American Astronomical Society. All rights reserved. 7 See http://wise2.ipac.caltech.edu/docs/release/allwise/expsup/. Motions listed in the AllWISE source Catalog are not strictly proper motions, because parallax effects are not taken into account. Hence we list them as “R.A. Motion” and “decl. Motion,” to differentiate them from proper motions from other catalogs, which we list as “μ α ” and “μ δ .” 1
Transcript of DISCOVERY OF A POSSIBLE COOL WHITE DWARF COMPANION...

DISCOVERY OF A POSSIBLE COOL WHITE DWARF COMPANION FROM THE AllWISE MOTION SURVEY
Sergio B. Fajardo-Acosta1, J. Davy Kirkpatrick
1, Adam C. Schneider
2, Michael C. Cushing
2, Daniel Stern
3,
Christopher R. Gelino1, Daniella C. Bardalez-Gagliuffi
4, Kendra Kellogg
5, and Edward L. Wright
6
1 IPAC, Mail Code 100-22, Caltech, 1200 E. California Boulevard, Pasadena, CA 91125, USA;[email protected], [email protected], [email protected]
2 University of Toledo, 2801 W. Bancroft Street, MS 113, Toledo, OH 43606, USA; [email protected], [email protected] Jet Propulsion Laboratory, California Institute of Technology, 4800 Oak Grove Drive, MS 169-221, Pasadena, CA 91109, USA; [email protected]
4 University of California at San Diego, 9450 Gillman Drive# 40282, La Jolla, CA 92092, USA; [email protected] Western University, 226-376-3530, 454 Castlegrove Boulevard, London, ON N6G 1K8, Canada; [email protected]
6 University of California at Los Angeles, Departmentof Physics andAstronomy, P.O. Box 951547, Los Angeles, CA 90095-1547, USA; [email protected] 2016 April 22; revised 2016 September 16; accepted 2016 September 17; published 2016 November 17
ABSTRACT
We present optical and near-infrared spectroscopy of WISEA J061543.91−124726.8, which we rediscovered as ahigh motion object in the AllWISE survey. The spectra of this object are unusual; while the red optical(λ>7000 Å) and near-infrared spectra exhibit characteristic TiO, VO, and H2O bands of a late-M dwarf, the blueportion of its optical spectrum shows a significant excess of emission relative to late-M-type templates. The excessemission is relatively featureless, with the exception of a prominent and very broad Na I D doublet. We find that nosingle, ordinary star can reproduce these spectral characteristics. The most likely explanation is an unresolvedbinary system of an M7 dwarf and a cool white dwarf. The flux of a cool white dwarf drops in the optical red andnear-infrared, due to collision-induced absorption, thus allowing the flux of a late-M dwarf to show through. Thisscenario, however, does not explain the Na D feature, which is unlike that of any known white dwarf, but whichcould perhaps be explained via unusual abundance or pressure conditions.
Key words: brown dwarfs – solar neighborhood – stars: individual (WISEA 0615–1247) – stars: low-mass –subdwarfs – white dwarfs
1. INTRODUCTION
The study and census of our Solar neighborhood is importantto advance our understanding of low-mass stars and browndwarfs, which are the most numerous known objects in theGalaxy. As such,they shed light on the low-end of the initialmass function, and on star formation efficiency. The search forour nearest neighbors lets us study objects in great detail,because they are the closest, brightest objects of their class. Thedetailed study of late-type dwarfs, brown dwarfs, subdwarfs,and white dwarfs has historically relied on the identification ofobjects based on their optical through mid-infrared colors.These studies have been enhanced by recent surveys for highproper motion objects, because these surveys have no colorbias, and can therefore identify objects with unusual character-istics not found through color-based searches.
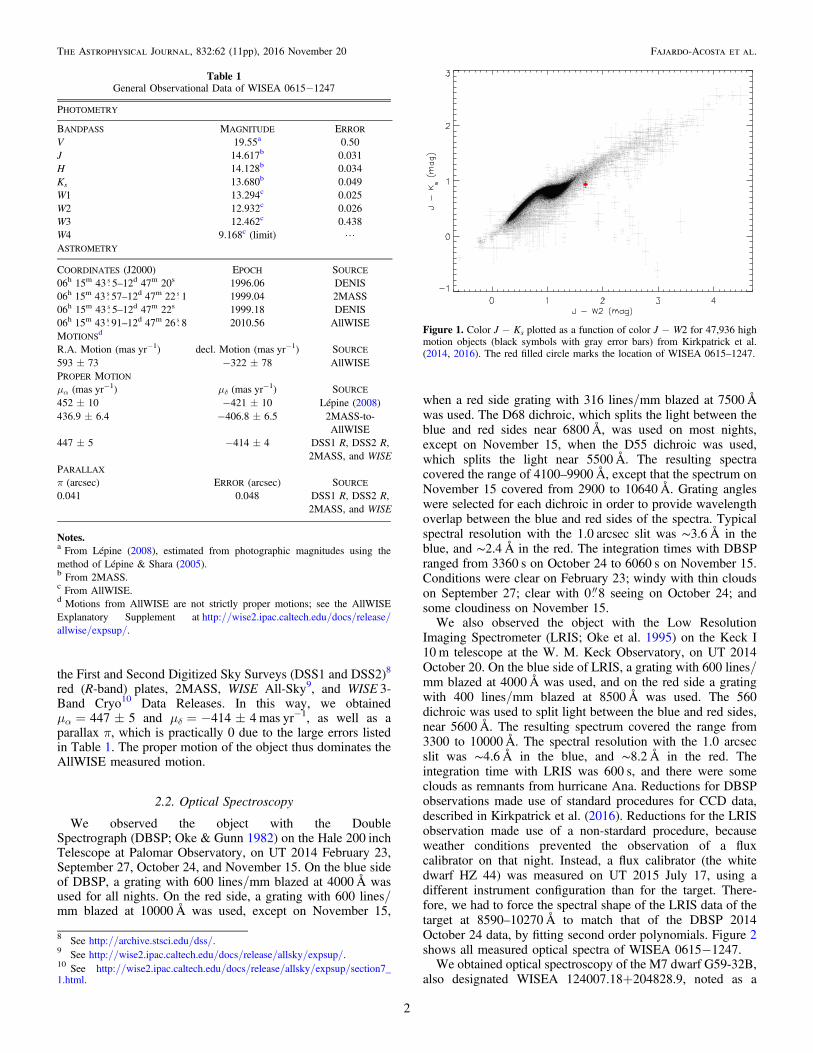
The object 2MASS J06154357−1247221=WISEAJ061543.91−124726.8, which we henceforth designate WISEA0615−1247, was originally discovered as a high proper motionstar by Lépine (2008) and designated by him as PM I06157−1247 in a re-analysis of southern hemisphere digitized skysurveys. Lépine (2008) finds proper motion components forWISEA 0615−1247 of μα=452±10mas yr−1, andμδ=−421±10mas yr−1 from measurements spanning anepoch range of 39.2 years (see Table 1). The object wasrediscovered by Kirkpatrick et al. (2014) due to its high motionin the AllWISE Data Release of the Wide-Field Infrared SurveyExplorer (WISE; Wright et al. 2010). The colors of the object,namely J−Ks=0.937±0.058 mag, from the Two MicronAll-Sky Survey (2MASS; Skrutskie 1997), and J−W2=1.685±0.040 mag (from 2MASS J and the WISE 4.6 μmbandpass W2; see Table 1), are shown as the red symbol inFigure 1. This figure compares these colors with those of 47,936high motion sources (Kirkpatrick et al. 2014, 2016). WISEA
0615−1247 lies ∼0.2 mag below or blueward in J−Ks colorrelative to the normal sequence of field objects, possibly hintingat a cool subdwarf nature. Early-L subdwarfs have colorsJ−W2 ranging from 1.1 to 1.8 mag, and J−Ks on average0.23mag below the normal sequence of field objects (see Figure7 in Kirkpatrick et al. 2016). The suggested sub–dwarfclassification of the object is similar to that by Lépine (2008),based on the reduced proper motion of the object in the Vbandpass. In order to elucidate the nature of the object, weobtained optical and near-infrared spectroscopy. The spectrum,as discussed below, proved to be unique. We propose a binaryscenario that we believe best explains the observed data,although it invokes a cool white dwarf companion unlike anyheretofore cataloged.
2. OBSERVATIONS
2.1. Proper Motion
The AllWISE Source Catalog7 lists R.A. Motion=593±73 mas yr−1 and decl. Motion=−322±78 mas yr−1 forWISEA 0615−1247 (Table 1). In order to confirm this motion,we measured the displacement of the object between the2MASS and AllWISE positions, to yield μα=436.9±6.4 mas yr−1 and μδ=−406.8±6.5 mas yr−1 (Table 1). Thisproper motion is in rough agreement, within the errors, with theAllWISE motions. We carried out an additional estimate of themotion of the object, via a χ2 minimization fit to its positions in
The Astrophysical Journal, 832:62 (11pp), 2016 November 20 doi:10.3847/0004-637X/832/1/62© 2016. The American Astronomical Society. All rights reserved.
7 See http://wise2.ipac.caltech.edu/docs/release/allwise/expsup/. Motionslisted in the AllWISE source Catalog are not strictly proper motions, becauseparallax effects are not taken into account. Hence we list them as “R.A.Motion” and “decl. Motion,” to differentiate them from proper motions fromother catalogs, which we list as “μα” and “μδ.”
1
the First and Second Digitized Sky Surveys (DSS1 and DSS2)8
red (R-band) plates, 2MASS, WISE All-Sky9, and WISE 3-Band Cryo10 Data Releases. In this way, we obtainedμα=447±5 and μδ=−414±4 mas yr−1, as well as aparallax π,which is practically 0 due to the large errors listedin Table 1. The proper motion of the object thus dominates theAllWISE measured motion.
2.2. Optical Spectroscopy
We observed the object with the DoubleSpectrograph (DBSP; Oke & Gunn 1982) on the Hale 200 inchTelescope at Palomar Observatory, on UT 2014 February 23,September 27, October 24, and November 15. On the blue sideof DBSP, a grating with 600 lines/mm blazed at 4000 Å wasused for all nights. On the red side, a grating with 600 lines/mm blazed at 10000 Å was used, except on November 15,
when a red side grating with 316 lines/mm blazed at 7500 Åwas used. The D68 dichroic, which splits the light between theblue and red sides near 6800 Å, was used on most nights,except on November 15, when the D55 dichroic was used,which splits the light near 5500 Å. The resulting spectracovered the range of 4100–9900 Å, except that the spectrum onNovember 15 covered from 2900 to 10640 Å. Grating angleswere selected for each dichroic in order to provide wavelengthoverlap between the blue and red sides of the spectra. Typicalspectral resolution with the 1.0 arcsec slit was ∼3.6 Å in theblue, and ∼2.4 Å in the red. The integration times with DBSPranged from 3360 s on October 24 to 6060 s on November 15.Conditions were clear on February 23; windy with thin cloudson September 27; clear with 0 8 seeing on October 24; andsome cloudiness on November 15.We also observed the object with the Low Resolution
Imaging Spectrometer (LRIS; Oke et al. 1995) on the Keck I10 m telescope at the W. M. Keck Observatory, on UT 2014October 20. On the blue side of LRIS, a grating with 600 lines/mm blazed at 4000 Å was used, and on the red side a gratingwith 400 lines/mm blazed at 8500 Å was used. The 560dichroic was used to split light between the blue and red sides,near 5600 Å. The resulting spectrum covered the range from3300 to 10000 Å. The spectral resolution with the 1.0 arcsecslit was ∼4.6 Å in the blue, and ∼8.2 Å in the red. Theintegration time with LRIS was 600 s, and there were someclouds as remnants from hurricane Ana. Reductions for DBSPobservations made use of standard procedures for CCD data,described in Kirkpatrick et al. (2016). Reductions for the LRISobservation made use of a non-stardard procedure, becauseweather conditions prevented the observation of a fluxcalibrator on that night. Instead, a flux calibrator (the whitedwarf HZ 44) was measured on UT 2015 July 17, using adifferent instrument configuration than for the target. There-fore,we had to force the spectral shape of the LRIS data of thetarget at 8590–10270 Å to match that of the DBSP 2014October 24 data, by fitting second order polynomials. Figure 2shows all measured optical spectra of WISEA 0615−1247.We obtained optical spectroscopy of the M7 dwarf G59-32B,
also designated WISEA 124007.18+204828.9, noted as a
Table 1General Observational Data of WISEA 0615−1247
PHOTOMETRY
BANDPASS MAGNITUDE ERRORV 19.55a 0.50J 14.617b 0.031H 14.128b 0.034Ks 13.680b 0.049W1 13.294c 0.025W2 12.932c 0.026W3 12.462c 0.438W4 9.168c (limit) LASTROMETRY
COORDINATES (J2000) EPOCH SOURCE06h 15m 43 5–12d 47m 20s 1996.06 DENIS06h 15m 43 57–12d 47m 22 1 1999.04 2MASS06h 15m 43 5–12d 47m 22s 1999.18 DENIS06h 15m 43 91–12d 47m 26 8 2010.56 AllWISEMOTIONSd
R.A. Motion (mas yr−1) decl. Motion (mas yr−1) SOURCE593±73 −322±78 AllWISEPROPER MOTION
μα (mas yr−1) μδ (mas yr−1) SOURCE452±10 −421±10 Lépine (2008)436.9±6.4 −406.8±6.5 2MASS-to-
AllWISE447±5 −414±4 DSS1 R, DSS2 R,
2MASS, and WISEPARALLAXπ (arcsec) ERROR (arcsec) SOURCE0.041 0.048 DSS1 R, DSS2 R,
2MASS, and WISE
Notes.a From Lépine (2008), estimated from photographic magnitudes using themethod of Lépine & Shara (2005).b From 2MASS.c From AllWISE.d Motions from AllWISE are not strictly proper motions; see the AllWISEExplanatory Supplement at http://wise2.ipac.caltech.edu/docs/release/allwise/expsup/.
Figure 1. Color J−Ks plotted as a function of color J−W2 for 47,936 highmotion objects (black symbols with gray error bars) from Kirkpatrick et al.(2014, 2016). The red filled circle marks the location of WISEA 0615–1247.
8 See http://archive.stsci.edu/dss/.9 See http://wise2.ipac.caltech.edu/docs/release/allsky/expsup/.10 See http://wise2.ipac.caltech.edu/docs/release/allsky/expsup/section7_1.html.
2
The Astrophysical Journal, 832:62 (11pp), 2016 November 20 Fajardo-Acosta et al.

component in a common-proper motion binary by Kirkpatricket al. (2014). The system was in a pre-flare state during theobservations, and was intended as a spectral-type comparison.We used the Boller & Chivens Spectrograph on the Irenee duPont 2.5 m telescope at Las Campanas Observatory, on UT2014 May 4. The integration time was 1800 s. See Kirkpatricket al. (2016) for more details.
We also obtained DBSP observations of three white dwarfsfor comparison with WISEA 0615−1247, and another objectthat was initially believed to also be a white dwarf. The whitedwarfs LHS 3250 and LSPM J1702+7158N were observed onUT 2015 June 8, with 3660 s integrations each, under clearconditions but with 2″ seeing. The white dwarf WD J0205−053 was observed on UT 2015 September 7, with 2400 sintegrations, through some clouds and glow from a last-quartermoon, although with 1 1–1 2 seeing. The 600 lines/mmgratings on the blue and red sides of DBSP were again usedwith the D68 dichroic, to produce continuous 4100–9900 Åspectra. Details on these three white dwarfs are given inSection 3.2.1. We observed the object LP 343−35=WISEA221515.51+315731.9 (Kirkpatrick et al. 2016), under theassumption that is was the white dwarf WD 2213+317. ThisDBSP observation was on UT 2016 January 13, with a 300 s
integration, using the D55 dichroic, and a 1.5 arcsec slit. Thegratings used were the 600 lines/mm on the blue side, and a316 lines/mm one blazed at 7500 Å on the red side, to producea continuous 3700–10300 Å spectrum, with typical spectralresolution of 4.9 Å in the blue, and 3.9 Å in the red. Details onthe object are given in Section 3.2.1 and in the Appendix.
2.3. Near-infrared Spectroscopy
We observed WISEA 0615−1247 in the near-infrared withthe upgraded SpeX spectrograph (Rayner et al. 2003) at theNASA Infrared 3 m Telescope Facility, on UT 2015 January18. A low-resolution (λ/Δλ=75–120) spectrum covering therange 0.69–2.54 μm was obtained using the prism mode.Exposures were done in an ABBA nod pattern along the15 arcsec slit; the total integration time was 956 s. In order toapply telluric corrections, an A0 V star was observed, as closein airmass as possible to our target, although a 0.3 airmassdifference was the best we could achieve. Data reduction wasdone with the SpeXtool package (Vacca et al. 2003; Cushinget al. 2004). Figure 3 shows the SpeX spectrum of WISEA0615−1247. Wavelength regions of low atmospheric transmis-sion (less than about 60%) are indicated with gray bands. Theseregions correspond to water vapor absorptions at 0.92, 1.13,1.35, and 1.85 μm, as well as CO2 absorptions near 1.6, 2.0,and 2.06 μm (Rayner et al. 2009). The spectrum exhibits twopeaks at ∼1.08 and 1.27 μm, which are near, but not at, thepositions of H Paschen-series γ and β lines, respectively. Thefeature at 1.08 μm is likely due to telluric H2O, and in ourexperience is sometimes easier to see at the low spectralresolution of these data. The feature at 1.27 μm is due to poorcorrection of a telluric O2 band.
2.4. Previous Imaging
We searched the literature for optical imaging data ofWISEA 0615−1247. The purpose was to see if a backgroundcontaminant source may have been present in the beam duringour optical spectroscopy of the object. The images examinedwere the B-band and R-band images in DSS2, and the I-bandimage in the Deep Near Infrared Survey of the Southern Sky
Figure 2. Optical spectra of WISEA 0615−1247, measured with DBSP atPalomar Observatory, on UT 2014 February 23, September 27, October 24,and November 15, and with LRIS at Keck Observatory, on UT 2014 October20. The bottom spectrum, shown in red, is of the M7 dwarf G59-32B, orWISEA 124007.18+204828.9, for spectral-type comparison. Spectra havebeen normalized at 7500 Å, and a constant offset has been added to separate thespectra vertically. Regions of low atmospheric transmission (Hamuyet al. 1994) are indicated by gray bands. Feature identifications are shown inred for the October 24 spectrum of WISEA 0615−1247.
Figure 3. Near-infrared spectrum of WISEA 0615−1247, measured with theSpeX spectrograph at the NASA IRTF, on UT 2015 January 18. Regions oftelluric absorption (Rayner et al. 2009) are indicated by gray bands.
3
The Astrophysical Journal, 832:62 (11pp), 2016 November 20 Fajardo-Acosta et al.
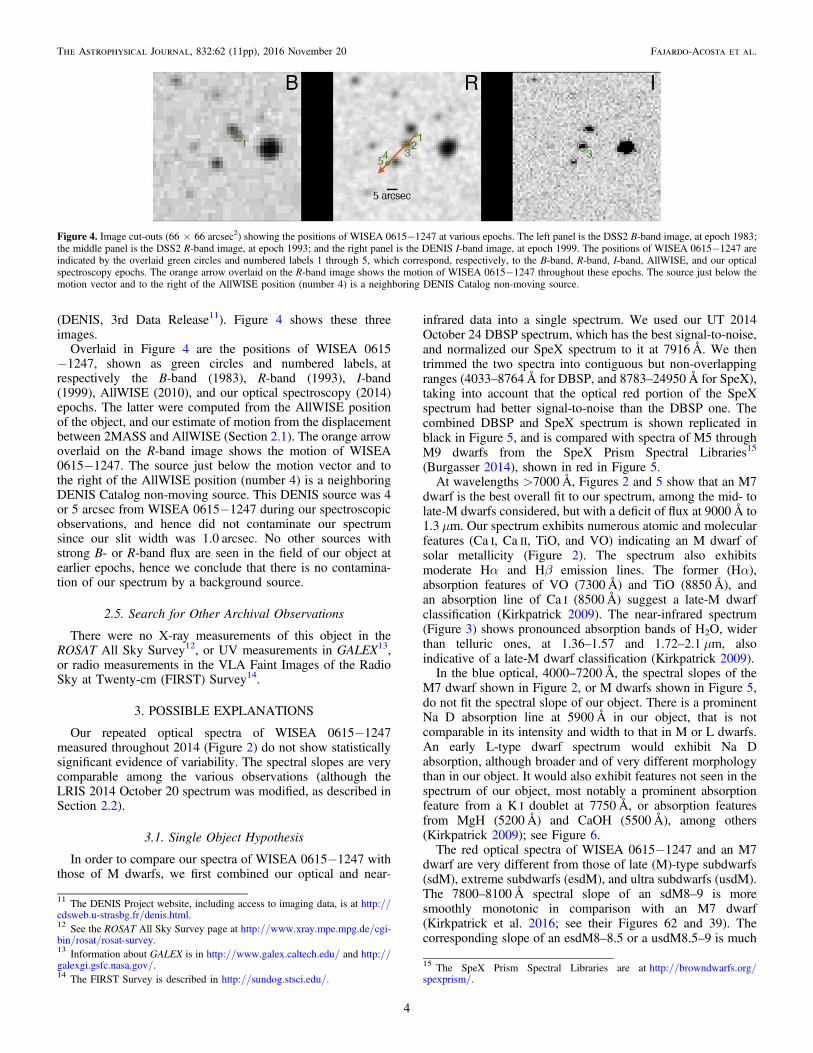
(DENIS, 3rd Data Release11). Figure 4 shows these threeimages.
Overlaid in Figure 4 are the positions of WISEA 0615−1247, shown as green circles and numbered labels,atrespectively the B-band (1983), R-band (1993), I-band(1999), AllWISE (2010), and our optical spectroscopy (2014)epochs. The latter were computed from the AllWISE positionof the object, and our estimate of motion from the displacementbetween 2MASS and AllWISE (Section 2.1). The orange arrowoverlaid on the R-band image shows the motion of WISEA0615−1247. The source just below the motion vector and tothe right of the AllWISE position (number 4) is a neighboringDENIS Catalog non-moving source. This DENIS source was 4or 5 arcsec from WISEA 0615−1247 during our spectroscopicobservations, and hence did not contaminate our spectrumsince our slit width was 1.0 arcsec. No other sources withstrong B- or R-band flux are seen in the field of our object atearlier epochs, hence we conclude that there is no contamina-tion of our spectrum by a background source.
2.5. Search for Other Archival Observations
There were no X-ray measurements of this object in theROSAT All Sky Survey12, or UV measurements in GALEX13,or radio measurements in the VLA Faint Images of the RadioSky at Twenty-cm (FIRST) Survey14.
3. POSSIBLE EXPLANATIONS
Our repeated optical spectra of WISEA 0615−1247measured throughout 2014 (Figure 2) do not show statisticallysignificant evidence of variability. The spectral slopes are verycomparable among the various observations (although theLRIS 2014 October 20 spectrum was modified, as described inSection 2.2).
3.1. Single Object Hypothesis
In order to compare our spectra of WISEA 0615−1247 withthose of M dwarfs, we first combined our optical and near-
infrared data into a single spectrum. We used our UT 2014October 24 DBSP spectrum, which has the best signal-to-noise,and normalized our SpeX spectrum to it at 7916 Å. We thentrimmed the two spectra into contiguous but non-overlappingranges (4033–8764 Å for DBSP, and 8783–24950 Å for SpeX),taking into account that the optical red portion of the SpeXspectrum had better signal-to-noise than the DBSP one. Thecombined DBSP and SpeX spectrum is shown replicated inblack in Figure 5, and is compared with spectra of M5 throughM9 dwarfs from the SpeX Prism Spectral Libraries15
(Burgasser 2014), shown in red in Figure 5.At wavelengths >7000 Å, Figures 2 and 5 show that an M7
dwarf is the best overall fit to our spectrum, among the mid- tolate-M dwarfs considered, but with a deficit of flux at 9000 Å to1.3 μm. Our spectrum exhibits numerous atomic and molecularfeatures (Ca I, Ca II, TiO, and VO) indicating an M dwarf ofsolar metallicity (Figure 2). The spectrum also exhibitsmoderate Hα and Hβ emission lines. The former (Hα),absorption features of VO (7300 Å) and TiO (8850 Å), andan absorption line of Ca I (8500 Å) suggest a late-M dwarfclassification (Kirkpatrick 2009). The near-infrared spectrum(Figure 3) shows pronounced absorption bands of H2O, widerthan telluric ones, at 1.36–1.57 and 1.72–2.1 μm, alsoindicative of a late-M dwarf classification (Kirkpatrick 2009).In the blue optical, 4000–7200 Å, the spectral slopes of the
M7 dwarf shown in Figure 2, or M dwarfs shown in Figure 5,do not fit the spectral slope of our object. There is a prominentNa D absorption line at 5900 Å in our object, that is notcomparable in its intensity and width to that in M or L dwarfs.An early L-type dwarf spectrum would exhibit Na Dabsorption, although broader and of very different morphologythan in our object. It would also exhibit features not seen in thespectrum of our object, most notably a prominent absorptionfeature from a K I doublet at 7750 Å, or absorption featuresfrom MgH (5200 Å) and CaOH (5500 Å), among others(Kirkpatrick 2009); see Figure 6.The red optical spectra of WISEA 0615−1247 and an M7
dwarf are very different from those of late (M)-type subdwarfs(sdM), extreme subdwarfs (esdM), and ultra subdwarfs (usdM).The 7800–8100 Å spectral slope of an sdM8–9 is moresmoothly monotonic in comparison with an M7 dwarf(Kirkpatrick et al. 2016; see their Figures 62 and 39). Thecorresponding slope of an esdM8–8.5 or a usdM8.5–9 is much
Figure 4. Image cut-outs (66×66 arcsec2) showing the positions of WISEA 0615−1247 at various epochs. The left panel is the DSS2 B-band image, at epoch 1983;the middle panel is the DSS2 R-band image, at epoch 1993; and the right panel is the DENIS I-band image, at epoch 1999. The positions of WISEA 0615−1247 areindicated by the overlaid green circles and numbered labels 1 through 5, which correspond, respectively, to the B-band, R-band, I-band, AllWISE, and our opticalspectroscopy epochs. The orange arrow overlaid on the R-band image shows the motion of WISEA 0615−1247 throughout these epochs. The source just below themotion vector and to the right of the AllWISE position (number 4) is a neighboring DENIS Catalog non-moving source.
11 The DENIS Project website, including access to imaging data, is at http://cdsweb.u-strasbg.fr/denis.html.12 See the ROSAT All Sky Survey page at http://www.xray.mpe.mpg.de/cgi-bin/rosat/rosat-survey.13 Information about GALEX is in http://www.galex.caltech.edu/ and http://galexgi.gsfc.nasa.gov/.14 The FIRST Survey is described in http://sundog.stsci.edu/.
15 The SpeX Prism Spectral Libraries are athttp://browndwarfs.org/spexprism/.
4
The Astrophysical Journal, 832:62 (11pp), 2016 November 20 Fajardo-Acosta et al.

bluer than for an M7 dwarf (Kirkpatrick et al. 2016; see theirFigures 71 and 74). Those same figures show that the8500–9250 Å spectral region is very red in an M7 dwarf,while it is modestly red or flat in an sdM8–9, and turns overblue with increasing wavelength in an esdM8–8.5, orusdM8.5–9 (Kirkpatrick et al. 2016). The spectra of sdM8–9,esdM8–8.5, or usdM8.5–9 exhibit a very dramatic pseudo-continuum bump or CaH absorption trough at 6800 Å, incontrast to a barely noticeable feature in an M7 dwarf(Kirkpatrick et al. 2016), owing to TiO bands that swamp theCaH trough in the latter. Therefore, a late-type sdM, esdM, orusdM cannot reproduce the red optical spectrum of WISEA0615−1247 while a solar metallicity M7 dwarf does.
3.2. Binary Hypothesis
In this section,we explore the possibility that an unresolvedbinary fits the data best. The binary would be comprised of anobject responsible for the blue optical portion of the spectrum,while a late-M dwarf is largely responsible for the red opticaland near-infrared portions.
The spectral energy distribution (SED) of a possible binarycompanion to a late-M dwarf can be assessed by subtracting aspectrum of the latter, from that of WISEA 0615−1247. Our
goals for the difference spectrum were for it to be positive inthe optical, except in telluric regions, and to eliminate the CaHand TiO spectral features at 6750–7050 Å, under the assump-tion that they are produced only by the late-M dwarf. The oneparameter that we varied was the normalization factor of thelate-M dwarf spectrum at a fixed wavelength, which thendetermined the corresponding normalization factor of thebinary companion spectrum. We chose 7400 Å as the normal-ization wavelength, because it is not in a telluric region, andboth the spectrum of our object and a late-M dwarf arerelatively featureless thereat. After experimenting with variousnormalization factors, we chose to normalize the late-M dwarfspectrum to 55% of the flux of our object at the abovewavelength. Figure 7 shows the subtraction of the M7 dwarfspectrum in Figure 2, from our object’s DBSP optical spectrumof 2014 October 24. Figure 7 shows that the CaH and TiOfeatures were not eliminated, but our choice of normalizationminimized their intensity. For normalization factors below55%, the above CaH and TiO features were more prominent,and for normalization factors above 55%, negative fluxesresulted in various wavelength regions apart from telluric ones.Figure 7 shows that the spectrum of a possible companion to alate-M dwarf linearly rises from 4000 to 6700 Å, except that itexhibits a broad absorption feature of Na I D at 5900 Å. The
Figure 5. Black lines are the combination of our DBSP spectrum of WISEA0615−1247 measured on UT 2014 October 24, trimmed to the range of4033through 8764 Å, and our SpeX spectrum trimmed to the range of8783 Åthrough 2.495 μm. The SpeX spectrum was normalized to the DBSP one at7916 Å, before trimming. The combined spectrum, in normalized flux densityunits, was replicated vertically by adding offsets, for comparison with spectraof known mid- through late-M-type dwarfs (shown as red lines) from the SpeXPrism Spectral Libraries; see the text for reference. These comparison spectrawere normalized to our object spectrum at 2.1 μm.
Figure 6. Black lines are our DBSP spectrum of WISEA 0615−1247 measuredon UT 2014 October 24. The spectrum is plotted in normalized flux densityunits, and was replicated vertically by adding offsets, for comparison withspectra of known early- to mid-L type dwarfs (shown as red lines). Thesespectra are of 2MASS J07464256+2000321 (L0.5), 2MASS J00361617+1821104 (L3.5), and 2MASS J15074769−1627386 (L5), from Kirkpatricket al. (2000) and Reid et al. (2000). The spectra are plotted only up to 8000 Åbecause of large discrepancies with our object at longer wavelengths. Regionsof low atmospheric transmission (Hamuy et al. 1994) are indicated by graybands. Feature identifications are shown in red for the L0.5 dwarf spectrum.
5
The Astrophysical Journal, 832:62 (11pp), 2016 November 20 Fajardo-Acosta et al.

spectrum then precipitously drops from ∼6700 to 7600 Å. It isvery roughly flat from ∼7700 to 8800 Å, and finally rises in theremaining reddest part of it.
The difference spectrum in Figure 7, and particularly theexcess in the optical blue, is plausibly produced by an objecthotter than an M dwarf, and of relatively small radius, for itsflux to be of the same order of magnitude as the M dwarf.Therefore, we considered a cool white dwarf as a possibility.Cool white dwarfs are those with temperatures 4500 K. Theyare sometimes uncovered in proper motion surveys (Scholzet al. 2009, and references therein). Their infrared flux densitiesare depressed due to collision-induced absorption (CIA) by H2
(Saumon et al. 1994; Hansen 1998; Abel et al. 2011). Weconsidered CIA mainly from H2–H2 pairs, such as in themodels by Abel et al. (2011). However, depending on therelative abundance of He, CIA from H2–He pairs may also besignificant, as in models by Borysow et al. (1997). The effect ofCIA is most evident at wavelengths >1 μm. However,Oppenheimer et al. (2001) noted that the optical colors of coolwhite dwarfs are also affected by CIA. The opacity of CIAstarts at approximately 0.6 μm and increases toward the near-infrared (Borysow et al. 1997). Models of cool white dwarfspectra with CIA, by D. Saumon and D. Koester (presented byKilic et al. 2006), show that their SEDs are bluer and depressedrelative to those of blackbodies. These models show that theonset of CIA in the optical is gradual, and its exact startingwavelength is difficult to quantify.
A cool white dwarf, as a companion to an M7 dwarf, mightqualitatively explain the colors J−Ks, J−W2 of WISEA0615−1247 (Figure 1). CIA models of cool white dwarfs havebumps and wiggles in the infrared, rather than a smooth fluxdescent with increasing wavelength (D. Saumon and D.Koester, presented by Kilic et al. 2006; Abel et al. 2011).The J−Ks color is similar to that in a Rayleigh–Jeansspectrum, while longer wavelength colors are redder. TheJ−Ks color of WISEA 0615−1247 (Section 1) is ∼0.06 magbluer than J−Ks∼1.0 for a typical M7 dwarf (Figure 14 ofKirkpatrick et al. 2008). The J−W2 color of WISEA 0615
−1247 (Section 1) is ∼0.18 mag redder than J−W2∼1.5 fora typical M7 dwarf (Figure 7 of Kirkpatrick et al. 2011). Wediscuss these colors further at the end of Section 3.2.2.
3.2.1. Comparison Cool White Dwarfs
We searched the literature for spectra of cool white dwarfswith which to fit the difference spectrum in Figure 7. The coolwhite dwarfs we selected are SDSS J133001.13+643523.8,WD 2356−209, LHS 3250, WISEA 1702+7158B, and WDJ0205−053. The first two show Na D absorption features,while the last three do not, although they were considered aspotential fits to the continuum of the difference spectrum in theblue optical. Table 2 lists observational and physicalcharacteristics of these five cool white dwarfs, and we alsodescribe their spectroscopic and other characteristics next.
1. SDSS J133001.13+643523.8 (Harris et al. 2003) is a He-atmosphere white dwarf whose optical spectrum exhibitsmetallic lines. Its Sloan Digital Sky Survey (SDSS; Yorket al. 2000) spectrum has prominent and very broad Na ID absorption near 5892 Å. The SDSS spectrum, of verylow signal-to-noise, tentatively exhibits Ca I absorptionfeatures at 4226, 4335, and 4455 Å, and Ca II infraredtriplet absorption features at 8498, 8542, and 8602 Å(Harris et al. 2003). Unlike the spectra of other DZ whitedwarfs, that of SDSS J133001.13+643523.8 does notexhibit the Mg I triplet lines near 5175 Å, or the Ca II H &K lines (3968 and 3934 Å).
2. WD 2356−209 was discovered as a candidate Galactichalo cool white dwarf by Oppenheimer et al. (2001). It isa DZ-type white dwarf, and its optical spectrum shows abroad and prominent absorption feature from Na I D andpossible absorption features from the Mg I triplet near5175 Å (Oppenheimer et al. 2001).
3. LHS 3250 (Luyten 1976) was discovered to be the firstcool white dwarf with CIA by Harris et al. (1999). It is aDC-type white dwarf, meaning it has no discerniblespectral features in the optical.
4. LSPM J1702+7158N (Lépine & Shara 2005)16 is thesecondary-component of a common-proper motion binary(10 8 separation); the primary component is LP 43-310(Salim & Gould 2003; Lépine & Shara 2005). Kirkpatricket al. (2016) rediscovered the common-proper motionsystem in an analysis of AllWISE high motion sources.Kirkpatrick et al. (2016) obtained a DBSP spectrum ofLSPM J1702+7158N and they classified the object as acool white dwarf.
5. WD J0205−053 was also discovered as a candidateGalactic halo cool white dwarf by Oppenheimer et al.(2001), and was followed up through optical photometryand spectroscopy by Salim et al. (2004). No spectral linesare seen in the optical, hence its classification as DC-type.Salim et al. (2004) concluded it had a He atmosphere.However, the SED of a pure-He atmosphere white dwarfwould be expected to be nearly identical to that of ablackbody (Kowalski & Saumon 2006). Bergeron et al.(2005) obtained optical and near-infrared ground-basedphotometry, and Kilic et al. (2009) obtained SpitzerIRAC photometry of this and other similar objects. Kilicet al. (2009) fitted atmospheric models to these data, and
Figure 7. Difference between our 2014 October 24 spectrum of WISEA 0615−1247, and the spectrum of the M7 V star WISEA 1240+2047 (both shown inFigure 2). The M7 V star was normalized to 55% of our object’s flux density at7400 Å, before subtraction, as explained in Section 3.2. The resultingdifference has been smoothed with a 3 pixel boxcar. The red dashed lineindicates a zero difference. Regions of low atmospheric transmission (Hamuyet al. 1994) are indicated by gray bands.
16 The LSPM-North Catalog is accessible at https://heasarc.gsfc.nasa.gov/W3Browse/all/lspmnorth.html.
6
The Astrophysical Journal, 832:62 (11pp), 2016 November 20 Fajardo-Acosta et al.
WD J0205−053 itself was modeled with a pure-Hatmosphere. Kilic et al. (2009) found that, in their sampleof 44 cool white dwarfs, only one had a pure-Heatmosphere.
We also selected for comparison the white dwarf WD 2213+317, whose coordinates in SIMBAD associate it with theAllWISE high motion object WISEA 221515.51+315731.9(Kirkpatrick et al. 2016). Kirkpatrick et al. (2016) found thatthe colors J−Ks=0.889±0.025 mag andJ−W2=1.081±0.028 mag place the AllWISE objectamong normal M dwarfs in color space (Figure 1). Kirkpatricket al. (2016) pointed to other binary systems known from theliterature, consisting of M and white dwarfs, whichalso fall atthe location of normal M dwarfs, and suggested that WD 2213+317 was worthy of follow-up. Unfortunately, the SIMBADassociation of the white dwarf and the AllWISE object iserroneous; the latter is an early-M-type dwarf instead, asexplained in the Appendix.
3.2.2. Binaries of Late-M and Cool White Dwarfs
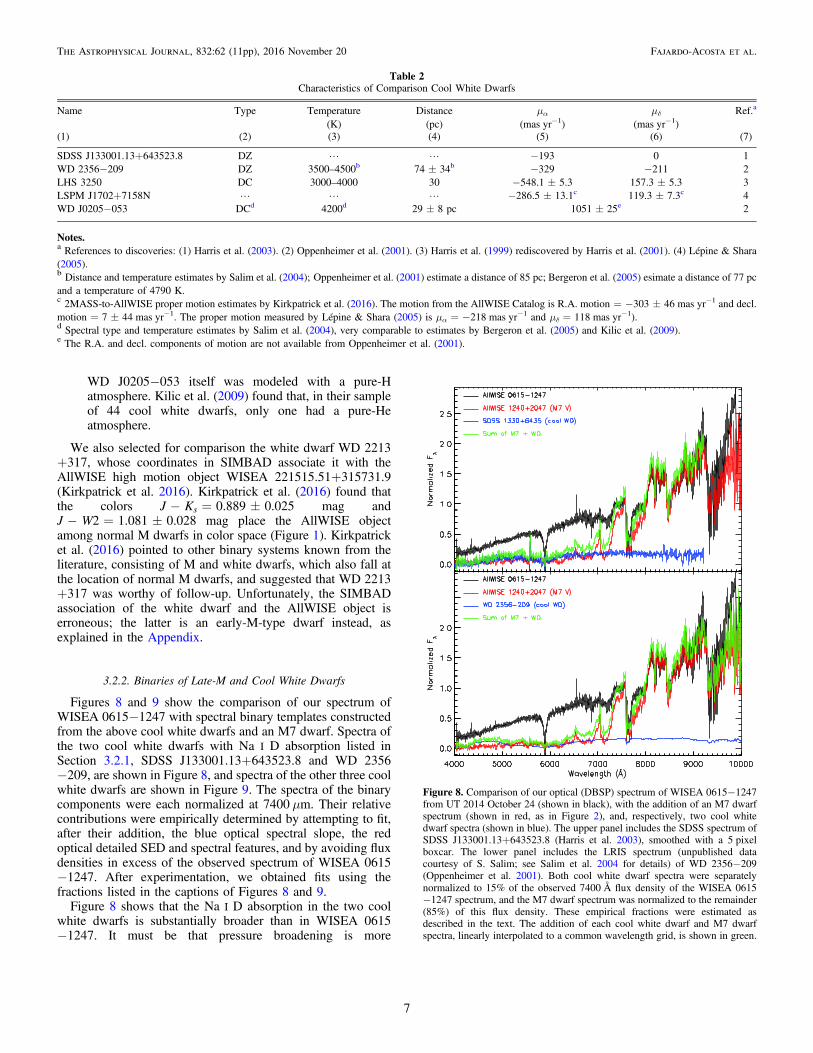
Figures 8 and 9 show the comparison of our spectrum ofWISEA 0615−1247 with spectral binary templates constructedfrom the above cool white dwarfs and an M7 dwarf. Spectra ofthe two cool white dwarfs with Na I D absorption listed inSection 3.2.1, SDSS J133001.13+643523.8 and WD 2356−209, are shown in Figure 8, and spectra of the other three coolwhite dwarfs are shown in Figure 9. The spectra of the binarycomponents were each normalized at 7400 μm. Their relativecontributions were empirically determined by attempting to fit,after their addition, the blue optical spectral slope, the redoptical detailed SED and spectral features, and by avoiding fluxdensities in excess of the observed spectrum of WISEA 0615−1247. After experimentation, we obtained fits using thefractions listed in the captions of Figures 8 and 9.
Figure 8 shows that the Na I D absorption in the two coolwhite dwarfs is substantially broader than in WISEA 0615−1247. It must be that pressure broadening is more
Table 2Characteristics of Comparison Cool White Dwarfs
Name Type Temperature Distance μα μδ Ref.a
(K) (pc) (mas yr−1) (mas yr−1)(1) (2) (3) (4) (5) (6) (7)
SDSS J133001.13+643523.8 DZ L L −193 0 1WD 2356−209 DZ 3500–4500b 74±34b −329 −211 2LHS 3250 DC 3000–4000 30 −548.1±5.3 157.3±5.3 3LSPM J1702+7158N L L L −286.5±13.1c 119.3±7.3c 4WD J0205−053 DCd 4200d 29±8 pc 1051±25e 2
Notes.a References to discoveries: (1) Harris et al. (2003). (2) Oppenheimer et al. (2001). (3) Harris et al. (1999) rediscovered by Harris et al. (2001). (4) Lépine & Shara(2005).b Distance and temperature estimates by Salim et al. (2004);Oppenheimer et al. (2001) estimate a distance of 85 pc; Bergeron et al. (2005) esimate a distance of 77 pcand a temperature of 4790 K.c 2MASS-to-AllWISE proper motion estimates by Kirkpatrick et al. (2016). The motion from the AllWISE Catalog is R.A. motion=−303±46 mas yr−1 and decl.motion=7±44 mas yr−1.The proper motion measured by Lépine & Shara (2005) is μα=−218 mas yr−1 and μδ=118 mas yr−1).d Spectral type and temperature estimates by Salim et al. (2004), very comparable to estimates by Bergeron et al. (2005) and Kilic et al. (2009).e The R.A. and decl. components of motion are not available from Oppenheimer et al. (2001).
Figure 8. Comparison of our optical (DBSP) spectrum of WISEA 0615−1247from UT 2014 October 24 (shown in black), with the addition of an M7 dwarfspectrum (shown in red, as in Figure 2), and, respectively, two cool whitedwarf spectra (shown in blue). The upper panel includes the SDSS spectrum ofSDSS J133001.13+643523.8 (Harris et al. 2003), smoothed with a 5 pixelboxcar. The lower panel includes the LRIS spectrum (unpublished datacourtesy of S. Salim; see Salim et al. 2004 for details) of WD 2356−209(Oppenheimer et al. 2001). Both cool white dwarf spectra were separatelynormalized to 15% of the observed 7400 Å flux density of the WISEA 0615−1247 spectrum, and the M7 dwarf spectrum was normalized to the remainder(85%) of this flux density. These empirical fractions were estimated asdescribed in the text. The addition of each cool white dwarf and M7 dwarfspectra, linearly interpolated to a common wavelength grid, is shown in green.
7
The Astrophysical Journal, 832:62 (11pp), 2016 November 20 Fajardo-Acosta et al.
pronounced in these cool white dwarfs, than in our system. Thespectral energy distributions (SEDs) of these two cool whitedwarfs are not an adequate fit as binary companions in thiscase, because they produce too much flux in the red optical,and not enough in the blue. Conversely, the red spectrum ismostly fit by an M7 dwarf. CIA in these cool white dwarfsappears to be less than in our system, possibly due to highereffective temperatures. We note that the temperature estimateof WD 2356−209 by Bergeron et al. (2005; see footnote (b) inTable 2) is relatively high. However, the models by Bergeronet al. (2005) tend to yield relatively high temperature values (H.Harris 2016, private communication).
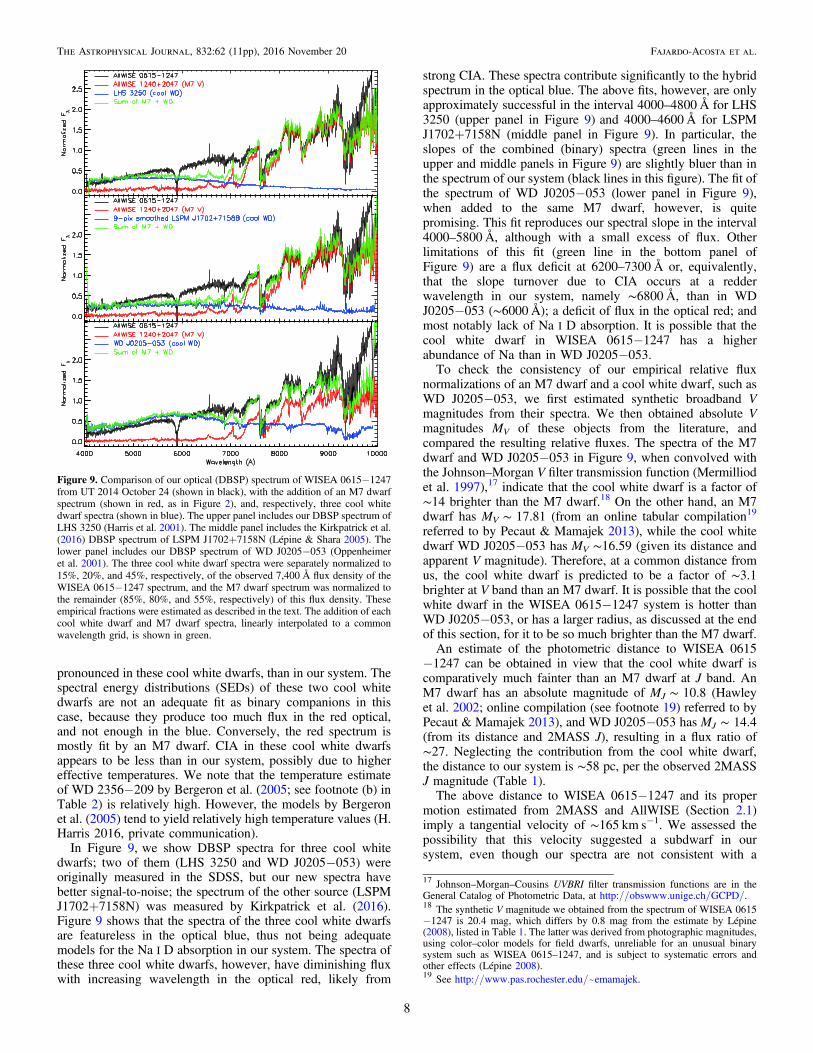
In Figure 9,we show DBSP spectra for three cool whitedwarfs; two of them (LHS 3250 and WD J0205−053) wereoriginally measured in the SDSS, but our new spectra havebetter signal-to-noise; the spectrum of the other source (LSPMJ1702+7158N) was measured by Kirkpatrick et al. (2016).Figure 9 shows that the spectra of the three cool white dwarfsare featureless in the optical blue, thus not being adequatemodels for the Na I D absorption in our system. The spectra ofthese three cool white dwarfs, however, have diminishing fluxwith increasing wavelength in the optical red, likely from
strong CIA. These spectra contribute significantly to the hybridspectrum in the optical blue. The above fits, however, are onlyapproximately successful in the interval 4000–4800 Å for LHS3250 (upper panel in Figure 9)and 4000–4600 Å for LSPMJ1702+7158N (middle panel in Figure 9). In particular, theslopes of the combined (binary) spectra (green lines in theupper and middle panels in Figure 9) are slightly bluer than inthe spectrum of our system (black lines in this figure). The fit ofthe spectrum of WD J0205−053 (lower panel in Figure 9),when added to the same M7 dwarf, however, is quitepromising. This fit reproduces our spectral slope in the interval4000–5800 Å, although with a small excess of flux. Otherlimitations of this fit (green line in the bottom panel ofFigure 9) are a flux deficit at 6200–7300 Å or, equivalently,that the slope turnover due to CIA occurs at a redderwavelength in our system, namely ∼6800 Å, than in WDJ0205−053 (∼6000 Å); a deficit of flux in the optical red; andmost notably lack of Na I D absorption. It is possible that thecool white dwarf in WISEA 0615−1247 has a higherabundance of Na than in WD J0205−053.To check the consistency of our empirical relative flux
normalizations of an M7 dwarf and a cool white dwarf, such asWD J0205−053, we first estimated synthetic broadband Vmagnitudes from their spectra. We then obtained absolute Vmagnitudes MV of these objects from the literature, andcompared the resulting relative fluxes. The spectra of the M7dwarf and WD J0205−053 in Figure 9, when convolved withthe Johnson–Morgan V filter transmission function (Mermilliodet al. 1997),17 indicate that the cool white dwarf is a factor of∼14 brighter than the M7 dwarf.18 On the other hand, an M7dwarf has MV∼17.81 (from an online tabular compilation19
referred to by Pecaut & Mamajek 2013), while the cool whitedwarf WD J0205−053 has MV ∼16.59 (given its distance andapparent V magnitude). Therefore, at a common distance fromus, the cool white dwarf is predicted to be a factor of ∼3.1brighter at V band than an M7 dwarf. It is possible that the coolwhite dwarf in the WISEA 0615−1247 system is hotter thanWD J0205−053, or has a larger radius, as discussed at the endof this section, for it to be so much brighter than the M7 dwarf.An estimate of the photometric distance to WISEA 0615
−1247 can be obtained in view that the cool white dwarf iscomparatively much fainter than an M7 dwarf at J band. AnM7 dwarf has an absolute magnitude of MJ∼10.8 (Hawleyet al. 2002; online compilation (see footnote 19) referred to byPecaut & Mamajek 2013), and WD J0205−053 has MJ∼14.4(from its distance and 2MASS J), resulting in a flux ratio of∼27. Neglecting the contribution from the cool white dwarf,the distance to our system is ∼58 pc, per the observed 2MASSJ magnitude (Table 1).The above distance to WISEA 0615−1247 and its proper
motion estimated from 2MASS and AllWISE (Section 2.1)imply a tangential velocity of ∼165 km s−1. We assessed thepossibility that this velocity suggested a subdwarf in oursystem, even though our spectra are not consistent with a
Figure 9. Comparison of our optical (DBSP) spectrum of WISEA 0615−1247from UT 2014 October 24 (shown in black), with the addition of an M7 dwarfspectrum (shown in red, as in Figure 2), and, respectively, three cool whitedwarf spectra (shown in blue). The upper panel includes our DBSP spectrum ofLHS 3250 (Harris et al. 2001). The middle panel includes the Kirkpatrick et al.(2016) DBSP spectrum of LSPM J1702+7158N (Lépine & Shara 2005). Thelower panel includes our DBSP spectrum of WD J0205−053 (Oppenheimeret al. 2001). The three cool white dwarf spectra were separately normalized to15%, 20%, and 45%, respectively, of the observed 7,400 Å flux density of theWISEA 0615−1247 spectrum, and the M7 dwarf spectrum was normalized tothe remainder (85%, 80%, and 55%, respectively) of this flux density. Theseempirical fractions were estimated as described in the text. The addition of eachcool white dwarf and M7 dwarf spectra, linearly interpolated to a commonwavelength grid, is shown in green.
17 Johnson–Morgan–Cousins UVBRI filter transmission functions are in theGeneral Catalog of Photometric Data, at http://obswww.unige.ch/GCPD/.18 The synthetic V magnitude we obtained from the spectrum of WISEA 0615−1247 is 20.4 mag, which differs by 0.8 mag from the estimate by Lépine(2008), listed in Table 1. The latter was derived from photographic magnitudes,using color–color models for field dwarfs, unreliable for an unusual binarysystem such as WISEA 0615–1247, and is subject to systematic errors andother effects (Lépine 2008).19 See http://www.pas.rochester.edu/~emamajek.
8
The Astrophysical Journal, 832:62 (11pp), 2016 November 20 Fajardo-Acosta et al.
subdwarf (Section 3.1). Traditionally, subdwarfs were con-sidered to be in the galactic halo (Ryan & Norris 1991;Gizis 1997; Lépine et al. 2003, 2007), and thereforedynamically “heated.” The median tangential velocity in thegalactic halo is ∼220 km s−1 (Reid & Hawley 2005), while thetypical velocity in the galactic disk is ∼37 km s−1 (Reid 1997).The escape velocity of the Galaxy near the Sun is ∼525 km s−1
(Carney & Latham 1987). In a recent study of the kinematics of3517 M-type objects of metallicity classes sdM, esdM, andusdM, Savcheva et al. (2014) found that the sdMs tend to be atthe galactic thick or old disk, while the esdMs and usdMs are atthe galactic halo. A histogram of the tangential velocities ofthese objects showed a peak at ∼50 km s−1, and values almostreaching 600 km s−1 (Savcheva et al. 2014). The tangentialvelocity of WISEA 0615–1247 is a factor of approximatelyfourtimes larger than in the galactic thin disk, and approxi-mately threetimes larger than in the thick disk, though smallerthan in the halo. The metallicity of WISEA 0615−1247 isinconsistent with membership in the latter, but it is probablethat it belongs to the thick disk. However, it should be takeninto account that there are high excursions in the velocities ofindividual objects around the above typical values. Therefore,any definite conclusion on the galactic population membershipof WISEA 0615−1247 will require a detailed kinematic study,including radial velocity and precise parallax measurements.
We computed the J−Ks and J−W2 colors of the binarysystem of an M7 dwarf and the cool white dwarf WD J0205−053, to see if they would reproduce the colors of WISEA0615−1247 shown in Figure 1. We used J and K photometry ofWD J0205−053 by Bergeron et al. (2005), and Spitzer IRACchannel 2 photometry by Kilic et al. (2009), which we regardedas equivalent to WISE W2, and computed absolute magnitudes.We used absolute magnitudes MJ and MK of an M7 dwarf fromthe online reference by Pecaut & Mamajek (2013; see footnote20). However, the fact that the cool white dwarf is intrinsicallymuch fainter than the M7 dwarf results in minute changes ofcolors J−Ks and J−W2 for this binary, relative to an M7dwarf (Section 3.2), of ∼0.03 and 0.05 mag, respectively.
A more luminous cool white dwarf would either have ahigher effective temperature, or a larger radius, than WD J0205−053. However, the effects of these two possibilities on CIAhave to be taken into account. Borysow et al. (1997) showedthat CIA decreases with increasing effective temperature, andincreases with surface gravity, and that CIA is pronounced forlow metallicity (Z<0.1 Z ) and effective temperature up to4000 K. Bergeron et al. (2005) and Tremblay & Bergeron(2008) computed pure-H atmospheric models of cool whitedwarfs. In these models, the color V−H becomes redder by∼0.10–0.17 mag when the effective temperature increases from4200 K (as in models for WD J0205−053) to 4500 K (thetemperature at which the above reddening effect, due toreduced CIA, is reversed). In our attempts to fit the SED ofWISEA 0615−1247 with binaries, we assumed that most of thenear-infrared flux is emitted by an M7 dwarf, henceconstraining V−H color variations to corresponding Vvariations in the cool white dwarf. It follows that an increasein effective temperature has only a modest effect, and ofopposite sense, in trying to solve the discrepancy in thepredicted and observed flux ratios of the M7 and the cool whitedwarf. In the models by Tremblay & Bergeron (2008), thecolor V−J becomes redder by ∼0.05 mag when surfacegravity log(g) decreases from 8.5 to 7.5, at an effective
temperature of 4500 K. The reddening effect is ∼0.1 mag at aneffective temperature of 4200 K. It follows that an increase inradius of a cool white dwarf leads to only a modest reduction inCIA, if log(g) variations are within the above range. Theassumed surface gravity of cool white dwarf models of WDJ0205−053 by Bergeron et al. (2005) and Kilic et al. (2009) islog(g)=8.0. Surface gravity should remain close to this value,as a result of an increase in the radius of a cool white dwarf, sothat CIA is still significant.A cool white dwarf of large radius but of surface gravity
comparable to that of WD J0205−053 may be hypothesized asa possibly improved fit, as a binary component, to WISEA0615−1247. Althaus et al. (2009)20 modeled He-core,H-atmosphere white dwarfs, whose progenitors had supersolarmetallicities. In these models, a 0.22 Me object withlog(Z/Ze)=0.03, and effective temperature of 4100–4200K, has a surface gravity of log(g)=7.12, MV ∼15 mag, B−V∼1.04 mag, and J−K ∼ 0.2 mag. For comparison, the colorsof WD J0205−053 from Bergeron et al. (2005) areB−V=1.32 mag and J−K=0.1 mag, not too diifferentfrom those of the above Althaus et al. (2009) model whitedwarf. A binary of this white dwarf and an M7 dwarf results ina shift of J−K toward the blue of ∼0.07 mag, relative to anM7 dwarf. This shift is larger than for WD J0205−053, andcomparable to that seen in WISEA 0615−1247 (∼0.06 mag,Section 3.2).
3.3. Other Possible Hypotheses
Other scenarios we explored are as follows.
1. A triple system composed of two late-M dwarfs and acool white dwarf. It is possible that a third component, inaddition to the binary system we discussed inSection 3.2.2, can improve the spectral fit to our data,such as in covering the flux deficit we currently see in theinterval 6200–7300 Å. If this third component is an sdM,esdM, or usdM, it would have to have been captured,because its low metallicity is disparate from the presenceof TiO lines in our spectra. It is possible that an sdM,esdM, or usdM can improve the spectral fit in the near-infrared. Figure 5 shows that an M7 dwarf spectrumyields flux deficits at 9700–11000 Å and 11500–13000 Å,as well as a bluer slope at 15000–16500 Å, and/or adeficit at 16800 Å, relative to WISEA 0615−1247. Therelative flux contribution of an sdM, esdM, or usdM in amultiple system, that would alleviate these shortcomings,is difficult to assess. However, as described at the end ofSection 3.1, an sdM, esdM, or usdM is not a good fit tothe optical red spectrum of WISEA 0615−1247, and suchremains the case regardless of the flux ratios in a multiplesystem. The bulk of the flux contribution in the opticalred would have to be from an M7 dwarf.
2. There could be unusual chromospheric activity in a singleor multiple stellar system. We would have expectedemission features, in contrast to the pronounced andbroadened Na I D absorption that we see. The UT 2014October 24 spectrum exhibits modest Hα and Hβ lines,that might indicate some level of this kind of activity.However, white-light flare events in active M dwarfs,which occur due to strong magnetic fields, produce much
20 See the online tabulation of models of white dwarfs by Althaus et al. (2009)at: http://evolgroup.fcaglp.unlp.edu.ar/TRACKS/tracks_heliumcore.html.
9
The Astrophysical Journal, 832:62 (11pp), 2016 November 20 Fajardo-Acosta et al.
stronger H Balmer series lines than seen in our object(Kowalski et al. 2010 and references therein), and there isno Na I D absorption.
4. CONCLUSIONS
We propose that WISEA 0615−1247 is an unresolvedbinary consisting of an M7 dwarf and a cool white dwarf, thelatter having an SED unlike any other cool white dwarfcurrently known. We speculate that the cool white dwarfproduces the observed Na I D absorption feature, if Naabundance is high, and if pressure broadening is less than inother known cool white dwarfs. Additional studies of thisfascinating system are warranted, including an accuratetrigonometric parallax measurement.
We thank our referee, Derek Homeier, for suggestions andcorrections that greatly improved the manuscript. We alsothank Hugh Harris and Samir Salim for very useful discussionsthat greatly benefited this paper, and Samir Salim for allowingus to use unpublished data. This publication makes use of dataproducts from WISE, which is a joint project of the Universityof California, Los Angeles, and the Jet Propulsion Laboratory(JPL)/California Institute of Technology (Caltech), funded bythe National Aeronautics and Space Administration (NASA).This research has made use of the NASA/Infrared Processingand Analysis Center (IPAC) Infrared Science Archive, which isoperated by JPL/Caltech, under contract with NASA. Thispublication also makes use of data products from the TwoMicron All Sky Survey, which is a joint project of theUniversity of Massachusetts and IPAC/Caltech, funded byNASA and the National Science Foundation (NSF). TheDENIS project has been partly funded by the SCIENCE andthe HCM plans of the European Commission under grantsCT920791 and CT940627. It is supported by INSU, MEN, andCNRS in France, by the State of Baden-Württemberg inGermany, by DGICYT in Spain, by CNR in Italy, byFFwFBWF in Austria, by FAPESP in Brazil, by OTKA grantsF-4239 and F-013990 in Hungary, and by the ESO C&EEgrant A-04-046. Funding for the SDSS and SDSS-II has beenprovided by the Alfred P. Sloan Foundation, the ParticipatingInstitutions, NSF, the U.S. Department of Energy, NASA, theJapanese Monbukagakusho, the Max Planck Society, and theHigher Education Funding Council for England. The SDSSWeb Site is http://www.sdss.org/. The SDSS is managed bythe Astrophysical Research Consortium for the ParticipatingInstitutions. The Participating Institutions are the AmericanMuseum of Natural History, Astrophysical Institute Potsdam,University of Basel, University of Cambridge, Case WesternReserve University, University of Chicago, Drexel University,Fermilab, the Institute for Advanced Study, the JapanParticipation Group, Johns Hopkins University, the JointInstitute for Nuclear Astrophysics, the Kavli Institute forParticle Astrophysics and Cosmology, the Korean ScientistGroup, the Chinese Academy of Sciences (LAMOST), LosAlamos National Laboratory, the Max-Planck-Institute forAstronomy (MPIA), the Max-Planck-Institute for Astrophysics(MPA), New Mexico State University, Ohio State University,University of Pittsburgh, University of Portsmouth, PrincetonUniversity, the United States Naval Observatory, and theUniversity of Washington. The Digitized Sky Surveys wereproduced at the Space Telescope Science Institute under U.S.
Government grant NAG W-2166. The images of these surveysare based on photographic data obtained using the OschinSchmidt Telescope on Palomar Mountain and the UK SchmidtTelescope. The plates were processed into the presentcompressed digital form with the permission of theseinstitutions.
APPENDIXMISIDENTIFICATION OF THE WHITE DWARFWD 2213+317 AS WISEA 221515.51+315731.9
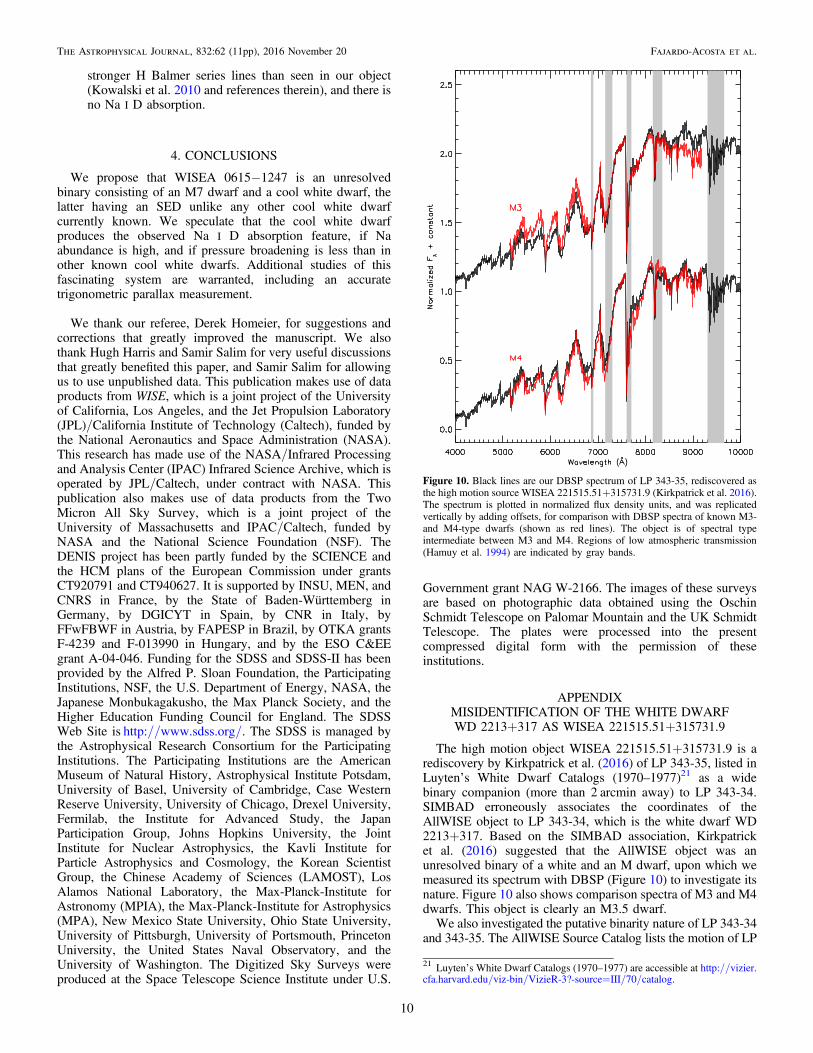
The high motion object WISEA 221515.51+315731.9 is arediscovery by Kirkpatrick et al. (2016) of LP 343-35, listed inLuyten’s White Dwarf Catalogs (1970–1977)21 as a widebinary companion (more than 2 arcmin away) to LP 343-34.SIMBAD erroneously associates the coordinates of theAllWISE object to LP 343-34, which is the white dwarf WD2213+317. Based on the SIMBAD association, Kirkpatricket al. (2016) suggested that the AllWISE object was anunresolved binary of a white and an M dwarf, upon which wemeasured its spectrum with DBSP (Figure 10) to investigate itsnature. Figure 10 also shows comparison spectra of M3 and M4dwarfs. This object is clearly an M3.5 dwarf.We also investigated the putative binarity nature of LP 343-34
and 343-35. The AllWISE Source Catalog lists the motion of LP
Figure 10. Black lines are our DBSP spectrum of LP 343-35, rediscovered asthe high motion source WISEA 221515.51+315731.9 (Kirkpatrick et al. 2016).The spectrum is plotted in normalized flux density units, and was replicatedvertically by adding offsets, for comparison with DBSP spectra of known M3-and M4-type dwarfs (shown as red lines). The object is of spectral typeintermediate between M3 and M4. Regions of low atmospheric transmission(Hamuy et al. 1994) are indicated by gray bands.
21 Luyten’s White Dwarf Catalogs (1970–1977) are accessible at http://vizier.cfa.harvard.edu/viz-bin/VizieR-3?-source=III/70/catalog.
10
The Astrophysical Journal, 832:62 (11pp), 2016 November 20 Fajardo-Acosta et al.

343-35 as R.A. motion=−54±39mas yr−1 and decl.motion=−186±35mas yr−1. The displacement of the objectbetween its 2MASS and AllWISE positions yieldsμα=3.3±6.4 mas yr−1 and μδ=−111.8±6.3 mas yr−1
(Kirkpatrick et al. 2016), in rough agreement (within 3σ) withthe AllWISE catalog motion. The object LP 343-34=2MASSJ22150696+3158402=LSPM 2215+3158 (Lépine & Shara2005) must be the white dwarf WD 2213+317. Its listed propermotions in the LSPM-N Catalog are μα=−47mas yr−1, andμδ=−149 mas yr−1 (Lépine & Shara 2005). Luyten’s WhiteDwarf Catalogs (1970–1977) list a total motion of 128mas yr−1
at P.A.=188°, consistent with the above. Our measurementof proper motion from the displacement between the 2MASSand AllWISE positions of LP 343-34 is μα=−135.3±29.8mas yr−1, and μδ=−226.8±31.8mas yr−1, in agree-ment, within 3σ, with the LSPM-N and Luyten’s Catalogs.The latter described LP 343-34 and 343-35 as a common-propermotion binary. However, the motions of the two objects aredistinct, as can be seen by comparing the 2MASS-to-AllWISE-derived values. Therefore, the white dwarf WD 2213+317 andour discovered M3.5 dwarf are not physically associated.
REFERENCES
Abel, M., Frommhold, L., Li, X., & Hunt, K. L. C. 2011, JPCA, 115, 6805Althaus, L. G., Panei, J. A., Romero, A. D., et al. 2009, A&A, 502, 207Bergeron, P., Ruiz, M. T., Hamuy, M., et al. 2005, ApJ, 625, 838Borysow, A., Jorgensen, U. G., & Zheng, C. 1997, A&A, 324, 185Burgasser, A. J. 2014, in ASI Conf. Ser. 11, Int. Workshop on Stellar Spectral
Libraries, ed. H. P. Singh, P. Prugniel, & I. Vauglin (Bengaluru: ASI), 7Carney, B., & Latham, D. 1987, in IAU Symp. 117, Dark Matter in the
Universe, ed. J. Kormendy & G. Knapp (Dordrecht: Reidel), 39Cushing, M. C., Vacca, W. D., & Rayner, J. T. 2004, PASP, 116, 362Gizis, J. 1997, AJ, 113, 806Hamuy, M., Suntzeff, N. B., Heathcote, S. R., et al. 1994, PASP, 106, 566Hansen, B. M. S. 1998, Natur, 394, 860Harris, H. C., Dahn, C. C., Vrba, F. J., et al. 1999, ApJ, 524, 1000Harris, H. C., Hansen, B. M. S., Liebert, J., et al. 2001, ApJL, 549, L109Harris, H. C., Liebert, J., Kleinman, S. J., et al. 2003, AJ, 126, 1023Hawley, S. L., Covey, K. R., Knapp, G. R., et al. 2002, AJ, 123, 3409
Kilic, M., Kowalski, P. M., Reach, W. T., & von Hippel, T. 2009, ApJ,696, 2094
Kilic, M., von Hippel, T., Mullally, F., et al. 2006, ApJ, 642, 1051Kirkpatrick, J. D. 2009, in Stellar Spectral Classification, ed. R. O. Gray &
C. J. Corbally (Princeton: Princeton Univ. Press), 339Kirkpatrick, J. D., Cruz, K. L., Barman, T. S., et al. 2008, ApJ, 689, 1295Kirkpatrick, J. D., Cushing, M. C., Gelino, C. R., et al. 2011, ApJS, 197, 19Kirkpatrick, J. D., Kellogg, K., Schneider, A., et al. 2016, ApJ, 224, 36Kirkpatrick, J. D., Reid, I. N., Liebert, J., et al. 2000, AJ, 120, 447Kirkpatrick, J. D., Schneider, A., Fajardo-Acosta, S., et al. 2014, ApJ, 783, 122Kowalski, A. F., Hawley, S. L., Holtzman, J. A., Wisniewski, J. P., &
Hilton, E. J. 2010, ApJL, 714, L98Kowalski, P. M., & Saumon, D. 2006, ApJ, 651, 137Lépine, S. 2008, AJ, 135, 2177Lépine, S., Rich, M., & Shara, M. 2003, AJ, 125, 1598Lépine, S., Rich, M., & Shara, M. 2007, ApJ, 669, 1235Lépine, S., & Shara, M. M. 2005, AJ, 129, 1483Luyten, W. J. 1976, A Catalogue of Stars with Proper Motions Exceeding 0.5″
Annually (Minneapolis, MN: Univ. Minnesota Press)Mermilliod, J.-C., Mermilliod, M., & Hauck, B. 1997, A&AS, 124, 349Oke, J. B., Cohen, J. G., Carr, M., et al. 1995, PASP, 107, 375Oke, J. B., & Gunn, J. E. 1982, PASP, 94, 586Oppenheimer, B. R., Hambly, N. C., Digby, A. P., Hodgkin, S. T., &
Saumon, D. 2001, Sci, 292, 698Pecaut, M. J., & Mamajek, E. E. 2013, ApJS, 208, 9Rayner, J. T., Cushing, M. C., & Vacca, W. D. 2009, ApJS, 185, 289Rayner, J. T., Toomey, D. W., Onaka, P. M., et al. 2003, PASP, 115, 362Reid, I. N., & Hawley, S. L. 2005, New Light on Dark Stars, Red Dwarfs,
Low-Mass Stars, Brown Dwarfs (Chichester: Springer-Praxis)Reid, I. N., Kirkpatrick, J. D., Gizis, J. E., et al. 2000, AJ, 119, 369Reid, N. 1997, in ASP Conf. Ser. 127, In Proper Motions and Galactic
Astronomy, ed. R. M. Humphreys (San Francisco, CA: ASP), 63Ryan, S. G., & Norris, J. E. 1991, AJ, 101, 1835Salim, S., & Gould, A. 2003, ApJ, 582, 1011Salim, S., Rich, R. M., Hansen, B. M., et al. 2004, ApJ, 601, 1075Saumon, D., Bergeron, P., Lunine, J. I., Hubbard, W. B., & Burrows, A. 1994,
ApJ, 424, 333Savcheva, A. S., West, A. A., & Bochanski, J. J. 2014, ApJ, 794, 145Scholz, R.-D., Storm, J., Knapp, G. R., & Zinnecker, H. 2009, A&A, 494, 949Skrutskie, M. F. 1997, in The Impact of Large Scale Near-IR Sky Surveys, ed.
F. Garzon et al. (Dordrecht: Kluwer), 25Tremblay, P. E., & Bergeron, P. 2008, ApJ, 672, 1144Vacca, W. D., Cushing, M. C., & Rayner, J. T. 2003, PASP, 115, 389Wright, E. L., Eisenhardt, P. R. M., Mainzer, A. K., et al. 2010, AJ, 140, 1868York, D. G., Adelman, J., Anderson, J. E., et al. 2000, AJ, 120, 1579
11
The Astrophysical Journal, 832:62 (11pp), 2016 November 20 Fajardo-Acosta et al.


![arXiv:1504.00662v2 [astro-ph.SR] 19 Aug 2015 · companion white dwarf (0.286±0.012 M ... wide binary orbit with a white dwarf companion (Section 3). The pulse arrival times of the](https://static.fdocuments.in/doc/165x107/5b59e21b7f8b9a4e1b8dcfa3/arxiv150400662v2-astro-phsr-19-aug-2015-companion-white-dwarf-02860012.jpg)
