Discontinuous Preference for Certainty and Insurance Demand: Results from a Framed Field Experiment...
28
Discontinuous Preference for Certainty and Insurance Demand: Results From a Framed Field Experiment in Burkina Faso Elena Serfilippi 1 Michael R Carter 2 Catherine Guirkinger 1 1 University of Namur 2 University of California, Davis & NBER November 8, 2015 Serfilippi, Carter & Guirkinger Certainty Preference
-
Upload
basis-ama-innovation-lab -
Category
Government & Nonprofit
-
view
135 -
download
2
Transcript of Discontinuous Preference for Certainty and Insurance Demand: Results from a Framed Field Experiment...
Discontinuous Preference for Certainty andInsurance Demand:
Results From a Framed Field Experiment in Burkina Faso
Elena Serfilippi1
Michael R Carter2
Catherine Guirkinger1
1University of Namur2University of California, Davis & NBER
November 8, 2015
Serfilippi, Carter & Guirkinger Certainty Preference
Logic of Insurance as a Development Tool
Decades of evidence that risk
Makes people poor by reducing incomes & destroying assets;and,Keeps people poor, by discouraging investment & distortingpatterns of asset accumulation)
The development impacts of risk reduction through insuranceshould therefore be significant:
By protecting households against the worst consequences ofadverse climatic shocks, index insurance should in principalallow households to prudentially invest more in risky, but highreturning agricultural activities.That is, if insurance has ex post protection effects, then itshould also have ex ante investment effects
Serfilippi, Carter & Guirkinger Certainty Preference
Evidence on Insurance Impacts
Evidence on the ex ante and ex post effects is just emerging:
Satellite-based Livestock Insurance (IBLI) protectedconsumption (for poorer households) and assets (for less poorhouseholds) after a drought in Northern Kenya (Janzen &Carter 2014)’Two-trigger’ area yield contract in Mali induced 30% increasesin borrowing and cotton plantings by small-scale farmers(Elabed & Carter 2014)Karlan et al. study in Ghana finds impacts of a similar order ofmagnitude
But despite this evidence, insurance demand is in many pilotshas been sluggish (see for example (Gine and Yang, 2009; Coleet. al., 2013; Hill and Robles, 2011, Dercon et al. 2011)
Serfilippi, Carter & Guirkinger Certainty Preference
Behavioral Economics Insights into Insurance Demand
Multiple conventional (EU-compliant) explanations for thissluggish demand:
Understanding and trustPricingContract quality
While insurance demand often approached through the lens ofstandard expected utility theory (Clarke, forthcoming), decadesof behavioral experiments suggest systematic deviationsbetween actual behavior and expected utility theoryWe have begun to see the application of behavioral insights tothe demand for insurance:
Petruad 2014 utilizes the Prospect Theory of Kahneman andTversky,1979 to study insurance preferences & demandElabed & Carter (2015) and Bryan (2014) similarly utilize thenotion of Ambiguity Aversion of Ellsberg (1961)
Today explore Andreoni and Sprenger’s (2009; 2012)“Discontinuous Preference for Certainty” and its implicationsfor insurance contract design & demandSerfilippi, Carter & Guirkinger Certainty Preference
Outline for Today
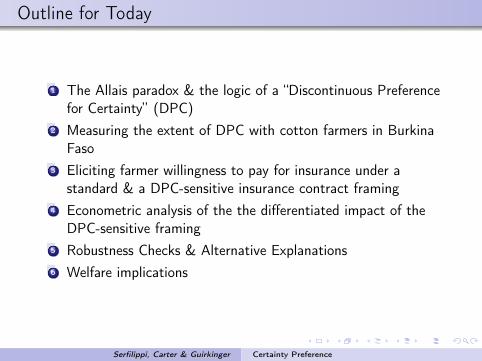
1 The Allais paradox & the logic of a “Discontinuous Preferencefor Certainty” (DPC)
2 Measuring the extent of DPC with cotton farmers in BurkinaFaso
3 Eliciting farmer willingness to pay for insurance under astandard & a DPC-sensitive insurance contract framing
4 Econometric analysis of the the differentiated impact of theDPC-sensitive framing
5 Robustness Checks & Alternative Explanations6 Welfare implications
Serfilippi, Carter & Guirkinger Certainty Preference
The Allais Paradox
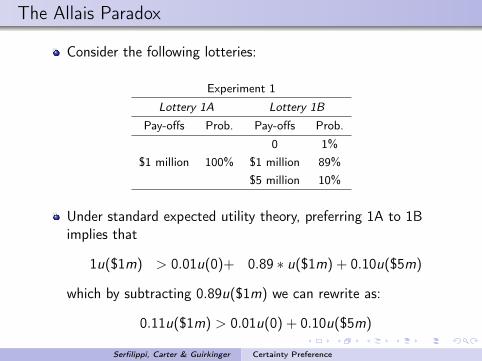
Consider the following lotteries:
Experiment 1
Lottery 1A Lottery 1B
Pay-offs Prob. Pay-offs Prob.
0 1%$1 million 100% $1 million 89%
$5 million 10%
Under standard expected utility theory, preferring 1A to 1Bimplies that
1u($1m) > 0.01u(0)+ 0.89 ∗ u($1m) + 0.10u($5m)
which by subtracting 0.89u($1m) we can rewrite as:
0.11u($1m) > 0.01u(0) + 0.10u($5m)
Serfilippi, Carter & Guirkinger Certainty Preference

The Allais Paradox
Now consider the following alternative lotteries:
Experiment 2
Lottery 2A Lottery 2B
Pay-offs Prob. Pay-offs Prob.
0 89% 0 90%$1 million 11%
$5 million 10%
Under standard expected utility theory, preferring 2B to 2Aimplies that
0.89u(0) + 0.11u($1m) < 0.90 ∗ u(0) + 0.10u($5m)
which by subtracting 0.89u(0) we can rewrite as:
0.11u($1m) < 0.01u(0) + 0.10u($5m)
which of course directly contradicts prior resultSerfilippi, Carter & Guirkinger Certainty Preference

The Allais Paradox
So what explains this fatal (for EU theory) attraction toLottery 1A?
Experiment 1 Experiment 2
Lottery 1A Lottery 1B Lottery 2A Lottery 2B
Pay-offs Prob. Pay-offs Prob. Pay-offs Prob. Pay-offs Prob.
0 1% 0 89% 0 90%$1 million 100% $1 million 89% $1 million 11%
$5 million 10% $5 million 10%
Prospect theory manages this departure from expected utilitytheory with a probability weighting function that overweightssmall probabilities relative to their objective likelihood
Serfilippi, Carter & Guirkinger Certainty Preference
The Allais Paradox
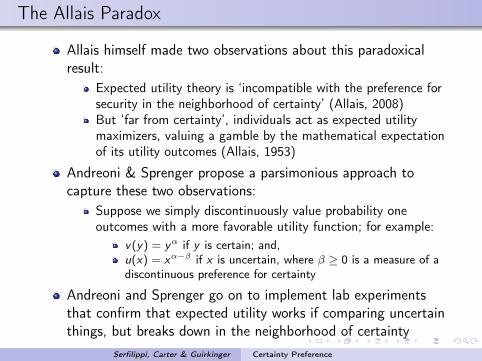
Allais himself made two observations about this paradoxicalresult:
Expected utility theory is ‘incompatible with the preference forsecurity in the neighborhood of certainty’ (Allais, 2008)But ‘far from certainty’, individuals act as expected utilitymaximizers, valuing a gamble by the mathematical expectationof its utility outcomes (Allais, 1953)
Andreoni & Sprenger propose a parsimonious approach tocapture these two observations:
Suppose we simply discontinuously value probability oneoutcomes with a more favorable utility function; for example:
v(y) = yα if y is certain; and,u(x) = xα−β if x is uncertain, where β ≥ 0 is a measure of adiscontinuous preference for certainty
Andreoni and Sprenger go on to implement lab experimentsthat confirm that expected utility works if comparing uncertainthings, but breaks down in the neighborhood of certainty
Serfilippi, Carter & Guirkinger Certainty Preference
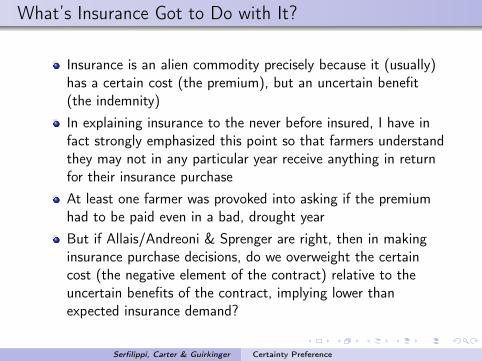
What’s Insurance Got to Do with It?
Insurance is an alien commodity precisely because it (usually)has a certain cost (the premium), but an uncertain benefit(the indemnity)In explaining insurance to the never before insured, I have infact strongly emphasized this point so that farmers understandthey may not in any particular year receive anything in returnfor their insurance purchaseAt least one farmer was provoked into asking if the premiumhad to be paid even in a bad, drought yearBut if Allais/Andreoni & Sprenger are right, then in makinginsurance purchase decisions, do we overweight the certaincost (the negative element of the contract) relative to theuncertain benefits of the contract, implying lower thanexpected insurance demand?
Serfilippi, Carter & Guirkinger Certainty Preference

What’s Insurance Got to Do with It?
The Andreoni & Sprenger formulation does not adapt easily topayoff structures that include certain and uncertain thing, butconsider the following variant which preserves their intuition:
w(x , y) = (αy+x)1−γ
1−γ where y is certain and x is uncertain andα ≥ 1In this ’bird in the hand is worth two in the bush’ specification,α is the constant marginal rate of substitution of a uncertainfor a certain dollar
Relative to expected utility (with α = 1), this formulationwould lead to an undervaluation of insurance (with α > 1),unless the premium could itself be made uncertain ...
Serfilippi, Carter & Guirkinger Certainty Preference
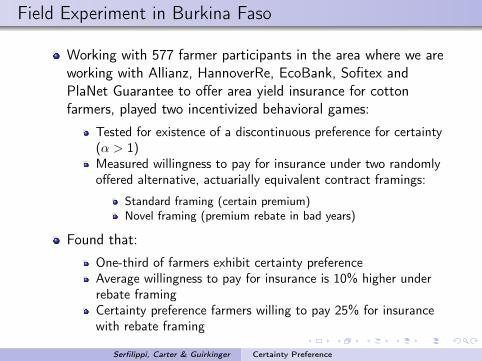
Field Experiment in Burkina Faso
Working with 577 farmer participants in the area where we areworking with Allianz, HannoverRe, EcoBank, Sofitex andPlaNet Guarantee to offer area yield insurance for cottonfarmers, played two incentivized behavioral games:
Tested for existence of a discontinuous preference for certainty(α > 1)Measured willingness to pay for insurance under two randomlyoffered alternative, actuarially equivalent contract framings:
Standard framing (certain premium)Novel framing (premium rebate in bad years)
Found that:
One-third of farmers exhibit certainty preferenceAverage willingness to pay for insurance is 10% higher underrebate framingCertainty preference farmers willing to pay 25% for insurancewith rebate framing
Serfilippi, Carter & Guirkinger Certainty Preference
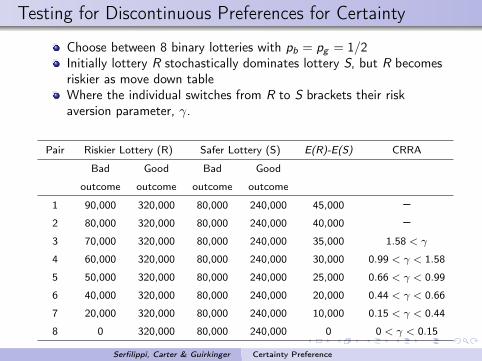
Testing for Discontinuous Preferences for Certainty
Choose between 8 binary lotteries with pb = pg = 1/2Initially lottery R stochastically dominates lottery S, but R becomesriskier as move down tableWhere the individual switches from R to S brackets their riskaversion parameter, γ.
Pair Riskier Lottery (R) Safer Lottery (S) E(R)-E(S) CRRA
Bad Good Bad Good
outcome outcome outcome outcome
1 90,000 320,000 80,000 240,000 45,000 –2 80,000 320,000 80,000 240,000 40,000 –3 70,000 320,000 80,000 240,000 35,000 1.58 < γ
4 60,000 320,000 80,000 240,000 30,000 0.99 < γ < 1.58
5 50,000 320,000 80,000 240,000 25,000 0.66 < γ < 0.99
6 40,000 320,000 80,000 240,000 20,000 0.44 < γ < 0.66
7 20,000 320,000 80,000 240,000 10,000 0.15 < γ < 0.44
8 0 320,000 80,000 240,000 0 0 < γ < 0.15
Note that those who switch at row 2 appear as quasi-Gneezy et al.(2006) type players who value a risky prospects by less than itsworst possible realization
Serfilippi, Carter & Guirkinger Certainty Preference

Playing the Game
Serfilippi, Carter & Guirkinger Certainty Preference
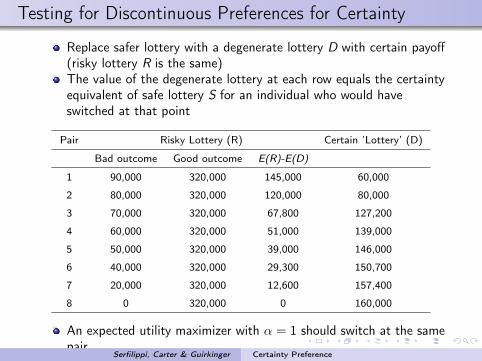
Testing for Discontinuous Preferences for Certainty
Replace safer lottery with a degenerate lottery D with certain payoff(risky lottery R is the same)The value of the degenerate lottery at each row equals the certaintyequivalent of safe lottery S for an individual who would haveswitched at that point
Pair Risky Lottery (R) Certain ’Lottery’ (D)
Bad outcome Good outcome E(R)-E(D)
1 90,000 320,000 145,000 60,000
2 80,000 320,000 120,000 80,000
3 70,000 320,000 67,800 127,200
4 60,000 320,000 51,000 139,000
5 50,000 320,000 39,000 146,000
6 40,000 320,000 29,300 150,700
7 20,000 320,000 12,600 157,400
8 0 320,000 0 160,000
An expected utility maximizer with α = 1 should switch at the samepair
Serfilippi, Carter & Guirkinger Certainty Preference
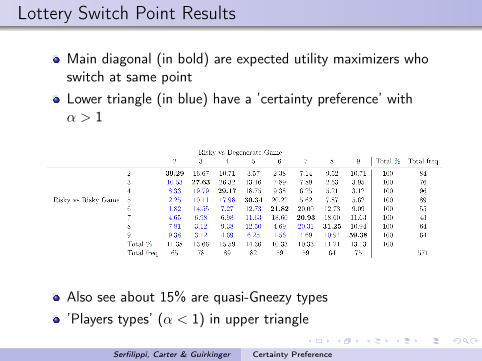
Lottery Switch Point Results
Main diagonal (in bold) are expected utility maximizers whoswitch at same pointLower triangle (in blue) have a ’certainty preference’ withα > 1
Also see about 15% are quasi-Gneezy types’Players types’ (α < 1) in upper triangle
Serfilippi, Carter & Guirkinger Certainty Preference
Prevalence of DPC Preferences
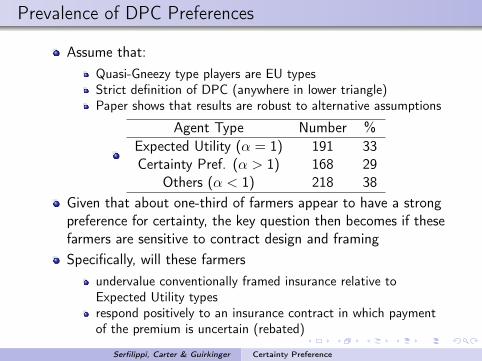
Assume that:Quasi-Gneezy type players are EU typesStrict definition of DPC (anywhere in lower triangle)Paper shows that results are robust to alternative assumptions
Agent Type Number %Expected Utility (α = 1) 191 33Certainty Pref. (α > 1) 168 29
Others (α < 1) 218 38Given that about one-third of farmers appear to have a strongpreference for certainty, the key question then becomes if thesefarmers are sensitive to contract design and framingSpecifically, will these farmers
undervalue conventionally framed insurance relative toExpected Utility typesrespond positively to an insurance contract in which paymentof the premium is uncertain (rebated)
Serfilippi, Carter & Guirkinger Certainty Preference

Insurance Game
Game was set up to closely mimic farmer’s reality:
1 hectare of land to use to cultivate cottonStochastic yields with 1200 kg of cotton in good year (80%probability) & 600 kg in bad year.Cotton price & input costs set at realistic levelsEndowed with a certain savings of 50,000
Good Year Bad YearNet Revenue 188,000 44,000
Certain Wealth Endowment 50,000 50,000Family Money 238,000 94,000
0.8w(α50, 000+ 188, 000) + 0.2w(α50, 000+ 44, 000)
Serfilippi, Carter & Guirkinger Certainty Preference
Insurance Game
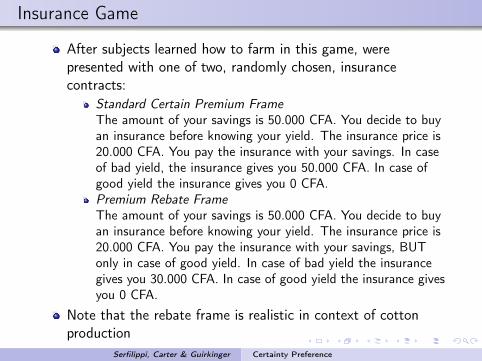
After subjects learned how to farm in this game, werepresented with one of two, randomly chosen, insurancecontracts:
Standard Certain Premium FrameThe amount of your savings is 50.000 CFA. You decide to buyan insurance before knowing your yield. The insurance price is20.000 CFA. You pay the insurance with your savings. In caseof bad yield, the insurance gives you 50.000 CFA. In case ofgood yield the insurance gives you 0 CFA.Premium Rebate FrameThe amount of your savings is 50.000 CFA. You decide to buyan insurance before knowing your yield. The insurance price is20.000 CFA. You pay the insurance with your savings, BUTonly in case of good yield. In case of bad yield the insurancegives you 30.000 CFA. In case of good yield the insurance givesyou 0 CFA.
Note that the rebate frame is realistic in context of cottonproduction
Serfilippi, Carter & Guirkinger Certainty Preference
Insurance Game
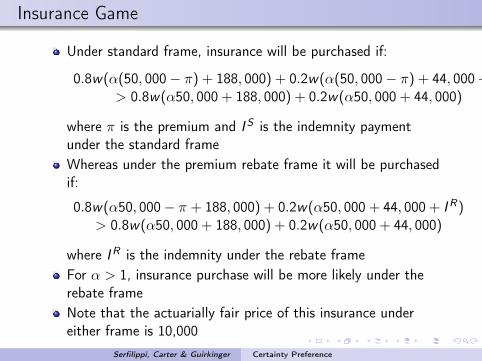
Under standard frame, insurance will be purchased if:
0.8w(α(50, 000− π) + 188, 000) + 0.2w(α(50, 000− π) + 44, 000+ I )> 0.8w(α50, 000+ 188, 000) + 0.2w(α50, 000+ 44, 000)
where π is the premium and I S is the indemnity paymentunder the standard frameWhereas under the premium rebate frame it will be purchasedif:
0.8w(α50, 000− π + 188, 000) + 0.2w(α50, 000+ 44, 000+ IR)> 0.8w(α50, 000+ 188, 000) + 0.2w(α50, 000+ 44, 000)
where IR is the indemnity under the rebate frameFor α > 1, insurance purchase will be more likely under therebate frameNote that the actuarially fair price of this insurance undereither frame is 10,000
Serfilippi, Carter & Guirkinger Certainty Preference

Willingness to Pay for Insurance
Mimicked the structure of prior games as closely as possibleStarted with an initial pair where insurance was priced at50,000 so that no insurance was the dominant choiceIn each subsequent pair, insurance price was dropped (withprices of 30.000; 25.000; 20.000; 15.000; 10.000; 5000; 0)Farmer chose whether and when to switch to the ’safer’insurance optionUnder standard expected utility theory, risk averse agent wouldbe expected to purchase insurance at some price in excess of10,000 irrespective of frameNever purchasing insurance was an option
Serfilippi, Carter & Guirkinger Certainty Preference
Results
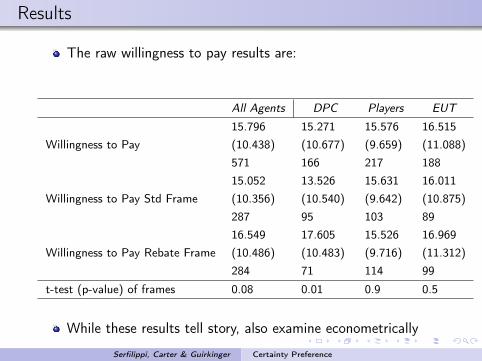
The raw willingness to pay results are:
All Agents DPC Players EUT
Willingness to Pay15.796 15.271 15.576 16.515(10.438) (10.677) (9.659) (11.088)571 166 217 188
Willingness to Pay Std Frame15.052 13.526 15.631 16.011(10.356) (10.540) (9.642) (10.875)287 95 103 89
Willingness to Pay Rebate Frame16.549 17.605 15.526 16.969(10.486) (10.483) (9.716) (11.312)284 71 114 99
t-test (p-value) of frames 0.08 0.01 0.9 0.5
While these results tell story, also examine econometrically
Serfilippi, Carter & Guirkinger Certainty Preference

Tobit Estimates & Marginal Impact of Rebate Frame
Tobit Marginal Impacts
Rebate Frame105 -161
(1418) (1584)
Rebate Frame x DPC4262* 5374** 3838** 4576**
(2564) (2598) (1862) (1816)
Rebate Frame x EUT1279 1948 1237 1607
(2158) (2302) (1885) (1896)
Rebate Frame x Player – –93 -143
(1259) (1404)
DPC Type-2643 -3073*
(1767) (1830)
EUT Type-249 -58
(1596) (1709)
Order Effect3180 3566***
(1183) (1247)
Controls No Yes
Serfilippi, Carter & Guirkinger Certainty Preference
Robustness Checks
Paper explores two alternative definitions of those with adiscontinuous preference for certainty:
More restrictive definition of DPC (individual must haveshifted by 2 rows to count as DPC type)Counting quasi-Gneezy players as DPC
General character of results not changed by these alternativedefinitions
Serfilippi, Carter & Guirkinger Certainty Preference
Can Prospect Theory Also Explain Results?
Prospect theory has a lot of moving parts (which is one of itsless desirable features in opinion of Andreoni & Sprenger)Loss aversion & reference points
Preference for degenerate lottery if reference point whichdistinguishes gains & losses is between low & high outcomes ofthe risky lotterySimilarly, a carefully selected reference point could rationalize apreference for the rebate frame
Probability weighting functionProblem is that probabilities of good and bad outcomes areboth one half, so no simple or natural interpretation ofprobability weighting as the explanation for a Rebate FramepreferenceShow that using standard cumulative prospect theory tools(Prelec weighting function and rank-dependent utility) canidentify a set of parameters that will explain the choiceHowever, implies that one 50-50 choice interpreted as 20-80and vice versa for the other
Serfilippi, Carter & Guirkinger Certainty Preference
Welfare Gains from Rebate Frame
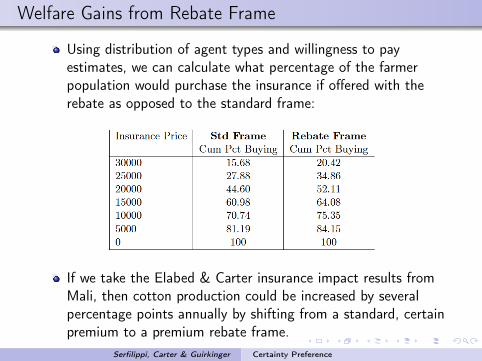
Using distribution of agent types and willingness to payestimates, we can calculate what percentage of the farmerpopulation would purchase the insurance if offered with therebate as opposed to the standard frame:
If we take the Elabed & Carter insurance impact results fromMali, then cotton production could be increased by severalpercentage points annually by shifting from a standard, certainpremium to a premium rebate frame.
Serfilippi, Carter & Guirkinger Certainty Preference
Conclusions
Results provide another example of the predictability of whatappears as irrationalities from the perspective of standardexpected utility theoryWhile our simple discontinuous preference for certainty modelmakes sense of these results, so to can a more convolutedversion of cumulative prospect theoryIrrespective about the interpretation, if this behavior is regularand predictable, then it does suggest a basis for an alternativeinsurance contract design that should meet with biggerdemand and have the potential to pick up some of the moneybeing left on the table every year by risk avoiding farmersWe hope to be able to test the rebate frame with a realcontract
Serfilippi, Carter & Guirkinger Certainty Preference
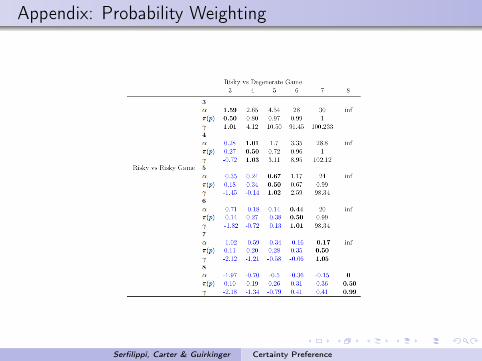
Appendix: Probability Weighting
Serfilippi, Carter & Guirkinger Certainty Preference