Disclosures of John Mascarenhas - ER Congressi · Disclosures of John Mascarenhas . New Drugs and...
43
Company name Research support Employee Consultant Stockholder Speakers bureau Advisory board Other Incyte X X Novartis X Promedior X CTI Biopharma X Roche X X Merck X Janssen Disclosures of John Mascarenhas
Transcript of Disclosures of John Mascarenhas - ER Congressi · Disclosures of John Mascarenhas . New Drugs and...
Company name
Researchsupport
Employee Consultant StockholderSpeakersbureau
Advisoryboard
Other
Incyte X X
Novartis X
Promedior X
CTI Biopharma
X
Roche X X
Merck X
Janssen
Disclosures of John Mascarenhas
New Drugs and Combination
Therapy Approaches in
Myeloproliferative Neoplasms
John Mascarenhas, MD
Associate Professor of Medicine
Icahn School of Medicine at Mount Sinai
Bologna 2018

Agenda
• SMAC Mimetic
• Activin Ligand Trap
• Telomerase Inhibitor
• Pentraxin-2 analogue
• TGF-β inhibitor
• MDM2 inhibitor
• Combination JAK inhibitor
– PI3K inhibitor
– BET inhibitor
(aggressivo)
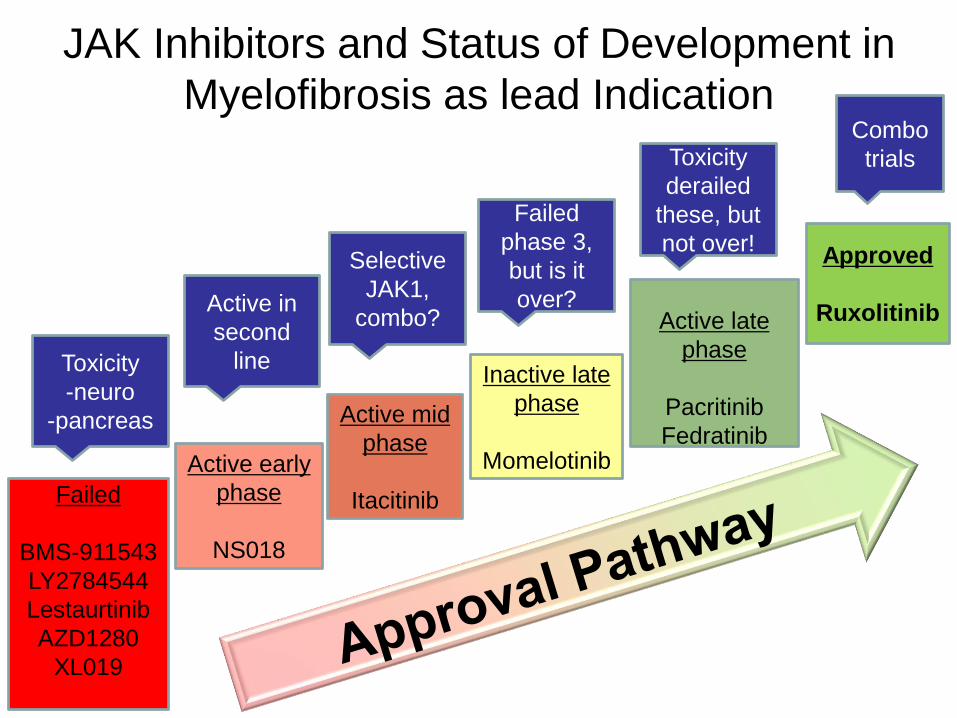
JAK Inhibitors and Status of Development in
Myelofibrosis as lead Indication
Approved
Ruxolitinib
Failed
BMS-911543
LY2784544
Lestaurtinib
AZD1280
XL019
Active late
phase
Pacritinib
Fedratinib
Inactive late
phase
MomelotinibActive early
phase
NS018
Active mid
phase
Itacitinib
Toxicity
-neuro
-pancreas
Active in
second
line
Selective
JAK1,
combo?
Failed
phase 3,
but is it
over?
Toxicity
derailed
these, but
not over!
Combo
trials

SMAC Mimetics
Bind to cIAP1, cIAP2, and XIAP
Cause rapid autoubiquitinylation
and proteasomal degradation of
cIAPs
Relieve caspase repression by
XIAP
XIAP SMAC
AVPI
Courtesy: Bing Carter, PhD
Heaton et al. Leuekmia. 2018 Apr 18

Day 1 D 8
1500 mg
D 15 D 22
1 cycle=28 days
BM bx=baseline
and at 3 months
D 29
If SD, then proceed to C2
LCL
DEX
Markers of apoptosis profile
Treatment Schema: LCL161 for MF
Primary Objectives:
1. To determine efficacy of LCL161 as therapy for PMF, post-
PV MF and post-ET MF
2. To determine objective response after 3 cycles of treatment Pemmaraju et al ASH 2017
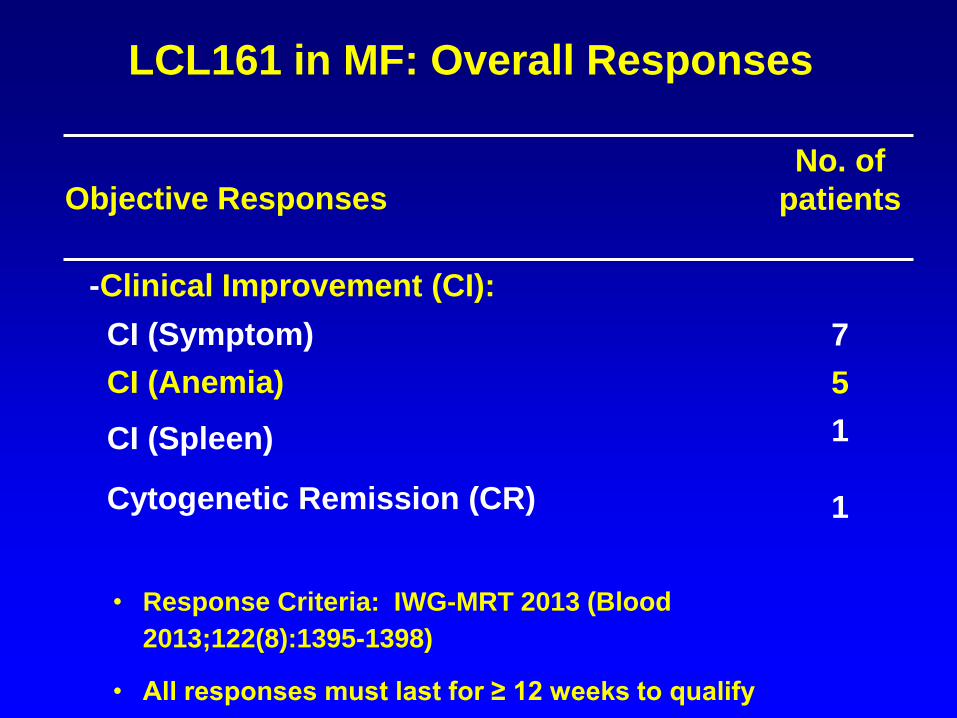
Objective Responses
No. of
patients
-Clinical Improvement (CI):
CI (Symptom) 7
CI (Anemia) 5
CI (Spleen)
Cytogenetic Remission (CR)
1
1
• Response Criteria: IWG-MRT 2013 (Blood
2013;122(8):1395-1398)
• All responses must last for ≥ 12 weeks to qualify
LCL161 in MF: Overall Responses
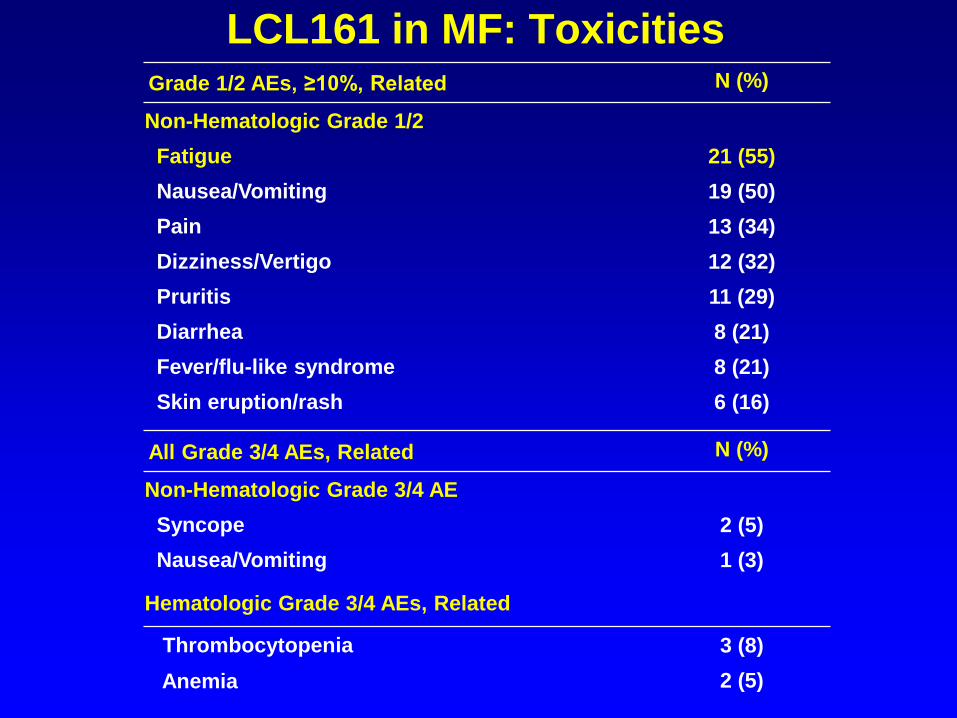
LCL161 in MF: ToxicitiesGrade 1/2 AEs, ≥10%, Related N (%)
Non-Hematologic Grade 1/2
Fatigue 21 (55)
Nausea/Vomiting 19 (50)
Pain 13 (34)
Dizziness/Vertigo 12 (32)
Pruritis 11 (29)
Diarrhea 8 (21)
Fever/flu-like syndrome 8 (21)
Skin eruption/rash 6 (16)
All Grade 3/4 AEs, Related N (%)
Non-Hematologic Grade 3/4 AE
Syncope 2 (5)
Nausea/Vomiting 1 (3)
Hematologic Grade 3/4 AEs, Related
Thrombocytopenia 3 (8)
Anemia 2 (5)

LCL161 in MF: On Target Reduction of CIAP1 in
Responding Patients
Pt #4 C1D1
C3D1
* *
pt#10 C1D1
C2D1
C3D1 **
#8 #11
C1D1
C2D1
C3D1
C1D1
C2D1*
XIAP
GAPDH
CIAP1
Total: 10 responders (N=2 lack of adequate samples and N=4 still under the treatment)
OCI-AML3, positive control . *, molecular weight markers
OCI- #14 KG #15 LHAML3 * C1 C2 C3 * C1 C2 C3
XIAP
GAPDH
CIAP1
NR/SD NR/SDNon-responders
#9 FH
C1 C2 C3 **
NR/SD

SOTATERCEPT
• A first-in-class activin
receptor IIA (ActRIIA)
“ligand trap”
• Fusion protein consisting of
the extracellular domain of
ActRIIA conjugated to the
Fc fragment of human IgG1
Sotatercept in MF
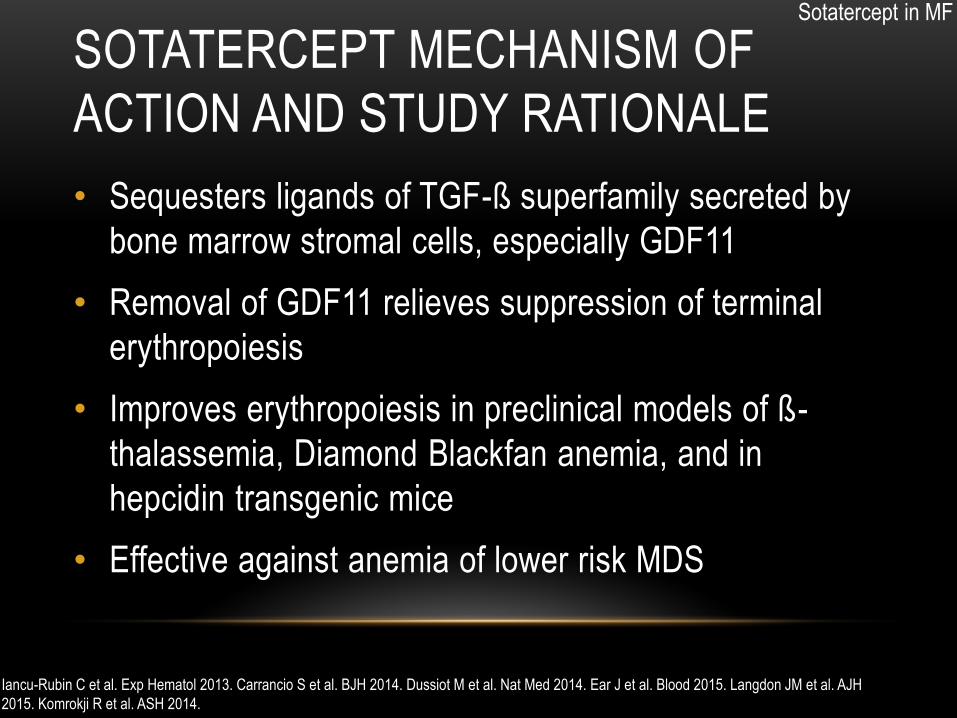
SOTATERCEPT MECHANISM OF
ACTION AND STUDY RATIONALE
• Sequesters ligands of TGF-ß superfamily secreted by
bone marrow stromal cells, especially GDF11
• Removal of GDF11 relieves suppression of terminal
erythropoiesis
• Improves erythropoiesis in preclinical models of ß-
thalassemia, Diamond Blackfan anemia, and in
hepcidin transgenic mice
• Effective against anemia of lower risk MDS
Iancu-Rubin C et al. Exp Hematol 2013. Carrancio S et al. BJH 2014. Dussiot M et al. Nat Med 2014. Ear J et al. Blood 2015. Langdon JM et al. AJH
2015. Komrokji R et al. ASH 2014.
Sotatercept in MF

PHASE II STUDY DESIGN PMF or post-PV/ET MF, Hgb <10 g/dL x ≥84 days
2 cohorts:
Sotatercept alone, 0.75 or 1 mg/kg SC q3w
Sotatercept 0.75 mg/kg SC q3w in subjects on stable dose of ruxolitinib
Response (on study x ≥84 days):
Anemic subjects: ≥1.5 g/dL ↑ from baseline x ≥84 d
Transfusion-dependent subjects: achievement of transfusion independence per IWG MRT 2013 criteria
Tefferi A et al. Blood 2013.
Sotatercept in MF

ADVERSE EVENTS POSSIBLY
RELATED TO SOTATERCEPT (N = 35)
Adverse event Grade No. of patients
Hypertension 3 3
2 2
Pain (joints/muscle) 3 1
2 1
1 1
Elevated UMACR 1 2
Limb edema 1 1
Headache (in the context
of HTN)
2 1
1 1
Nausea 1 1
Sotatercept in MF

MEAN HEMOGLOBIN OVER TIME IN
RESPONDERS (N=10)
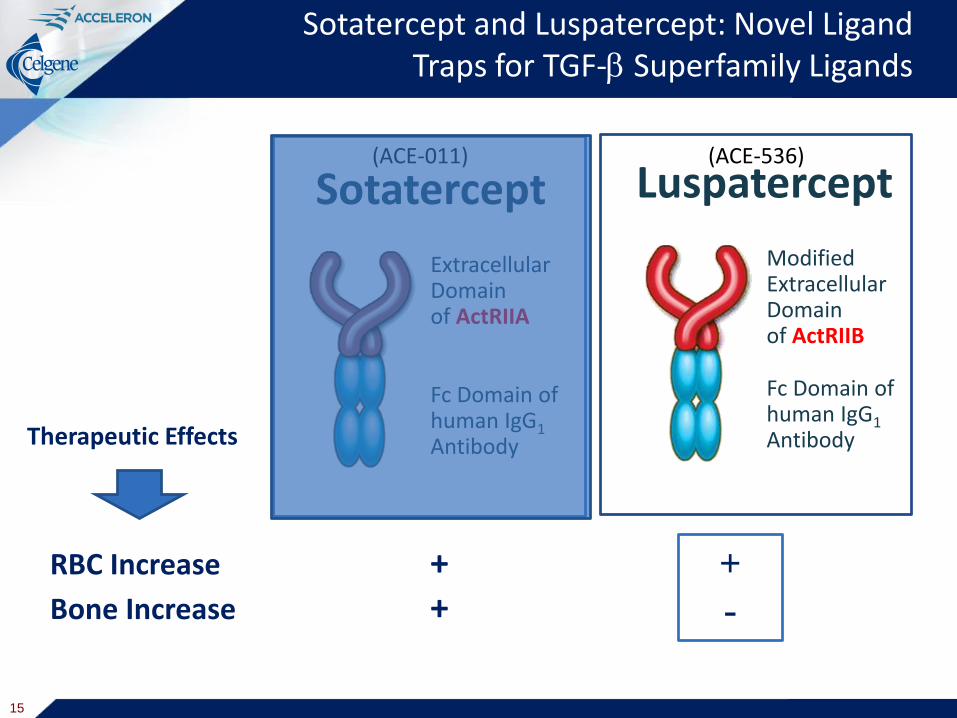
ModifiedExtracellularDomainof ActRIIB
Fc Domain of human IgG1Antibody
Luspatercept
Sotatercept and Luspatercept: Novel Ligand Traps for TGF- Superfamily Ligands
ExtracellularDomainof ActRIIA
Fc Domain of human IgG1Antibody
Sotatercept(ACE-011)
RBC Increase +Bone Increase +
(ACE-536)
Therapeutic Effects
15
+
-
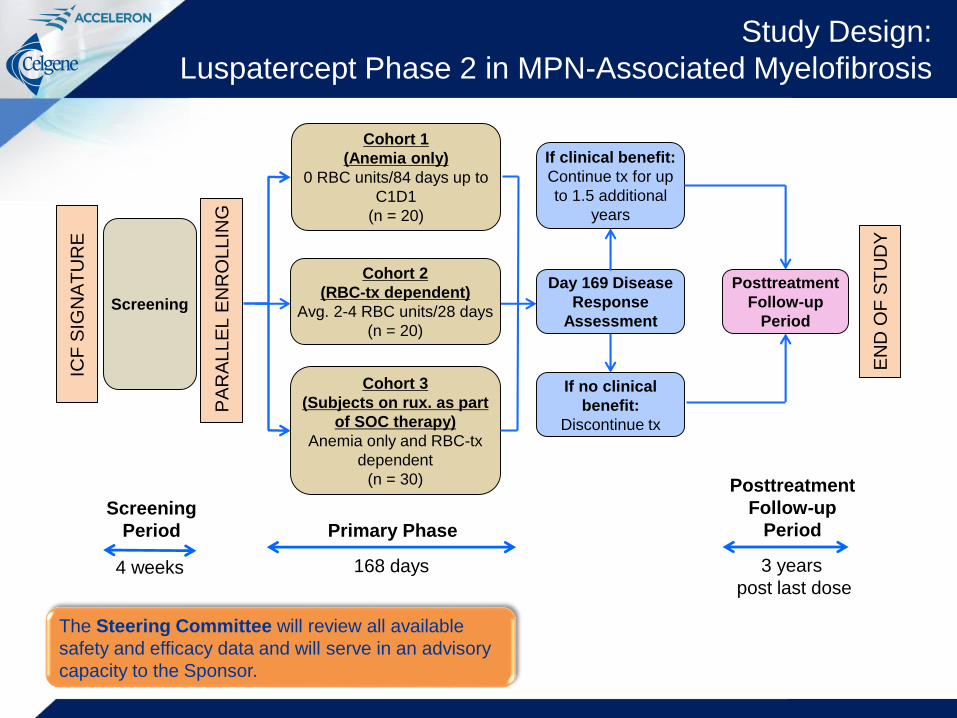
Study Design:
Luspatercept Phase 2 in MPN-Associated Myelofibrosis
PA
RA
LL
EL
EN
RO
LL
ING
ICF
SIG
NA
TU
RE
Screening
Screening
Period
4 weeks
Cohort 1
(Anemia only)
0 RBC units/84 days up to
C1D1
(n = 20)
Cohort 2
(RBC-tx dependent)
Avg. 2-4 RBC units/28 days
(n = 20)
Cohort 3
(Subjects on rux. as part
of SOC therapy)
Anemia only and RBC-tx
dependent
(n = 30)
Day 169 Disease
Response
Assessment
If clinical benefit:
Continue tx for up
to 1.5 additional
years
If no clinical
benefit:
Discontinue tx
Posttreatment
Follow-up
Period
Primary Phase
168 days
Posttreatment
Follow-up
Period
3 years
post last dose
EN
D O
F S
TU
DY
The Steering Committee will review all available
safety and efficacy data and will serve in an advisory
capacity to the Sponsor.
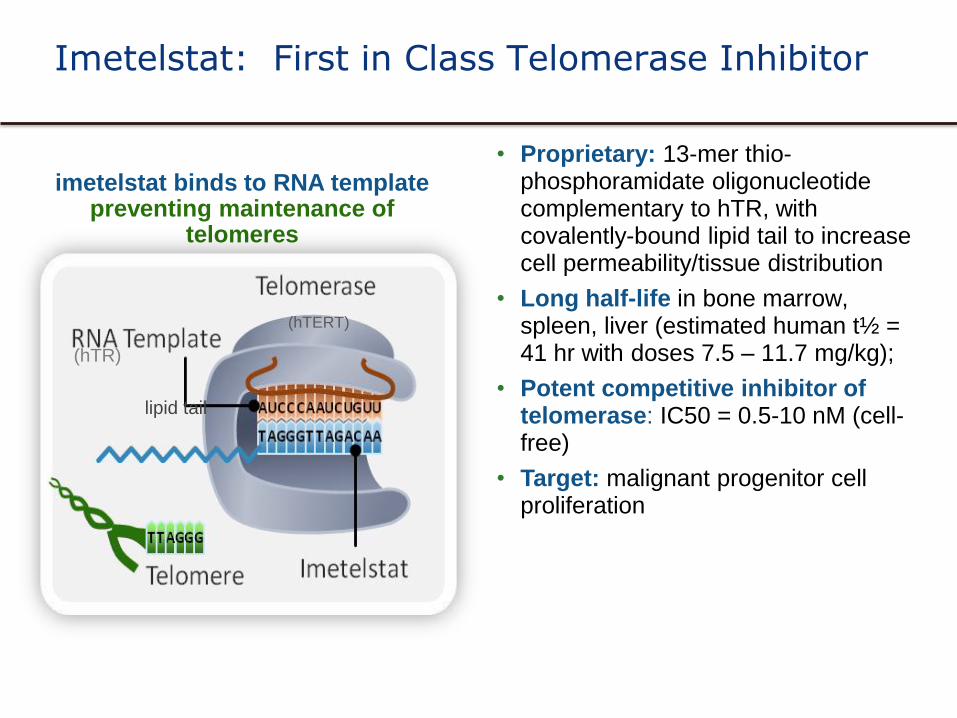
imetelstat binds to RNA templatepreventing maintenance of
telomeres
• Proprietary: 13-mer thio-phosphoramidate oligonucleotide complementary to hTR, with covalently-bound lipid tail to increase cell permeability/tissue distribution
• Long half-life in bone marrow, spleen, liver (estimated human t½ = 41 hr with doses 7.5 – 11.7 mg/kg);
• Potent competitive inhibitor of telomerase: IC50 = 0.5-10 nM (cell-free)
• Target: malignant progenitor cell proliferation
(hTR)
(hTERT)
lipid tail
Imetelstat: First in Class Telomerase Inhibitor
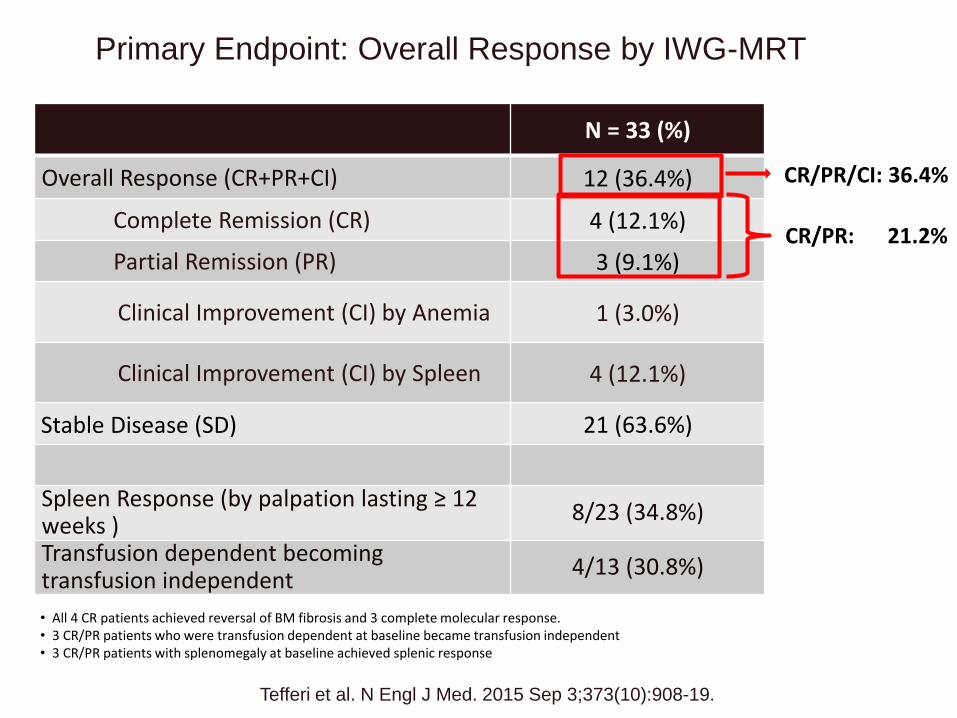
Primary Endpoint: Overall Response by IWG-MRT
N = 33 (%)
Overall Response (CR+PR+CI) 12 (36.4%)
Complete Remission (CR) 4 (12.1%)
Partial Remission (PR) 3 (9.1%)
Clinical Improvement (CI) by Anemia 1 (3.0%)
Clinical Improvement (CI) by Spleen 4 (12.1%)
Stable Disease (SD) 21 (63.6%)
Spleen Response (by palpation lasting ≥ 12 weeks )
8/23 (34.8%)
Transfusion dependent becomingtransfusion independent
4/13 (30.8%)
• All 4 CR patients achieved reversal of BM fibrosis and 3 complete molecular response.• 3 CR/PR patients who were transfusion dependent at baseline became transfusion independent• 3 CR/PR patients with splenomegaly at baseline achieved splenic response
CR/PR: 21.2%
CR/PR/CI: 36.4%
18Tefferi et al. N Engl J Med. 2015 Sep 3;373(10):908-19.

Co - Primary Endpoints To evaluate the spleen response rate at Week
24
– The percentage of participants who achieve ≥ 35% reduction in spleen volume from baseline as measured by MRI
To evaluate the symptom response rate at Week 24
- The percentage of subjects who have ≥50% reduction in total symptom score as measured by modified MFSAF v2.0.
Key Eligibility Criteria* 18 years of age and older
Diagnosis of PMF; or PET-MF or PPV-MF
DIPSS intermediate-2 or high risk MF
Measurable splenomegaly
Active symptoms of MF prior to study entry
Documented progressive disease during or after JAK inhibitor
ANC ≥ 1,500/ul
Platelets ≥ 75,000/ mm3
Peripheral blood and bone marrow blast count of <10%
A Randomized, Single-Blind, Multicenter Phase 2 Study to Evaluate the Activity of 2 Dose Levels of Imetelstat in Subjects With Intermediate-2 or High-Risk Myelofibrosis (MF) Relapsed/Refractory to Janus Kinase (JAK) Inhibitor
Imetelstat 9.4 mg/kg IV
every 3 weeks
Imetelstat 4.7 mg/kg IV
every 3 weeks
Randomization
N=200
Until disease progression, unacceptable toxicity, or study
end.
1:1
*Not a complete list of inclusion and exclusion criteria
IMbarkTM (NCT02426086)
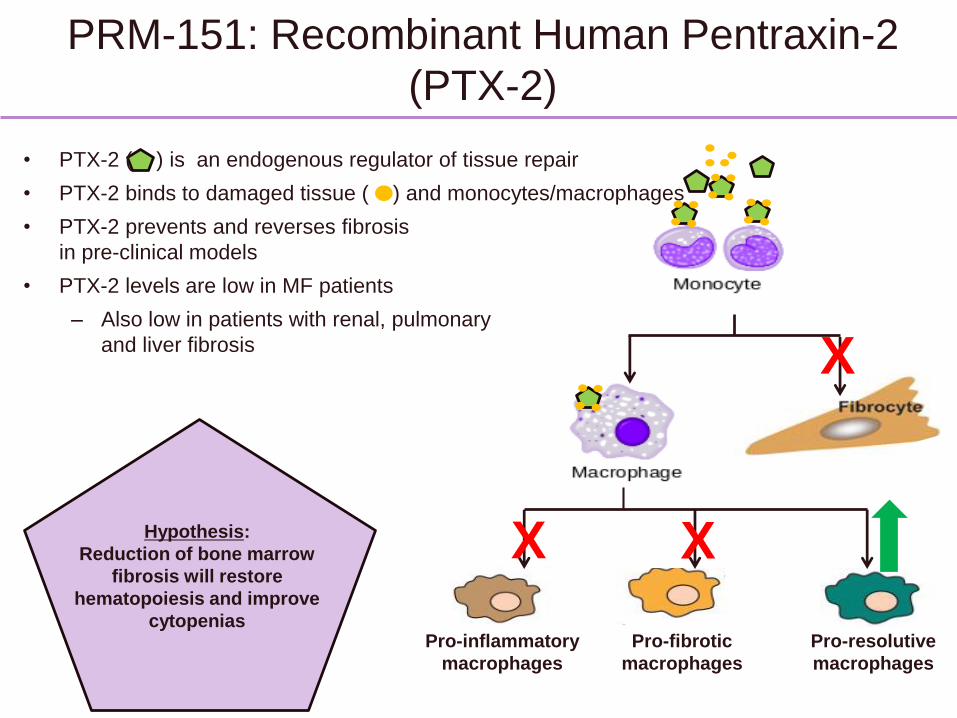
PRM-151: Recombinant Human Pentraxin-2
(PTX-2)
X
X X
Pro-inflammatory
macrophages
Pro-fibrotic
macrophages
Pro-resolutive
macrophages
Hypothesis:
Reduction of bone marrow
fibrosis will restore
hematopoiesis and improve
cytopenias
• PTX-2 ( ) is an endogenous regulator of tissue repair
• PTX-2 binds to damaged tissue ( ) and monocytes/macrophages
• PTX-2 prevents and reverses fibrosis
in pre-clinical models
• PTX-2 levels are low in MF patients
– Also low in patients with renal, pulmonary
and liver fibrosis
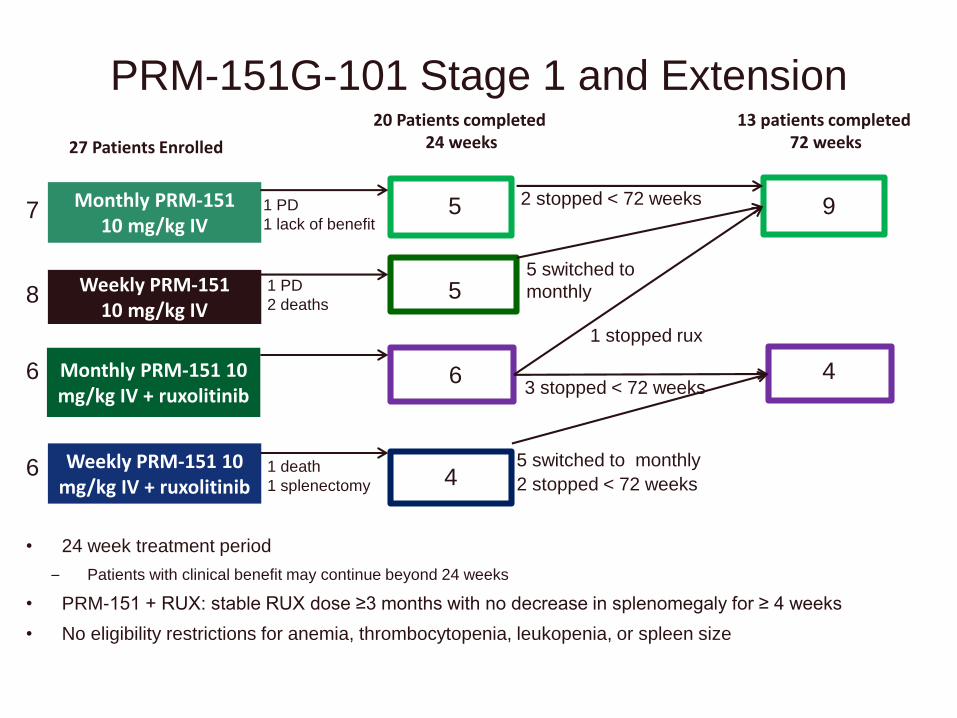
Weekly PRM-151 10 mg/kg IV
Monthly PRM-151 10 mg/kg IV
Weekly PRM-151 10 mg/kg IV + ruxolitinib
Monthly PRM-151 10 mg/kg IV + ruxolitinib
27 Patients Enrolled
PRM-151G-101 Stage 1 and Extension
• 24 week treatment period
– Patients with clinical benefit may continue beyond 24 weeks
• PRM-151 + RUX: stable RUX dose ≥3 months with no decrease in splenomegaly for ≥ 4 weeks
• No eligibility restrictions for anemia, thrombocytopenia, leukopenia, or spleen size
7
8
6
6
20 Patients completed 24 weeks
13 patients completed 72 weeks
5 9
5
6 4
4
1 PD
2 deaths
1 PD
1 lack of benefit
1 death
1 splenectomy
2 stopped < 72 weeks
5 switched to
monthly
1 stopped rux
3 stopped < 72 weeks
2 stopped < 72 weeks
5 switched to monthly
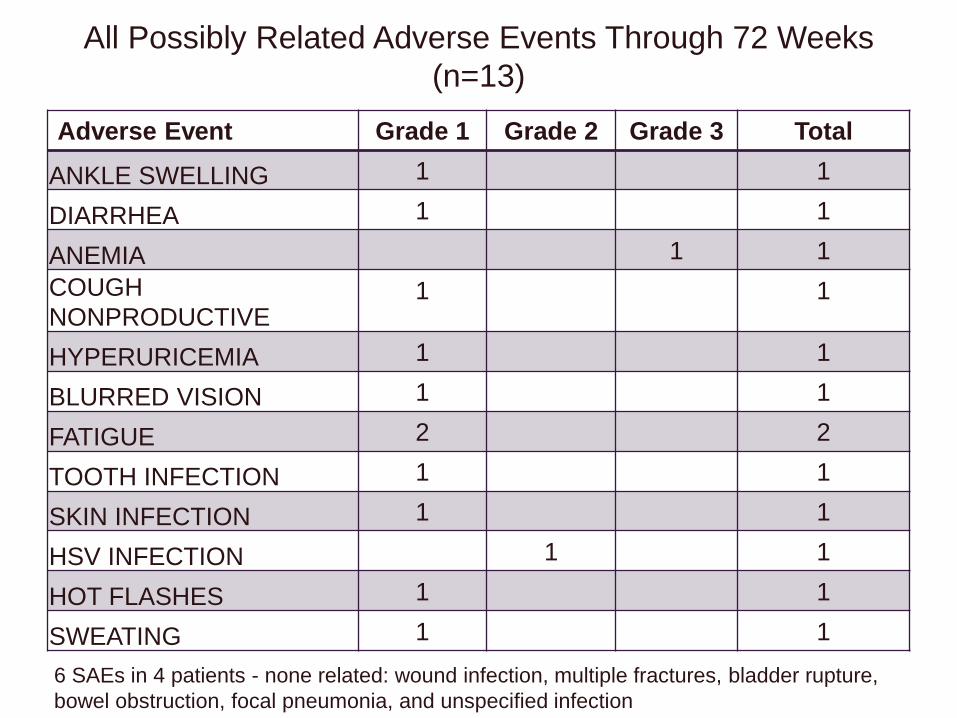
All Possibly Related Adverse Events Through 72 Weeks
(n=13)
Adverse Event Grade 1 Grade 2 Grade 3 Total
ANKLE SWELLING 1 1
DIARRHEA 1 1
ANEMIA 1 1
COUGH
NONPRODUCTIVE1 1
HYPERURICEMIA 1 1
BLURRED VISION 1 1
FATIGUE 2 2
TOOTH INFECTION 1 1
SKIN INFECTION 1 1
HSV INFECTION 1 1
HOT FLASHES 1 1
SWEATING 1 1
6 SAEs in 4 patients - none related: wound infection, multiple fractures, bladder rupture,
bowel obstruction, focal pneumonia, and unspecified infection
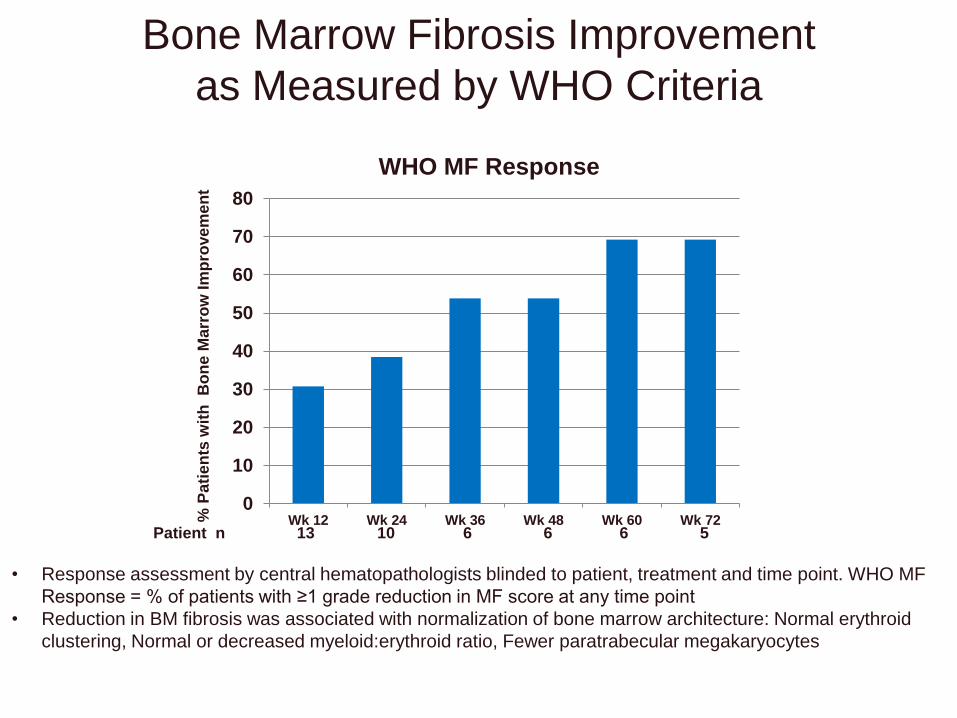
Bone Marrow Fibrosis Improvement
as Measured by WHO Criteria
• Response assessment by central hematopathologists blinded to patient, treatment and time point. WHO MF
Response = % of patients with ≥1 grade reduction in MF score at any time point
• Reduction in BM fibrosis was associated with normalization of bone marrow architecture: Normal erythroid
clustering, Normal or decreased myeloid:erythroid ratio, Fewer paratrabecular megakaryocytes
% P
ati
en
ts w
ith
B
on
e M
arr
ow
Im
pro
ve
me
nt
Patient n 13 10 6 6 6 5
0
10
20
30
40
50
60
70
80
Wk 12 Wk 24 Wk 36 Wk 48 Wk 60 Wk 72
WHO MF Response
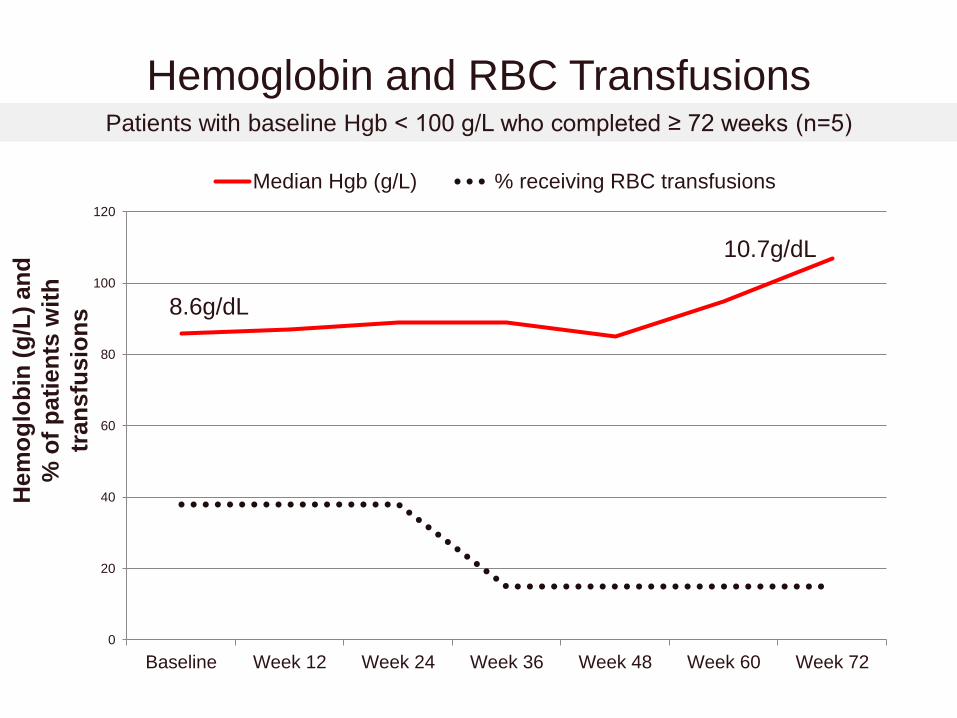
Hemoglobin and RBC Transfusions
Hem
og
lob
in (
g/L
) an
d
% o
f p
ati
en
ts w
ith
tran
sfu
sio
ns
Patients with baseline Hgb < 100 g/L who completed ≥ 72 weeks (n=5)
0
20
40
60
80
100
120
Baseline Week 12 Week 24 Week 36 Week 48 Week 60 Week 72
Median Hgb (g/L) % receiving RBC transfusions
10.7g/dL
8.6g/dL

Platelets and Platelet Transfusions
Pla
tele
ts x
10
9/L
an
d
% o
f p
ati
en
ts w
ith
PLT
tra
nsfu
sio
ns
Patients with Baseline Platelets < 100 x 109/L who completed ≥ 72 weeks (n=9)
0
10
20
30
40
50
60
Baseline Week 12 Week 24 Week 36 Week 48 Week 60 Week 72
Median PLT (x 109/L) % pts receiving plt transfusions
52K
37K
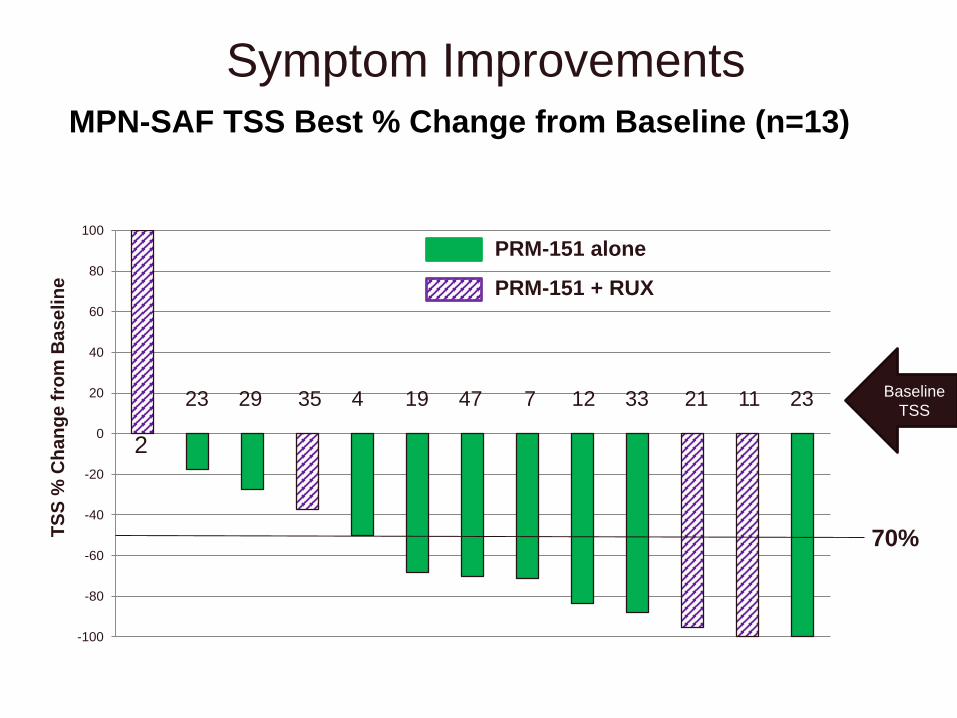
Symptom ImprovementsT
SS
% C
ha
ng
e f
rom
Ba
se
lin
e
MPN-SAF TSS Best % Change from Baseline (n=13)
-100
-80
-60
-40
-20
0
20
40
60
80
100
PRM-151 alone
PRM-151 + RUX
2
23 29 35 4 19 47 7 12 33 21 11 23 Baseline
TSS
70%
-120
-100
-80
-60
-40
-20
0
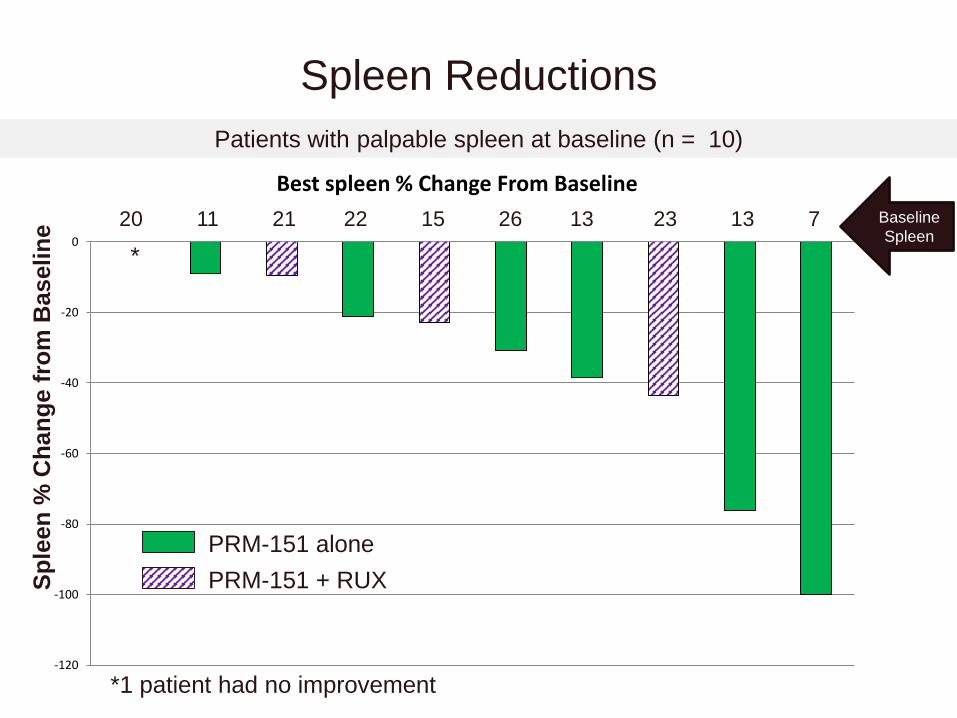
Best spleen % Change From Baseline
Sp
leen
% C
han
ge f
rom
Baseli
ne
Spleen Reductions
PRM-151 alone
PRM-151 + RUX
Patients with palpable spleen at baseline (n = 10)
*
*1 patient had no improvement
Baseline
Spleen20 11 21 22 15 26 13 23 13 7
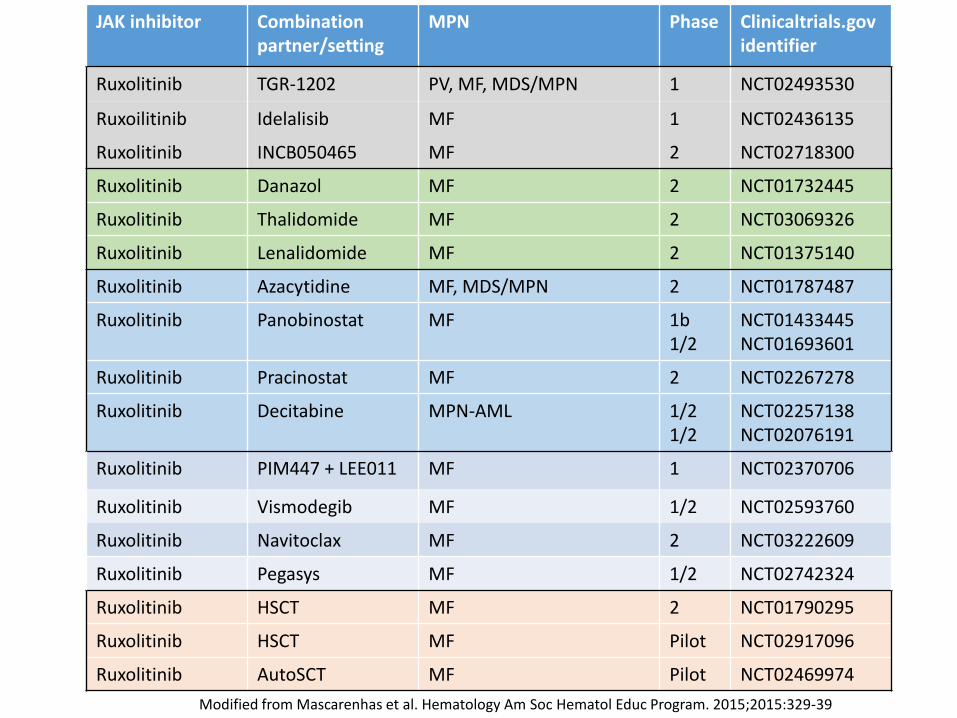
JAK inhibitor Combination partner/setting
MPN Phase Clinicaltrials.govidentifier
Ruxolitinib TGR-1202 PV, MF, MDS/MPN 1 NCT02493530
Ruxoilitinib Idelalisib MF 1 NCT02436135
Ruxolitinib INCB050465 MF 2 NCT02718300
Ruxolitinib Danazol MF 2 NCT01732445
Ruxolitinib Thalidomide MF 2 NCT03069326
Ruxolitinib Lenalidomide MF 2 NCT01375140
Ruxolitinib Azacytidine MF, MDS/MPN 2 NCT01787487
Ruxolitinib Panobinostat MF 1b1/2
NCT01433445NCT01693601
Ruxolitinib Pracinostat MF 2 NCT02267278
Ruxolitinib Decitabine MPN-AML 1/21/2
NCT02257138NCT02076191
Ruxolitinib PIM447 + LEE011 MF 1 NCT02370706
Ruxolitinib Vismodegib MF 1/2 NCT02593760
Ruxolitinib Navitoclax MF 2 NCT03222609
Ruxolitinib Pegasys MF 1/2 NCT02742324
Ruxolitinib HSCT MF 2 NCT01790295
Ruxolitinib HSCT MF Pilot NCT02917096
Ruxolitinib AutoSCT MF Pilot NCT02469974
Modified from Mascarenhas et al. Hematology Am Soc Hematol Educ Program. 2015;2015:329-39
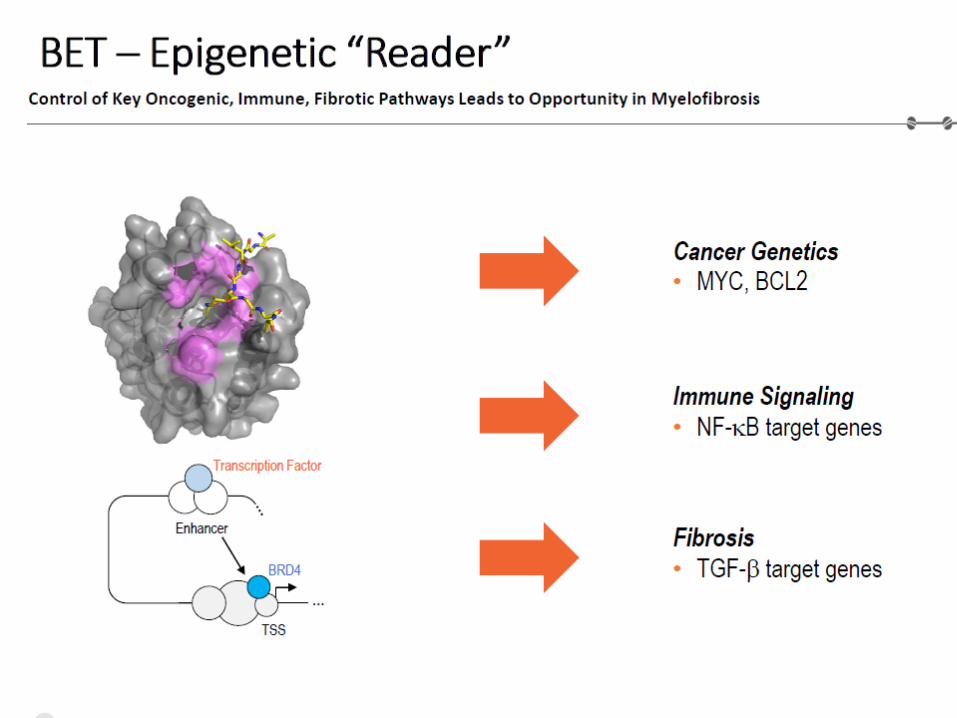
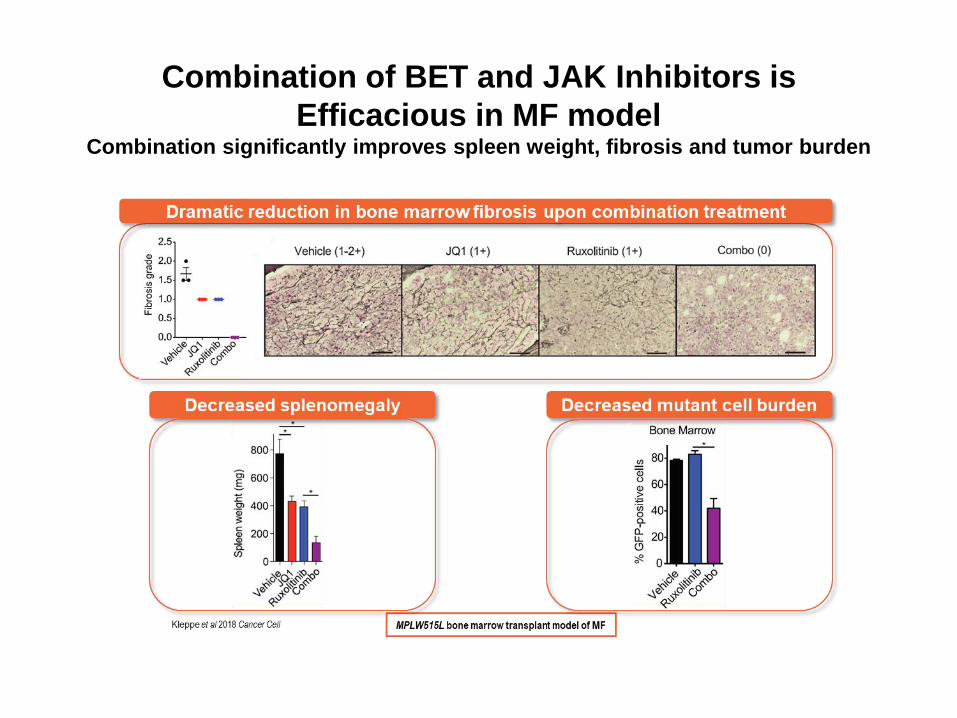
Combination of BET and JAK Inhibitors is
Efficacious in MF modelCombination significantly improves spleen weight, fibrosis and tumor burden

Background: MDM2 and PV
• PV CD34+ cells contain higher levels of MDM2 compared to normal CD34+ cells
• Low doses of a Nutlin and Peg-IFNα 2a increase p21 and PUMA protein levels in PV CD34+ cells and promote apoptosis
• Treatment with low doses of a Nutlin and Peg-IFNα 2a reduce the numbers of JAK2V617F-positive cells transplanted in NOD/SCID mice
Lu M et al. Blood. 2012 Oct 11;120(15):3098-105;Lu et al. Blood. 2014 Jul 31;124(5):771-9

MD
M2 p
osit
ive c
ells (
% o
f to
tal M
NC
)
Nor
mal
PV
0
20
40
60
80
P=0.01
Baseline MDM2 levels higher in study participants than normal controls

0
1
2
3
4
5
6
7
8
C1D1 C1D5
Pla
sma
MIC
-1 le
vels
(p
g/m
l)P=0.004
Evidence of P53 pathway activation: Plasma MIC-1 levels are significantly
increased in PV patients following treatment with idasanutlin
N=6
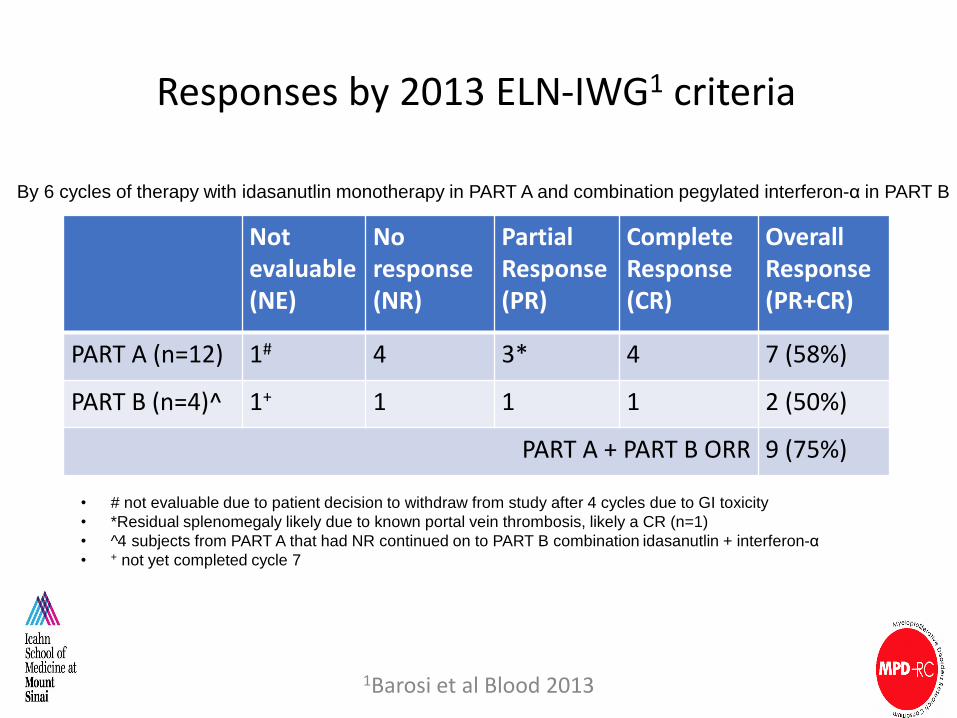
Responses by 2013 ELN-IWG1 criteria
Not evaluable(NE)
No response(NR)
Partial Response(PR)
Complete Response(CR)
Overall Response(PR+CR)
PART A (n=12) 1# 4 3* 4 7 (58%)
PART B (n=4)^ 1+ 1 1 1 2 (50%)
PART A + PART B ORR 9 (75%)
1Barosi et al Blood 2013
• # not evaluable due to patient decision to withdraw from study after 4 cycles due to GI toxicity
• *Residual splenomegaly likely due to known portal vein thrombosis, likely a CR (n=1)
• ^4 subjects from PART A that had NR continued on to PART B combination idasanutlin + interferon-α
• + not yet completed cycle 7
By 6 cycles of therapy with idasanutlin monotherapy in PART A and combination pegylated interferon-α in PART B

4
7 8 4 12 3 9 8 10 6 8
Driver mutation responses with idasanutlin therapy
12 3 9 8 10 6 8
4
7 8 4
Median % reduction -
43% (range -91.9%
to +60.3%)
52% 69% 89%82% 87% 2% 24% 23% 45% 36% 6%
Baseline VAF

Acknowledgements Mount Sinai
Ronald HoffmanXiaoli WangVesna NajfeldJoseph TripodiAnna Rita MigliaccioMarina KremyanskayaJohn RobozMin LuLuena PapaDaniel Hathaway
Camelia Iancu-RubinJohn MascarenhasJiajing QiuGoar MosoyanEran ZimranBruce PetersenMyron SchwartzLina JungAlicia Orellana
MSKCCRoss LevineRaajit RampalFranck Rapaport
University of UtahMohammed Salama
New York Blood Center Rona Weinberg
Xu Wu
Mayo Clinic Scottsdale
Ruben Mesa
Amylou Dueck
Heidi Kosiorek
MPD-RC
Mary Frances McMullin
Jean-Jacques Kiladjian
Joanne Ewing
Murat Arcasoy
Elliot Winton
Claire Harrison
Rose Catchatorian
Andrea Bacigalupo
Richard F. Schlenk
Arnon Nagler
Craig Kessler
Alessandro Rambaldi
David Liebowitz
Adam MeadValerio De StefannoAlessandro VannucchiDamiano RondelliAbdulraheem YacoubJosef PrchalCasey O’ConnellDmitry Berenzon,Richard SilverEllen Ritchie
Gabriela Hobbs

BACK UP

Therapeutic Hypothesis
Treatment with a TGF-β inhibitor may treat PMF by providing proliferative
advantage to healthy HSC in the marrow and preventing formation of
myelofibrosis-HSC supporting niches in the spleen
Hematopoietic failure MF Hematopoiesis
Marrow Spleen
MF-HSCHSC
MF-MK
MF-HSC
TGF-β
MF- activated
fibrocytes“Normal niche”
Courtesy of Annarita Migliaccio
Oste
og
en
esis
Marr
ow
fib
ros
isN
eo
vascu
lari
zati
on
Hem
ato
po
iesis
In liv
er
PE-C
D117
FITC-Sca1
Ste
m/
pro
ge
nit
or
cell
tra
ffic
kin
g
Natural Death
Age (Months)
Birth
0 1 8 12 24
Pre -M Early -M M
Th
rom
bo
cyto
pe
nia
An
em
ia
Young Old
3.5%1.9%
24.4%70.2%Th
rom
bo
sis
Oste
og
en
esis
Neo
vascu
lari
zati
on
PE-C
D117
FITC-Sca1
Birth
0 1 8 12 24
Pre -M Early -M M
Th
rom
bo
cyto
pe
nia
An
em
ia
Young Old
3.5%1.9%
24.4%70.2%Th
rom
bo
sis
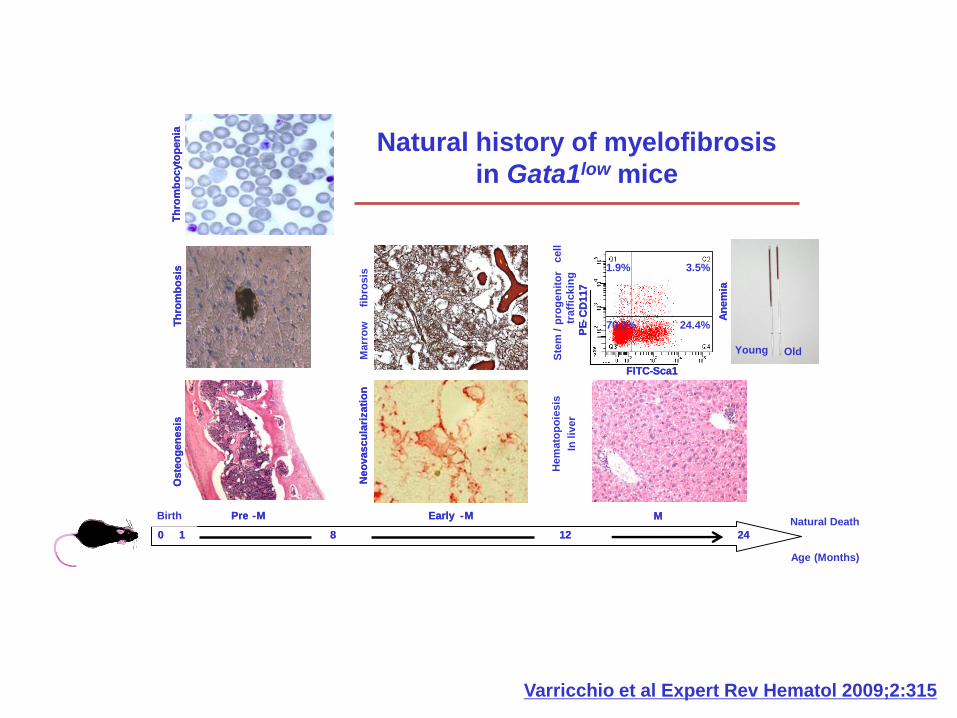
Natural history of myelofibrosis
in Gata1low mice
Varricchio et al Expert Rev Hematol 2009;2:315

Ruxolitinib based combination therapy: Setting a higher standard for success?
• Greater spleen reduction
• Greater symptom improvement
• Improvement in disease related cytopenias
• Deeper molecular responses
• Bone marrow morphologic responses
• IWG-MRT/ELN response criteria