Disclaimer: The views expressed are those of Paul Gipe and are not necessarily those of the sponsor....
45
Disclaimer : The views expressed are those of Paul Gipe and are not necessarily those of the sponsor. Disclosure : Paul Gipe has worked with Aerovironment, ANZSES, APROMA, ASES, AusWEA, AWEA, BWEA, BWE, CanWEA, CAW, CEERT, DGW, DSF, EECA, ES&T, GEO, GPI Atlantic, IREQ, KWEA, MADE, Microsoft, ManSEA, MSU, NRCan, NRG Systems, NASA, NREL, NZWEA, ORWWG, OSEA, PG&E, SeaWest, SEI, TREC, USDOE, WAWWG, WE Energies, the Folkecenter, the Izaak Walton League, the Minnesota Project, the Sierra Club, and Zond Systems, and written for magazines in the USA, Canada, France, Denmark, and Germany. Paul Gipe, wind-works.org
-
Upload
oswin-fleming -
Category
Documents
-
view
214 -
download
1
Transcript of Disclaimer: The views expressed are those of Paul Gipe and are not necessarily those of the sponsor....
Disclaimer: The views expressed are those of Paul Gipe and are not necessarily those of the sponsor.
Disclosure: Paul Gipe has worked with Aerovironment, ANZSES, APROMA, ASES, AusWEA, AWEA, BWEA, BWE, CanWEA, CAW, CEERT, DGW, DSF, EECA, ES&T, GEO, GPI Atlantic, IREQ, KWEA, MADE, Microsoft, ManSEA, MSU, NRCan, NRG Systems, NASA, NREL, NZWEA, ORWWG, OSEA, PG&E, SeaWest, SEI, TREC, USDOE, WAWWG, WE Energies, the Folkecenter, the Izaak Walton League, the Minnesota Project, the Sierra Club, and Zond Systems, and written for magazines in the USA, Canada, France, Denmark, and Germany.
Paul Gipe, wind-works.org

Overview of Worldwide Wind Development
By Paul Gipe

North American Energy Policy
North Americans are Dabbling Around the Edges of Renewable
Energy Policy
Little Recognition of the Crisis Facing the Continent
Paul Gipe, wind-works.org

Skibsted Fjord, Denmark
Complacency is Not a Policy
Inaction is Not an Option
Paul Gipe, wind-works.org

FuchskauteHöhe Westerwald, Germany
The Troika of
Meeting Demand
• Conservation
#1 Use Less
• Improve Efficiency
#2 Do More with Less
• Renewable Energy
#3 Invest in the Future

Typical Household Consumption
Paul Gipe, wind-works.org
kWh/yr/home
Texas 14,000
Ontario 10,000
California 6,500
Netherlands 3,000

Living Better on Less
• 10 Million California Households
• 2 x 100 W Bulbs
• 2 x 25 W CF
• 150 W Savings x 10 Million
• = 1,500 MW Savings!

Many More Opportunities
• Task Lighting
• Notebooks = 90% Savings!

The Result in the Nies-Gipe Household
Jan Feb March April May June July Aug Sept Oct Nov Dec
Month
0
200
400
600
800kWh/month
2001
2002
5 yr Avg

The Result in California?
• 8-10% Savings
• We Coped with Crisis
• The Lights Stayed On
• Savings Permanent
• Cut Bills 20%

Swept Area per Household
TexasRenewable Tariffs Launched
0
2
4
6
8
10
12
14Wind Turbine Area (m2)/Household (~6.4 m/s)
Texas
Ontario
California
Germany
Paul Gipe, wind-works.org
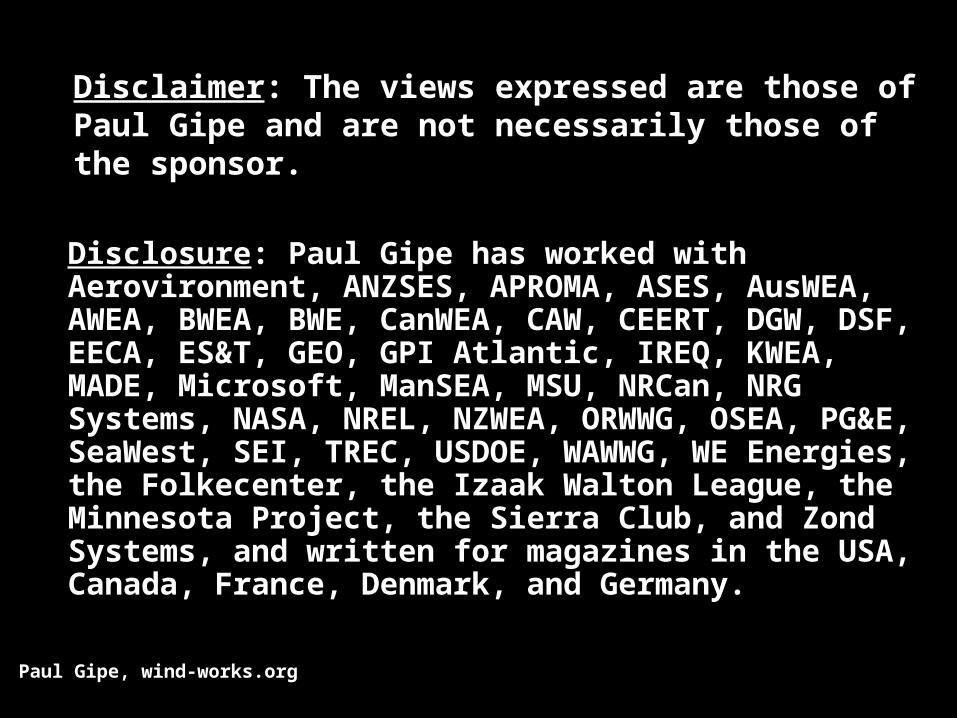
Colorado
California
Wind Energy Has Come of Age
Paul Gipe, wind-works.org
Paul Gipe, wind-works.org
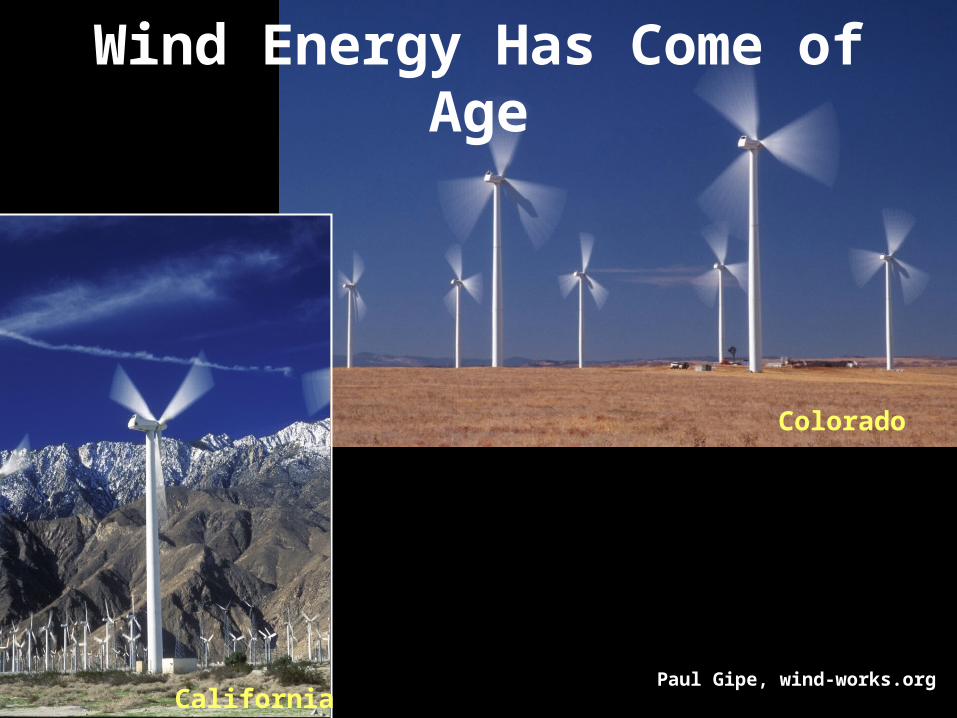
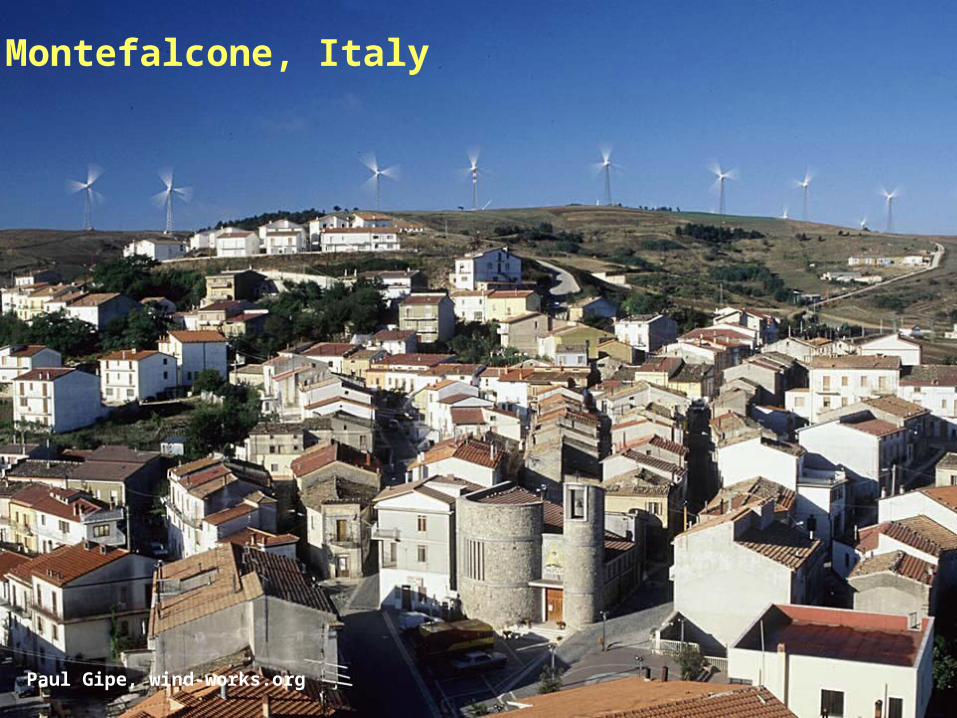
Montefalcone, Italy
Paul Gipe, wind-works.org
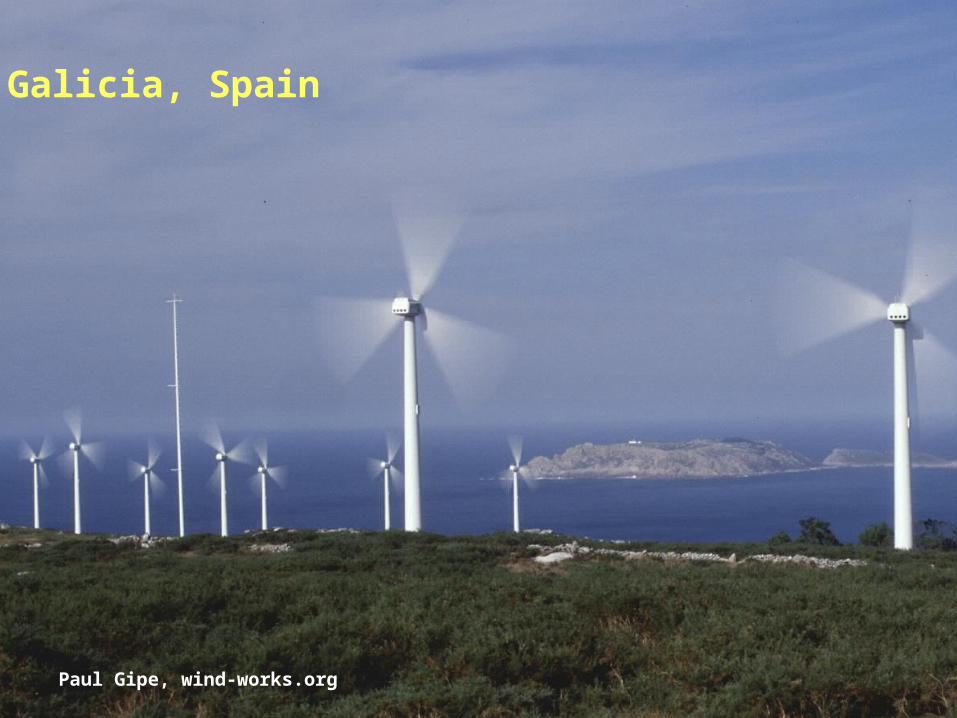
Galicia, Spain
Paul Gipe, wind-works.org

Why Now?
• Wind WorksGreater Reliability
• Productivity ImprovedMore Efficient
Taller Towers
• Costs DeclinedEconomies-of-Scale
84 85 86 87 88 89 90 91 92 93 94 95 96 97
Year
0
500
1000
1500
2000
2500Sales Price in US$/kW
0
200
400
600
800
1000 Yield in kWh/m2/yr
Sales Price
Yield
Paul Gipe, wind-works.org
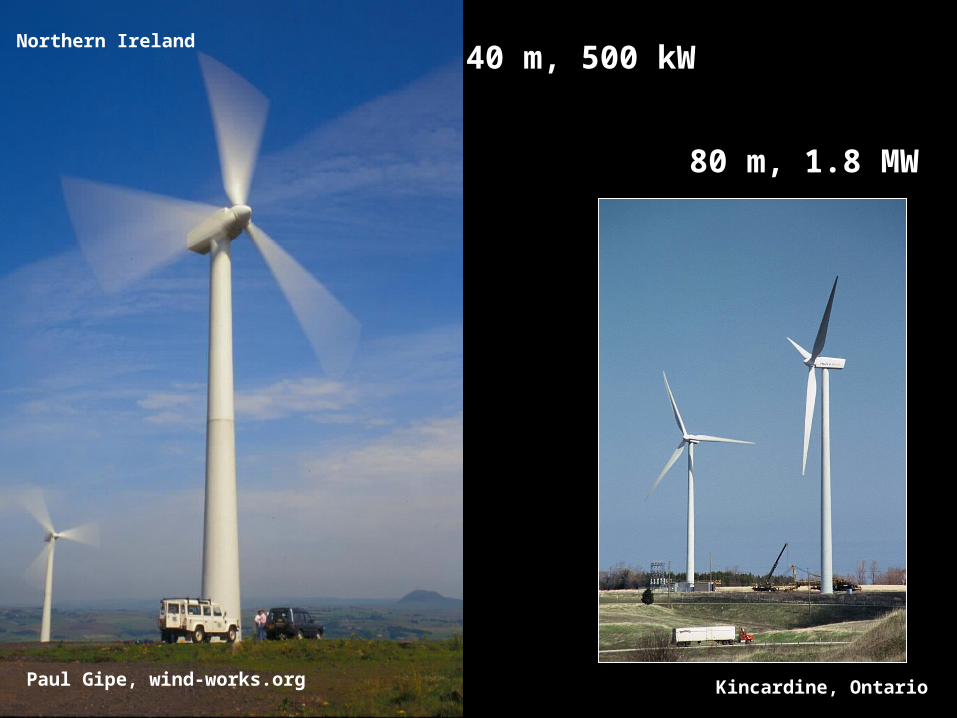
40 m, 500 kW
80 m, 1.8 MW
Kincardine, Ontario
Northern Ireland
Paul Gipe, wind-works.org

We Know What Works . . .and What Doesn’t
Eole, Cap Chat
© Vortec
Paul Gipe, wind-works.org

2006 World Wind Capacity
80 81 82 83 84 85 86 87 88 89 90 91 92 93 94 95 96 97 98 99 00 01 02 03 04 05 06
Year
0
20
40
60
Megawatts (Thousands)
Europe
North America
Asia
Paul Gipe, wind-works.org

World Wind Capacity 2006~70,000 MW
Europe66%
North America17%
Africa0%
Asia16%
South America1%
Paul Gipe, wind-works.org

2006 World Wind Capacity
12,000 MW 48,000 MW
12,000 MW
Paul Gipe, wind-works.org

European Wind Capacity 2006
2,100
2,000
1,600
800
3,100
20,700
1,400
1,700
650
600
11,600
80300
Paul Gipe, wind-works.org

North American Wind Capacity2006
2,250
11 50 2,800
400
950
6
320
850
450300
50035
800
350
100
455030050
70
400
180
175
45150
175
Paul Gipe, wind-works.org

Wind Energy is a Real BusinessUS$35 Billion in 2006O&M3%
Electricity Sales32%
Project Development65%
Paul Gipe, wind-works.org
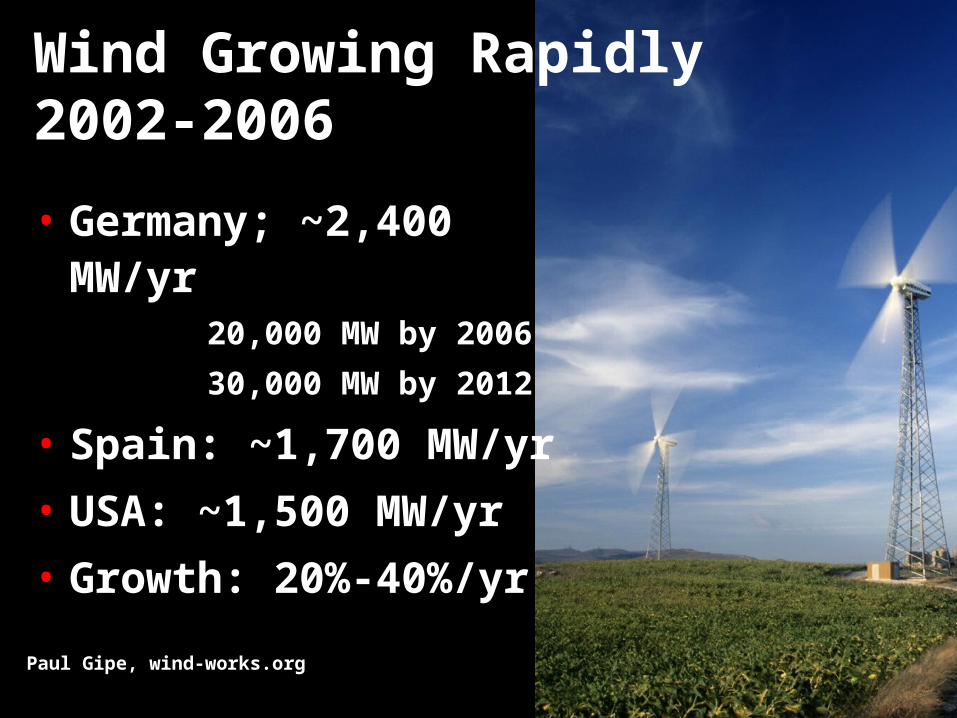
Wind Growing Rapidly2002-2006
• Germany; ~2,400 MW/yr20,000 MW by 2006
30,000 MW by 2012
• Spain: ~1,700 MW/yr
• USA: ~1,500 MW/yr
• Growth: 20%-40%/yr
Paul Gipe, wind-works.org

US-Canada Wind Market
Paul Gipe, wind-works.org
80 81 82 83 84 85 86 87 88 89 90 91 92 93 94 95 96 97 98 99 00 01 02 03 04 05 06
Year
0
500
1000
1500
2000
2500
MW/Year
Canada
USA
Production Tax Credit (Subsidy)
Paul Gipe, wind-works.org
North American MarketMajor Players
• USAFlorida Power & Light (50% of Market)Scottish PowerÉlectricité de France (EnXco)Eon?
• CanadaTrans Alta (Utility)Suncor (Oil, Tar Sands)Enbridge (Gas)

North American MarketMajor Suppliers
• USAGE!VestasSiemans (Bonus)Suzlon (India)
• CanadaGEVestasEnerconOther (Vensys)
Paul Gipe, wind-works.org

Why Wind?
• Reduces Use of Fossil & Nuclear Fuels
• Most Cost-Effective of New Renewables
• Relatively Benign
Paul Gipe, wind-works.org
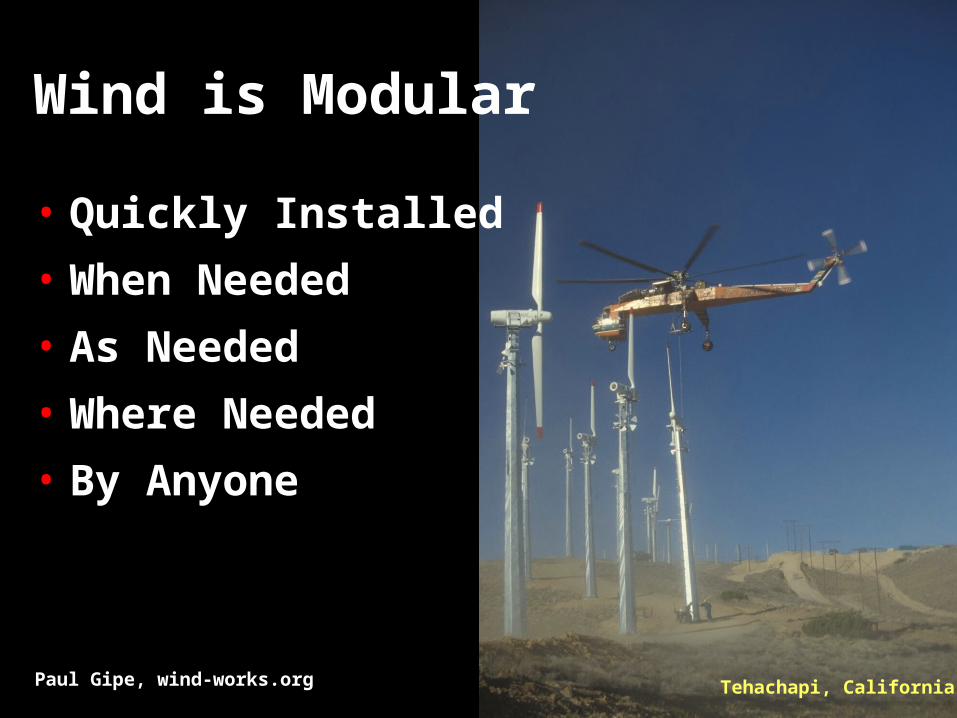
Wind is Modular
• Quickly Installed
• When Needed
• As Needed
• Where Needed
• By Anyone
Tehachapi, CaliforniaPaul Gipe, wind-works.org

Wind is Flexible• Scale
Big or Small Projects
• LocationNear or Far
• TimeShort Lead Times
• OwnershipLocal or Absentee
Paul Gipe, wind-works.org

Wind Energy’s Benefits
• Clean & Green (Mostly)No SOx, NOx, or CO2
• RenewableNet Positive Energy Balance (4-6 months)
• Domestic: Not Subject to Embargo• Does Not Consume Water• Modular = Flexible• . . . and Can be Removed
Paul Gipe, wind-works.org

Wind Energy’s Impacts
• Aesthetics or Intrusiveness• Erosion & Scarring from Roads
Length, Width, Number and Slope
• Shadow Flicker & Disco Effect• Climate?• Noise--They are Audible• Wildlife
Habitat DisruptionBird & Bat Kills: Collisions, Electrocutions
Paul Gipe, wind-works.org
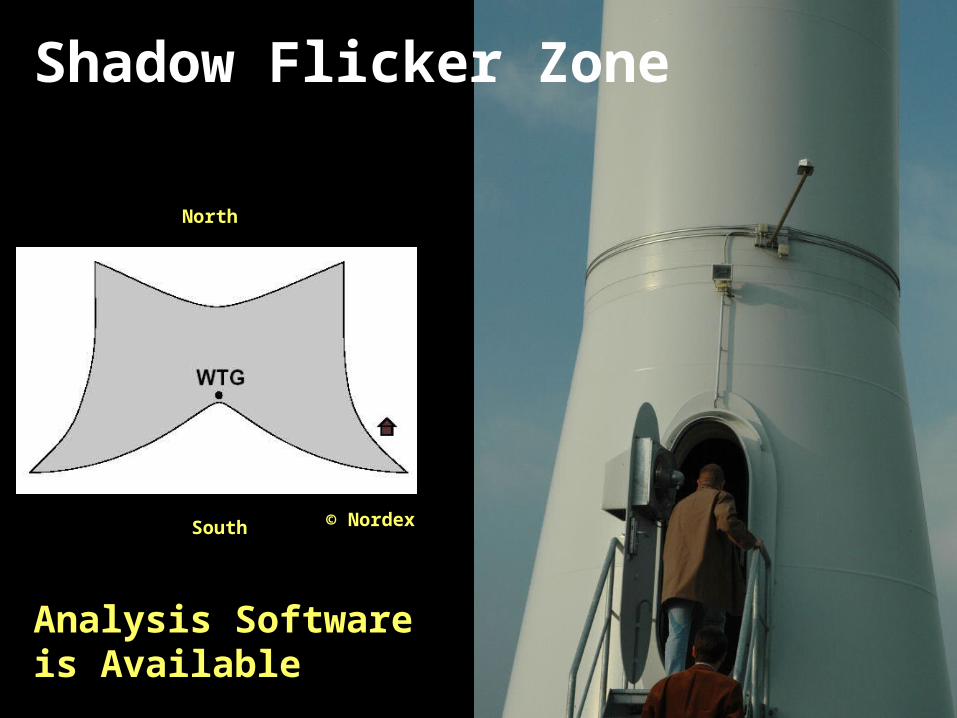
Shadow Flicker Zone
© NordexSouth
North
Analysis Software is Available

Noise• Distinctly Audible
They Are Not Silent
They Will Be Heard
• Great Reductions in Noise
• But Noise is Constant--Ever-PresentExcept During Calms
• Small Turbines Are NoisiestFor Their Size
Paul Gipe & Assoc.
Air 303-403 Noise
Bergey Noise

Noise Footprint
Paul Gipe & Assoc.

40
42
44
46
48
50
52
54
56
58
60
62
64
66 dB
A (
Leq)
13 14 15 16 17 18 19 20 21 22 23 24 25 26 27 Wind Speed (mph)
Air 403 Noise at Wulf Test Field
Paul Gipe & Assoc.
Paul Gipe, wind-works.orgPaul Gipe & Assoc.
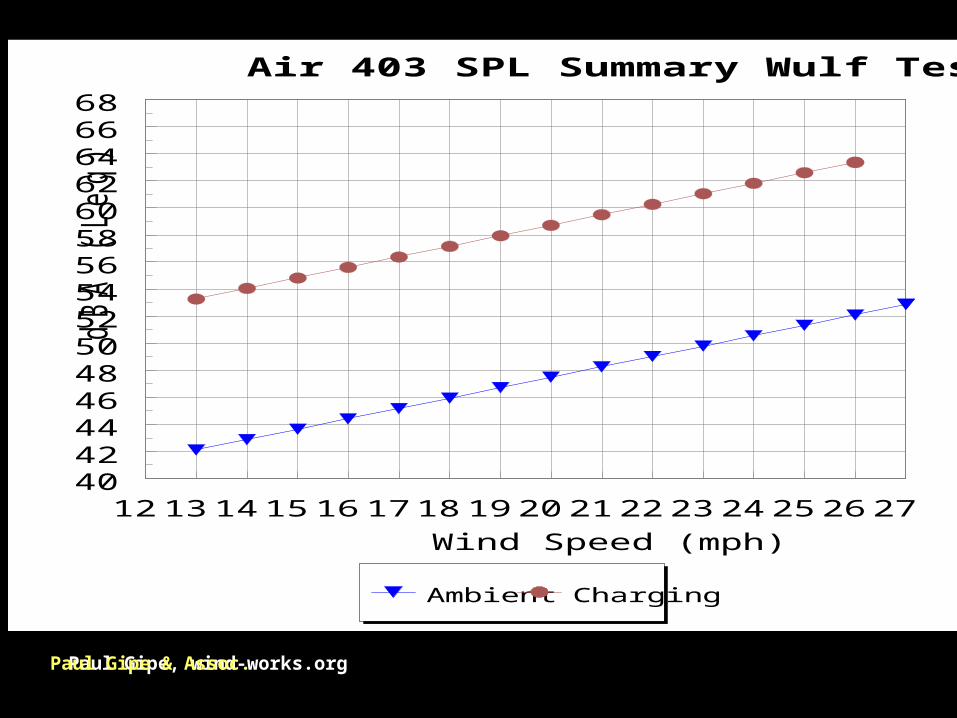
40 42 44 46 48 50 52 54 56 58 60 62 64 66 68
dB
A (
Leq)
12 13 14 15 16 17 18 19 20 21 22 23 24 25 26 27
Wind Speed (mph)
Ambient Charging
Air 403 SPL Summary Wulf Test Field

Paul Gipe, wind-works.org
Calculated & Measured Noise EmissionsSource Sound Power Level at 8 m/s
1 10 100
Diameter (meters)
60
70
80
90
100
110
120Sound Power Level dBA
1980s 1990s
1999 Small
Micro H40
L=22 log D + 72
L=22 log D + 65
BWC 850
H40
AirX
Air303

Noise Source Strength
Sound Power Level (Emission Source Strength) for Selected Wind Turbines, andEstimated Distance to 45 dBA
Distance to@ 8 m/s1TowerRatedSwept45 dBA2dBAHeightPowerAreaDiameter
ftmLeqftmkWm2ftm160508866200.3213.81.2Air 403110358566200.9582.4Whisper H4031095938927301334313Furländer4101259610532802545918Lagerwey 18/80660200100207635001,25713140Enercon E40740225102220671,6503,42121666Vestas V66
1. Sound Power Levels increase with increasing wind speed.2. Estimated using IEA model and atmospheric absorption.

Noise Community Response
noise than that indicated here.and neighbors could be either more or less sensitive to wind turbineNote: This table was derived for noise sources other than wind turbines,
Community Response to Noise from Sources Other Than Wind Turbines
Estimated Community ResponseAmount by whichNoise ExceedsBackground Level
DescriptionCategorydBNo observed reactionNone0Sporadic complaintsLittle5Widespread complaintsMedium10Threats of actionStrong15Vigorous actionVery Strong20
Source: Harvey Hubbard, Kevin Shepherd, NASA, 1990.

Noise LimitsSelected Noise Limits, Sound Pressure Levels in dBA
RuralResidentialMixedCommercial 50556065DayGermany35404550Night404550LeqDayNetherlands303540Night4540Leq Denmark1
45L50High speedEngland 2
40L50Low speed60606575L50DayMinnesota50506575L50Night65657080L10DayMinnesota55557080L10Night4545L8.3Kern County, Calif.3
45L90Riverside County, Calif.6050L90Palm Springs, Calif.4
1. Not to exceed 45 dBA beyond 400 m from wind turbine.2. L50 approx. 350 m from the nearest turbine.3. L8.3., not to exceed 50 dBA.4. 50 dBA if lot is actually used as residential.
Paul Gipe & Assoc.
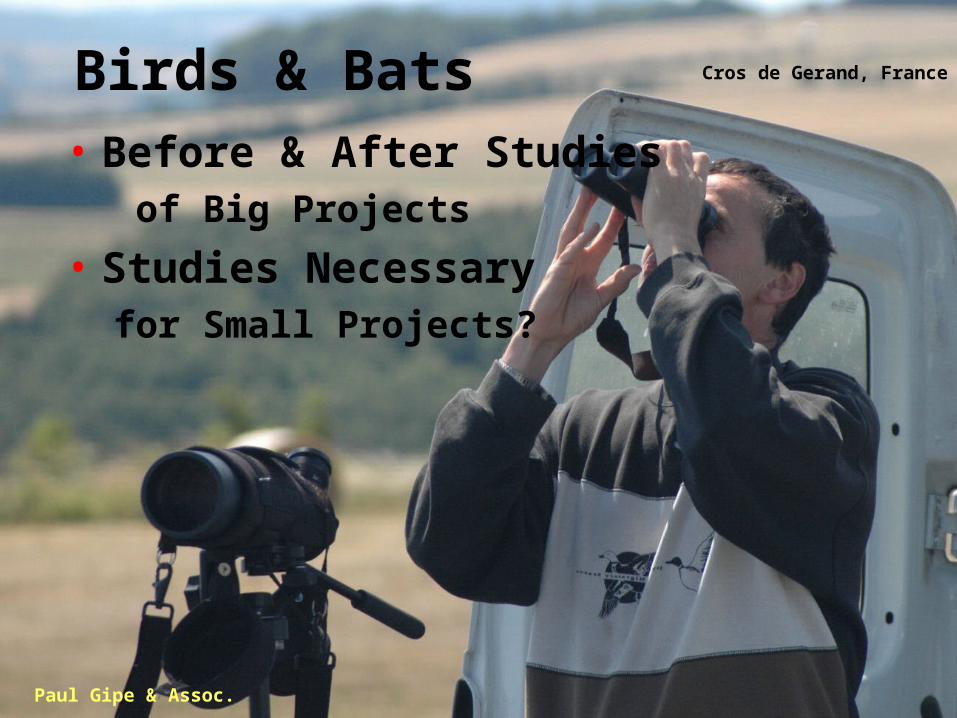
Birds & Bats• Before & After Studies
of Big Projects
• Studies Necessaryfor Small Projects?
Cros de Gerand, France

Birds & Bats• Bats
Appalachian Mts & Bufalo Ridge (MN)
Bat Conservation Society Report
Cause Unkown & Further Research In Doubt
US Wind Industry Uncooperative
Seasonal Shut Down Possible
• Birds, Altamont PassIssue Unresolved
California Wind Industry Uncooperative
Disaster for Raptors & Wind Energy
Paul Gipe & Assoc.
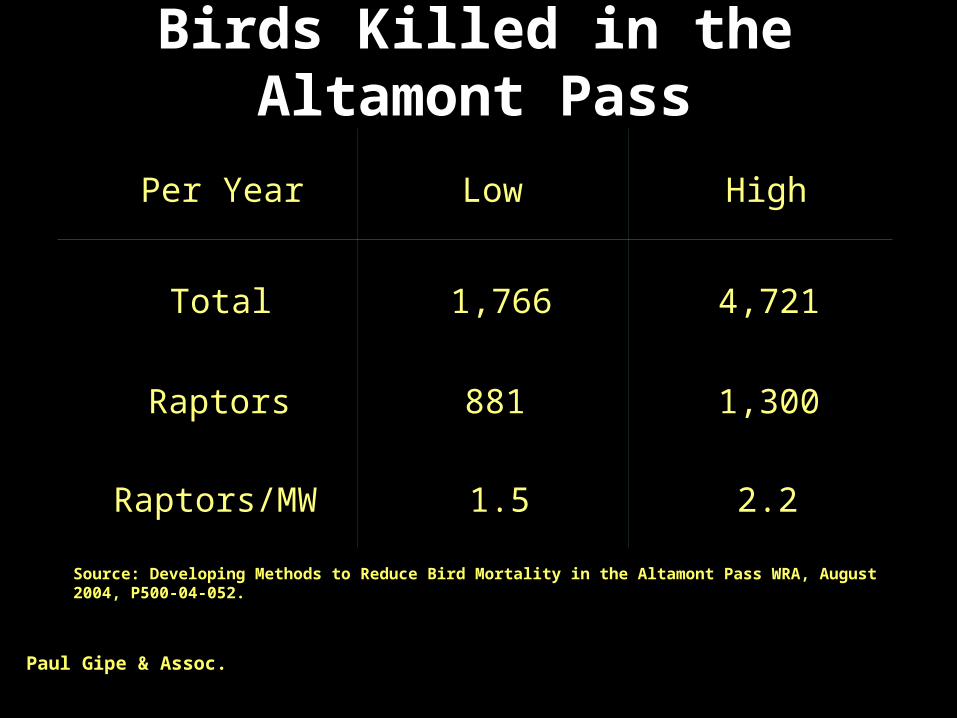
Birds Killed in the Altamont Pass
Paul Gipe & Assoc.
Source: Developing Methods to Reduce Bird Mortality in the Altamont Pass WRA, August 2004, P500-04-052.
Per Year Low High
Total 1,766 4,721
Raptors 881 1,300
Raptors/MW 1.5 2.2
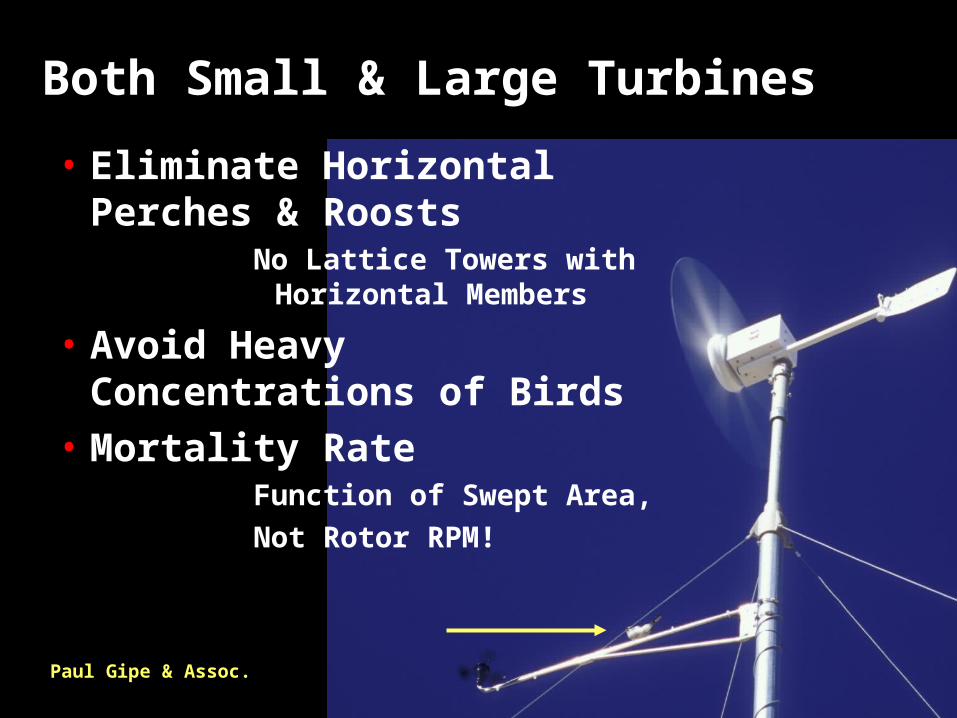
• Eliminate Horizontal Perches & Roosts
No Lattice Towers with Horizontal Members
• Avoid Heavy Concentrations of Birds
• Mortality Rate Function of Swept Area,
Not Rotor RPM!
Both Small & Large Turbines
Paul Gipe & Assoc.